Embed Size (px)
Citation preview
CEPIS Survey of Professional e-Competence in Europe Page 1 of 59
CEPIS Survey of Professional e-Competence in Europe
Spain Report

CEPIS Survey of Professional e-Competence in Europe Page 2 of 59
Contents:
1 Introduction ..................................................................................................... 3
2 Methodology and Survey Approach ............................................................... 5
2.1 Personal Information .................................................................................. 5 2.2 Competence Questionnaire ....................................................................... 5 2.3 Criteria for Inclusion ................................................................................... 6 2.4 Personal Results ........................................................................................ 7
3 Respondent Demographics ............................................................................ 8
3.1 Respondents by Country............................................................................ 8 3.2 Respondents by Age .................................................................................. 9 3.3 Respondents by Gender ............................................................................ 9 3.4 Respondents by Education Level ............................................................. 10 3.5 Respondents by Educational Field ........................................................... 11 3.6 Respondents by Industry Sector .............................................................. 12 3.7 Respondents by Enterprise Size .............................................................. 12 3.8 Respondents by Professional Status ....................................................... 13 3.9 Respondents by ICT Profile (based on declared profile) .......................... 14
4 Proximity Profiles and Skills Evaluation ...................................................... 16
4.1 Respondents by Proximity Profile ............................................................ 16 4.2 Comparison between Professional Profile and Proximity Profile .............. 17 4.3 Analysis of Skills Diffusion ....................................................................... 19
5 Analysis.......................................................................................................... 21
5.1 IT Manager .............................................................................................. 21 5.2 IT Systems Analyst .................................................................................. 22 5.3 Software Developer ................................................................................. 23 5.4 Integration & Testing Engineer ................................................................. 24 5.5 IT Administrator ....................................................................................... 25 5.6 IT Systems Engineer ................................................................................ 26 5.7 Service Support Manager ........................................................................ 27 5.8 IT Trainer ................................................................................................. 28
6 Conclusions ................................................................................................... 30
7 Annex ............................................................................................................. 32
7.1 Description of Additional Segmentation .................................................... 32 7.2 ICT Competence – Knowledge Index ....................................................... 34 7.3 Proximity Profiles – Details ...................................................................... 37 7.4 Profile Segmentation ................................................................................ 54

CEPIS Survey of Professional e-Competence in Europe Page 3 of 59
1 Introduction
The following report outlines the results from Spain of a recent pan-European survey to identify the digital competencies held by European ICT professionals. The survey offered a unique opportunity to explore the status of professional e-competence in Europe through an online tool that provided the individual respondents with a snapshot of their competences against an agreed European framework (the European e-Competence Framework). The benefits for the individuals who participated in this survey included the ability to compare their competences against required competences for typical ICT job profiles throughout Europe, to help identify individual strengths and weaknesses, and to assist in identifying training and professional development opportunities. In addition, the survey results provide an insight into the status of national level professional competences in various countries in Europe. The ability to determine what competencies are underdeveloped in a country can assist in developing focused training to further educate the workforce. The ability to compare and contrast different countries’ results also provides a useful competence benchmarking tool for each individual country.
The research was conducted via a web questionnaire based on the European e-Competence Framework (e-CF), developed by the CEN (European Committee for Standardization) Workshop on ICT Skills and supported by the European Commission. This framework identifies 36 ICT competences all of which are used in this tool. The survey expert team, based on CEPIS experiences in defining IT competences and jobs, identified 18 typical professional profiles and an expanded set of skills to describe such profiles. The increased set of 44 skills, includes all 36 competences from the e-CF, five of which have been further split into a few sub-cases in order to allow a more precise description of different technical contents. Annex 7.1 describes the additional e-CF segmentation in detail. The work of the survey has been carried out by the Council of European Professional Informatics Societies (CEPIS) in association with Asociación de Técnicos de Informática (ATI), who led the research in Spain. Since the sample of respondents to the survey may not be thoroughly representative of the overall situation in each country, this country report has been assessed and validated by national experts from ATI before publication. Any contributions from national experts about the Spanish survey results have been included in this report. Key points stemming from the survey data gathered by the ATI include:
The respondents show a higher average age than their colleagues in the rest of Europe (the second highest across Europe).
Spanish IT professionals responding to the questionnaire in general show a good level of education and a high focus on IT.
Female representation is very low (the second lowest across Europe).

CEPIS Survey of Professional e-Competence in Europe Page 4 of 59
Spain has the highest proportion of IT professionals in the supply side of the IT industry.
The level of Knowledge Index of Spanish respondents presents two different types of scores: in the Build and Run areas the indexes are higher than European averages, while in the remaining three areas (Manage, Enable and Plan), indexes are lower.
CEPIS Survey of Professional e-Competence in Europe Page 5 of 59
2 Methodology and Survey Approach
The research has been conducted across 28 countries in Europe and across greater Europe using a web-based survey tool. The European survey results have been compiled by respondents coming from these 28 countries. 16 of the countries had a total number of responses higher than 30 and of this 10 had more than 50 respondents and at least one cluster of a minimum of 10 respondents with the same calculated profilel; the minimum amount required to create some elements of an individual country report. Spain had 177 respondents to the survey, which resulted in eight IT profiles having more than 10 respondents. It is important to note that the results presented in this report represent only the respondents who participated in the survey. It is not a general statistical reference for the country. The survey was completed by individual respondents who consider themselves to be IT Practitioners and was divided into three sections. The survey was based on the enhanced e-CF segmentation, which is described in Annex 7.1. The three sections are described below.
2.1 Personal Information
Each respondent enters personal information including educational background, employment status, organisation size, industry and selecting the IT profile which matches their current role. The respondent chooses from the following common IT roles:
IT Manager IT Project Manager
Database Manager
IT Quality Manager
IT System Analyst
Network Manager
IT Client Manager
Software Developer
IT Administrator
IT Sales and Marketing Consultant
Integration and Testing Engineer
IT Systems Engineer
IT Applications Consultant IT Systems Architect
Service Support Manager
Business Analyst
IT Security Manager
IT Trainer
2.2 Competence Questionnaire
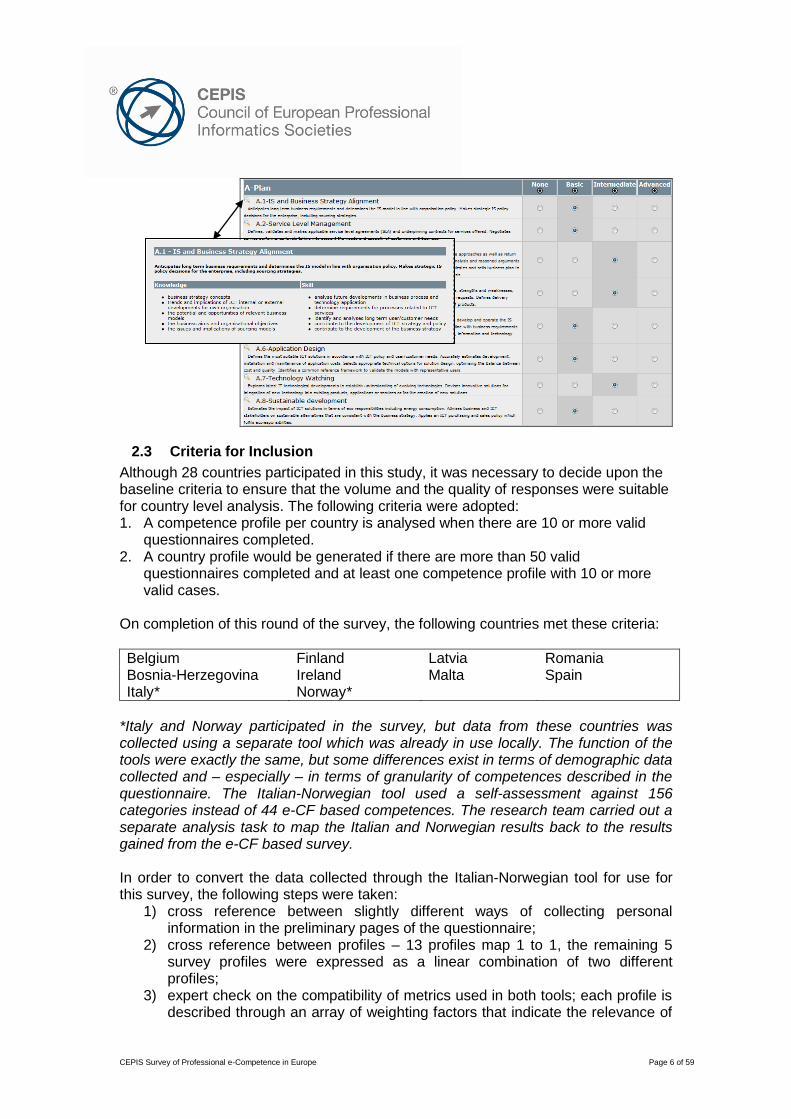
In the next phase the respondent completes the competence questionnaire. The questionnaire consists of 44 competences. For each competence the respondent selects their competence level choosing from “None”, “Basic”, “Intermediate” and “Advanced” options. Additional information is also available for each competence to assist the respondent in choosing an appropriate level:
CEPIS Survey of Professional e-Competence in Europe Page 6 of 59
2.3 Criteria for Inclusion
Although 28 countries participated in this study, it was necessary to decide upon the baseline criteria to ensure that the volume and the quality of responses were suitable for country level analysis. The following criteria were adopted: 1. A competence profile per country is analysed when there are 10 or more valid
questionnaires completed. 2. A country profile would be generated if there are more than 50 valid
questionnaires completed and at least one competence profile with 10 or more valid cases.
On completion of this round of the survey, the following countries met these criteria:
Belgium Finland Latvia Romania Bosnia-Herzegovina Ireland Malta Spain Italy* Norway*
*Italy and Norway participated in the survey, but data from these countries was collected using a separate tool which was already in use locally. The function of the tools were exactly the same, but some differences exist in terms of demographic data collected and – especially – in terms of granularity of competences described in the questionnaire. The Italian-Norwegian tool used a self-assessment against 156 categories instead of 44 e-CF based competences. The research team carried out a separate analysis task to map the Italian and Norwegian results back to the results gained from the e-CF based survey. In order to convert the data collected through the Italian-Norwegian tool for use for this survey, the following steps were taken:
1) cross reference between slightly different ways of collecting personal information in the preliminary pages of the questionnaire;
2) cross reference between profiles – 13 profiles map 1 to 1, the remaining 5 survey profiles were expressed as a linear combination of two different profiles;
3) expert check on the compatibility of metrics used in both tools; each profile is described through an array of weighting factors that indicate the relevance of

CEPIS Survey of Professional e-Competence in Europe Page 7 of 59
each competence to the single profile, but the consistency between the different descriptions was deemed very good;
4) identification of an optimized and controlled algorithm that minimizes the maximum distance between calculated proximity scores in both questionnaires1.
2.4 Personal Results
On completion of the survey, the respondent is presented with their personal results. The personal results are displayed on a graphical “radar” split into segments (one for each competence) as illustrated in the image to the right. The profile that is closest to the competences chosen by the respondent (their “proximity profile”) is shown along with a proximity index “88.56%” in this case. Below the “radar” is a list of the competences that the individual should look to improve, and competences which are held at levels over and above what is required for the profile. The respondent can also review their proximity to the other profiles and export any of the reports in PDF format to review.
1 The algorithm is based on the simplex method for discrete linear optimization, constrained to
4 integer numbers. This scientific part of the work was carried out through a project associated with a university exam of “Optimization” at the SUPSI (Scuola universitaria professionale della Svizzera Italiana, www.supsi.ch); further details available in a dedicated document edited by Giovanni Franza to be published in “biblioteca AICA” (online library service for members of AICA, www.aicanet.it).

CEPIS Survey of Professional e-Competence in Europe Page 8 of 59
3 Respondent Demographics
The following section provides an overview of the demographic of the respondents from Spain. Again we underline that these results are based on the following conditions:
The survey sample was dependent on the available contact database used to promote the survey in each country; there may be some variance between the membership of this contact database and the full population of ICT professionals in the country.
The sample composition reflects the participation of mostly ATI members.
The two criteria above also apply to the samples of all other countries who took part in the survey. Therefore the comparisons between the Spanish results and the European average should be considered as very important but also as a preliminary indication which may require more extensive validation.
3.1 Respondents by Country
The CEPIS Survey of Professional e-Competence in Europe was conducted from September 2010 until March 2011 across 28 countries in Europe and beyond. Overall 1918 IT Practitioners participated in the survey. The percentage of participants by country is represented in the graphic below.
15%
13%
10%
10%
10%
9%
5%
5%
5%
3%
15%
Italy
Finland
Ireland
Belgium
Malta
Spain
Norway
Latvia
Bosnia-Herz.
Romania
Other
Total: 1918
Figure 1 – Respondents by Country Spain had a high level of participation in this survey, 177 cases, which allows us to analyse the Spanish situation quite thoroughly.
CEPIS Survey of Professional e-Competence in Europe Page 9 of 59
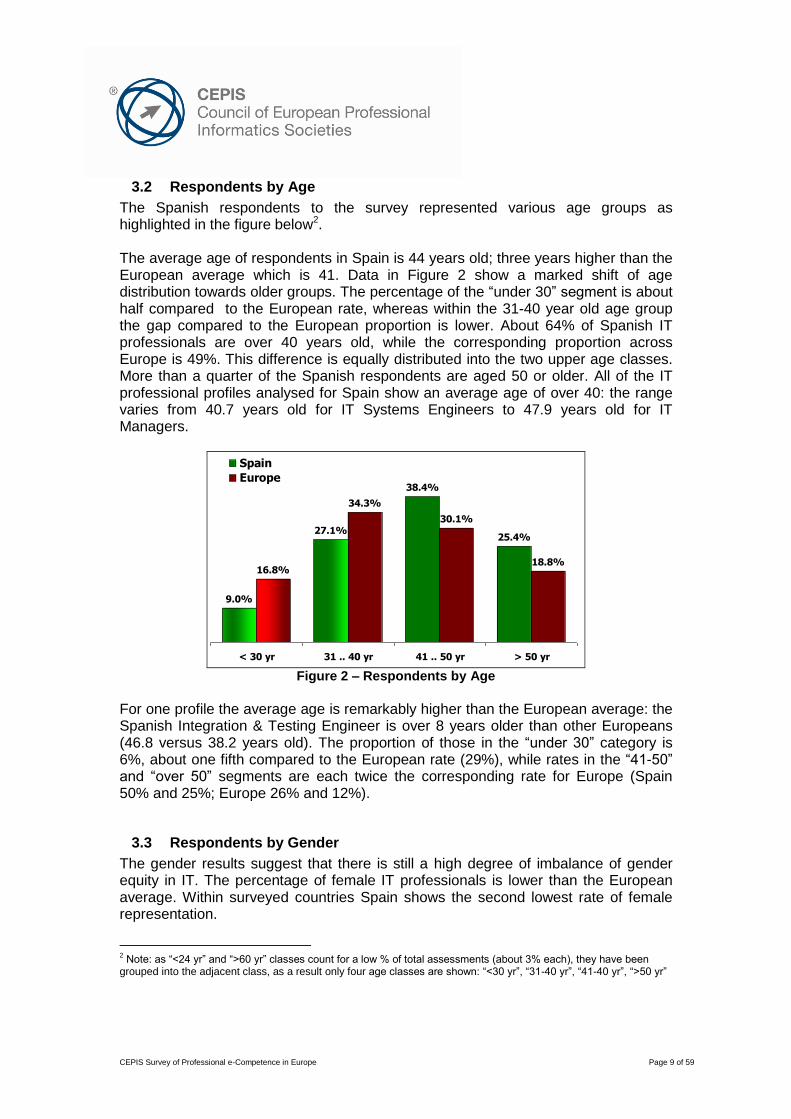
3.2 Respondents by Age
The Spanish respondents to the survey represented various age groups as highlighted in the figure below2. The average age of respondents in Spain is 44 years old; three years higher than the European average which is 41. Data in Figure 2 show a marked shift of age distribution towards older groups. The percentage of the “under 30” segment is about half compared to the European rate, whereas within the 31-40 year old age group the gap compared to the European proportion is lower. About 64% of Spanish IT professionals are over 40 years old, while the corresponding proportion across Europe is 49%. This difference is equally distributed into the two upper age classes. More than a quarter of the Spanish respondents are aged 50 or older. All of the IT professional profiles analysed for Spain show an average age of over 40: the range varies from 40.7 years old for IT Systems Engineers to 47.9 years old for IT Managers.
25.4%
16.8%
34.3%
30.1%
18.8%
9.0%
38.4%
27.1%
< 30 yr 31 .. 40 yr 41 .. 50 yr > 50 yr
Spain
Europe
Figure 2 – Respondents by Age
For one profile the average age is remarkably higher than the European average: the Spanish Integration & Testing Engineer is over 8 years older than other Europeans (46.8 versus 38.2 years old). The proportion of those in the “under 30” category is 6%, about one fifth compared to the European rate (29%), while rates in the “41-50” and “over 50” segments are each twice the corresponding rate for Europe (Spain 50% and 25%; Europe 26% and 12%).
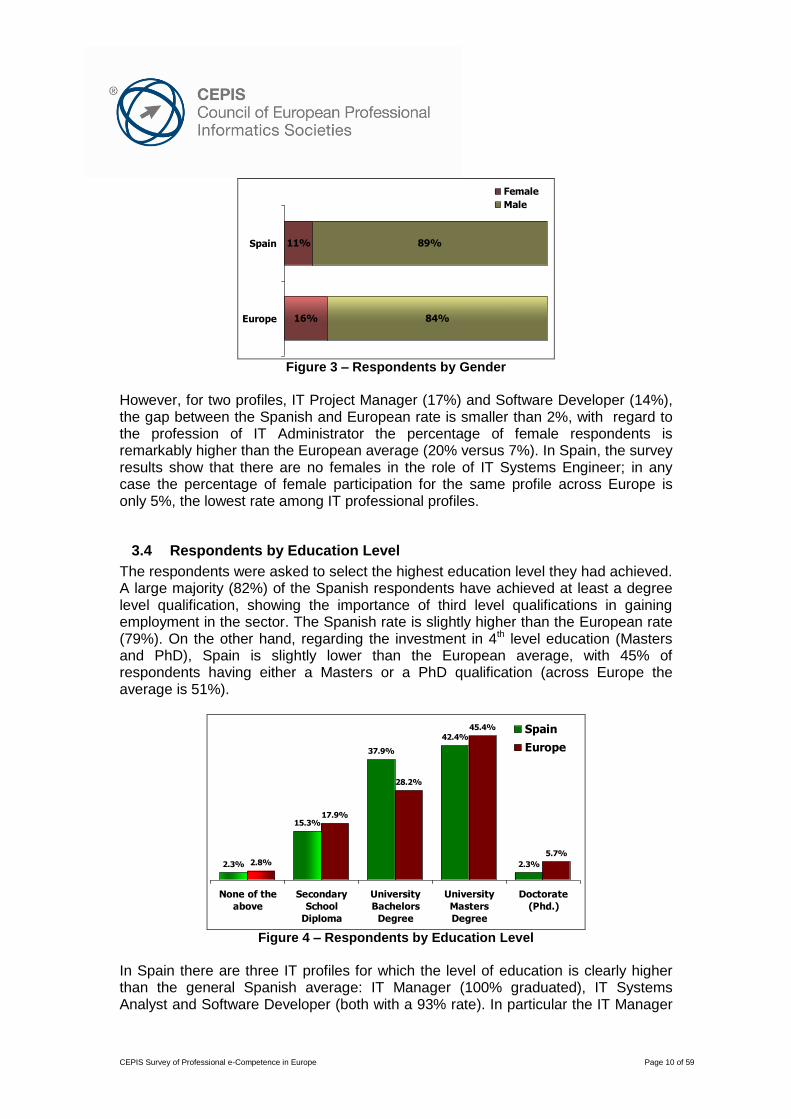
3.3 Respondents by Gender
The gender results suggest that there is still a high degree of imbalance of gender equity in IT. The percentage of female IT professionals is lower than the European average. Within surveyed countries Spain shows the second lowest rate of female representation.
2 Note: as “<24 yr” and “>60 yr” classes count for a low % of total assessments (about 3% each), they have been
grouped into the adjacent class, as a result only four age classes are shown: “<30 yr”, “31-40 yr”, “41-40 yr”, “>50 yr”
CEPIS Survey of Professional e-Competence in Europe Page 10 of 59
89%
84%
11%
16%
Spain
Europe
Female
Male
Figure 3 – Respondents by Gender
However, for two profiles, IT Project Manager (17%) and Software Developer (14%), the gap between the Spanish and European rate is smaller than 2%, with regard to the profession of IT Administrator the percentage of female respondents is remarkably higher than the European average (20% versus 7%). In Spain, the survey results show that there are no females in the role of IT Systems Engineer; in any case the percentage of female participation for the same profile across Europe is only 5%, the lowest rate among IT professional profiles.
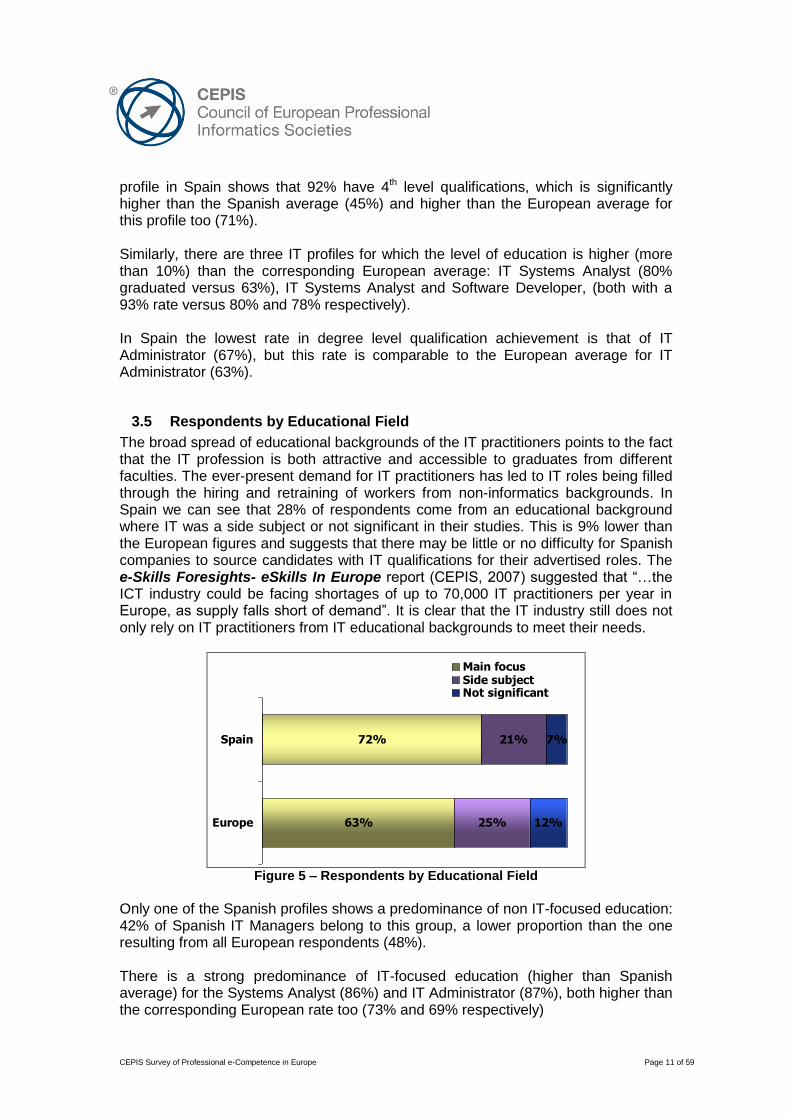
3.4 Respondents by Education Level
The respondents were asked to select the highest education level they had achieved. A large majority (82%) of the Spanish respondents have achieved at least a degree level qualification, showing the importance of third level qualifications in gaining employment in the sector. The Spanish rate is slightly higher than the European rate (79%). On the other hand, regarding the investment in 4th level education (Masters and PhD), Spain is slightly lower than the European average, with 45% of respondents having either a Masters or a PhD qualification (across Europe the average is 51%).
42.4%
2.3%2.8%
17.9%
28.2%
45.4%
5.7%
2.3%
37.9%
15.3%
None of the
above
Secondary
School
Diploma
University
Bachelors
Degree
University
Masters
Degree
Doctorate
(Phd.)
Spain
Europe
Figure 4 – Respondents by Education Level
In Spain there are three IT profiles for which the level of education is clearly higher than the general Spanish average: IT Manager (100% graduated), IT Systems Analyst and Software Developer (both with a 93% rate). In particular the IT Manager
CEPIS Survey of Professional e-Competence in Europe Page 11 of 59
profile in Spain shows that 92% have 4th level qualifications, which is significantly higher than the Spanish average (45%) and higher than the European average for this profile too (71%). Similarly, there are three IT profiles for which the level of education is higher (more than 10%) than the corresponding European average: IT Systems Analyst (80% graduated versus 63%), IT Systems Analyst and Software Developer, (both with a 93% rate versus 80% and 78% respectively). In Spain the lowest rate in degree level qualification achievement is that of IT Administrator (67%), but this rate is comparable to the European average for IT Administrator (63%).
3.5 Respondents by Educational Field
The broad spread of educational backgrounds of the IT practitioners points to the fact that the IT profession is both attractive and accessible to graduates from different faculties. The ever-present demand for IT practitioners has led to IT roles being filled through the hiring and retraining of workers from non-informatics backgrounds. In Spain we can see that 28% of respondents come from an educational background where IT was a side subject or not significant in their studies. This is 9% lower than the European figures and suggests that there may be little or no difficulty for Spanish companies to source candidates with IT qualifications for their advertised roles. The e-Skills Foresights- eSkills In Europe report (CEPIS, 2007) suggested that “…the ICT industry could be facing shortages of up to 70,000 IT practitioners per year in Europe, as supply falls short of demand”. It is clear that the IT industry still does not only rely on IT practitioners from IT educational backgrounds to meet their needs.
21%
25%
7%
12%63%
72%Spain
Europe
Main focusSide subjectNot significant
Figure 5 – Respondents by Educational Field
Only one of the Spanish profiles shows a predominance of non IT-focused education: 42% of Spanish IT Managers belong to this group, a lower proportion than the one resulting from all European respondents (48%). There is a strong predominance of IT-focused education (higher than Spanish average) for the Systems Analyst (86%) and IT Administrator (87%), both higher than the corresponding European rate too (73% and 69% respectively)

CEPIS Survey of Professional e-Competence in Europe Page 12 of 59
3.6 Respondents by Industry Sector
Spain has a lower number of respondents coming from the IT demand side, compared to the European average. In Spain 42% of respondents (the third lowest rate in Europe) are focused on IT demand side activities compared to 51% across Europe. In particular, Spanish data show that there is only one profile which is focused mainly on the IT demand side: IT Administrators coming from the IT demand side are at 67%, very similar to the European proportion (65%). On the contrary, the Spanish Integration & Testing Engineer shows a 50:50 ratio for demand/supply, while the corresponding ratio for their European colleague is 57:43.
58%
49%
42%
51%
Spain
Europe
IT demand side
IT supply side
y
Figure 6 – Respondents by Industry Sector
All the other profiles show a clear predominance of professionals coming from the supply side of the IT industry. Especially regarding the Spanish IT Manager, only 8% come from the IT demand sector, while the global proportion across Europe is 50%.
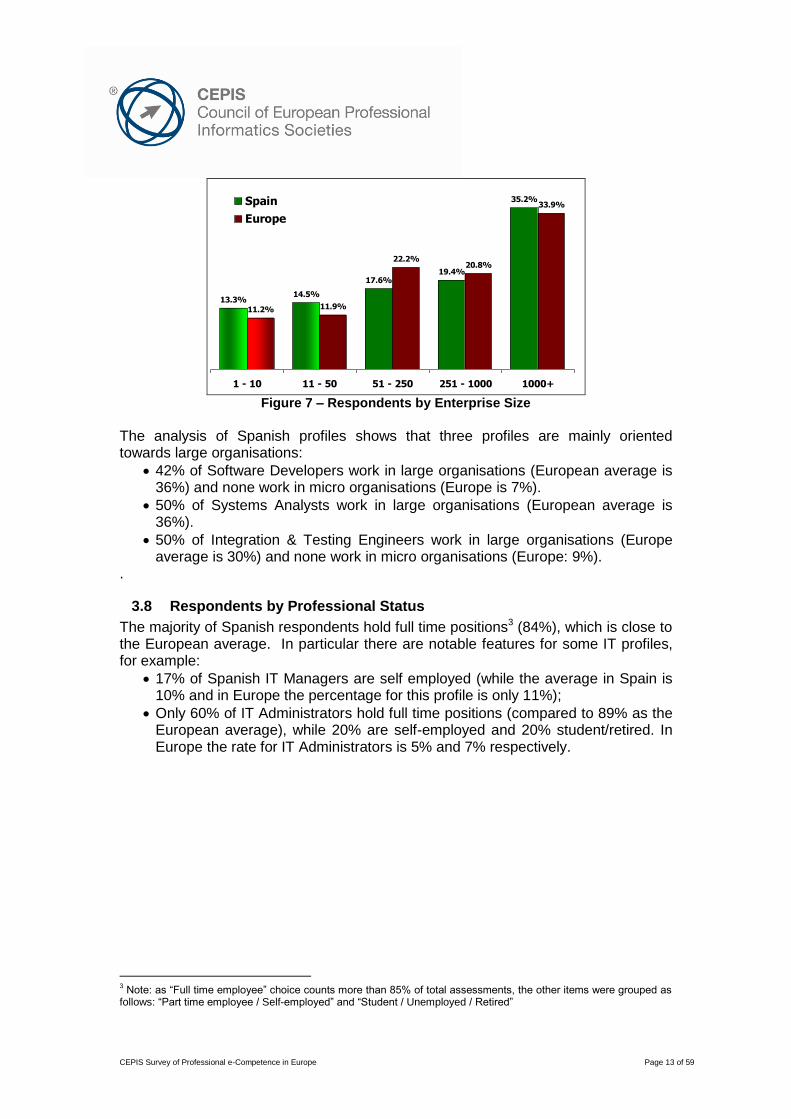
3.7 Respondents by Enterprise Size
Spain has two notable differences compared to Europe in terms of enterprise size responses, with a greater number of micro and small organisations (28% have 50 employees or less, 5% less than Europe), but also a slightly higher number of large organisations, with 35.2% of respondents working for enterprises with 1000+ employees.
CEPIS Survey of Professional e-Competence in Europe Page 13 of 59
19.4%
35.2%
11.2% 11.9%
22.2%20.8%
33.9%
14.5%
17.6%
13.3%
1 - 10 11 - 50 51 - 250 251 - 1000 1000+
Spain
Europe
Figure 7 – Respondents by Enterprise Size
The analysis of Spanish profiles shows that three profiles are mainly oriented towards large organisations:
42% of Software Developers work in large organisations (European average is 36%) and none work in micro organisations (Europe is 7%).
50% of Systems Analysts work in large organisations (European average is 36%).
50% of Integration & Testing Engineers work in large organisations (Europe average is 30%) and none work in micro organisations (Europe: 9%).
.
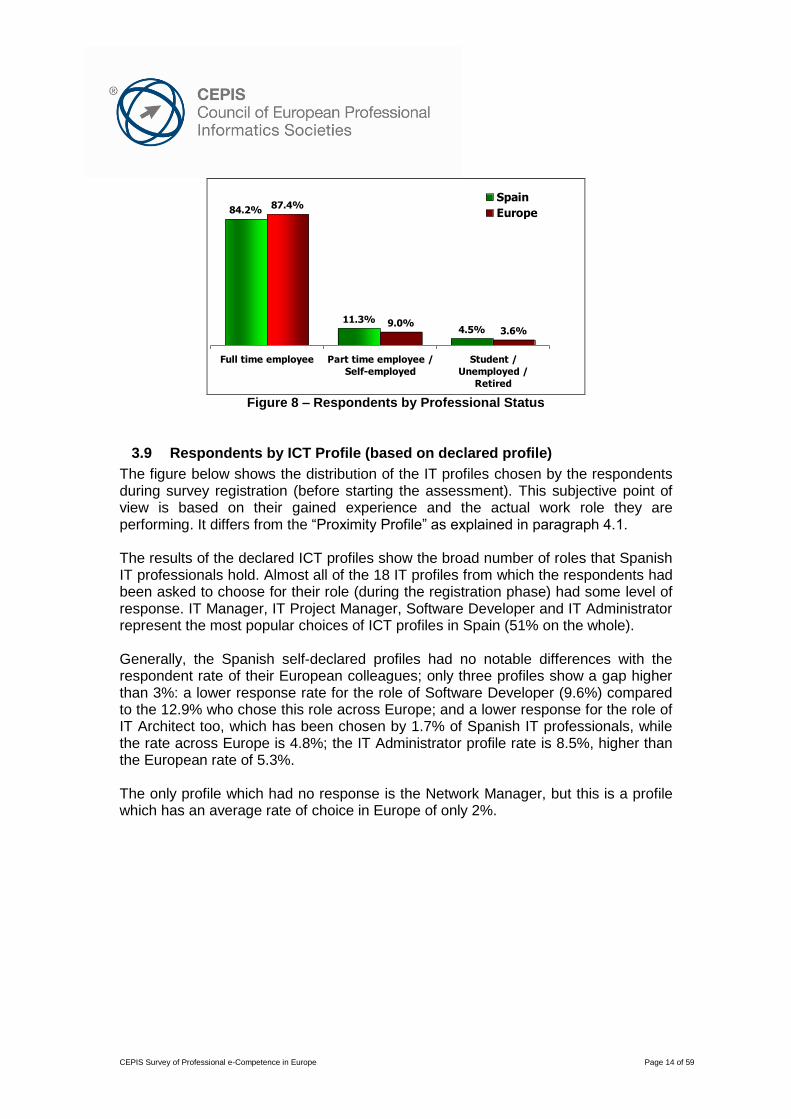
3.8 Respondents by Professional Status
The majority of Spanish respondents hold full time positions3 (84%), which is close to the European average. In particular there are notable features for some IT profiles, for example:
17% of Spanish IT Managers are self employed (while the average in Spain is 10% and in Europe the percentage for this profile is only 11%);
Only 60% of IT Administrators hold full time positions (compared to 89% as the European average), while 20% are self-employed and 20% student/retired. In Europe the rate for IT Administrators is 5% and 7% respectively.
3 Note: as “Full time employee” choice counts more than 85% of total assessments, the other items were grouped as
follows: “Part time employee / Self-employed” and “Student / Unemployed / Retired”
CEPIS Survey of Professional e-Competence in Europe Page 14 of 59
3.6%
84.2%
4.5%11.3% 9.0%
87.4%
Full time employee Part time employee /
Self-employed
Student /
Unemployed /
Retired
Spain
Europe
Figure 8 – Respondents by Professional Status
3.9 Respondents by ICT Profile (based on declared profile)
The figure below shows the distribution of the IT profiles chosen by the respondents during survey registration (before starting the assessment). This subjective point of view is based on their gained experience and the actual work role they are performing. It differs from the “Proximity Profile” as explained in paragraph 4.1. The results of the declared ICT profiles show the broad number of roles that Spanish IT professionals hold. Almost all of the 18 IT profiles from which the respondents had been asked to choose for their role (during the registration phase) had some level of response. IT Manager, IT Project Manager, Software Developer and IT Administrator represent the most popular choices of ICT profiles in Spain (51% on the whole). Generally, the Spanish self-declared profiles had no notable differences with the respondent rate of their European colleagues; only three profiles show a gap higher than 3%: a lower response rate for the role of Software Developer (9.6%) compared to the 12.9% who chose this role across Europe; and a lower response for the role of IT Architect too, which has been chosen by 1.7% of Spanish IT professionals, while the rate across Europe is 4.8%; the IT Administrator profile rate is 8.5%, higher than the European rate of 5.3%. The only profile which had no response is the Network Manager, but this is a profile which has an average rate of choice in Europe of only 2%.

CEPIS Survey of Professional e-Competence in Europe Page 15 of 59
26.0%
4.5%
1.1%
2.8%
5.1%
3.4%
15.3%
5.6%
9.6%
1.7%
1.7%
0.6%
0.6%
0.0%
8.5%
3.4%
5.1%
5.1%
23.6%
2.8%
1.6%
2.1%
5.4%
5.7%
12.9%
3.6%
12.9%
1.2%
4.8%
2.6%
1.4%
2.0%
5.3%
4.2%
2.7%
5.4%
IT Manager P01
IT Quality Manager & Auditor P02
IT Client Manager P03
IT Sales & Mktg Consultant P04
IT Applications Consultant P05
Business Analyst P06
IT Project Manager P07
IT Systems Analyst P08
Software Developer P09
Integr. & Testing Engineer P10
IT Systems Architect P11
IT Security Manager P12
Database Administrator P13
Network Manager P14
IT Administrator P15
IT Systems Engineer P16
Service Support Manager P17
IT Trainer P18
Spain
Europe
Figure 9 – Respondents by ICT Profile
CEPIS Survey of Professional e-Competence in Europe Page 16 of 59
4 Proximity Profiles and Skills Evaluation
Each respondent evaluates their own competence against the 44 competences provided, using the following scale: None: none or almost no knowledge on the topic, confused ideas Basic: knowledge of major concepts, but not exhaustive Medium: knowledge of concepts and applicative capability, some direct experiences High: in-depth and thorough knowledge of concepts and applicative capability with comprehensive experience in complex context A Knowledge Index (KI) has been computed for each competence, using a scale of 0 to 3: KI = ( # of answers “none” * 0 + # of answers “basic” * 1 + # of answers “medium” * 2 + # of answers “high” * 3) / (# of answers) The proximity profile for each respondent is the profile that best fits with the competences that he/she has declared. The proximity is represented as a percentage.
4.1 Respondents by Proximity Profile
Based on the outcome of the calculated proximity profiles we can see a picture of IT Profiles emerge from the competences declared by the Spanish respondents. A high rate of respondents has competences for the roles of Software Developer, Service Support Manager, Integration & Testing Engineer, IT Administrator and IT Systems Analyst. The Software Developer profile shows the second highest rate (15.8%) in Europe (the European average is 12.0%). The IT Systems Analyst profile shows the third highest rate in Europe (7.9%, while the average across Europe is 6.6%). Even for the Service Support Manager, Spain scored the third highest rate (10.7%, European average 8.5%). A very low statistic, compared to the European average of 8.0%, is the IT Project Manager percentage (2.8%).

CEPIS Survey of Professional e-Competence in Europe Page 17 of 59
Spain Europe
12 154
5 80
8 51
4 52
2 41
5 45
5 153
14 127
28 231
16 126
5 85
9 60
5 68
5 64
15 165
10 96
19 163
10 157
# of respondents
6.8%
2.8%
4.5%
2.3%
1.1%
2.8%
2.8%
7.9%
15.8%
9.0%
2.8%
5.1%
2.8%
2.8%
8.5%
5.6%
10.7%
5.6%
IT Manager P01
IT Quality Manager & Auditor P02
IT Client Manager P03
IT Sales & Mktg Consultant P04
IT Applications Consultant P05
Business Analyst P06
IT Project Manager P07
IT Systems Analyst P08
Software Developer P09
Integr. & Testing Engineer P10
IT Systems Architect P11
IT Security Manager P12
Database Administrator P13
Network Manager P14
IT Administrator P15
IT Systems Engineer P16
Service Support Manager P17
IT Trainer P18
Figure 10 – Respondents by Proximity Profile
4.2 Comparison between Professional Profile and Proximity Profile
The analysis of the original profile selection made by the IT practitioners and the proximity profile i.e. the profile that best fits with the competences that he/she has declared shows a large variance for many of the profiles. As we can see from Figure 11, the profile IT Manager is a declared profile for 26% of the respondents in Spain, but an analysis of their competence leads to only 7% of these practitioners having the necessary competence for that particular role. This trend is replicated across Europe, where 24% of respondents declared they were IT Managers, but only 8% of those practitioners had the required competences for that role. In Spain, this issue is also notable with the IT Project Manager profile. The results show that this is a declared profile for 15% of the Spanish respondents, but only 3% were seen to have the competences associated with it after their survey evaluation. This trend, even if with a much smaller gap, is replicated across Europe, as seen in Figure 12, where 13% of European respondents declared they
Figure 11 – IT Manager: declared and calculated profile
Figure 12 - IT Project Manager: declared and calculated profile
15%
13%
3%
8%
Spain
Europe
Declared profile
Calculated profileIT Project Manager P07
26%
24%
7%
8%
Spain
Europe
Declared profile
Calculated profileIT Manager P01
CEPIS Survey of Professional e-Competence in Europe Page 18 of 59
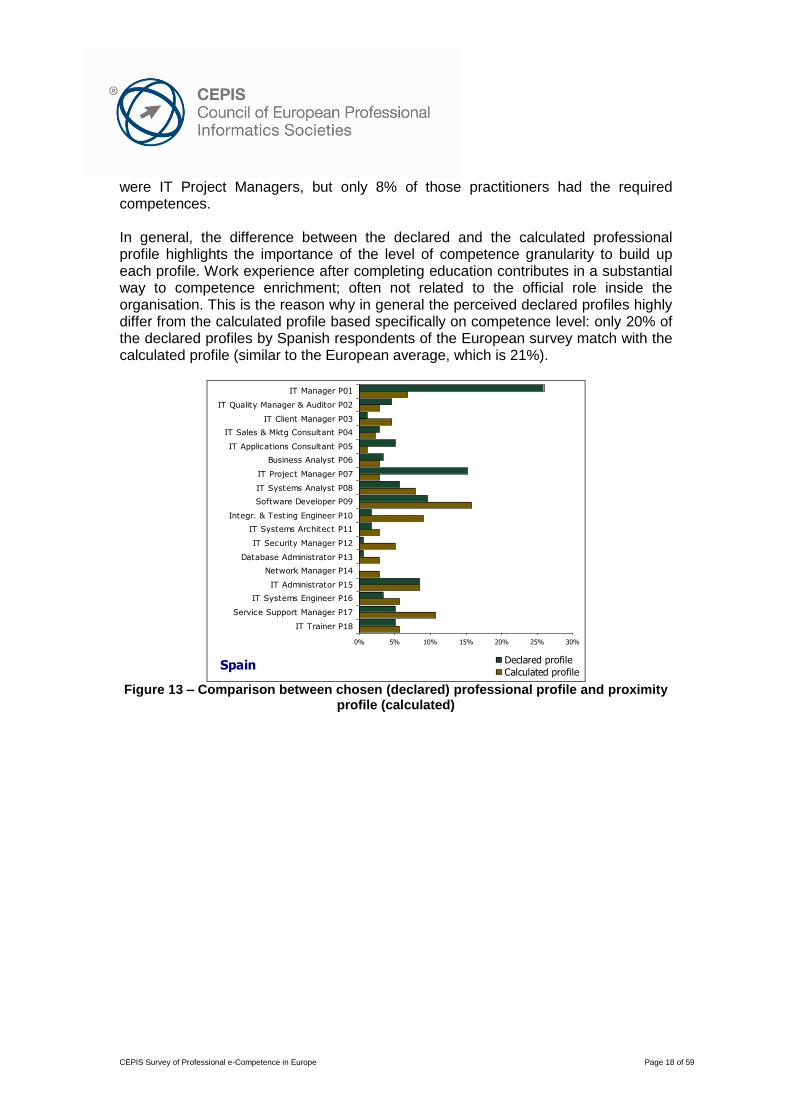
were IT Project Managers, but only 8% of those practitioners had the required competences. In general, the difference between the declared and the calculated professional profile highlights the importance of the level of competence granularity to build up each profile. Work experience after completing education contributes in a substantial way to competence enrichment; often not related to the official role inside the organisation. This is the reason why in general the perceived declared profiles highly differ from the calculated profile based specifically on competence level: only 20% of the declared profiles by Spanish respondents of the European survey match with the calculated profile (similar to the European average, which is 21%).
0% 5% 10% 15% 20% 25% 30%
IT Manager P01
IT Quality Manager & Auditor P02
IT Client Manager P03
IT Sales & Mktg Consultant P04
IT Applications Consultant P05
Business Analyst P06
IT Project Manager P07
IT Systems Analyst P08
Software Developer P09
Integr. & Testing Engineer P10
IT Systems Architect P11
IT Security Manager P12
Database Administrator P13
Network Manager P14
IT Administrator P15
IT Systems Engineer P16
Service Support Manager P17
IT Trainer P18
Declared profile
Calculated profileSpain
Figure 13 – Comparison between chosen (declared) professional profile and proximity
profile (calculated)

CEPIS Survey of Professional e-Competence in Europe Page 19 of 59
0% 5% 10% 15% 20% 25% 30%
IT Manager P01
IT Quality Manager & Auditor P02
IT Client Manager P03
IT Sales & Mktg Consultant P04
IT Applications Consultant P05
Business Analyst P06
IT Project Manager P07
IT Systems Analyst P08
Software Developer P09
Integr. & Testing Engineer P10
IT Systems Architect P11
IT Security Manager P12
Database Administrator P13
Network Manager P14
IT Administrator P15
IT Systems Engineer P16
Service Support Manager P17
IT Trainer P18
Declared profile
Calculated profileEurope
Figure 14 – Europe – Comparison between chosen (declared) professional profile and
proximity profile (calculated)
For the reasons outlined above, we will only use the calculated profiles data for the analysis.
4.3 Analysis of Skills Diffusion
Figure 15 below provides a comparison for Spain and Europe of the ICT competence knowledge index for the five competence areas: Plan, Build, Run, Enable, Manage.
1.63
1.79
1.82
1.34
1.44
1.66
1.67
1.68
1.38
1.51
Plan (A)
Build (B)
Run (C)
Enable (D)
Manage (E)
SpainEurope
Figure 15 – Knowledge Index by competence areas
In Spain, it appears that the Knowledge Index (KI) is generally slightly higher than the equivalent for Europe. The full value of each KI is 3.0.

CEPIS Survey of Professional e-Competence in Europe Page 20 of 59
In particular it appears that in three areas the Knowledge Index is slightly lower: Plan (1.63 for Spain, 1.66 for Europe); Enable, the weakest area for Europe too (1.34 for Spain, 1.38 for Europe); Manage (1.44 for Spain, 1.51 for Europe). As regards the Run area and Build area, Spain scores higher indexes. In the Run area the KI is 1.73 while the European index is 1.68. In the Build area the KI for Spain is 1.79, the second highest across Europe where the average is 1.67. The IT profiles that have the most relevant Knowledge Index are:
IT Administrator with 1.66 KI in Plan area, 1.78 KI in Build area, 2.54 KI in Run area, 1.44 KI in Enable area, 1.38 in Manage Area.
IT Manager with 2.16 KI in Plan area, 1.07 KI in Build area, 1.14 KI in Run area, 1.92 KI in Enable area, 2.25 in Manage area.
A more in-depth analysis of the Knowledge Indexes of each competence area is fundamental in order to design detailed training paths to cover the competence gaps for each proximity profile of each respondent.

CEPIS Survey of Professional e-Competence in Europe Page 21 of 59
5 Analysis
The 177 generated proximity profiles referred to 18 IT professional profiles (Figure 10). The eligibility criteria for the analysis of these profiles are as follows:
10 or more cases per country for each profile;
A proximity profile score higher than 40%. Following these criteria the following eight profiles for Spain were analysed:
1. IT Manager 2. IT Systems Analyst 3. Software Developer 4. Integration & Testing Engineer 5. IT Administrator 6. IT Systems Engineer 7. Service Support Manager 8. IT Trainer
In this chapter a deeper analysis of the data for each of these eight profiles is presented.
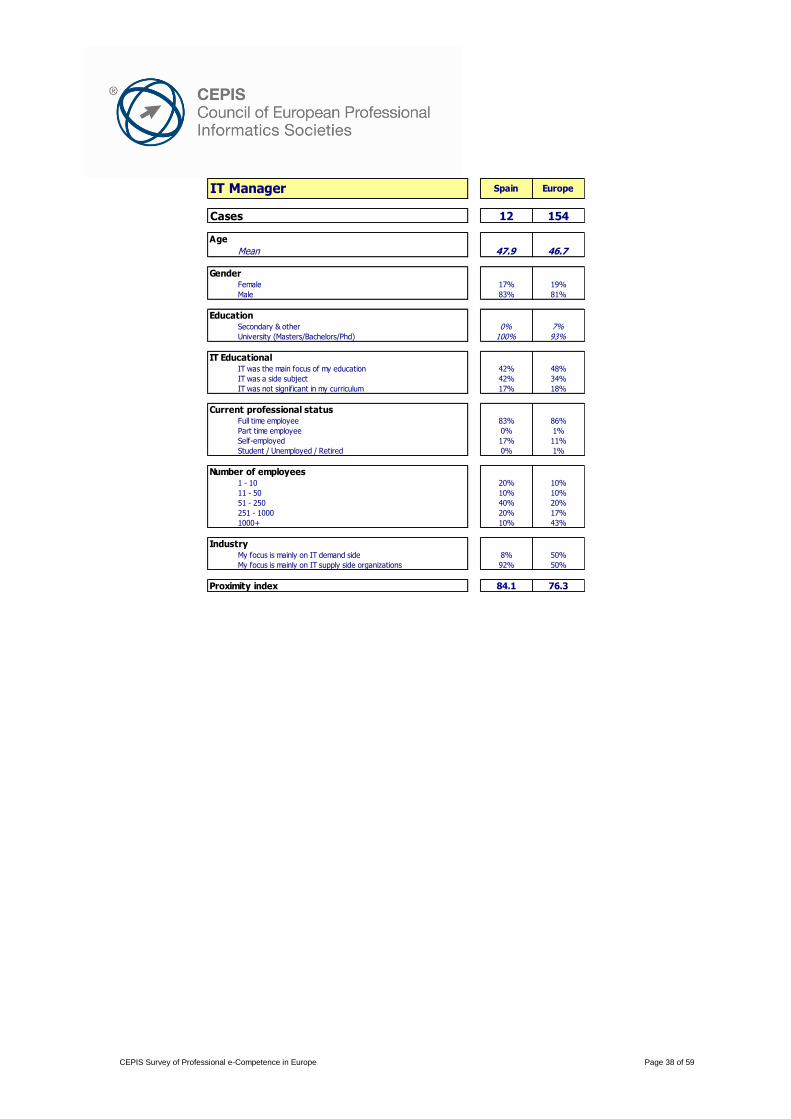
5.1 IT Manager
The following analysis is related to the content of section 7.3.1. All Spanish IT Managers have attained a university degree or higher (100%), this is the highest rate in Europe compared to an average of 93%. Moreover, 92% of Spanish IT Managers have attained a 4th level qualification (Masters or PhD), which is 21% higher than the European education level average of 71%. The minority (42%) of Spanish IT Managers have come from an education background where IT was the main focus in the curriculum, lower than the European average of 48%, and remarkably lower than the Spanish general rate of 72%. Spanish IT Managers are about 48 years old, one year older than their European colleagues, where the average age is 46.7, but four years older compared to other Spanish IT professionals. A small number of IT Managers who responded are female (17%), which is similar to the 19% female proportion for the European IT Manager and higher than the 11%
2.16
1.07
1.14
1.92
2.25
1.96
1.01
1.10
1.70
1.98
Plan (A)
Build (B)
Run (C)
Enable (D)
Manage (E)
SpainEurope
IT Manager
Figure 16 - IT Manager
CEPIS Survey of Professional e-Competence in Europe Page 22 of 59
female proportion for all Spanish respondents. Spanish IT Managers are drawn from the IT supply side (92%). This is the highest rate in Europe, which has an average of 50%; the Spanish average rate is 58%. The distribution of Spanish IT Managers by enterprise size shows a concentration of medium-small organisations (51-250 employees: 40%, twice the European and national rates) and a very low proportion in large organisations (1000+ employees: 10%; across Europe the average is 43% and the Spanish average is 35%). Spanish IT Managers show a Knowledge Index that is generally quite higher than the European average in each area: 2.90 Plan area versus 1.96, 1.07 Build area versus 1.01, 1.14 Run area versus 1.10, 1.92 Enable area versus 1.70 and 2.25 Manage area versus 1.98. The scores for Plan and Manage areas are the best results among analysed countries.
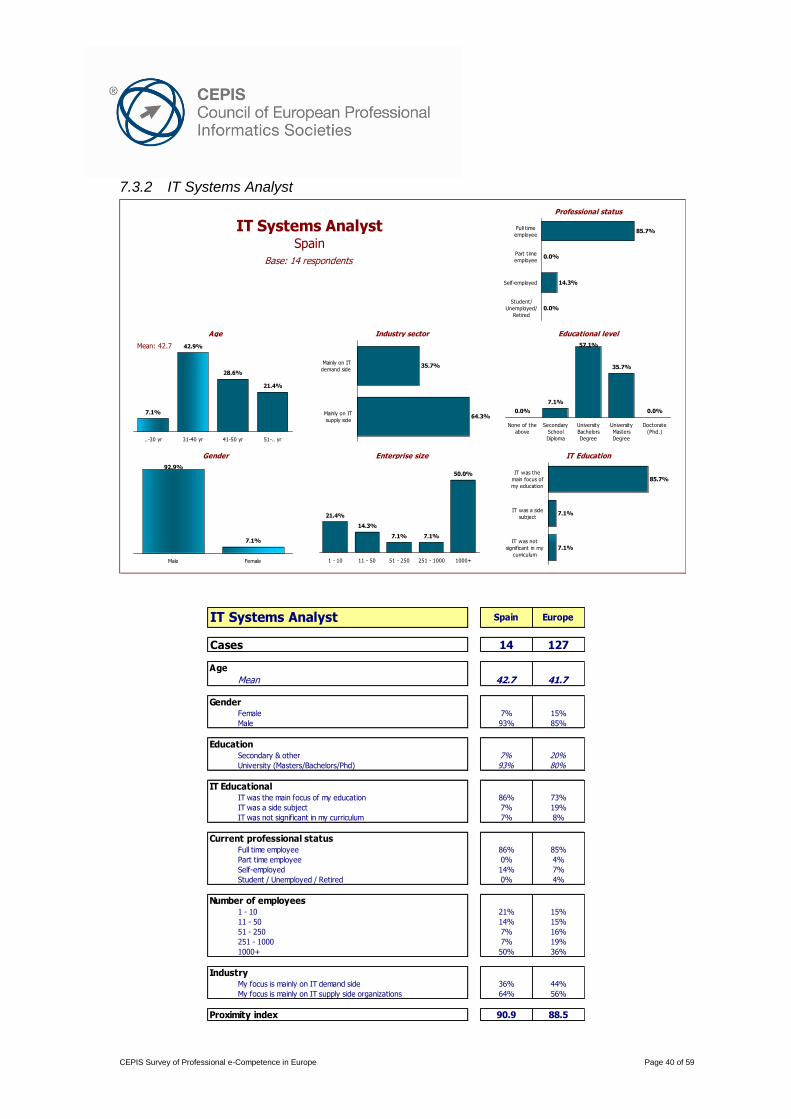
5.2 IT Systems Analyst
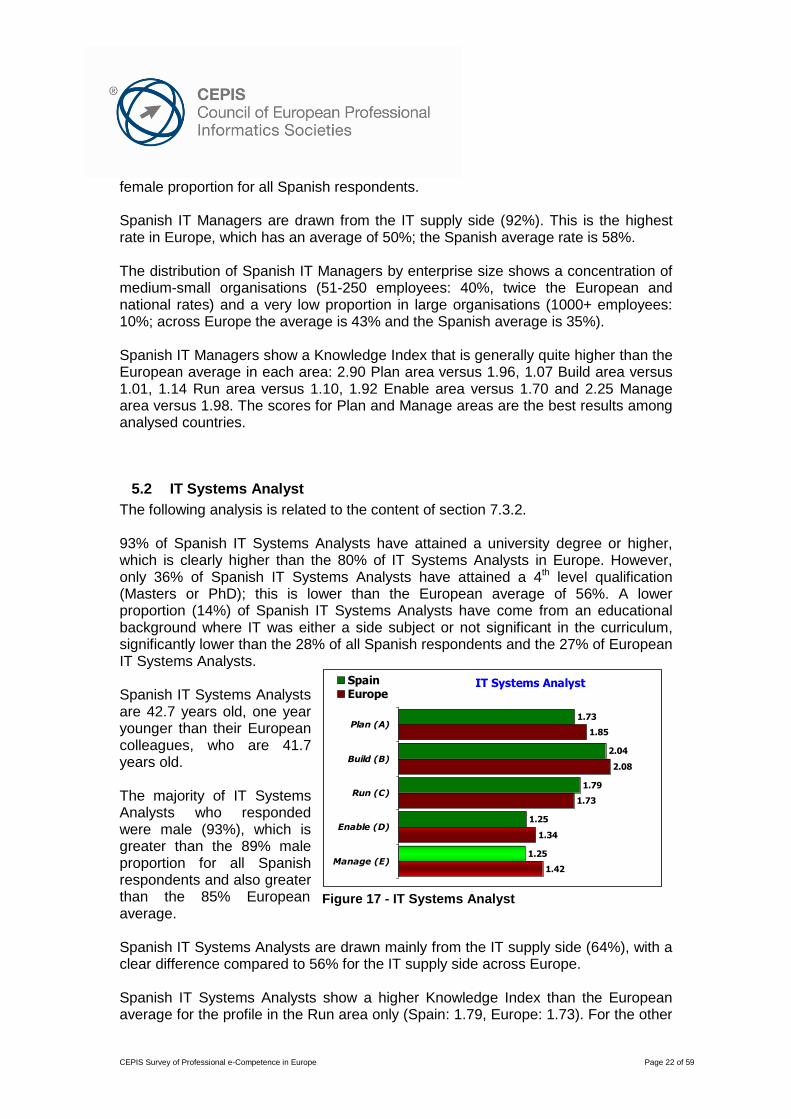
The following analysis is related to the content of section 7.3.2. 93% of Spanish IT Systems Analysts have attained a university degree or higher, which is clearly higher than the 80% of IT Systems Analysts in Europe. However, only 36% of Spanish IT Systems Analysts have attained a 4th level qualification (Masters or PhD); this is lower than the European average of 56%. A lower proportion (14%) of Spanish IT Systems Analysts have come from an educational background where IT was either a side subject or not significant in the curriculum, significantly lower than the 28% of all Spanish respondents and the 27% of European IT Systems Analysts. Spanish IT Systems Analysts are 42.7 years old, one year younger than their European colleagues, who are 41.7 years old. The majority of IT Systems Analysts who responded were male (93%), which is greater than the 89% male proportion for all Spanish respondents and also greater than the 85% European average. Spanish IT Systems Analysts are drawn mainly from the IT supply side (64%), with a clear difference compared to 56% for the IT supply side across Europe. Spanish IT Systems Analysts show a higher Knowledge Index than the European average for the profile in the Run area only (Spain: 1.79, Europe: 1.73). For the other
1.73
2.04
1.79
1.25
1.25
1.85
2.08
1.73
1.34
1.42
Plan (A)
Build (B)
Run (C)
Enable (D)
Manage (E)
SpainEurope
IT Systems Analyst
Figure 17 - IT Systems Analyst
CEPIS Survey of Professional e-Competence in Europe Page 23 of 59
areas the KI is slightly lower (1.73 Plan area versus 1.85, 2.04 Build area versus 2.08, 1.25 Enable area versus 1.34 and 1.25 Manage area versus 1.42).
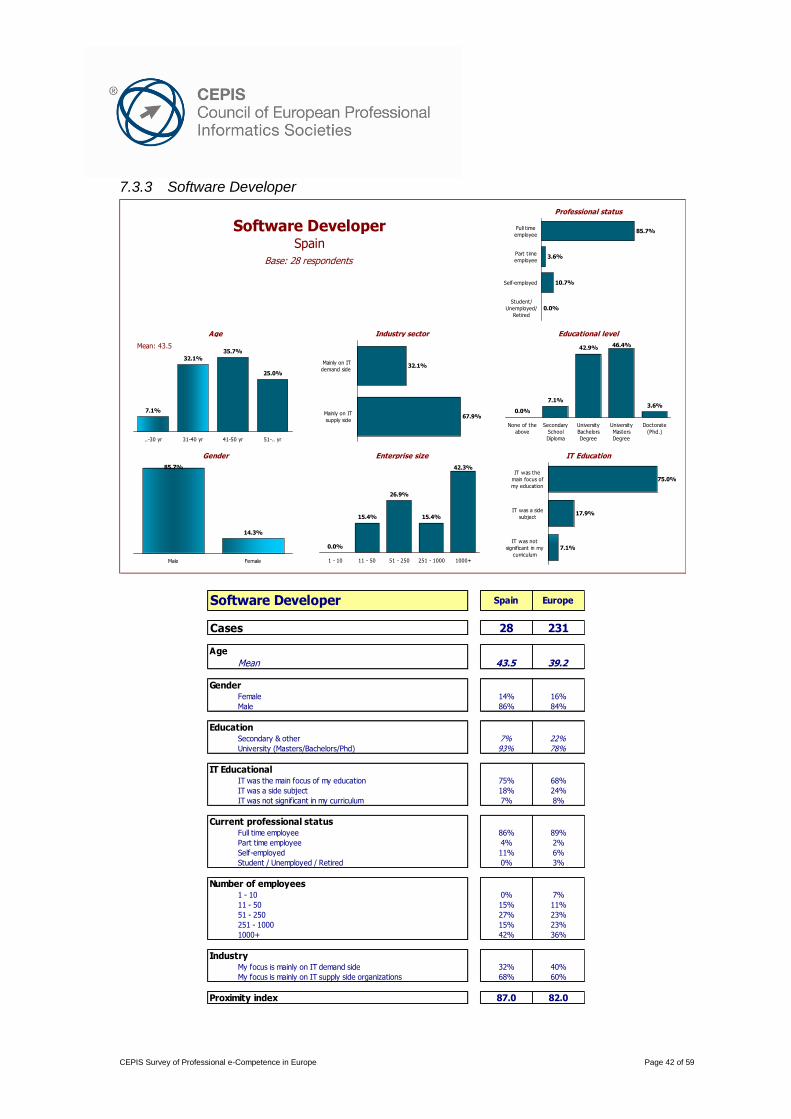
5.3 Software Developer
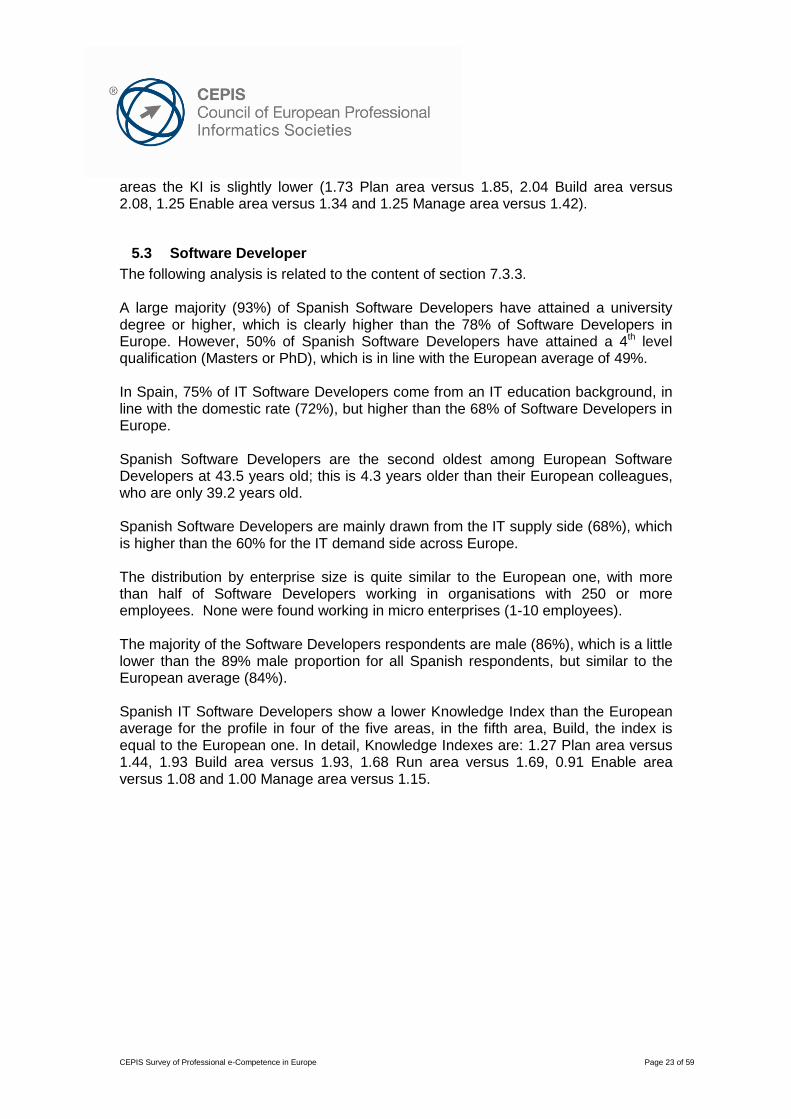
The following analysis is related to the content of section 7.3.3. A large majority (93%) of Spanish Software Developers have attained a university degree or higher, which is clearly higher than the 78% of Software Developers in Europe. However, 50% of Spanish Software Developers have attained a 4th level qualification (Masters or PhD), which is in line with the European average of 49%. In Spain, 75% of IT Software Developers come from an IT education background, in line with the domestic rate (72%), but higher than the 68% of Software Developers in Europe. Spanish Software Developers are the second oldest among European Software Developers at 43.5 years old; this is 4.3 years older than their European colleagues, who are only 39.2 years old. Spanish Software Developers are mainly drawn from the IT supply side (68%), which is higher than the 60% for the IT demand side across Europe. The distribution by enterprise size is quite similar to the European one, with more than half of Software Developers working in organisations with 250 or more employees. None were found working in micro enterprises (1-10 employees). The majority of the Software Developers respondents are male (86%), which is a little lower than the 89% male proportion for all Spanish respondents, but similar to the European average (84%). Spanish IT Software Developers show a lower Knowledge Index than the European average for the profile in four of the five areas, in the fifth area, Build, the index is equal to the European one. In detail, Knowledge Indexes are: 1.27 Plan area versus 1.44, 1.93 Build area versus 1.93, 1.68 Run area versus 1.69, 0.91 Enable area versus 1.08 and 1.00 Manage area versus 1.15.

CEPIS Survey of Professional e-Competence in Europe Page 24 of 59
1.27
1.93
1.68
0.91
1.00
1.44
1.93
1.69
1.08
1.15
Plan (A)
Build (B)
Run (C)
Enable (D)
Manage (E)
SpainEurope
Software Developer
Figure 18 - Software Developer
5.4 Integration & Testing Engineer
The following analysis is related to the content of section 7.3.4. The large majority (75%) of Spanish Integration & Testing Engineers have attained a university degree or higher, a slightly lower rate than the 80% of Integration & Testing Engineers in Europe. Anyway, 44% of Spanish Integration & Testing Engineers have attained a 4th level qualification (Masters or PhD), which is in line with the European average of 41%. In Spain 63% of Integration & Testing Engineers come from an IT education background, a lower rate than the 72% of all Spanish respondents, and than the 77% of their European colleagues. The Spanish Integration & Testing Engineer average is 46.2 years old, 8 years older than the European average, and the oldest among European colleagues, who are 38.2 years old. The majority of the Integration & Testing Engineers who responded were male (88%), which is in line with the 89% male proportion for all Spanish respondents and higher than the 80% rate across Europe. Spanish Integration & Testing Engineers were drawn equally from the IT supply side and the demand side (50:50), a different ratio compared to the 43% for the IT supply side across Europe.

CEPIS Survey of Professional e-Competence in Europe Page 25 of 59
1.17
2.31
1.59
0.72
0.76
1.31
2.25
1.69
0.95
0.98
Plan (A)
Build (B)
Run (C)
Enable (D)
Manage (E)
SpainEurope
Integration & Testing Engineer
Figure 19 - Integration & Testing Engineer
The distribution by enterprise size is quite similar to the European one, with a light shift toward bigger enterprises. Half of Spanish Integration & Testing Engineers work in organisations with 1,000 or more employees (European proportion for this size class is 30%). None have been found working in micro enterprises (1-10 employees) while in Europe the average proportion is 9%.
Spanish Integration & Testing Engineers show a higher Knowledge Index than the European average for the profile in only one of the five areas: Build KI is 2.31 versus 2.25 for Europe. For the remaining four areas the Spanish KI are lower: Plan 1.17 versus 1.31; Run 1.59 versus 1.69; Enable 0.72 versus 0.95; Manage 0.76 versus 0.98.
5.5 IT Administrator
The following analysis is related to the content of section 7.3.5. Two out of three Spanish IT Administrators have attained a university degree or higher, a proportion similar to the 64% of IT Administrators in Europe, but lower if compared to the Spanish general average (82%). However, only 20% of Spanish IT Administrators have attained a 4th level qualification (Masters or PhD), which is lower than the European average of 30%. In Spain 87% of the IT Administrators came from an IT education background, quite high compared to 69% of European colleagues, and to 72% of all Spanish respondents. Spanish IT Administrators were drawn principally from the IT demand side (67%) a rate comparable to 65% for the IT demand side across Europe, while the Spanish average is 42%. Spanish IT Administrators are on average 41.3 years old, three years older than their European colleagues, but about three years younger than other Spanish IT Professionals, who are 44 years old. A majority of the IT Administrators who responded are male (80%), lower than the proportion of all respondents from Spain (89%) or across Europe (93%).

CEPIS Survey of Professional e-Competence in Europe Page 26 of 59
Spanish IT Administrators show a rather different Knowledge Index compared to the European average. In two areas the KI of Spanish IT Administrators is a bit smaller: in Enable area the KI is 1.44 while the European average is 1.45; in Manage area the Spanish KI is 1.38 while the European average is 1.41. As regard the remaining three areas, Spanish Knowledge Indexes are higher than European ones: for Plan area 1.66 versus 1.62, for Build area 1.78 versus 1.61 and Run area 2.54 versus 2.31.
5.6 IT Systems Engineer
The following analysis is related to the content of section 7.3.6. 80% of Spanish IT Systems Engineers have attained a university degree or higher, clearly higher than the 63% of IT Systems Engineers in Europe and in line with the Spanish general average of 82%. Moreover, 40% of Spanish IT Systems Engineers have attained a 4th level qualification (Masters or PhD), which is in line with the European average of 38%, even if a bit lower than the national average (45%). In Spain 60% of the IT Systems Engineers came from an IT education background, in line with the rate of 58% of European colleagues, but lower than the 72% of all Spanish respondents. The Spanish IT Systems Engineer average age is 40.7 years old, two years older compared to the European average (38.6), but three years younger than the national average (44.0). Spanish IT Systems Engineers were drawn mainly from the IT supply side (70%) compared to 46% for the IT demand side across Europe, while the Spanish average is 58%. The majority of IT Systems Engineers work in organisations with 250 employees or more (70%), a high rate compared to European colleagues (52%) and to all respondents from Spain (54%). All of the IT Systems Engineers who responded from Spain were male, while the male proportion for all Spanish respondents is 89% and for Europe is 95%. Spanish IT Systems Engineers show a good performance in Knowledge Index (KI) for only two areas, while the remaining three KI’s are lower than the European average for the profile; (1.38 Plan area versus 1.56, 1.89 Build area versus 1.69,
1.66
1.78
2.54
1.44
1.38
1.62
1.61
2.31
1.45
1.41
Plan (A)
Build (B)
Run (C)
Enable (D)
Manage (E)
SpainEurope
IT Administrator
Figure 20 - IT Administrator

CEPIS Survey of Professional e-Competence in Europe Page 27 of 59
2.25 Run area versus 2.17, 1.26 Enable area versus 1.34, 1.21 Manage area versus 1.41).
1.38
1.89
2.25
1.26
1.21
1.56
1.69
2.17
1.34
1.41
Plan (A)
Build (B)
Run (C)
Enable (D)
Manage (E)
SpainEurope
IT Systems Engineer
Figure 21 - IT Systems Engineer
5.7 Service Support Manager
The following analysis is related to the content of section 7.3.7. 79% of Spanish Service Support Managers have attained a university degree or higher, a proportion similar to the 81% of Service Support Managers in Europe. Moreover, 37% of Spanish Service Support Managers have attained a 4th level qualification (Masters or PhD), which is very similar to the European average of 41%. In Spain, 74% of the Service Support Managers came from an IT education background, clearly a high proportion compared to 60% of their European colleagues, but in line with the 72% proportion of all Spanish respondents. Spanish Service Support Managers are 42.6 years old, about two years older than their European colleagues, who are 40.3 years old, but younger than other Spanish IT professionals, whose average age is 44. A large proportion of Service Support Managers who responded are male (95%), which is higher than the 89% male proportion for all Spanish respondents, and clearly higher than the 83% European average. Spanish Service Support Managers were drawn principally from the IT supply side (63%) compared to 46% for the IT supply side across Europe. Spanish Service Support Managers show a Knowledge Index higher than the European average in only two areas: Run (2.00 versus 1.91) and Enable (1.24 versus 1.13). For the remaining three areas KI’s are lower than the European average for the profile: Plan (1.38 versus 1.45); Build (1.38 versus 1.47); Manage (1.25 versus 1.27).

CEPIS Survey of Professional e-Competence in Europe Page 28 of 59
1.38
1.38
2.00
1.24
1.25
1.45
1.47
1.91
1.13
1.27
Plan (A)
Build (B)
Run (C)
Enable (D)
Manage (E)
SpainEurope
Service Support Manager
Figure 22 - Service Support Manager
5.8 IT Trainer
The following analysis is related to the content of section 7.3.8. A large majority (90%) of Spanish IT Trainers have attained a university degree or higher, which is quite similar to the 85% of IT Trainers in Europe. However, 50% of Spanish IT Trainers have attained a 4th level qualification (Masters or PhD), which is slightly lower than the European average of 57%. In Spain 70% of IT Trainers come from an IT education background, the second highest rate across Europe. This proportion is very similar to 72% of all Spanish respondents, but clearly higher than the 57% of European average. Spanish IT Trainers are on average 41.7 years old, younger than the average Spanish IT professional (44), but similar to their European colleagues, who are 41.1 years old. A small number of the IT Trainers who responded are female (30%), which is markedly higher than the 11% female proportion for all Spanish respondents. But lower than the 41% European rate. IT Trainer is the professional profile in which women are most represented across Europe. Spanish IT Trainers are mainly drawn from the IT supply side (70%), significantly higher than the 51% of IT supply side across Europe, but also higher than the national rate of 58%. Spanish IT Trainers show a higher Knowledge Index than the European average for the profile in all five areas (1.60 Plan area versus 1.36, 1.40 Build area versus 1.30, 1.36 Run area versus 1.20, 1.71 Enable area versus 1.35, 1.83 Manage area versus 1.46). The Spanish KI results show the best KI in each area.

CEPIS Survey of Professional e-Competence in Europe Page 29 of 59
1.60
1.40
1.36
1.71
1.83
1.36
1.30
1.20
1.35
1.46
Plan (A)
Build (B)
Run (C)
Enable (D)
Manage (E)
SpainEurope
IT Trainer
Figure 23 - IT Trainer
CEPIS Survey of Professional e-Competence in Europe Page 30 of 59
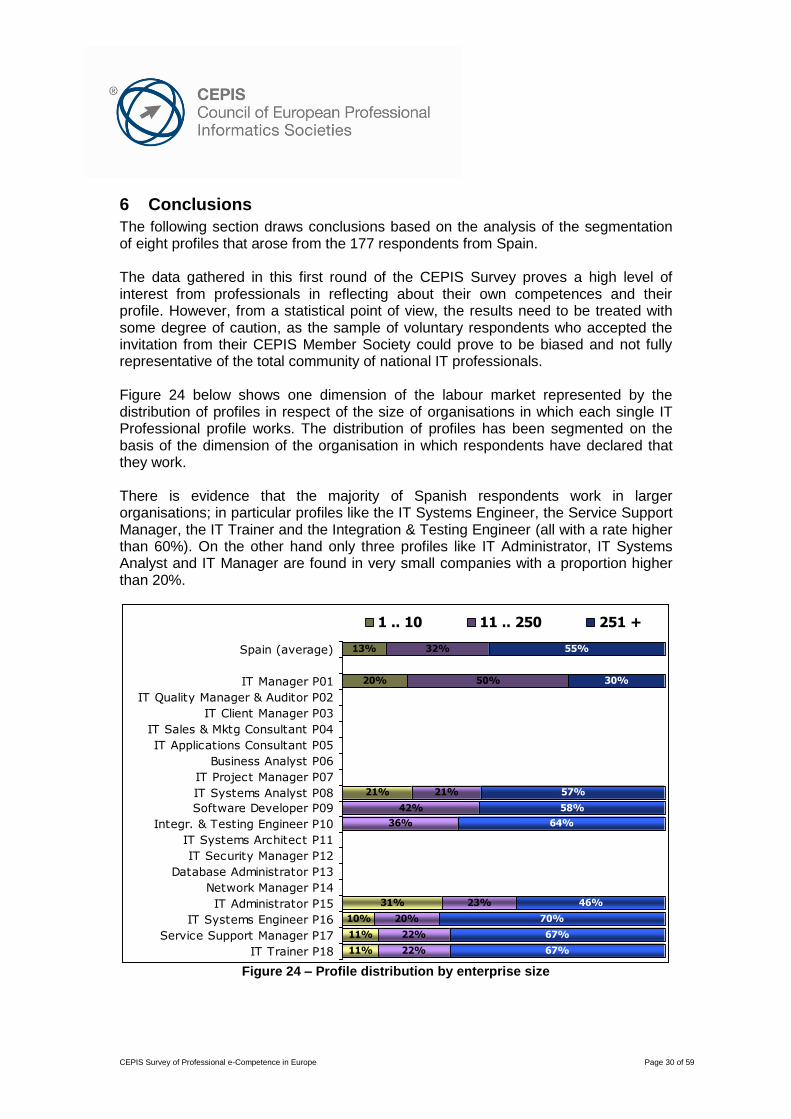
6 Conclusions
The following section draws conclusions based on the analysis of the segmentation of eight profiles that arose from the 177 respondents from Spain. The data gathered in this first round of the CEPIS Survey proves a high level of interest from professionals in reflecting about their own competences and their profile. However, from a statistical point of view, the results need to be treated with some degree of caution, as the sample of voluntary respondents who accepted the invitation from their CEPIS Member Society could prove to be biased and not fully representative of the total community of national IT professionals. Figure 24 below shows one dimension of the labour market represented by the distribution of profiles in respect of the size of organisations in which each single IT Professional profile works. The distribution of profiles has been segmented on the basis of the dimension of the organisation in which respondents have declared that they work. There is evidence that the majority of Spanish respondents work in larger organisations; in particular profiles like the IT Systems Engineer, the Service Support Manager, the IT Trainer and the Integration & Testing Engineer (all with a rate higher than 60%). On the other hand only three profiles like IT Administrator, IT Systems Analyst and IT Manager are found in very small companies with a proportion higher than 20%.
13%
20%
21%
31%
10%
11%
11%
32%
50%
21%
42%
36%
23%
20%
22%
22%
55%
30%
57%
58%
64%
46%
70%
67%
67%
Spain (average)
IT Manager P01
IT Quality Manager & Auditor P02
IT Client Manager P03
IT Sales & Mktg Consultant P04
IT Applications Consultant P05
Business Analyst P06
IT Project Manager P07
IT Systems Analyst P08
Software Developer P09
Integr. & Testing Engineer P10
IT Systems Architect P11
IT Security Manager P12
Database Administrator P13
Network Manager P14
IT Administrator P15
IT Systems Engineer P16
Service Support Manager P17
IT Trainer P18
1 .. 10 11 .. 250 251 +
Figure 24 – Profile distribution by enterprise size

CEPIS Survey of Professional e-Competence in Europe Page 31 of 59
The analysis of profile segmentation by age distribution (section 7.4.1) shows that the general average age is 44 in Spain against a European average age of 41. The proportion of professionals under 30 years old is very small with only 9% of respondents in this category. As in other countries, for Spain there is a need to attract younger people to the IT Profession without losing the experience of the older age group. The segmentation of the profiles by gender (section 7.4.3) provides evidence that the female representation in Spain is very restricted; in only two profiles is the representation of women larger than 20% (IT Administrator 20% and IT Trainer 30%), in one profile women are not represented at all (IT Systems Engineer) even if, also at European level, female presence in this profile is scarce (5%). The results of the educational level (section 7.4.4 and 7.4.5) survey questions suggest that there is a good level of attainment of degrees. In six out of the eight analysed profiles the Spanish rate is higher than the European rate. With respect to the profile distribution by IT education background, there is some evidence to suggest a sufficient education: indeed only the IT Manager profile counts for more than half of IT Professionals with a non-IT focused education. The majority of the IT profiles work in the IT supply side (section 7.4.6); in more detail IT Manager, IT System Engineer, IT Trainer, Software Developer, IT Systems Analyst, and Service Support Manager (all with a rate of 60% or more). On the demand side there is a predominance of the IT Administrator profile (67%). The remaining profile, Integration & Testing Engineer, is equally present in both the demand and supply side (50/50). For the level of Knowledge Index (section 4.3) Spanish respondents present two different types of scores: in the Build and Run areas the indexes are higher than European averages, while in the remaining three areas (Manage, Enable and Plan), indexes are lower. A deeper analysis of the Knowledge Indexes compared to each profile requirements is fundamental in order to design detailed training paths to cover the competence gaps for each proximity profile of each respondent. For further information on this study please see www.cepis.org or www.ati.es.

CEPIS Survey of Professional e-Competence in Europe Page 32 of 59
7 Annex
7.1 Description of Additional Segmentation
The research has been conducted via an e-CF based web questionnaire. To enhance the differentiation of the 18 profiles gathered: an additional segmentation of eight more ICT competencies have been introduced on the basic nucleus of 36 as outlined here below.
European e-Competence Framework 2.0
CEPIS Survey of Professional e-Competence in Europe
B.1. Design and Development B.1a. Design and Development (Infrastructure and Software Environment)
B.1b. Design and Development (Data Model and Application Logics)
B.1c. Design and Development (User Interfaces)
B.2. Systems Integration B.2a. Systems Integration (Configuration and Performance Control)
B.2b. Systems Integration (Package Selection and Customization)
C.4. Problem Management C.4a. Problem Management (Process)
C.4b. Problem Management (Network Operation)
C.4c. Problem Management (Computer System Operation)
C.4d. Problem Management (Database Administration)
C.4e. Problem Management (Application Maintenance)
D.9. Personnel Development D.9a. Personnel Development (Competence Analysis)
D.9b. Personnel Development (Resource Management)
This additional segmentation has proven valuable in improving the uniqueness of each job profile.
For instance, all CEPIS Survey responses until 11/2/2011 were analysed, and in this sample only 20 respondents had identified themselves as Network Managers in initial pages (before entering the detailed questionnaire): 17 of them got a proximity value to the same profile in the range 51% to 100%, whilst the remaining three got values between 0 and 18% (maybe they did not complete the questionnaire); therefore, these three respondents were discarded from mean value calculation.

CEPIS Survey of Professional e-Competence in Europe Page 33 of 59
Self-declared
Network Network Mgr DB Admin Network Mgr DB Admin
Managers 80.81% 78.08% 80.65% 50.47%
1 4% 3% 6% 4%
2 97% 94% 98% 60%
3 83% 87% 88% 79%
4 77% 55% 81% 33%
5 75% 70% 84% 74%
6 100% 98% 100% 89%
7 95% 84% 95% 76%
8 99% 98% 100% 89%
9 98% 78% 99% 45%
10 92% 89% 99% 77%
11 64% 65% 18% 19%
12 65% 74% 62% 12%
13 70% 64% 63% 18%
14 88% 84% 83% 45%
15 0% 0% 0% 0%
16 86% 74% 81% 12%
17 58% 81% 54% 35%
18 61% 70% 58% 25%
19 54% 67% 51% 21%
20 76% 60% 75% 69%
E-CF 2.0 (pure) enhanced e-CF
Results with the “Additional e-CF Segmentation” are shown in columns 4 & 5 in the above table:
80.65% average proximity to the Network Manager profile,
50.47% average proximity to the Database Administrator profile; this means that a Network Manager normally does not have all detailed competences to act as a good Database Administrator. Columns 2 & 3 show simulated results of data processing with the original set of 36 e-CF competences:
80.81% proximity to the Network Manager profile (Similar to the previous result),
78.08% proximity to the Database Administrator profile. In this case, the Database Administrator profile can hardly be distinguished from the Network Manager profile (as it appears that they require nearly the same set of "pure" e-CF competences). This shows that if we do not split different technology contents of the various competences, we are not able to differentiate between some technical profiles.

CEPIS Survey of Professional e-Competence in Europe Page 34 of 59
7.2 ICT Competence – Knowledge index
1.61
1.59
1.40
1.86
1.75
1.88
1.84
1.08
1.67
1.59
1.55
1.94
1.72
1.81
1.83
1.19
IS & Business Strategy Alignment A01
Service Level Management A02
Business Plan Development A03
Product or Project Planning A04
Architecture Design A05
Application Design A06
Technology Watching A07
Sustainable development A08
SpainEurope
Figure A1 – ICT Competence – Knowledge index – Plan
1.75
1.93
1.81
1.83
1.68
1.71
1.77
1.86
1.62
1.67
1.65
1.70
1.55
1.72
1.66
1.75
Design & Development (infrastructure &
sw environment) B01a
Design & Development (data model &
application logics) B01b
Design & Development (user interface)
B01c
Systems Integration (configuration &
performance control) B02a
Systems Integration (package selection &
customization) B02b
Testing B03
Solution Deployment B04
Documentation Production B05
SpainEurope
Figure A2 – ICT Competence – Knowledge index – Build

CEPIS Survey of Professional e-Competence in Europe Page 35 of 59
2.25
2.02
1.87
2.17
1.40
1.58
1.42
1.86
2.03
1.83
1.74
1.87
1.37
1.57
1.35
1.66
User Support C01
Change Support C02
Service Delivery C03
Problem Management (process) C04a
Problem Management (network
operation) C04b
Problem Management (computer system
operation) C04c
Problem Management (database
administration) C04d
Problem Management (application
maintenance) C04e
SpainEurope
Figure A3 – ICT Competence – Knowledge index – Run
1.46
1.47
1.50
1.41
1.33
0.88
0.93
1.24
1.46
1.47
1.63
1.44
1.50
1.55
1.41
1.28
0.94
0.99
1.25
1.57
1.66
1.55
Information Security Strategy
Development D01
ICT Quality Strategy Development D02
Education & Training Provision D03
Purchasing D04
Sales Proposal Development D05
Channel Management D06
Sales Management D07
Contract Management D08
Personnel Development (competence
analysis) D09aPersonnel Development (resource
management) D09bInformation & Knowledge Management
D10
SpainEurope
Figure A4 – ICT Competence – Knowledge index – Enable

CEPIS Survey of Professional e-Competence in Europe Page 36 of 59
1.09
1.47
1.39
1.64
1.54
1.45
1.51
1.44
1.45
1.26
1.62
1.47
1.61
1.63
1.49
1.55
1.41
1.55
Forecast Development E01
Project & Portfolio Management E02
Risk Management E03
Relationship Management E04
Process Improvement E05
ICT Quality Management E06
Business Change Management E07
Information Security Management E08
IT Governance E09
SpainEurope
Figure A5 – ICT Competence – Knowledge index – Manage

CEPIS Survey of Professional e-Competence in Europe Page 37 of 59
7.3 Proximity Profiles – Details
7.3.1 IT Manager
Gender IT EducationEnterprise size
Age Industry sector Educational level
Spain
IT Manager
Base: 12 respondents
Professional status
83.3%
0.0%
16.7%
0.0%
Full time
employee
Part time
employee
Self-employed
Student/
Unemployed/
Retired
0.0% 0.0%8.3%
91.7%
0.0%
None of the
above
Secondary
School
Diploma
University
Bachelors
Degree
University
Masters
Degree
Doctorate
(Phd.)
41.7%
41.7%
16.7%
IT was the
main focus of
my education
IT was a side
subject
IT was not
significant in my
curriculum
20.0%
10.0%
40.0%
20.0%
10.0%
1 - 10 11 - 50 51 - 250 251 - 1000 1000+
8.3%
91.7%
Mainly on IT
demand side
Mainly on IT
supply side0.0%
25.0%
41.7%
33.3%
..-30 yr 31-40 yr 41-50 yr 51-.. yr
Mean: 47.9
16.7%
83.3%
FemaleMale
CEPIS Survey of Professional e-Competence in Europe Page 38 of 59
Spain Europe
Cases 12 154
Age
Mean 47.9 46.7
GenderFemale 17% 19%
Male 83% 81%
EducationSecondary & other 0% 7%University (Masters/Bachelors/Phd) 100% 93%
IT EducationalIT was the main focus of my education 42% 48%
IT was a side subject 42% 34%
IT was not significant in my curriculum 17% 18%
Current professional statusFull time employee 83% 86%
Part time employee 0% 1%
Self-employed 17% 11%
Student / Unemployed / Retired 0% 1%
Number of employees1 - 10 20% 10%
11 - 50 10% 10%
51 - 250 40% 20%
251 - 1000 20% 17%
1000+ 10% 43%
IndustryMy focus is mainly on IT demand side 8% 50%
My focus is mainly on IT supply side organizations 92% 50%
Proximity index 84.1 76.3
IT Manager

CEPIS Survey of Professional e-Competence in Europe Page 39 of 59
Spain Europe
Proximity index 84.1 76.3Min 46 40Max 100 100
Knowledge index
A- Plan 2.16 1.96A01) IS & Business Strategy Alignment 2.75 2.64A02) Service Level Management 2.25 1.98A03) Business Plan Development 2.50 2.22A04) Product or Project Planning 2.67 2.25A05) Architecture Design 1.83 1.74A06) Application Design 1.33 1.51A07) Technology Watching 2.25 2.03A08) Sustainable development 1.67 1.34
B- Build 1.07 1.01B01a) Design & Development (infrastructure & sw environment) 1.42 1.03B01b) Design & Development (data model & application logics) 1.17 0.98B01c) Design & Development (user interface) 1.00 0.94B02a) Systems Integration (configuration & performance control) 1.00 0.94B02b) Systems Integration (package selection & customization) 0.92 0.87B03) Testing 0.92 1.08B04) Solution Deployment 1.00 1.10B05) Documentation Production 1.17 1.17
C- Run 1.14 1.10C01) User Support 1.25 1.34C02) Change Support 1.33 1.26C03) Service Delivery 1.42 1.26C04a) Problem Management (process) 1.58 1.40C04b) Problem Management (network operation) 0.92 0.93C04c) Problem Management (computer system operation) 1.08 0.97C04d) Problem Management (database administration) 0.58 0.71C04e) Problem Management (application maintenance) 0.92 0.92
D- Enable 1.92 1.70D01) Information Security Strategy Development 1.75 1.64D02) ICT Quality Strategy Development 1.92 1.85D03) Education & Training Provision 1.75 1.70D04) Purchasing 2.00 1.77D05) Sales Proposal Development 2.00 1.63D06) Channel Management 1.50 1.32D07) Sales Management 1.67 1.40D08) Contract Management 2.17 1.84D09a) Personnel Development (competence analysis) 2.08 1.89D09b) Personnel Development (resource management) 2.17 1.94D10) Information & Knowledge Management 2.17 1.76
E- Manage 2.25 1.98E01) Forecast Development 2.00 1.79E02) Project & Portfolio Management 2.67 2.14E03) Risk Management 2.25 1.95E04) Relationship Management 2.67 2.09E05) Process Improvement 2.17 2.10E06) ICT Quality Management 1.75 1.75E07) Business Change Management 2.50 2.08E08) Information Security Management 1.83 1.62E09) IT Governance 2.42 2.27
IT Manager
CEPIS Survey of Professional e-Competence in Europe Page 40 of 59
7.3.2 IT Systems Analyst
Gender IT EducationEnterprise size
Age Industry sector Educational level
Spain
IT Systems Analyst
Base: 14 respondents
Professional status
85.7%
0.0%
14.3%
0.0%
Full time
employee
Part time
employee
Self-employed
Student/
Unemployed/
Retired
0.0%
7.1%
57.1%
35.7%
0.0%
None of the
above
Secondary
School
Diploma
University
Bachelors
Degree
University
Masters
Degree
Doctorate
(Phd.)
85.7%
7.1%
7.1%
IT was the
main focus of
my education
IT was a side
subject
IT was not
significant in my
curriculum
21.4%
14.3%
7.1% 7.1%
50.0%
1 - 10 11 - 50 51 - 250 251 - 1000 1000+
35.7%
64.3%
Mainly on IT
demand side
Mainly on IT
supply side
7.1%
42.9%
28.6%
21.4%
..-30 yr 31-40 yr 41-50 yr 51-.. yr
Mean: 42.7
7.1%
92.9%
FemaleMale
Spain Europe
Cases 14 127
Age
Mean 42.7 41.7
GenderFemale 7% 15%
Male 93% 85%
EducationSecondary & other 7% 20%University (Masters/Bachelors/Phd) 93% 80%
IT EducationalIT was the main focus of my education 86% 73%
IT was a side subject 7% 19%
IT was not significant in my curriculum 7% 8%
Current professional statusFull time employee 86% 85%
Part time employee 0% 4%
Self-employed 14% 7%
Student / Unemployed / Retired 0% 4%
Number of employees1 - 10 21% 15%
11 - 50 14% 15%
51 - 250 7% 16%
251 - 1000 7% 19%
1000+ 50% 36%
IndustryMy focus is mainly on IT demand side 36% 44%
My focus is mainly on IT supply side organizations 64% 56%
Proximity index 90.9 88.5
IT Systems Analyst

CEPIS Survey of Professional e-Competence in Europe Page 41 of 59
Spain Europe
Proximity index 90.9 88.5Min 76 41Max 100 100
Knowledge index
A- Plan 1.73 1.85A01) IS & Business Strategy Alignment 1.57 1.74A02) Service Level Management 1.64 1.43A03) Business Plan Development 1.36 1.56A04) Product or Project Planning 1.64 2.03A05) Architecture Design 2.00 2.06A06) Application Design 2.50 2.72A07) Technology Watching 2.21 2.02A08) Sustainable development 0.93 1.21
B- Build 2.04 2.08B01a) Design & Development (infrastructure & sw environment) 1.86 1.95B01b) Design & Development (data model & application logics) 2.36 2.33B01c) Design & Development (user interface) 2.07 2.23B02a) Systems Integration (configuration & performance control) 2.21 2.07B02b) Systems Integration (package selection & customization) 2.21 2.13B03) Testing 1.79 2.17B04) Solution Deployment 1.93 1.80B05) Documentation Production 1.86 1.95
C- Run 1.79 1.73C01) User Support 2.14 2.10C02) Change Support 2.00 2.06C03) Service Delivery 1.71 1.72C04a) Problem Management (process) 2.07 1.87C04b) Problem Management (network operation) 1.36 1.25C04c) Problem Management (computer system operation) 1.50 1.47C04d) Problem Management (database administration) 1.57 1.57C04e) Problem Management (application maintenance) 1.93 1.76
D- Enable 1.25 1.34D01) Information Security Strategy Development 1.57 1.37D02) ICT Quality Strategy Development 1.50 1.58D03) Education & Training Provision 1.43 1.68D04) Purchasing 1.14 1.21D05) Sales Proposal Development 0.93 1.27D06) Channel Management 0.64 0.79D07) Sales Management 0.57 0.83D08) Contract Management 1.29 1.07D09a) Personnel Development (competence analysis) 1.43 1.64D09b) Personnel Development (resource management) 1.57 1.70D10) Information & Knowledge Management 1.71 1.65
E- Manage 1.25 1.42E01) Forecast Development 0.79 1.07E02) Project & Portfolio Management 1.07 1.62E03) Risk Management 1.14 1.29E04) Relationship Management 1.36 1.45E05) Process Improvement 1.79 1.69E06) ICT Quality Management 1.29 1.40E07) Business Change Management 1.21 1.34E08) Information Security Management 1.36 1.39E09) IT Governance 1.21 1.50
IT Systems Analyst
CEPIS Survey of Professional e-Competence in Europe Page 42 of 59
7.3.3 Software Developer
Gender IT EducationEnterprise size
Age Industry sector Educational level
Spain
Software Developer
Base: 28 respondents
Professional status
85.7%
3.6%
10.7%
0.0%
Full time
employee
Part time
employee
Self-employed
Student/
Unemployed/
Retired
0.0%
7.1%
42.9% 46.4%
3.6%
None of the
above
Secondary
School
Diploma
University
Bachelors
Degree
University
Masters
Degree
Doctorate
(Phd.)
75.0%
17.9%
7.1%
IT was the
main focus of
my education
IT was a side
subject
IT was not
significant in my
curriculum
0.0%
15.4%
26.9%
15.4%
42.3%
1 - 10 11 - 50 51 - 250 251 - 1000 1000+
32.1%
67.9%
Mainly on IT
demand side
Mainly on IT
supply side
7.1%
32.1%
35.7%
25.0%
..-30 yr 31-40 yr 41-50 yr 51-.. yr
Mean: 43.5
14.3%
85.7%
FemaleMale
Spain Europe
Cases 28 231
Age
Mean 43.5 39.2
GenderFemale 14% 16%
Male 86% 84%
EducationSecondary & other 7% 22%University (Masters/Bachelors/Phd) 93% 78%
IT EducationalIT was the main focus of my education 75% 68%
IT was a side subject 18% 24%
IT was not significant in my curriculum 7% 8%
Current professional statusFull time employee 86% 89%
Part time employee 4% 2%
Self-employed 11% 6%
Student / Unemployed / Retired 0% 3%
Number of employees1 - 10 0% 7%
11 - 50 15% 11%
51 - 250 27% 23%
251 - 1000 15% 23%
1000+ 42% 36%
IndustryMy focus is mainly on IT demand side 32% 40%
My focus is mainly on IT supply side organizations 68% 60%
Proximity index 87.0 82.0
Software Developer

CEPIS Survey of Professional e-Competence in Europe Page 43 of 59
Spain Europe
Proximity index 87.0 82.0Min 54 40Max 100 100
Knowledge index
A- Plan 1.27 1.44A01) IS & Business Strategy Alignment 1.21 1.27A02) Service Level Management 1.07 1.20A03) Business Plan Development 0.82 1.21A04) Product or Project Planning 1.64 1.83A05) Architecture Design 1.43 1.57A06) Application Design 2.07 2.08A07) Technology Watching 1.36 1.52A08) Sustainable development 0.57 0.83
B- Build 1.93 1.93B01a) Design & Development (infrastructure & sw environment) 1.96 1.92B01b) Design & Development (data model & application logics) 2.46 2.39B01c) Design & Development (user interface) 2.54 2.47B02a) Systems Integration (configuration & performance control) 1.61 1.90B02b) Systems Integration (package selection & customization) 1.46 1.40B03) Testing 1.93 1.98B04) Solution Deployment 1.57 1.65B05) Documentation Production 1.89 1.73
C- Run 1.68 1.69C01) User Support 2.36 2.03C02) Change Support 1.89 1.70C03) Service Delivery 1.61 1.65C04a) Problem Management (process) 2.18 1.80C04b) Problem Management (network operation) 0.68 0.96C04c) Problem Management (computer system operation) 0.82 1.38C04d) Problem Management (database administration) 1.36 1.48C04e) Problem Management (application maintenance) 2.54 2.53
D- Enable 0.91 1.08D01) Information Security Strategy Development 0.86 1.06D02) ICT Quality Strategy Development 0.89 1.13D03) Education & Training Provision 1.18 1.26D04) Purchasing 0.86 1.09D05) Sales Proposal Development 0.93 1.04D06) Channel Management 0.50 0.68D07) Sales Management 0.57 0.71D08) Contract Management 0.50 0.83D09a) Personnel Development (competence analysis) 1.07 1.29D09b) Personnel Development (resource management) 1.18 1.43D10) Information & Knowledge Management 1.43 1.32
E- Manage 1.00 1.15E01) Forecast Development 0.54 0.97E02) Project & Portfolio Management 1.00 1.35E03) Risk Management 0.93 1.06E04) Relationship Management 1.36 1.31E05) Process Improvement 1.14 1.29E06) ICT Quality Management 1.29 1.14E07) Business Change Management 1.07 1.19E08) Information Security Management 0.96 1.02E09) IT Governance 0.68 1.00
Software Developer

CEPIS Survey of Professional e-Competence in Europe Page 44 of 59
7.3.4 Integration & Testing Engineer
Gender IT EducationEnterprise size
Age Industry sector Educational level
Spain
Integration & Testing Engineer
Base: 16 respondents
Professional status
81.3%
0.0%
0.0%
18.8%
Full time
employee
Part time
employee
Self-employed
Student/
Unemployed/
Retired
6.3%
18.8%
31.3%
43.8%
0.0%
None of the
above
Secondary
School
Diploma
University
Bachelors
Degree
University
Masters
Degree
Doctorate
(Phd.)
62.5%
25.0%
12.5%
IT was the
main focus of
my education
IT was a side
subject
IT was not
significant in my
curriculum
0.0%
21.4%
14.3% 14.3%
50.0%
1 - 10 11 - 50 51 - 250 251 - 1000 1000+
50.0%
50.0%
Mainly on IT
demand side
Mainly on IT
supply side6.3%
18.8%
50.0%
25.0%
..-30 yr 31-40 yr 41-50 yr 51-.. yr
Mean: 46.2
12.5%
87.5%
FemaleMale
Spain Europe
Cases 16 126
Age
Mean 46.2 38.2
GenderFemale 13% 20%
Male 88% 80%
EducationSecondary & other 25% 20%University (Masters/Bachelors/Phd) 75% 80%
IT EducationalIT was the main focus of my education 63% 77%
IT was a side subject 25% 19%
IT was not significant in my curriculum 13% 4%
Current professional statusFull time employee 81% 91%
Part time employee 0% 2%
Self-employed 0% 5%
Student / Unemployed / Retired 19% 3%
Number of employees1 - 10 0% 9%
11 - 50 21% 14%
51 - 250 14% 29%
251 - 1000 14% 18%
1000+ 50% 30%
IndustryMy focus is mainly on IT demand side 50% 57%
My focus is mainly on IT supply side organizations 50% 43%
Proximity index 90.0 86.7
Integration & Testing Engineer

CEPIS Survey of Professional e-Competence in Europe Page 45 of 59
Spain Europe
Proximity index 90.0 86.7Min 54 41Max 100 100
Knowledge index
A- Plan 1.17 1.31A01) IS & Business Strategy Alignment 0.81 1.02A02) Service Level Management 0.81 0.98A03) Business Plan Development 0.56 1.01A04) Product or Project Planning 1.19 1.57A05) Architecture Design 1.69 1.58A06) Application Design 2.06 1.82A07) Technology Watching 1.63 1.63A08) Sustainable development 0.63 0.88
B- Build 2.31 2.25B01a) Design & Development (infrastructure & sw environment) 2.00 2.01B01b) Design & Development (data model & application logics) 2.31 2.18B01c) Design & Development (user interface) 2.38 2.17B02a) Systems Integration (configuration & performance control) 2.56 2.57B02b) Systems Integration (package selection & customization) 2.19 2.16B03) Testing 2.38 2.52B04) Solution Deployment 2.44 2.26B05) Documentation Production 2.25 2.08
C- Run 1.59 1.69C01) User Support 2.31 2.14C02) Change Support 1.69 1.79C03) Service Delivery 1.50 1.75C04a) Problem Management (process) 1.88 1.87C04b) Problem Management (network operation) 1.06 1.21C04c) Problem Management (computer system operation) 1.38 1.55C04d) Problem Management (database administration) 0.94 1.47C04e) Problem Management (application maintenance) 1.94 1.78
D- Enable 0.72 0.95D01) Information Security Strategy Development 1.00 1.12D02) ICT Quality Strategy Development 1.13 1.13D03) Education & Training Provision 0.88 1.25D04) Purchasing 0.88 0.93D05) Sales Proposal Development 0.63 0.86D06) Channel Management 0.38 0.52D07) Sales Management 0.31 0.54D08) Contract Management 0.44 0.67D09a) Personnel Development (competence analysis) 0.69 1.11D09b) Personnel Development (resource management) 0.75 1.21D10) Information & Knowledge Management 0.88 1.13
E- Manage 0.76 0.98E01) Forecast Development 0.44 0.82E02) Project & Portfolio Management 0.81 1.09E03) Risk Management 0.75 0.91E04) Relationship Management 0.88 1.11E05) Process Improvement 0.75 1.13E06) ICT Quality Management 0.75 1.02E07) Business Change Management 0.69 0.90E08) Information Security Management 0.94 0.95E09) IT Governance 0.81 0.90
Integration & Testing Engineer

CEPIS Survey of Professional e-Competence in Europe Page 46 of 59
7.3.5 IT Administrator
Gender IT EducationEnterprise size
Age Industry sector Educational level
Spain
IT Administrator
Base: 15 respondents
Professional status
60.0%
0.0%
20.0%
20.0%
Full time
employee
Part time
employee
Self-employed
Student/
Unemployed/
Retired
13.3%
20.0%
46.7%
20.0%
0.0%
None of the
above
Secondary
School
Diploma
University
Bachelors
Degree
University
Masters
Degree
Doctorate
(Phd.)
86.7%
13.3%
0.0%
IT was the
main focus of
my education
IT was a side
subject
IT was not
significant in my
curriculum
30.8%
7.7%
15.4% 15.4%
30.8%
1 - 10 11 - 50 51 - 250 251 - 1000 1000+
66.7%
33.3%
Mainly on IT
demand side
Mainly on IT
supply side
13.3%
40.0%
26.7%
20.0%
..-30 yr 31-40 yr 41-50 yr 51-.. yr
Mean: 41.3
20.0%
80.0%
FemaleMale
Spain Europe
Cases 15 165
Age
Mean 41.3 38.3
GenderFemale 20% 7%
Male 80% 93%
EducationSecondary & other 33% 36%University (Masters/Bachelors/Phd) 67% 64%
IT EducationalIT was the main focus of my education 87% 69%
IT was a side subject 13% 21%
IT was not significant in my curriculum 0% 10%
Current professional statusFull time employee 60% 85%
Part time employee 0% 3%
Self-employed 20% 5%
Student / Unemployed / Retired 20% 7%
Number of employees1 - 10 31% 12%
11 - 50 8% 10%
51 - 250 15% 25%
251 - 1000 15% 28%
1000+ 31% 26%
IndustryMy focus is mainly on IT demand side 67% 65%
My focus is mainly on IT supply side organizations 33% 35%
Proximity index 94.0 89.0
IT Administrator

CEPIS Survey of Professional e-Competence in Europe Page 47 of 59
Spain Europe
Proximity index 94.0 89.0Min 58 40Max 100 100
Knowledge index
A- Plan 1.66 1.62A01) IS & Business Strategy Alignment 1.47 1.50A02) Service Level Management 1.53 1.66A03) Business Plan Development 1.20 1.39A04) Product or Project Planning 1.53 1.68A05) Architecture Design 1.93 1.64A06) Application Design 1.73 1.45A07) Technology Watching 2.40 2.11A08) Sustainable development 1.47 1.53
B- Build 1.78 1.61B01a) Design & Development (infrastructure & sw environment) 1.93 1.67B01b) Design & Development (data model & application logics) 1.73 1.39B01c) Design & Development (user interface) 1.47 1.55B02a) Systems Integration (configuration & performance control) 2.07 1.79B02b) Systems Integration (package selection & customization) 1.73 1.52B03) Testing 1.53 1.55B04) Solution Deployment 2.00 1.90B05) Documentation Production 1.80 1.51
C- Run 2.54 2.31C01) User Support 2.93 2.70C02) Change Support 2.47 2.14C03) Service Delivery 2.60 2.32C04a) Problem Management (process) 2.80 2.15C04b) Problem Management (network operation) 2.80 2.72C04c) Problem Management (computer system operation) 3.00 2.81C04d) Problem Management (database administration) 1.73 1.64C04e) Problem Management (application maintenance) 2.00 1.98
D- Enable 1.44 1.45D01) Information Security Strategy Development 1.93 1.61D02) ICT Quality Strategy Development 1.67 1.53D03) Education & Training Provision 1.60 1.55D04) Purchasing 1.60 1.58D05) Sales Proposal Development 1.53 1.35D06) Channel Management 1.00 1.17D07) Sales Management 1.00 1.13D08) Contract Management 1.07 1.33D09a) Personnel Development (competence analysis) 1.33 1.50D09b) Personnel Development (resource management) 1.47 1.78D10) Information & Knowledge Management 1.67 1.43
E- Manage 1.38 1.41E01) Forecast Development 1.13 1.30E02) Project & Portfolio Management 1.33 1.38E03) Risk Management 1.20 1.31E04) Relationship Management 1.33 1.46E05) Process Improvement 1.53 1.44E06) ICT Quality Management 1.47 1.44E07) Business Change Management 1.33 1.37E08) Information Security Management 1.80 1.53E09) IT Governance 1.27 1.44
IT Administrator

CEPIS Survey of Professional e-Competence in Europe Page 48 of 59
7.3.6 IT Systems Engineer
Gender IT EducationEnterprise size
Age Industry sector Educational level
Spain
IT Systems Engineer
Base: 10 respondents
Professional status
100.0%
0.0%
0.0%
0.0%
Full time
employee
Part time
employee
Self-employed
Student/
Unemployed/
Retired
0.0%
20.0%
40.0% 40.0%
0.0%
None of the
above
Secondary
School
Diploma
University
Bachelors
Degree
University
Masters
Degree
Doctorate
(Phd.)
60.0%
40.0%
0.0%
IT was the
main focus of
my education
IT was a side
subject
IT was not
significant in my
curriculum
10.0%
0.0%
20.0%
40.0%
30.0%
1 - 10 11 - 50 51 - 250 251 - 1000 1000+
30.0%
70.0%
Mainly on IT
demand side
Mainly on IT
supply side
10.0%
50.0%
20.0% 20.0%
..-30 yr 31-40 yr 41-50 yr 51-.. yr
Mean: 40.7
0.0%
100.0%
FemaleMale
Spain Europe
Cases 10 96
Age
Mean 40.7 38.6
GenderFemale 0% 5%
Male 100% 95%
EducationSecondary & other 20% 37%University (Masters/Bachelors/Phd) 80% 63%
IT EducationalIT was the main focus of my education 60% 58%
IT was a side subject 40% 29%
IT was not significant in my curriculum 0% 13%
Current professional statusFull time employee 100% 93%
Part time employee 0% 0%
Self-employed 0% 2%
Student / Unemployed / Retired 0% 5%
Number of employees1 - 10 10% 9%
11 - 50 0% 21%
51 - 250 20% 18%
251 - 1000 40% 32%
1000+ 30% 20%
IndustryMy focus is mainly on IT demand side 30% 54%
My focus is mainly on IT supply side organizations 70% 46%
Proximity index 89.1 83.1
IT Systems Engineer

CEPIS Survey of Professional e-Competence in Europe Page 49 of 59
Spain Europe
Proximity index 89.1 83.1Min 58 41Max 100 100
Knowledge index
A- Plan 1.38 1.56A01) IS & Business Strategy Alignment 1.10 1.54A02) Service Level Management 1.30 1.75A03) Business Plan Development 0.80 1.13A04) Product or Project Planning 1.50 1.58A05) Architecture Design 1.80 1.68A06) Application Design 1.60 1.52A07) Technology Watching 1.80 1.97A08) Sustainable development 1.10 1.33
B- Build 1.89 1.69B01a) Design & Development (infrastructure & sw environment) 1.30 1.86B01b) Design & Development (data model & application logics) 1.40 1.44B01c) Design & Development (user interface) 1.60 1.59B02a) Systems Integration (configuration & performance control) 2.60 2.21B02b) Systems Integration (package selection & customization) 2.10 1.68B03) Testing 2.00 1.57B04) Solution Deployment 2.00 1.54B05) Documentation Production 2.10 1.61
C- Run 2.25 2.17C01) User Support 2.70 2.57C02) Change Support 2.30 2.38C03) Service Delivery 2.30 2.07C04a) Problem Management (process) 2.50 2.08C04b) Problem Management (network operation) 2.00 2.04C04c) Problem Management (computer system operation) 2.70 2.73C04d) Problem Management (database administration) 1.70 1.56C04e) Problem Management (application maintenance) 1.80 1.91
D- Enable 1.26 1.34D01) Information Security Strategy Development 1.90 1.61D02) ICT Quality Strategy Development 1.40 1.47D03) Education & Training Provision 1.80 1.52D04) Purchasing 1.40 1.63D05) Sales Proposal Development 1.00 1.14D06) Channel Management 0.60 0.90D07) Sales Management 0.60 0.82D08) Contract Management 0.90 1.10D09a) Personnel Development (competence analysis) 1.60 1.54D09b) Personnel Development (resource management) 1.00 1.66D10) Information & Knowledge Management 1.70 1.33
E- Manage 1.21 1.41E01) Forecast Development 0.80 1.10E02) Project & Portfolio Management 0.80 1.48E03) Risk Management 0.90 1.30E04) Relationship Management 1.10 1.40E05) Process Improvement 1.30 1.46E06) ICT Quality Management 1.40 1.41E07) Business Change Management 1.30 1.35E08) Information Security Management 1.80 1.57E09) IT Governance 1.50 1.59
IT Systems Engineer

CEPIS Survey of Professional e-Competence in Europe Page 50 of 59
7.3.7 Service Support Manager
Gender IT EducationEnterprise size
Age Industry sector Educational level
Spain
Service Support Manager
Base: 19 respondents
Professional status
84.2%
0.0%
10.5%
5.3%
Full time
employee
Part time
employee
Self-employed
Student/
Unemployed/
Retired
0.0%
21.1%
42.1%
31.6%
5.3%
None of the
above
Secondary
School
Diploma
University
Bachelors
Degree
University
Masters
Degree
Doctorate
(Phd.)
73.7%
26.3%
0.0%
IT was the
main focus of
my education
IT was a side
subject
IT was not
significant in my
curriculum
11.1% 11.1% 11.1%
33.3% 33.3%
1 - 10 11 - 50 51 - 250 251 - 1000 1000+
36.8%
63.2%
Mainly on IT
demand side
Mainly on IT
supply side
15.8%
21.1%
42.1%
21.1%
..-30 yr 31-40 yr 41-50 yr 51-.. yr
Mean: 42.6
5.3%
94.7%
FemaleMale
Spain Europe
Cases 19 163
Age
Mean 42.6 40.3
GenderFemale 5% 17%
Male 95% 83%
EducationSecondary & other 21% 19%University (Masters/Bachelors/Phd) 79% 81%
IT EducationalIT was the main focus of my education 74% 60%
IT was a side subject 26% 22%
IT was not significant in my curriculum 0% 18%
Current professional statusFull time employee 84% 85%
Part time employee 0% 3%
Self-employed 11% 8%
Student / Unemployed / Retired 5% 4%
Number of employees1 - 10 11% 7%
11 - 50 11% 7%
51 - 250 11% 30%
251 - 1000 33% 19%
1000+ 33% 37%
IndustryMy focus is mainly on IT demand side 37% 54%
My focus is mainly on IT supply side organizations 63% 46%
Proximity index 83.7 81.9
Service Support Manager
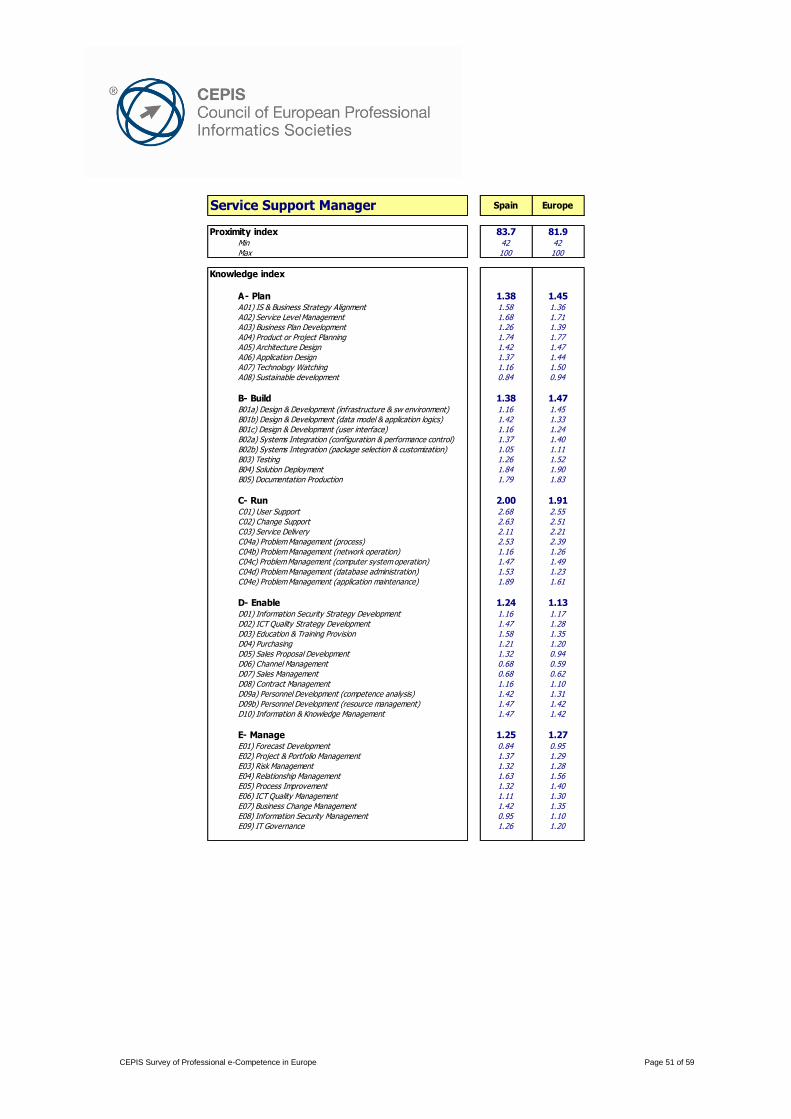
CEPIS Survey of Professional e-Competence in Europe Page 51 of 59
Spain Europe
Proximity index 83.7 81.9Min 42 42Max 100 100
Knowledge index
A- Plan 1.38 1.45A01) IS & Business Strategy Alignment 1.58 1.36A02) Service Level Management 1.68 1.71A03) Business Plan Development 1.26 1.39A04) Product or Project Planning 1.74 1.77A05) Architecture Design 1.42 1.47A06) Application Design 1.37 1.44A07) Technology Watching 1.16 1.50A08) Sustainable development 0.84 0.94
B- Build 1.38 1.47B01a) Design & Development (infrastructure & sw environment) 1.16 1.45B01b) Design & Development (data model & application logics) 1.42 1.33B01c) Design & Development (user interface) 1.16 1.24B02a) Systems Integration (configuration & performance control) 1.37 1.40B02b) Systems Integration (package selection & customization) 1.05 1.11B03) Testing 1.26 1.52B04) Solution Deployment 1.84 1.90B05) Documentation Production 1.79 1.83
C- Run 2.00 1.91C01) User Support 2.68 2.55C02) Change Support 2.63 2.51C03) Service Delivery 2.11 2.21C04a) Problem Management (process) 2.53 2.39C04b) Problem Management (network operation) 1.16 1.26C04c) Problem Management (computer system operation) 1.47 1.49C04d) Problem Management (database administration) 1.53 1.23C04e) Problem Management (application maintenance) 1.89 1.61
D- Enable 1.24 1.13D01) Information Security Strategy Development 1.16 1.17D02) ICT Quality Strategy Development 1.47 1.28D03) Education & Training Provision 1.58 1.35D04) Purchasing 1.21 1.20D05) Sales Proposal Development 1.32 0.94D06) Channel Management 0.68 0.59D07) Sales Management 0.68 0.62D08) Contract Management 1.16 1.10D09a) Personnel Development (competence analysis) 1.42 1.31D09b) Personnel Development (resource management) 1.47 1.42D10) Information & Knowledge Management 1.47 1.42
E- Manage 1.25 1.27E01) Forecast Development 0.84 0.95E02) Project & Portfolio Management 1.37 1.29E03) Risk Management 1.32 1.28E04) Relationship Management 1.63 1.56E05) Process Improvement 1.32 1.40E06) ICT Quality Management 1.11 1.30E07) Business Change Management 1.42 1.35E08) Information Security Management 0.95 1.10E09) IT Governance 1.26 1.20
Service Support Manager

CEPIS Survey of Professional e-Competence in Europe Page 52 of 59
7.3.8 IT Trainer
Gender IT EducationEnterprise size
Age Industry sector Educational level
Spain
IT Trainer
Base: 10 respondents
Professional status
90.0%
0.0%
10.0%
0.0%
Full time
employee
Part time
employee
Self-employed
Student/
Unemployed/
Retired
0.0%
10.0%
40.0% 40.0%
10.0%
None of the
above
Secondary
School
Diploma
University
Bachelors
Degree
University
Masters
Degree
Doctorate
(Phd.)
70.0%
10.0%
20.0%
IT was the
main focus of
my education
IT was a side
subject
IT was not
significant in my
curriculum
11.1% 11.1% 11.1%
33.3% 33.3%
1 - 10 11 - 50 51 - 250 251 - 1000 1000+
30.0%
70.0%
Mainly on IT
demand side
Mainly on IT
supply side
10.0%
40.0%
30.0%
20.0%
..-30 yr 31-40 yr 41-50 yr 51-.. yr
Mean: 41.7
30.0%
70.0%
FemaleMale
Spain Europe
Cases 10 157
Age
Mean 41.7 41.1
GenderFemale 30% 41%
Male 70% 59%
EducationSecondary & other 10% 15%University (Masters/Bachelors/Phd) 90% 85%
IT EducationalIT was the main focus of my education 70% 57%
IT was a side subject 10% 30%
IT was not significant in my curriculum 20% 13%
Current professional statusFull time employee 90% 87%
Part time employee 0% 1%
Self-employed 10% 7%
Student / Unemployed / Retired 0% 5%
Number of employees1 - 10 11% 11%
11 - 50 11% 13%
51 - 250 11% 21%
251 - 1000 33% 25%
1000+ 33% 29%
IndustryMy focus is mainly on IT demand side 30% 49%
My focus is mainly on IT supply side organizations 70% 51%
Proximity index 81.2 72.9
IT Trainer

CEPIS Survey of Professional e-Competence in Europe Page 53 of 59
Spain Europe
Proximity index 81.2 72.9Min 45 40Max 97 100
Knowledge index
A- Plan 1.60 1.36A01) IS & Business Strategy Alignment 1.70 1.44A02) Service Level Management 2.00 1.31A03) Business Plan Development 1.50 1.44A04) Product or Project Planning 2.30 1.83A05) Architecture Design 1.10 1.17A06) Application Design 1.80 1.39A07) Technology Watching 1.50 1.35A08) Sustainable development 0.90 0.96
B- Build 1.40 1.30B01a) Design & Development (infrastructure & sw environment) 1.30 1.04B01b) Design & Development (data model & application logics) 1.30 1.17B01c) Design & Development (user interface) 1.00 1.18B02a) Systems Integration (configuration & performance control) 1.20 0.99B02b) Systems Integration (package selection & customization) 1.00 0.91B03) Testing 1.90 1.57B04) Solution Deployment 1.00 1.18B05) Documentation Production 2.50 2.34
C- Run 1.36 1.20C01) User Support 2.10 1.81C02) Change Support 1.70 1.32C03) Service Delivery 1.80 1.31C04a) Problem Management (process) 2.00 1.46C04b) Problem Management (network operation) 0.90 0.83C04c) Problem Management (computer system operation) 0.60 0.89C04d) Problem Management (database administration) 0.60 0.85C04e) Problem Management (application maintenance) 1.20 1.11
D- Enable 1.71 1.35D01) Information Security Strategy Development 1.70 1.16D02) ICT Quality Strategy Development 2.40 1.36D03) Education & Training Provision 1.90 1.97D04) Purchasing 1.30 1.25D05) Sales Proposal Development 1.50 1.22D06) Channel Management 1.00 0.82D07) Sales Management 1.40 0.96D08) Contract Management 1.50 1.14D09a) Personnel Development (competence analysis) 2.00 1.73D09b) Personnel Development (resource management) 2.10 1.62D10) Information & Knowledge Management 2.00 1.66
E- Manage 1.83 1.46E01) Forecast Development 1.30 1.12E02) Project & Portfolio Management 1.80 1.46E03) Risk Management 1.70 1.39E04) Relationship Management 2.00 1.68E05) Process Improvement 2.00 1.68E06) ICT Quality Management 2.50 1.62E07) Business Change Management 1.90 1.62E08) Information Security Management 1.50 1.14E09) IT Governance 1.80 1.46
IT Trainer

CEPIS Survey of Professional e-Competence in Europe Page 54 of 59
7.4 Profile Segmentation
7.4.1 Profile Distribution by Age
9%
7%
7%
6%
13%
10%
16%
10%
66%
67%
71%
68%
69%
67%
70%
63%
70%
25%
33%
21%
25%
25%
20%
20%
21%
20%
Spain (average)
IT Manager P01
IT Quality Manager & Auditor P02
IT Client Manager P03
IT Sales & Mktg Consultant P04
IT Applications Consultant P05
Business Analyst P06
IT Project Manager P07
IT Systems Analyst P08
Software Developer P09
Integr. & Testing Engineer P10
IT Systems Architect P11
IT Security Manager P12
Database Administrator P13
Network Manager P14
IT Administrator P15
IT Systems Engineer P16
Service Support Manager P17
IT Trainer P18
<30yr 31..50 >50yr
Total Total
P01 IT Manager 7% 8%
P02 IT Quality Manager & Auditor 3% 4%
P03 IT Client Manager 5% 3%
P04 IT Sales & Mktg Consultant 2% 3%
P05 IT Applications Consultant 1% 2%
P06 Business Analyst 3% 2%
P07 IT Project Manager 3% 8%
P08 IT Systems Analyst 8% 7%
P09 Software Developer 16% 12%
P10 Integration & Testing Engineer 9% 7%
P11 IT Systems Architect 3% 4%
P12 IT Security Manager 5% 3%
P13 Database Administrator 3% 4%
P14 Network Manager 3% 3%
P15 IT Administrator 8% 9%
P16 IT Systems Engineer 6% 5%
P17 Service Support Manager 11% 9%
P18 IT Trainer 6% 8%
Total cases 177 1913
8%
16 45 322 1232
8% 8%4%
116 359
7% 5% 3%
10% 8% 9%
4%
9%
2% 4% 3%
11% 9% 5%
4% 3%
1% 4% 3%
2%
6% 4%
8% 4% 4%
11%
7% 8%
13% 13% 8%
6%
2% 3%
4% 9% 9%
1%
3% 1%
1% 2% 3%
2%
3% 6%
2% 3% 2%
5%
31-50 yr 51-.. yr
3% 6% 18%
..-30 yr
7%
4%
7%
7%
7%
16%
9%
4%
0%
2%
2%
4%
51-.. yr
9%
2%
2%
9%
6%
10%
6%
2%
5%
1%
2%
3%
9%
16%
9%
6%
19%
6%
31-50 yr
7%
3%
5%
3%
1%
3%
0%
13%
0%
13%
6%
13%
6%
6%
by Age ..-30 yr
0%
0%
6%
0%
0%
6%
0%
EuropeSpain
(Note: the profiles to be analysed are those satisfying the condition of having 10 respondents or more.)
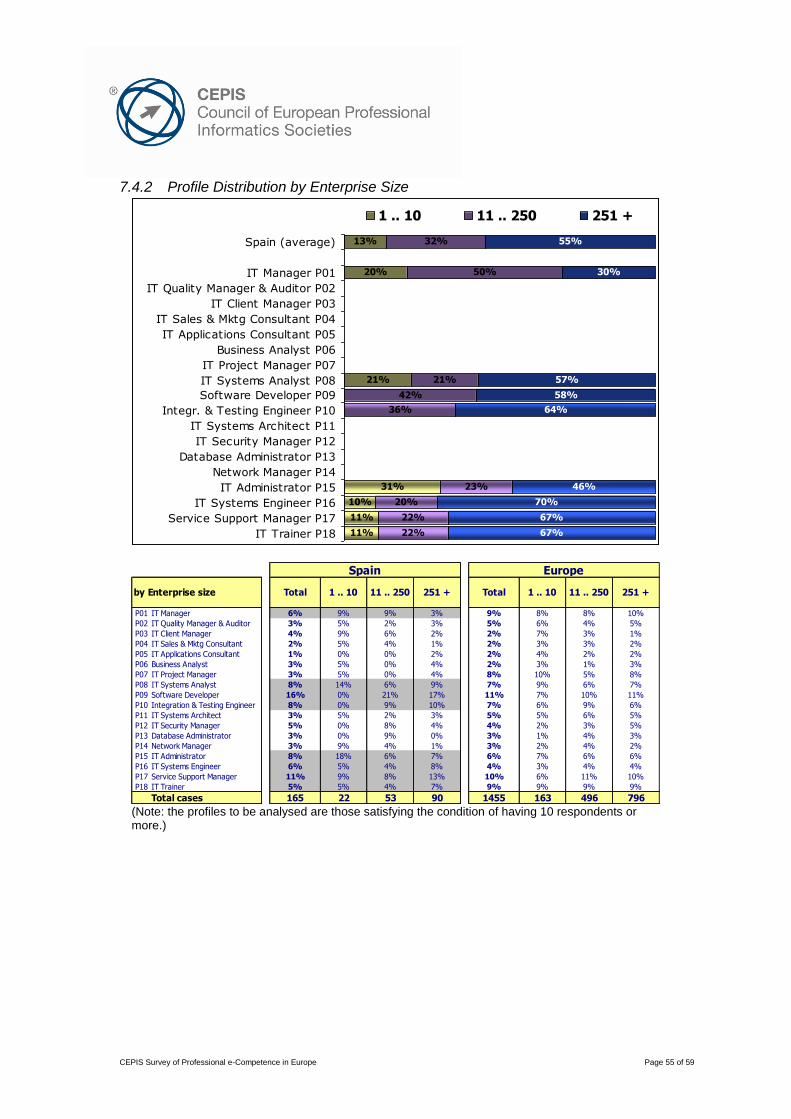
CEPIS Survey of Professional e-Competence in Europe Page 55 of 59
7.4.2 Profile Distribution by Enterprise Size
13%
20%
21%
31%
10%
11%
11%
32%
50%
21%
42%
36%
23%
20%
22%
22%
55%
30%
57%
58%
64%
46%
70%
67%
67%
Spain (average)
IT Manager P01
IT Quality Manager & Auditor P02
IT Client Manager P03
IT Sales & Mktg Consultant P04
IT Applications Consultant P05
Business Analyst P06
IT Project Manager P07
IT Systems Analyst P08
Software Developer P09
Integr. & Testing Engineer P10
IT Systems Architect P11
IT Security Manager P12
Database Administrator P13
Network Manager P14
IT Administrator P15
IT Systems Engineer P16
Service Support Manager P17
IT Trainer P18
1 .. 10 11 .. 250 251 +
Total Total
P01 IT Manager 6% 9%
P02 IT Quality Manager & Auditor 3% 5%
P03 IT Client Manager 4% 2%
P04 IT Sales & Mktg Consultant 2% 2%
P05 IT Applications Consultant 1% 2%
P06 Business Analyst 3% 2%
P07 IT Project Manager 3% 8%
P08 IT Systems Analyst 8% 7%
P09 Software Developer 16% 11%
P10 Integration & Testing Engineer 8% 7%
P11 IT Systems Architect 3% 5%
P12 IT Security Manager 5% 4%
P13 Database Administrator 3% 3%
P14 Network Manager 3% 3%
P15 IT Administrator 8% 6%
P16 IT Systems Engineer 6% 4%
P17 Service Support Manager 11% 10%
P18 IT Trainer 5% 9%
Total cases 165 1455
10%9% 9% 3% 8%
Spain Europe
251 +
7% 7%
11%
4%
163
1 .. 10 11 .. 250
8%
496
2%
6%
4%
5%
10%
796
5% 4% 7% 9% 9% 9%
22 53 90
9% 8% 13% 6%
5% 4% 8% 3%
10%
4% 4%
6% 6%
2%
18% 6%
0% 9% 0% 1%
9% 4% 1%
5% 2% 3% 5%
0% 8% 4% 2%
3%
3% 5%
9% 6%
5%
0% 9% 10% 6%
0% 21% 17% 7%
5% 0% 4% 10%
14% 6% 9% 9%
11%
6% 7%
1% 3%
8%
5% 0% 4% 3%
0% 0% 2% 4%
3% 1%
5% 4% 1% 3%
2% 2%
3% 2%
4% 5%
9% 6%
5% 2% 3% 6%
2% 7%
by Enterprise size 1 .. 10 11 .. 250 251 +
(Note: the profiles to be analysed are those satisfying the condition of having 10 respondents or more.)

CEPIS Survey of Professional e-Competence in Europe Page 56 of 59
7.4.3 Profile Distribution by Gender
11%
17%
7%
14%
13%
20%
5%
30%
89%
83%
93%
86%
88%
80%
100%
95%
70%
Spain (average)
IT Manager P01
IT Quality Manager & Auditor P02
IT Client Manager P03
IT Sales & Mktg Consultant P04
IT Applications Consultant P05
Business Analyst P06
IT Project Manager P07
IT Systems Analyst P08
Software Developer P09
Integr. & Testing Engineer P10
IT Systems Architect P11
IT Security Manager P12
Database Administrator P13
Network Manager P14
IT Administrator P15
IT Systems Engineer P16
Service Support Manager P17
IT Trainer P18
Female Male
Total Total
P01 IT Manager 7% 8%
P02 IT Quality Manager & Auditor 3% 4%
P03 IT Client Manager 5% 3%
P04 IT Sales & Mktg Consultant 2% 3%
P05 IT Applications Consultant 1% 2%
P06 Business Analyst 3% 2%
P07 IT Project Manager 3% 8%
P08 IT Systems Analyst 8% 7%
P09 Software Developer 16% 12%
P10 Integration & Testing Engineer 9% 7%
P11 IT Systems Architect 3% 4%
P12 IT Security Manager 5% 3%
P13 Database Administrator 3% 4%
P14 Network Manager 3% 3%
P15 IT Administrator 8% 9%
P16 IT Systems Engineer 6% 5%
P17 Service Support Manager 11% 8%
P18 IT Trainer 6% 8%
Total cases 177 1918
Maleby Gender Female Male Female
0% 3% 8%
0%
11% 6% 9% 8%
3%
5% 4% 2% 3%
3% 1% 3%
0% 1% 1% 2%
0% 3% 2% 2%
5% 3% 8% 8%
5% 8% 6% 7%
21% 15% 12% 12%
11% 9% 8% 6%
0% 3% 4% 5%
0% 6% 2% 3%
5% 3% 1% 4%
0% 3% 1% 4%
16% 8% 4% 10%
19 158 314 1604
16% 4% 21% 6%
Spain Europe
5% 11% 9% 8%
2% 6%0% 6%
(Note: the profiles to be analysed are those satisfying the condition of having 10 respondents or more.)

CEPIS Survey of Professional e-Competence in Europe Page 57 of 59
7.4.4 Profile Distribution by Educational Level
82%
100%
93%
93%
75%
67%
80%
79%
90%
18%
7%
7%
25%
33%
20%
21%
10%
Spain (average)
IT Manager P01
IT Quality Manager & Auditor P02
IT Client Manager P03
IT Sales & Mktg Consultant P04
IT Applications Consultant P05
Business Analyst P06
IT Project Manager P07
IT Systems Analyst P08
Software Developer P09
Integr. & Testing Engineer P10
IT Systems Architect P11
IT Security Manager P12
Database Administrator P13
Network Manager P14
IT Administrator P15
IT Systems Engineer P16
Service Support Manager P17
IT Trainer P18
University degree Diploma or less
Total Total
P01 IT Manager 7% 8%
P02 IT Quality Manager & Auditor 3% 4%
P03 IT Client Manager 5% 3%
P04 IT Sales & Mktg Consultant 2% 3%
P05 IT Applications Consultant 1% 2%
P06 Business Analyst 3% 2%
P07 IT Project Manager 3% 8%
P08 IT Systems Analyst 8% 7%
P09 Software Developer 16% 12%
P10 Integration & Testing Engineer 9% 7%
P11 IT Systems Architect 3% 4%
P12 IT Security Manager 5% 3%
P13 Database Administrator 3% 3%
P14 Network Manager 3% 3%
P15 IT Administrator 8% 8%
P16 IT Systems Engineer 6% 5%
P17 Service Support Manager 11% 9%
P18 IT Trainer 6% 8%
Total cases 177 1907
Universityby Education LevelSecondary &
other
Secondary &
otherUniversity
0%
3%
8%
3%
3% 9%
3% 4%
6%
3%
3%
0%
0%
3%
6%
13%
6%
6%
3%
6%
16%
6%
13%
3%
4%
2%
1%
3%
3%
9%
18%
8%
2%
5%
3%
2%
7%
5%
10%
6%
6% 2%
3% 3%
3% 2%
1% 3%
5% 9%
6% 7%
13% 12%
6% 7%
4% 4%
2% 4%
4% 3%
5% 3%
15% 7%
9% 4%
8% 9%
6% 9%
Spain Europe
31 146 395 1512 (Note: the profiles to be analysed are those satisfying the condition of having 10 respondents or more.)

CEPIS Survey of Professional e-Competence in Europe Page 58 of 59
7.4.5 Profile Distribution by IT Education
72%
42%
86%
75%
63%
87%
60%
74%
70%
28%
58%
14%
25%
38%
13%
40%
26%
30%
Spain (average)
IT Manager P01
IT Quality Manager & Auditor P02
IT Client Manager P03
IT Sales & Mktg Consultant P04
IT Applications Consultant P05
Business Analyst P06
IT Project Manager P07
IT Systems Analyst P08
Software Developer P09
Integr. & Testing Engineer P10
IT Systems Architect P11
IT Security Manager P12
Database Administrator P13
Network Manager P14
IT Administrator P15
IT Systems Engineer P16
Service Support Manager P17
IT Trainer P18
Main focus Secondary subjet
Total Total
P01 IT Manager 7% 8%
P02 IT Quality Manager & Auditor 3% 4%
P03 IT Client Manager 5% 3%
P04 IT Sales & Mktg Consultant 2% 3%
P05 IT Applications Consultant 1% 2%
P06 Business Analyst 3% 2%
P07 IT Project Manager 3% 8%
P08 IT Systems Analyst 8% 7%
P09 Software Developer 16% 12%
P10 Integration & Testing Engineer 9% 7%
P11 IT Systems Architect 3% 4%
P12 IT Security Manager 5% 3%
P13 Database Administrator 3% 3%
P14 Network Manager 3% 3%
P15 IT Administrator 8% 8%
P16 IT Systems Engineer 6% 5%
P17 Service Support Manager 11% 9%
P18 IT Trainer 6% 8%
Total cases 177 1907
by IT Education Main focusSide/Not
significantMain focus
Side/Not
significant4% 14% 6% 11%
2% 4% 4% 5%
4% 6% 2% 3%
3% 0% 3% 3%
2% 0% 2% 2%
3% 2% 2% 3%
2% 4% 8% 8%
9% 4% 8% 5%
17% 14% 13% 10%
8% 12% 8% 4%
3% 2% 5% 3%
6% 4% 3% 3%
2% 4% 4% 3%
3% 2% 3% 5%
10% 4% 9% 7%
5% 8% 4% 6%
7% 9%
11% 10% 8% 9%
6% 6%
127 50 1201 706
Spain Europe
(Note: the profiles to be analysed are those satisfying the condition of having 10 respondents or more.)

CEPIS Survey of Professional e-Competence in Europe Page 59 of 59
7.4.6 Profile Distribution by IT Industry
42%
8%
36%
32%
50%
67%
30%
37%
30%
58%
92%
64%
68%
50%
33%
70%
63%
70%
Spain (average)
IT Manager P01
IT Quality Manager & Auditor P02
IT Client Manager P03
IT Sales & Mktg Consultant P04
IT Applications Consultant P05
Business Analyst P06
IT Project Manager P07
IT Systems Analyst P08
Software Developer P09
Integr. & Testing Engineer P10
IT Systems Architect P11
IT Security Manager P12
Database Administrator P13
Network Manager P14
IT Administrator P15
IT Systems Engineer P16
Service Support Manager P17
IT Trainer P18
IT Demand side IT Supply side
Total Total
P01 IT Manager 7% 9%
P02 IT Quality Manager & Auditor 3% 5%
P03 IT Client Manager 5% 3%
P04 IT Sales & Mktg Consultant 2% 3%
P05 IT Applications Consultant 1% 2%
P06 Business Analyst 3% 3%
P07 IT Project Manager 3% 8%
P08 IT Systems Analyst 8% 7%
P09 Software Developer 16% 11%
P10 Integration & Testing Engineer 9% 7%
P11 IT Systems Architect 3% 5%
P12 IT Security Manager 5% 4%
P13 Database Administrator 3% 3%
P14 Network Manager 3% 3%
P15 IT Administrator 8% 7%
P16 IT Systems Engineer 6% 4%
P17 Service Support Manager 11% 10%
P18 IT Trainer 6% 9%
Total cases 177 1637
by IT Industry Demand side Supply side Demand side Supply side
1% 11% 9% 9%
5% 1% 5% 5%
5% 4% 3% 3%
5% 0% 3% 3%
3% 0% 2% 2%
1% 4% 3% 2%
3% 3% 8% 8%
7% 9% 6% 8%
12% 19% 8% 13%
11% 8% 8% 6%
3% 3% 5% 5%
7% 4% 4% 3%
3% 3% 3% 4%
4% 2% 3% 3%
13% 5% 9% 5%
4% 7% 4% 3%
9% 12% 10% 9%
4% 7% 9% 9%
75 102 829 808
Spain Europe
(Note: the profiles to be analysed are those satisfying the condition of having 10 respondents or more.)

![EUGENIO SCHININÀ, GIUSEPPE ZERBI THE ALL-ROUND IT … · The EUCIP Core Syllabus at [] specifies the content of the EUCIP ... the paths, and covers the three fundamental processes:](https://img.pdfslide.us/doc/110x75/5fd45d783158732c757105f6/eugenio-schinin-giuseppe-zerbi-the-all-round-it-the-eucip-core-syllabus-at-.jpg)