Embed Size (px)
Citation preview
ISSN 2042-2695
CEP Discussion Paper No 1428
May 2016
The Elusive Employment Effect of the Minimum Wage
Alan Manning
Abstract There is a huge body of empirical research on the employment effect of the minimum wage that has failed to clearly demonstrate the negative effect that so many economists strongly believe to find. This paper reviews the reasons for this and argues that the literature needs to re-focus to further our knowledge on the topic. Keywords: Minimum wage, employment JEL Classifications: J3 This paper was produced as part of the Centre’s Labour Markets Programme. The Centre for Economic Performance is financed by the Economic and Social Research Council. Acknowledgements I would like to thank James Bishop, Jeff Borland, Arin Dube, Stephanie Koo, David Mare, and particularly Vincenzo Scrutinio, for help with this paper. Alan Manning, Centre for Economic Performance and London School of Economics. Published by Centre for Economic Performance London School of Economics and Political Science Houghton Street London WC2A 2AE All rights reserved. No part of this publication may be reproduced, stored in a retrieval system or transmitted in any form or by any means without the prior permission in writing of the publisher nor be issued to the public or circulated in any form other than that in which it is published. Requests for permission to reproduce any article or part of the Working Paper should be sent to the editor at the above address. A. Manning, submitted 2016.
2
Introduction
It is over 25 years since Charlie Brown invited readers of the Journal of Economic Perspectives to
think about the question ’Minimum Wage Laws: Are They Over-rated?’ with the final sentence “the
minimum wage is over-rated by its critics as well as its supporters” (p144) (Brown, 1988). At the
time, there was a strong academic consensus that the minimum wage caused job losses, was not
well-targeted on those it set out to help, and dominated by other policies to help the poor like the
EITC. Although the minimum wage often commanded wide support among the general population,
policy-makers seemed to be paying attention - the US federal minimum wage had not been raised
for almost a decade and only 10 states had higher minima. Outside the US, in 1993 the UK abolished
the Wages Councils that had set minimum wages in some low-paying industries since being
established by Winston Churchill in 1909 leaving only a minimum wage in agriculture. In 1994, the
OECD published its view on desirable labour market policies in the Jobs Study, recommending that
countries “reassess the role of statutory minimum wages as an instrument to achieve redistributive
goals, and switch to more direct instruments. If it is judged desirable to maintain a legal minimum
wage as part of an anti-poverty strategy, consider minimising its adverse employment effects”
(OECD, 1994). So, minimum wages seemed to be withering away.
The landscape looks very different today – there is pressure to make more use of minimum wages
almost everywhere. In the US, the logjam in Congress no change in the federal minimum wage is
likely but 29 states have higher minima and a number of cities are going their own way, passing
legislation to raise the minimum wage to levels (in relation to average earnings) not seen for more
than a generation. Outside the US, increasing numbers of countries are introducing or raising
minimum wages e.g. Hong Kong in 2011, Germany in 2015. Professional advice has changed - a joint
report from the IMF, World Bank, OECD and ILO for a G20 Conference in 2012 wrote ““a statutory
minimum wage set at an appropriate level may raise labour force participation at the margin,
without adversely affecting demand, thus having a net positive impact especially for workers weakly
attached to the labour market” (ILO, 2012). The IMF1 recommended to the US in October 2014 that
“given its current low level (compared both to U.S. history and international standards), the
minimum wage should be increased”.
Central to this change in view is what has sometimes been called the ‘New Minimum Wage
Research’ (perhaps best exemplified by Card and Krueger, 1995) that, starting in the early 1990s,
cast some doubt on the conventional wisdom that the minimum wage inevitably destroyed jobs with
the only interesting question being the size of the loss. To be sure, disagreement remains within the
1 https://www.imf.org/external/np/ms/2014/061614.htm
3
profession so that almost 25 years after this research began, there is no consensus on the
employment effects of the minimum wage - O’Neill (2014) shows that there are clear characteristics
of economists who signed the petition for and against the 2013 Fair Minimum Wage Act. But it does
seem fair to say that clear negative impacts on employment of minimum wages are elusive.
In the large number of papers that try to estimate what the effect of minimum wages are on
employment, there is a danger of losing sight of the ‘why’ question – why is it so hard to find
negative employment effects of the minimum wage. Perhaps there are economic factors that
explain the small and often ambiguous effects of the minimum wage on employment? Or perhaps
labor markets are fundamentally different from conventional product markets. These are the issues
discussed by this paper.
The conclusion is that the employment effect is elusive but that we should not be surprised by this
given the way labor markets operate in which deviations from perfect competition are much larger
than, say, in some product markets. And that it is perhaps time for the literature to move on to try to
address the question of how high the minimum wage can be raised without significant employment
effects appearing.
The Elusive Employment Effect: US Evidence
The employment effect has always and continues to constitute the bulk of research on the impact of
the minimum wage. This paper will not attempt to survey the vast literature on the employment
effect of the minimum wage – there are excellent reviews available in Neumark and Wascher (2008),
Belman and Wolfson (2013) and Schmitt (2013) as well as a number of meta-studies (Doucouliagos
and Stanley, 2009; Leonard, Stanley and Doucouliagos, 2014; Chletsos and Giotis, 2015). We are
almost at the point where there are meta-studies of meta-studies. To keep this paper to a
manageable length it does not attempt to be encyclopaedic and cite every relevant study on every
topic – apologies to those who do not get cited when they have as good a claim as those who do.
Most studies of the employment effect of the minimum wage focus on groups where the minimum
is high in relation to average earnings e.g. teenagers, low-wage industries or those with low
education. There is a sample selection problem here. There is probably no economist who does not
believe that there is a point at which higher minimum wages reduce employment so one should be
able to find samples in which this effect can be found. But even if one did find such samples, it
would not mean that the impact of the minimum wage is everywhere negative. However, the
4
practical problem is that it is very hard to find sub-samples which demonstrate a robust negative
effect of minimum wages on employment.
Of course, there are many parts of the labor market where the minimum wage would be expected to
have no detectable effect on any labor market outcome because it is set so low in relation to
prevailing wages that it has no impact at all. So it makes sense to confine the search for the
employment effect of the minimum wage to segments where one can detect a significant wage
effect. But even then the employment effect is often elusive.
To illustrate the elusiveness of the employment effect, this paper will only consider in detail the
literature on the most studied group, the American teenager. This is also the group where it has
been argued that a negative employment effect is most commonly found (studies on, for example,
fast food restaurants are even less conclusive). Teenagers hate having adults poking their noses into
their business but their employment and wages have been pored over by generations of labor
economists seeking to answer the question ‘what is the impact of the minimum wage on
employment?’. The early literature (reviewed in Brown, Gilroy and Kohen, 1982) largely focused on
time series analysis but for the last 20+ years (starting with Neumark and Wascher, 1992) it is state-
level panels that have been the focus of attention.
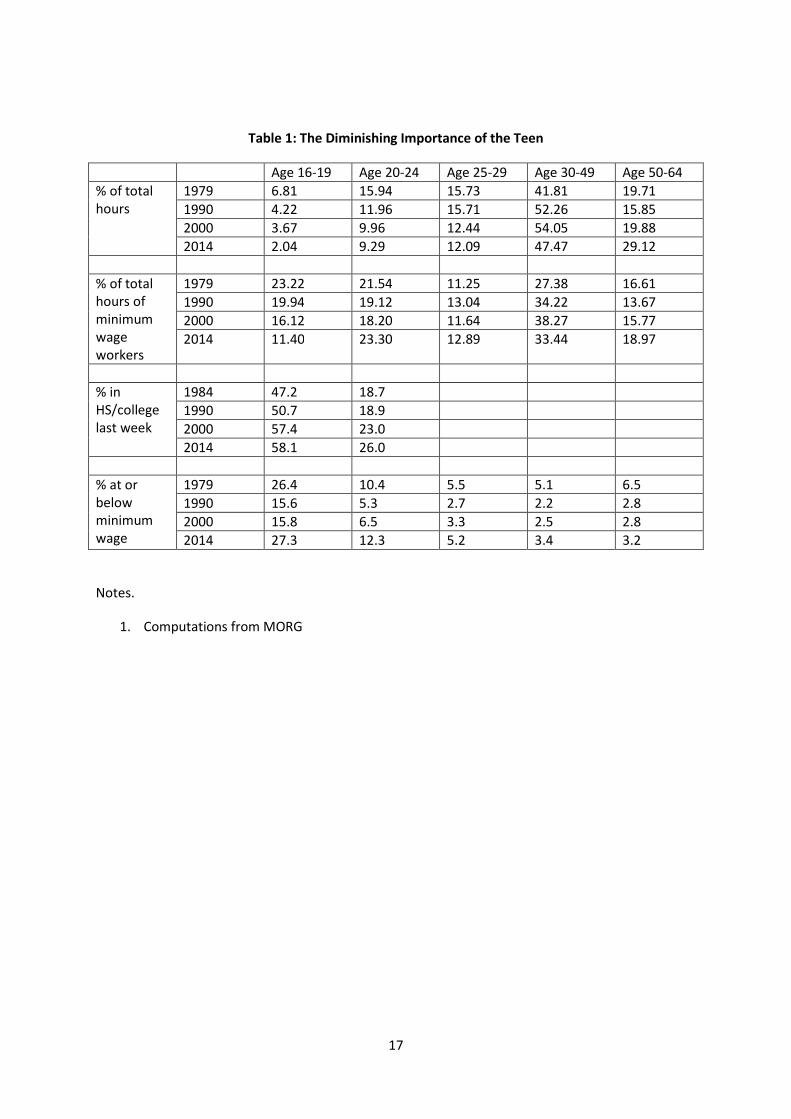
There is, of course, some reason for this attention. Teens are the group which is most affected by
the minimum wage – Table 1 shows that in both 1979 and 2014, slightly more than 25% of teens had
a reported hourly wage at or below the minimum though the fraction was somewhat lower in the
intervening years2. And in some states in 2014 the minimum wage is very close to the median hourly
wage for teens. So, while the minimum wage in the US as a whole is at quite a low level relative to
median earnings (directly affecting less than 5% of workers), it is binding in the teen labor market.
But there is also something slightly odd about the focus on teens as this group is a small and
declining share of total employment, representing only 2% of total hours worked in 2014 (Table 1).
The teen` share of minimum wage workers has been declining as well. In 1979, one in four minimum
wage workers was a teen, this is now 1 in 9. In 1979 there were similar number of minimum wage
workers who were teens as were aged 20-24 – now the second group are over twice as large as the
teen group. And Table 1 shows that almost 60% of teens were in education last week (this is
averaged across the whole year)and students’ labor supply could be different from that of the
population as a whole. For example, a finding that hours and employment fall when minimum
wages rise could be a backward-bending labor supply curve as teenagers seek to earn a certain
2 The minimum here is the maximum of the federal or state level. Reported wages may be below the
minimum because of measurement error, the use of the youth sub-minimum, because they are tipped workers
or because the worker is not covered by the minimum wage as coverage is not universal.
5
amount of income to finance their education but otherwise want to spend as much time as possible
on their studies. All of this means that there is something odd about extrapolating the evidence on
teens to the whole labor market yet this is what a recent CBO report did (CBO, 2014) in producing
estimates of the impact of proposed rises in the federal minimum wage on total employment.
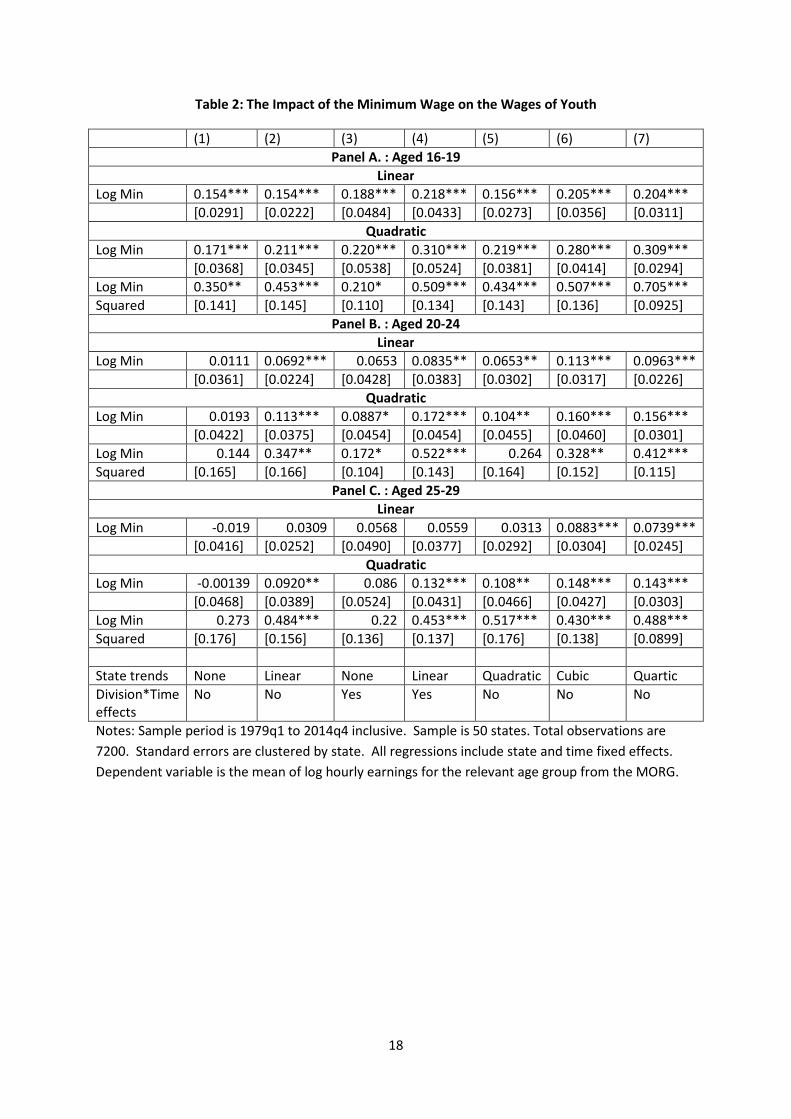
In spite of all this the employment effect on teens is elusive. Table 2 starts by presenting some
estimates of the impact of minimum wages on teen wages using a state-level panel as a first check
there is some effect on wages. There is considerable dispute in the literature on the appropriate
controls in these regressions that has varied over time. We do not seek to argue for a ‘best’
specification - instead we present a variety of estimates based on those used in Neumark, Salas and
Wascher (2014) who are responding in part to Allegretto, Dube and Reich (2011)3. Our sample
period is 1979-2014. We define the minimum wage as the maximum of the state and federal
minimum.
All of these regressions control for the prime-age unemployment rate and the proportion of teens in
the population. The reported specifications differ according to the fixed effects and trends that are
included. The first column just includes state and time fixed effects, column (2) adds state-specific
linear trends, column (3) census division time fixed effects, column (4) the both the census division
effects and the linear trends, column (5) has a state-specific quadratic trend, column (6) a cubic
trend and column (7) a quartic trend.
Table 2 shows that for teen wages, there is a clear robust impact of minimum wages on the mean
log hourly wage for teens. Although the estimates do vary with specification the range is not very
large. The size of the elasticity is slightly larger than the fraction of teens reporting hourly wages at
or below the minimum which is consistent with modest spill-over effects from the minimum wage
(Autor, Manning and Smith, 2015).
One problem with these specifications is that they imply that the elasticity of teen wages with
respect to the minimum wage is a constant whatever the level of the minimum wage. While this
may be all that could be identified for the observed range of variation in minimum wages, it is
implausible as a universal model as it predicts that a rise in the minimum wage from $1 to $1.10 has
the same impact as a rise from $10 to $11 dollars. We would expect the marginal effect of changes
in the minimum wage to be increasing in the minimum wage – a very low minimum wage will have
no impact and a higher minimum wage a larger impact. Non-linearity has not been investigated
3 We do not address in detail here a recent debate that uses synthetic control methods – Neumark, Salas and
Wascher (2014), Dube and Zipperer (2015). But, it seems unlikely this will deliver clear evidence on a negative
employment effect.
6
much in the literature on employment effects (though it is in the literature on the impact of the
minimum wage on inequality – Lee, 1999; Autor, Manning and Smith, 2015) , perhaps because it is
thought hard enough to detect a linear effect. But for the wages of teenagers, one can detect such
an effect as is demonstrated in the ‘quadratic’ part of Table 2, Panel A. This includes a quadratic
term in the minimum wage normalized by the mean log hourly wage of prime-age workers in the
state and then instrumented using the controls in the regression interacted with the minimum to
deal with the quadratic term. The quadratic term is centred so that the coefficient on the linear
term is the marginal effect at the mean value of the normalized minimum wage – details are in the
Appendix.
As one can see, the quadratic term for teens has the expected positive coefficient in all specifications
as one would expect, is significantly different from zero and reasonably robust.
Although most research focuses on teens, Table 2 also reports results for those aged 20-24 and 25-
29 . Table 1 showed that both of these groups now account for a higher fraction of minimum wage
workers than do teens though the impact of the minimum wage is lower for these groups. For the
20-24 age group most of the estimated impacts of the minimum on wages are significantly different
from zero especially in the quadratic specification, though lower than the estimated effect for teens.
So, it is not just teens where one can detect a significant impact on wages. And for the 25-29 group,
there are also some significant effects with the quadratic estimates not being very different from
those found for the 20-24 age group. Detectable wage effects seem to extend beyond the teen
years.
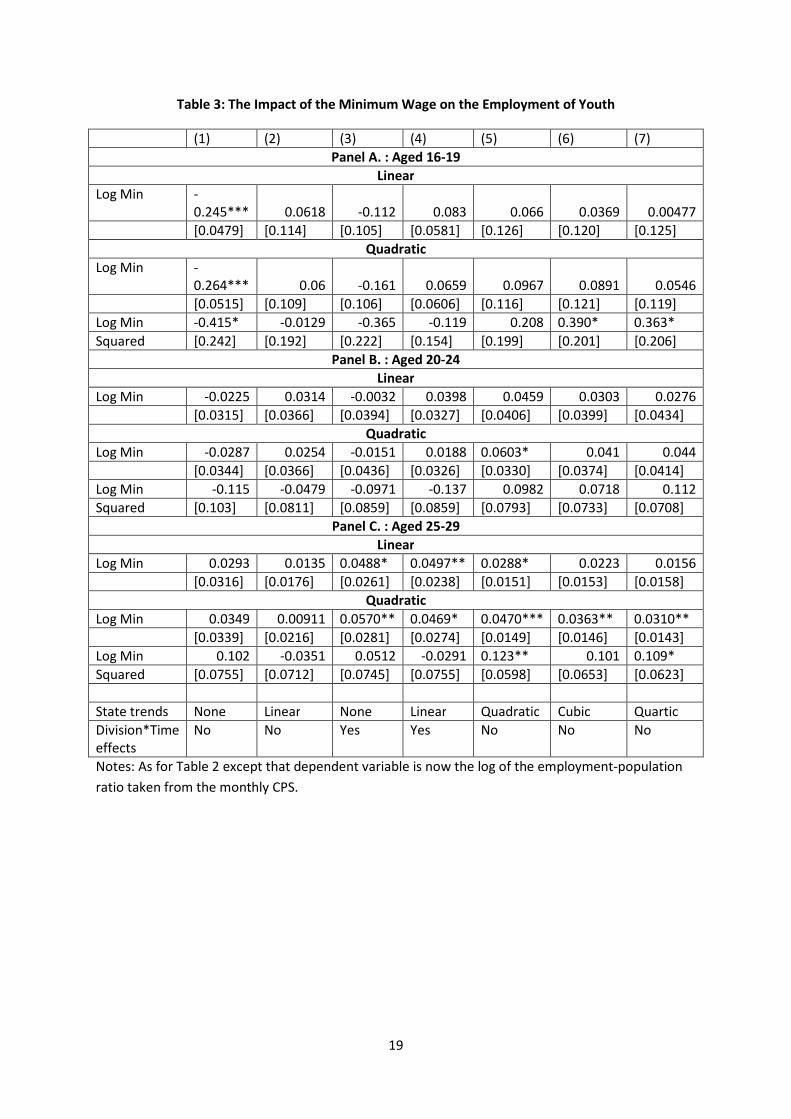
Table 3 presents estimates of similar equations for the effect of the minimum wage on the
employment rate of teenagers. For teens the specification which includes only state and time fixed
effects (Panel A, column 1) produces a significant negative effect in both the linear and the quadratic
specification. But, unlike the wage effect, this is not at all robust to other specifications. The
estimated effects are generally not significantly different from zero and positive coefficients are as
common as negative ones4. For the older groups where the estimated wage effect is not as robust
but still often present, one never finds significant negative effects and most of the estimated effects
are small and positive.
4 This is slightly different from Neumark, Salas and Wascher (2014) who do estimate a negative
effect in some of the later columns for the shorter sample period 1991-2011.
7
This – in a nutshell – is the elusive employment effect. Even for groups where one can estimate a
sizeable, robust wage effect, the employment effect is hard to find.
It seems unlikely that state-level panel data on teens is going to deliver clear evidence on a non-zero
employment effect of the minimum wage (if it exists) in the near future. This literature has come to
resemble trench warfare (complete with six feet of mud) in which the two sides are fighting over a
small patch of ground which is not of much strategic importance in any case. It is time to call a truce
with it being acknowledged that no clear evidence of a negative effect on employment has been
found and re-deploy the energy expended on this issue to other areas.
But the difficulty of establishing a clear employment effect is a puzzle to many and why this should
be the case is discussed in the next section.
Why is the Employment Effect so Elusive?
Suppose we have a very simple model based on a competitive labor market for the analysis of the
wage and employment effects of the minimum wage. We assume that the minimum wage affects
actual wages according to an equation:
min
0 1ln ln
ww w xα α α ε= + + + (1)
In turn the wage affects the marginal cost of labor to the employer according to:
0 1ln ln
c
cw w xβ β β ε= + + + (2)
And, in turn, there is a labor demand curve relating employment to the cost of labor to the employer
so that we have:
0 1ln ln
c
nn w xγ γ γ ε= + + + (3)
Combining (1)-(3) we end up with a reduced-form equation relating employment to the minimum:
min
0 1ln lnn w x uδ αβγ δ= + + + (4)
If one can detect a significant effect of the minimum on wages in the estimation of (1) but fail to find
one in (4), there are a number of possible explanations for this. First, it may simply be harder to find
an equal-sized impact on employment than wages (which would correspond to a labor demand
elasticity of 1) because employment has more residual variation leading to larger standard errors.
Looking at Tables 1 and 2 one can see that, for teens, the standard errors on the employment
8
estimates are typically larger than on the wage estimates. But, for the older groups, the standard
errors on wage and employment equations are very similar.
To the extent that there is something to the argument that it is harder to get a precise employment
estimate than a wage estimate, the solution is better quality data. In this regard, the literature could
perhaps make more use in future of administrative and payroll data, the use of which was probably
pioneered by Neumark and Wascher (2000). Studies using payroll data are surprisingly rare but two
recent studies, Giuliano (2013) and Hirsch, Kaufman and Zelenska (2015) both found large wage
effects but no negative employment effects.
Secondly, it may be that the impact of the minimum wage on employment is weaker than on wages
because β or γ or both are small i.e. because the pass-through from minimum wages to the cost of
labor is low or because the labor demand curve has a low elasticity. We consider arguments for this
in turn.
Low Pass-Through
Why might the link between wages and employer labour costs be weak? It may be the case that
employers can off-set the impact of higher minimum wages by being less generous with other
aspects of the employment contract – what Brown (1988) called offsets – such as meal breaks, fringe
benefits or training. The feature of offsets is that workers are made worse-off, possibly by more
than the increase in the minimum wage. Evidence for this is decidedly weak (see the review in
Neumark and Wascher, 2008, or Belman and Wolfson, 2014) but it is a theoretical possibility. But
there are other reasons why labor costs may not rise as fast as wages which do not depend on
workers being made worse-off - turnover and monitoring costs. Consider turnover costs - suppose
that each worker costs H to hire and train and that the turnover rate is given by ( ),fq w w where
fw is the wage paid by this firm and w is the wage paid by other firms. We would expect that a
high own-wage lowers quits, a high other wage raises it but the effect of raising both own and other
wages is to reduce quits as work as a whole becomes more attractive relative to non-work. We have
accumulating evidence that increases in the minimum wage are associated with lower labor
turnover even if total employment is unchanged (Portugal and Cardoso, 2006; Brochu and Green,
2013; Dube, Lester and Reich, 2015; Dube, Giuliano and Leonard, 2015). Total labour costs in firm
f will be given by:
( ),c
f f fw w q w w H= + (5)
9
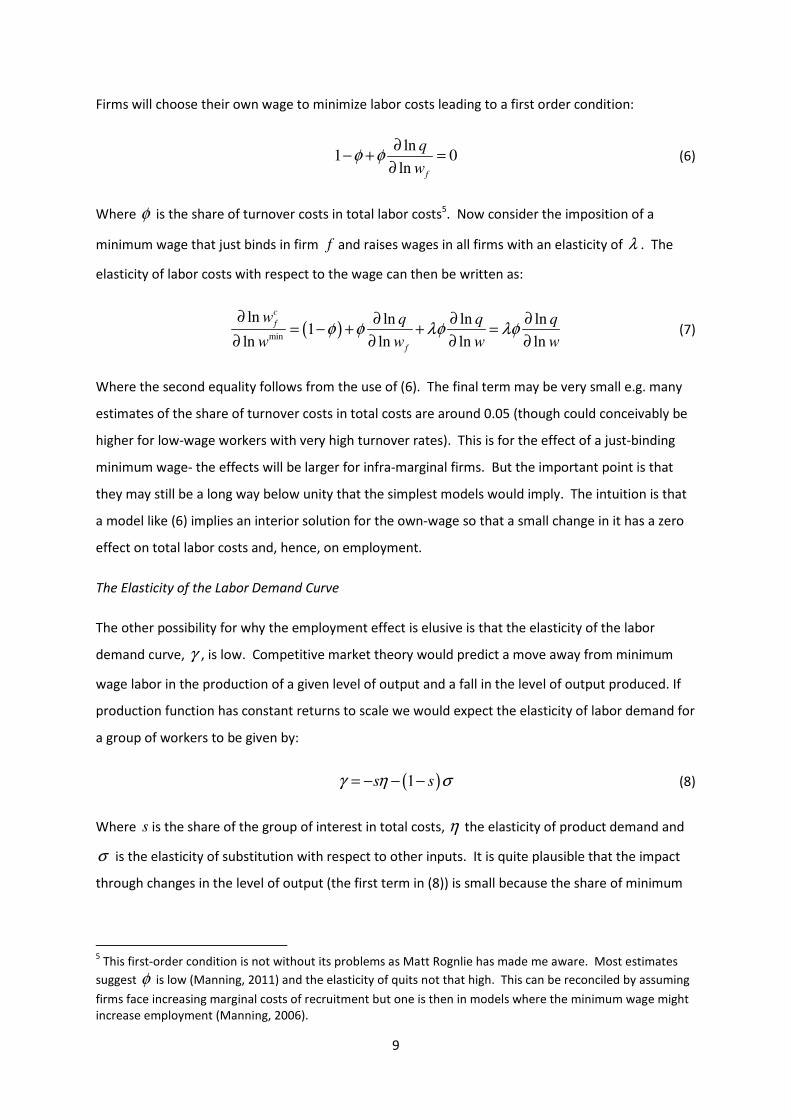
Firms will choose their own wage to minimize labor costs leading to a first order condition:
ln1 0
ln f
q
wφ φ
∂− + =
∂ (6)
Where φ is the share of turnover costs in total labor costs5. Now consider the imposition of a
minimum wage that just binds in firm f and raises wages in all firms with an elasticity of λ . The
elasticity of labor costs with respect to the wage can then be written as:
( )min
ln ln ln ln1
ln ln ln ln
c
f
f
w q q q
w w w wφ φ λφ λφ
∂ ∂ ∂ ∂= − + + =
∂ ∂ ∂ ∂(7)
Where the second equality follows from the use of (6). The final term may be very small e.g. many
estimates of the share of turnover costs in total costs are around 0.05 (though could conceivably be
higher for low-wage workers with very high turnover rates). This is for the effect of a just-binding
minimum wage- the effects will be larger for infra-marginal firms. But the important point is that
they may still be a long way below unity that the simplest models would imply. The intuition is that
a model like (6) implies an interior solution for the own-wage so that a small change in it has a zero
effect on total labor costs and, hence, on employment.
The Elasticity of the Labor Demand Curve
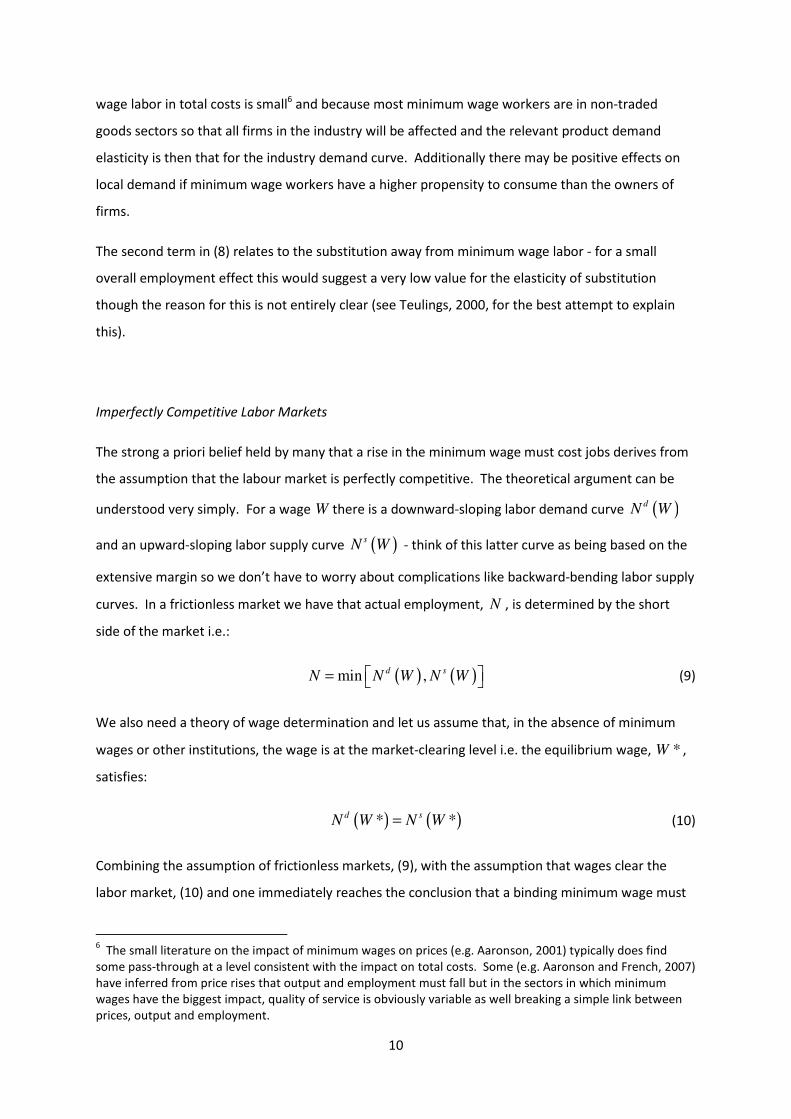
The other possibility for why the employment effect is elusive is that the elasticity of the labor
demand curve, γ , is low. Competitive market theory would predict a move away from minimum
wage labor in the production of a given level of output and a fall in the level of output produced. If
production function has constant returns to scale we would expect the elasticity of labor demand for
a group of workers to be given by:
( )1s sγ η σ= − − − (8)
Where s is the share of the group of interest in total costs, η the elasticity of product demand and
σ is the elasticity of substitution with respect to other inputs. It is quite plausible that the impact
through changes in the level of output (the first term in (8)) is small because the share of minimum
5 This first-order condition is not without its problems as Matt Rognlie has made me aware. Most estimates
suggest φ is low (Manning, 2011) and the elasticity of quits not that high. This can be reconciled by assuming
firms face increasing marginal costs of recruitment but one is then in models where the minimum wage might
increase employment (Manning, 2006).
10
wage labor in total costs is small6 and because most minimum wage workers are in non-traded
goods sectors so that all firms in the industry will be affected and the relevant product demand
elasticity is then that for the industry demand curve. Additionally there may be positive effects on
local demand if minimum wage workers have a higher propensity to consume than the owners of
firms.
The second term in (8) relates to the substitution away from minimum wage labor - for a small
overall employment effect this would suggest a very low value for the elasticity of substitution
though the reason for this is not entirely clear (see Teulings, 2000, for the best attempt to explain
this).
Imperfectly Competitive Labor Markets
The strong a priori belief held by many that a rise in the minimum wage must cost jobs derives from
the assumption that the labour market is perfectly competitive. The theoretical argument can be
understood very simply. For a wage W there is a downward-sloping labor demand curve ( )dN W
and an upward-sloping labor supply curve ( )sN W - think of this latter curve as being based on the
extensive margin so we don’t have to worry about complications like backward-bending labor supply
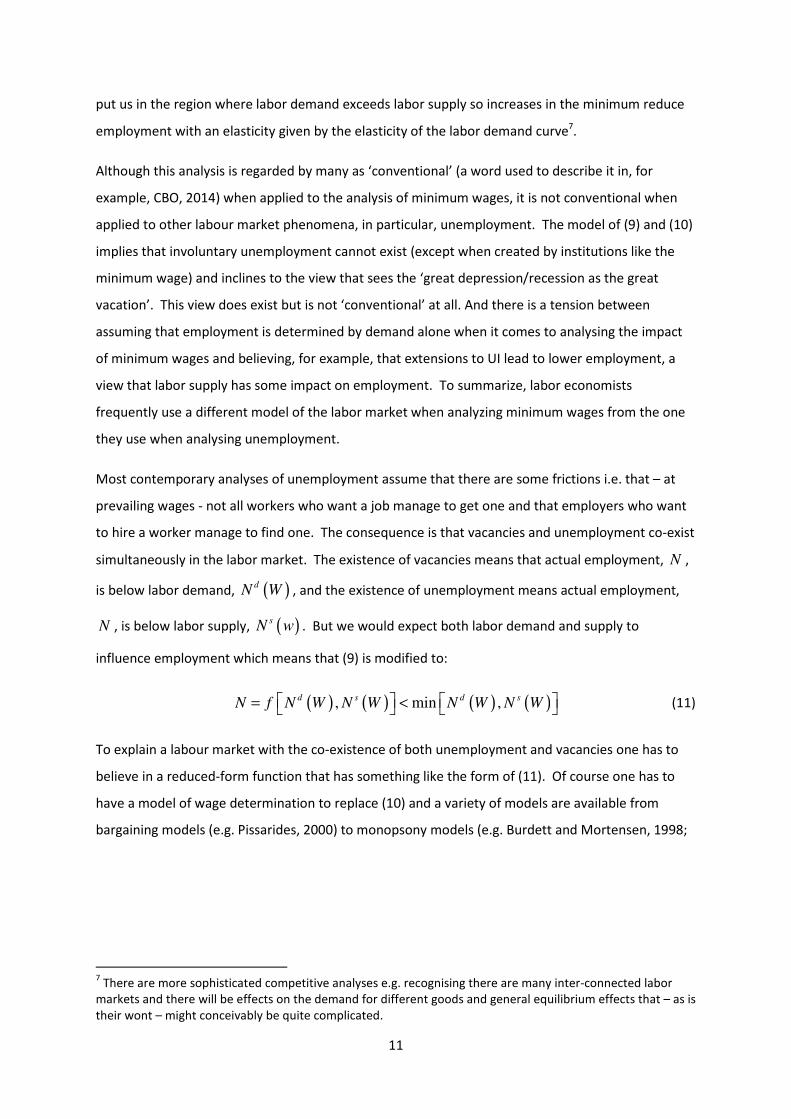
curves. In a frictionless market we have that actual employment, N , is determined by the short
side of the market i.e.:
( ) ( )min ,d s
N N W N W = (9)
We also need a theory of wage determination and let us assume that, in the absence of minimum
wages or other institutions, the wage is at the market-clearing level i.e. the equilibrium wage, *W ,
satisfies:
( ) ( )* *d s
N W N W= (10)
Combining the assumption of frictionless markets, (9), with the assumption that wages clear the
labor market, (10) and one immediately reaches the conclusion that a binding minimum wage must
6 The small literature on the impact of minimum wages on prices (e.g. Aaronson, 2001) typically does find
some pass-through at a level consistent with the impact on total costs. Some (e.g. Aaronson and French, 2007)
have inferred from price rises that output and employment must fall but in the sectors in which minimum
wages have the biggest impact, quality of service is obviously variable as well breaking a simple link between
prices, output and employment.
11
put us in the region where labor demand exceeds labor supply so increases in the minimum reduce
employment with an elasticity given by the elasticity of the labor demand curve7.
Although this analysis is regarded by many as ‘conventional’ (a word used to describe it in, for
example, CBO, 2014) when applied to the analysis of minimum wages, it is not conventional when
applied to other labour market phenomena, in particular, unemployment. The model of (9) and (10)
implies that involuntary unemployment cannot exist (except when created by institutions like the
minimum wage) and inclines to the view that sees the ‘great depression/recession as the great
vacation’. This view does exist but is not ‘conventional’ at all. And there is a tension between
assuming that employment is determined by demand alone when it comes to analysing the impact
of minimum wages and believing, for example, that extensions to UI lead to lower employment, a
view that labor supply has some impact on employment. To summarize, labor economists
frequently use a different model of the labor market when analyzing minimum wages from the one
they use when analysing unemployment.
Most contemporary analyses of unemployment assume that there are some frictions i.e. that – at
prevailing wages - not all workers who want a job manage to get one and that employers who want
to hire a worker manage to find one. The consequence is that vacancies and unemployment co-exist
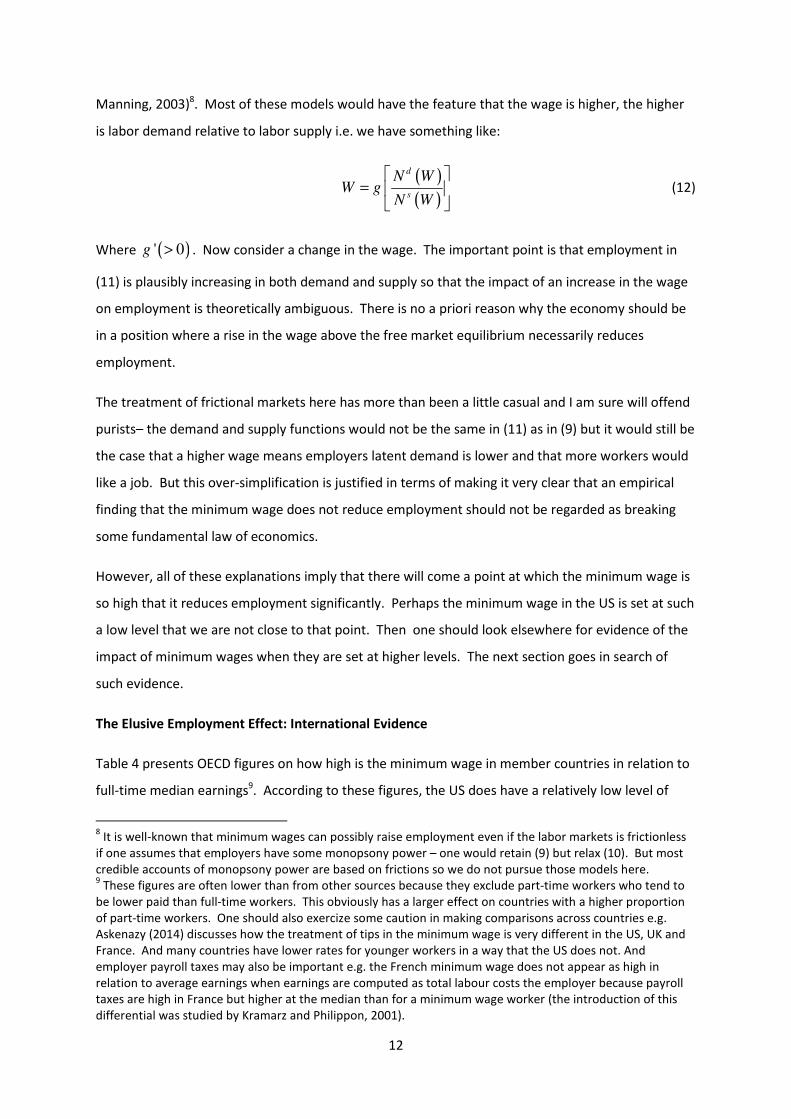
simultaneously in the labor market. The existence of vacancies means that actual employment, N ,
is below labor demand, ( )dN W , and the existence of unemployment means actual employment,
N , is below labor supply, ( )sN w . But we would expect both labor demand and supply to
influence employment which means that (9) is modified to:
( ) ( ) ( ) ( ), min ,d s d s
N f N W N W N W N W = < (11)
To explain a labour market with the co-existence of both unemployment and vacancies one has to
believe in a reduced-form function that has something like the form of (11). Of course one has to
have a model of wage determination to replace (10) and a variety of models are available from
bargaining models (e.g. Pissarides, 2000) to monopsony models (e.g. Burdett and Mortensen, 1998;
7 There are more sophisticated competitive analyses e.g. recognising there are many inter-connected labor
markets and there will be effects on the demand for different goods and general equilibrium effects that – as is
their wont – might conceivably be quite complicated.
12
Manning, 2003)8. Most of these models would have the feature that the wage is higher, the higher
is labor demand relative to labor supply i.e. we have something like:
( )( )
d
s
N WW g
N W
=
(12)
Where ( )' 0g > . Now consider a change in the wage. The important point is that employment in
(11) is plausibly increasing in both demand and supply so that the impact of an increase in the wage
on employment is theoretically ambiguous. There is no a priori reason why the economy should be
in a position where a rise in the wage above the free market equilibrium necessarily reduces
employment.
The treatment of frictional markets here has more than been a little casual and I am sure will offend
purists– the demand and supply functions would not be the same in (11) as in (9) but it would still be
the case that a higher wage means employers latent demand is lower and that more workers would
like a job. But this over-simplification is justified in terms of making it very clear that an empirical
finding that the minimum wage does not reduce employment should not be regarded as breaking
some fundamental law of economics.
However, all of these explanations imply that there will come a point at which the minimum wage is
so high that it reduces employment significantly. Perhaps the minimum wage in the US is set at such
a low level that we are not close to that point. Then one should look elsewhere for evidence of the
impact of minimum wages when they are set at higher levels. The next section goes in search of
such evidence.
The Elusive Employment Effect: International Evidence
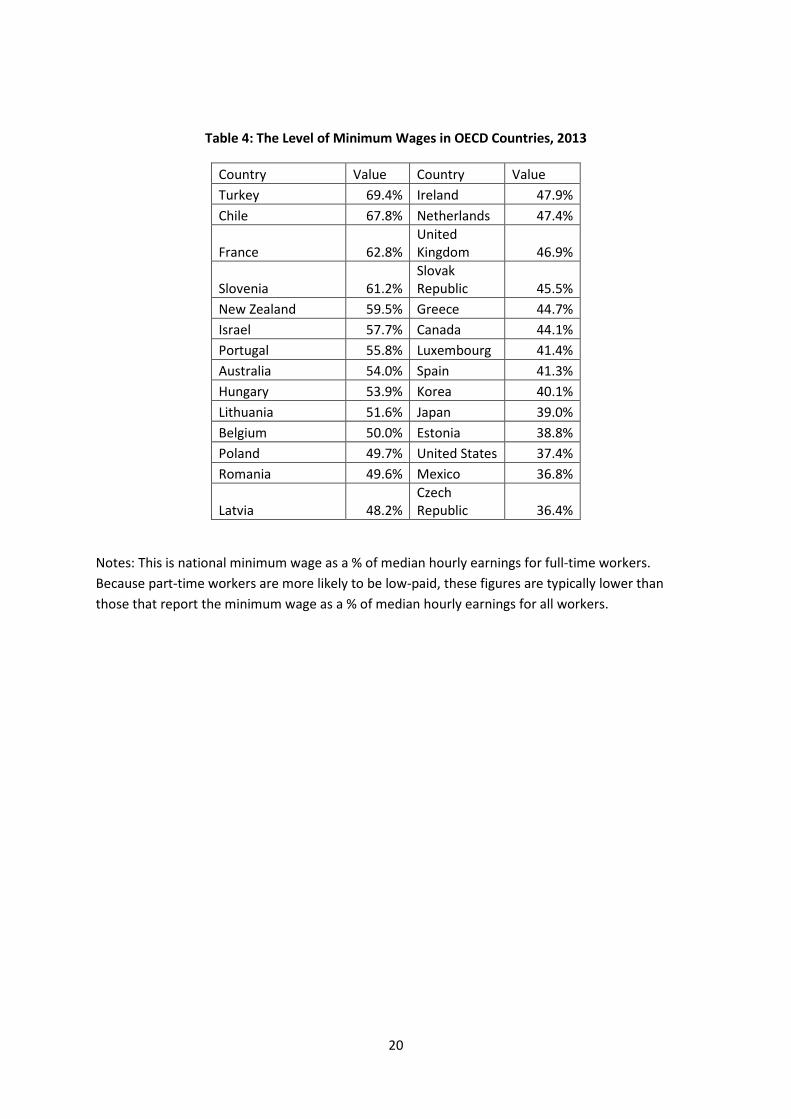
Table 4 presents OECD figures on how high is the minimum wage in member countries in relation to
full-time median earnings9. According to these figures, the US does have a relatively low level of
8 It is well-known that minimum wages can possibly raise employment even if the labor markets is frictionless
if one assumes that employers have some monopsony power – one would retain (9) but relax (10). But most
credible accounts of monopsony power are based on frictions so we do not pursue those models here. 9 These figures are often lower than from other sources because they exclude part-time workers who tend to
be lower paid than full-time workers. This obviously has a larger effect on countries with a higher proportion
of part-time workers. One should also exercize some caution in making comparisons across countries e.g.
Askenazy (2014) discusses how the treatment of tips in the minimum wage is very different in the US, UK and
France. And many countries have lower rates for younger workers in a way that the US does not. And
employer payroll taxes may also be important e.g. the French minimum wage does not appear as high in
relation to average earnings when earnings are computed as total labour costs the employer because payroll
taxes are high in France but higher at the median than for a minimum wage worker (the introduction of this
differential was studied by Kramarz and Philippon, 2001).
13
minimum wages in relation to median earnings. So we might hope to look to other countries where
the minimum wage is higher to search for the employment effect. We will briefly consider a number
of cases, selected to focus on where the minimum wage seems much higher than in the US and
where we have good research designs for investigating the employment impact.
The UK
After the US, the country with the most research on the employment impact of the minimum wage
is the UK It is particularly interesting because in the period 1993-199910 it had no minimum wage
except in agriculture leading to some startling job offers e.g. for a security officer for £2 per hour
who must provide their own dog. In 1999 the National Minimum Wage was introduced, initially at a
low level (about 46% of median hourly earnings), but subsequently increased to now be about 55%.
Unlike the US it does have sizeable age variation – there are lower rates for workers aged less than
21 and for apprentices. The body responsible for making recommendations on the level of the
minimum wage to the government, the Low Pay Commission, has always commissioned research on
the employment effects (see LPC, 2015, for its latest report) and, apart from a few studies in specific
sectors (e.g. Machin, Manning and Rahman, 2003, which studied a sector where 30% of workers
were paid the minimum), has found nothing. Here I will simply present a summary of that research.
The NMW is what it says, a national minimum wage, so investigation of the employment effect has
concentrated on comparing groups where the minimum wage differs in its impact. It obviously has
had more impact on younger than older workers, on women than men and in low-wage regions of
the UK.
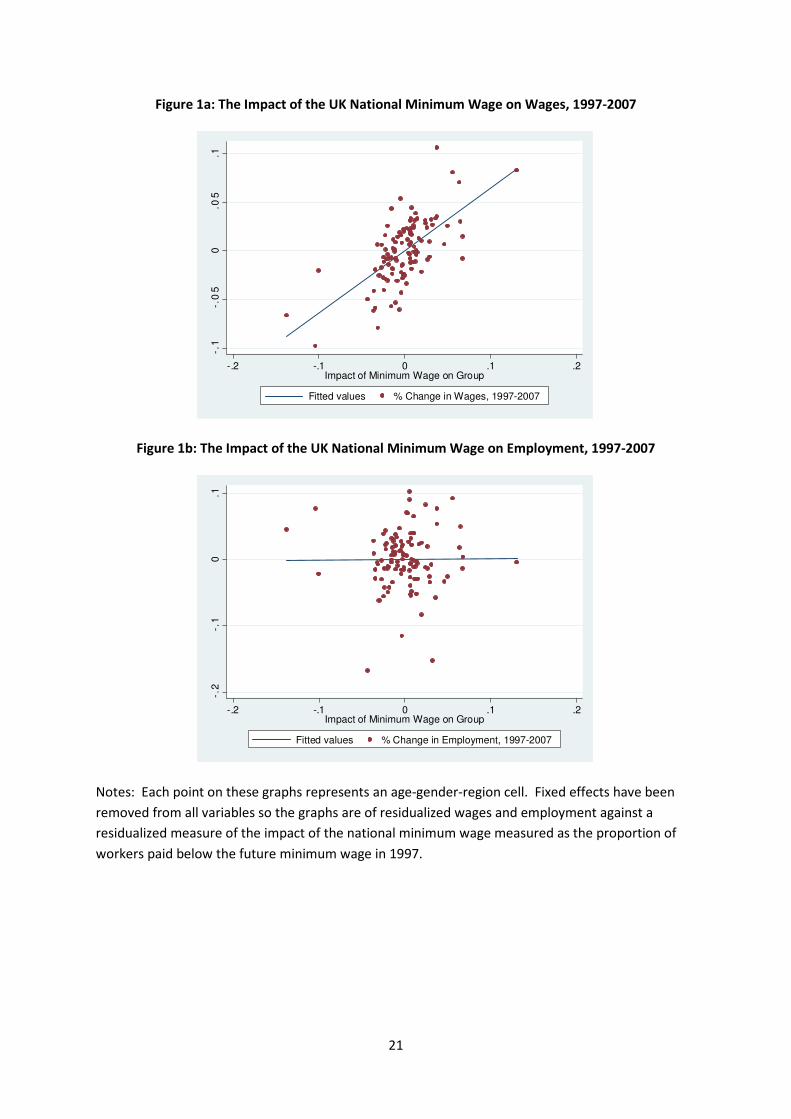
Here we will just consider the long-period impact of the minimum wage from 1997 (before it was
introduced) to 2007 (before the financial crisis). We divide the labour market into segments by
gender, age groups and regions. We compute the fraction of workers who would be expected to be
affected by the minimum wage using data from 1996. We then consider how wages and
employment have changed in the different segments after controlling for gender, age and region
effects. Figure 1a plots the residualized change in wages against the residualized bite of the
minimum wage. One can see very clearly the impact of the NMW on wages – wage growth has been
stronger in low-wage segments of the UK labour market – this is consistent with the fall in wage
inequality in the bottom half of the distribution in this period (Butcher, Dickens and Manning, 2012).
Figure 1b does the same exercize but for employment – the lack of a relationship is very clear. We
10 Prior to 1993 it had Wages Councils which set minimum wages in a number of low-paid sectors though some
large low-paid sectors were excluded.
14
see in the UK, although the minimum wage is at a higher level than in the US, a clear impact on
wages but an elusive effect on employment.
France
France is often held up as the model of what happens when the minimum wage is set too high. It
has had high unemployment in general, and youth unemployment in particular, for a very long time.
The expert committee that reports on the minimum wage estimates (DGT, 2014, p52) that 11.4% of
workers are paid the in the neighborhood of the minimum much higher than the proportions directly
affected in the US or the UK. And the expert committee has never recommended since its inception
in 2008, increasing the minimum faster than the minimum required by the law, reflecting the view of
the economists on it that the minimum is too high.
However, the fact that the minimum wage is increased every year according to a formula with only
small variation relative to average earnings means that it is very difficult if not impossible to clearly
identify the impact of the minimum wage in France . The one study that does consider a large
change is Kramarz and Philippon (2001) who consider a change in 1996 that reduced the payroll tax
on minimum wage workers at the same time that the minimum wage itself was increased. That
study found an increase in teen employment but because the cost of labor to the employer was
reduced at the same time as the incentive to work was raised one would expect both the demand
and the supply for labor to increase (see (11)) so employment would be expected to rise. This is not
the same as a general cut or rise in the minimum wage.
It may well be the case that the minimum wage is set in France at a level where it results in sizeable
job losses but we don’t have the studies to back up such an assertion.
Australia
Minimum wages in Australia are complicated. Although Australia does have a Federal Minimum
Wage (currently set at AUS$16.87, approximately US$13.5) it also has a system of ‘Modern Awards’
which sets minimum wages by industry, occupation, and seniority. As a result there are over 1500
different minimum wages in total, and the federal minimum wage is simply an absolute floor. But
even the federal minimum is at a relatively high level relative to average earnings- around 16% of
workers are currently paid the minimum wage (Plunkett and Borland, 2014). In fact, the OECD
statistics suggested that in the late 1990s they were higher than those in France and. But, unlike
France, the Australian labour market has not been plagued by persistently high unemployment rates
(it is currently 6.1%).
15
Like France, the nature of the minimum wage variation in Australia does not lend itself to a high
quality research design when it comes to investigating the impact of minimum wages on
employment and the literature is small. But it is a useful counterpoint to the argument that all the
countries with the highest minimum wages have a very clear unemployment problem.
Other Countries
New Zealand also has high minimum wages, and an official body to review the evidence on its
impact (see MBIE, 2014). The research based on the best variation in the minimum wage is Hyslop
and Stillman (2007, 2011) who investigate the impact of large changes in the youth minimum wage,
finding – at best – weak evidence of job losses even though the minimum wages are high in relation
to average earnings.
One could also point to studies of Ireland (O’Neill, Nolan and Williams, 2006), Portugal (Portugal and
Cardoso, 2006) or Hungary (Harasztosi and Lindner, 2015) for studies of large changes in minimum
wages in countries where the level of minimum wages are relatively high that fail to find clear
evidence of negative employment effects.
The conclusion is that the employment effect remains – for the moment – elusive. But it may be
that we are about to learn more. A number of US cities are phasing in sizeable rises in minimum
wages that are estimated to affect much higher proportions of workers in the labor market as a
whole – over 20% - than we have experienced. In the case of Los Angeles, the proposed 50%
increase over 5 years is estimated to directly affect 35% of workers by 2019 (Reich et al, 2015).
Seattle started its increase in the minimum wage to $15 on 1 April 2015 and already newspapers and
the tweetosphere are full of stories about the impacts though it will be some time before we have
enough data to make a considered judgment. It would, however, be extraordinary if minimum
wages at this level do not provide clear evidence of job losses and would almost certainly lead to
another revision in professional opinion. And, outside the US, the new minimum wage in Germany is
also set at quite a high level (need to get an estimate) and there will undoubtedly be economists
poring over the results from that as well.
Conclusion
Much of the literature on the employment minimum wage focuses on the question of ‘what is the
employment effect of the minimum wage’ using an empirical specification in which the effect is
always negative, zero or positive, and focusing heavily on the evidence for American teens. We have
reached the point of diminishing returns to this. A balanced view of the evidence on teen
employment makes it clear that any evidence of a negative employment effect is not robust to
16
reasonable variation in specification, even when the wage effect is robust. This might mean that the
labor demand elasticity is very small (and this paper has discussed some reasons why that might be
the case) but it might mean that the effect is not negative at all. The claim that the employment
effect might not be negative continues to be met with incredulity in some quarters, or
euphemistically described as ‘non-conventional’. But the ‘conventional’ view is based on a model of
the labor market in which all unemployment is voluntary leisure. To be internally consistent those
who argue that the minimum wage must reduce employment need to sign up for the ‘great
recessions as a great vacation’ hypothesis. As soon as one acknowledges that labor markets have
frictions (hardly an unconventional view) one has to acknowledge that the impact of the minimum
wage on employment is theoretically ambiguous – this paper has tried to explain why in the simplest
possible terms.
Of course there is some level of the minimum wage at which employment will decline significantly.
The literature should re-orient itself towards trying to find that point. One cannot when the
observed range of minimum wages does not include the turning-point but recent initiatives suggest
we may be about to observe the impact of much higher minimum wages in the near future.
Together with, hopefully, an increased use of high-quality payroll data, we may be about to learn
more.
17
Table 1: The Diminishing Importance of the Teen
Age 16-19 Age 20-24 Age 25-29 Age 30-49 Age 50-64
% of total
hours
1979 6.81 15.94 15.73 41.81 19.71
1990 4.22 11.96 15.71 52.26 15.85
2000 3.67 9.96 12.44 54.05 19.88
2014 2.04 9.29 12.09 47.47 29.12
% of total
hours of
minimum
wage
workers
1979 23.22 21.54 11.25 27.38 16.61
1990 19.94 19.12 13.04 34.22 13.67
2000 16.12 18.20 11.64 38.27 15.77
2014 11.40 23.30 12.89 33.44 18.97
% in
HS/college
last week
1984 47.2 18.7
1990 50.7 18.9
2000 57.4 23.0
2014 58.1 26.0
% at or
below
minimum
wage
1979 26.4 10.4 5.5 5.1 6.5
1990 15.6 5.3 2.7 2.2 2.8
2000 15.8 6.5 3.3 2.5 2.8
2014 27.3 12.3 5.2 3.4 3.2
Notes.
1. Computations from MORG
18
Table 2: The Impact of the Minimum Wage on the Wages of Youth
(1) (2) (3) (4) (5) (6) (7)
Panel A. : Aged 16-19
Linear
Log Min 0.154*** 0.154*** 0.188*** 0.218*** 0.156*** 0.205*** 0.204***
[0.0291] [0.0222] [0.0484] [0.0433] [0.0273] [0.0356] [0.0311]
Quadratic
Log Min 0.171*** 0.211*** 0.220*** 0.310*** 0.219*** 0.280*** 0.309***
[0.0368] [0.0345] [0.0538] [0.0524] [0.0381] [0.0414] [0.0294]
Log Min 0.350** 0.453*** 0.210* 0.509*** 0.434*** 0.507*** 0.705***
Squared [0.141] [0.145] [0.110] [0.134] [0.143] [0.136] [0.0925]
Panel B. : Aged 20-24
Linear
Log Min 0.0111 0.0692*** 0.0653 0.0835** 0.0653** 0.113*** 0.0963***
[0.0361] [0.0224] [0.0428] [0.0383] [0.0302] [0.0317] [0.0226]
Quadratic
Log Min 0.0193 0.113*** 0.0887* 0.172*** 0.104** 0.160*** 0.156***
[0.0422] [0.0375] [0.0454] [0.0454] [0.0455] [0.0460] [0.0301]
Log Min 0.144 0.347** 0.172* 0.522*** 0.264 0.328** 0.412***
Squared [0.165] [0.166] [0.104] [0.143] [0.164] [0.152] [0.115]
Panel C. : Aged 25-29
Linear
Log Min -0.019 0.0309 0.0568 0.0559 0.0313 0.0883*** 0.0739***
[0.0416] [0.0252] [0.0490] [0.0377] [0.0292] [0.0304] [0.0245]
Quadratic
Log Min -0.00139 0.0920** 0.086 0.132*** 0.108** 0.148*** 0.143***
[0.0468] [0.0389] [0.0524] [0.0431] [0.0466] [0.0427] [0.0303]
Log Min 0.273 0.484*** 0.22 0.453*** 0.517*** 0.430*** 0.488***
Squared [0.176] [0.156] [0.136] [0.137] [0.176] [0.138] [0.0899]
State trends None Linear None Linear Quadratic Cubic Quartic
Division*Time
effects
No No Yes Yes No No No
Notes: Sample period is 1979q1 to 2014q4 inclusive. Sample is 50 states. Total observations are
7200. Standard errors are clustered by state. All regressions include state and time fixed effects.
Dependent variable is the mean of log hourly earnings for the relevant age group from the MORG.
19
Table 3: The Impact of the Minimum Wage on the Employment of Youth
(1) (2) (3) (4) (5) (6) (7)
Panel A. : Aged 16-19
Linear
Log Min -
0.245*** 0.0618 -0.112 0.083 0.066 0.0369 0.00477
[0.0479] [0.114] [0.105] [0.0581] [0.126] [0.120] [0.125]
Quadratic
Log Min -
0.264*** 0.06 -0.161 0.0659 0.0967 0.0891 0.0546
[0.0515] [0.109] [0.106] [0.0606] [0.116] [0.121] [0.119]
Log Min -0.415* -0.0129 -0.365 -0.119 0.208 0.390* 0.363*
Squared [0.242] [0.192] [0.222] [0.154] [0.199] [0.201] [0.206]
Panel B. : Aged 20-24
Linear
Log Min -0.0225 0.0314 -0.0032 0.0398 0.0459 0.0303 0.0276
[0.0315] [0.0366] [0.0394] [0.0327] [0.0406] [0.0399] [0.0434]
Quadratic
Log Min -0.0287 0.0254 -0.0151 0.0188 0.0603* 0.041 0.044
[0.0344] [0.0366] [0.0436] [0.0326] [0.0330] [0.0374] [0.0414]
Log Min -0.115 -0.0479 -0.0971 -0.137 0.0982 0.0718 0.112
Squared [0.103] [0.0811] [0.0859] [0.0859] [0.0793] [0.0733] [0.0708]
Panel C. : Aged 25-29
Linear
Log Min 0.0293 0.0135 0.0488* 0.0497** 0.0288* 0.0223 0.0156
[0.0316] [0.0176] [0.0261] [0.0238] [0.0151] [0.0153] [0.0158]
Quadratic
Log Min 0.0349 0.00911 0.0570** 0.0469* 0.0470*** 0.0363** 0.0310**
[0.0339] [0.0216] [0.0281] [0.0274] [0.0149] [0.0146] [0.0143]
Log Min 0.102 -0.0351 0.0512 -0.0291 0.123** 0.101 0.109*
Squared [0.0755] [0.0712] [0.0745] [0.0755] [0.0598] [0.0653] [0.0623]
State trends None Linear None Linear Quadratic Cubic Quartic
Division*Time
effects
No No Yes Yes No No No
Notes: As for Table 2 except that dependent variable is now the log of the employment-population
ratio taken from the monthly CPS.
20
Table 4: The Level of Minimum Wages in OECD Countries, 2013
Country Value Country Value
Turkey 69.4% Ireland 47.9%
Chile 67.8% Netherlands 47.4%
France 62.8%
United
Kingdom 46.9%
Slovenia 61.2%
Slovak
Republic 45.5%
New Zealand 59.5% Greece 44.7%
Israel 57.7% Canada 44.1%
Portugal 55.8% Luxembourg 41.4%
Australia 54.0% Spain 41.3%
Hungary 53.9% Korea 40.1%
Lithuania 51.6% Japan 39.0%
Belgium 50.0% Estonia 38.8%
Poland 49.7% United States 37.4%
Romania 49.6% Mexico 36.8%
Latvia 48.2%
Czech
Republic 36.4%
Notes: This is national minimum wage as a % of median hourly earnings for full-time workers.
Because part-time workers are more likely to be low-paid, these figures are typically lower than
those that report the minimum wage as a % of median hourly earnings for all workers.
21
Figure 1a: The Impact of the UK National Minimum Wage on Wages, 1997-2007
Figure 1b: The Impact of the UK National Minimum Wage on Employment, 1997-2007
Notes: Each point on these graphs represents an age-gender-region cell. Fixed effects have been
removed from all variables so the graphs are of residualized wages and employment against a
residualized measure of the impact of the national minimum wage measured as the proportion of
workers paid below the future minimum wage in 1997.
-.1
-.0
50
.05
.1
-.2 -.1 0 .1 .2Impact of Minimum Wage on Group
Fitted values % Change in Wages, 1997-2007
-.2
-.1
0.1
-.2 -.1 0 .1 .2Impact of Minimum Wage on Group
Fitted values % Change in Employment, 1997-2007
22
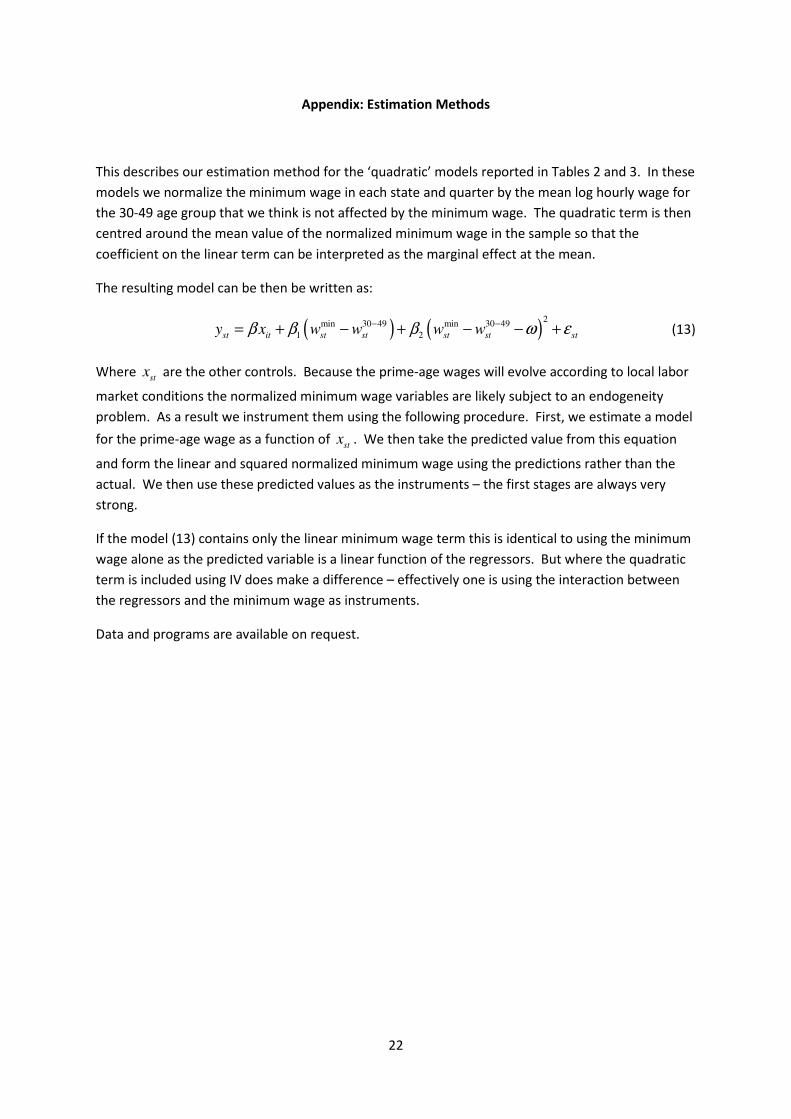
Appendix: Estimation Methods
This describes our estimation method for the ‘quadratic’ models reported in Tables 2 and 3. In these
models we normalize the minimum wage in each state and quarter by the mean log hourly wage for
the 30-49 age group that we think is not affected by the minimum wage. The quadratic term is then
centred around the mean value of the normalized minimum wage in the sample so that the
coefficient on the linear term can be interpreted as the marginal effect at the mean.
The resulting model can be then be written as:
( ) ( )2
min 30 49 min 30 49
1 2st it st st st st sty x w w w wβ β β ω ε− −= + − + − − + (13)
Where st
x are the other controls. Because the prime-age wages will evolve according to local labor
market conditions the normalized minimum wage variables are likely subject to an endogeneity
problem. As a result we instrument them using the following procedure. First, we estimate a model
for the prime-age wage as a function of st
x . We then take the predicted value from this equation
and form the linear and squared normalized minimum wage using the predictions rather than the
actual. We then use these predicted values as the instruments – the first stages are always very
strong.
If the model (13) contains only the linear minimum wage term this is identical to using the minimum
wage alone as the predicted variable is a linear function of the regressors. But where the quadratic
term is included using IV does make a difference – effectively one is using the interaction between
the regressors and the minimum wage as instruments.
Data and programs are available on request.
23
References
Aaronson, Daniel (2001) “Price pass-through and the minimum wage”, Review of Economics and
Statistics, 83, 158–69.
Aaronson, Daniel and Eric French (2007) “Product Market Evidence on the Employment Effects of
the Minimum Wage”, Journal of Labor Economics, 25, 167-200.
Allegretto, Sylvia A., Arindrajit Dube, and Michael Reich (2011) “Do minimum wages really reduce
teen employment? Accounting for heterogeneity and selectivity in state panel data”, Industrial
Relations, 50, 205–40.
Askenazy, Philippe (2014) “The Parameters of a National Minimum Hourly Wage”, IZA Policy Paper
No. 86.
Autor, David, Alan Manning and Christopher Smith (2015) “The Contribution of the Minimum Wage
to U.S. Wage Inequality over Three Decades: A Reassessment”, American Economic Journal
(Applied), forthcoming.
Belman, Dale and Paul J. Wolfson (2014) “What Does the Minimum Wage Do?”, Upjohn Institute for
Employment Research, Kalamazoo, Michigan.
Brochu, Pierre and David Green (2013) “The Impact of Minimum Wages on Labour Market
Transitions”, Economic Journal, 123, 1203-135.
Brown, Charles. (1988) "Minimum Wage Laws: Are They Overrated?" Journal of Economic
Perspectives, 2, 133-145.
Brown, Charles, Charles Gilroy, and Andrew Kohen (1982) “The effect of the minimum wage
on employment and unemployment”, Journal of Economic Literature, 20, 487–528.
Burdett, Kenneth, and Dale T. Mortensen, (1998) “Wage Differentials, Employer Size, and
Unemployment”, International Economic Review, 39, 257-73.
Butcher, Tim, Richard Dickens and Alan Manning (2012) “Minimum Wages and Wage Inequality:
Some Theory and an Application to the UK,” November 2012
Card, David E. and Alan B. Krueger (1995) “Myth and measurement: The new economics of the
minimum wage”, Princeton: Princeton University Press, 1995.
Chletsos, Michael & Giotis, Georgios P (2015) "The employment effect of minimum wage using 77
international studies since 1992: A meta-analysis," MPRA Paper 61321, University of Munich.
Congressional Budget Office (2014) “The Effects of a Minimum-Wage Increase on Employment and
Family Income”, Washington DC: CBO.
Direction générale du Trésor (2014) “Salaire Minimum Interprofessionnel de Croissance: Rapport du
Groupe d’Experts”, Paris : Direction générale du Trésor.
Doucouliagos, Hristos and T. D. Stanley (2009) “Publication Selection Bias in Minimum-Wage
Research? A Meta-Regression Analysis." British Journal of Industrial Relations, vol. 47, no. 2, pp.
24
406-428.
Dube, Arindrajut, Laura Giuliano and Jonathan Leonard (2015) “Fairness and Frictions: The impact of
unequal raises on quit behaviour”, unpublished.
Dube, Arindrajit, T. William Lester, and Michael Reich (2015) “Minimum Wage Shocks, Employment
Flows and Labor Market Frictions.” Journal of Labor Economics, forthcoming
Dube, Arindrajit and Ben Zipperer (2015) “Pooling Multiple Case Studies using Synthetic Controls: An
Application to Minimum Wage Policies” IZA Discussion Paper 8944 (March 2015)
Giuliano, Laura (2013) “Minimum Wage Effects on Employment, Substitution, and the Teenage Labor
Supply: Evidence from Personnel Data,” Journal of Labor Economics, 2013, 31, 155-194.
Harasztosi, Péter and Attila Lindner (2015) “Who Pays for the Minimum Wage?” UC Berkeley
Hirsch, Barry, Bruce E. Kaufman and Tetyana Zelenska (2015) “Minimum Wage Channels of
Adjustment”, forthcoming, Industrial Relations.
Hyslop, D. and S. Stillman (2007). "Youth minimum wage reform and the labour market in New
Zealand." Labour Economics, 14, 201-230.
Hyslop, D and Stillman, S. (2011), The Impact of the 2008 Youth Minimum Wage Reform, The
Department of Labour, Wellington.
ILO (2012) “Boosting jobs and living standards in G20 countries: A joint report by the ILO, OECD, IMF
and the World Bank”, http://www.oecd.org/g20/topics/framework-strong-sustainable-balanced-
growth/Boosting%20jobs%20and%20living%20standards%20in%20G20%20countries.pdf
Kramarz, Francis and Thomas Philippon (2001) “The impact of differential payroll tax subsidies on
minimum wage employment”, Journal of Public Economics, 82, 115-146.
Lee, David (1999) “Wage Inequality in the United States During the 1980s: Rising Dispersion or
Falling Minimum Wage?” Quarterly Journal of Economics, 114, 977-1023.
Leonard, Megan, Thomas Stanley & Hristos Doucouliagos, (2014). "Does the UK Minimum Wage
Reduce Employment? A Meta-Regression Analysis," British Journal of Industrial Relations, 52, 499-
520.
Low Pay Commission (2015) “National Minimum Wage: Low Pay Commission report 2015”, London:
Low Pay Commission.
Machin, Stephen, Alan Manning and Lupin Rahman (2003)“Where the Minimum Wage Bites Hard:
The Introduction of the UK National Minimum Wage to a Low Wage Sector”, Journal of the European
Economic Association, 1, 154-180
Manning, Alan (2003) “Monopsony in Motion: Imperfect Competition in Labor Markets”, Princeton:
Princeton University Press.
Manning, Alan (2011) “Imperfect Competition in Labour Markets”, in O.Ashenfelter and D.Card (eds)
Handbook of Labor Economics, volume 4, North-Holland: Amsterdam, 2011
25
Ministry Of Business Innovation And Employment (2014) “Minimum Wage Review, 2014”,
http://www.dol.govt.nz/er/pay/backgroundpapers/2014/Minimum-Wage-Review-MBIE-Report-
2014.pdf
Neumark, David , Ian Salas & William Wascher (2014) "Revisiting the Minimum Wage-Employment
Debate: Throwing Out the Baby with the Bathwater?," Industrial and Labor Relations Review, 67,
608-648.
Neumark, David, and William Wascher (1992) “Employment effects of minimum and subminimum
wages: Panel data on state minimum wage laws”, Industrial and Labor Relations Review, 46, 55–81.
Neumark, David, and William Wascher (2000) "Minimum Wages and Employment: A Case Study of
the Fast-Food Industry in New Jersey and Pennsylvania: Comment." American Economic Review, 90,
1362-1396.
Neumark, David, and William Wascher (2008) “Minimum Wages”. Cambridge, MA: MIT Press.
OECD (2004) “OECD Jobs Study”, Paris: OECD.
Pissarides, Christopher A. (2000) “Equilibrium Unemployment Theory”,. 2nd ed., Cambridge (MA):
MIT Press
O'Neill, Donal (2014) “Divided Opinion on The Fair Minimum Wage Act of 2013: Random or
Systematic Differences”, IZA Discussion Paper, No. 8601.
O'Neill, Donal and Nolan, Brian and Williams, James, (2006) “Evaluating the Introduction of a
National Minimum Wage: Evidence from a New Survey of Firms in Ireland” Labour, 20, 63-90.
Plunkett, James and Jeff Borland (2014) “Aussie Rules: A briefing note on Australia’s approach to the
minimum wage and lessons for UK policymakers”, London: Resolution Foundation.
Portugal, P. and Cardoso, A. R. (2006), “Disentangling the minimum wage puzzle: an analysis of
worker accessions and separations”, Journal of the European Economic Association, 4, 988–1013.
Reich, Michael , Ken Jacobs, Annette Bernhardt and Ian Perry (2015) “The Proposed Minimum Wage
Law for Los Angeles: Economic Impacts and Policy Options”, UC Berkeley ILRE, March 2015.
Schmitt, John (2013) “Why Does the Minimum Wage Have No Discernible Effect on Employment?”,
CEPR, February 2013.
Teulings, Coen N., 2000, “Aggregation Bias in Elasticities of Substitution and the Minimum Wage
Paradox”, International Economic Review; 41(2), May, pages 359-98.
CENTRE FOR ECONOMIC PERFORMANCE Recent Discussion Papers
1427 Decio Coviello Andrea Guglielmo Giancarlo Spagnolo
The Effect of Discretion on Procurement Performance
1426 Andrew B. Bernard Andreas Moxnes and Karen Helene Ulltveit-Moe
Two-sided Heterogeneity and Trade
1425 Stephen Machin Sandra McNally Martina Viarengo
“Teaching to Teach” Literacy
1424 Yatang Lin Where does the Wind Blow? Green Preferences and Spatial Misallocation in the Renewable Energy Sector
1423 Andrew B. Bernard Valerie Smeets Frederic Warzynski
Rethinking Deindustrialization
1422 Stefano Gagliarducci Marco Manacorda
Politics in the Family: Nepotism and the Hiring Decisions of Italian Firms
1421 Jordi Blanes i Vidal Marc Möller
Team Adaptation
1420 Andrew B. Bernard J. Bradford Jensen Stephen J. Redding Peter K. Schott
Global Firms
1419 Marco Manacorda Andrea Tesei
Liberation Technology: Mobile Phones and Political Mobilization in Africa
1418 Jeremiah Dittmar Ralf R. Meisenzahl
State Capacity and Public Goods: Institutional Change, Human Capital and Growth in Early Modern Germany
1417 Holger Breinlich Swati Dhingra Gianmarco Ottaviano
How Have EU’s Trade Agreements Impacted Consumers?
1416 Stefan Bender Nicholas Bloom David Card John Van Reenen Stefanie Wolter
Management Practices, Workforce Selection and Productivity
1415 Emanuel Ornelas Special and Differential Treatment for Developing Countries
1414 Markus K. Brunnermeier Luis Garicano Philip R. Lane Marco Pagano Ricardo Reis Tano Santos David Thesmar Stijn Van Nieuwerburgh Dimitri Vayanos
The Sovereign-Bank Diabolic Loop and ESBies
1413 Antoine Dechezleprêtre Elias Einiö Ralf Martin Kieu-Trang Nguyen John Van Reenen
Do Tax Incentives for Research Increase Firm Innovation? An RD Design for R&D
1412 Luis Garicano Luis Rayo
Relational Knowledge Transfers
1411 João Paulo Pessoa International Competition and Labor Market Adjustment
1410 Claudia Olivetti Barbara Petrongolo
The Evolution of Gender Gaps in Industrialized Countries
1409 Quoc-Anh Do Kieu-Trang Nguyen Anh N. Tran
One Mandarin Benefits the Whole Clan: Hometown Favoritism in an Authoritarian Regime
The Centre for Economic Performance Publications Unit Tel 020 7955 7673 Fax 020 7404 0612
Email [email protected] Web site http://cep.lse.ac.uk