Embed Size (px)
Citation preview
ISSN 2042-2695
CEP Discussion Paper No 1341
March 2015
Giving a Little Help to Girls? Evidence on Grade Discrimination and its Effect on
Students’ Achievement
Camille Terrier
Abstract This paper tests if gender-discrimination in grading affects pupils' achievements and course choices. I use a unique dataset containing grades given by teachers, scores obtained anonymously by pupils at different ages, and their course choice during high school. Based on double-differences, the identification of the gender bias in grades suggests that girls benefit from a substantive positive discrimination in math but not in French. This bias is not explained by girls' better behavior and only marginally by their lower initial achievement. I then use the heterogeneity in teachers' discriminatory behavior to show that classes in which teachers present a high degree of discrimination in favor of girls are also classes in which girls tend to progress significantly more than boys, during the school year but also during the next four years. Teachers' biases also increase the relative probability that girls attend a general high school and chose science courses.
Keywords: Gender, grading, discrimination, progress JEL codes: I21, I24, J16
This paper was produced as part of the Centre’s Education Programme. The Centre for Economic Performance is financed by the Economic and Social Research Council.
I would especially like to thank my advisor Marc Gurgand. This paper also benefited from discussions and helpful comments from Elizabeth Beasley, Anne Boring, Thomas Breda, Ricardo Estrada, Julien Grenet, Alexis Le Chapelain, Eric Maurin, Sandra McNally, Thomas Piketty, Steve Pischke, Corinne Prost, as well as participants at the Paris School of Economics Applied Economics Seminar, Third Lisbon Research Workshop on Economics, Statistics and Econometrics of Education, University College London RES PhD Conf, University of Southern Denmark Applied Micro Workshop, Sciences-Po Paris LIEPP Education Seminar, French Ministry of Education Workshop and European Doctoral Program in Quantitative Economics Jamboree. I am especially grateful to Francesco Avvisati, Marc Gurgand, Nina Guyon and Eric Maurin for sharing their dataset, as well as to the Direction de l'évaluation, de la prospective et de la performance (DEPP) of the French Ministry of Education for giving me access to complementary data used in this paper.
Camille Terrier , Paris School of Economics and Centre for Economic Performance, London School of Economics.
Published by Centre for Economic Performance London School of Economics and Political Science Houghton Street London WC2A 2AE
All rights reserved. No part of this publication may be reproduced, stored in a retrieval system or transmitted in any form or by any means without the prior permission in writing of the publisher nor be issued to the public or circulated in any form other than that in which it is published.
Requests for permission to reproduce any article or part of the Working Paper should be sent to the editor at the above address.
C. Terrier, submitted 2015.
1 Introduction
This paper is related to two puzzles in pupils' success at school. First, in most OECD countries, a
persistent achievement gap exists between boys and girls at the earliest stage of schooling. Boys
tend to outperform girls in mathematics, whilst the opposite is observed in languages (Fryer and
Levitt 2010, OECD 2009)1. Second, in many countries girls catch up with boys in mathematics
over the years, so that the aforementioned achievement gap vanishes. In French however, boys
do not catch up and girls tend to keep their advance. This opposite pattern implies that in
many countries, by the end of secondary school, girls outperform boys at school2. These puzzles
raise two questions: how to explain the early achievement gap between boys and girls ? Why
does it seem to vanish in math but persist in humanities?
This paper sheds new light on gender biases in teachers' grades and provides evidence on the
impact of such biases on pupils' progress. Gender gaps in achievement are of particular concern
since they might cause greater subsequent inequalities in tracks chosen, subjects of study at
university, and wages (Heckman et al. 2006). In an e�ort to understand the origins of these
gender inequalities, research has proven that teachers' stereotypes a�ect their pupils' success,
notably because stereotypes can bias teachers' assessment and grades (Bar and Zussman 2012,
Burgess and Greaves 2009, Hanna and Linden 2012). In mathematics, teachers have often been
thought to have negative stereotypes towards girls. Girls would be less competitive than boys,
less logical, less adventurous and would rely more on e�ort than on ability to succeed (Tiedemann
2000, Fennema and Peterson 1985, Fennema et al. 1990).
A number of papers have shown that girls bene�t from grade discrimination (Lindhal 2007,
Lavy 2008, Robinson and Lubienski 2011, Falch and Naper 2013, Cornwell et al. 2013). Most of
these results are based on a comparison between blind scores and teachers grades, a methodology
introduced in a seminal paper by Lavy (2008). Yet, there is no clear consensus in the existing
literature. Some papers �nd no gender discrimination (Hinnerich et al. 2011). Ouazad and
Page (2013) and Dee (2007) observe that gender discrimination depends on teachers' gender,
while Breda and Ly (2012) �nd that discrimination depends on the degree to which the subject
is �male-connoted�. Besides the inconclusive nature of this literature, most previous papers are
not able to disentangle a pure gender bias from a discrimination related to pupils' behavior.
Hence the risk of biased estimates due to omitted variables. A contribution of this paper is to
1International comparative studies of educational achievement provide evidence of this early gender gap. In
the 2011 TIMSS assessment of mathematical knowledge of 4th grade pupils, of the 24 countries with a statistically
signi�cant gender di�erence, 20 had di�erences favoring boys � among which the United States, Finland, Norway,
Austria, Korea, Germany and Italy. Regarding reading and writing, in nearly all of the 45 countries participating
to the PIRLS assessment, 4th grade girls outperformed boys in the reading achievement in 2011.2In math, TIMSS assessments have shown gender di�erences in achievement to favor boys on average at the
fourth grade, but to disappear or favor girls at the eighth grade, although the situation varies considerably from
country to country. On the contrary, recent research in the United States �nds that girls have an advantage in
reading at all grades from kindergarten through the eighth grade (Robinson and Lubienski 2011,), and PISA 2009
reports that 15-year-old girls perform consistently better in reading than boys (Machin and Pekkarinen 2008,
OECD 2009).
1
address this concern.
Another key question is whether grade discrimination a�ects pupils' progress. There is
very little research measuring the e�ects of gender biases on pupils' subsequent progress. All
prior research have focused on potential mechanisms through which discrimination could a�ect
progress. Jussim and Eccles (1992) study how teachers' expectations in�uence student achieve-
ment through self-ful�lling prophecies. Positive biases could also reduce `stereotype threats'.
The latter arise when girls or minority groups perform poorly for the sole reason that they fear
con�rming the stereotype that their group performs poorly (Steele and Aronson 1995, Ho� and
Pandey 2006). The apprehension it causes might disrupt women's math performance (Spencer et
al. 1999). Therefore, over-grading girls can reduce their anxiety to be judged as poor performers
when they undergo a math exam. Additionally, teacher-assigned grades have been proven to
a�ect students' math self-concept and interest (Trautwein et al. 2006, Marsh and Craven, 1997),
which can a�ect their achievement (Bonesronning, 2008). Finally, Mechtenberg (2009) provides
a theoretical model of how biased grading at school can explain gender di�erences in achieve-
ments3. The link between biased grading and pupils' achievement has long been an important
research question in education sciences, but not in economics. To my knowledge, this is the �rst
paper to provide empirical evidence on how grade discrimination a�ects pupils' progress over
the short and long-term, along with a contemporaneous and independent study by Lavy and
Sand (2015)4.
I use a rich student-level dataset produced by Avvisati et al. (2014). Three features make
this dataset unique. Firstly it includes two di�erent measures of a pupil's ability: a `blind' score
and a `non-blind' score. This enables me to identify the gender bias. 4490 pupils in 6th grade
were required to take a standardized test at the beginning and at the end of the year. These
tests were graded anonymously by an external corrector. They can be considered as blind scores
free of any teachers' stereotypes. In addition to these blind scores, grades attributed by teachers
were collected during the school year � hence non-blind and potentially a�ected by teachers'
stereotypes. As long as both blind and non-blind scores measure the same skills, the blind score
can be considered as the counterfactual measure to the non-blind score. A second advantage of
this dataset is that it contains extensive information on pupils' behavior in the classroom. This
allows me to disentangle grade favoritism related to gender from favoritism related to pupils'
behavior. Finally, the third key feature of these data is that we can follow pupils over time.
Blind scores are available at three di�erent periods: beginning and end of the 6th grade, and
end of the 9th grade. Information is also available on pupils' course choice during high school.
This gives me the unique opportunity to study the impact of gender discrimination on pupils'
progress (over the short and long-term) and course choice.
3School results are de�ned as a combination of talent and e�ort, the latter being the channel through which
grade discrimination could a�ect future cognitive achievement.4Lavy and Sand (2015) analyze a similar question by using the di�erence between teachers in the degree of
stereotypical attitude, and the conditional random assignment of pupils to classes to identify the e�ect of teachers'
attitudes on boys and girls progress separately.
2
I use a double-di�erences (DiD) strategy to identify the existence of gender biases in grades.
Discrimination is de�ned as the average gap between non-blind and blind scores for girls, minus
this same gap for boys. Prior research has used this method to estimate gender discrimination
(Falch and Naper 2013, Breda and Ly 2012, Lavy 2008, Goldin and Rouse 2000, Blank 1991).
Overall I �nd strong evidence for a substantial bias in favor of girls in math, representing 0.31
points of the s.d. No discrimination is observed in French. Controlling for pupils' punishment
does not a�ect signi�cantly the estimate so that the gender discrimination does not capture a
�good behavior bias�. However, controlling for pupils' achievement at the beginning of the year
slightly decreases the gender bias in math, due to the fact that girls perform lower than boys in
this subject, and that low performers tend to be favored by teachers. These results are robust to
a variety of alternative speci�cations that account for the fact that the blind and the non-blind
scores might not measure the same abilities, that they are not �lled in at the same date, and
�nally that girls might be more stressed than boys for national evaluations. These �ndings shed
new light on the role of girls' behavior in teachers' gender bias. They tend to con�rm existing
studies which �nd that girls are favored by teachers in math (Falch and Naper 2013, Breda and
Ly 2012).
Then, based on the preceding robust estimation of teachers' biases, I focus my analysis on
the e�ect of these biases on girls' progress and course choice, compared to boys. The identi�-
cation strategy, based on class level data, exploits the high variation in teachers' discriminatory
behavior: not all teachers favor girls, and among those who have a biased assessment of girls
relative to boys, some are more biased than others. Taking advantage of both this heterogene-
ity and the quasi-random assignment of pupils to teachers who discriminate, the identi�cation
stems from a comparison of the relative progress of girls (as compared to boys) in classes where
the teacher displays a high degree of discrimination, to the progress of girls in classes where the
teacher does not discriminate much.
The key �nding is that classes in which girls bene�t from a high degree of positive discrimi-
nation are also classes in which girls progress more (relative to boys) during the 6th grade and
over the long term. Girls perform initially lower than boys in math but catch up during the 6th
grade. I �nd that the reduction of this achievement gap between boys and girls is entirely driven
by teachers discriminatory behavior. Over the longer term, half of catching up is explained
by teachers' biases. Additionally, I �nd that gender discrimination a�ects girls course choice
compared to boys. Girls are relatively more likely to attend a general high school (rather than a
professional or technical one), and to chose scienti�c courses in high school. All together, these
results show that positively rewarding pupils has the potential to a�ect their progress and course
choice. This is consistent with two mechanisms mentioned in prior literature. In math, favoring
girls can reduce the stereotype threat they su�er from, and hence reduce their apprehension
when �lling in an exam. This could explain why, over the short term, biases a�ect girls' relative
progress in math but not in French, a subject in which girls might su�er less from stereotypes
threats. Positive biases can also a�ect girls' interest and self-con�dence in a subject. However,
3
my results tend to challenge Mechtenberg's (2009) theoretical predictions according to which,
due to their awareness of receiving biased grading, girls would be reluctant to internalize good
grades in math.
Taken together, these results build upon an important literature suggesting that teachers'
grades are biased. My �ndings con�rm the existence of such biases, but more importantly
they highlight that gender discrimination can have long-lasting e�ects on girls' human capital
accumulation relative to boys. I provide a new explanation for the fact that the achievement
gap vanishes in math but persists in French. This is particularly relevant for the ongoing debate
about policies aimed at promoting gender equality at school. Advocates of such policies usually
focus their argumentation on the fact that teachers' grades can be a source of inequalities at
school. My �ndings bring this argument one step further by highlighting that, over the long term,
teachers' biases can also play a large and lasting role in the reduction of the gender achievement
gap at school.
The article proceeds as follows. Section 2 presents the dataset and gives some descriptive
statistics. Section 3 de�nes a simple model of grade attribution, discusses the identi�cation of
gender discrimination in grades, and presents the results. Section 4 presents a model of pupils'
progress, discusses the identi�cation of the causal e�ect, and presents the results. Section 5
concludes.
2 Data
2.1 The dataset
I address the question of teachers' assessment bias by using a French dataset which contains
35 secondary schools, 191 classes, and 4490 pupils in 6th grade, hence 11 years old. Three
features of this dataset are particularly interesting for this study. First, this dataset provides
two di�erent sources of information on pupils' achievements. The �rst one is the score obtained
by students to a standardized test they complete at the beginning of the school year. This
test has been created by the French Education Ministry and is taken every year by all French
pupils who enter the 6th grade in order to assess their cognitive skills. It is identical across
schools and tests knowledge on French and mathematics. The important feature of this test is
that it is externally graded so that the grader has no information on the name, gender, social
background or school attended by pupils. Hence, these scores may safely be assumed to be free
of any bias caused by stereotypes from an external examiner. The second source of information
on children' achievement is provided by teachers' assessment of their own pupils. A pupil has
a di�erent teacher in each subject and all teachers report pupils' average grade on end-of-term
report cards. In this study, I focus on mathematics and French grades given during the �rst and
last term of the school year. In so far as teachers have permanent contacts with the pupils they
teach, these average grades may re�ect biases from teachers' gender stereotypes. Thus, I have
two di�erent scores that measure students' knowledge. I use the term "blind scores" to describe
4
test scores that have been anonymously graded. When grades have been given by teachers who
know pupils' gender and identity, I describe them as "non-blind scores"5.
The second interesting feature of this dataset is that it contains a rich set of measures of
pupils' behavior for each of the three school terms. I have information on whether pupils were
given an o�cial �disciplinary warning�, whether they were de�nitively excluded from the school,
temporarily excluded from the school or from the class, whether they were put in detention or
received blâmes6. Temporary exclusions signal violent behavior or repeated transgressions of
the rules. They are decided by the school head. All these sanctions can be cumulated by pupils.
The third key aspect of this dataset is that we can follow pupils over time: blind scores and
schooling decisions are available several years after the sixth grade. This enables me to estimate
the e�ect of the gender bias on pupils' progress and course choice. Regarding progress, a pupil's
achievement is measured by blind scores at the end of the 6th grade and at end of the 9th grades
(on top of the blind score given at the entrance of grade 6). The test completed at the end of
grade 6 is extremely similar to the one pupils take when they enter grade 6. The knowledge
tested are similar and the properties of this test are the same as described above : created by
the French Education Ministry, identical across schools, externally graded. Then, at the end of
grade 9, which is also the end of lower secondary school, all pupils have to take a national exam
to obtain the 'Diplome national du brevet'. This externally graded score constitutes the �nal
blind measure of pupils' ability in this study7. Finally, additionally to these scores, information
is available on pupils' schooling decisions and course choice in high school. The 9th grade
corresponds to the last grade of the lower (and compulsory) secondary school. After this grade,
pupils can chose between the vocational, technical or general training. For those who decide to
follow a general training, pupils have to specialize when they enter the 11th grade, by choosing
one of the three following options: sciences, humanities or economics and social sciences. I use
this information to estimate the e�ect of teachers' gender biases on three outcomes : pupils'
probability to undergo a general training, to follow scienti�c courses, and to repeat a grade.
Information on pupils' long-term outcomes comes from the statistical department of the French
ministry of education. It has been merged to the initial dataset. An analysis of the attrition is
done in section 4.4. Overall, respectively 18.9% and 19.6% of the French and math scores are
missing at the end of the 9th grade. For 20.9% of the pupils, we do not have information on
their course choice during the 11th grade.
5It is worth mentioning that the standardized tests are high-stakes for neither the students nor the teachers.
For students, they are a pure administrative evaluation aimed at reporting pupils' average achievement by schools
to the Ministry. For teachers, their evaluations or salaries do not depend on their pupils' results to these tests so
that they have no incentive to `teach to the test'. The standardized tests are also taken in the same conditions
as ordinary class exams: pupils �ll in the test in their usual classroom and their teacher gives the instructions.
Only the content of the tests di�er, an issue that I will discuss further in the paper.6Blâmes are o�cial warnings given by the school's administration when a pupil behaves badly in a repeated
way.7It is worth mentioning that contrary the 6th grade blind scores, the 9th grade score is high-stake for the
pupils.
5
Finally, the dataset contains information on teachers' gender, birth date and years of ex-
perience, as well as administrative information on children: gender, parents' profession, grade
retention and birth date. The schools included in this dataset are mostly located in deprived
areas. Therefore they are not representative of all French pupils, an issue that I will discuss in
a further section.
2.2 Descriptive statistics and balance check of attrition
The dataset contains 4490 pupils. The �rst column of table 1 presents descriptive statistics.
48.1% of the pupils in this sample are girls and 68.6% have low SES parents, which is consistent
with the fact that most schools in this study are located in the deprived administrative area of
Creteil. Regarding attrition, for 526 pupils (11.7%), one or more test score is missing during
�rst term so that the sample is unbalanced. Missing scores might be blind or non-blind scores,
in math or French. The sample of pupils with no missing grades in math and French contains
3964 observations � 4068 in math only and 4058 in French. In order to test if pupils with one or
more missing variables are di�erent from those with no missing variables, I implement a balance
check of the attrition and compare several characteristics across both groups of pupils. Results
are presented in table 1.
Pupils for which one or more test score is missing have di�erent characteristics from pupils
with no variable missing. They have systematically lower test scores in both blind and non-blind
scores. For instance, in French during �rst term, their blind score is on average 0.283 points
lower. There are also 7.9 percentage points fewer girls in the sample with missing variables, and
pupils' seem to have a slightly worst behavior. Parents belong less to high or low SES, hence we
can expect parents being more middle class.
Considering these di�erences, analyzing discrimination with the sole balanced sample is not
satisfactory. Although this sample allows comparing results obtained with the same subset of
pupils, it might yield results that su�er from a selection bias, hence being non-representative
of the whole sample. In the remaining of the paper, I systematically run regressions on both
samples: the sample of 3964 observations with no missing variable and the one with the maximum
number of observations (4490) but some variables missing. Every time results di�er, I will point
it out.
2.3 Descriptive statistics
Table 2 and density graphics present statistical di�erences between boys' and girls' scores. In
the remaining of the paper, all descriptive statistics and analysis are performed on standardized
test scores � mean zero and variance equal one. Standardization is done within score (blind and
non-blind), subject and term.
6
Graphics 1 and 2 display distributions of blind and non-blind scores during the �rst term
in French. In this subject, girls strongly outperform boys, and this premium is not a�ected
by the nature of the grade (blind or non-blind). As reported in table 2, girls' average score is
0.434 points higher than boys when the score is blind and 0.460 when it is non-blind. However,
the story is di�erent in mathematics. Figures 3 and 4 show that boys outperform girls when
grades are blind, but the opposite is observed when teachers assess their pupils. Hence, girls'
average score during �rst term is 0.147 points lower than boys when the score is blind but it is
0.170 points higher when it is non-blind. Graphically, a clear shift to the right of girls' score
distribution is observed (relative to boys) when comparing blind and non-blind scores in math.
Graphics 5 to 10 present girls' and boys' evolution of blind scores between the beginning
and the end of the 6th grade, hence capturing their relative progress. In math, the initial boys`
premium vanishes between the �rst and last term of the 6th grade. Girls progress more than
boys so that, by the end of the year, the average gap between boys' and girls' scores in math is no
more statistically signi�cant. Three years later, by the end of 9th grade, girls at the bottom of
the distribution are even performing better than boys. The average achievement gap represents
0.058 points and is in favor of girls. One of the objectives of this paper is to determine whether
part of this catching up is the result of encouragement generated by grade bias in favor of girls.
In French, no clear di�erence in progress between boys and girls is observed.
3 Gender discrimination in grades
3.1 Model of grade attribution
I de�ne a simple model to describe how blind and non-blind scores are attributed. The main
assumption of this model is that blind scores are free of any bias, and should only measure
pupils' ability, whereas non-blind scores can be a�ected by teacher's stereotypes towards boys
or girls. Hence, blind scores are modeled as a function of a pupil's ability only:
Bi = θ1i + εiB (1)
Here θ1i is a pupil's ability, Bi is a noisy measure of a pupil's ability, and εiB corresponds to
an individual random shock speci�c to blind scores. This might capture any e�ect that makes a
pupil overperform or underperform the day of the exam and can be interpreted as measurement
error. Non-blind scores can be a�ected by teachers' beliefs towards pupils' gender. Hence, they
can be modeled as a function of both ability and pupils' gender:
NBi = α0 + θ2i + α2Gi + εiNB (2)
Here θ2i is the pupil's ability that is measured by the non-blind test. Gi is a dummy variable
that takes the value 1 for girls. α2 is the coe�cient representing the potential gender related
7
discrimination. The constant α0 represents the average gap for boys between the non-blind
score and the ability (NBi − θ2i). εiNB is an individual shock speci�c to grades attributed
by teachers. This noise might capture pupils' behavior for instance. Finally, I allow θ1i and
θ2i to di�er, meaning that abilities measured by blind and non-blind scores might di�er. The
relationship between both abilities can be modeled as follows:
θ2i = ρθ1i + vi (3)
Where vi captures variables that potentially a�ect ability measured by class exams θ2i, once
controlled for ability measured by blind score θ1i. Any speci�c ability measured by class exams
but not by standardized tests, would be captured by vi. I discuss further in the next section the
importance of di�erentiating abilities measured by both tests. Ability measured by blind scores
(θ1i) might include pupils' long-term memory and their ability to synthesize knowledge acquired
in the last few months, while ability measured by non-blind scores (θ2i) might integrate more
short-term skills such as learning an exercise by heart and replicating it the day after for the
class exam. Any di�erence between θ1i and θ2i could bias the identi�cation of discrimination.
If the blind and the non-blind scores measure slightly di�erent abilities, and if boys or girls are
more endowed in one of these abilities, then the coe�cient α2 of gender would not only measure
a potential discrimination, but also the di�erence in ability distribution between boys and girls.
This way of modeling blind and non-blind scores is highly simpli�ed and relies on two im-
portant hypotheses. Firstly, I suppose a linear relation between non-blind scores, ability and
gender. Secondly, I assume that non-blind scores do not depend on blind scores in this spec-
i�cation. This hypothesis is likely to be satis�ed in our context because blind tests were not
corrected by teachers but by independent correctors.
The reduced form of this structural model is obtained by replacing θ2i by its formula in
equation (2):
NBi = α0 + ρθ1i + α2Gi + (εiNB + vi) (4)
Replacing θ1i by (Bi − εiB) gives the �nal reduced form:
NBi = α0 + ρBi + α2Gi + (εiNB + vi − ρεiB) (5)
It is worth mentioning that this model could be used to study other sources of discrimination.
For instance, biases in grades related to pupils' behavior, their academic level or their social
background could be studied by replacing Gi by other interesting variables in equation (5).
3.2 Identi�cation strategy for discrimination
To identify a potential gender bias in grades, I �rst use a double-di�erences strategy. This
methodology has been introduced in a seminal paper by Lavy (2008) and widely used by later
papers to estimate discrimination: Falch and Naper (2013), Breda and Li (2012), Goldin and
Rouse (2000) and Blank (1991). The strategy consists of estimating the di�erence between
8
boys' and girls' average gap between the non-blind and the blind scores. In the absence of
teachers' biases in grades, and under the assumption that both tests measure the same abilities,
the di�erence between the non-blind score and the blind score should be the same for boys and
girls. This corresponds to the common trend identi�cation hypothesis. Implementing a double
di�erence controls for the average e�ect of non-blind grading on scores, for the average e�ect
of being a girl on score, so that what the double di�erence captures is the speci�c e�ect of the
grade being non-blind on girls scores, relative to boys.
One of the advantages of the reduced form equation (5) is that it is compatible with an
identi�cation based on double-di�erences, provided that the following assumptions are made:
blind and non-blind scores are assumed to measure the same abilities, so that θ2i = θ1i = θi.
In equation (5) this is equivalent to ρ = 1 and vi = 0. This hypothesis is often implicitly made
in other papers. I make it clear here, and will discuss its robustness in a further section, by
analyzing the identi�cation of discrimination in the more general setup where both tests do not
measure the same abilities. To begin with, I consider this assumption as valid, so that equation
(5) is equivalent to the usual double-di�erences equation:
NBi −Bi = α0 + α2Gi + (εiNB − εiB) (6)
A more common formulation of this DiD speci�cation is written below. The estimates ob-
tained for discrimination are similar but equation (7) has the advantage of providing coe�cients
for the gender e�ect and the non-blind e�ect:
Scoin = α+ βGi + γNBi + α2(Gi ∗NBi) + πc + εin (7)
Here Scoin is the grade received by a pupil when the nature of scoring is n (n=1 for non-
blind and 0 for blind). Hence, for each pupil, this dependent variable is a vector of both blind
and non-blind grades received. Gi is a dummy variable equal to 1 if the pupil is a girl. NBi
is a dummy variable equal to 1 if the score has been given non-anonymously by a teacher.
The coe�cient I am interested in is the coe�cient α2 of the interaction term which identi�es
gender discrimination. Finally, πc is a class �xed-e�ect aimed at capturing elements a�ecting
grades in a given class: teachers' severity for instance, or student/teacher ratio, peers e�ects. . .
In further speci�cations, additional control variables will be added such as pupils' behavior,
parents' profession, or pupils' initial level.
3.3 Empirical results on discrimination
Table 3 presents the coe�cient estimates of equation (7). Two di�erent regressions are
run in math (columns 1 and 3) and French (columns 2 and 4). In all speci�cations, standard
errors are estimated with school level clusters to take into account common shocks at the school
level. I �nd that in math, the coe�cient of the interaction term Girl*Non-Blind is high and
9
signi�cant - 0.31 points of the s.d - meaning that girls bene�t from a positive discrimination in
this subject. This result suggests that the extent of the bias is important: girls' non-blind scores
are on average 6.2% higher than boys in math during �rst term due to discrimination. Using
the balanced sample or the full sample does not change the results much. In addition, in French
the coe�cient of the interaction term is neither high nor signi�cant, meaning that no gender
bias is observed in this subject.
These results con�rm up to a point what Lavy (2008) observes in his analysis: in opposition
to what common beliefs about girls' discrimination would predict, the biases observed are in
favor of girls. Similarly, Robinson and Lubienski (2011) �nd that teachers in elementary and
middle schools consistently rate females higher than males in both math and reading, even when
cognitive assessments suggest that males have an advantage. Contrary to both previous studies,
I �nd a bias only in math and not in all subjects. The results of Breda and Ly (2012) are
also consistent with my estimates. They �nd that discrimination goes in favor of females in
more �male-connoted� subjects (e.g Math). Results decomposed by teachers' characteristics are
provided in Appendix A.
I try now to understand why the gender bias is in favor of girls. Any characteristics of pupils
that would in�uence teachers' grades and would not be equally distributed between boys and
girls, could potentially explain teachers' bias in favor of girls. Typically, pupils' behavior in the
class, pupils' initial achievement or having repeated a grade are three characteristics that could
(consciously or not) in�uence teachers' attributed grades and are di�erent for boys and girls. I
successively test if each of these three characteristics explains the bias in favor of girls.
Controlling for pupils' behavior. If a bad behavior in�uences teachers' assessment (con-
sciously or not), since boys behave worse than girls, this could a�ect the gender bias.8 As far
as I know, previous studies were not able to disentangle the `pure' gender discrimination from
a discrimination related to girls' better behavior than boys.9 This is one of the contributions of
this paper.
I create a variable �Punishment� that is a proxy for a pupil's bad behavior. It takes the value
1 if a pupil has received a disciplinary warning from the class council during �rst term or if he/she
was temporarily excluded from the school. During the �rst term 8% of pupils received at least
one sanction: 6.2% received a disciplinary warning and 3.6% were temporarily excluded from the
school. Boys are punished more than girls: among pupils having at least one sanction during the
�rst term, 85% are boys. Several schools did not provide information on their pupils' behavior,
so that the punishment variable is missing for many pupils. Therefore, following regressions will
8In equation (6), without any controls for pupils' punishment, the latter would enter the error term, and would
be correlated with the gender variable.9Cornwell et al. (2013), using data from the 1998-99 ECLS-K cohort of primary school pupils, take into account
pupils' non cognitive skills to explain why "boys who perform equally as well as girls on reading, math and science
tests are graded less favorably by their teachers." More speci�cally, the authors use teachers' reported information
on how well a pupil is "engaged in the classroom" and �nd that controlling for this variable signi�cantly reduces
or completely removes the bias in teachers' grades, depending on pupils' ethnicity and the grade considered.
10
focus on the sample of 2269 pupils for which punishments are non-missing10. This sample being
di�erent from the previous one, I run a balance check to verify if pupils' characteristics di�er. No
signi�cant di�erences are found regarding the blind score, non-blind score, gender and parents'
profession.11
Results are presented in table 4, column 2. Regressions are run in math only, where gender
discrimination is observed. To ensure that coe�cient comparisons are based on the same sample,
column 1 presents results of the standard DiD regression implemented on the new sample. The
coe�cient for discrimination decreases when I control for pupils' behavior, but the drop is very
small: the point estimate goes from 0.327 to 0.317. This suggests that in math, the gender
discrimination I observe cannot be explained by girls' better behavior than boys.12
Controlling for pupils' initial achievement. The second hypothesis I test is whether dis-
crimination in favor of girls partially captures two potentially related e�ects: (1) some teachers'
might give more favorable grades to low-achievers and (2) in some classes the variance of teach-
ers' grades might be smaller than the variance of the standardized scores. Firstly, some teachers
might behave di�erently towards low-performers, and potentially give them higher grades than
expected by their ability. If this is the case, since girls perform lower than boys in math, what
I interpret as gender discrimination could partially capture a `low-achiever' positive discrimina-
tion. Secondly, some teachers might have a lower dispersion of their grades than the dispersion
of the standardized scores. For a given dispersion of blind scores in a classroom, reducing the
dispersion of non-blind scores will improve the non-blind score of the weakest in the class, rela-
tively to the scores of the best pupils. Again, since girls have initially lower scores than boys in
math, a teacher who prefers a reduced dispersion of his grades will advantage girls compared to
boys.
To test these hypotheses, I �rst add controls for pupils' initial position in the blind grade
distribution. The new speci�cation includes dummy variables indicating whether pupils belong
to the lowest or highest decile of the blind score distribution. Scores are decomposed into deciles
within each subject and within class, meaning that pupils are ranked relatively to other children
in their class. Column 4 in table 4 presents results when a variable controlling for low achievers
is included (pupils below the 1st decile) and column 5 presents results with variables controlling
for both low and high achievers (pupils above the 9th decile). The point estimate of the gender
bias decreases by 7.5% when controls for low achievers are added to the regression � from 0.318
10The sample is the full sample, minus the pupils with a missing punishment11Even if schools which do not provide information on sanctions are the one with the worst behaved students,
my results will be a lower bound of the e�ect of pupils' behavior on the gender bias.12A variable that controls for pupils' bad behavior is included but girls' behavior might also a�ect non-blind
scores through more di�use aspects (Cornwell et al. 2013): how they behave in the classroom, how often they
answer questions, the diligence they show in their work. I consider that these elements will not bias the results
as long as they are a component of my de�nition of girls. In this case, the coe�cient for gender discrimination
captures some characteristics that are intrinsically linked to girls.
11
to 0.294 - suggesting that part of the gender bias in math captures an encouragement towards
low-achiever. The gender bias coe�cient further decreases (by 9.1% in total) when a dummy
variable for high achievers is added.13
Controlling for pupils' grade repetition. The third characteristic which might in�uence
teachers' grades and is not equally distributed for boys and girls is grade repetition. Among
pupils who have repeated a grade, 62.2% are boys. As previously, I include a dummy for grade
repetition in the regression. Results are presented in column 6 of table 4, and suggest that grade
repetition does not explain the positive bias in favor of girls14.
3.4 Robustness checks
3.4.1 Are both tests measuring the same abilities?
The DiD speci�cation discussed above rests on the restrictive assumption that both tests measure
the same abilities. However, if blind and non-blind scores do not measure exactly the same
abilities, and if these skills are not equally distributed between boys and girls, then failing to
take it into account will yield biased DiD estimates of gender discrimination. In equation (6),
the coe�cient α2 which I interpret as discrimination would partly capture girls or boys speci�c
ability in blind or non-blind scores. In this paper, I am careful about this concern since blind
tests are standardized tests created by the French Education Ministry, while non-blind grades
correspond to the average mark given every term by the teacher. They might measure slightly
di�erent abilities.
A way to test if both scores measure the same abilities is to directly estimate the reduced
form equation (5) in which no restrictive assumption is imposed on abilities, and to verify if the
coe�cient ρ is signi�cantly di�erent from one. If not, both tests can be assumed to measure
abilities which are perfectly correlated and DiD estimates can safely be assumed to be unbiased.
Due to measurement error, instrumental variables are used for this estimation. The method is
fully detailed in Appendix B.
As reported in table 13 of Appendix B, the IV estimate of the coe�cient of interest α2
equals 0.339 in math and 0.080 in French, which is very similar to the coe�cient obtained
by implementing DiD on the balanced sample � 0.323 and 0.043 respectively. This con�rms
my results suggesting a bias in teachers' grades in favor of girls. Additionally, the purpose of
this estimation is to check whether both tests measure abilities which are perfectly correlated,
13As a second test, I run the regression on pupils' rank instead of pupils' test scores. Teachers' narrower or larger
dispersion of their grades does not a�ect their pupils' ranking within the class. Hence running DiD regressions
with pupils' rank as a dependent variable is a mean to control for teachers' smaller/larger variance of grades.
Table 5 displays the coe�cients of these regressions, which I run on the initial whole sample containing 8329
observations in math and 8315 in French. Coe�cients are consistent with previous conclusions: the interaction
term equals -2.2 in math, meaning that girls' average rank decreases by 2.2 when they are assessed by their
teacher � going from 22 to 19.8 for instance.14Finally, I test whether parents' profession has an impact on discrimination and �nd no signi�cant e�ect of
pupils' social background.
12
in other words if the IV coe�cient of the blind score is equal to one. This coe�cient ranges
from 0.964 in French to 1.090 in math and in both cases I cannot reject the hypothesis that
ρ = 1. This result suggests that the blind and non-blind tests measure skills that are perfectly
correlated, and hence that implementing double-di�erences gives unbiased estimates of a gender
bias. Hence, for further analysis, the DiD speci�cation will be used.
Finally, in the reduced form presented above: NBi = α0 + ρBi + α2Gi + (εiNB + vi − ρεiB),
I show in Appendix C that we can estimate how the OLS downward bias on ρ a�ects the
estimation of our coe�cient of interest α2. Using the omitted variable bias formula, we can
easily show that the OLS downward bias on ρ creates a downward bias on α2 in math, but an
upward bias on α2 in French. This implies that the OLS estimate of α2 is a lower bound in
math. It remains high and signi�cant (equal to 0.264 in math and 0.172 in French) as reported
in table 13. This con�rms that in math a substantial bias exists in favor of girls. In French,
the coe�cient should be interpreted more carefully. The OLS estimate is an upper bound of the
gender bias. It suggests a positive e�ect, but any other method aimed at reducing the bias (IV
or DiD) do not �nd any signi�cant gender bias.
3.4.2 Could girls progress more than boys between the date of the blind test and
the date of the non-blind?
Pupils take the standardized blind test during one of the �rst days of the school year whereas
teachers' assessment is an average of several grades given by teachers during the �rst term. Since
the �rst term lasts three months, this average of several grades measures a pupils' average ability
about one and a half month after the beginning of the school year. This time lag between the
date of the blind and non-blind scores might be problematic if girls tend to progress more than
boys during this period. In particular, if teachers' biases in math appear early in the school year,
it might a�ect girls' progress from the �rst weeks of the school year. In this case, the coe�cient
which I interpret as a gender bias in math would be an upper bound for the true gender bias.
To address this concern, I use the data that have been collected at the end of the academic
year. Fortunately, the same scores have been collected - standardized tests and teachers' given
grades � but the time lag is reversed during the last term. Pupils take the standardized blind
test during one of the last days of the school year, while teachers' assessment is an average of
several grades given by teachers during the three last months. Hence, the blind test is taken
after the non-blind test. Under the same assumption that girls tend to progress more than boys
during this period, my estimates of gender discrimination during the third term would be a lower
bound. Computing the lower and upper bound of the estimates enables us to �nd a plausible
interval for the gender bias.
I run the same DiD regression as before but with the third term scores. Then I compare the
estimates obtained during �rst term (upper-bound) and last term (lower bound). The results
13
are displayed in table 6. The same full sample is used for both regressions. Consistent with the
hypothesis that girls progress more than boys in math, the third term coe�cient (0.259) is lower
than the �rst term coe�cient (0.318). The true value of gender discrimination is likely to be
between 0.259 and 0.318.
3.4.3 Could girls be more a�ected by some unobserved shocks ?
The simple model de�ned in section 3 contains three unobserved shocks: (1) εiB corresponds to
an individual shock speci�c to blind scores, (2) εiNB corresponds to an individual shock speci�c
to non-blind scores and (3) vi captures any speci�c ability measured by class exams but not
by standardized tests. The DiD estimates rest on the assumption that these shocks are equally
distributed for boys and girls15. However, if girls are systematically more stressed than boys
for standardized tests16, if they tend to be less e�ective than boys in environments that they
perceive as more competitive (Gneezy et al 2003), if they tend to attach more importance to
national evaluations, or if they are more endowed in speci�c abilities measured by class exams17,
the restrictive assumption would be violated and the DiD estimates could be biased.
To take these shocks into account, I run triple-di�erences (Breda et al, 2013) which rest on
the following intuition: if girls systematically under-perform (or over-perform) for standardized
tests because of an unobserved shock and if this shock is equally distributed between subjects,
then girls should also have a lower blind than non-blind score in French. I do not observe
this. In French, the gap between the blind and non-blind score for girls is the same as the
one for boys. Comparing the coe�cient for discrimination in math and French, as I do here,
is equivalent to implementing within-gender between-subjects regressions � or triple di�erences.
This is a mean to control for any unobserved shock or characteristics that di�er across gender
but are assumed to be constant between subjects. Typically, triple di�erences allow vi to be
distributed di�erently for boys and girls, but within gender vi must be constant between French
and math18. The coe�cient for relative discrimination obtained with this method corresponds
to the coe�cient in math minus the one in French, hence 0.291 for the whole sample. I still
15In mathematical terms, this means that E(εiNB |Gi = 1) = E(εiNB |Gi = 0), E(εiB |Gi = 1) = E(εiB |Gi = 0)
and E(vi|Gi = 1) = E(vi|Gi = 0).16If girls are more stressed than boys for standardized tests, they would tend to under-perform in this kind of
examination. My coe�cient of discrimination would be an upper bound for true gender discrimination. However,
a higher stress is unlikely because both tests are taken in the same conditions. Pupils take the standardized
test and their class exam in the same classroom where they sit usually, and it is their teacher who gives the
instructions. What is more, standardized tests are not high-stakes for the students. A pupil's test result is not
accounted for to compute his/her end of term average score.17These abilities could recover short-term memory or learning an exercise by heart and replicating it the day
after for the class exam. McNally and Machin (2003) also suggest that the mode of assessment could a�ect the
gender achievement gap.18In mathematical terms, this means that E(vi,french|Gi = 1) = E(vi,math|Gi = 1) and E(vi,french|Gi = 0) =
E(vi,math|Gi = 0). This within-pupil between-subjects method controls for any characteristic speci�c to girls
that potentially a�ect teachers' biases: the fact that girls behave better, might be more attentive, more serious,
more diligent.
14
conclude that a positive bias exists in math in favor of girls.
4 Impact of discrimination on pupils' progress
The results on gender discrimination pave the way for a new set of questions related to the impact
of discrimination on pupils' subsequent achievement and subject choices at school. Positively
discriminating students might encourage them to make more of an e�ort, and hence to increase
their scores. Reversely, if achievement and e�orts are substitutes, some students bene�ting from
positive discrimination could provide less e�ort, as they consider that they are good enough
(Benabou and Tirole, 2002). The dataset I use has the bene�t of containing blind scores at
three di�erent periods in time - at the beginning and at the end of the 6th grade, and at the
end of 9th grade - as well as information on pupils' subject choices during 11th grade.
4.1 Comparisons of girls and boys progress
Figures 11 and 12 plot the distribution of boys and girls progress between the �rst and the
last term of grade 6, while graphics 13 and 14 plot the progress between 6th grade and 9th grade
- over the entire lower secondary school. I de�ne progress as the di�erence between the blind
score at the �nal period and the blind score at the beginning of 6th grade19.
Graphically, there is clear evidence that girls progress more than boys in mathematics,
whereas progress in French is similar. As reported in table 7, in math during the �rst term
of 6th grade, girls' average score was 0.075 points below the mean. It is only 0.021 points below
the mean during the last term, and becomes 0.029 points above the mean by the end of the
9th grade - hence a total increase of 0.104 points of the s.d. Since girls' blind scores were lower
than boys' at the beginning of 6th grade, the fastest progress experienced by girls reduces the
gap between boys and girls blind scores. This catching up of girls in math raises the question
of the link between the positive bias in grades I observe in their favor in this subject and their
subsequent higher progress.
4.2 Model of pupil's progress
I de�ne a simple model aimed at isolating the e�ect of teachers' biased assessment on pupils'
progress. To begin with, I will keep the model as general as possible so that discrimination could
be considered towards any group of pupils. The main issue when evaluating the impact of grade
discrimination on a pupil's progress is to disentangle the pure e�ect of grade biases from several
other determinants that might explain a pupil's high or low progress: how much of the progress
19The di�erence between the blind score at the end of the 6th grade and the one at the beginning of 6th grade
can be interpreted as a pupil's progress because both standardized tests measure the same abilities. They are
designed by the French Ministry of Education and aimed at measuring the same abilities at two di�erent periods
in time.
15
is due to discrimination? How much is due to speci�c characteristics of the discriminated group?
For instance, girls might have an intrinsic tendency to progress more than boys over the school
year, without any discrimination. Similarly, low-achievers might have an initial higher propensity
to progress than high-achievers, again independently from any discrimination. Finally, I want to
take into account the fact that some teachers are more able than others to make their entire class
progress. Especially, biased teachers might share characteristics that make their pupils progress
more. The following model aims at isolating these various determinants of pupils' blind scores
evolution over the school year. Equation (8) below describes blind scores during �rst term (as
de�ned in section 2.1), while equation (9) describes blind scores during the third term (or any
later period20):
B1i = θ1i + εB1i (8)
B3i = θ3i + εB3i (9)
For the remaining of the model, all variables and parameters for third term are indexed by
3. A pupil's ability has changed between the �rst and the last term. I model third term ability
as a function of the three e�ects I want to disentangle: the e�ect of discrimination, a pupil's
independent tendency to progress compared to the others and a teachers' e�ect on progress:
θ3i = δθ1i + αGi + µiTi + βD1i + ωi (10)
Third term ability θ3i depends on three potential e�ects: (1) a discrimination e�ect caused by
teachers' biased assessment of their pupils: βD1i, where D1i corresponds to grade discrimination
during �rst term. Its impact on pupils' third term ability is measured by the coe�cient β. It
is important to understand that this coe�cient captures several channels through which grade
biases can a�ect a pupil's third term score. Motivation or discouragement are direct channels,
but e�ort is also an important channel, as well as change in self-con�dence and reduction of
stereotypes threats. I will not be able to distinguish between these di�erent channels, that
are all captured by the coe�cient β. (2) Second, third term ability θ3i also depends on the
independent tendency to progress of the discriminated group, relatively to other pupils. This is
captured by the coe�cient α. In this general model, Gi is a dummy variable that equals one
for pupils belonging to the discriminated group. In a model where only gender discrimination
is considered, Gi would correspond to a girl dummy. (3) Finally, a pupil's progress is a�ected
by his/her teacher's ability to make the entire class progress, where Ti is a teacher dummy.
Compared to the model of discrimination presented in section 3, I assume here that the blind
and non-blind tests measure the same abilities during the �rst term. This assumption is based
on results obtained in the �rst part. Following the �rst robustness check, I could not reject the
hypothesis that both scores are measuring skills that are perfectly correlated.
20For the sake of simplicity, I model the progress between the �rst and last term of grade 6, but the same
model remains valid for progress between the beginning of the 6th grade and any later period.
16
In equation (10), I replace the coe�cient for discrimination D1i by NB1i − θ1i, which corre-
sponds to the di�erence between a pupil's ability and the non-blind grade attributed by his/her
teacher during the �rst term. This corresponds to discrimination during the �rst term. Equation
(10) becomes:
θ3i = δθ1i + αGi + µiTi + β(NB1i − θ1i) + ωi (11)
By replacing θ3i by its expression in equation (11) I obtain:
B3i = δθ1i + αGi + µiTi + β(NB1i − θ1i) + ωi + εB3i (12)
Finally, replacing θ1i by its equation gives the following reduced form of the model:
B3i = (δ − β)B1i + βNB1i + αGi + µiTi + [ωi + εB3i + (β − δ)εB1i] (13)
This reduced form equation isolates the e�ect of discrimination β, the discriminated group's
independent tendency to progress α, and µi the teacher's e�ect. By rewriting it as below, the
interpretation of the coe�cients becomes straightforward: once controlled for a pupil's ability
B1i, for a group tendency to progress Gi, and for a teacher's average e�ect Ti, the coe�cient β
of the di�erence between non-blind and blind scores captures the e�ect induced by the fact that
a pupil receives a grade higher than expected by his/her ability:
B3i = δB1i + β(NB1i −B1i) + αGi + µiTi + (ωi + εB3i + (β − δ)εB1i) (14)
4.3 Identi�cation of girls' relative progress due to grade biases
The model de�ned above is compatible with any kind of grade discrimination (related to gender,
ethnicity, achievement, behavior. . . ). To build upon the results found in part 1, I will focus
now on the identi�cation of girls progress (relative to boys) due to gender discrimination only.
Therefore, in equation (14), the group dummy Gi becomes a dummy for girls. The term discrim-
ination will always refer to gender biases in the rest of this section. The identi�cation strategy is
based on the observation that not all teachers discriminate, and that among teachers who have
a biased assessment of girls compared to boys, the degree of the bias also di�ers across teachers,
with some teachers discriminating more than others. I take advantage of this heterogeneity in
the degree of discrimination to implement a between-class analysis. It is the variance in teach-
ers' discriminatory behavior that will identify the causal e�ect of teachers' biased assessment
on pupils' achievement21. Graphically, this variance is represented by the horizontal axis of the
graphics 15 and 16. We want to test if classes in which girls bene�t from a high degree of dis-
crimination (relatively to boys) are also classes in which girls progress more (relatively to boys).
This identi�cation strategy can be seen as a DiD strategy, where the treatment corresponds to
21Lavy and Sand (2015) use a similar method to identify the e�ect of teachers' stereotypical attitudes on boys
and girls progress separately.
17
discrimination towards girls in some classes and the outcome is girls average third term blind
score compared to boys.
It is worth mentioning that the impact of gender discrimination I estimate with this spec-
i�cation captures di�erent elements. Teachers that tend to favor girls in their grades are also
likely to have a behavior towards girls that di�ers from teachers who do not have biased grading.
Typically, they might be more encouraging, friendlier, focus more attention on girls, or be less
critical. The e�ect of gender discrimination on progress will capture all these e�ects. Even
without being able to separately identify these elements, it is interesting to know if teachers'
biased behaviors � with all elements it embeds � have an impact on girls' progress relative to
boys.
Graphics 15 and 16 provide a good insight into this question. For each class in the sample,
these graphs display the discrimination coe�cient and girls' progress relative to boys during the
6th grade. The discrimination coe�cient is de�ned as the class average di�erence between the
non-blind and the blind scores for girls, minus this same di�erence for boys. It corresponds to
the estimate of gender discrimination obtained with the DiD in part 1. Girls' progress relative
to boys is measured as the di�erence between their blind score at the end of the year and this
blind score at the beginning of the year, minus this same di�erence for boys. Graphically, there
is clear evidence of a positive correlation between the degree of discrimination and the degree of
progress, and this is true in both French and math. It is also interesting to see that in part 1, the
results suggest that on average there is no discrimination in French. Graphic 16 clearly shows
that despite this null average, there is an important variance in teachers' biased assessments,
which might yield girls' higher or lower progress in these classes.
The identi�cation strategy is based on the comparison of mean scores between classes. Based
on equation 14, this requires aggregating scores at the class level for both girls and boys22 and
22 All variables are averaged conditionally to being a girl and having teacher Ti. Within a class, girls' average
third term blind score is given by:
E(B3i/Ti, Gi = 1) = δE(B1i/Ti, Gi = 1) + βE(NB1i −B1i/Ti, Gi = 1) + αE(Gi/Ti, Gi = 1)
+µiE(Ti/Ti, Gi = 1) + E(ωi/Ti, Gi = 1) + E(εB3i/Ti, Gi = 1) + (β − δ)E(εB1i/Ti, Gi = 1)
Symmetrically, boys' average score within a class is given by:
E(B3i/Ti, Gi = 0) = δE(B1i/Ti, Gi = 0) + βE(NB1i −B1i/Ti, Gi = 0) + αE(Gi/Ti, Gi = 0)
+µiE(Ti/Ti, Gi = 0) + E(ωi/Ti, Gi = 0) + E(εB3i/Ti, Gi = 0) + (β − δ)E(εB1i/Ti, Gi = 0)
18
calculating the di�erence in progress between boys and girls in class c23:
(B3G −B3B)c = α+ δ(B1G −B1B)c + β[(NB1G −B1G)− (NB1B −B1B)]c + (ωG − ωB)c (15)
Equation 15 corresponds to the equation aggregated at the class level which I want to estimate
to identify the e�ect of gender discrimination on progress. It is speci�ed as a di�erentiation
between boys and girls average scores at the class level, so that teachers' e�ects disappear; they
a�ect similarly boys and girls within a class. The double di�erence at the right hand side of
the equation corresponds to the coe�cients for gender discrimination estimated in section 3 of
the paper � although here there is one coe�cient per class24. The coe�cient β identi�es the
e�ect of being assigned a teacher who discriminates girls more or less � relatively to boys � on
girls' average third term blind score � relative to boys � once I control for the initial average
di�erence between boys and girls' blind scores. This coe�cient can be seen as a causal e�ect
under the assumption that girls' assignment to a teacher who discriminates is quasi-random. In
other words, being assigned a teacher who discriminates is independent from girls' unobserved
characteristics ωi that make them potentially progress more than boys, once their initial level
is controlled for. I use the term quasi-random to describe the fact that pupils' assignment to
teachers is not done through a proper lottery. Yet, an arbitrary assignment of girls with high
predicted progress to teachers who discriminate is highly plausible for several reasons. Firstly,
pupils considered in this study are in 6th grade, which corresponds to the �rst year of lower
secondary school. When deciding the composition of classes, school heads and teachers have
very little information on these new pupils, in particular it is very unlikely that they can predict
their progress, and therefore in�uence their assigned class and teacher. Secondly, assigning
teachers who discriminate to girls who have a high probability to progress more than boys
would necessitate that school heads know who the teachers are who discriminate girls, which is
again unlikely.
Although it is not possible to test this independence assumption, I test if the assignment to a
teacher who discriminates is independent from boys and girls observed characteristics. To do so,
I �rst regress the discrimination coe�cient (de�ned at the class level in both French and math)
on pupils' gender and �nd no signi�cant e�ect: girls are not more assigned to teachers with a
high bias than boys. This is true in French and math. Then, for both boys and girls separately,
23 Where to simplify notations:
B3G = E(B3i/Ti, Gi = 1), B3B = E(B3i/Ti, Gi = 0)...
ωG = E(ωi/Ti, Gi = 1) + E(εB3i/Ti, Gi = 1) + (β − δ)E(εB1i/Ti, Gi = 1)
ωB = E(ωi/Ti, Gi = 0) + E(εB3i/Ti, Gi = 0) + (β − δ)E(εB1i/Ti, Gi = 0)
24It is also worth noticing that in equation 15, assuming δ = 1 transforms it into a standard DiD equation:
(B3G −B3B)c − (B1G −B1B)c = α+ β[(NB1G −B1G)− (NB1B −B1B)]c + (ωG − ωB)c
where the coe�cient β obtained corresponds to the slopes of regressions lines displayed in graphics 16
and 17. For the remainder of the analysis, I use equation 15 which requires less restrictive assumptions.
19
I successively regress the discrimination coe�cient (in math and in French) on the following
set of variables : having upper class parents, having lower class parents, having repeated a
grade. I �nd that these observed characteristics are independent from being assigned a teacher
with a high level of bias. The only exception is that boys with upper class parents are slightly
less likely to be assigned a teacher who discriminates in math, and that girls having repeated
a grade are less likely to be assigned a teacher who discriminates in French. Finally, I argue
that being assigned a teacher who discriminates is independent from girls' and boys' averaged
random shocks a�ecting blind scores during �rst and last term. As long as these shocks recover
pure testing noise � being ill the day of the exam for instance - it is plausible that they are
independent from teachers' assignment 25.
This between-class comparison has three advantages compared to an estimation of parame-
ters with individual observations based on equation 13. First, comparing classes rules out the
issue of girls' potential higher stress than boys for blind tests. Here the double-di�erences na-
ture of equation 15 implies that any e�ect that is common to all classes disappears. As long
as pupils' assignment to teachers who discriminate is independent from their unobserved char-
acteristics that make them progress more, then girls with higher stress for standardized tests
should be equally distributed between classes. A second concern when analyzing discrimination
and progress with individual observation is the potential for reversed causality caused by the
fact that teachers might discriminate more pupils they believe have an ex-ante high potential for
progress. In my setting, the arbitrary assignment of pupils implies that those with an ex-ante
high potential for progress should be equally distributed between classes. Hence, comparing
classes rules out this problem. Finally, averaging scores at the class level reduces signi�cantly
the measurement error a�ecting blind score when measured at the individual level.
4.4 Balance check of the attrition
Three di�erent outcomes are used to estimate the causal e�ect of teachers' gender biases on
girls' relative progress : the blind score at the end of 6th grade, the blind score at the end of 9th
grade and pupils' subject choices during 11th grade. Not all the pupils could be followed over
the long term, so two types of attrition exist : (1) an attrition at the class level when scores
are missing for all pupils in a class and (2) an attrition at the individual level when within a
class scores are missing for some pupils. Attrition is not problematic as such. Yet, if attrition
at the class level is more important for classes with high (or low) discrimination degree, this
could bias my estimate. To test this, I regress the dummy variable for missing classes on the
25The identi�cation I use is based on the heterogeneity in teachers' discriminatory behaviors between di�erent
classes. It is equivalent to implement an IV strategy based on equation 13, where the term (NB1i −B1i) would
be instrumented by all the interactions between teachers and girls at the class level. These interactions measure
teachers' biased grading in favor of girls. The assumption detailed above - pupils' assignment to a teacher who
discriminates is random - is analogous to an exclusion restriction on these instrumental variables.
20
discrimination coe�cient26. Results are presented in table 8. Classes included in the analyses of
the short-term and long-term progress do not di�er regarding the discrimination degree of their
teachers. Second, I test if the percentage of girls or boys missing in a class is correlated to the
degree of bias of their teacher. To do so, I regress the percentage of girls (per class) on the gender
bias. This is done successively for boys and girls. As previously, for each gender, six di�erent
regressions are run corresponding to the six columns of the table. Results are presented in table
9. Out of twelve coe�cients, eleven are statistically non signi�cant, suggesting that attrition of
boys and girls is independent from teachers' gender biases.
4.5 Empirical results on girls' progress relative to boys
4.5.1 Short term progress during the 6th grade
The �rst regression is based on equation 15. The key result (reported in table 10) suggests that
in math, classes in which teachers present a high degree of discrimination in favor of girls, are
also classes in which girls tend to progress more over one school year compared to boys. The
coe�cient is high (0.281) and signi�cant in math. In a class where boys and girls would have
on average the same initial blind score, positively rewarding girls by increasing their non-blind
score by one s.d compared to boys, would increase the gap between boys and girls third term
blind score by 0.28 s.d. This e�ect is substantive, but we should keep in mind that the treatment
is also important : increasing teachers' bias by one s.d represents approximatively an increase
from the minimum to the maximum value of the bias. It might be more relevant to interpret
this coe�cient in light of the �rst part results. An average discrimination coe�cient of 0.31 was
found in math, which implies that, proportionally, girls' third term blind score would increase
by 0.089 points - or 1.7% - compared to boys27. This e�ect of teachers' biases on progress during
the 6th grade is observed in math but no signi�cant e�ect is observed in French over the short
term, partly because the standard-error of the estimate is high.
26Six di�erent regressions are run for each missing variable : blind score in French and math at the end of
the sixth grade, blind score in French and math at the end of the ninth grade, and information on course choice
during the eleventh grade (regressed on discrimination in both French and math).27We should be careful when interpreting the coe�cient and keep in mind that the outcome is relative. It
corresponds to the di�erence between girls and boys scores, so that the positive coe�cient I �nd could correspond
to a higher progress for girls than for boys, or a blind score that remains constant for girls between �rst and last
term but decreases for boys (due to their feeling of being negatively discriminated compared to girls for instance).
Lavy and Sand (2015) provide evidence that teachers' biases in favor of boys have an asymmetric e�ect on boys
and girls. Boys achievement increases while girls' achievement is negatively a�ected.
21
4.5.2 Long-term progress until the 9th grade
Beyond the short-term e�ect, it is interesting to see if the e�ect of teachers' gender biases during
the 6th grade persists over the long term, and if the girls favored by their teachers continue
to catch up boys in math. To answer this question, I analyze pupils' progress until grade 9,
hence four years after the gender bias is observed. The same speci�cation is used and results are
reported in columns 3 and 4 of table 10. Teachers' gender biases during grade 6 have a high and
signi�cant long-term e�ect on girls' progress relative to boys, in both math and French. Once
controlled for the achievement gap between girls and boys at the beginning of the lower secondary
school, increasing girls' grades by 1 s.d compared to boys will increase the gender achievement
gap at the end of lower secondary school by 0.375 points in math and 0.421 in French. As
previously, the magnitude of this e�ect can be interpreted with regard to the average gender
bias found in the �rst part of the analysis. For the average estimate of teachers' bias, girls'
long term achievement would increase by 0.116 s.d in math and 0.131 in French, compared to
boys. This long-term e�ect observed in French is interesting. It shows that despite the fact that
we found no average bias in teachers' grades, there exists an important variance in teachers'
discriminatory behaviors which has an e�ect on girls' relative progress.
To build upon these results, it is interesting to see whether the catching up of girls that
we observe in math, �rst during the 6th grade, and then until the 9th grade, would still have
occurred without the gender discrimination. The descriptive statistics presented in table 2 show
that, in math during third term the gap between girls and boys blind score equals -0.041 points
of the s.d, while it equals -0.147 during �rst term. This represents a relative improvement of
girls compared to boys of 0.106 s.d. My results suggest that, in the absence of a gender bias,
the achievement gap during third the term would have been equal to -0.130 instead of -0.041,
therefore a relative improvement of girls of 0.017 instead of 0.106. Hence, in the absence of
discrimination, girls would not have progressed more than boys during the 6th grade. The
catching up we observe in math during the 6th grade is almost entirely driven by the positive
e�ect of the gender discrimination on girls' progress. Following the same reasoning, it is easy to
show that, over the long term, about half of girls catch-up of boys is caused by teachers' biased
behavior in math28.
4.5.3 E�ect of teachers' biases on course choice
I �nally test if teachers' biases in favor of girls a�ect the type of high school and courses they chose
compared to boys. The 9th grade corresponds to the last grade of the lower (and compulsory)
28The calculus is as follows : the descriptive statistics presented in table 2 show that, in math at the end of
the 9th grade, the achievement gap between girls and boys blind score equals +0.058 points of the s.d, while it
is -0.147 at the beginning of the 6th grade. This represents a relative improvement of girls compared to boys of
0.205 points of the s.d. My estimates show that due to teachers' biases, girls' long term achievement relative to
boys increase by 0.116 points of the s.d in math. This represents a little bit more than half of girls' total relative
progress.
22
secondary school. After this grade, pupils can chose between a vocational, technical or general
high school, the latter being chosen by the majority as it provides the most opportunities to
continue studies at university. In our sample, 50.9% of the girls choose a general high school and
40.3% of boys. For the pupils who decided to attend a general high school, everyone attends the
same courses during the 10th grade, but pupils have to specialize when they enter the 11th grade.
Three options are available to them: sciences, humanities or economics and social sciences. In
this sample, among girls in general high school, 32.8% chose the scienti�c course, while 40.2%
of the boys did so. This reversal of the gender probability is striking as the scienti�c path is
the most prestigious one, and the one that leads to higher education in science, technology,
engineering and math (STEM) �elds. These �elds of studies are highly gender unbalanced in
most countries. Therefore, it would be interesting to know if favoring girls is a mean to �ght
these persistent gender di�erences.
Using the same speci�cation as before, I successively analyze the e�ect of teachers' discrim-
inatory behavior during the 6th grade on three outcomes: girls' relative probability to attend a
general highschool, to chose a scienti�c course and to repeat a grade. Results are presented in
table 11. The dependent variable is the di�erence between girls and boys probability to attend
a general highschool in grade 10 (columns 1 and 2), to chose a scienti�c course in grade 11
(columns 3 and 4) or to repeat one of the grades between grade 6 and grade 11 (columns 5 and
6).
First, I �nd that being assigned a teacher who favors girls in the 6th grade increases girls' rela-
tive probability to attend a general highschool (rather than a professional or technical one) by
0.15 percentage points when the discrimination is in a math course and 0.16 percentage points
when the discrimination is in French. Knowing that on average in this sample, girls are 10.6%
more likely than boys to attend a general highschool, the magnitude of the e�ect is very high
: it multiplies by two girls higher probability than boys to chose a general highschool. This
e�ect is however in line with Lavy and Sand (2015) who �nd that "the estimated e�ect of math
teachers' stereotypical attitude [in favor of boys] on enrollment in advance studies in math is
positive and signi�cant for boys (0.093, SE=0.049) and negative and signi�cant for girls (-0.073,
SE=0.044)". This signi�cant e�ect is also consistent with the preceding result on girls higher
progress than boys until grade 9. The likelihood that a pupil attends a general highschool in
grade 10 is highly correlated to his/her results at the end the lower secondary school (grade 9).
Second, the results reported in columns 3 and 4 suggest that teachers' biases positively a�ect
girls' relative probability to chose a scienti�c course during the 11th grade. As previously, this
e�ect is observed whether the gender bias is in French (+0.095) or in math (+0.107). Although
the coe�cients are positive, it is interesting to notice that they are signi�cantly lower than the
preceding ones (on the probability to chose a general highschool). This observation is inter-
esting because the scienti�c path is the most prestigious one, and the one that leads to higher
23
education in STEM �elds. Although rewarding girls make them progress more (compared to
boys) and attend more general highschool, this suggests that girls still face barriers that prevent
them from increasing in the same proportion their likelihood to chose scienti�c courses. I am
not able to provide evidence on the existence of such barriers, but recent papers show that low-
income students are less likely to apply to prestigious and high-achieving college, hence creating
an academic "undermatch"29. Since 68% of the pupils in this sample have low SES parents,
this mechanism is relatively plausible. Finally, teachers' biased behavior slightly decreases girls
relative probability to repeat a grade in math, but not in French.
All together, the positive e�ect of teachers biases on both girls' relative progress and schooling
decisions is consistent with di�erent mechanisms mentioned in prior literature. Firstly, positively
rewarding girls can reduce the stereotype threat e�ect. In situations where stereotypes are
perceived as important, some girls have been proved to perform poorly for the sole reason that
they fear con�rming the stereotypes (Spencer et al. 1999). If math is perceived by girls as more
a�ected by teachers' stereotypes, over-grading girls in this subject can reduce their anxiety to be
judged as poor performers, and therefore favor their progress. Over the short term, the fact that
biases a�ect girls' relative progress in math but not in French is consistent with a reduction of
the stereotype threat, which might be more prevalent in math than in French. My �ndings are
also consistent with prior research highlighting a `contrast e�ect' according to which a student's
academic self-concept is positively in�uenced by his or her individual achievement, but negatively
a�ected by other peers-average achievement - usually composed of peers in the classrooms - once
controlled for individual achievement (Trautwein et al. 2006, Marsh and Craven, 1997). With
regard to this contrast e�ect, giving higher grades to girls would have a twofold e�ect: from an
absolute point of view, higher grades will positively a�ect girls' self-concept, and self-con�dence
in math, and from a relative point of view, girls' higher grades compared to boys will reduce
the achievement gap between boys and girls, and therefore increase girls relative academic self-
concept. Finally, my result tends to challenge Mechtenberg's (2009) theoretical predictions
according to which girls are reluctant to internalize good grades in math, because they believe
their grades are biased.
5 Conclusion
In most OECD countries, at the earliest stage of schooling, boys outperform girls in mathemat-
ics, but they underperform in humanities. Then over the school years, this achievement gap
tends to vanish in math but persist in French. This paper studies how teachers biased grades
can explain both the achievement gap between boys and girls and its evolution over time. I use
data containing both blind and non-blind scores at di�erent periods in time to identify, �rst the
e�ect of teachers' stereotypes on their grades, and second the e�ect of biased rewards on pupils'
progress and course choice. Firstly regarding discrimination, my results suggest that an impor-
29See for instance Hoxby and Avery 2013, Smith et al. 2013, Dillon et al. 2013.
24
tant positive discrimination exists in math towards girls, while no bias is observed in French.
This gender bias cannot be explained by girls' better behavior than boys. However it partially
captures girls' initial lower achievement in math. Regarding the impact of discrimination on
girls' progress relative to boys, I observe that classes in which teachers present a high degree
of discrimination in favor of girls during the 6th grade, are also classes in which girls tend to
progress more compared to boys. This is true over the short and long term, hence suggesting
a positive e�ect of rewards on girls' relative progress. Teachers' biases also a�ect girls relative
likelihood to attend a general high school during the 10th grade (rather than a professional
or technical one) and to choose a scienti�c course during grade 11. These results provide new
empirical evidence on gender discrimination in grades and how it a�ects the gender achievement
gap over the short term and long term.
I am however unable to disentangle the di�erent channels through which a gender bias can
a�ect girls' relative achievement. On the one hand, positively rewarding pupils could motivate
them, make them increase their e�orts, increase their self-con�dence, and reduce the stereotype-
threat they su�er from. On the other hand, if pupils consider e�ort and abilities as substitutes,
a higher grade might be an incentive to reduce e�ort and work. Unfortunately, I am not able to
disentangle these e�ects that might compensate or reinforce each other. This is an interesting
question for future research. Another concern is the external validity of my results. In this study,
I use a dataset that has been collected in schools of a relatively deprived educational district.
This must be considered for issues of external validity of this analysis. Teachers assigned to
deprived areas are on average younger than teachers in more advantaged schools, and we have
seen that unexperienced teachers are more biased. Similarly, pupils in these areas might face
more constraints (�nancial or self-censorship) regarding their schooling decisions.
Finally, this analysis provides several policy-relevant results regarding teachers grading.
First, my �ndings suggest that marks given by teachers do not re�ect only pupils' ability. They
are a�ected by pupils' characteristics or attitudes. This raises the question of the relevance
of some elements included in grades. Should a grade re�ect a pupil's gender, his/her initial
achievement, or behavior? The answer is not clear and seems to depend on the objective pur-
sued. On the one hand, if grades are wished to measure only a pupil's ability, then the in�uence
of a pupils' gender seems problematic, especially since several important decisions in school life
are made on the basis of student grades (choice of stream at the beginning of upper secondary
school, whether to repeat a year, choice of subject paths, etc). A simple and non-costly policy
to remedy gender biases would consist of informing teachers about conscious or unconscious
stereotyping and its potential e�ects on the grades that they give. French teachers have cur-
rently neither training nor information provided on the risks they face of judging their students
through the lens of stereotypes. Making them aware of these risks might be a simple solution
to signi�cantly reduce biases in grades. Considering that teachers biases are problematic is also
related to the ongoing debate on the use of grades as evaluation tools. The earlier teachers give
grades to students, the higher the potential for discrimination. In several education systems,
25

pupils do not receive any grades before they turn 11 or more (Sweden for instance). On the
other hand, grades could be considered as an instrument with which teachers improve student
progress. In this case, teachers' grades could be a way to reduce the inequalities in achievement
between boys and girls, by encouraging girls in math and boys in French to eliminate their lag.
26
References
[1] Bar, Talia, and Asaf Zussman. � Partisan grading �. American Economic Journal: Applied Economics
4, no 1 (2012): 30-48.
[2] Bénabou, Roland, and Jean Tirole. � Self-Con�dence and Personal Motivation �. The Quarterly
Journal of Economics 117, no 3 (8 janvier 2002): 871:915.
[3] Bertrand, Marianne, Esther Du�o, and Sendhil Mullainathan. � How Much Should We Trust
Di�erences-in-Di�erences Estimates? �. National Bureau of Economic Research Working Paper Series
No. 8841 (2002).
[4] Blank, Rebecca M. � The E�ects of Double-Blind versus Single-Blind Reviewing: Experimental
Evidence from The American Economic Review �. The American Economic Review 81, no 5 (1
décembre 1991): 1041-67.
[5] Bonesrønning, Hans. � The e�ect of grading practices on gender di�erences in academic performance
�. Bulletin of Economic Research 60, no 3 (2008): 245-64.
[6] Bouguen, Adrien. �Adjusting content to every students' needs : further evidence from a teacher
training program�. Ongoing research.
[7] Breda, Thomas, and Son Thierry Ly. � Do professors really perpetuate the gender gap in science?
Evidence from a natural experiment in a French higher education institution �. CEP WP, june 2012.
[8] Burgess, Simon, and Ellen Greaves. � Test Scores, Subjective Assessment and Stereotyping of Ethnic
Minorities �. Journal of Labor Economics 31, (2013): 535-576
[9] Cornwell, Christopher, David B. Mustard and Jessica Van Parys. � Noncognitive Skills and the
Gender Disparities in Test Scores and Teacher Assessments: Evidence from Primary School �. J.
Human Resources Winter 48, no 1 (2013): 236-264
[10] Crawford, Claire, Lorraine Dearden, and Costas Meghir. � When you are born matters: the impact
of date of birth on child cognitive outcomes in England �, octobre 2007.
[11] Dee, Thomas S. � A Teacher Like Me: Does Race, Ethnicity, or Gender Matter? �. American
Economic Review 95, no 2 (2005): 158-65.
[12] ���. � Teachers and the Gender Gaps in Student Achievement �. The Journal of Human Re-
sources 42, no 3 (1 juillet 2007): 528-54.
[13] Dillon, Eleanor Wiske and Je�rey Andrew Smith. � The Determinants of Mismatch Between Stu-
dents and Colleges �. NBER Working Paper no 19286 (August 2013).
[14] Else-Quest, Nicole M, Janet Shibley Hyde, and Marcia C Linn. � Cross-national patterns of gender
di�erences in mathematics: a meta-analysis �. Psychological Bulletin 136, no 1 (janvier 2010): 103-27.
[15] Falch, Torberg, and Linn Renée Naper. � Educational evaluation schemes and gender gaps in student
achievement �. Economics of Education Review 36 (octobre 2013): 12-25.
[16] Fennema, Elizabeth, Penelope L. Peterson, Thomas P. Carpenter, and Cheryl A. Lubinski. � Teach-
ers' Attributions and Beliefs about Girls, Boys, and Mathematics �. Educational Studies in Mathe-
matics 21, no 1 (1 février 1990): 55-69.
27
[17] Fryer, Roland G and Steven Levitt. � An Empirical Analysis of the Gender Gap in Mathematics �.
American Economic Journal: Applied Economics, no 2 (2010): 210-40.
[18] Gneezy, Uri, Murial Niederle, and Aldo Rustichini. "Performance in competitive Environments:
Gender Di�erences". Quarterly Journal of Economics, 118, no 3 (2003): 1049- 1074.
[19] Goldin, Claudia. � Notes on Women and the Undergraduate Economics Major. � CSWEP Newslet-
ter, Summer 2013, 15 édition.
[20] Goldin, Claudia, and Cecilia Rouse. � Orchestrating Impartiality: The Impact of �Blind� Auditions
on Female Musicians �. American Economic Review 90, no 4 (septembre 2000): 715-41.
[21] Hanna, Rema N. and Leigh L. Linden. � Discrimination in Grading �. American Economic Journal:
Economic Policy 4, no 4 (2012): 146-168.
[22] Heckman, James J., Jora Stixrud, and Sergio Urzua. � The E�ects of Cognitive and Noncognitive
Abilities on Labor Market Outcomes and Social Behavior �. Journal of Labor Economics 24, no 3
(2006): 411-482.
[23] Hinnerich, Björn Tyrefors, Erik Höglin, and Magnus Johannesson. � Are boys discriminated in
Swedish high schools? �. Economics of Education Review 30, no 4 (août 2011): 682-90.
[24] Ho�, Karla, and Priyanka Pandey. � Discrimination, Social Identity, and Durable Inequalities �.
The American Economic Review 96, no 2 (1 mai 2006): 206-11.
[25] Hoxby, Caroline and Christopher Avery. � The Missing �One-O�s�: The Hidden Supply of High-
Achieving, Low-Income Students �. Brookings Papers on Economic Activity, (Spring 2013)
[26] Lavy, Victor. � Do gender stereotypes reduce girls' or boys' human capital outcomes? Evidence
from a natural experiment �. Journal of Public Economics 92, no 10-11 (octobre 2008): 2083-2105.
[27] Lavy, Victor and Edith Sand. � On The Origins of Gender Human Capital Gaps: Short and Long
Term Consequences of Teachers' Stereotypical Biases �. NBER Working Paper no 20909 (January
2015)
[28] Lindahl, Erica. � Does gender and ethnic background matter when teachers set school grades?
Evidence from Sweden �. Uppsala University Working paper (2007).
[29] Machin, Stephen and Sandra McNally. � Gender and Student Achievement in English Schools �,
Oxford Review of Economic Policy no 21, (2005): 357-72.
[30] Machin, Stephen and Tuomas Pekkarinen. � Global Sex Di�erences in Test Score Variability �,
Science no 322, (2008): 1331-1332
[31] Marsh, Herbert. W., and Rhonda G. Craven. � Academic self-concept: Beyond the dustbowl. �
In G. D. Phye (Ed.), Handbook of classroom assessment. San Diego, CA: Academic Press., 1997,
131:198.
[32] Marsh, Herbert W., and Rhonda G. Craven. � The Pivotal Role of Frames of Reference in Academic
Self-Concept Formation: The Big Fish-Little Pond E�ect �, 2001.
[33] Mechtenberg, Lydia. � Cheap Talk in the Classroom: How Biased Grading at School Explains
Gender Di�erences in Achievements, Career Choices and Wages �. Review of Economic Studies 76,
no 4 (2009): 1431-59.
28
[34] Neblett, Enrique W, Cheri L Philip, Courtney D Cogburn, and Robert M Sellers. � African Amer-
ican Adolescents' Discrimination Experiences and Academic Achievement: Racial Socialization as a
Cultural Compensatory and Protective Factor �. Journal of Black Psychology 32, no 2 (5 janvier
2006): 199-218.
[35] OECD. PISA 2009 Results: What Students Know and Can Do � Student Performance in Reading,
Mathematics and Science, 2010.
[36] Ouazad, Amine, and Lionel Page. � Students' Perceptions of Teacher Biases: Experimental Eco-
nomics in Schools �. Journal of Public Economics 105 (2013): 116-130.
[37] Ready, Douglas D., and David L. Wright. � Accuracy and Inaccuracy in Teachers' Perceptions of
Young Children's Cognitive Abilities �. American Educational Research Journal 48, no 2 (1 avril
2011): 335-60.
[38] Robinson, Joseph Paul, and Sarah Theule Lubienski. � The Development of Gender Achievement
Gaps in Mathematics and Reading During Elementary and Middle School Examining Direct Cognitive
Assessments and Teacher Ratings �. American Educational Research Journal 48, no 2 (1 avril 2011):
268-302.
[39] Smith, Jonathan, Matea Pender and Jessica Howell. � The full extent of student-college academic
undermatch �. Economics of Education Review 32, (February 2013): 247-261.
[40] Spencer, Steven J., Claude M. Steele, and Diane M. Quinn. � Stereotype Threat and Women's Math
Performance �. Journal of Experimental Social Psychology 35, no 1 (janvier 1999): 4-28.
[41] Steele, Claude M., and Joshua Aronson. � Stereotype threat and the intellectual test performance
of African Americans �. Journal of Personality and Social Psychology 69, no 5 (1995): 797-811.
[42] Tiedemann, Joachim. � Gender related beliefs of teachers in elementary school mathematics �.
Educational Studies in Mathematics 41 (2000): 191-207.
[43] ���. � Teachers' Gender Stereotypes as Determinants of Teacher Perceptions in Elementary
School Mathematics �. Educational Studies in Mathematics 50, no 1 (2002): 49-62.
[44] Trautwein, Ulrich, Oliver Ludtke, Herbert W. Marsh, Olaf Koller, and Jurgen Baumert. � Tracking,
Grading, and Student Motivation: Using Group Composition and Status to Predict Self-Concept
and Interest in Ninth-Grade Mathematics �. Journal of Educational Psychology 98, no 4 (novembre
2006): 788-806.
[45] Van Ewijk, Reyn. � Same Work, Lower Grade? Student Ethnicity and Teachers' Subjective Assess-
ments �. Economics of Education Review 30, no 5 (octobre 2011): 1045-58.
[46] Wei, Thomas E. � Stereotype threat, gender, and math performance: evidence from the national
assesment of educational progress �. Working Paper, Harvard University, 2009.
29
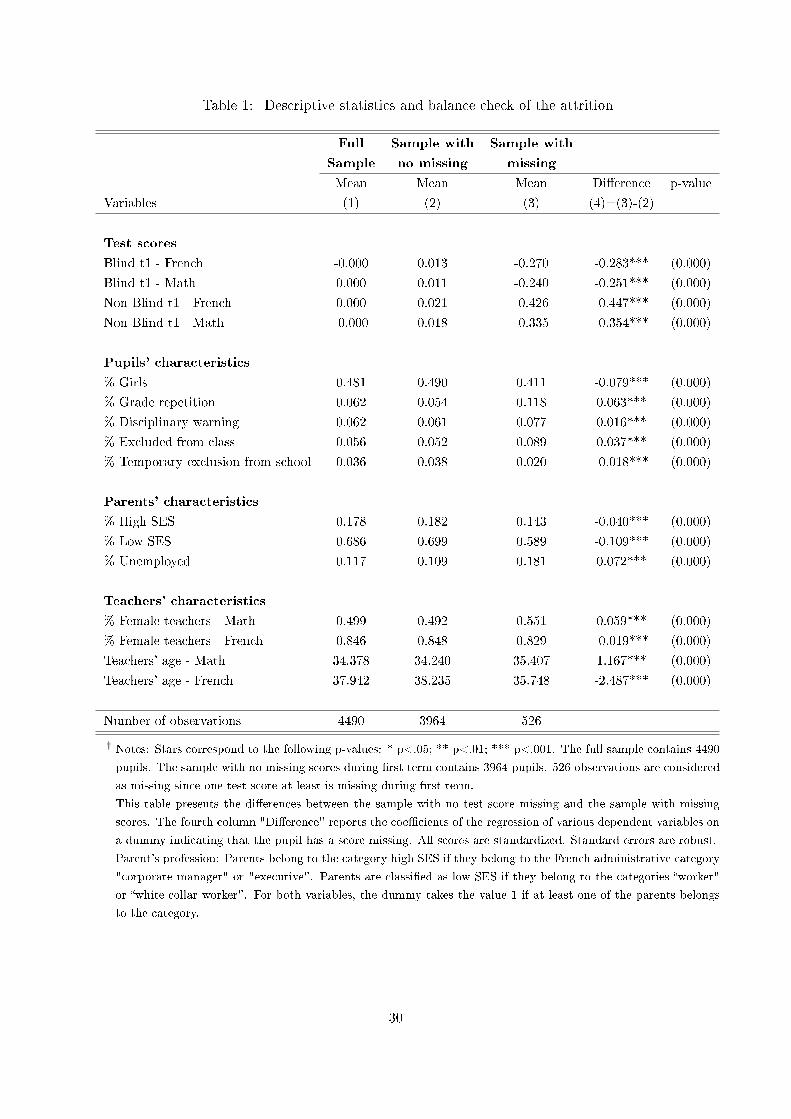
Table 1: Descriptive statistics and balance check of the attrition
Full Sample with Sample with
Sample no missing missing
Mean Mean Mean Di�erence p-value
Variables (1) (2) (3) (4)=(3)-(2)
Test scores
Blind t1 - French -0.000 0.013 -0.270 -0.283*** (0.000)
Blind t1 - Math 0.000 0.011 -0.240 -0.251*** (0.000)
Non-Blind t1 - French 0.000 0.021 -0.426 -0.447*** (0.000)
Non-Blind t1 - Math -0.000 0.018 -0.335 -0.354*** (0.000)
Pupils' characteristics
% Girls 0.481 0.490 0.411 -0.079*** (0.000)
% Grade repetition 0.062 0.054 0.118 0.063*** (0.000)
% Disciplinary warning 0.062 0.061 0.077 0.016*** (0.000)
% Excluded from class 0.056 0.052 0.089 0.037*** (0.000)
% Temporary exclusion from school 0.036 0.038 0.020 -0.018*** (0.000)
Parents' characteristics
% High SES 0.178 0.182 0.143 -0.040*** (0.000)
% Low SES 0.686 0.699 0.589 -0.109*** (0.000)
% Unemployed 0.117 0.109 0.181 0.072*** (0.000)
Teachers' characteristics
% Female teachers - Math 0.499 0.492 0.551 0.059*** (0.000)
% Female teachers - French 0.846 0.848 0.829 -0.019*** (0.000)
Teachers' age - Math 34.378 34.240 35.407 1.167*** (0.000)
Teachers' age - French 37.942 38.235 35.748 -2.487*** (0.000)
Number of observations 4490 3964 526
† Notes: Stars correspond to the following p-values: * p<.05; ** p<.01; *** p<.001. The full sample contains 4490
pupils. The sample with no missing scores during �rst term contains 3964 pupils. 526 observations are considered
as missing since one test score at least is missing during �rst term.
This table presents the di�erences between the sample with no test score missing and the sample with missing
scores. The fourth column "Di�erence" reports the coe�cients of the regression of various dependent variables on
a dummy indicating that the pupil has a score missing. All scores are standardized. Standard errors are robust.
Parent's profession: Parents belong to the category high SES if they belong to the French administrative category
"corporate manager" or "executive". Parents are classi�ed as low SES if they belong to the categories �worker"
or �white-collar worker". For both variables, the dummy takes the value 1 if at least one of the parents belongs
to the category.
30
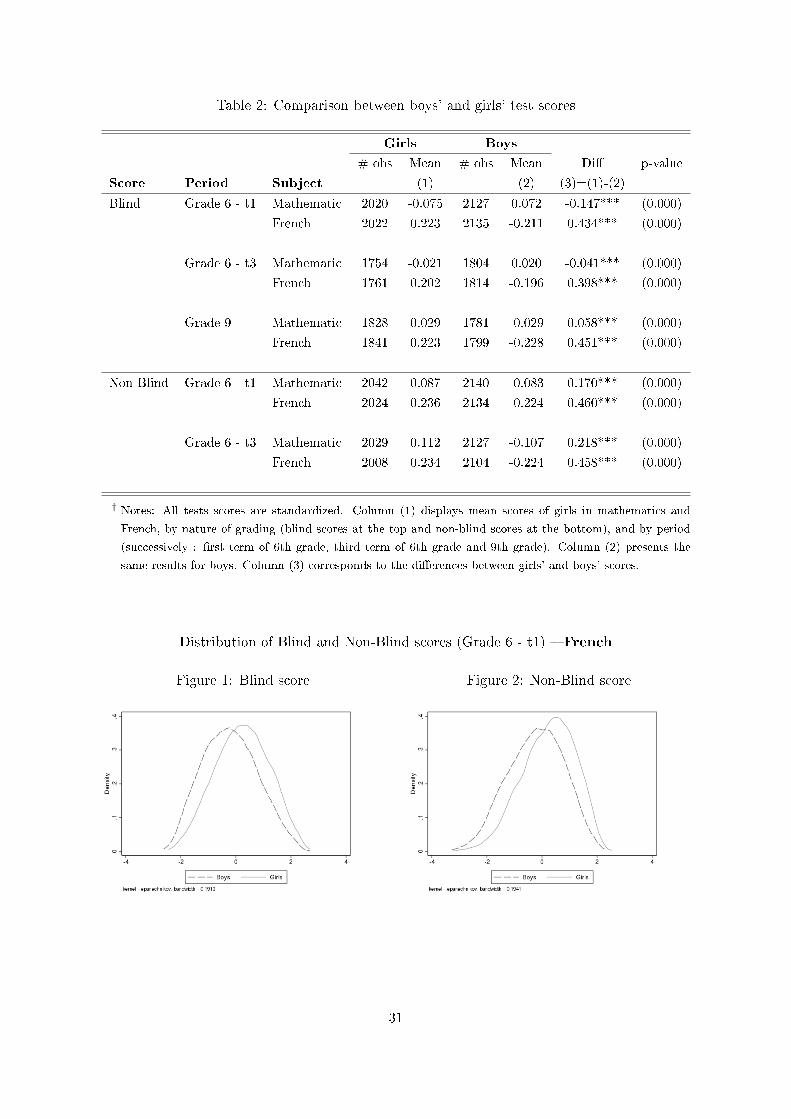
Table 2: Comparison between boys' and girls' test scores
Girls Boys
# obs Mean # obs Mean Di� p-value
Score Period Subject (1) (2) (3)=(1)-(2)
Blind Grade 6 - t1 Mathematic 2020 -0.075 2127 0.072 -0.147*** (0.000)
French 2022 0.223 2135 -0.211 0.434*** (0.000)
Grade 6 - t3 Mathematic 1754 -0.021 1804 0.020 -0.041*** (0.000)
French 1761 0.202 1814 -0.196 0.398*** (0.000)
Grade 9 Mathematic 1828 0.029 1781 -0.029 0.058*** (0.000)
French 1841 0.223 1799 -0.228 0.451*** (0.000)
Non-Blind Grade 6 - t1 Mathematic 2042 0.087 2140 -0.083 0.170*** (0.000)
French 2024 0.236 2134 -0.224 0.460*** (0.000)
Grade 6 - t3 Mathematic 2029 0.112 2127 -0.107 0.218*** (0.000)
French 2008 0.234 2104 -0.224 0.458*** (0.000)
† Notes: All tests scores are standardized. Column (1) displays mean scores of girls in mathematics and
French, by nature of grading (blind scores at the top and non-blind scores at the bottom), and by period
(successively : �rst term of 6th grade, third term of 6th grade and 9th grade). Column (2) presents the
same results for boys. Column (3) corresponds to the di�erences between girls' and boys' scores.
Distribution of Blind and Non-Blind scores (Grade 6 - t1) � French
Figure 1: Blind score Figure 2: Non-Blind score
31
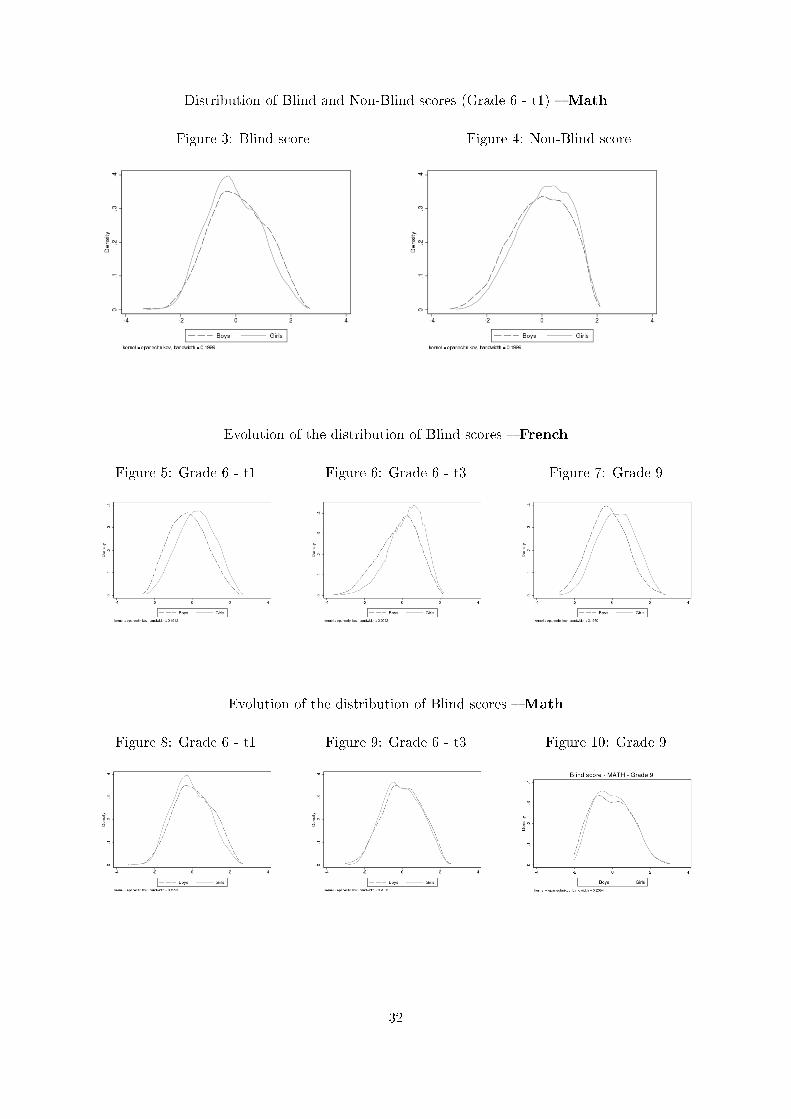
Distribution of Blind and Non-Blind scores (Grade 6 - t1) � Math
Figure 3: Blind score Figure 4: Non-Blind score
Evolution of the distribution of Blind scores � French
Figure 5: Grade 6 - t1 Figure 6: Grade 6 - t3 Figure 7: Grade 9
Evolution of the distribution of Blind scores � Math
Figure 8: Grade 6 - t1 Figure 9: Grade 6 - t3 Figure 10: Grade 9
32
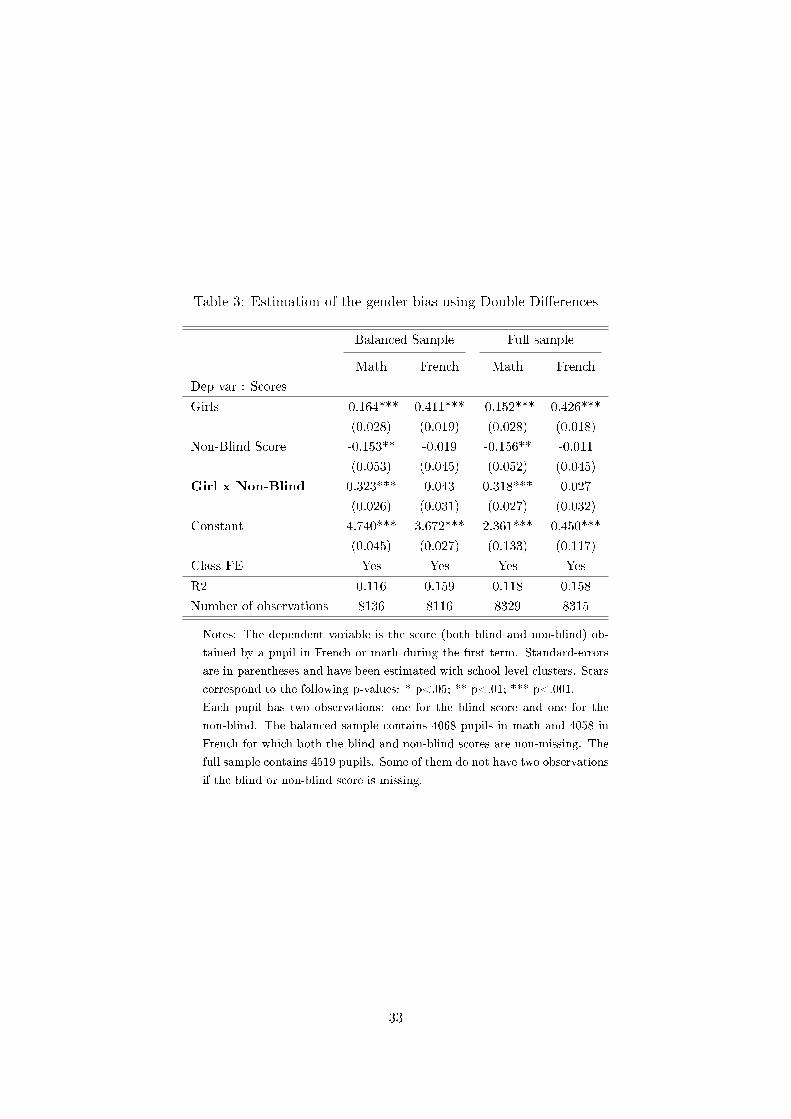
Table 3: Estimation of the gender bias using Double-Di�erences
Balanced Sample Full sample
Math French Math French
Dep var : Scores
Girls -0.164*** 0.411*** -0.152*** 0.426***
(0.028) (0.019) (0.028) (0.018)
Non-Blind Score -0.153** -0.019 -0.156** -0.011
(0.053) (0.045) (0.052) (0.045)
Girl x Non-Blind 0.323*** 0.043 0.318*** 0.027
(0.026) (0.031) (0.027) (0.032)
Constant 4.740*** 3.672*** 2.361*** 0.450***
(0.045) (0.027) (0.133) (0.117)
Class FE Yes Yes Yes Yes
R2 0.116 0.159 0.118 0.158
Number of observations 8136 8116 8329 8315
Notes: The dependent variable is the score (both blind and non-blind) ob-
tained by a pupil in French or math during the �rst term. Standard-errors
are in parentheses and have been estimated with school level clusters. Stars
correspond to the following p-values: * p<.05; ** p<.01; *** p<.001.
Each pupil has two observations: one for the blind score and one for the
non-blind. The balanced sample contains 4068 pupils in math and 4058 in
French for which both the blind and non-blind scores are non-missing. The
full sample contains 4519 pupils. Some of them do not have two observations
if the blind or non-blind score is missing.
33
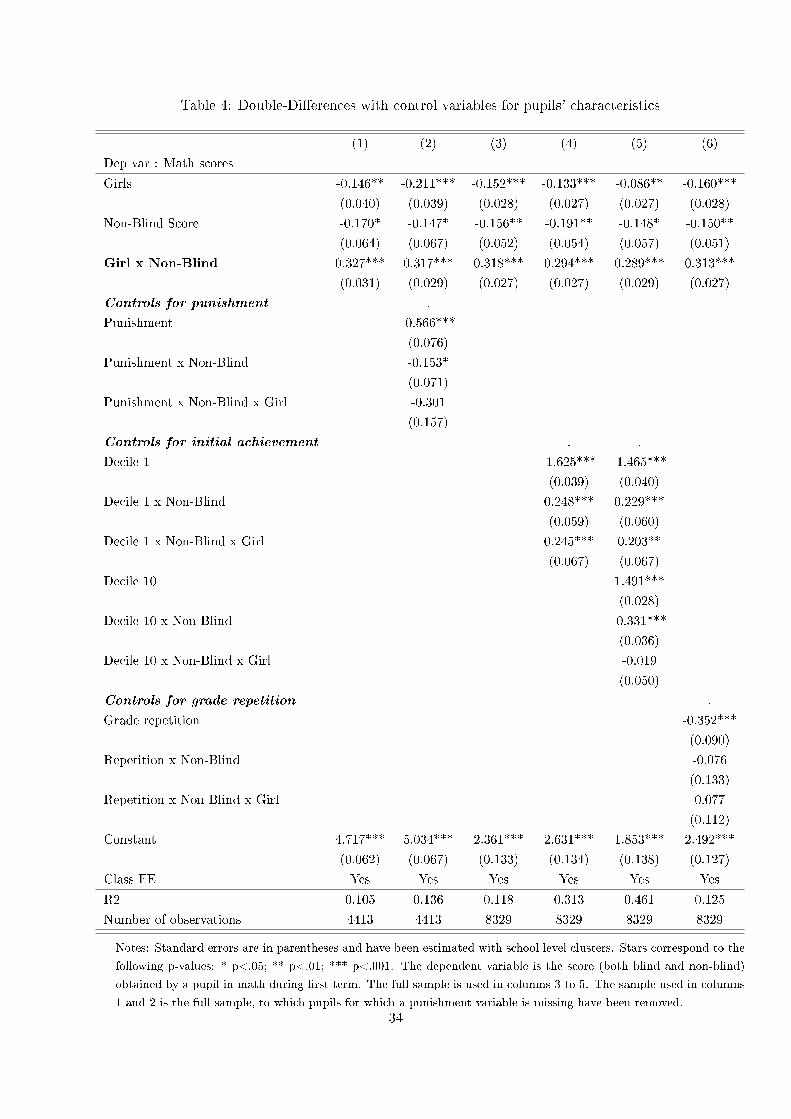
Table 4: Double-Di�erences with control variables for pupils' characteristics
(1) (2) (3) (4) (5) (6)
Dep var : Math scores
Girls -0.146** -0.211*** -0.152*** -0.133*** -0.086** -0.160***
(0.040) (0.039) (0.028) (0.027) (0.027) (0.028)
Non-Blind Score -0.170* -0.147* -0.156** -0.191** -0.148* -0.150**
(0.064) (0.067) (0.052) (0.054) (0.057) (0.051)
Girl x Non-Blind 0.327*** 0.317*** 0.318*** 0.294*** 0.289*** 0.313***
(0.031) (0.029) (0.027) (0.027) (0.029) (0.027)
Controls for punishment .
Punishment -0.566***
(0.076)
Punishment x Non-Blind -0.153*
(0.071)
Punishment x Non-Blind x Girl -0.301
(0.157)
Controls for initial achievement . .
Decile 1 -1.625*** -1.465***
(0.039) (0.040)
Decile 1 x Non-Blind 0.248*** 0.229***
(0.059) (0.060)
Decile 1 x Non-Blind x Girl 0.245*** 0.203**
(0.067) (0.067)
Decile 10 1.491***
(0.028)
Decile 10 x Non-Blind -0.331***
(0.036)
Decile 10 x Non-Blind x Girl -0.019
(0.050)
Controls for grade repetition .
Grade repetition -0.352***
(0.090)
Repetition x Non-Blind -0.076
(0.133)
Repetition x Non-Blind x Girl 0.077
(0.112)
Constant 4.717*** 5.034*** 2.361*** 2.631*** 1.853*** 2.492***
(0.062) (0.067) (0.133) (0.134) (0.138) (0.127)
Class FE Yes Yes Yes Yes Yes Yes
R2 0.105 0.136 0.118 0.313 0.461 0.125
Number of observations 4413 4413 8329 8329 8329 8329
Notes: Standard-errors are in parentheses and have been estimated with school level clusters. Stars correspond to the
following p-values: * p<.05; ** p<.01; *** p<.001. The dependent variable is the score (both blind and non-blind)
obtained by a pupil in math during �rst term. The full sample is used in columns 3 to 5. The sample used in columns
1 and 2 is the full sample, to which pupils for which a punishment variable is missing have been removed.
34
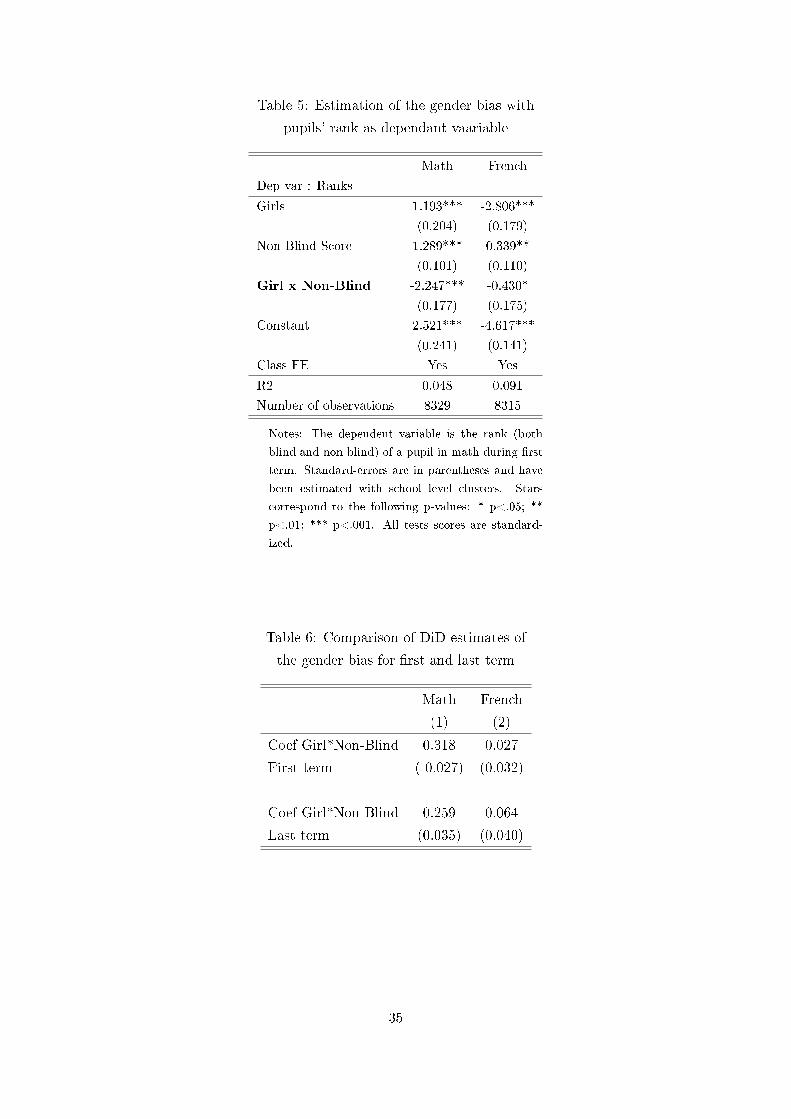
Table 5: Estimation of the gender bias with
pupils' rank as dependant vaariable
Math French
Dep var : Ranks
Girls 1.193*** -2.806***
(0.204) (0.179)
Non-Blind Score 1.289*** 0.339**
(0.101) (0.110)
Girl x Non-Blind -2.247*** -0.430*
(0.177) (0.175)
Constant 2.521*** -4.617***
(0.241) (0.141)
Class FE Yes Yes
R2 0.048 0.091
Number of observations 8329 8315
Notes: The dependent variable is the rank (both
blind and non-blind) of a pupil in math during �rst
term. Standard-errors are in parentheses and have
been estimated with school level clusters. Stars
correspond to the following p-values: * p<.05; **
p<.01; *** p<.001. All tests scores are standard-
ized.
Table 6: Comparison of DiD estimates of
the gender bias for �rst and last term
Math French
(1) (2)
Coef Girl*Non-Blind 0.318 0.027
First term ( 0.027) (0.032)
Coef Girl*Non-Blind 0.259 0.064
Last term (0.035) (0.040)
35
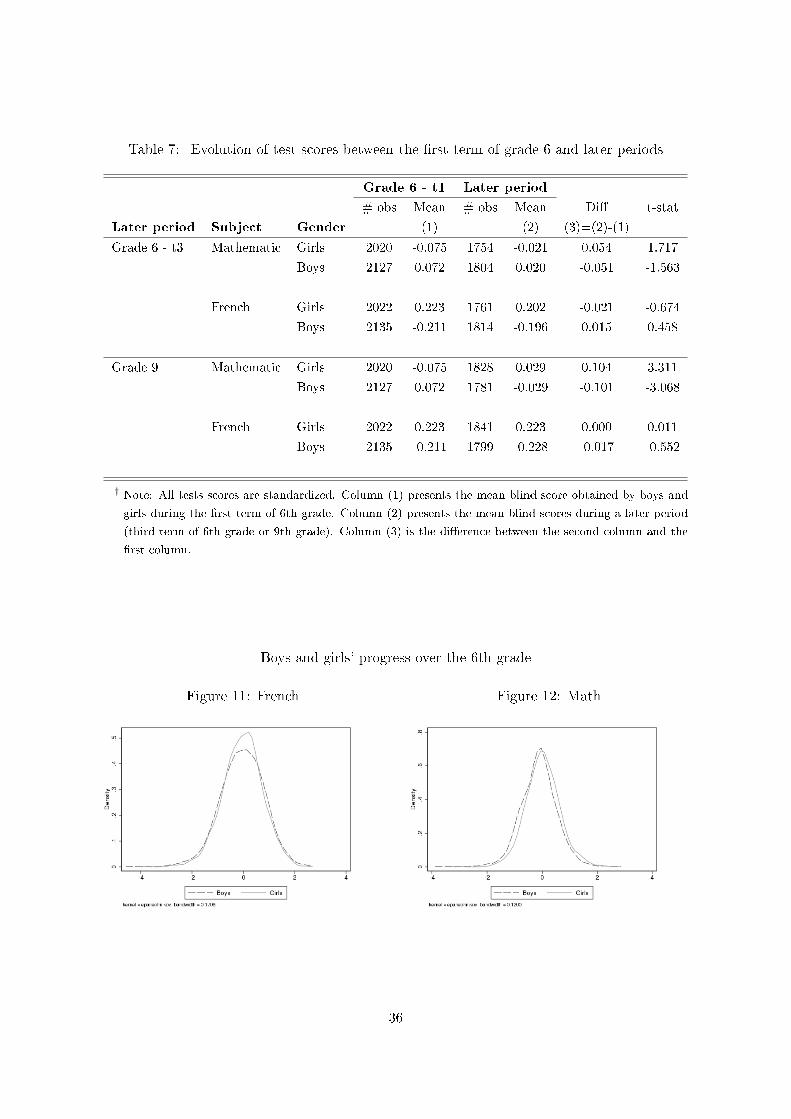
Table 7: Evolution of test scores between the �rst term of grade 6 and later periods
Grade 6 - t1 Later period
# obs Mean # obs Mean Di� t-stat
Later period Subject Gender (1) (2) (3)=(2)-(1)
Grade 6 - t3 Mathematic Girls 2020 -0.075 1754 -0.021 0.054 1.717
Boys 2127 0.072 1804 0.020 -0.051 -1.563
French Girls 2022 0.223 1761 0.202 -0.021 -0.674
Boys 2135 -0.211 1814 -0.196 0.015 0.458
Grade 9 Mathematic Girls 2020 -0.075 1828 0.029 0.104 3.311
Boys 2127 0.072 1781 -0.029 -0.101 -3.068
French Girls 2022 0.223 1841 0.223 0.000 0.011
Boys 2135 -0.211 1799 -0.228 -0.017 -0.552
† Note: All tests scores are standardized. Column (1) presents the mean blind score obtained by boys and
girls during the �rst term of 6th grade. Column (2) presents the mean blind scores during a later period
(third term of 6th grade or 9th grade). Column (3) is the di�erence between the second column and the
�rst column.
Boys and girls' progress over the 6th grade
Figure 11: French Figure 12: Math
36
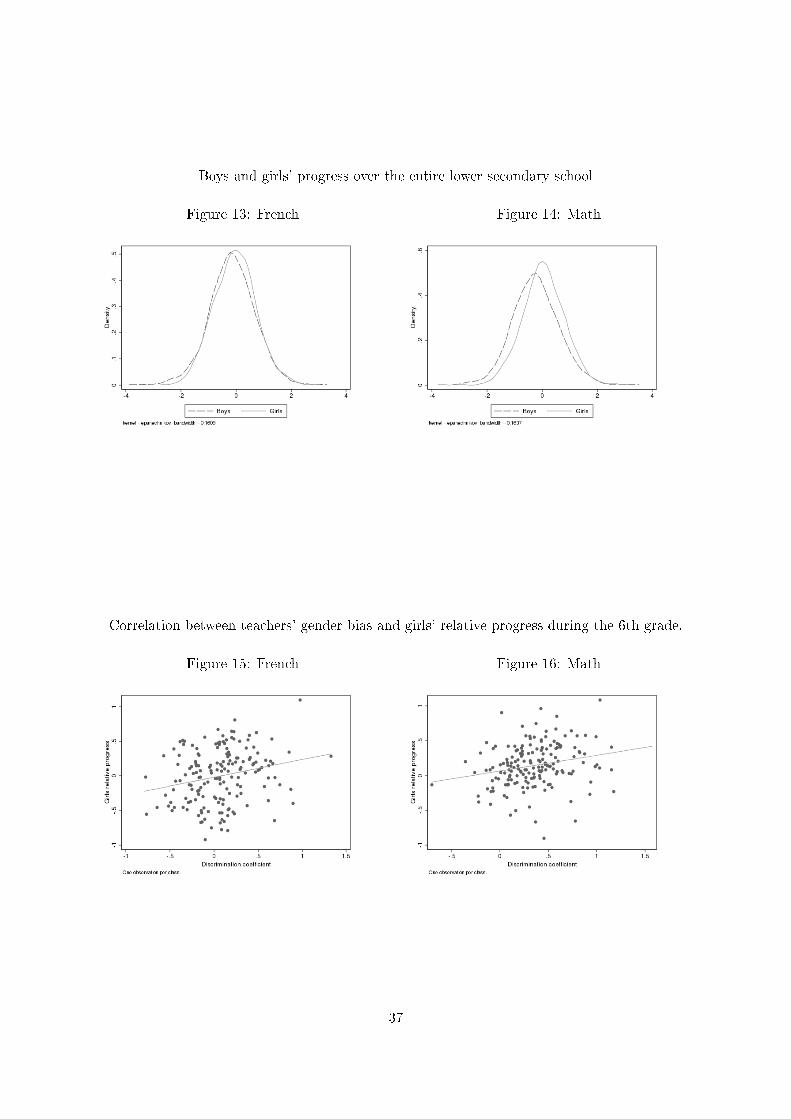
Boys and girls' progress over the entire lower secondary school
Figure 13: French Figure 14: Math
Correlation between teachers' gender bias and girls' relative progress during the 6th grade.
Figure 15: French Figure 16: Math
37
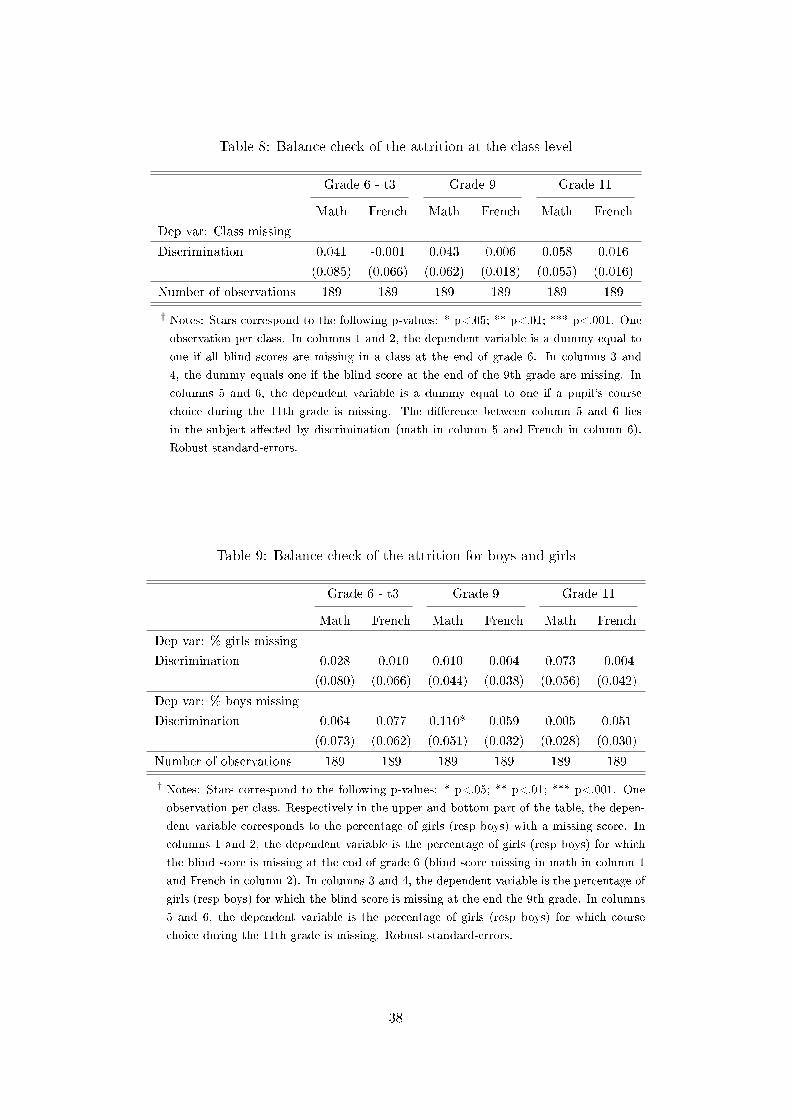
Table 8: Balance check of the attrition at the class level
Grade 6 - t3 Grade 9 Grade 11
Math French Math French Math French
Dep var: Class missing
Discrimination 0.041 -0.001 0.043 0.006 0.058 0.016
(0.085) (0.066) (0.062) (0.018) (0.055) (0.016)
Number of observations 189 189 189 189 189 189
† Notes: Stars correspond to the following p-values: * p<.05; ** p<.01; *** p<.001. One
observation per class. In columns 1 and 2, the dependent variable is a dummy equal to
one if all blind scores are missing in a class at the end of grade 6. In columns 3 and
4, the dummy equals one if the blind score at the end of the 9th grade are missing. In
columns 5 and 6, the dependent variable is a dummy equal to one if a pupil's course
choice during the 11th grade is missing. The di�erence between column 5 and 6 lies
in the subject a�ected by discrimination (math in column 5 and French in column 6).
Robust standard-errors.
Table 9: Balance check of the attrition for boys and girls
Grade 6 - t3 Grade 9 Grade 11
Math French Math French Math French
Dep var: % girls missing
Discrimination 0.028 -0.010 0.010 0.004 0.073 -0.004
(0.080) (0.066) (0.044) (0.038) (0.056) (0.042)
Dep var: % boys missing
Discrimination 0.064 0.077 0.110* 0.059 0.005 0.051
(0.073) (0.062) (0.051) (0.032) (0.028) (0.030)
Number of observations 189 189 189 189 189 189
† Notes: Stars correspond to the following p-values: * p<.05; ** p<.01; *** p<.001. One
observation per class. Respectively in the upper and bottom part of the table, the depen-
dent variable corresponds to the percentage of girls (resp boys) with a missing score. In
columns 1 and 2, the dependent variable is the percentage of girls (resp boys) for which
the blind score is missing at the end of grade 6 (blind score missing in math in column 1
and French in column 2). In columns 3 and 4, the dependent variable is the percentage of
girls (resp boys) for which the blind score is missing at the end the 9th grade. In columns
5 and 6, the dependent variable is the percentage of girls (resp boys) for which course
choice during the 11th grade is missing. Robust standard-errors.
38
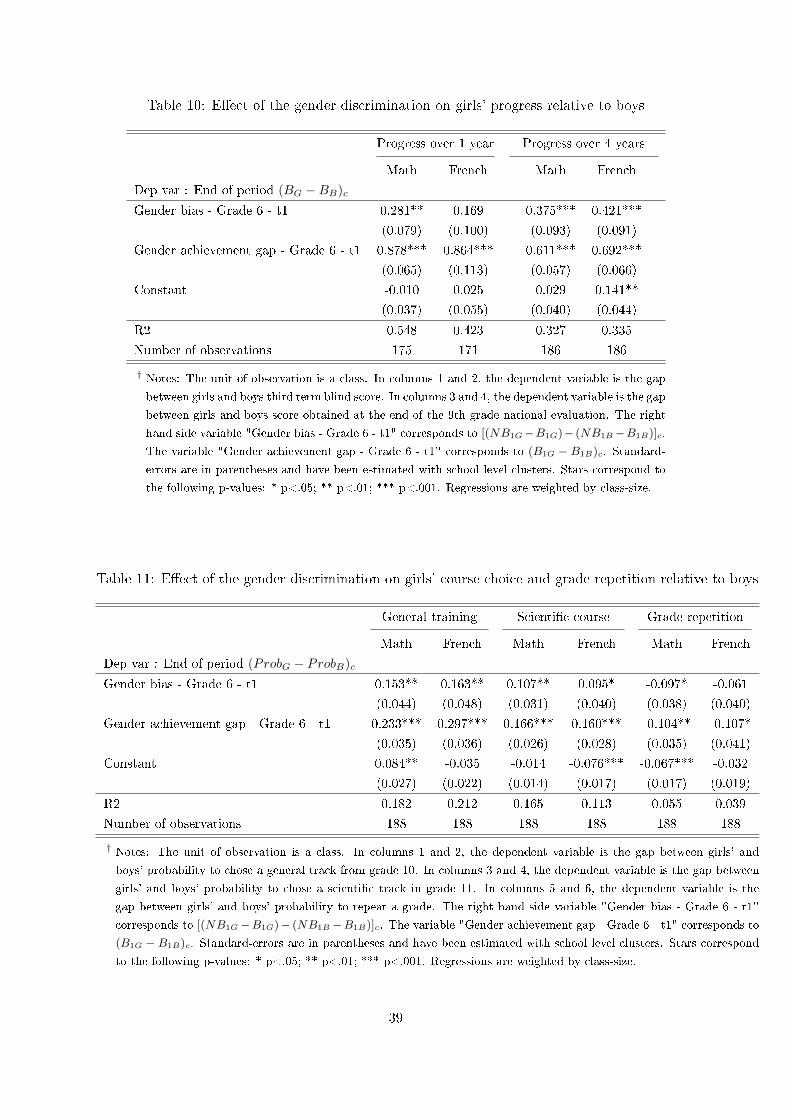
Table 10: E�ect of the gender discrimination on girls' progress relative to boys
Progress over 1 year Progress over 4 years
Math French Math French
Dep var : End of period (BG −BB)c
Gender bias - Grade 6 - t1 0.281** 0.169 0.375*** 0.421***
(0.079) (0.100) (0.093) (0.091)
Gender achievement gap - Grade 6 - t1 0.878*** 0.864*** 0.611*** 0.692***
(0.065) (0.113) (0.057) (0.066)
Constant -0.010 0.025 0.029 0.141**
(0.037) (0.055) (0.040) (0.044)
R2 0.548 0.423 0.327 0.335
Number of observations 175 171 186 186
† Notes: The unit of observation is a class. In columns 1 and 2, the dependent variable is the gap
between girls and boys third term blind score. In columns 3 and 4, the dependent variable is the gap
between girls and boys score obtained at the end of the 9th grade national evaluation. The right
hand side variable "Gender bias - Grade 6 - t1" corresponds to [(NB1G−B1G)− (NB1B−B1B)]c.
The variable "Gender achievement gap - Grade 6 - t1" corresponds to (B1G − B1B)c. Standard-
errors are in parentheses and have been estimated with school level clusters. Stars correspond to
the following p-values: * p<.05; ** p<.01; *** p<.001. Regressions are weighted by class-size.
Table 11: E�ect of the gender discrimination on girls' course choice and grade repetition relative to boys
General training Scienti�c course Grade repetition
Math French Math French Math French
Dep var : End of period (ProbG − ProbB)c
Gender bias - Grade 6 - t1 0.153** 0.163** 0.107** 0.095* -0.097* -0.061
(0.044) (0.048) (0.031) (0.040) (0.038) (0.040)
Gender achievement gap - Grade 6 - t1 0.233*** 0.297*** 0.166*** 0.160*** -0.104** -0.107*
(0.035) (0.036) (0.026) (0.028) (0.035) (0.041)
Constant 0.084** -0.035 -0.014 -0.076*** -0.067*** -0.032
(0.027) (0.022) (0.014) (0.017) (0.017) (0.019)
R2 0.182 0.212 0.165 0.113 0.055 0.039
Number of observations 188 188 188 188 188 188
† Notes: The unit of observation is a class. In columns 1 and 2, the dependent variable is the gap between girls' and
boys' probability to chose a general track from grade 10. In columns 3 and 4, the dependent variable is the gap between
girls' and boys' probability to chose a scienti�c track in grade 11. In columns 5 and 6, the dependent variable is the
gap between girls' and boys' probability to repeat a grade. The right hand side variable "Gender bias - Grade 6 - t1"
corresponds to [(NB1G−B1G)− (NB1B −B1B)]c. The variable "Gender achievement gap - Grade 6 - t1" corresponds to
(B1G − B1B)c. Standard-errors are in parentheses and have been estimated with school level clusters. Stars correspond
to the following p-values: * p<.05; ** p<.01; *** p<.001. Regressions are weighted by class-size.
39
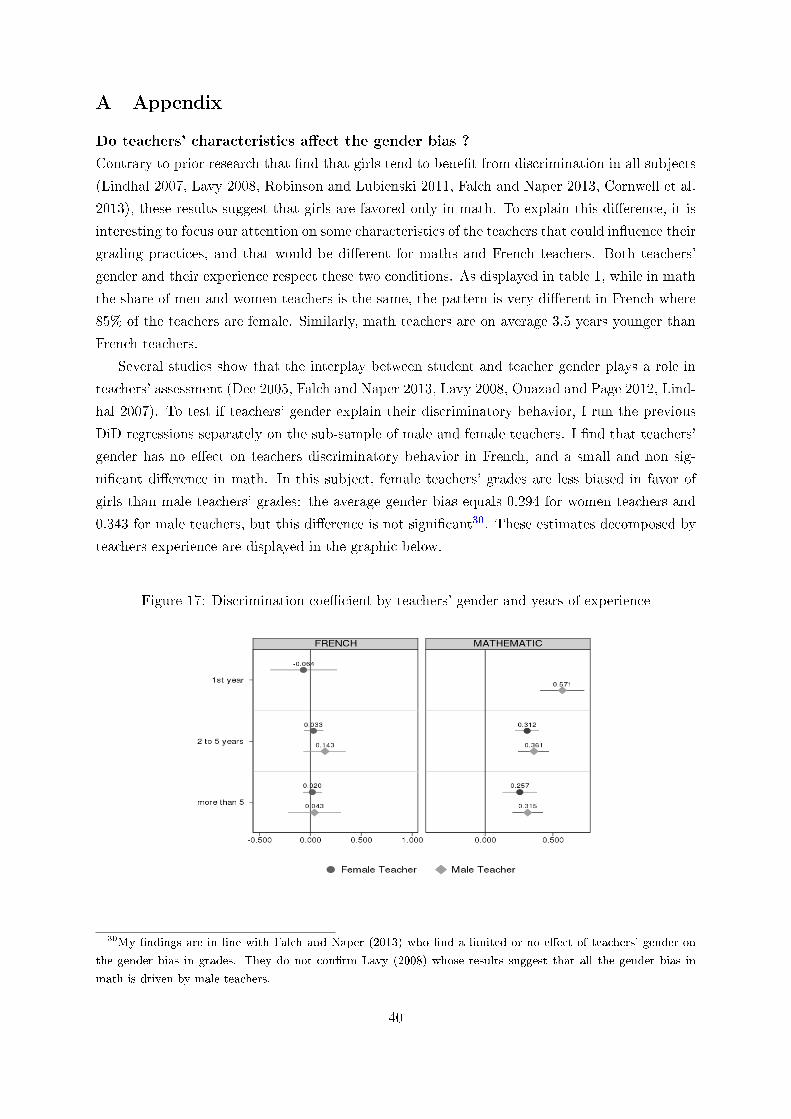
A Appendix
Do teachers' characteristics a�ect the gender bias ?
Contrary to prior research that �nd that girls tend to bene�t from discrimination in all subjects
(Lindhal 2007, Lavy 2008, Robinson and Lubienski 2011, Falch and Naper 2013, Cornwell et al.
2013), these results suggest that girls are favored only in math. To explain this di�erence, it is
interesting to focus our attention on some characteristics of the teachers that could in�uence their
grading practices, and that would be di�erent for maths and French teachers. Both teachers'
gender and their experience respect these two conditions. As displayed in table 1, while in math
the share of men and women teachers is the same, the pattern is very di�erent in French where
85% of the teachers are female. Similarly, math teachers are on average 3.5 years younger than
French teachers.
Several studies show that the interplay between student and teacher gender plays a role in
teachers' assessment (Dee 2005, Falch and Naper 2013, Lavy 2008, Ouazad and Page 2012, Lind-
hal 2007). To test if teachers' gender explain their discriminatory behavior, I run the previous
DiD regressions separately on the sub-sample of male and female teachers. I �nd that teachers'
gender has no e�ect on teachers discriminatory behavior in French, and a small and non sig-
ni�cant di�erence in math. In this subject, female teachers' grades are less biased in favor of
girls than male teachers' grades: the average gender bias equals 0.294 for women teachers and
0.343 for male teachers, but this di�erence is not signi�cant30. These estimates decomposed by
teachers experience are displayed in the graphic below.
Figure 17: Discrimination coe�cient by teachers' gender and years of experience
30My �ndings are in line with Falch and Naper (2013) who �nd a limited or no e�ect of teachers' gender on
the gender bias in grades. They do not con�rm Lavy (2008) whose results suggest that all the gender bias in
math is driven by male teachers.
40
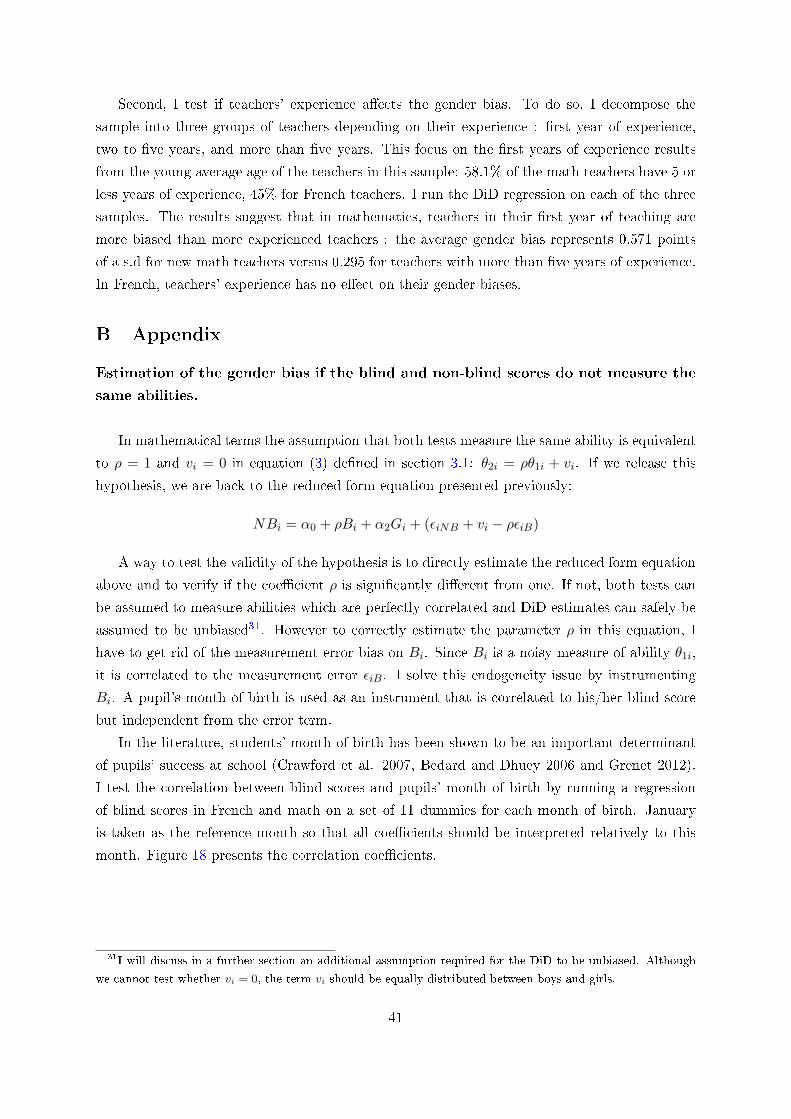
Second, I test if teachers' experience a�ects the gender bias. To do so, I decompose the
sample into three groups of teachers depending on their experience : �rst year of experience,
two to �ve years, and more than �ve years. This focus on the �rst years of experience results
from the young average age of the teachers in this sample: 58.1% of the math teachers have 5 or
less years of experience, 45% for French teachers. I run the DiD regression on each of the three
samples. The results suggest that in mathematics, teachers in their �rst year of teaching are
more biased than more experienced teachers : the average gender bias represents 0.571 points
of a s.d for new math teachers versus 0.295 for teachers with more than �ve years of experience.
In French, teachers' experience has no e�ect on their gender biases.
B Appendix
Estimation of the gender bias if the blind and non-blind scores do not measure the
same abilities.
In mathematical terms the assumption that both tests measure the same ability is equivalent
to ρ = 1 and vi = 0 in equation (3) de�ned in section 3.1: θ2i = ρθ1i + vi. If we release this
hypothesis, we are back to the reduced form equation presented previously:
NBi = α0 + ρBi + α2Gi + (εiNB + vi − ρεiB)
A way to test the validity of the hypothesis is to directly estimate the reduced form equation
above and to verify if the coe�cient ρ is signi�cantly di�erent from one. If not, both tests can
be assumed to measure abilities which are perfectly correlated and DiD estimates can safely be
assumed to be unbiased31. However to correctly estimate the parameter ρ in this equation, I
have to get rid of the measurement error bias on Bi. Since Bi is a noisy measure of ability θ1i,
it is correlated to the measurement error εiB. I solve this endogeneity issue by instrumenting
Bi. A pupil's month of birth is used as an instrument that is correlated to his/her blind score
but independent from the error term.
In the literature, students' month of birth has been shown to be an important determinant
of pupils' success at school (Crawford et al. 2007, Bedard and Dhuey 2006 and Grenet 2012).
I test the correlation between blind scores and pupils' month of birth by running a regression
of blind scores in French and math on a set of 11 dummies for each month of birth. January
is taken as the reference month so that all coe�cients should be interpreted relatively to this
month. Figure 18 presents the correlation coe�cients.
31I will discuss in a further section an additional assumption required for the DiD to be unbiased. Although
we cannot test whether vi = 0, the term vi should be equally distributed between boys and girls.
41
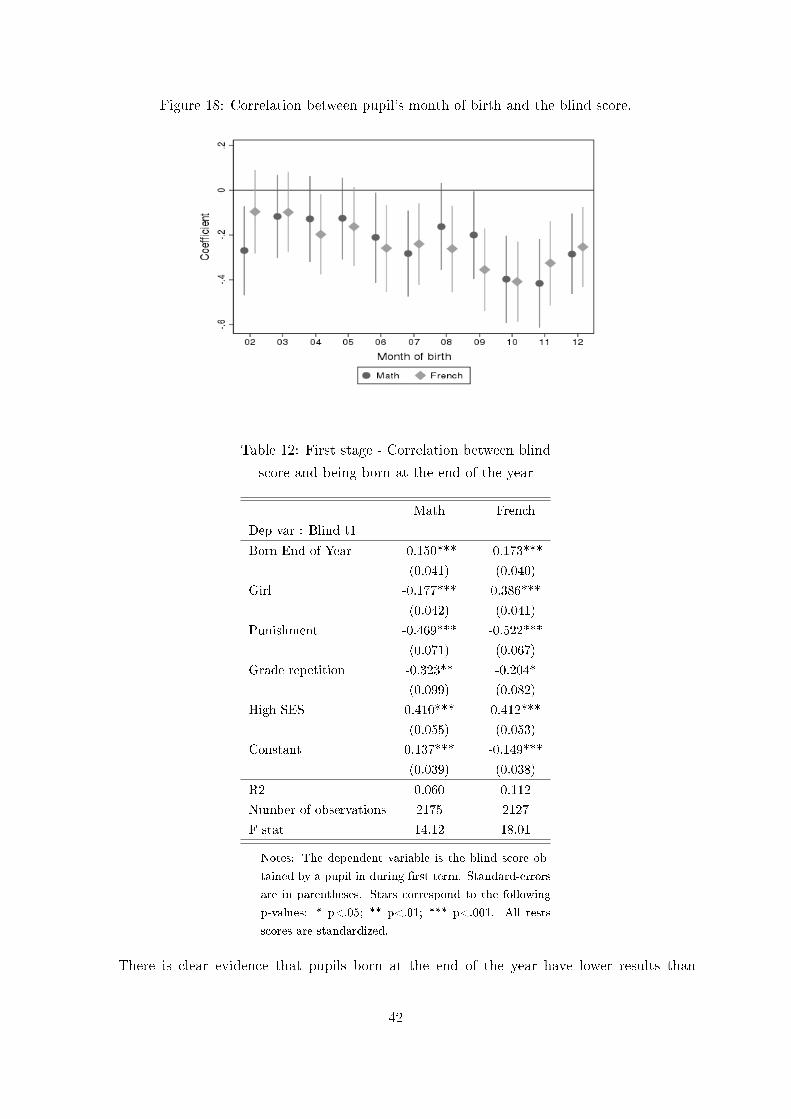
Figure 18: Correlation between pupil's month of birth and the blind score.
Table 12: First stage - Correlation between blind
score and being born at the end of the year
Math French
Dep var : Blind t1
Born End of Year -0.150*** -0.173***
(0.041) (0.040)
Girl -0.177*** 0.386***
(0.042) (0.041)
Punishment -0.469*** -0.522***
(0.071) (0.067)
Grade repetition -0.323** -0.204*
(0.099) (0.082)
High SES 0.410*** 0.412***
(0.055) (0.053)
Constant 0.137*** -0.149***
(0.039) (0.038)
R2 0.060 0.112
Number of observations 2175 2127
F stat 14.12 18.01
Notes: The dependent variable is the blind score ob-
tained by a pupil in during �rst term. Standard-errors
are in parentheses. Stars correspond to the following
p-values: * p<.05; ** p<.01; *** p<.001. All tests
scores are standardized.
There is clear evidence that pupils born at the end of the year have lower results than
42
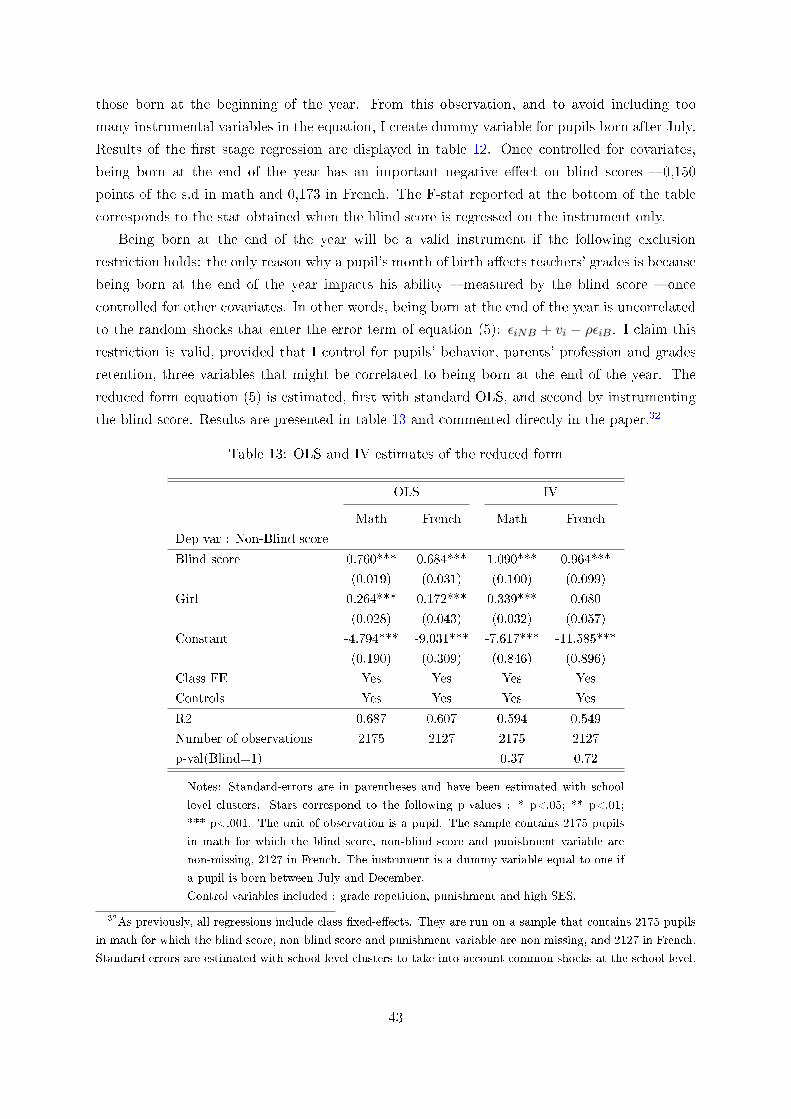
those born at the beginning of the year. From this observation, and to avoid including too
many instrumental variables in the equation, I create dummy variable for pupils born after July.
Results of the �rst stage regression are displayed in table 12. Once controlled for covariates,
being born at the end of the year has an important negative e�ect on blind scores � 0,150
points of the s.d in math and 0,173 in French. The F-stat reported at the bottom of the table
corresponds to the stat obtained when the blind score is regressed on the instrument only.
Being born at the end of the year will be a valid instrument if the following exclusion
restriction holds: the only reason why a pupil's month of birth a�ects teachers' grades is because
being born at the end of the year impacts his ability � measured by the blind score � once
controlled for other covariates. In other words, being born at the end of the year is uncorrelated
to the random shocks that enter the error term of equation (5): εiNB + vi − ρεiB. I claim this
restriction is valid, provided that I control for pupils' behavior, parents' profession and grades
retention, three variables that might be correlated to being born at the end of the year. The
reduced form equation (5) is estimated, �rst with standard OLS, and second by instrumenting
the blind score. Results are presented in table 13 and commented directly in the paper.32
Table 13: OLS and IV estimates of the reduced form
OLS IV
Math French Math French
Dep var : Non-Blind score
Blind score 0.760*** 0.684*** 1.090*** 0.964***
(0.019) (0.031) (0.100) (0.099)
Girl 0.264*** 0.172*** 0.339*** 0.080
(0.028) (0.043) (0.032) (0.057)
Constant -4.794*** -9.031*** -7.617*** -11.585***
(0.190) (0.309) (0.846) (0.896)
Class FE Yes Yes Yes Yes
Controls Yes Yes Yes Yes
R2 0.687 0.607 0.594 0.549
Number of observations 2175 2127 2175 2127
p-val(Blind=1) 0.37 0.72
Notes: Standard-errors are in parentheses and have been estimated with school
level clusters. Stars correspond to the following p-values : * p<.05; ** p<.01;
*** p<.001. The unit of observation is a pupil. The sample contains 2175 pupils
in math for which the blind score, non-blind score and punishment variable are
non-missing, 2127 in French. The instrument is a dummy variable equal to one if
a pupil is born between July and December.
Control variables included : grade repetition, punishment and high SES.
32As previously, all regressions include class �xed-e�ects. They are run on a sample that contains 2175 pupils
in math for which the blind score, non-blind score and punishment variable are non-missing, and 2127 in French.
Standard errors are estimated with school level clusters to take into account common shocks at the school level.
43
Finally, regarding the exclusion restriction, some might argue that once controlled for the
abilities measured by the blind score, being born at the end of the year is not perfectly in-
dependent from unobserved speci�c skills vi tested by the non-blind score only. If this is the
case, it is likely that being born at the end of the year would also be negatively correlated with
these unobserved skills. Therefore the IV estimates of ρ might be an upper bond for the true
value of ρ, while the OLS would be a lower bound (due to the downward measurement error
bias). Indeed, the IV estimate is ρIV = Cov(NBi,EndY eari)Cov(Bi,EndY eari)
. If a correlation exists between vi and
being born at the end of the year, this would a�ect the numerator of the formula by increasing
Cov(NBi, EndY eari). Hence ρIV would be an upper bound for the parameter ρ.
C Appendix
Measure of the omitted variable bias a�ecting ρ and α2.
Since girls perform initially lower than boys in mathematics, and higher in French, the blind
score is correlated to a pupils' gender. The downward bias on ρ could a�ect the estimate of α2.
Using the formula of the omitted variable bias allows me to determine the direction of the bias
that a�ects both ρ and α2 (Bouguen, 2014).
The well-known formula of the omitted variable bias is :
E(b1/X) = β1 + (X ′1X1)−1X ′1X2β2 (16)
where X1 is a vector of the observed variables, X2 is a vector of the unobserved variables,
β1 is the vector of the estimated coe�cients of the observed variables, and β2 is the vector of
the coe�cients of the unobserved variables.
In my setting, the observed variables are the blind score Bi and a pupil's gender Gi, and the
unobserved variable is the error term a�ecting the blind score εBi :
X1 =
B1 G1
B2 G2
......
Bn Gn
, β1 =
(ρ
α2
), X2 =
εB,1
εB,2
...
εB,n
, β2 = −ρ
In the following, I simplify notations as follows:∑N
i=1 =∑
and εBi = EiHence :
(X ′1X1) =
( ∑B2
i
∑BiGi∑
BiGi∑G2
i
)
44
(X ′1X1)−1 = 1∑B2i
∑G2i−(
∑BiGi)2
( ∑G2
i −∑BiGi
−∑BiGi
∑B2
i
)
(X ′1X2) =
(∑BiEi∑GiEi
)
(X ′1X1)−1(X ′1X2) = 1∑B2i
∑G2i−(
∑BiGi)2
(∑G2
i
∑BiEi −
∑BiGi
∑GiEi∑
B2i
∑GiEi −
∑BiGi
∑BiEi
)
(X ′1X1)−1(X ′1X2)β2 = 1∑B2i
∑G2i−(
∑BiGi)2
(−ρ∑G2
i
∑BiEi + ρ
∑BiGi
∑GiEi
−ρ∑B2
i
∑GiEi + ρ
∑BiGi
∑BiEi
)
The �rst row gives the bias which a�ects the estimates of the coe�cient of Bi. The second
row corresponds to the bias on the coe�cient α2 of the variable Gi :
E(α2) = α2 − ρ∑B2
i
∑GiEi −
∑BiGi
∑BiEi∑
B2i
∑G2
i − (∑BiGi)2
(17)
Dividing both the numerator and denominator by n2, gives :
E(α2) = α2 − ρV (Bi)Cov(Gi, Ei)− Cov(Bi, Gi)Cov(Bi, Ei)
V (Bi)[V (Gi)− Gi]− Cov(Bi, Gi)2(18)
Dividing both the numerator and denominator by V (Bi)V (Gi)σEi gives:
E(α2) = α2 − ρr(Gi,Ei) − r(Gi,Bi)r(Bi,Ei)
1 + GiV (Bi)
− r2(Bi,Gi)
σEiσGi
(19)
where σEi is the standard deviation of Ei, σGi is the standard deviation of Gi, r(Gi,Ei) is the
correlation coe�cient between Gi and Ei, r(Bi,Ei) is the correlation coe�cient between Bi and Eiand Gi is the mean of the variable Gi.
Being a girl is assumed to be orthogonal to the shock a�ecting the blind score so that
r(Gi,Ei) = 0:
E(α2) = α2 + ρr(Gi,Bi)r(Bi,Ei)
1 + GiV (Bi)
− r2(Bi,Gi)
σEiσGi
(20)
Based on this formula, the direction of the bias depends on the sign of each of its elements:
ρ is the correlation coe�cient between the blind score and the non-blind score. It is positive.
By de�nition, standard deviation and variances are also positive, as is the average value of the
dummy Gi. Finally, we can easily show that r(Bi,Ei) is positive33. Hence, the direction of the bias
33 In a standard measurement error model r(Bi,Ei) =Cov(Bi,Ei)σBi
σEi= V (Bi)
σBiσEi
=σEiσBi
> 0
45

is fully determined by the sign of r(Gi,Bi). This is the correlation coe�cient between Gi and Bi.
It is positive in French, where girls perform higher than boys for the standardized evaluation,
and negative in mathematics where they perform lower at the beginning of the 6th grade. This
means that in math, the estimate of the coe�cient α2 is a lower bound for the true value of α2.
In French the estimate is an upper bound.
46

CENTRE FOR ECONOMIC PERFORMANCE Recent Discussion Papers
1340 Olivier Marie Ulf Zölitz
'High' Achievers? Cannabis Access and Academic Performance
1339 Terence C. Cheng Joan Costa-i-Font Nattavudh Powdthavee
Do You Have To Win It To Fix It? A Longitudinal Study of Lottery Winners and Their Health Care Demand
1338 Michael Amior Why are Higher Skilled Workers More Mobile Geographically? The Role of the Job Surplus
1337 Misato Sato Antoine Dechezleprêtre
Asymmetric Industrial Energy Prices and International Trade
1336 Christos Genakos Svetoslav Danchev
Evaluating the Impact of Sunday Trading Deregulation
1335 Georg Graetz Guy Michaels
Robots at Work
1334 Claudia Steinwender The Roles of Import Competition and Export Opportunities for Technical Change
1333 Javier Ortega Gregory Verdugo
The Impact of Immigration on the Local Labor Market Outcomes of Blue Collar Workers: Panel Data Evidence
1332 David Marsden Teachers and Performance Pay in 2014: First Results of a Survey
1331 Andrea Tesei Trust and Racial Income Inequality: Evidence from the U.S.
1330 Andy Feng Georg Graetz
Rise of the Machines: The Effects of Labor-Saving Innovations on Jobs and Wages
1329 Alex Bryson Andrew E. Clark Richard B. Freeman Colin P. Green
Share Capitalism and Worker Wellbeing
1328 Esther Hauk Javier Ortega
Schooling, Nation Building and Industrialization: A Gellnerian Approach
1327 Alex Bryson Rafael Gomez Tingting Zhang
All-Star or Benchwarmer? Relative Age, Cohort Size and Career Success in the NHL
1326 Stephan E. Maurer Voting Behaviour and Public Employment in Nazi Germany
1325 Erik Eyster Kristof Madarasz Pascal Michaillat
Preferences for Fair Prices, Cursed Inferences, and the Nonneutrality of Money
1324 Joan Costa-Font Mireia Jofre-Bonet Julian Le Grand
Vertical Transmission of Overweight: Evidence From English Adoptees
1323 Martin Foureaux Koppensteiner Marco Manacorda
Violence and Birth Outcomes: Evidence From Homicides in Brazil
1322 Réka Juhász
Temporary Protection and Technology Adoption: Evidence from the Napoleonic Blockade
1321 Edward P. Lazear Kathryn L. Shaw Christopher Stanton
Making Do With Less: Working Harder During Recessions
1320 Alan Manning Amar Shanghavi
"American Idol" - 65 years of Admiration
1319 Felix Koenig Alan Manning Barbara Petrongolo
Reservation Wages and the Wage Flexibility Puzzle
The Centre for Economic Performance Publications Unit Tel 020 7955 7673 Fax 020 7404 0612
Email [email protected] Web site http://cep.lse.ac.uk


![Petrarch - ''Coronation Oration'' [1341]](https://img.pdfslide.us/doc/110x75/55cf8e82550346703b92e573/petrarch-coronation-oration-1341.jpg)