Embed Size (px)
Citation preview

ISSN 2042-2695
CEP Discussion Paper No 1264
April 2014
Immigration and the Access to Social Housing in the UK
Diego Battiston Richard Dickens Alan Manning
Jonathan Wadsworth

Abstract This paper investigates the impact of immigration on the probability of being in social housing in the UK. In recent years immigrant households are slightly more likely than natives to be in social housing but once one controls for relevant household characteristics immigrants are significantly less likely to be in social housing than natives. However, there has been change over time – the immigrant penalty has fallen over time probably because of changes in allocation rules. Overall we find that the rising number of immigrants and the change in the allocation rules can explain about one-third of the fall in the probability of being in social housing with two-thirds being the result of the fall in the social housing stock.
Key words: Immigration, social housing JEL: F22, R21, H75
This paper was produced as part of the Centre’s Communities Programme. The Centre for Economic Performance is financed by the Economic and Social Research Council.
Diego Battiston is a PhD student at the LSE Department of Economics and an Occasional Research Assistant in the Communities Programme at the CEP. Richard Dickens is a Professor of Economics at the University of Sussex. Alan Manning is Director of the Communities Programme at the CEP and Professor of Economics, London School of Economics and Political Science. Jonathan Wadsworth is a Professor of Economics at Royal Holloway and is a Senior Research Fellow in CEP’s Labour Markets programme.
Published by Centre for Economic Performance London School of Economics and Political Science Houghton Street London WC2A 2AE
All rights reserved. No part of this publication may be reproduced, stored in a retrieval system or transmitted in any form or by any means without the prior permission in writing of the publisher nor be issued to the public or circulated in any form other than that in which it is published.
Requests for permission to reproduce any article or part of the Working Paper should be sent to the editor at the above address.
D. Battiston, R. Dickens, A. Manning and J. Wadsworth, submitted 2014.
2
Introduction
The impact of immigration on natives is a contentious issue with a majority of the population in
many countries currently being opposed to more immigration and believing that it makes the
country a worse place to live (see, for example, Card, Dustmann and Preston, 2012). In the UK (the
country studied in this paper) over 30% of the population have, for the last 10 years, rated
immigration and race relations as one of the two most important issues facing Britain and over 60%
of the population believe there are too many immigrants (Duffy and Frere‐Smith, 2014).
The largest body of research on the impact of immigration is about the labour market ‐ the effect on
wages and employment of both natives and migrants. Although this literature has a very active
debate about whether the impact of immigration on the wages of natives is positive or negative (see,
for example, Card, 1990, 2005, Borjas, 2003, Ottaviano and Peri, 2012 for the US and Dustmann,
Fabbri and Preston, 2005, Nickell and Saleheen, 2008, Manacorda, Manning and Wadsworth, 2012,
Dustmann, Frattini and Preston, 2012, for the UK inter alia) the effects are not very large in absolute
terms so it is hard to explain why such modest impacts produce such a strength of feeling about
immigration among the general population.
It may be that it is the perceived or actual non‐labour market effects of immigration that are more
important in explaining attitudes to immigration. An important aspect of these concerns is about
the demands that immigrants may place on the welfare state. This literature is most developed in
the US (e.g. Borjas and Trejo, 1991, 1993; Borjas and Hilton, 1996) and is usefully reviewed by
Barrett and McCarthy (2008)1. In the UK the number of studies is quite small ‐ Dustmann, Frattini
and Halls (2010) and Dustmann and Frattini (2013) attempt to provide an overall assessment of
whether immigrants pay more in taxes than they receive in benefits and consume as public services.
Wadsworth (2013) studies the relative use of natives and immigrants of public‐provided health
services in the UK and Germany, and Geay, McNally and Telhaj (2012) study the impact of migrants
on educational outcomes and Bell, Fasani and Machin (2013) the impact on crime.
This paper is about the effect of immigration on access to publicly‐provided housing in the UK,
known as social housing in British English. Although the proportion of the population in social
housing has halved over the last 30 years, there remain about 15% of adults who are in social
housing with the benefits that social rents are very considerably below the equivalent private sector
rents (perhaps 40% nationally and up to 70% in some parts of London)2. Although not every
household wants to be in social housing3 there is excess demand for such housing and there has to
be an allocation mechanism (described in more detail later) to ration demand. So, one reason social
housing is of interest because it is a non‐trivial portion of the welfare state.
But social housing is also of particular interest because it is an area where immigrants and natives
might be in more direct and visible conflict over access to resources. The conflict is more direct
because the supply of housing is almost certainly very inelastic in the short‐run (and in the longer‐
run under current UK housing policies). This inelasticity (together with prices that do not respond to
excess demand) means that one more immigrant household in social housing is quite likely to be one
1 There is also a small literature on whether the generosity of welfare affects the location decisions of immigrants (for example, Borjas, 1999; de Giorgi and Pellizzari, 2009). 2 Authors’ own estimates from the English Housing Survey. 3 Many want to own their own home and social housing tends to be in the more deprived neighbourhoods.

3
less native household. And this will be visible in a way that the receipt of welfare benefits is not.
This contrasts with other aspects of the welfare state e.g. if immigration leads to higher expenditure
on some welfare programmes this is not typically at the expense of the entitlement of natives
though it may place strain on the wider public finances (depending on the taxes paid and other
welfare benefits received by migrants). And in areas like health and education the funding
mechanisms ensure that increased resources follow increases in population though the adequacy of
those resources is sometimes questioned. Consistent with the view that conflict over resources may
be more salient in the case of social housing is that, according to the Citizenship Survey4, over 20% of
white Britons think they are treated worse than people of other races by social landlords, much
higher than feel they are treated worse by the education and health services (less than 5%) and
private landlords (about 5%)5.
There is a small amount of existing research on immigration and social housing in the UK that has
generally concluded that there is no discrimination in favour of immigrants (Rutter and Latorre,
2009). Our study is much more comprehensive in terms of data used. There is a small literature on
immigration and home ownership and housing demand (Borjas, 2002; Constant et al, 2009; Nygaard,
2011; Whitehead, 2011; Whitehead et al, 2011) and on the impact of immigration on house prices
and rents (Saiz, 2003, 2007; Sa, 2011).
The plan of the paper is as follows. In the first section we describe social housing in the UK and
describe its evolution over time. This section also discusses the rules for being eligible to apply for
social housing and how these rules affect natives and immigrants paying close attention to the fact
that eligibility is based on household more than individual characteristics. Although it is impossible
to ascertain eligibility exactly, our best estimate is that over 90% of immigrants are in households
who are eligible to apply for social housing. So differences in eligibility are probably not very
important in explaining differences in access.
But, because not all households want social housing and there is excess demand for social housing
among those who do, being eligible to apply for social housing does not determine whether one is in
social housing. It is in the allocation of social housing that the perceived discrimination referred to
above exists. The second section then estimates models for the probability of a household being in
social housing using the UK Labour Force Survey. We show that immigrants as a whole are slightly
more likely to be in social housing but there is considerable heterogeneity among immigrants –
those with EEA citizenship are less likely to be in social housing than natives while those immigrants
who either have UK (most likely acquired after immigration) or are non‐EEA citizens are more likely
to be in social housing than natives. However, once one controls for factors like the demographic
structure of the household, the area of residence and economic circumstances (all factors that one
would expect to affect the probability of being in social housing) these differences disappear and
immigrant households are significantly less likely to be in social housing than equivalent native
households.
4 Authors’ own tabulations, available on request. 5 To give some further context to these statistics the level of discrimination perceived by white Britons in social housing is higher than that perceived by any other group in social housing. And the only other ethnic groups reporting higher levels of perceived discrimination with any part of the state is the black community with the police, criminal justice and immigration authorities, a relationship that we know to be very troubled.

4
We then investigate the impact of time since arrival finding that recent immigrants are much less
likely to be in social housing than equivalent natives but that after about 10 years this probability
rises above that of natives before falling back to the native level. A natural interpretation of this
finding is that recent immigrants find it hard to access both social housing but after a while gain
access to it. There is then a period of time when they would like to be home owners but cannot
afford this option – however, over time a higher fraction come to be able to take this option.
Using data on waiting lists we then investigate the allocation of social housing from those who
indicate a demand for it. We find that immigrants are more likely than native households to demand
social housing but, given the demand, are less likely to be allocated social housing. However in the
allocation of new tenancies, there seems to be equal treatment of natives and immigrants.
The analysis to this point is of the contemporary situation. The fourth section then turns its
attention to changes over time. We document that there has been considerable change over time –
in particular the penalty to being an immigrant household has declined over time. We argue, using
references to the qualitative literature analysis of the social housing allocation procedure, that this
reflects changes to allocation processes that were designed to reduce discrimination, primarily
against ethnic minorities though ethnicity and immigration do overlap.
While our empirical estimates suggest that these changes have been partly successful, the
consequence of this is that the estimated probability of a native household being in social housing
has fallen over time from both the increase in immigrant households with a likely demand for social
housing and the elimination of discriminatory practices. So, from the perspective of a white native
household the chances of being in social housing have fallen. We document the extent of the fall
and indicate the changes that can be ascribed to the change in the allocation procedure, to the
change in immigration and the change in the social housing stock. We show that it is the change in
the housing stock itself that has had by far the largest impact on native households, though there is
a modest effect from increased immigration.
Our conclusions are that the vast majority of immigrants in the UK are likely to be eligible to apply
for social housing. But, in terms of access to social housing, the contemporary situation is that
immigrant households are slightly more likely than native households but, once one controls for
demographic, economic and regional circumstances, immigrant households are less likely to be in
social housing than equivalent native households. There is certainly no evidence of discrimination in
favour of immigrant households as is believed by a sizeable fraction of the white British population.
However we show that there has been some important changes – the immigrant penalty has fallen
over time. So, the combination of a rising immigrant population and a change in the allocation rules
that benefit immigrants has combined with a declining social housing stock to reduce the probability
of native households having access to social housing.
1. Social Housing in the UK
In the UK publicly‐provided housing, known as ‘social housing’ refers both to housing owned by local
authorities (popularly known as ‘council housing’) and housing owned by non‐profit Housing
Associations. What is termed ‘social housing’ in the UK comes in two main varieties – local authority

5
owned housing (commonly called council housing6) and housing provided by housing associations
that are almost entirely non‐profit organizations7. Collectively, these landlords are known as
registered social landlords. The most important characteristics of social housing are that rents are
below market levels (probably around 40% lower on average and up to 70% in parts of London), and
there is more security of tenure than in the private rental sector. Although there are differences
between local authority and housing association tenancies it is commonly perceived that the
distinction is often lost on tenants and in this paper we group these tenancies into a single category
of social tenants (Table A8 in the Data Appendix presents estimates for the division of social tenants
between local authority and housing associations).
Figure 1 presents the share of the total UK housing stock that is owned by councils and housing
associations over a long period of time. The decline in the both the total stock and the proportion of
the housing stock in the social sector has two main causes ‐ the ‘right to buy’ policy, initiated by
Margaret Thatcher of giving social tenants the right to buy their homes and a dramatic decline in the
building of new social housing (as shown in Figure 2).
The rules for the allocation of social housing have also changed over time. At its inception in the late
nineteenth century, social housing was primarily for the ‘deserving poor’, people who were thought
to be ill‐served by the private rental sector but could not afford to buy their own homes (see, for
example, Merrett, 1979) . But, over time, social housing increasingly came to be allocated on the
basis of need and being a social tenant associated with socioeconomic disadvantage. This long‐term
trend was exacerbated by the right to buy policy (as the better‐off tenants were much more likely to
exercize this right). For the current paper, we are particularly interested in the rights of immigrants
to social housing.
2. Immigrants and Access to Social Housing
a. Descriptive Statistics
Figure 3 presents the proportions of working‐age natives and immigrants who are in the three main
forms of housing tenure (owner‐occupier, social tenant, and private tenant) using data from the
Labour Force Survey over the whole period for which immigration status is recorded. For natives,
one can see the dramatic fall in the proportion of social tenants in the 1980s associated with council
house sales but also a more gradual but steady fall since then which the outcome of a rising
population, a failure to increase the stock of social housing in line with that growth and continued
sales of the social housing stock. Owner‐occupation rose very markedly for much of the period but
has fallen over the last 10 years with a concomitant rise in the private rental sector as rising house
prices have made it harder to buy one’s own home.
For immigrants the picture is a little different. the fall in the proportion of social tenants is more
muted in the 1980s and has been only very small since 1990. The consequence of this is that while
33% of natives were social tenants in 1979 compared to 25% of immigrants, by 2013 16.6% of adult
immigrants were in social housing compared to 14.6% of natives. As the fraction of the population
6 Increasingly, local authority housing is managed by what is known as ‘arm’s length management organizations’ though ownership remains with the local authorities. 7 A 2011 law change now allows housing associations to be profit‐making though the numbers are tiny.

6
that is immigrant is also rising over this period, this means that the proportion of social tenants who
are immigrants has been rising as shown in Figure 4. This is more marked if one looks at new social
tenancies (defined as a tenancy that is less than 3 months)8
This data appears to show that immigrants are becoming relatively more likely over time to be in
social housing. This outcome is partly the result of the demand for social housing from immigrant
and native households but because there is excess demand for social housing, the rules by which
social housing are allocated is also important. The next section describes the rules as they currently
operate.
b. Immigrants and Eligibility for Social Housing
The process of being allocated social housing can be thought‐of as a two‐stage process. First, one has to apply for social housing and not everyone is eligible to apply. Then, one has to be offered (and accept) a tenancy if offered one. We first describe the eligibility conditions and then the allocation process. The eligibility conditions are different for natives and migrants. However, it is hard to give a simple summary of these conditions without any inaccuracy as even official documents express the view that “the rules on eligibility for housing assistance in relation to persons from abroad are extremely complex” (House of Commons Library, 2014). With the exception of a few special cases (e.g. refugees) all applicants, whether or not they are British citizens, must pass the ‘habitual residence test’ to be eligible for social housing (this test is also used to assess the right to claim other welfare benefits). To pass this test you must have a right to reside in the UK and prove that you intend to make your home in the UK for the time being. If this sounds a bit vague that is because it probably is – for example the 2012 guidance to local authorities on the allocation of accommodation observed that “The term ‘habitual residence’ is not defined in legislation”, and that “When deciding whether a person is habitually resident, consideration must be given to all the facts of each case in a common sense way”9. For UK Citizens the habitual residence test is the only requirement to satisfy the eligibility condition so is a necessary and sufficient condition for being allowed to apply for a council home. For EEA citizens (those from the EU and Norway, Iceland, Liechtenstein and Switzerland), they can apply for local authority housing if they have the right to reside in the UK which they automatically have if they are working (either as an employee or as self‐employed) or can support themselves or have lawfully been in the UK for 5 years. The right to reside for those who do not meet these criteria is the subject of evolving case law10. Non‐EEA citizens are ineligible to apply if they are subject to immigration control which means they do not have indefinite leave to remain and which typically also means they have no recourse to public funds. There are a variety of rules about when non‐EEA migrants can apply for indefinite leave to remain but for most immigrants it is currently after 5 years. An immigrant may also be eligible to apply for social housing if they have a child with British citizenship though this is typically only available to the children of immigrants once the parents have indefinite leave to remain so – in theory – coincides with the adult criterion for eligibility for social housing.
8 This question is only asked from 1992 onwards so is not available for the earlier years. 9 DCLG (2013), Annex 4. 10 See, for example, http://www.ftb.eu.com/local‐government‐pdf/ftb‐september‐2011‐de‐right‐to‐reside‐29‐final%281%29.pdf

7
If an individual is eligible they can include in their application anyone who is reasonably part of their household or family irrespective of whether they are eligible though ineligible household members cannot have the tenancy in their name11. This means that if one wants to apply for social housing, one should apply in the name of some household member who is eligible. This principle guides our selection of variables to include in the regressions later. The same rules apply to those housing association tenancies for which the local authority has ‘nomination’ rights i.e. can select the tenant. But, where the housing association itself selects the tenant they are not allowed to exclude anyone on the basis of their immigration status as to do so would make them vulnerable to being prosecuted for discrimination.
c. From Rules to Modelling Given the above discussion it seems to make sense to divide individuals into 5 mutually exclusive categories based on their country of birth and nationality. Our baseline category is adults who are born in the UK and who we would expect to be eligible to apply for social housing (though a small minority may not be e.g. if they have lived abroad for most of their life but the information in the available data sets does not allow us to identify this small group). One would expect that these individuals have access to UK citizenship if desired and to pass the ‘habitual residence test’12. We refer to these as the UK‐born or natives. Our second category are adults who are foreign‐born but have UK citizenship (probably through
naturalization but a minority probably from birth) and so will almost certainly be eligible to apply for
social housing. We refer to these as the foreign‐born UK citizens.
Our third category are adults who are foreign‐born, not UK citizens but do have EEA citizenship ‐ this
is a group that would be expected to have more eligibility for social housing than immigrants from
outside the EEA. In some of our analysis we separate this group into those containing A8 and other
EEA citizens, the A8 being the eight Eastern European countries who joined the EU in 2004 (see, for
example, McGhee et al, 2013 for a description of the experience of A8 migrants). We refer to these
as foreign‐born EEA citizens. Note that in recent years a non‐trivial fraction of EEA immigrants into
the UK were born outside the EEA i.e. have probably acquired EEA citizenship after first migrating to
an EEA country other than the UK.
Finally, the residual category are adults who are foreign‐born and do not have EEA citizenship. We
sometimes distinguish between those who have been in the UK for more or less than 5 years as this
is the most common cut‐off for having indefinite leave to remain. We refer to these as the non‐EEA
citizens.
Figure 5 shows the fraction in each category for immigrants has changed over time13. Currently
about 40% of adult immigrants are British citizens though it used to be about 50%. The fraction who
are non‐A8 EEA citizens is quite constant at about 20%, the proportion who are A8 citizens has risen
11 See, for example, http://www.housing‐rights.info/obtaining‐council‐housing.php 12 There is a small proportion of the UK‐born who do not report British citizenship I the LFS but we regarded them as too small to warrant separate statistical analysis. 13 Note that some changes can occur because of the accession of a country to the EEA so individuals born in that country will be moved from one category to another.

8
over the past 10 years to about 12% and the fraction who are non‐EEA citizens but have been in the
UK more than 5 years is also quite constant at about 20%. The fraction of immigrants who are non‐
EEA and in the UK less than 5 years rose from about 8% in the late 1980s to be about 20% in the
early 2000s since when it has fallen back to 10%. It is this last group that is the only group who we
might think are ineligible to apply for social housing – most immigrants in the UK would be eligible
by virtue of UK or EEA citizenship or having been in the UK sufficiently long.
This is all at the individual level but, as outlined above, it is households that apply for social housing
and it is the eligibility status of the proposed named tenant that is decisive in establishing eligibility.
We do not have information on who would be the proposed tenant but it is natural to assign
individuals to the household category which is most advantageous for applying to social housing and
some member of the household meets. So, if there is a UK –born citizen in a household, all individuals in the household would be put in that category whether or not they – as individuals were
UK born citizens. Figure 6 shows the proportions of immigrants in the different categories defined in
this way. Currently about one‐third of immigrants are in households where there is an adult UK
native, and slightly under 30% in a household with a foreign‐born UK citizen. Under 10% of
immigrants are in households where no adult is a UK/EEA citizen and no adult has been in the UK
less than 5 years – this is the only group one would not expect to have eligibility to apply for social
housing.
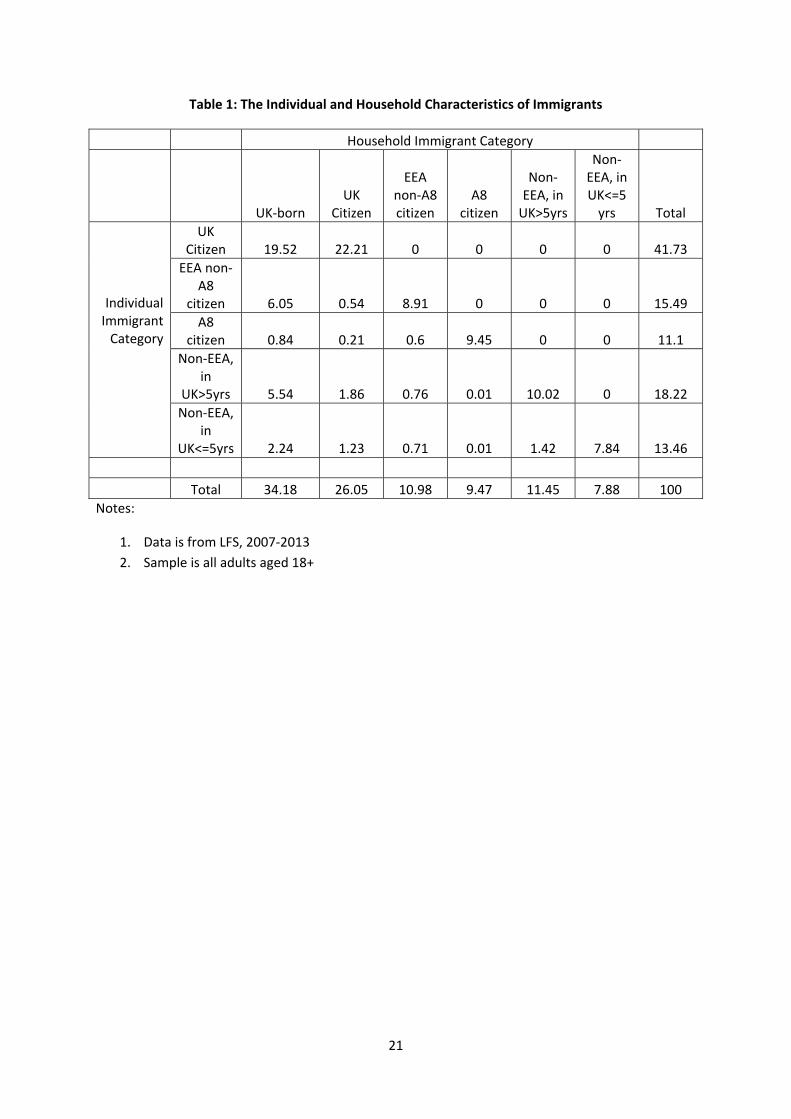
Figure 6 says nothing about the link between individual and household status – this data for the
period since 2007 is provided in Table 1. For example, among new non‐EEA immigrants in the UK,
16.6% are in a household where at least one adult was born in the UK, 9.1% in a household where all
adults are foreign‐born but at least one has UK citizenship, another 5.3% in a household where
someone has non‐UK EEA citizenship, and 10.5% in a household with all non‐EEA citizens but for
whom at least one has been in the UK for more than 5 years. Of non‐EEA migrants who have been in
the UK less than 5 years only 58% are in households where all adults are in the same situation. So,
looked at from the individual perspective we would expect 13.5% of adult immigrants to be ineligible
to apply for social housing but, viewed at the household level, that falls to 7.8%. So, the vast
majority of immigrants would seem to be eligible to apply for social housing but, just because one is
eligible to apply does not mean one becomes a tenant. To address this issue we turn to the
statistical analysis of the allocation of social housing.
3. The Probability of Being in Social Housing 2007‐2013
Eligible households who apply for social housing are placed on a waiting list. The 1996 Housing Act
required local authorities to give priority to various needy groups e.g. households with children, the
elderly, the sick the homeless and those living in unsatisfactory accommodation (see Rutter and
Latorre, 2009, for more extensive discussion). But local authorities do have some discretion in the
way this is interpreted and other factors that might be taken into account. Most use some type of
points or banding system to decide the level of priority that a household has e.g. giving more points
to households with dependent children. When a property becomes vacant most social landlords now
use a choice‐based letting scheme in which all households on the list can bid for the vacancy and it is
given to the household with the highest number of points. All of this means that the outcome we
observe – whether an individual is in social housing – represents the outcome of a demand for social
housing by that individual and the allocation of a tenancy according to the rules described above.

9
We start our empirical analysis by considering the most recent period, 2007‐2013. We estimate
probit models where the dependent variable is being in social housing. We estimate at an individual
level but our characteristics are all defined at the household level – this effectively gives more
weight to larger households as seems appropriate. We cluster the standard errors at the household
level both to deal with this issue and to deal with the fact that the LFS is a short panel.
As regressors we use some variables to measure the immigrant status of the household. We include
the native‐immigrant categories defined at household level as reported above. But we also include
the fraction of adults in the household who are members of the five categories as these variables do
turn out to have considerable explanatory power (though Table A6 in the Data Appendix reports a
specification in which these are omitted). In a later analysis we consider the impact of years since
arrival in the UK. Time in the UK should be important partly because it affects eligibility for some
recent immigrants (as described above) but also because it takes time to get into social housing
especially once on the waiting list. As it is likely to be the adult who has been in the UK the longest
who is most important in determining eligibility, we use as the maximum time in the UK of any adult
household member as our regressor.
Obviously we need to control for other factors that affect whether an individual is likely to be in
social housing – we group these into demographic, regional and economic.
Demographic variables
We control for whether there is more than one adult in the household, the number of post‐
retirement age adults, whether there any children, the number of children and the introduction of
multi‐adult household with children – these variables are chosen because they seem to have the
most explanatory power. In addition we control for the ages of the youngest and oldest child, and a
quadratic in the age of the youngest and oldest adults in the household.
Regional Variables
There is a large variation in both the provision of social housing across the UK and the distribution of
immigrants so we include in our main analysis dummy variables for the 20 regions recorded in the
LFS.
Economic variables
We control for whether any adult in the household is in work, the number of adults in work in the
household and, where in work the highest –earning 2‐digit occupation of any member of the
household. The average earnings by occupation are taken from ASHE 2012 and the regressor we use
is a quadratic in the average earnings of that occupation. We sometimes also control for total
household weekly labour income relative to average weekly earnings in that year, though are sample
is reduced in this case because the income questions are only asked in waves 1 and 5.
One variable we do not include is education. This is because there are serious problems in the UK
LFS with the measurement of the education of immigrants. For much of our sample period,
qualifications earned abroad were deliberately classified as ‘other qualifications’ even if, for example,
it was a college degree, But ‘other qualifications’ for a UK native would typically be a very low level
of qualification. The use of this variable makes immigrants seem worse qualified than they really are.

10
The LFS also contains information on the age left full‐time education but there is evidence that
immigrants take longer to attain a given level of qualification so this tends to over‐state immigrants’
education14. Table A7 in the Data Appendix presents some results when we do control for age left
full‐time education.
In many ways occupation is a better measure than education for the current purposes as it measures
how well a household is doing in the UK labour market so takes account, for example, that some
foreign qualifications may not attract the same return as seemingly equivalent UK qualifications. It is
the household’s economic circumstances and not their education that would appear on any
application for social housing.
Country variables
We sometimes control for the detailed country of birth of members of the household and
sometimes summarize this by using the log of GDP per capital relative to the UK and the Gini
coefficient relative to the UK level (Borjas and Trejo, 1993, found both variables to be important for
explaining welfare receipt in the US)15.
We also sometimes control for the ethnic composition of the household using nine categories (white,
mixed, Indian, Pakistani, Bangladeshi, Chinese, other Asian, Black and Other).
Table 2 presents some descriptive statistics for immigrant and native households16. Immigrant
households do differ from native households in a number of respects but there is also considerable
heterogeneity within immigrant categories. For example, the A8 migrants are markedly younger and
have been in the UK less time, are very much less likely to be owner‐occupiers, are more likely to be
in work but in much lower‐paid occupations. Immigrants tend to be from countries poorer and
more unequal than the UK though this is less marked for EEA migrants (as one would expect). Those
immigrants who have become UK citizens have been in the UK longer. The ethnic mix of migrants is
different from that of natives (mainly in being less white) and also varies by immigrant category – for
example almost all individuals in A8 households are white households but it is less than 80% for
immigrants from the rest of the EEA.
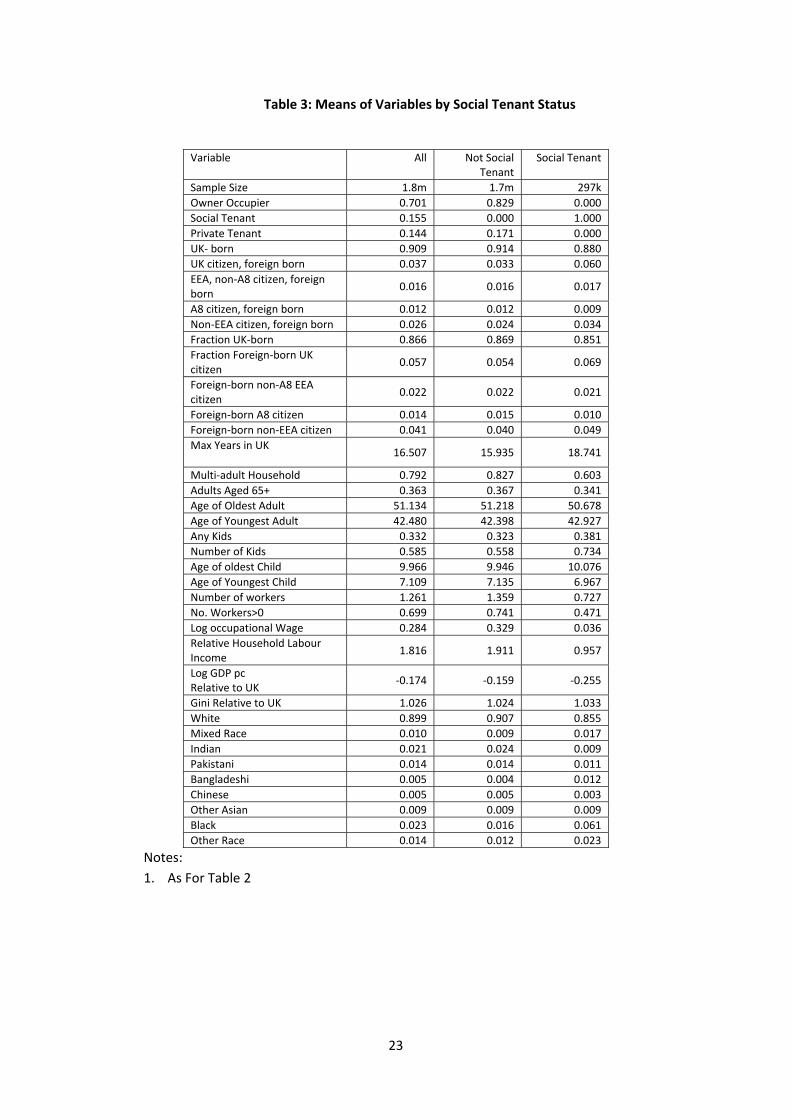
Table 3 presents the descriptive statistics but disaggregated by whether individuals are social
tenants or not. Immigrants as a whole are slightly over‐represented in social housing (as we saw in
Figure 3) but there is considerable heterogeneity – individuals in A8 households are under‐
represented in social housing while individuals in foreign‐born UK‐citizen households are heavily
over‐represented. But the most striking differences between social tenants and the rest of the
population is that social tenants are much more likely to be in single‐adult households, much less
likely to be in work and when in work to be in lower‐paid occupations. Social tenants are also less
likely to be white but not all non‐white groups are over‐represented in social housing. Indians and
Pakistanis are less likely to be in social housing while Bangladeshi and Black ethnicities are heavily
14 For example, while only 1.3% of the UK‐born report leaving education aged 25 or older, the proportion is over 20% for immigrants from Nigeria and these immigrants are not all working in Phd‐level occupations. 15 Borjas and Trejo (1993) also offered a hypothesis to explain why those variables are important based on the free choice of immigrants. But as immigration and access to social housing are heavily influenced by institutional rules there may be other explanations for the empirical regularities discovered. 16 We only report means in the main text as many variables are binary. Standard deviations are presented in the Data Appendix.

11
over‐represented (this variation across ethnic minorities is well‐known – see, for example, Robinson,
1980; Peach, 1998; Hamnett and Butler, 2010) .
Of course, one can learn a lmited amount from Tables 2 and 3 because so many of the variables are
correlated with each other – we next turn to regression results. Table 4 presents our basic results
for the period 2007‐201317. The dependent variable is whether the individual is in social housing.
The sample is adults aged 18 and over. The reported coefficients are marginal effects from a
baseline characteristics vector which are households that contain someone who is British born and
(where the relevant variables are included) have one adult, aged 35, not working and two children
aged 10 and 7 and living in the south‐east of England . We refer to a household with these
characteristics as the baseline household – it is a group among which social tenancy is common. The
first column simply controls for year in addition to household immigrant status (though the year
dummies are insignificant). This shows that relative to the baseline household some immigrant
households are more and some less likely to be in social housing. Households which only contain
EEA citizens are equally likely to be in social housing as the native households and those with A8
citizens are less likely. But, those containing a foreign‐born British citizen are 7.9% points more
likely than the UK –born to be in social housing and those containing no EAA citizens are 5.2% more
likely to be in social housing. These are quite likely to be similar groups differing primarily in the
time they have been in the UK as citizens from many poorer non‐EEA countries find it advantageous
to acquire UK citizenship if they are entitled to do so after remaining in the UK for a while. These
marginal effects are based on comparing households in which 100% of the adults are in the relevant
category. But there is also an important impact from the composition of the household – for a given
household immigrant category the probability of being in social housing is lower if there are more
immigrants in the household18. Most of this variation comes from households with a native adult
and it shows, for example, that a household with 2 adults, one UK‐born and the other a foreign‐born
UK citizen are 5.5 percentage points less likely to be in social housing (this household has 0.5 for the
fraction foreign born UK citizen which multiplies the ‐0.11 coefficient).
Of course, the results in column (1) do not control for characteristics and successive columns of
Table 4 add more controls. The second column adds demographic controls and this has the effect of
reducing the coefficients of all immigrant groups except for the A8. This comes about because
households with more children, who are older etc are more likely to be in social housing (detailed
regressions are in Table A5 in the Appendix) and these tend to be characteristic of immigrant
households (see Table 2). The third column then adds regional controls which is important because
immigrants are not evenly spread throughout the UK and neither is the supply of social housing.
This has the effect of reducing all coefficients on immigrant categories because they tend to over‐
represented in London where there is more social housing. The fourth column adds economic
variables (the number of adults in work and the occupational standing of the household). This has a
very large effect, making the coefficients on all immigrant categories negative and significantly
different from zero with the exception of the foreign‐born UK citizen group. This shows, that
17 In the main text we present only the coefficients on the immigrant variables but the coefficients on all variables is reported in the Data Appendix. 18 The Data Appendix reports a specification in which we do not control for the composition of the household – the results are very similar.

12
conditional on economic circumstances, immigrant households are less likely than native households
to be in social housing. We use this as our baseline specification.
This conclusion is based on the number of adults in work in the household and the occupational
standing of the household rather than actual household labour income. Labour income is only
available in the LFS for households in wave 1 and 5 but, for this sub‐set we can investigate the effect
that controlling for that has. Column (5) has the same specification as column (4) but restricted to
the sample for which total labour income is available. The results are similar showing that the
change in sample does not, by itself, change the results. The sixth column then includes household
income relative to the annual average. By comparing columns (5) and (6) one can see that the
inclusion of actual household labour income has only a small effect on our results.
But there seems to be a significant effect not just of actual household income and occupation but
the average income level of the country in which one was born. The seventh column includes a
quartic in log gdp per capita and the Gini coefficient in the country of birth relative to the UK (both
of these variables being found significant by Borjas and Trejo, 1993, for the receipt of welfare in the
US). With inclusion of these variables the dummy variables on the immigrant categories become
even more negative. The reason is that immigrants from poorer and more unequal countries 9these
often being the same countries) do seem to have a higher propensity to be in social housing in
addition to their actual economic circumstance in the UK. Finally, we control for the ethnic mix of
the household controlling for the proportion of the household in nine ethnic groups. All the
estimated coefficients on the immigrant categories remain negative and sizeable.
Our conclusion from Table 4 is that when one compares equivalent households, immigrants are
much less likely than natives to be in social housing. But some immigrant groups do have
characteristics (more children, lower economic status, concentration in cities, and coming from
poorer countries) that are risk factors for all groups in being social housing. So the comparisons
without controls are misleading.
Table 5 investigates the robustness of this conclusion to a number of other specifications. For
example, every variable included in Table 5 is defined at the household level – the second column of
Table 5 shows that the inclusion of individual immigrant and citizenship variables has only tiny
additional explanatory power suggesting that our specification does not omit any key household
variables. Secondly, we investigate whether the immigrant and citizenship status of children has any
additional explanatory power. We include as variables whether there is a child who is UK‐born and
not interacted with the immigrant status. The results suggest that having a child whether UK born or
not has an additional positive effect on the probability of immigrants being in social housing.
All of these regressions pool local authority and housing association tenants together. Table A8 in
the Data Appendix reports estimates from models for the probability of being in local authority
housing conditional on being a social tenant. Most of the coefficients are not very large suggesting
that there is little difference in the allocation of local authority and housing association homes, the
one exception being that there is some evidence that A8 migrants are less likely to be in local
authority housing.

13
The Impact of Time in the UK
One important variable that has not been controlled for so far is time since arrival in the UK. This is
likely to be important for two reasons. First, as described earlier, non‐EEA citizens only become
eligible for social housing when they have indefinite leave to remain which typically takes 5 years.
Secondly, because social housing is in excess demand, it takes time to be allocated social housing
even after one is on the waiting list and an immigrant household cannot go on the list until they
arrive in the UK.
Figure 7 presents the raw data on the fraction of immigrants in different categories who are in social
housing according to the longest time in the UK of any adult household member. We also show the
fitted values from a group‐specific cubic in a probit model – this can be seen to be a good
approximation for all groups. The proportion in social housing for UK natives is also shown as a
comparison. For all groups of immigrant households recent immigrants have a lower probability of
being in social housing than natives. The proportion then rises equalling that of natives after about 5
years. For EEA citizens (both A8 and non‐A8) the proportion then stabilizes at a level similar to that
for natives (though the data for A8 citizens at long durations is very noisy as there are very few
observations). But for those immigrants who become UK citizens or who remain non‐EEA citizens
the proportion in social housing rises above the native proportion peaking after about 15 years and
then declining with – in the case of those who become UK citizens – the decline being to about the
native rate. These immigrant groups follow a hump‐shaped pattern.
One might observe this hump‐shape in the raw data because of a failure to control for other relevant
factors e.g. age. But it persists even when we do control for these factors as can be seen in Figure 8
which shows the predicted proportions (based on a cubic) when one controls for demographic
regional and economic variables (column 4 of Table 4). all groups continue to show a hump‐shaped
pattern. For the EEA groups they are always below natives but for the UK and non‐EEA groups they
are first below that native rate then above it before falling back to end up below it again. A natural
interpretation for this hump‐shaped pattern is that newly‐arrived immigrants are almost all in
private rental housing but aspire to home ownership. It takes time to acquire the financial resources
to buy a home and, in the meanwhile, social housing is more attractive than the private rental sector.
4. Waiting Lists and Allocations
We have estimated models for the probability of being in social housing. This reflects not just the
allocation rules but the demand for social housing. So, if a group is found to be less likely to be in
social housing that could be because it has a lower demand for social housing and tells us little about
the allocation rules. With the LFS we cannot investigate this further because we have no indication
of whether individuals who are not in social housing would like to be. But, in the English Housing
Survey (EHS) we do have some information about whether households are on a waiting list for social
housing.
The EHS is an annual survey of about 13000 households in England that has been conducted since
200819. We use the surveys for 2008‐2010 inclusive.
19 It is a successor to the Survey of English Housing which had been conducted since the early 1990s. But the earlier survey has no information on immigrant status so is no use for our purpose.

14
In most regards the EHS is inferior to the LFS as sample sizes are much smaller, it covers only England
and contains less information about individuals. But, it does ask a question about waiting lists,
specifically “are you (or anyone else in the household) on a council house or housing association
waiting list (or transfer list)?”. We use the answer to this question to identify those households who
are actively demanding social housing. In our sample period 3.77% of adults report being on a
waiting list which compares with 14.73% in social housing. But, something like 40% of those who
report being on a waiting list are already yin social housing (it being possible they are seeking a
better home) so that only 2.23% of the adult population are not currently in social housing and on a
waiting list. One might conclude form this that the excess demand is of the order of 15% than the
actual numbers in social housing20.
Because the individual data is not as rich in the EHS as the LFS we need to modify our regressors to
fit what is available.
First, and most importantly, the EHS asks whether one is born in the UK and whether one is a UK
citizen21 but – if one is not – there is no information on country of birth or nationality. This means
that we cannot distinguish EEA from non‐EEA citizens or the A8 citizens within the EEA group. So our
analysis uses three household categories – those containing a UK‐born adult, those without a UK‐
born adult but with an adult UK citizen and those without any adults who are UK born or citizens.
Secondly, the region variable is different being at the government office region level. And, finally the
occupation question is coded according to the National Statistics Socio‐Economic Classification22
which is similar but not identical to an occupational classification. We take the highest coded one‐
digit code as a measure of occupational attainment for the household. All other variables are as in
the LFS.
As a starting point we compare estimates of the probability of being in social housing in the EHS and
the LFS where the LFS data is comparable to the EHS data. This is done in the first two columns of
Table 6 where there are no other controls apart from year dummies and in Table 7 for our baseline
specification (that includes demographic, regional and economic variables). The first two columns of
Table 6 shows that – without controls – the LFS and EHS estimates are quite similar with both
household immigrant categories being more likely to be in social housing than natives. With
baseline controls, the estimates reported in the first two columns of Table 7 show more difference in
the two surveys – in the LFS both immigrant categories are less likely than natives to be in social
housing while the immigrant penalties are lower in the EHS where only the penalty on non UK
citizens is significantly different from zero. In both surveys, with and without controls, households
with a higher fraction of immigrants are less likely to be in social housing.
Of course this does not tell us whether immigrants are less likely to demand social housing or to be
allocated it when they demand it. To investigate this we construct a binary variable taking the value
one if the household is in social housing or on a waiting list – we use this as our measure of demand.
The third columns of Table 6 and Table 7 show the results when this is our binary variable. Without
20 This obviously does not count any discouraged prospective tenants who do not apply because they feel they would not be allocated a home. 21 Though the nationality question does not seem to coded for 2011. 22 For details see http://www.ons.gov.uk/ons/guide‐method/classifications/current‐standard‐classifications/soc2010/soc2010‐volume‐3‐ns‐sec‐‐rebased‐on‐soc2010‐‐user‐manual/index.html

15
controls (the third column of Table 6) both household immigrant categories are more likely to
demand social housing than natives. With controls (the third column of Table 7) these effects are
not significantly different from zero. This suggests that – once one controls for the baseline
characteristics, immigrants and natives have very similar demands for social housing.
To consider the allocation of social housing among those who demand it, the fourth columns of
Tables 6 and 7 use as a sample those who demand social housing and as a dependent variable
whether individuals are in social housing. The negative coefficients reported both with and without
controls suggest that, conditional on demanding social housing, immigrant households are less likely
than natives to be in social housing i.e. that the allocation process acts, if anything in favour of
natives. In these specifications household composition has little significant impact.
One possible explanation for this is that native households are more likely to have been on a waiting
list for longer because immigrants cannot go on a waiting list until they arrive in the UK (and are
likely to have to wait a longer period even then). The final columns of Table 6 and 7 investigates this
by using as a sample whether an individual is on the waiting list or is a new tenant (defined as having
been in the property for less than a year, the best that is available) so were on the waiting list
recently. Here the sample sizes are very small but none of the coefficients are significantly different
from zero, suggesting fairness in the allocation of newly vacant properties to immigrants and natives.
5. Changes Over Time
The analysis so far has focused on the contemporary situation but there is also some interest in
whether there has been any change over time. To this end, we estimate models similar to the ones
we have so far for each individual year from 1985 to 2013. We then report coefficients for each year.
Because A8 migrants did not exist prior to 2004 we pool both the EEA migrants into a single group.
Figures 9‐11 shows the changes for different specifications. In each figure the first panel shows the
predicted probability of being in social housing for a native household with base characteristics and
the probability for different types of immigrant household with the same characteristics. The
second panel shows the difference in the probabilities of being in social housing of native and
immigrant households i.e. is the marginal effect at base characteristics.
Figure 9 shows the results when there are no controls – these are simply the sample proportions in
social housing for different immigrant groups. The first panel shows the decline for native
households and EEA citizen households follow a similar path. But for foreign‐born UK households
the proportion in social housing is actually rising – at the start of the period they were 10 percentage
points less likely than natives to be in social housing but were 10 percentage points more likely by
the end (as can be seen from the second panel). For non‐EEA citizen households, they started being
much less likely than natives to be in social housing, but this rose to being considerably above by
about 2000 before declining somewhat to end up being very similar.
Of course, these different trends might be accounted for by the changing composition of native and
immigrant households over this period. Figure 10 does the same exercize but including our baseline
controls (column 4 of Table 4). The native proportion now refers to the probability of someone
being in social housing for a household with base characteristics which are above the average. Note
that the native proportion in social housing declined from 1985‐1995 but then rose to 2000 before
16
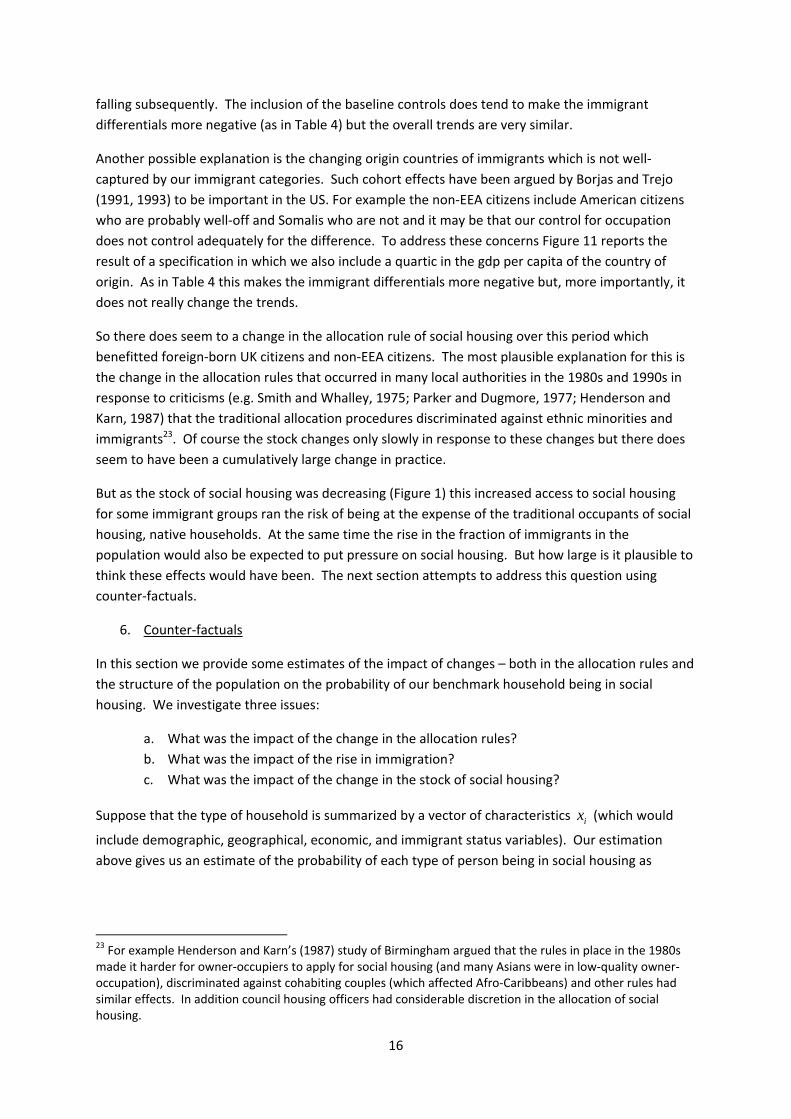
falling subsequently. The inclusion of the baseline controls does tend to make the immigrant
differentials more negative (as in Table 4) but the overall trends are very similar.
Another possible explanation is the changing origin countries of immigrants which is not well‐
captured by our immigrant categories. Such cohort effects have been argued by Borjas and Trejo
(1991, 1993) to be important in the US. For example the non‐EEA citizens include American citizens
who are probably well‐off and Somalis who are not and it may be that our control for occupation
does not control adequately for the difference. To address these concerns Figure 11 reports the
result of a specification in which we also include a quartic in the gdp per capita of the country of
origin. As in Table 4 this makes the immigrant differentials more negative but, more importantly, it
does not really change the trends.
So there does seem to a change in the allocation rule of social housing over this period which
benefitted foreign‐born UK citizens and non‐EEA citizens. The most plausible explanation for this is
the change in the allocation rules that occurred in many local authorities in the 1980s and 1990s in
response to criticisms (e.g. Smith and Whalley, 1975; Parker and Dugmore, 1977; Henderson and
Karn, 1987) that the traditional allocation procedures discriminated against ethnic minorities and
immigrants23. Of course the stock changes only slowly in response to these changes but there does
seem to have been a cumulatively large change in practice.
But as the stock of social housing was decreasing (Figure 1) this increased access to social housing
for some immigrant groups ran the risk of being at the expense of the traditional occupants of social
housing, native households. At the same time the rise in the fraction of immigrants in the
population would also be expected to put pressure on social housing. But how large is it plausible to
think these effects would have been. The next section attempts to address this question using
counter‐factuals.
6. Counter‐factuals
In this section we provide some estimates of the impact of changes – both in the allocation rules and
the structure of the population on the probability of our benchmark household being in social
housing. We investigate three issues:
a. What was the impact of the change in the allocation rules?
b. What was the impact of the rise in immigration?
c. What was the impact of the change in the stock of social housing?
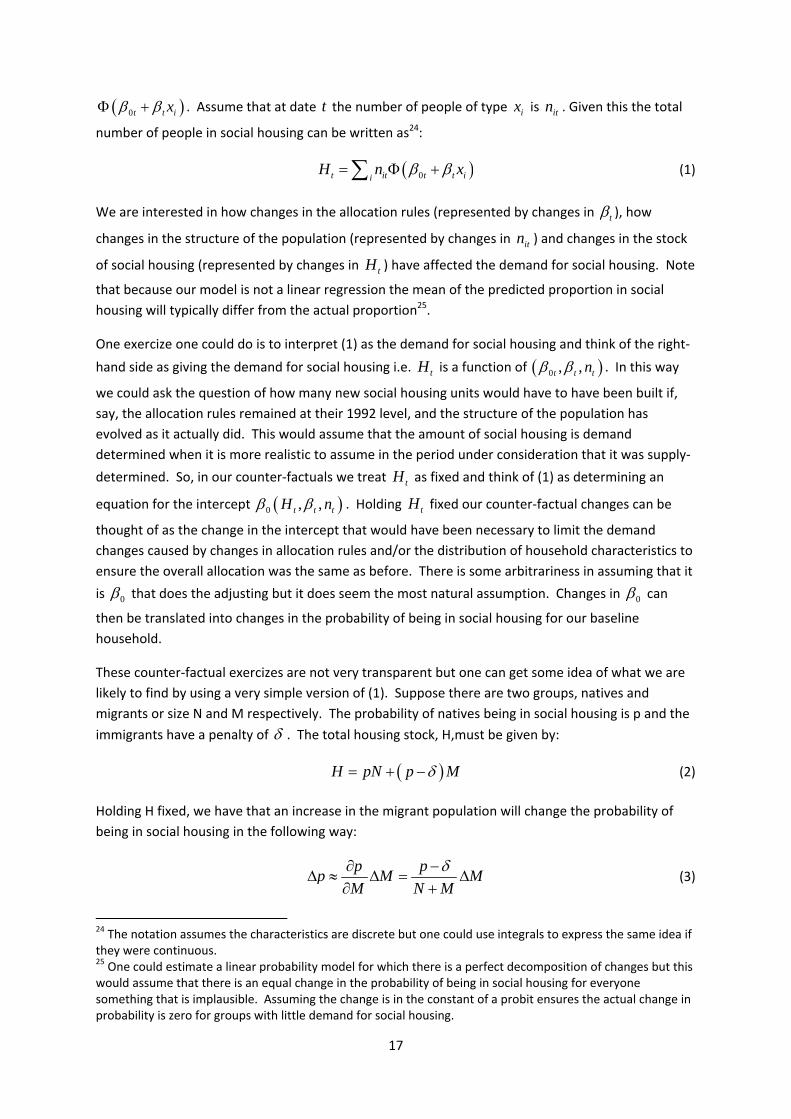
Suppose that the type of household is summarized by a vector of characteristics ix (which would
include demographic, geographical, economic, and immigrant status variables). Our estimation
above gives us an estimate of the probability of each type of person being in social housing as
23 For example Henderson and Karn’s (1987) study of Birmingham argued that the rules in place in the 1980s made it harder for owner‐occupiers to apply for social housing (and many Asians were in low‐quality owner‐occupation), discriminated against cohabiting couples (which affected Afro‐Caribbeans) and other rules had similar effects. In addition council housing officers had considerable discretion in the allocation of social housing.
17
0t t ix . Assume that at date t the number of people of type ix is itn . Given this the total
number of people in social housing can be written as24:
0t it t t iiH n x (1)
We are interested in how changes in the allocation rules (represented by changes in t ), how
changes in the structure of the population (represented by changes in itn ) and changes in the stock
of social housing (represented by changes in tH ) have affected the demand for social housing. Note
that because our model is not a linear regression the mean of the predicted proportion in social
housing will typically differ from the actual proportion25.
One exercize one could do is to interpret (1) as the demand for social housing and think of the right‐
hand side as giving the demand for social housing i.e. tH is a function of 0 , ,t t tn . In this way
we could ask the question of how many new social housing units would have to have been built if,
say, the allocation rules remained at their 1992 level, and the structure of the population has
evolved as it actually did. This would assume that the amount of social housing is demand
determined when it is more realistic to assume in the period under consideration that it was supply‐
determined. So, in our counter‐factuals we treat tH as fixed and think of (1) as determining an
equation for the intercept 0 , ,t t tH n . Holding tH fixed our counter‐factual changes can be
thought of as the change in the intercept that would have been necessary to limit the demand
changes caused by changes in allocation rules and/or the distribution of household characteristics to
ensure the overall allocation was the same as before. There is some arbitrariness in assuming that it
is 0 that does the adjusting but it does seem the most natural assumption. Changes in 0 can
then be translated into changes in the probability of being in social housing for our baseline
household.
These counter‐factual exercizes are not very transparent but one can get some idea of what we are
likely to find by using a very simple version of (1). Suppose there are two groups, natives and
migrants or size N and M respectively. The probability of natives being in social housing is p and the
immigrants have a penalty of . The total housing stock, H,must be given by:
H pN p M (2)
Holding H fixed, we have that an increase in the migrant population will change the probability of
being in social housing in the following way:
p p
p M MM N M
(3)
24 The notation assumes the characteristics are discrete but one could use integrals to express the same idea if they were continuous. 25 One could estimate a linear probability model for which there is a perfect decomposition of changes but this would assume that there is an equal change in the probability of being in social housing for everyone something that is implausible. Assuming the change is in the constant of a probit ensures the actual change in probability is zero for groups with little demand for social housing.

18
So if, for example, the proportion of immigrant households in the population rises from 5% to 10%
and 20% are in social housing the probability of a native being in social housing would fall by 1
percentage point. Similarly, if the immigrant penalty changes we have:
p M
pN M
(4)
So that, if, for example the immigrant penalty falls by 10 percentage points and immigrants are 10%
of the population, this will reduce the probability of being in social housing for natives by 1
percentage point.
Finally if the housing stock changes we will have that:
1p p H
p H HH N M H
(5)
If is small. If the social housing stock falls by 20% then the probability of being in social housing
will also fall by about 20% or 4 percentage points from a base of a 20% social tenancy rate.
Our counter‐factual estimates are more sophisticated than this but these back‐of‐the envelope
calculations but they do give some transparent idea of likely orders of magnitude. The results of our
counter‐factual analyses are presented in Figure 12 – all results relate to our baseline specification
and the probability of being in social housing for a household with baseline characteristics (which is
quite high). The actual probability of being in social housing is identical to that reported in Figure 9 –
the fall from 1992 to 201326 is from 61.7% to 51.5% i.e. a fall of 10.2 percentage points. This
obviously reflects changes in the demographics of the population (both native and migrant), changes
in the allocation rules and changes in the social housing stock. We construct counter‐factuals to
show what would have happened if some of these factors had been held constant.
The first counter‐factual (changing allocation rules) shows what would have happened to the
probability of being in social housing for our baseline household if the population and housing stock
had been held at their 1992 levels and only the allocation rules had been changed (the ’s in (1))
As can be seen the probability of being in social housing would have first risen and then fallen ending
up much where it started and considerably above where it actually ended up. But this is the impact
of the change in all the ’s, not just those related to immigrants. So the next counter‐factual
(changes in immigrant allocation rule) only changes the ’s relating to immigrants (essentially those
reported in Figures 9‐11) and keeps all others at their 1992 level. This can be seen to reduce the
probability of being in social housing for our baseline household by 1 percentage point i.e. the effect
is small. The reason is that while the change in some of the coefficients in Figure 9 are large the
proportion of immigrants in the population is small so this translates into a small overall change in
the probability of being in social housing – as would be expected from (4).
The next counter‐factual (“changes in immigrant population”) holds the ’s and the total housing
stock at their 1992 levels but changes the cell sizes of the immigrant population in line with the
26 The starting date is partly determined by the start of the quarterly LFS after which the data are more consistent over time and partly because the earlier period was heavily influenced by council house sales.

19
actual increase (though the composition within immigrant groups is held at the 1992 level). This can
be shown to reduce the probability of being in social housing for our baseline household by about
2.7 percentage points i.e. about a third of the total fall.
The final counter‐factual (“changes in social housing stock”) keeps the allocation rule and
demographic structure constant at the 1992 level and then alters the housing stock in line with the
actual change. This is predicted to have caused a fall of about 5.9 percentage points i.e. most of the
change.
So our conclusion is that the increase in the population from migration together with a failure to
increase the social housing stock can explain about 2.7 percentage points of the 10.1 percentage
point reduction in the probability of being in social housing and the change in the allocation rules in
favour of migrants another 1.0 percentage point. But the decline in the stock explains about 5.9
percentage points of the reduction so is the more important factor. Note that because this is a non‐
linear model there is no requirement for the components to add up and we have not done a
complete decomposition which would be complicated and uninformative considering there are
changes in the sizes of different groups, the composition of these groups, and the allocation process
as it relates to different groups.
7. Conclusions
In this paper we have investigated the impact of immigration on social housing in the UK, atopic of
contemporary relevance because of a widespread perception that immigrants get preferential
access to social housing. Our conclusions are that the vast majority of immigrants in the UK are
likely to be eligible to apply for social housing. But, in terms of access to social housing, the
contemporary situation is that immigrant households are slightly more likely than native households
but, once one controls for demographic, economic and regional circumstances, immigrant
households are less likely to be in social housing than equivalent native households. There is
certainly no evidence of discrimination in favour of immigrant households as is believed by a sizeable
fraction of the white British population. However we show that there has been some important
changes – the immigrant penalty has fallen over time. So, the combination of a rising immigrant
population and a change in the allocation rules that benefit immigrants has combined with a
declining social housing stock to reduce the probability of native households having access to social
housing. We constructed a series of counter‐factuals to ‘explain’ the fall in the probability of being
in social housing – the decline in the size of the social housing stock explains about two‐thirds of the
fall with the rise in the immigrant population and the change in the allocation rule explaining about
one‐third.
Our analysis has been of the UK and its institutions27 but many other countries have a sizeable social
housing sector where rents are below market levels (see, for example, Andrews et al, 2011) and we
would expect the conclusions to have some relevance to them. And housing in general and social
27 Because of the rent subsidy, it is almost inevitable that institutional features loom large in the analysis of social housing because of the need for the rules that ration the excess demand that is likely to exist whenever public rents are below private rents. This makes it harder to draw very general conclusions compared to, for example, labour market impacts that might be expected to be broadly similar across time and space though Angrist and Kugler (2003) emphasize there are institutional aspects to the labour market impacts of immigration as well.

20
housing in particular is an area where conflict between natives and migrants over access to scarce
resources may be both more real (because the housing stock is inelastic in the short‐run) and more
salient because it is visible in a way that, for example, immigrant receipt of welfare is not. So the
study of social housing may shed light on the wider conflicts, perceived or real, between natives and
migrants that make immigration such a contentious topic in many countries.
21
Table 1: The Individual and Household Characteristics of Immigrants
Household Immigrant Category
UK‐born UK
Citizen
EEA non‐A8 citizen
A8 citizen
Non‐EEA, in UK>5yrs
Non‐EEA, in UK<=5 yrs Total
Individual Immigrant Category
UK Citizen 19.52 22.21 0 0 0 0 41.73
EEA non‐A8
citizen 6.05 0.54 8.91 0 0 0 15.49
A8 citizen 0.84 0.21 0.6 9.45 0 0 11.1
Non‐EEA, in
UK>5yrs 5.54 1.86 0.76 0.01 10.02 0 18.22
Non‐EEA, in
UK<=5yrs 2.24 1.23 0.71 0.01 1.42 7.84 13.46
Total 34.18 26.05 10.98 9.47 11.45 7.88 100
Notes:
1. Data is from LFS, 2007‐2013
2. Sample is all adults aged 18+

22
Table 2: Means of Main Variables by Household Immigrant Categories
Variable All UK‐ born UK citizen, foreign born
EEA, non‐A8 citizen, foreign born
A8 citizen, foreign born
Non‐EEA citizen, foreign born
Sample Size 1.8m 1.6m 65677 27327 20796 43801
Owner Occupier 0.701 0.735 0.563 0.321 0.097 0.217
Social Tenant 0.155 0.150 0.250 0.163 0.118 0.205
Private Tenant 0.144 0.115 0.188 0.515 0.785 0.578
UK‐ born 0.908 1.000 0.000 0.000 0.000 0.000
UK citizen, foreign born 0.037 0.000 1.000 0.000 0.000 0.000
EEA, non‐A8 citizen, foreign born
0.016 0.000 0.000 1.000 0.000 0.000
A8 citizen, foreign born 0.012 0.000 0.000 0.000 1.000 0.000
Non‐EEA citizen, foreign born
0.026 0.000 0.000 0.000 0.000 1.000
Fraction UK‐born 0.866 0.954 0.000 0.000 0.000 0.000
Fraction Foreign‐born UK citizen
0.057 0.027 0.868 0.000 0.000 0.000
Foreign‐born non‐A8 EEA citizen
0.022 0.008 0.020 0.830 0.000 0.000
Foreign‐born A8 citizen 0.014 0.001 0.007 0.049 0.998 0.000
Foreign‐born non‐EEA citizen
0.041 0.010 0.105 0.120 0.002 1.000
Max Years in UK 16.507 25.511 14.763 5.504 9.648
Multi‐adult Household 0.792 0.798 0.703 0.710 0.871 0.739
Adults Aged 65+ 0.363 0.380 0.324 0.192 0.014 0.079
Age of Oldest Adult 51.134 51.828 50.595 43.929 35.410 39.237
Age of Youngest Adult 42.480 43.010 42.333 38.360 28.545 33.017
Any Kids 0.332 0.321 0.458 0.339 0.472 0.462
Number of Kids 0.585 0.560 0.950 0.623 0.704 0.855
Age of oldest Child 9.966 10.030 9.858 9.291 8.371 9.047
Age of Youngest Child 7.109 7.190 6.588 6.321 5.797 6.078
Number of workers 1.261 1.267 1.013 1.258 1.931 1.133
No. Workers>0 0.699 0.696 0.663 0.743 0.951 0.716
Log occupational Wage 0.284 0.289 0.234 0.274 0.079 0.264
Relative Household Labour Income
1.816 1.829 1.660 1.954 1.406 1.704
Log GDP pc Relative to UK ‐0.174 ‐0.050 ‐1.798 ‐0.568 ‐0.560 ‐1.798
Gini Relative to UK 1.026 1.007 1.260 1.073 1.034 1.325
White 0.899 0.946 0.285 0.781 0.946 0.193
Mixed Race 0.010 0.009 0.023 0.031 0.003 0.018
Indian 0.021 0.012 0.161 0.021 0.000 0.160
Pakistani 0.014 0.009 0.093 0.010 0.000 0.047
Bangladeshi 0.005 0.003 0.053 0.002 0.000 0.023
Chinese 0.005 0.002 0.031 0.006 0.000 0.075
Other Asian 0.009 0.003 0.085 0.019 0.000 0.103
Black 0.023 0.011 0.181 0.048 0.000 0.208
Other Race 0.014 0.005 0.088 0.082 0.051 0.173
Notes.
1. Data is from LFS, 2007‐2013 and refers to adults aged 18+.
2. Means of region variables are reported in the Data Appendix as are standard deviations of
all variables.
3. Immigration variables refer to household status as defined in the text.
23
Table 3: Means of Variables by Social Tenant Status
Variable All Not Social Tenant
Social Tenant
Sample Size 1.8m 1.7m 297k
Owner Occupier 0.701 0.829 0.000
Social Tenant 0.155 0.000 1.000
Private Tenant 0.144 0.171 0.000
UK‐ born 0.909 0.914 0.880
UK citizen, foreign born 0.037 0.033 0.060
EEA, non‐A8 citizen, foreign born
0.016 0.016 0.017
A8 citizen, foreign born 0.012 0.012 0.009
Non‐EEA citizen, foreign born 0.026 0.024 0.034
Fraction UK‐born 0.866 0.869 0.851
Fraction Foreign‐born UK citizen
0.057 0.054 0.069
Foreign‐born non‐A8 EEA citizen
0.022 0.022 0.021
Foreign‐born A8 citizen 0.014 0.015 0.010
Foreign‐born non‐EEA citizen 0.041 0.040 0.049
Max Years in UK
16.507 15.935 18.741
Multi‐adult Household 0.792 0.827 0.603
Adults Aged 65+ 0.363 0.367 0.341
Age of Oldest Adult 51.134 51.218 50.678
Age of Youngest Adult 42.480 42.398 42.927
Any Kids 0.332 0.323 0.381
Number of Kids 0.585 0.558 0.734
Age of oldest Child 9.966 9.946 10.076
Age of Youngest Child 7.109 7.135 6.967
Number of workers 1.261 1.359 0.727
No. Workers>0 0.699 0.741 0.471
Log occupational Wage 0.284 0.329 0.036
Relative Household Labour Income
1.816 1.911 0.957
Log GDP pc Relative to UK
‐0.174 ‐0.159 ‐0.255
Gini Relative to UK 1.026 1.024 1.033
White 0.899 0.907 0.855
Mixed Race 0.010 0.009 0.017
Indian 0.021 0.024 0.009
Pakistani 0.014 0.014 0.011
Bangladeshi 0.005 0.004 0.012
Chinese 0.005 0.005 0.003
Other Asian 0.009 0.009 0.009
Black 0.023 0.016 0.061
Other Race 0.014 0.012 0.023
Notes:
1. As For Table 2

24
Table 4: The Probability of Being in Social Housing
(1) (2) (3) (4) (5) (6) (7) (8)
Household Immigrant Category
UK citizen, foreign born
0.079 0.068 0.024 ‐0.022 ‐0.023 ‐0.030 ‐0.060 ‐0.062
(0.004) (0.005) (0.005) (0.006) (0.007) (0.007) (0.009) (0.009)
EEA, non‐A8 citizen, foreign born
0.011 ‐0.005 ‐0.048 ‐0.084 ‐0.074 ‐0.074 ‐0.083 ‐0.099
(0.005) (0.008) (0.007) (0.009) (0.011) (0.011) (0.009) (0.009)
A8 citizen, foreign born
‐0.035 ‐0.039 ‐0.047 ‐0.127 ‐0.107 ‐0.104 ‐0.119 ‐0.116
(0.004) (0.009) (0.009) (0.010) (0.015) (0.014) (0.012) (0.012)
Non‐EEA citizen, foreign born
0.052 0.063 0.015 ‐0.071 ‐0.077 ‐0.082 ‐0.121 ‐0.149
(0.004) (0.006) (0.006) (0.007) (0.009) (0.009) (0.010) (0.011)
Household Immigrant Composition Variables
Foreign‐born UK citizen
‐0.109 ‐0.154 ‐0.191 ‐0.172 ‐0.170 ‐0.176 ‐0.174 ‐0.149
(0.006) (0.011) (0.011) (0.013) (0.017) (0.017) (0.015) (0.015)
Foreign‐born non‐A8 EEA citizen
‐0.123 ‐0.086 ‐0.117 ‐0.051 ‐0.048 ‐0.039 ‐0.050 ‐0.037
(0.009) (0.017) (0.017) (0.019) (0.024) (0.025) (0.019) (0.019)
Foreign‐born A8 citizen
‐0.236 ‐0.184 ‐0.185 ‐0.125 ‐0.069 ‐0.047 ‐0.120 ‐0.109
(0.021) (0.035) (0.035) (0.040) (0.058) (0.060) (0.041) (0.040)
Foreign‐born non‐EEA citizen
‐0.101 ‐0.034 ‐0.090 ‐0.090 ‐0.088 ‐0.089 ‐0.111 ‐0.100
(0.008) (0.014) (0.014) (0.017) (0.022) (0.023) (0.019) (0.019)
Number of obs 2,068,077 2,068,077 2,068,077 2,064,612 659,503 659,503 1,721,601 1,680,568
Year dummies Yes Yes yes Yes Yes yes yes yes
Demographic controls
Yes yes Yes Yes yes yes yes
Regional controls yes Yes Yes yes yes yes
Economic controls Yes Yes yes yes yes
Relative income yes yes
Country of birth controls
yes yes
Ethnicity controls
Notes:
1. The sample is adults for the period 2007‐2013 inclusive
2. The dependent variable is whether the individual is in social housing.
3. The reported estimates are marginal effects evaluated for a household with the base
characteristics which are a one‐adult two‐child household, with the adult aged 35 and the
children 10 and 7 and not in work and living in the south‐east of England.
4. Robust standard errors, clustered at the household level are reported in parentheses.
5. The demographic controls are whether the household has more than one adult, the number
of retired adults, a quadratic in the maximum and minimum age of adults, whether there are
any kids, the number of kids, the maximum and minimum age of kids.
6. The regional controls are 20 dummy variables.
7. The economic controls are a dummy variable for whether any adult is in work, the number
of workers and a quadratic in the log of the maximum occupational wage of any adult.
8. The relative income is total household labour income relative to a year‐specific average.
9. The country of birth controls are quartic in the log of GDP per capita in country of birth
relative to the UK and the Gini coefficient relative to the UK.
10. Ethnicity controls are for the 9 ethnic groups described in the text.

25
Table 5: The Probability of Being in Social Housing: Further Specifications
(1) (2) (3) Household Immigrant Category UK citizen, foreign born
‐0.022 ‐0.019 ‐0.028
(0.006) (0.006) (0.007) EEA, non-A8 citizen, foreign born
‐0.084 ‐0.073 ‐0.085
(0.009) (0.009) (0.011) A8 citizen, foreign born
‐0.127 ‐0.113 ‐0.153
(0.010) (0.011) (0.015) Non-EEA citizen, foreign born
‐0.071 ‐0.064 ‐0.113
(0.007) (0.007) (0.009) Household Immigrant Composition Variables
Foreign-born UK citizen
‐0.172 ‐0.186 ‐0.173
(0.013) (0.013) (0.013) Foreign-born non-A8 EEA citizen
‐0.051 ‐0.059 ‐0.050
(0.019) (0.019) (0.019) Foreign-born A8 citizen
‐0.125 ‐0.130 ‐0.132
(0.040) (0.040) (0.040) Foreign-born non-EEA citizen
‐0.090 ‐0.115 ‐0.097
(0.017) (0.017) (0.017) Individual Characteristics Child* Immigrant Interactions Foreign-born UK
citizen with UK-born child
0.021 Foreign 0.001 (0.011)
(0.001) Foreign-born non-A8 EEA citizen with UK-born child
0.068 UK Citizen 0.004 (0.019)
(0.003) Foreign-born A8 citizen with UK-born child
0.059 EEA Citizen ‐0.001 (0.022)
Foreign-born non-EEA citizen with UK-born child
0.102 (0.013)
Foreign-born UK citizen with foreign-born child
0.005 (0.026)
Foreign-born non-A8 EEA citizen with foreign -born child
‐0.102 (0.029)
Foreign-born A8 citizen with foreign -born child
0.047 (0.026)
Foreign-born non-EEA citizen with UK-born child
0.053
Number of observations
2,064,612 1,998,944 2,054,262
Notes:
1. Variables and samples as in column (4) of Table 4.

26
Table 6: Waiting Lists and the Demand for Social Housing: No Controls
(1) (2) (3) (4) (5)
Data LFS EHS EHS EHS EHS
Dependent Variable In Social Housing
In Social Housing
Demands Social Housing
In Social Housing
In Social Housing
Sample All All All Demands Social Housing
New Tenant or On waiting List
Household Immigrant Category
UK citizen, foreign born 0.079 0.092 0.106 ‐0.006 ‐0.065
(0.006) (0.011) (0.011) (0.018) (0.032)
Non‐UK citizen, foreign born 0.023 0.029 0.058 ‐0.098 0.024
(0.004) (0.008) (0.009) (0.020) (0.031)
Household Immigrant Composition Variables
Foreign‐born UK citizen ‐0.104 ‐0.102 ‐0.111 ‐0.017 ‐0.102
(0.012) (0.017) (0.018) (0.044) (0.083)
Foreign‐born non‐UK citizen ‐0.097 ‐0.094 ‐0.088 ‐0.093 ‐0.133
(0.013) (0.020) (0.020) (0.043) (0.093)
Number of observations 745,076 96,101 96,101 16,696 4,721
Year dummies yes yes yes Yes Yes
Other controls no no no no No
Notes.
1. Sample is period 2008‐2010 inclusive for both LFS and EHS.
2. Reported estimates are marginal effects for the baseline household as defined in Table 4.
Table 7: Waiting Lists and the Demand for Social Housing: Controls
(1) (2) (3) (4) (5)
Data LFS EHS EHS EHS EHS
Dependent Variable
In Social Housing
In Social Housing
Demands Social Housing
In Social Housing
In Social Housing
Sample All All All Demands Social Housing
New Tenant or On waiting List
Household Immigrant Category
UK citizen, foreign born
‐0.027 0.008 0.023 ‐0.047 ‐0.026
(0.01) (0.015) (0.015) (0.022) (0.040)
Non‐UK citizen, foreign born
‐0.077 ‐0.046 ‐0.005 ‐0.116 0.044
(0.009) (0.016) (0.014) (0.022) (0.035)
Household Immigrant Composition Variables
Foreign‐born UK citizen
‐0.148 ‐0.176 ‐0.187 ‐0.008 0.037
(0.022) (0.033) (0.031) (0.038) (0.094)
Foreign‐born non‐UK citizen
‐0.036 ‐0.053 ‐0.049 ‐0.017 0.048
(0.023) (0.038) (0.035) (0.040) (0.101)
Number of observations 737,345
95,775 95,775 16,559 4,674
Year dummies yes yes yes Yes Yes
Other controls yes yes yes Yes Yes
Notes: As for Table 6. Controls are regional, demographic and economic.
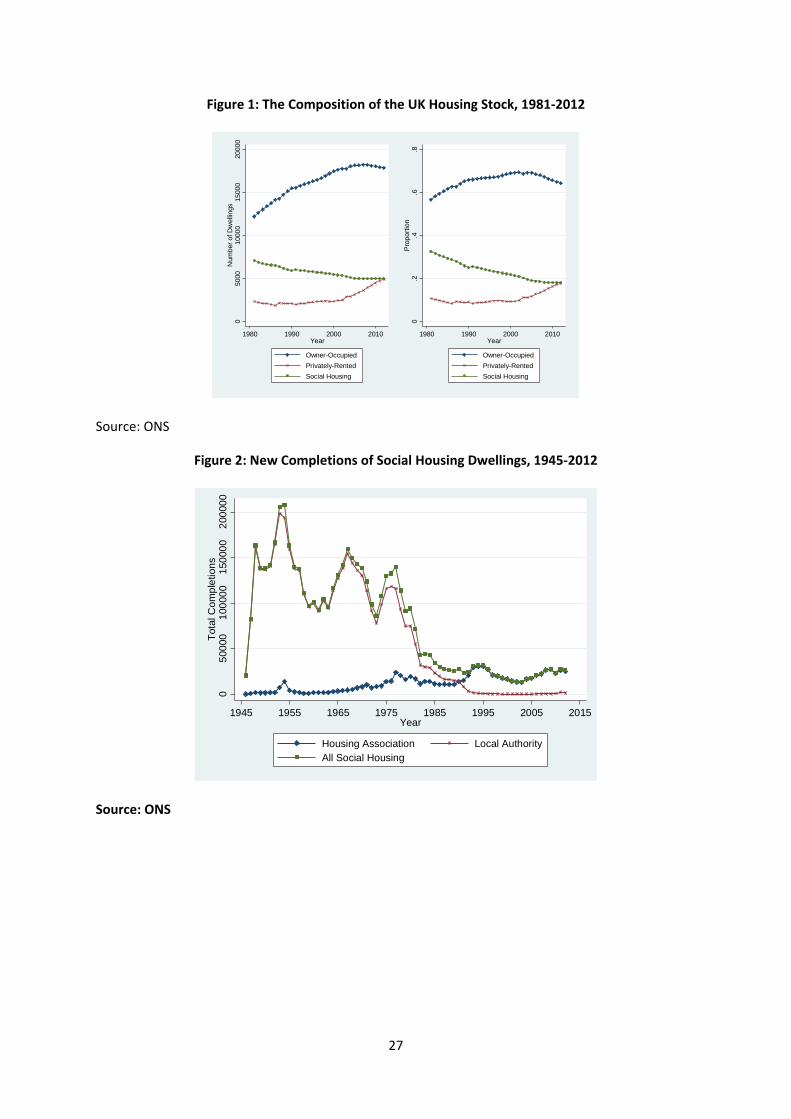
27
Figure 1: The Composition of the UK Housing Stock, 1981‐2012
Source: ONS
Figure 2: New Completions of Social Housing Dwellings, 1945‐2012
Source: ONS
050
0010
000
1500
020
000
Num
ber
of D
wel
lings
1980 1990 2000 2010Year
Owner-Occupied
Privately-Rented
Social Housing
0.2
.4.6
.8P
ropo
rtio
n
1980 1990 2000 2010Year
Owner-Occupied
Privately-Rented
Social Housing
05
0000
100
000
150
000
200
000
Tot
al C
omp
letio
ns
1945 1955 1965 1975 1985 1995 2005 2015Year
Housing Association Local AuthorityAll Social Housing
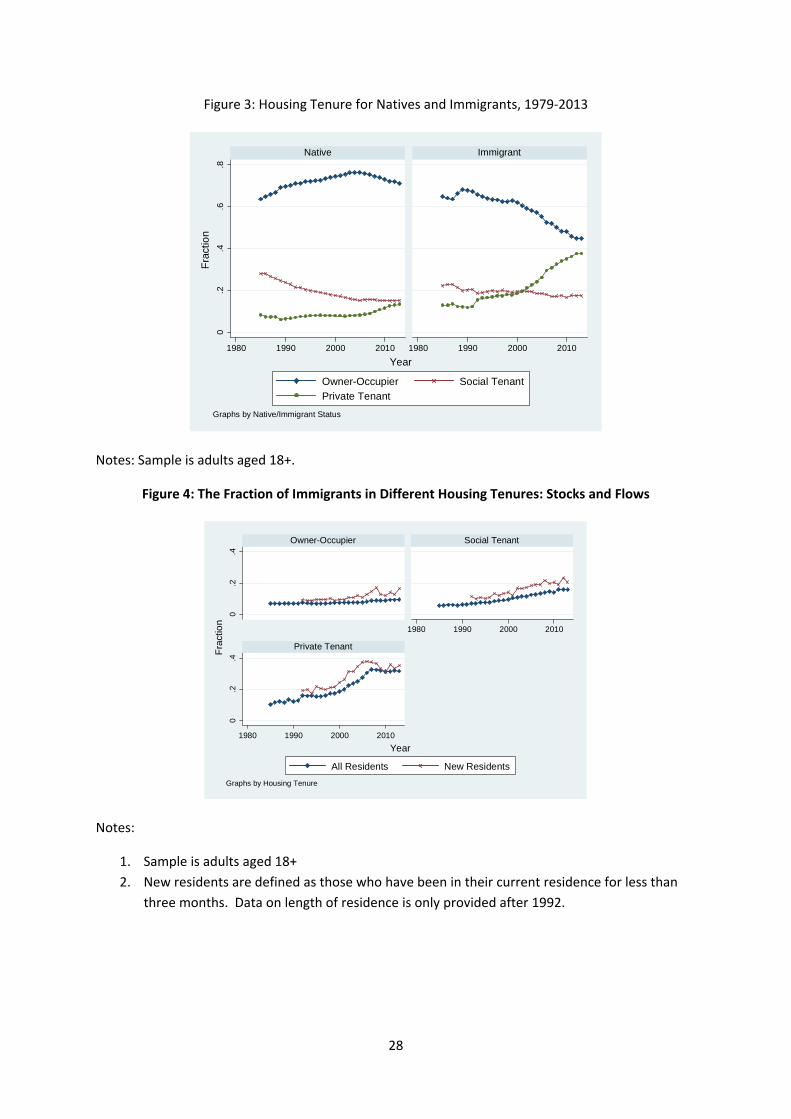
28
Figure 3: Housing Tenure for Natives and Immigrants, 1979‐2013
Notes: Sample is adults aged 18+.
Figure 4: The Fraction of Immigrants in Different Housing Tenures: Stocks and Flows
Notes:
1. Sample is adults aged 18+
2. New residents are defined as those who have been in their current residence for less than
three months. Data on length of residence is only provided after 1992.
0.2
.4.6
.8
1980 1990 2000 2010 1980 1990 2000 2010
Native Immigrant
Owner-Occupier Social Tenant
Private Tenant
Fra
ctio
n
Year
Graphs by Native/Immigrant Status
0.2
.40
.2.4
1980 1990 2000 2010
1980 1990 2000 2010
Owner-Occupier Social Tenant
Private Tenant
All Residents New Residents
Fra
ctio
n
Year
Graphs by Housing Tenure

29
Figure 5: The Share of Adult Immigrants In Different Individual Immigrant Categories
Notes:
1. Sample is the foreign‐born, aged 18+.
Figure 6: The Share of Adult Immigrants By Household Immigrant Categories
Notes.
1. Sample is the foreign‐born, aged 18+.
2. The household immigrant category assigned to an individual is based on the characteristics
of all household members e.g. UK born means the immigrant is in a household with at least
one adult who is UK born. See text for more details.
0.1
.2.3
.4.5
Fra
ctio
n
1980 1990 2000 2010 2020Year
UK Citizen EEA (non-A8) CitizenA8 Citizen non-EEA Citizen, in UK>5 yrsnon-EEA Citizen, in UK<=5 yrs
0.1
.2.3
.4F
ract
ion
1980 1990 2000 2010 2020Year
UK Born UK CitizenEEA (non-A8) Citizen A8 Citizennon-EEA Citizen, in UK>5 yrs non-EEA Citizen, in UK<=5 yrs
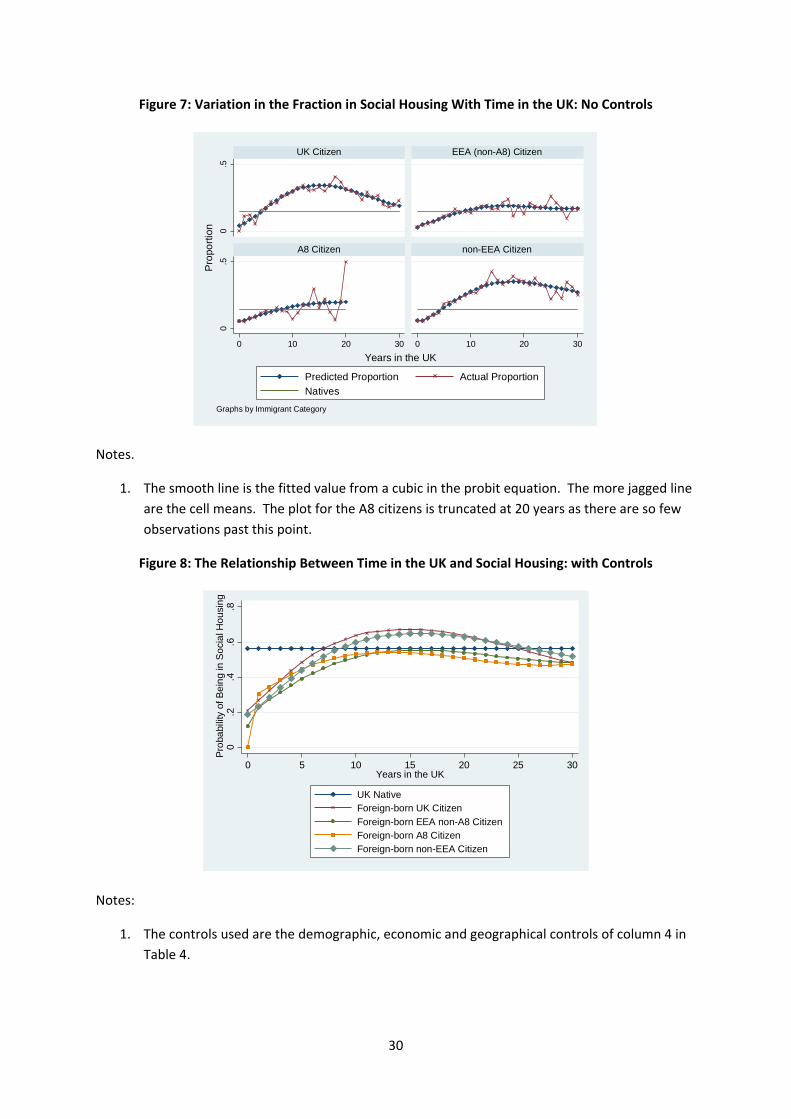
30
Figure 7: Variation in the Fraction in Social Housing With Time in the UK: No Controls
Notes.
1. The smooth line is the fitted value from a cubic in the probit equation. The more jagged line
are the cell means. The plot for the A8 citizens is truncated at 20 years as there are so few
observations past this point.
Figure 8: The Relationship Between Time in the UK and Social Housing: with Controls
Notes:
1. The controls used are the demographic, economic and geographical controls of column 4 in
Table 4.
0.5
0.5
0 10 20 30 0 10 20 30
UK Citizen EEA (non-A8) Citizen
A8 Citizen non-EEA Citizen
Predicted Proportion Actual Proportion
Natives
Pro
port
ion
Years in the UK
Graphs by Immigrant Category
0.2
.4.6
.8P
roba
bilit
y of
Be
ing
in S
oci
al H
ou
sin
g
0 5 10 15 20 25 30Years in the UK
UK NativeForeign-born UK Citizen
Foreign-born EEA non-A8 CitizenForeign-born A8 CitizenForeign-born non-EEA Citizen

31
Figure 9: Changes in the Marginal Effects of Immigrant Household Categories over time:
No Controls
Notes.
1. These are the estimated marginal effects for the household immigrant categories for the
specification of column (1) of Table 4 estimated for each year.
2. A8 and non‐A8 migrants are pooled.
Figure 10: Changes in the Marginal Effects of Immigrant Household Categories over time:
Baseline Controls
.1.2
.3.4
Pro
port
ion
1985 1990 1995 2000 2005 2010 2015Year
UK Born
Foreign-Born UK Citizen
EEA Citizen
non-EEA Citizen-.
1-.
050
.05
.1.1
5D
iffer
entia
l
1985 1990 1995 2000 2005 2010 2015Year
Foreign-Born UK Citizen
EEA Citizen
non-EEA Citizen
.4.5
.6.7
Pro
port
ion
1985 1990 1995 2000 2005 2010 2015Year
UK Born
Foreign-Born UK Citizen
EEA Citizen
non-EEA Citizen
-.3
-.2
-.1
0D
iffer
entia
l
1985 1990 1995 2000 2005 2010 2015Year
Foreign-Born UK Citizen
EEA Citizen
non-EEA Citizen

32
Figure 11: Changes in the Immigrant Proportions and Rates over time: Baseline Controls + Country
of Birth Controls
Figure 12: Counter‐Factuals for the Probability of Being In Social Housing
.4.5
.6.7
Pro
port
ion
1985 1990 1995 2000 2005 2010 2015Year
UK Born
Foreign-Born UK Citizen
EEA Citizen
non-EEA Citizen-.
2-.
15-.
1-.
050
.05
Diff
eren
tial
1985 1990 1995 2000 2005 2010 2015Year
Foreign-Born UK Citizen
EEA Citizen
non-EEA Citizen
.5.5
5.6
.65
.7.7
5P
rop
ort
ion
1990 1995 2000 2005 2010 2015year
ActualOnly Changes in Allocation RuleOnly Changes in Immigrant Allocation RuleOnly Changes in Immigrant PopulationOnly Changes in Social Housing Stock

33
References
Andrews, D., A. Caldera Sánchez and Å. Johansson (2011), “Housing Markets and Structural Policies in OECD Countries”, OECD Economics Department Working Papers, No. 836, OECD Publishing. Angrist, Joshua D. and Adriane D. Kugler. (2003) "Protective Or Counter‐Productive? Labour Market Institutions And The Effect Of Immigration On EU Natives," Economic Journal, 113, F302‐331.
Barrett, Alan and Yvonne McCarthy (2008) “Immigrants and welfare programmes: exploring the
interactions between immigrant characteristics, immigrant welfare dependence, and welfare policy”
Oxford Review of Economic Policy, 24, 542‐559.
Bell, Brian, Machin, Stephen and Fasani, Francesco (2010) “Crime and immigration: evidence from
large immigrant waves”. CEP Discussion Paper, No. 984. Centre for Economic Performance, London
School of Economics and Political Science, London, UK.
Borjas, George J. (1999) “Immigration and Welfare Magnets”, Journal of Labour Economics,17, 607–
37.
Borjas, George J. (2002) “Homeownership in the immigrant population”, Journal of Urban Economics,
52, 448‐476.
Borjas, George J., (2003), “The Labour Demand Curve is Downward sloping: Re‐examining the Impact
of Immigration on the Labour market” Quarterly Journal of Economics, 118, 1335‐1374.
Borjas, George J. and Lynette Hilton (1996) “Immigration and the Welfare State: Immigrant
Participation in Means‐Tested Entitlement Programs”, Quarterly Journal of Economics, 111, 575‐604.
Borjas, George J. and Stephen J. Trejo (1991) "Immigrant Participation in the Welfare System",
Industrial and Labor Relations Review, 44, 195‐211.
Borjas, George J. and Stephen J. Trejo (1993) "National origin and immigrant welfare recipiency,"
Journal of Public Economics, 50, 325‐344.
Card, David. (1990), “The Impact of the Mariel Boatlift on the Miami Labour Market”, Industrial and
Labour Relations Review, 43, 245‐257.
Card, David. (2005), “Is the New Immigration Really So Bad?” Economic Journal, 115, F00‐F323.
Card, David, Christian Dustmann & Ian Preston (2012) "Immigration, Wages, And Compositional
Amenities," Journal of the European Economic Association, 10, 78‐119.
Constant, AF, R Roberts, and KF Zimmermann (2009) “Ethnic identity and immigrant
homeownership”, Urban Studies, 9, 1879‐1898.
De Giorgi, Giacomo and Michele Pellizzari (2009) "Welfare Migration in Europe" Labour Economics, 16, 353‐363.
Department for Communities and Local Government (2013) “Allocation of accommodation: guidance for local housing authorities in England”, December 2013

34
https://www.gov.uk/government/publications/allocation‐of‐accommodation‐guidance‐for‐local‐housing‐authorities‐in‐england
Duffy, Bobby and Tom Frere‐Smith (2014) “Perceptions and Reality: Public Attitudes to Immigration”,
http://www.ipsos‐mori.com/DownloadPublication/1634_sri‐perceptions‐and‐reality‐immigration‐
report‐2013.pdf
Dustmann, Christian. Fabbri, F. and Preston, I., (2005), “The Impact of Immigration on the UK Labour
Market”, Economic Journal, 115, F324‐F341.
Dustmann, Christian, Tommaso Frattini and Ian Preston (2012) “The Effect of Immigration along the Distribution of Wages”, Review of Economic Studies, 80, 145‐173.
Dustmann, Christian, Tommaso Frattini and Caroline Halls (2010) “Assessing the fiscal costs and
benefits of A8 migration to the UK”, Fiscal Studies, 31, 1‐41.
Dustmann, Christian, and Tommaso Frattini (2013) “The Fiscal Effects of Immigration to the UK”, CREAM Discussion Paper. Geay, Charlotte, Sandra McNally, and Shqiponja Telhaj, (2012) “Non‐Native Speakers Of English In
The Classroom: What Are The Effects On Pupil Performance?”, CEE Discussion Paper Np. 137.
Hamnett, Chris and Tim Butler (2010) “The Changing Ethnic Structure of Housing Tenures in London, 1991‐2001”, Urban Studies, 47, 55‐74.
Henderson, Jeff and Valerie Karn (1987) “Race, Class and State Housing: Inequality and the
Allocation of Public Housing in England”, Gower Publishing: Aldershot.
House of Commons Library (2014) “EU Migrants: Entitlement to Housing Assistance (England)”,
SN/SP/4737, January 2014.
Manacorda, Marco , Alan Manning and Jonathan Wadsworth (2012) “The Impact of Immigration on the Structure of Wages: Theory and Evidence from Britain”, Journal of the European Economic Association, 10, 120–151.
Merrett, Stephen (1979) “State Housing in Britain”, London: Routledge and Kegan Paul.
McGhee D, S. Heath, and P. Trevena, (2013), "Post‐accession Polish migrants—their experiences of
living in ‘low‐demand’ social housing areas in Glasgow" Environment and Planning A, 45, 329–343.
Nickell, Stephen and Jumana Saleheen (2008) "The impact of immigration on occupational wages:
evidence from Britain," Working Papers 08‐6, Federal Reserve Bank of Boston
Nygaard, C. (2011) “International migration, housing demand and access to homeownership in the
UK”, Urban Studies, 48, 2211‐2229.
Ottaviano, G. and Peri, G. (2012), “Rethinking the Effects of Immigration on Wages”, Journal of the European Economic Association, 10, 152–197.

35
Parker, John and Keith Dugmore (1977) “Race and the allocation of public housing ‐a GLC survey” Journal of Ethnic and Migration Studies, 6, 27‐40
Peach, Ceri (1998) “South Asian and Caribbean Ethnic minority Housing Choice in Britain”, Urban Studies, 35, 1657‐1680.
Robinson, Vaughan (1980) “Asians and Council Housing”, Urban Studies, 17, 323‐332.
Rutter, Jill and Maria Latorre (2009) “Social housing allocation and immigrant communities”, Equality
and Human Rights Commission Research Report.
Sa, Filipa (2011) “Immigration and House Prices in the UK”, IZA Discussion Paper No. 5893.
Saiz, Albert (2003) “Room in the Kitchen for the Melting Pot: Immigration and Rental Prices”, Review of Economics and Statistics, 85, 502‐521.
Saiz, Albert (2007) “Immigration and housing rents in American cities”, Journal of Urban Economics,
61, 345‐371.
Smith, David and Anne Whalley (1975), “Public Housing and Racial Minorities”, PEP, 1975.
Wadsworth, Jonathan (2013) “Mustn't Grumble: Immigration, Health and Health Service Use in the UK and Germany”, Fiscal Studies, 34, 55‐82.
Whitehead, Christine (2011) “Migration and its impact on housing costs” In Marsden, David, (ed.) Employment in the Lean Years: Policy and Prospects for the Next Decade. Oxford University Press, Oxford, UK.
Whitehead, Christine, Anne Edge, Ian Gordon, Kathleen Scanlon, and Tony Travers (2011) “The impact of migration on access to housing and the housing market”, Migration Advisory Committee Report.

36
Data Appendix
This Appendix contains more detailed information about the variables used in the regressions and
the results of some alternative specifications.
Data Sources
Table A1: Means of LFS Regional Variables by Household Immigrant Category
Table A2: Standard Deviations of LFS Variables by Household Immigrant Category
Table A3: Means of LFS Regional Variables by Social Tenant Status
Table A4: Standard Deviations of LFS Variables by Social Tenant Status
Table A5: Detailed Regression Results Behind Table 4
Table A6: Results Omitting Household Immigrant Composition Variables
Table A7: Results including Educational Attainment
Table A8: Regression Results for whether Landlord is Local Authority or Housing Association

37
Data Sources
Labour Force Survey and English Housing Survey
These data are obtained from the ESRC Data Archive and all codings are available on request.
Relative GDP Per Capita
Per capita GDP at PPP is taken from the CIA World Factbook as this has the most complete list (only
Kosovo is missing). Since 2007 all countries of birth and citizenship have been given separate
identifiers in the LFS but prior to that date, some countries were grouped together. The coding
changed at 4 dates with more individual countries being added at each change. The coding always
grouped similar countries together. Where a coding covers a number of countries we use the
weighted average of log GDP per capita using as weights the distribution of UK immigrants within
the groupings in the post‐2007 period.
Relative Gini
Ginin coefficients are taken from the UN‐WIDER World Income Inequality database
http://www.wider.unu.edu/research/Database/en_GB/database/ and the latest available figures are
used for every country. Where a coding covers a number of countries we use the weighted average
of the Gini using as weights the distribution of UK immigrants within the groupings in the post‐2007
period.
Occupational Wages
These are taken from the 2012 Annual Survey of Hours and Earnings.
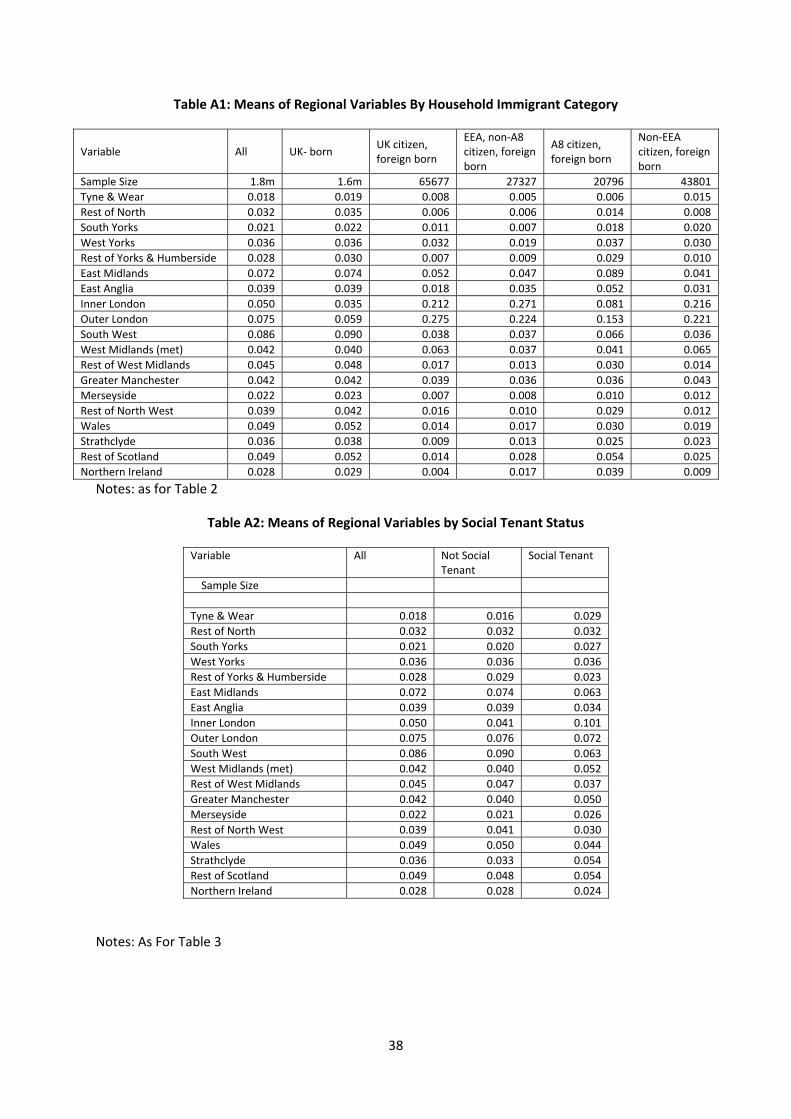
38
Table A1: Means of Regional Variables By Household Immigrant Category
Variable All UK‐ born UK citizen, foreign born
EEA, non‐A8 citizen, foreign born
A8 citizen, foreign born
Non‐EEA citizen, foreign born
Sample Size 1.8m 1.6m 65677 27327 20796 43801
Tyne & Wear 0.018 0.019 0.008 0.005 0.006 0.015
Rest of North 0.032 0.035 0.006 0.006 0.014 0.008
South Yorks 0.021 0.022 0.011 0.007 0.018 0.020
West Yorks 0.036 0.036 0.032 0.019 0.037 0.030
Rest of Yorks & Humberside 0.028 0.030 0.007 0.009 0.029 0.010
East Midlands 0.072 0.074 0.052 0.047 0.089 0.041
East Anglia 0.039 0.039 0.018 0.035 0.052 0.031
Inner London 0.050 0.035 0.212 0.271 0.081 0.216
Outer London 0.075 0.059 0.275 0.224 0.153 0.221
South West 0.086 0.090 0.038 0.037 0.066 0.036
West Midlands (met) 0.042 0.040 0.063 0.037 0.041 0.065
Rest of West Midlands 0.045 0.048 0.017 0.013 0.030 0.014
Greater Manchester 0.042 0.042 0.039 0.036 0.036 0.043
Merseyside 0.022 0.023 0.007 0.008 0.010 0.012
Rest of North West 0.039 0.042 0.016 0.010 0.029 0.012
Wales 0.049 0.052 0.014 0.017 0.030 0.019
Strathclyde 0.036 0.038 0.009 0.013 0.025 0.023
Rest of Scotland 0.049 0.052 0.014 0.028 0.054 0.025
Northern Ireland 0.028 0.029 0.004 0.017 0.039 0.009
Notes: as for Table 2
Table A2: Means of Regional Variables by Social Tenant Status
Variable All Not Social Tenant
Social Tenant
Sample Size
Tyne & Wear 0.018 0.016 0.029
Rest of North 0.032 0.032 0.032
South Yorks 0.021 0.020 0.027
West Yorks 0.036 0.036 0.036
Rest of Yorks & Humberside 0.028 0.029 0.023
East Midlands 0.072 0.074 0.063
East Anglia 0.039 0.039 0.034
Inner London 0.050 0.041 0.101
Outer London 0.075 0.076 0.072
South West 0.086 0.090 0.063
West Midlands (met) 0.042 0.040 0.052
Rest of West Midlands 0.045 0.047 0.037
Greater Manchester 0.042 0.040 0.050
Merseyside 0.022 0.021 0.026
Rest of North West 0.039 0.041 0.030
Wales 0.049 0.050 0.044
Strathclyde 0.036 0.033 0.054
Rest of Scotland 0.049 0.048 0.054
Northern Ireland 0.028 0.028 0.024
Notes: As For Table 3

39
Table A3: Standard Deviations of Variables by Household Immigrant Category
Variable All UK‐ born UK citizen, foreign born
EEA, non‐A8 citizen, foreign born
A8 citizen, foreign born
Non‐EEA citizen, foreign born
Sample Size 1.8m 1.6m 65677 27327 20796 43801
Owner Occupier 0.458 0.441 0.496 0.467 0.297 0.413
Social Tenant 0.362 0.357 0.433 0.370 0.323 0.404
Private Tenant 0.351 0.319 0.390 0.500 0.411 0.494
UK‐ born 0.289 1 0 0 0 0
UK citizen, foreign born 0.190 0.000 0.000 0.000 0.000 0.000
EEA, non‐A8 citizen, foreign born
0.127 0.000 0.000 0.000 0.000 0.000
A8 citizen, foreign born 0.108 0.000 0.000 0.000 0.000 0.000
Non‐EEA citizen, foreign born
0.159 0.000 0.000 0.000 0.000 0.000
Fraction UK‐born 0.308 0.146 0.000 0.000 0.000 0.000
Fraction Foreign‐born UK citizen
0.197 0.111 0.227 0.000 0.000 0.000
Foreign‐born non‐A8 EEA citizen
0.128 0.063 0.099 0.299 0.000 0.000
Foreign‐born A8 citizen 0.113 0.024 0.065 0.157 0.027 0.000
Foreign‐born non‐EEA citizen
0.178 0.069 0.207 0.221 0.027 0.000
Max Years in UK 13.755 12.539 13.676 4.528 9.617
Multi‐adult Household 0.406 0.402 0.457 0.454 0.335 0.439
Adults Aged 65+ 0.675 0.688 0.605 0.485 0.127 0.322
Age of Oldest Adult 14.438 14.254 14.109 14.552 9.664 12.393
Age of Youngest Adult 19.229 19.412 18.146 17.341 8.333 12.685
Any Kids 0.471 0.467 0.498 0.473 0.499 0.499
Number of Kids 0.973 0.948 1.288 1.046 0.892 1.138
Age of oldest Child 3.145 3.077 3.581 3.348 3.995 3.813
Age of Youngest Child 3.191 3.160 3.515 2.935 3.399 3.395
Number of workers 1.061 1.063 0.936 1.051 1.131 0.985
No. Workers>0 0.459 0.460 0.473 0.437 0.216 0.451
Log occupational Wage 0.387 0.386 0.388 0.407 0.280 0.416
Household relative labour income
1.640 1.652 1.492 1.809 0.889 1.545
Log GDP pc Relative to UK 0.579 0.250 1.158 0.839 0.069 1.154
Gini Relative to UK 0.112 0.051 0.289 0.204 0.088 0.282
White 0.301 0.226 0.451 0.414 0.226 0.395
Mixed Race 0.080 0.075 0.128 0.139 0.046 0.117
Indian 0.140 0.103 0.362 0.132 0.006 0.362
Pakistani 0.114 0.095 0.287 0.092 0.000 0.209
Bangladeshi 0.069 0.049 0.222 0.047 0.000 0.149
Chinese 0.065 0.036 0.169 0.064 0.000 0.258
Other Asian 0.086 0.043 0.267 0.122 0.010 0.294
Black 0.144 0.096 0.380 0.200 0.009 0.400
Other Race 0.107 0.055 0.266 0.245 0.200 0.361
Tyne & Wear 0.134 0.137 0.091 0.069 0.080 0.122
Rest of North 0.177 0.183 0.078 0.075 0.119 0.089
South Yorks 0.145 0.147 0.105 0.081 0.133 0.140
West Yorks 0.186 0.187 0.176 0.135 0.190 0.170
Rest of Yorks & Humberside 0.165 0.169 0.081 0.094 0.168 0.101
East Midlands 0.259 0.262 0.222 0.211 0.285 0.199
East Anglia 0.192 0.195 0.134 0.183 0.223 0.172
Inner London 0.219 0.183 0.409 0.445 0.273 0.411
Outer London 0.264 0.236 0.446 0.417 0.360 0.415
South West 0.280 0.286 0.191 0.188 0.249 0.186
West Midlands (met) 0.200 0.196 0.244 0.188 0.198 0.247

40
Rest of West Midlands 0.208 0.214 0.129 0.115 0.171 0.117
Greater Manchester 0.200 0.201 0.194 0.186 0.186 0.202
Merseyside 0.146 0.150 0.081 0.091 0.098 0.109
Rest of North West 0.194 0.200 0.124 0.102 0.167 0.111
Wales 0.215 0.222 0.117 0.128 0.169 0.135
Strathclyde 0.187 0.192 0.092 0.113 0.156 0.150
Rest of Scotland 0.216 0.221 0.115 0.164 0.227 0.157
Northern Ireland 0.164 0.169 0.063 0.130 0.194 0.093

41
Table A4: Standard Deviations of Variables by Social Tenant Status
Variable All Not Social Tenant
Social Tenant
Sample Size 1.8m 1.7m 297k
Owner Occupier 0.458 0.376 0.000
Social Tenant 0.362 0.000 0.000
Private Tenant 0.351 0.376 0.000
UK‐ born 0.289 0.495 0.479
UK citizen, foreign born 0.190 0.179 0.238
EEA, non‐A8 citizen, foreign born
0.127 0.126 0.130
A8 citizen, foreign born 0.108 0.110 0.094
Non‐EEA citizen, foreign born
0.159 0.154 0.181
Fraction UK‐born 0.308 0.303 0.336
Fraction Foreign‐born UK citizen
0.197 0.190 0.231
Foreign‐born non‐A8 EEA citizen
0.128 0.127 0.130
Foreign‐born A8 citizen 0.113 0.115 0.097
Foreign‐born non‐EEA citizen
0.178 0.174 0.197
Max Years in UK 13.755 13.932 12.800
Multi‐adult Household 0.406 0.378 0.489
Adults Aged 65+ 0.675 0.686 0.607
Age of Oldest Adult 14.438 14.297 15.174
Age of Youngest Adult 19.229 18.933 20.762
Any Kids 0.471 0.468 0.486
Number of Kids 0.973 0.936 1.144
Age of oldest Child 3.145 3.125 3.250
Age of Youngest Child 3.191 3.162 3.342
Number of workers 1.061 1.055 0.925
No. Workers>0 0.459 0.438 0.499
Log occupational Wage 0.387 0.394 0.220
Household relative labour income
1.640 1.685 0.727
Log GDP pc Relative to UK 0.579 0.536 0.770
Gini Relative to UK 0.112 0.108 0.128
White 0.301 0.290 0.352
Mixed Race 0.080 0.073 0.109
Indian 0.140 0.148 0.089
Pakistani 0.114 0.116 0.101
Bangladeshi 0.069 0.059 0.110
Chinese 0.065 0.067 0.056
Other Asian 0.086 0.085 0.090
Black 0.144 0.119 0.233
Other Race 0.107 0.099 0.142
Tyne & Wear 0.134 0.127 0.167
Rest of North 0.177 0.177 0.176
South Yorks 0.145 0.142 0.162
West Yorks 0.186 0.186 0.185
Rest of Yorks & Humberside 0.165 0.167 0.148
East Midlands 0.259 0.262 0.243
East Anglia 0.192 0.194 0.181
Inner London 0.219 0.198 0.302
Outer London 0.264 0.265 0.259
South West 0.280 0.286 0.244
West Midlands (met) 0.200 0.195 0.223
Rest of West Midlands 0.208 0.211 0.190

42
Greater Manchester 0.200 0.196 0.218
Merseyside 0.146 0.143 0.160
Rest of North West 0.194 0.198 0.170
Wales 0.215 0.217 0.205
Strathclyde 0.187 0.179 0.225
Rest of Scotland 0.216 0.214 0.225
Northern Ireland 0.164 0.166 0.152

43
Table A5: Detailed Regression Results Behind Table 4
(1) (2) (3) (4) (5) (6) (7) (8)
UK citizen, foreign born
0.297 0.173 0.062 ‐0.057 ‐0.059 ‐0.075 ‐0.149 ‐0.158
(0.012) (0.013) (0.013) (0.014) (0.018) (0.018) (0.027) (0.023)
EEA, non‐A8 citizen, foreign born
0.047 ‐0.012 ‐0.130 ‐0.210 ‐0.187 ‐0.188 ‐0.180 ‐0.253
(0.019) (0.020) (0.021) (0.022) (0.028) (0.028) (0.029) (0.024)
A8 citizen, foreign born
‐0.168 ‐0.101 ‐0.127 ‐0.319 ‐0.268 ‐0.267 ‐0.239 ‐0.295
(0.023) (0.024) (0.024) (0.027) (0.037) (0.037) (0.041) (0.030)
Non‐EEA citizen, foreign born
0.203 0.159 0.039 ‐0.180 ‐0.193 ‐0.210 ‐0.317 ‐0.378
(0.014) (0.015) (0.015) (0.017) (0.022) (0.022) (0.033) (0.028)
Fraction Foreign‐born UK citizen
‐0.473 ‐0.393 ‐0.505 ‐0.437 ‐0.433 ‐0.443 ‐0.426 ‐0.390
(0.027) (0.028) (0.028) (0.033) (0.043) (0.044) (0.050) (0.039)
Foreign‐born non‐A8 EEA citizen
‐0.535 ‐0.219 ‐0.309 ‐0.130 ‐0.123 ‐0.097 ‐0.095 ‐0.098
(0.040) (0.043) (0.044) (0.048) (0.061) (0.063) (0.064) (0.049)
Foreign‐born A8 citizen ‐1.025 ‐0.469 ‐0.488 ‐0.319 ‐0.176 ‐0.118 ‐0.086 ‐0.286
(0.090) (0.091) (0.093) (0.101) (0.148) (0.151) (0.153) (0.104)
Foreign‐born non‐EEA citizen
‐0.438 ‐0.087 ‐0.238 ‐0.229 ‐0.225 ‐0.224 ‐0.282 ‐0.261
(0.036) (0.037) (0.037) (0.042) (0.056) (0.057) (0.064) (0.049)
No. of Kids 0.076 0.083 0.050 0.057 0.057 0.052 0.058
(0.008) (0.008) (0.008) (0.010) (0.010) (0.010) (0.009)
Age of oldest Child 0.030 0.029 0.016 0.015 0.013 0.013 0.015
(0.002) (0.002) (0.002) (0.003) (0.003) (0.003) (0.002)
Age of youngest Child ‐0.031 ‐0.031 ‐0.019 ‐0.020 ‐0.018 ‐0.017 ‐0.017
(0.002) (0.002) (0.002) (0.003) (0.003) (0.003) (0.002)
Any Kids 0.409 0.422 0.232 0.210 0.170 0.148 0.176
(0.017) (0.017) (0.018) (0.022) (0.022) (0.023) (0.018)
Multi‐adult Household ‐1.034 ‐1.021 ‐0.499 ‐0.496 ‐0.460 ‐0.416 ‐0.434
(0.009) (0.009) (0.011) (0.014) (0.014) (0.014) (0.011)
Multi‐adult Household with kids
‐0.305 ‐0.310 ‐0.032 ‐0.006 0.027 0.041 ‐0.003
(0.011) (0.011) (0.012) (0.015) (0.015) (0.015) (0.012)
No. Adults Aged 65+ ‐0.043 ‐0.049 ‐0.207 ‐0.202 ‐0.194 ‐0.210 ‐0.228
(0.008) (0.008) (0.008) (0.010) (0.009) (0.010) (0.008)
Age of Oldest Adult 0.026 0.033 0.174 0.194 0.199 0.194 0.169
(0.005) (0.005) (0.006) (0.007) (0.007) (0.007) (0.006)
Age of Oldest Adult squared
0.030 0.030 ‐0.036 ‐0.047 ‐0.053 ‐0.051 ‐0.032
(0.002) (0.002) (0.002) (0.003) (0.003) (0.003) (0.002)
Age of Youngest Adult ‐0.145 ‐0.142 ‐0.193 ‐0.188 ‐0.176 ‐0.190 ‐0.208
(0.003) (0.003) (0.003) (0.004) (0.004) (0.004) (0.003)
Age of Youngest Adult squared
0.025 0.026 0.021 0.022 0.021 0.023 0.023
(0.001) (0.001) (0.001) (0.001) (0.001) (0.001) (0.001)
Year==2007 0.025 0.016 0.016 0.044 0.030 0.031 0.034 0.046
(0.008) (0.009) (0.009) (0.010) (0.012) (0.012) (0.012) (0.010)
Year==2008 0.021 0.012 0.012 0.039 0.019 0.018 0.019 0.039
(0.009) (0.009) (0.009) (0.010) (0.012) (0.012) (0.012) (0.010)
Year==2009 0.011 0.003 0.002 0.015 0.003 0.004 0.001 0.012
(0.007) (0.007) (0.007) (0.008) (0.011) (0.011) (0.011) (0.008)
Year==2011 ‐0.011 ‐0.010 ‐0.010 ‐0.021 ‐0.024 ‐0.027 ‐0.025 ‐0.021
(0.007) (0.008) (0.008) (0.008) (0.013) (0.013) (0.013) (0.009)
Year==2012 ‐0.005 ‐0.013 ‐0.011 0.006 ‐0.018 ‐0.022 ‐0.031 ‐0.008
(0.007) (0.008) (0.008) (0.008) (0.013) (0.013) (0.013) (0.009)
Year==2013 0.005 ‐0.006 ‐0.003 0.024 ‐0.014 ‐0.017 ‐0.033 0.006
(0.008) (0.009) (0.009) (0.010) (0.015) (0.015) (0.015) (0.010)
Tyne and Wear 0.469 0.342 0.360 0.343 0.340 0.347
(0.018) (0.019) (0.022) (0.022) (0.022) (0.019)
Rest of North 0.144 0.009 0.033 0.016 0.008 0.011
(0.015) (0.016) (0.019) (0.019) (0.019) (0.016)
South Yorks 0.296 0.153 0.186 0.165 0.152 0.152
(0.017) (0.018) (0.021) (0.021) (0.021) (0.018)
West Yorks 0.131 0.016 0.038 0.023 0.019 0.033

44
(0.014) (0.015) (0.018) (0.018) (0.018) (0.015)
Rest of Yorks & Humberside
0.002 ‐0.094 ‐0.062 ‐0.081 ‐0.093 ‐0.097
(0.017) (0.018) (0.021) (0.021) (0.021) (0.018)
East Midlands 0.051 ‐0.029 ‐0.008 ‐0.024 ‐0.035 ‐0.029
(0.012) (0.012) (0.014) (0.014) (0.015) (0.012)
East Anglia 0.070 0.030 0.045 0.027 0.022 0.030
(0.015) (0.016) (0.018) (0.018) (0.019) (0.016)
Inner London 0.684 0.732 0.748 0.786 0.807 0.678
(0.013) (0.015) (0.019) (0.019) (0.020) (0.016)
Outer London 0.098 0.080 0.071 0.087 0.094 0.062
(0.012) (0.014) (0.017) (0.017) (0.017) (0.014)
South West ‐0.045 ‐0.105 ‐0.121 ‐0.142 ‐0.141 ‐0.103
(0.012) (0.012) (0.015) (0.015) (0.015) (0.012)
West Midlands (met) 0.266 0.152 0.172 0.152 0.151 0.161
(0.014) (0.015) (0.018) (0.018) (0.018) (0.015)
Rest of West Midlands 0.025 ‐0.031 ‐0.012 ‐0.033 ‐0.039 ‐0.029
(0.014) (0.015) (0.018) (0.018) (0.018) (0.015)
Greater Manchester 0.229 0.129 0.143 0.125 0.115 0.129
(0.014) (0.014) (0.017) (0.017) (0.017) (0.015)
Merseyside 0.221 0.080 0.093 0.075 0.065 0.073
(0.018) (0.019) (0.022) (0.022) (0.022) (0.019)
Rest of North West ‐0.044 ‐0.138 ‐0.103 ‐0.123 ‐0.132 ‐0.131
(0.015) (0.016) (0.018) (0.018) (0.018) (0.016)
Wales 0.052 ‐0.085 ‐0.089 ‐0.110 ‐0.114 ‐0.085
(0.013) (0.014) (0.017) (0.017) (0.017) (0.014)
Strathclyde 0.394 0.306 0.320 0.309 0.304 0.314
(0.014) (0.015) (0.017) (0.017) (0.017) (0.014)
Rest of Scotland 0.201 0.147 0.154 0.149 0.149 0.152
(0.013) (0.013) (0.016) (0.016) (0.016) (0.013)
Northern Ireland ‐0.000 ‐0.148 ‐0.039 ‐0.058 ‐0.075 ‐0.139
(0.015) (0.016) (0.019) (0.019) (0.019) (0.016)
Number of Workers ‐0.143 ‐0.144 0.017 ‐0.004 ‐0.164
(0.007) (0.009) (0.010) (0.010) (0.007)
No. of Workers>0 ‐0.456 ‐0.452 ‐0.404 ‐0.385 ‐0.446
(0.011) (0.016) (0.019) (0.019) (0.012)
Log occupational wage ‐1.397 ‐1.455 ‐1.136 ‐1.162 ‐1.430
(0.019) (0.027) (0.029) (0.029) (0.020)
Log occupational wage squared
0.136 0.183 0.189 0.203 0.151
(0.028) (0.038) (0.039) (0.040) (0.028)
Log gdp pc in country of birth (rel to UK)
‐0.045 0.086
(0.068) (0.055)
Log gdp pc in country of birth squared
‐0.159 0.228
(0.101) (0.082)
Log gdp pc in country of birth cubed
‐0.069 0.102
(0.045) (0.037)
Log gdp pc in country of birth quartic
‐0.005 0.015
(0.006) (0.005)
Gini in country of birth relative to UK
0.098 ‐0.152
(0.036) (0.030)
Mixed Race 0.343
(0.030)
Indian ‐0.515
(0.034)
Pakistani ‐0.579
(0.038)
Bangladeshi 0.054
(0.051)
Chinese ‐0.310
(0.058)
Other Asian ‐0.138

45
(0.040)
Black 0.466
(0.023)
Other Race 0.229
(0.030)
Relative Labour Income
‐0.323 ‐0.336
(0.015) (0.015)
Relative Labour Income squared
‐0.005 0.003
(0.009) (0.009)
Relative Labour Income cubed
0.004 0.003
(0.002) (0.002)
Relative Labour Income quartic
‐0.000 ‐0.000
(0.000) (0.000)
Constant ‐1.047 ‐0.198 ‐0.320 0.165 0.182 ‐0.059 ‐0.171 0.290
(0.006) (0.010) (0.011) (0.013) (0.016) (0.023) (0.043) (0.033)
Observations 2,068,077 2,068,077 2,068,077 2,064,612 659,503 659,503 637,864 1,942,229
Notes.
1. These are probit coeffcients (results reported in Table 4 are marginal effects).
2. See Notes to Table 4.

46
Table A6: Results Excluding Household Composition Variables
(1) (2) (3) (4) (5) (6) (7) (8)
UK citizen, foreign born
0.083 0.086 0.046 ‐0.004 ‐0.007 ‐0.013 ‐0.006 ‐0.015
(0.003) (0.005) (0.005) (0.005) (0.007) (0.007) (0.008) (0.008)
EEA, non‐A8 citizen, foreign born
0.013 0.001 ‐0.039 ‐0.082 ‐0.073 ‐0.073 ‐0.068 ‐0.087
(0.004) (0.007) (0.007) (0.008) (0.011) (0.010) (0.009) (0.009)
A8 citizen, foreign born
‐0.031 ‐0.035 ‐0.040 ‐0.120 ‐0.102 ‐0.100 ‐0.089 ‐0.090
(0.004) (0.009) (0.009) (0.010) (0.015) (0.014) (0.011) (0.012)
Non‐EEA citizen, foreign born
0.056 0.067 0.025 ‐0.063 ‐0.070 ‐0.076 ‐0.071 ‐0.104
(0.004) (0.006) (0.006) (0.007) (0.009) (0.008) (0.010) (0.010)
Number of obs 2,068,077 2,068,077 2,068,077 2,064,612 659,503 659,503 1,721,601 1,680,568
Year dummies Yes yes yes Yes Yes yes yes yes
Demographic controls
yes yes Yes Yes yes yes yes
Regional controls yes Yes Yes yes yes yes
Economic controls Yes Yes yes yes yes
Relative income yes yes
Country of birth controls
yes yes
Ethnicity controls
Notes.
1. As for Table 4 except that household composition variables are excluded.
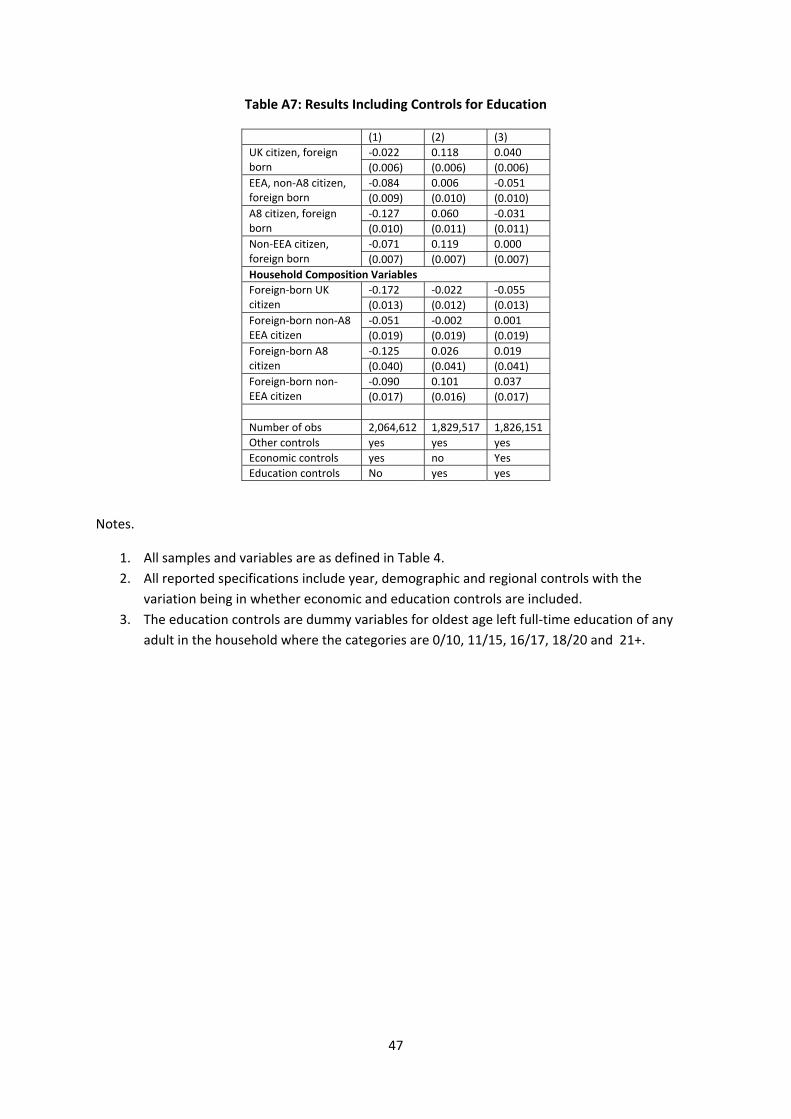
47
Table A7: Results Including Controls for Education
(1) (2) (3)
UK citizen, foreign born
‐0.022 0.118 0.040
(0.006) (0.006) (0.006)
EEA, non‐A8 citizen, foreign born
‐0.084 0.006 ‐0.051
(0.009) (0.010) (0.010)
A8 citizen, foreign born
‐0.127 0.060 ‐0.031
(0.010) (0.011) (0.011)
Non‐EEA citizen, foreign born
‐0.071 0.119 0.000
(0.007) (0.007) (0.007)
Household Composition Variables
Foreign‐born UK citizen
‐0.172 ‐0.022 ‐0.055
(0.013) (0.012) (0.013)
Foreign‐born non‐A8 EEA citizen
‐0.051 ‐0.002 0.001
(0.019) (0.019) (0.019)
Foreign‐born A8 citizen
‐0.125 0.026 0.019
(0.040) (0.041) (0.041)
Foreign‐born non‐EEA citizen
‐0.090 0.101 0.037
(0.017) (0.016) (0.017)
Number of obs 2,064,612 1,829,517 1,826,151
Other controls yes yes yes
Economic controls yes no Yes
Education controls No yes yes
Notes.
1. All samples and variables are as defined in Table 4.
2. All reported specifications include year, demographic and regional controls with the
variation being in whether economic and education controls are included.
3. The education controls are dummy variables for oldest age left full‐time education of any
adult in the household where the categories are 0/10, 11/15, 16/17, 18/20 and 21+.

48
Table A8: Models for Whether a Local Authority or Housing Association Tenant
(1) (2) (3) (4) (5) (6) (7) (8)
Household Immigrant Category
UK citizen, foreign born
0.059 0.054 0.015 0.014 0.018 0.018 0.008 0.012
(0.009) (0.009) (0.010) (0.010) (0.012) (0.012) (0.016) (0.016)
EEA, non‐A8 citizen, foreign born
0.016 0.018 ‐0.007 ‐0.007 ‐0.005 ‐0.006 ‐0.013 ‐0.011
(0.015) (0.015) (0.015) (0.015) (0.018) (0.018) (0.016) (0.016)
A8 citizen, foreign born
‐0.015 ‐0.006 ‐0.031 ‐0.028 ‐0.006 ‐0.006 ‐0.022 ‐0.031
(0.020) (0.020) (0.020) (0.020) (0.028) (0.028) (0.023) (0.023)
Non‐EEA citizen, foreign born
0.060 0.063 0.024 0.021 0.000 ‐0.000 0.005 0.010
(0.011) (0.011) (0.012) (0.012) (0.014) (0.014) (0.019) (0.020)
Household Immigrant Composition Variables
Foreign‐born UK citizen
‐0.052 ‐0.083 ‐0.123 ‐0.109 ‐0.147 ‐0.145 ‐0.114 ‐0.100
(0.025) (0.025) (0.027) (0.027) (0.034) (0.033) (0.030) (0.031)
Foreign‐born non‐A8 EEA citizen
‐0.006 ‐0.033 ‐0.036 ‐0.022 ‐0.019 ‐0.016 ‐0.019 ‐0.013
(0.038) (0.038) (0.039) (0.040) (0.050) (0.050) (0.040) (0.040)
Foreign‐born A8 citizen
‐0.183 ‐0.199 ‐0.207 ‐0.183 ‐0.161 ‐0.155 ‐0.184 ‐0.199
(0.082) (0.082) (0.085) (0.087) (0.122) (0.121) (0.087) (0.087)
Foreign‐born non‐EEA citizen
0.016 ‐0.023 ‐0.076 ‐0.056 ‐0.111 ‐0.106 ‐0.040 ‐0.019
(0.031) (0.032) (0.033) (0.033) (0.042) (0.042) (0.039) (0.039)
Number of obs 308,662 308,662 308,662 306,945 105,215 105,215 296,284 290,094
Year dummies Yes Yes yes Yes Yes yes yes yes
Demographic controls
Yes yes Yes Yes yes yes yes
Regional controls yes Yes Yes yes yes yes
Economic controls Yes Yes yes yes yes
Relative income yes yes
Country of birth controls
yes yes
Ethnicity controls
Notes.
1. The sample is all adult social tenants for the period 2007‐2013.
2. The dependent variable is a binary variable taking the value 1 if the individual is a local
authority tenant and zero if they are a housing association tenant.
3. The reported coefficients are marginal effects from the baseline household as described in
Table 4.
4. All controls are as described in Table 4.

CENTRE FOR ECONOMIC PERFORMANCE Recent Discussion Papers
1263 Alexandre B. Cunha Emanuel Ornelas
Political Competition and the Limits of Political Compromise
1262 Alexander C. Lembcke The Impact of Mandatory Entitlement to Paid Leave on Employment in the UK
1261 Nicholas Bloom Paul M. Romer Stephen J. Terry John Van Reenen
Trapped Factors and China’s Impact on Global Growth
1260 Alexander C. Lembcke Home Computers and Married Women's Labor Supply
1259 Michael Carter John Morrow
The Political Economy of Inclusive Rural Growth
1258 Nicholas Bloom Erik Brynjolfsson Lucia Foster Ron Jarmin Megha Patnaik Itay Saporta-Eksten John Van Reenen
IT and Management in America
1257 David W. Johnston Grace Lordan
When Work Disappears: Racial Prejudice and Recession Labour Market Penalties’
1256 A. Chevalier O. Marie
Economic Uncertainty, Parental Selection and the Criminal Activity of the ‘Children of the Wall’
1255 W. David Bradford Paul Dolan Matteo M. Galizzi
Looking Ahead: Subjective Time Perception and Individual Discounting
1254 Marc J. Melitz Stephen J. Redding
Missing Gains from Trade?
1253 Charlotte Cabane Andrew E. Clark
Childhood Sporting Activities and Adult Labour-Market Outcomes
1252 Andrew E. Clark Emanuela D'Angelo
Upward Social Mobility, Well-being and Political Preferences: Evidence from the BHPS

1251 Juliano Assunção, João Paulo Pessoa Leonardo Rezende
Flex Cars and Competition in Ethanol and Gasoline Retail Markets
1250 Oriana Bandiera Andrea Prat Raffaella Sadun
Managing the Family Firm: Evidence from CEOs at Work
1249 Vincent Sterk Silvana Tenreyro
The Transmission of Monetary Policy Operations through Redistributions and Durable Purchases
1248 Guy Michaels Ferdinand Rauch
Resetting the Urban Network: 117-2012
1247 Thiemo Fetzer Oliver Pardo Amar Shanghavi
An Urban Legend?! Power Rationing, Fertility and its Effects on Mothers
1246 João Paulo Pessoa John Van Reenen
Decoupling of Wage Growth and Productivity Growth? Myth and Reality
1245 Richard Layard Andrew E. Clark Francesca Cornaglia Nattavudh Powdthavee James Vernoit
What Predicts a Successful Life? A Life-Course Model of Well-Being
1244 Benjamin Faber Trade Integration, Market Size and Industrialization: Evidence from China’s National Trunk Highway System
1243 Scott R Baker Nicholas Bloom
Does Uncertainty Reduce Growth? Using Disasters as Natural Experiments
1242 Jo Blanden Paul Gregg Lindsey Macmillan
Intergenerational Persistence in Income and Social Class: The Impact of Within-Group Inequality
1241 Richard Murphy Felix Weinhardt
The Importance of Rank Position
1240 Alex Eble Peter Boone Diana Elbourne
Risk and Evidence of Bias in Randomized Controlled Trials in Economics
1239 Richard Layard Dan Chisholm Vikram Patel Shekhar Saxena
Mental Illness and Unhappiness
The Centre for Economic Performance Publications Unit Tel 020 7955 7673 Fax 020 7404 0612
Email [email protected] Web site http://cep.lse.ac.uk


![[Doc 1264] 4-9-2015 Exhibit and Witness List](https://img.pdfslide.us/doc/110x75/56d6bf7e1a28ab3016967426/doc-1264-4-9-2015-exhibit-and-witness-list.jpg)