Embed Size (px)
Citation preview

CEO vs. Consumer Confidence:
Investment, Financing, and Firm Performance
T. Clifton Green, Byoung-Hyoun Hwang, and Cong (Roman) Wang*
February 2015
We find capital expenditures, merger activity, and net financing all increase with
aggregate CEO and consumer confidence. However, while CEO confidence
positively predicts future return on assets, consumer confidence is negatively
related to ROA and sales growth as well as future forecast revisions and earnings
surprises. Our findings suggest that irrationality manifests primarily on the
investor side, with more rational/better informed managers using times of high
consumer confidence to empire build. Corroborating this view, we find that a
negative relation between consumer confidence and insider purchases by CEOs.
JEL Classification: G02, G10, G31, G32, G34
Keywords: Consumer Confidence, CEO Confidence, Corporate Investment, Firm
Performance.
* Green and Wang are with the Goizueta Business School, Emory University, [email protected].,
[email protected]. Hwang is with the Dyson School of Applied Economics and Management, Cornell University
and the Korea University Business School, Korea University, [email protected]. We thank John McConnell, Simon
Gervais, and Soojin Yim, and seminar participants at Cornell University, Maastricht University, the Mitsui Finance
Symposium at the University of Michigan, and the All Georgia Finance Conference at the Federal Reserve Bank of
Atlanta for helpful comments. We are particularly grateful to William O'Brien who provided excellent research
assistance.

1
1. Introduction
Traditional theories of capital bugeting and structure assume that managers and investors are
fully rational with unbiased forecasts of future events. Managers take for granted that capital
markets are efficient, and investors assume managers respond rationally to their compensation
contracts and monitoring mechanisms. In recent years, research has begun to consider violations
of these assumptions and explore how behavioral biases influence the corporate decision making
process (Baker and Wurgler, 2012).
One area of behavioral corporate finance literature emphasizes investor behavior that is
less than fully rational and explores the strategic response of rational managers (e.g., Baker,
Stein, and Wurgler, 2003; Bergman and Jenter, 2007; Polk and Sapienza, 2013). A second line of
research examines the effects of behavioral biases among corporate managers themselves (e.g.,
Malmendier and Tate, 2005, 2008; Hirshleifer, Low, and Teoh, 2012; Ben-David, Graham, and
Harvey, 2013). While the literature generally has considered the two approaches separately, in
practice, investor and manager irrationality likely coexist.
The goal of this study is to explore the extent to which manager and investor optimism
influence corporate decision making. As measures of manager and investor optimism, we use
aggregated surveys of CEO and consumer confidence conducted by The Conference Board. Our
setting allows us to directly compare CEO confidence with consumer confidence using a
similarly constructed measure, and we disentangle CEOs’ and consumers’ relative effects on
corporate finance activities.
Although consumer confidence is more widely discussed in the financial press, we might
expect CEO confidence to more reliably predict future economic conditions. As insiders, CEOs
are better informed about their companies than consumers. CEOs also tend to be well educated

2
and perhaps less vulnerable to behavioral biases. At the same time, managers are not immune
from cognitive biases and may deviate from rational decision making. For example, using
proxies for individual overconfidence, research finds evidence that CEO overconfidence affects
firm investment (Malmendier and Tate, 2005, 2008; Galasso and Simcoe, 2011; Hirshleifer,
Low, and Teoh, 2012; Ben-David, Graham, and Harvey, 2013), capital structure (Hackbarth,
2008; Malmendier, Tate, and Yan, 2009; Ben-David, Graham, and Harvey, 2013), and corporate
governance (Goel and Thakor, 2008).
Empirically, we find CEOs and consumers often disagree. The late 1990s, for instance,
mark an episode when consumers were substantially more optimistic about economic conditions
than CEOs. The mid-2000s, on the other hand, represent years during which CEOs were less
pessimistic than consumers. More generally, we find that both confidence levels respond
similarly to certain macroeconomic variables (e.g., inflation, GDP growth). At the same time,
consumer confidence is more closely tied to labor market conditions, whereas CEOs respond
more strongly to corporate performance.
How do CEO and investor optimism relate to corporate decision making? We observe
that capital expenditure, merger activity, and financing activity all increase with CEO and
consumer confidence. For example, a one standard deviation increase in CEO (consumer)
confidence is associated with a 0.38% (0.18%) increase in future capital expenditure over total
assets. To put these numbers in perspective, the median capital expenditure in our sample is
4.61%. Similarly, a one standard deviation increase in CEO (consumer) confidence translates
into a 0.31% (0.52%) increase in the future aggregate net dollar amount raised via debt and
equity scaled by total assets, which compares to an average scaled net issuance of 6.0%.

3
The observed positive relation between corporate expansion and CEO and consumer
confidence is consistent with both rational and behavioral explanations. In a rational setting, each
measure of confidence could provide incremental information about economic conditions, and
managers may judiciously consider consumers’ perspective when making corporate finance
decisions. On the other hand, if CEOs are susceptible to excess optimism, then managers may
overinvest based on their own biased beliefs. Alternatively, if irrationality manifests primarily on
the investor side, agency conflicts could lead rational managers to exploit periods of high
consumer confidence to empire build.
Our analysis of confidence and firm performance points towards excess optimism among
consumers. In particular, we find that CEO confidence positively predicts future return on assets.
In sharp contrast, consumer confidence is negatively related to this performance measure. In
particular, a one standard deviation increase in CEO confidence is associated with a 0.68%
increase in ROA, whereas a one standard deviation increase in consumer confidence is
associated with a 0.43% decrease in ROA. Consumer confidence also negatively predicts sales
growth, with a one standard deviation increase in consumer confidence being associated with
2.3% lower sales growth.
One possible interpretation for the negative relation between consumer confidence and
future performance is that high consumer confidence signals a point in the business cycle where
firm growth and profitability are naturally lower. To help rule out this and other fundamentals-
based explanations, we examine the relation between measures of confidence and future analyst
forecast revisions and earnings surprises. Consistent with disappointment in future firm
performance, we find a negative relation between consumer confidence and subsequent forecast
revisions and earnings surprises. In particular, a one standard deviation increase in consumer

4
confidence is associated with 0.28% greater reduction in future earnings forecasts (compared to a
mean reduction of 1.73%). Using the consensus forecast as the market’s expectation, we
similarly find one standard deviation increase in consumer confidence leads to 0.54% lower
earnings surprises. On the other hand, the relation between CEO confidence and forecast
revisions and earnings surprises is positive but generally insignificant. These findings suggest the
connection between high consumer confidence and low firm performance is related to excess
optimism leading to disappointing cash flows rather than being driven by fundamental factors.
Our evidence suggests firms raise funds and invest when consumers are confident, but
this appears to be an inopportune time to grow. We next study the relation between confidence
and CEO trading to help determine whether management is misled by consumer confidence or
strategically exploits their misplaced optimism as an opportunity to empire build. Using the
approach of Cohen, Malloy and Pomorski (2012) to filter out routine trades, we find a negative
relation between consumer confidence and net purchases by CEOs. A one standard deviation
increase in consumer confidence is associated with a 0.32 standard deviation decrease in CEO
net purchases. In contrast, we find a positive and marginally significant relation between CEO
net purchases and CEO confidence. The results are consistent with CEOs buying when they are
confident and trading against consumer confidence.
Our final analysis explores the informational channel by which confidence is related to
investment and firm performance. In particular, we revisit the analyses while including nine
additional controls for macroeconomic conditions. While the findings are generally robust to
individual controls, including the full litany of macro variables weakens the results and more so
for consumer confidence. One interpretation is that consumers mistakenly interpret the

5
macroeconomic conditions which lead them to be personally confident, such as low inflation and
high labor income growth, as also reflecting fertile opportunities for corporate growth.
Taken together, the results imply that CEOs in aggregate are less susceptible than
investors to periods of excess optimism. Consumer confidence negatively predicts future firm
performance, whereas CEO confidence is positively related to future firm performance.
Moreover, the patterns of investment, issuance, and trading by insiders suggest CEOs recognize
excess optimism among investors and exploit these periods as an opportunity to empire build
(Jensen, 1986).
Our findings help clarify existing stylized facts. For example, research finds that
companies with high growth in investment or total assets tend to earn lower subsequent returns
(e.g. Titman, Wei, and Xie, 2004; Cooper, Gulen, and Schill, 2008; Arif and Lee, 2014). This
evidence is consistent with over-optimism among both investors and management. However, the
poor performance of growing firms is also consistent with opportunistic empire building on the
part of management. Our analysis helps to differentiate between behavioral and market-timing
explanations.
Our results also help extend the literature that examines the effects of investor sentiment
on corporate behavior. Bergman and Roychowdhury (2008) find that managers reduce long-
horizon disclosure during periods of high sentiment, consistent with their trying to maintain
optimistic earnings valuations. Hribar and Quinn (2013) find a negative relation between
consumer confidence and insider trading that is stronger among hard-to-value firms such as
small firms and loss firms. We document a similar difference after controlling for CEO
confidence, suggesting that the results are related to differences of opinion rather than
unobserved factors.

6
More generally, our evidence that behavioral biases manifest more on the investor side
rather than the manager side supports a governance model where managers’ incentives are
aligned with equity owners, but where more rational/better informed managers are afforded the
flexibility to make decisions that are unpopular in the marketplace.
The paper proceeds as follows: The CEO and consumer confidence measures are
described in Section 2. Section 3 examines the relation between the confidence measures and
corporate finance activities. Section 4 examines the relation between CEO- and consumer
confidence and firm performance. Section 5 examines confidence levels and insider trading,
Section 6 conducts additional analyses, and Section 7 concludes.
2. Data
In this section we describe the CEO and consumer confidence data as well as the data on
corporate investment, financing, and performance.
2.1 CEO Confidence Data
We gauge CEO confidence using The Conference Board Measure of CEO Confidence produced
by The Conference Board. The data series begins in 1976 and our sample ends in 2012. The
CEO Confidence Survey is conducted once every quarter with questionnaires mailed out in the
second month of the quarter and responses flowing in throughout the remainder of the survey
quarter. According to The Conference Board, questionnaires are mailed to 800 CEOs, of which
between 80 and 100 CEOs respond. The companies surveyed are all members of The Conference
Board and operate in one of the following ten industries: food/textiles/apparel,
paper/printing/publishing, chemicals/petroleum/rubber, metal, machinery, utilities,
wholesale/retail trade, banking/financing, insurance, and business services.

7
CEOs are asked to assess (1) current economic conditions vs. 6 months ago, (2)
expectations for the economy, 6 months ahead, and (3) expectations for their own industry, 6
months ahead. For each of these three questions, CEOs are given five reply options:
“substantially better” [Score=100], “moderately better” [Score=75], “same” [Score=50],
“moderately worse” [Score=25], and “substantially worse” [Score=0]. The Conference Board
computes the average score across all CEOs for each question, and then averages across the three
questions to form The Conference Board Measure of CEO Confidence. Theoretically, the CEO
confidence measure can range from 0 to 100; in practice the index ranges from 24 to 76 in our
sample period.
As a first step in characterizing CEO confidence, we compare the CEO confidence index
with two other similar measures of executive expectations. We first consider the Global CFO
Outlook Survey which begins in 2001 and is analyzed in Graham and Harvey (2007). The survey
questionnaire is delivered quarterly to senior financial executives and subscribers of CFO
magazine, and respondents are asked whether they are more/less optimistic about the economy
relative to the previous quarter. Analogous to our CEO index, we calculate the “CFO”
confidence index as the difference between the percentage of optimistic and pessimistic
responses. We find the correlation between CEO and “CFO” confidence indexes is 0.87.
A second alternative measure of management confidence is from the Philadelphia Fed’s
Business Outlook Survey, in which manufacturing firms in the third Federal Reserve District
(Pennsylvania, New Jersey, and Deleware) are asked to rate business conditions on a monthly
basis. We find the correlation between our CEO confidence index and the Fed’s “future general
business activity index” is 0.66. The benefit of the Conference Board data is that it provides a
longer and broader (geographically and industry-wise) measure of aggregate CEO confidence

8
that is constructed in a manner similar to consumer confidence. The CEO index’s high observed
correlation with alternative measures of manager optimism helps build confidence in the data.
2.2 Consumer Confidence Data
We measure investor optimism using The Conference Board Consumer Confidence Index also
produced by The Conference Board. The survey is conducted by TNS, a market information
group. The data have been examined by Ludvigson (2004) and Lemmon & Portniaguina (2006),
among others. On the first of the month, TNS mails questionnaires to a sample of 5,000
households; responses flow in throughout the survey month. The sample is representative based
on key demographics and geographics as defined by the US Census Bureau and it is drawn from
on original sample in which respondents agree to do the interviews. The Conference Board
reports that of the 5,000 households, between 3,250 and 3,500 respond.1
Data are available every other month from 1967 to mid-1977, and every month thereafter.
Our sample period begins in 1976 (based on the availability of CEO confidence) and ends in
2012. As the CEO Confidence Survey is conducted once every quarter with questionnaires being
mailed out in the second month of the quarter (and responses flowing in throughout the
remainder of the second month and the full third month of the survey quarter), we use consumer
confidence data as of the third month of the quarter (i.e., March, June, September, and
December). Using data from the second month of the quarter has very little impact on our
results.2
1 Questionnaires are mailed to a sample of 5,000 households that previously agreed to do the interviews, and as a result the
overall response rate is unknown. 2 From Feb 1976 to Feb 1977, when consumer surveys were still conducted bi-monthly, we use data as of February (2nd month
of the quarter), June (3rd month), August (2nd month), December (3rd month).

9
The Conference Board also provides consumer confidence indexes by geographic
regions, and our sample is available from January 1981 to October 2010. Consumers are
assigned to one of the following regions based on their geographic locations: New England,
Middle Atlantic, South Atlantic, East North Central, West North Central, East South Central,
West South Central, Mountain, and Pacific. Coval and Moskowitz (1999) find investors exhibit a
strong preference for locally headquartered firms, and regional consumer confidence may also be
more relevant for company sales, etc. In our panel analysis, we therefore take advantage of the
region-level data to build a panel. Specifically, we match each firm’s headquarter location to the
aforementioned seven regions and use the regional consumer confidence measures. Although
perhaps less true for geographically diverse firms, our approach assumes that confidence near the
headquarters is most important for firm decisions.3
Consumers are asked to assess (1) current economic conditions vs. 6 months ago, (2)
expectations for the economy, 6 months ahead, (3) current employment conditions vs. 6 months
ago, (4) expectations for employment conditions, 6 months ahead, and (5) expectations for total
family income, 6 months ahead. For each of these five questions, consumers are given three
reply options: “positive”, “negative”, or “neutral”. For each question, the positive figure is
divided by the sum of the positive and negative to yield a proportion. For each question, the
average proportion for the calendar year 1985 is used as a benchmark to yield the index value for
that question. The Consumer Confidence Index is the average of the index value for questions 1,
2, 3, 4, and 5. By construction, the confidence measure equals 100 in calendar year 1985.
Throughout our sample, it ranges from 26.9 to 142.5.
3 Looking ahead, the results using the national consumer confidence index are similar but slightly less robust than
when using the region-matched consumer confidence.

10
A comparison of the questions used to construct the CEO confidence with the questions
posed in the Consumer Confidence Survey reveals similarities: Both surveys ask participants to
evaluate current as well as future economic conditions with a six-month time frame. Two major
differences are that while CEOs are asked to evaluate industry conditions in their third question,
consumers are surveyed about their employment condition and family income. Moreover, while
CEOs are given five reply options (“substantially better”, “moderately better”, “same”,
“moderately worse”, and “substantially worse”), consumers are given only three reply options
(“better”, “same”, “worse”).
Another difference is that, unlike the values in The Conference Board Measure of CEO
Confidence, the response proportions used in the Consumer Confidence Index are seasonally
adjusted. However, The Conference Board notes that the consumer confidence “series are
typically not highly seasonal” (The Conference Board 2011, p. 3). Correspondingly, we observe
little seasonality in the Conference Board Measure of CEO Confidence™.
2.3 Macro and Performance Data
We employ several macroeconomic and stock-market variables drawn from the literature either
as independent or as dependent variables. Financial-market variables observed quarterly, semi-
annually, and annually, and measured in percent include: CRSP value-weighted return (RETvw)
and CRSP equal-weighted return (RETew). Data are from the Center for Research in Security
Prices (CRSP).
Macroeconomic variables observed quarterly and measured in percent are: Dividend
yield (DIV) measured as the total cash ordinary dividend of the CRSP value-weighted index over
the last four quarters and divided by the value of the index at the end of the current quarter (as in
Fama & French (1988)); default spread (DEF) measured as the difference between the yields to

11
maturity on Moody’s Baa-rated and Aaa-rated bonds; the yield on three-month Treasury bills
(YLD3); GDP growth (ΔGDP) measured as 100 times the quarterly change in the natural
logarithm of chained GDP (in 2005 dollars); consumption growth (ΔCONSUMPTION) measured
as 100 times the quarterly change in the natural logarithm of personal consumption expenditures;
labor income growth (ΔLABOR) measured as 100 times the quarterly change in the natural
logarithm of labor income, computed as total personal income minus dividend income, per
capita, and deflated by the PCE deflator; the unemployment rate (URATE); the inflation rate
(CPIQ), from CRSP, cumulated over the most recent three months; the consumption-to-wealth
ratio (CAY) from Lettau & Ludvigson (2001); and corporate profitability (PROFIT) measured as
corporate profits after tax (without Inventory Valuation Adjustment and without Capital
Consumption Adjustment). The data source for the macroeconomic variables are the Board of
Governors of the Federal Reserve System, the US Department of Commerce: Bureau of
Economic Analysis, and the US Department of Labor: Bureau of Labor Statistics.
2.4 CEO versus Consumer Confidence
Figure 1 plots CEO confidence against consumer confidence. To facilitate comparison, we
standardize both CEO and consumer confidence. In particular, we compute the average and the
standard deviation of each series, over the 1976 to 2012 sample period. We then subtract from
each quarterly observation its average and we scale the difference by its standard deviation.
Figure 1 reveals that CEOs and consumers periodically agree and disagree. For example,
during the late 1970s and the late 2000s both CEOs and consumers were pessimistic. On the
other hand, there was striking disagreement during the late 1990s when consumers were
substantially more optimistic about economic conditions than CEOs.

12
To more fully characterize the differences between CEO and consumer confidence, Table
1 examines whether various macroeconomic variables correlate differently with
contemporaneous values of CEO confidence than they do with contemporaneous values of
consumer confidence. We find that both measures of confidence correlate similarly with
contemporaneous GDP growth and consumption growth. However, consumer confidence is
significantly more sensitive to contemporaneous labor income growth and the unemployment
rate, whereas CEO confidence correlates more highly with corporate profitability.
In Table 2, we estimate regression equations of CEO (consumer) confidence on lagged
realizations of macroeconomic variables. We observe that high GDP growth precedes high CEO
and high consumer confidence, whereas high dividend yield and high inflation rate precede low
CEO and low consumer confidence. While CEOs and consumers respond similarly to past GDP
growth, dividend yield and inflation, consumers respond much more positively to high past labor
income growth than CEOs. Moreover, while consumers respond negatively to high past
unemployment rate, CEOs respond positively to high past unemployment rate. In addition,
CEOs’ confidence relates more positively to past realizations of corporate profitability and stock
market performance.
To summarize, consumers respond more strongly to labor market conditions, whereas
CEOs respond more strongly to measures of corporate performance. As strong corporate and
stock market performance does not necessarily correspond with good labor market conditions,
this may provide a partial explanation for why sometimes CEOs and consumers differ in their
confidence levels. In our analysis, we explore how these differences are associated with
corporate activities and performance.
3. Confidence and Corporate Finance: CEOs and Consumers

13
We begin our investigation by assessing how CEO and consumer confidence relate to measures
of investment and financing activity. We study a large unbalanced panel of 12,628 firms from
1981 to 2011. We exclude financial firms (i.e., firms with a one-digit SIC of 6) as well as utility
firms (i.e., firms with a two-digit SIC of 49). Otherwise, our sample includes all
CRSP/Compustat firms with data on investment and financing.
3.1 Investment
We examine the relation between CEO and consumer confidence and future corporate
investment using two measures of investment. Our first measure is the aggregate dollar amount
of capital expenditure by firm i during fiscal year t (Compustat CAPX), scaled by the lagged
book value of total assets (Compustat AT) and divided by 100. Our second measure of corporate
investment relies on the aggregate dollar amount spent on mergers and acquisitions (M&A)
announced by firm i during fiscal year t, scaled by the lagged book value of total assets and
divided by 100. We obtain acquisition data from SDC for completed deals. If a firm does not
conduct any merger activity in a given fiscal year, M&A activity is equal to zero. Here, we
restrict our sample to firms which experience M&A activities.4
Our baseline regression equation is motivated by Baker, Stein and Wurgler (2003):
𝐶𝐴𝑃𝑋𝑖,𝑡
𝑇𝐴𝑖,𝑡−1= 𝛼𝑖 + 𝛽1𝐶𝐸𝑂_𝐶𝑜𝑛𝑓𝑡−1 + 𝛽2𝐶𝑜𝑛𝑠_𝐶𝑜𝑛𝑓𝑡−1 + 𝑋𝛿 + 𝑒𝑖,𝑡, (1)
where i indexes firms and t denotes time. Investment is measured annually by fiscal year and
confidence is measured quarterly. CEO_Conft-1 and Cons_Conft-1 therefore denote the most
recent levels of confidence prior to the beginning of firm i’s fiscal year. To facilitate
interpretation, CEO_Conft-1 and Cons_Conft-1 are standardized to have a mean of zero and a
4 This reduces our sample to 5,341 firms. Results are robust when using the whole sample.

14
standard deviation of one. X includes the lagged dependent variable, Firm Sizei,t-1, which is the
market value of equity prior to the beginning of firm i’s fiscal year, and Qi,t-1, which is defined as
total assets plus the market value of equity (at fiscal year-end) minus the book value of equity
(Compustat SEQ), scaled by total assets.
Our specification uses the lagged dependent variable as well as firm-fixed effects (αi).
Standard OLS suffers from endogenity issues in this setting (Arellano and Bover, 1995).
Therefore, to obtain consistent estimator as well as to gain efficiency, we adapt the system GMM
developed by Arellano and Bover (1995). Standard errors are clustered by fiscal year and are
robust to heteroskedasticity and arbitrary forms of serial correlation.
Our interest centers on the coefficient estimates on CEO_Conft-1 and Cons_Conft-1. As
reported in Table 3, the regression produces strong positive and significant slopes on the
confidence measures. The estimate on CEO_Conft-1 ranges from 0.373 (t-statistic = 4.51) to
0.381 (t-statistic = 4.69) depending on the regression specification, implying that a one standard
deviation increase in CEO confidence leads to a 0.37% to 0.38% increase in scaled capital
expenditure. The estimate on Cons_Conft-1 ranges from 0.163 (t-statistic = 1.98) to 0.182 (t-
statistic = 2.97), implying that a one standard deviation increase in consumer confidence
translates to a 0.16% to 0.18% increase in scaled capital expenditure. These effects are
economically significant relative to the median level of scaled investment of 4.60%.
We make similar observations when examining the relation between confidence levels
and M&A activity. Table 4 reports the findings when capital expenditures in Equation (1) is
replaced with scaled M&A activity. The results indicate that M&A activity increases with
consumer confidence. The estimate on CEO_Conft-1 is 0.209 (t-statistic = 2.07) for our main
regression specification; the estimate on Cons_Conft-1 is 0.685 (t-statistic = 5.29). These numbers

15
imply that a one standard deviation increase in CEO and consumer confidence translates to a
0.21% and 0.69% increase in scaled M&A activity.
3.2 Financing
Given the rise in investment activity associated with high levels of CEO and consumer
confidence, it is natural to assess whether increases in confidence also lead to greater external
financing activity. We explore the connection between confidence and issuance by computing
the aggregate dollar amount raised through both debt issuance and external equity by firm i
during fiscal year t, scaled by the lagged book value of total assets and divided by 100.
We define Debt-Issuance as the difference between (a) “Debt – Due in 1st Year”
(Compustat DD1) plus “Long-Term Debt – Total” (Compustat DLTT) in fiscal year t and (b) the
sum of DD1 and DLTT in fiscal year t-1. External equity issuance is computed as in McKeon
(2013). The backbone is the “Sale of Common and Preferred Stock-”variable (Compustat
SSTKY) from the Compustat Fundamentals Quarterly file. SSTKY is a year-to-date figure. To
compute quarterly proceeds for quarters 2, 3, and 4, we thus subtract the SSTKY from the
previous quarter. To isolate the issuance of common shares, we also subtract proceeds from
preferred shares (increases in PSTKQ, or PSTKRQ when missing). Negative values or missing
values are set equal to zero.
Quarterly common share issuances as computed above divided by the market value of
equity is referred to as quarterly Equity-Issuance. This issuance measure captures both internal
and external equity issuances. Based on hand-collected data, McKeon (2012) makes the
observation that virtually all observations for which quarterly Equity-Issuance is greater than
three percent represent external equity issuances. Therefore, we define quarterly External-

16
Equity-Issuance as equal to Equity-Issuance if it is greater than three percent, and zero otherwise.
Annual external equity issuance is the sum of the quarterly External-Equity-Issuance.5
Our analysis is organized around the following regression equation:
𝑁𝑒𝑡𝐼𝑠𝑠𝑖,𝑡
𝑇𝐴𝑖,𝑡−1= 𝛼𝑖 + 𝛽1𝐶𝐸𝑂_𝐶𝑜𝑛𝑓𝑡−1 + 𝛽2𝐶𝑜𝑛𝑠_𝐶𝑜𝑛𝑓𝑡−1 + 𝑋𝛿 + 𝑒𝑖,𝑡, (2)
where 𝑁𝑒𝑡𝐼𝑠𝑠𝑖,𝑡 is the sum of debt- and equity-issuance for firm i in year t. CEO_Conft-1 and
Cons_Conft-1 reflect the most recent levels of confidence prior to the beginning of firm i’s fiscal
year. CEO_Conft-1 and Cons_Conft-1 continue to be standardized with mean zero and unit
standard deviation to facilitate interpretation. We use the same set of independent variables as in
regression equation (1) and use the system GMM approach of Arellano and Bover (1995), where
standard errors are clustered by fiscal year and are robust to heteroskedasticity and arbitrary
forms of serial correlation.
The results in Table 5 show that external financing significantly increases with CEO and
consumer confidence. Based on our estimated coefficients, a one standard deviation increase in
CEO_Conft-1 corresponds to 0.309% more net issuance (t-statistic = 2.45), which compares to an
average scaled net issuance of 6.85% in our overall sample. Consumer confidence is also
positively related to issuance, with a one standard deviation increase in Cons_Conft-1
corresponding to a 0.517% more net issuance (t-statistic = 3.63).
We also explore whether CEO or consumer confidence is associated with firms’
decisions to issue equity relative to debt by substituting the Equity-Ratio, calculated as the ratio
of Equity-Issuance over Net-Issuance, as the dependent variable in Equation 2. In untabulated
results, we find no significant relation between Equity-Ratio and either measure of confidence.
5 Please see the Appendix in McKeon (2013) for a more detailed description of the variable construction.

17
The findings suggest CEO and consumer confidence do positively predict firm’s financing
activities, but they do not provide specific support for consumer or CEO confidence-based
market timing (e.g. Baker and Wurgler, 2002; Malmendier, Tate, and Yan, 2011).
3.3 Summary
Taken together, we detect a positive relation between CEO and consumer confidence and future
corporate investment and financing activities. These patterns are generally consistent with both
rational and behavioral interpretations. For example, rational managers may assess future
economic conditions correctly and alter their firm’s investment and financing activity
accordingly. Moreover, while managers occasionally disagree with consumers about the state of
the economy, they rationally update their views based on consumers’ perspective when making
decisions. In particular, when consumers are confident, managers anticipate selling more
products and adapt the level of investment and financing.
A more behavioral view of the data is that irrational managers invest based on their own
biased beliefs. Managers particularly do so if external financing is relatively easy to obtain,
which is why investment also increases with our measure of investor optimism. Alternatively, if
the primary manifestation of irrationality is on the investor side, our results could imply that
investment and financing activity generally increase with more rational/better informed
managers’ assessment of economic conditions. Yet, in the presence of agency conflicts, rational
managers also exploit times of high investor optimism to empire build.
In the next section we explore the relation between CEO and consumer confidence and
future firm performance to help differentiate between these alternative explanations.
4. Confidence and Firm Performance: CEOs and Consumers

18
4.1 Confidence and Operating Performance
We examine the relation between CEO and consumer confidence and firm performance using
two accounting-based measures. Our first measure is annual growth in sales (Compustat SALE),
and the second measure is return on assets (Compustat EBIT / (AT+lagged(AT)/2). Both
variables are divided by 100.
We estimate the following regression specification:
𝑃𝑒𝑟𝑓𝑖,𝑡 = 𝛼𝑖 + 𝛽1𝐶𝐸𝑂_𝐶𝑜𝑛𝑓𝑡−1 + 𝛽2𝐶𝑜𝑛𝑠_𝐶𝑜𝑛𝑓𝑡−1 + 𝑋𝛿 + 𝑒𝑖,𝑡, (3)
where Perfi,t denotes ROA or sales growth for firm i in fiscal year t. As in the previous analysis,
CEO_Conft-1 and Cons_Conft-1 reflect the standardized, most recent levels of confidence prior to
the beginning of firm i’s fiscal year. We include the same set of controls. We implement the
Arellano-and-Bover-system GMM and we construct our standard errors to be robust to
heteroskedasticity and arbitrary forms of serial correlations, as well as clustering by fiscal year.
Table 6 reports the estimates for ROA. The confidence coefficients imply that a one
standard deviation increase in CEO_Conft-1 comes with 0.678% (t-statistic = 6.75) to 0.661% (t-
statistic = 6.93) higher ROA. In contrast, a one standard deviation increase in consumer
confidence comes with -0.433% (t-statistic = -5.55) to -0.399% (t-statistic = -6.37) lower future
ROA. To put these numbers in perspective, the median ROA in our sample is 7.0%.
Similar differences are observed between CEO and consumer confidence and future sales
growth. Sales growth marginally increases with CEO confidence, yet strongly decreases with
consumer confidence. The estimate on CEO_Conft-1 ranges from 0.693 (t-statistic = 0.98) to
0.758 (t-statistic = 1.27) and the estimate on Cons_Conft-1 ranges from -2.252 (t-statistic = -4.17)
to -2.271 (t-statistic = -3.98), depending on the regression specification. These numbers imply
that a one standard deviation increase in CEO (consumer) confidence is associated with a 0.69-

19
0.76% increase (2.25-2.27% decrease) in future sales growth, relative to the median sales growth
in our sample of 8.0%. The positive relation between CEO confidence and future performance,
combined with the negative relation between consumer confidence and future firm performance,
is consistent with excess optimism manifesting primarily on the investor side.
4.2 Confidence and Analyst Forecasts
A potential alternative interpretation of the performance results is that CEOs and
consumers have unbiased expectations, but they are confident at different points in the business
cycle which naturally reflect different performance levels. If high consumer confidence leads not
only to lower sales growth and ROA, but also to disappointing cash flows, then the negative
relation between consumer confidence and firm performance is unlikely to be explained by
(anticipated) fundamental factors alone.
We test this interpretation by analyzing the relation between CEO and consumer
confidence and subsequent forecast revisions and earnings surprises. In particular, for each firm-
year, we calculate earnings surprises as the difference between actual annual earnings and the
consensus forecast. Following Livnat and Mendenhall (2006), we use the I/B/E/S Detail file and
construct the consensus forecast as the median of the most recent (prior to the earnings release)
forecast across analysts. Similarly, for each firm-year we measure the forecast revision as the
median difference between analysts’ last EPS forecast of the year and the first forecast.
Forecast revisions therefore capture the change in earnings expectations over the course
of the fiscal year, and earnings surprises measure the unexpected news in the final
announcement. Both forecast revisions and earnings surprises are scaled by price per share at the
end of the fiscal year. We then regress equal-weighted forecast revisions and earnings surprises

20
on lagged quarterly levels of CEO and consumer confidence while controlling for lagged
earnings surprises and lagged equal-weighted market returns as follows:
𝐹𝑜𝑟𝑒𝑐𝑎𝑠𝑡𝑡 = 𝛼 + 𝛽1𝐶𝐸𝑂_𝐶𝑜𝑛𝑓𝑡−1 + 𝛽2𝐶𝑜𝑛𝑠_𝐶𝑜𝑛𝑓𝑡−1 + 𝑋𝛿 + 𝑒𝑡. (5)
where 𝐹𝑜𝑟𝑒𝑐𝑎𝑠𝑡𝑡 denotes equal-weighted forecast revisions or earnings surprises across all firms
with fiscal year end in quarter, t. Standard errors are Newey-West adjusted with four lags.6
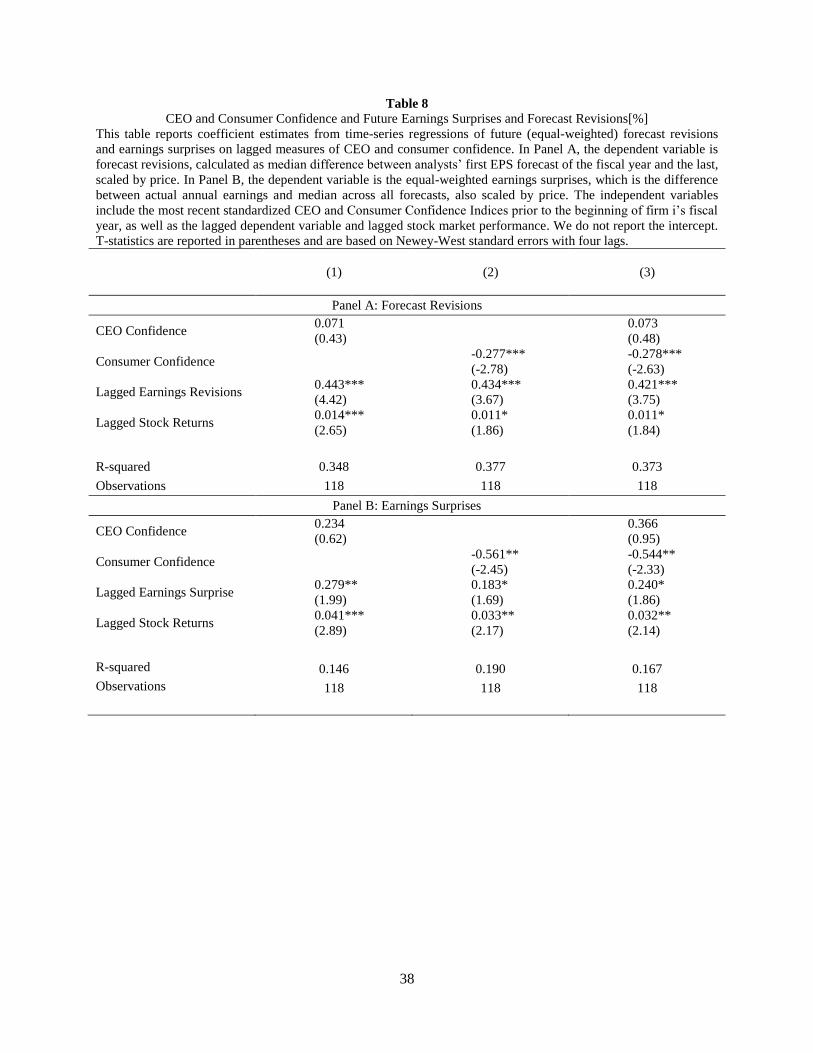
Table 8 reports the results. We find that consumer confidence negatively predicts forecast
revisions and earnings surprises. In Panel A, a one standard deviation increase in consumer
confidence is associated with a 0.28% (significant at 1% level) decrease in earnings forecasts,
relative to the median forecast revision of -1.73%. The relation between consumer confidence
and future earnings surprises in Panel B is somewhat stronger. The coefficient of consumer
confidence ranges from -0.544% (t-statistic = -2.33) to -0.561% (t-statistic = -2.45), relative to a
median earnings surprise of -2.04%. We find CEO confidence is positively related with both
forecast revisions and earnings surprises, but the relation is statistically insignificant. In general,
we find high consumer confidence is associated with disappointing future cash flows.
Taken together, our evidence is consistent with managers accurately assessing future
economic conditions and positively predicting future ROA and to a certain extent sales growth.
This view implies that adapting the level of investment and financing to match managers’ beliefs
is a value-enhancing strategy. Consumers, on the other hand, appear more susceptible to over-
optimism, with high levels of consumer confidence negatively predicting firm performance.
Nevertheless, managers appear to take consumers’ views into consideration, as investment and
financing also increase with consumer confidence.
6 The results are robust when using value-weighted earnings surprises and forecast revisions as well as constructing
earnings surprises and forecast revisions using mean forecasts.

21
A remaining question is whether managers mistakenly interpret high consumer
confidence as a signal of improved sales growth and profitability, or alternatively realize the
negative performance relation and strategically exploit high consumer confidence to empire
build. In the next section, we help distinguish between these interpretations by exploring how
CEOs react to consumer confidence through their personal trading.
5. Confidence and Insider Trading: CEOs and Consumers
The previous sections document a positive relation between CEO and consumer confidence and
corporate expansion yet contrasting relations with firm performance. In particular, the negative
relation between consumer confidence and earnings surprises suggests that investors incorrectly
interpret high confidence periods as signaling favorable business conditions for growth. If CEOs
recognize consumer over-optimism, they may benefit from the reduced resistance to empire
building and increase firm investment accordingly. In addition, more rational CEOs may also
benefit at the personal level by trading against investor over-optimism. For example, Jenter
(2005) finds that managers’ private portfolio decisions are consistent with market timing
behavior, with insider purchases being more likely among low valuation firms. Managers are
also more likely to purchase shares when they themselves are confident about future economic
activity.
In line with our stock-market-regression equation (4), we estimate the following time-
series regression equation to assess the relation between CEO and consumer confidence and
insider trading:
𝐼𝑛𝑠𝑡 = 𝛼 + 𝛽1𝐶𝐸𝑂_𝐶𝑜𝑛𝑓𝑡−1 + 𝛽2𝐶𝑜𝑛𝑠_𝐶𝑜𝑛𝑓𝑡−1 + +𝛿3𝑟𝑚,𝑡−1 + 𝑒𝑡 . (6)

22
Insider buying versus selling (Ins) is the logarithm of one plus the aggregate value of shares
purchased minus the aggregate value of shares sold across all CEOs in our sample during
calendar quarter t, divided by the total market capitalization in period t-1. CEOs typically receive
equity shares as part of their compensation and they subsequently sell them in routine ways.
CEOs may also engage in routing buys. As these trades are non-informed, in computing the
aggregate value of shares purchased/sold, we filter out routine-buys/sells and focus on non-
routine-transactions. Motivated by Cohen, Malloy & Pomorski’s (2012) approach to filter out
scheduled trading activity, we deem a buy (sell) occurring in month t a routine-buy (sell) if the
CEO purchased (sold) shares in the same month t over the past three years .
CEO_Conft-1 and Cons_Conft-1 denote the standardized, one-quarter lagged CEO and
consumer confidence prior to the insider transactions. As before, we control for past GDP
growth, past consumption growth, past labor income growth and past consumption-to-wealth
ratio. For robustness, we also report results when controlling for past stock market performance.
Standard errors are Newey-West adjusted with four lags.
Panel A of Table 9 presents the coefficients for one-quarter lagged confidence measures.
The estimate on Cons_Conft-1 ranges from -0.320 (t-statistic = -4.33) to -0.320 (t-statistic = -
4.26), which suggests a one-standard deviation increase in consumer confidence is associated
with a 0.32 to 0.33 standard deviation decrease in net purchases. The results are similar in Panel
B, which presents the coefficients for four-quarter lagged confidence measures. Consumer
confidence continues to be significantly negatively related to net purchases. The coefficient
estimate ranges from -0.270 (t-statistic = -3.96) to -0.283 (t-statistic = -3.64). Negative loadings
suggest CEOs tend to sell after observing high consumer confidence. This is consistent with

23
CEOs understanding that investors are over-optimistic and taking advantage by trading against
investor optimism.
The relation between CEO confidence and net purchases is positive but less robust. The
estimate on CEO_Conft-1 ranges from 0.006 (t-statistic = 0.04) to 0.290 (t-statistic = 2.54),
depending on the regression specification. The results suggest that CEOs not only trade against
investor optimism, but also tend to trade based on their own outlooks about the future economy.
Interestingly, CEOs appear to act more slowly on their own confidence, but more quickly on
consumer confidence Overall, the consumer confidence evidence is consistent with CEOs being
aware that high investor optimism frequently precedes low subsequent firm performance and
with CEOs trading accordingly.
6. Confidence and Macroeconomic Conditions
In our final analysis, we examine whether the different relations between CEO and consumer
confidence and corporate expansion and firm performance is driven by different emphasis on
fundamentals. Specifically, we re-estimate regression equations (1) – (5) and include
macroeconomic controls as additional independent variables. We consider the following nine
macro variables as in Lemmon and Portniaguina (2006): Dividend yield (DIV); default spread
(DEF); the yield on three-month Treasury bills (YLD3); GDP growth (ΔGDP); consumption
growth (ΔCONSUMPTION); labor income growth (ΔLABOR); the unemployment rate (URATE);
the inflation rate (CPIQ); and the consumption-to-wealth ratio (CAY) from Lettau & Ludvigson
(2001). We initially include the macroeconmic variables one by one. Our final regression
specification includes all macroeconomic variables simultaneously.
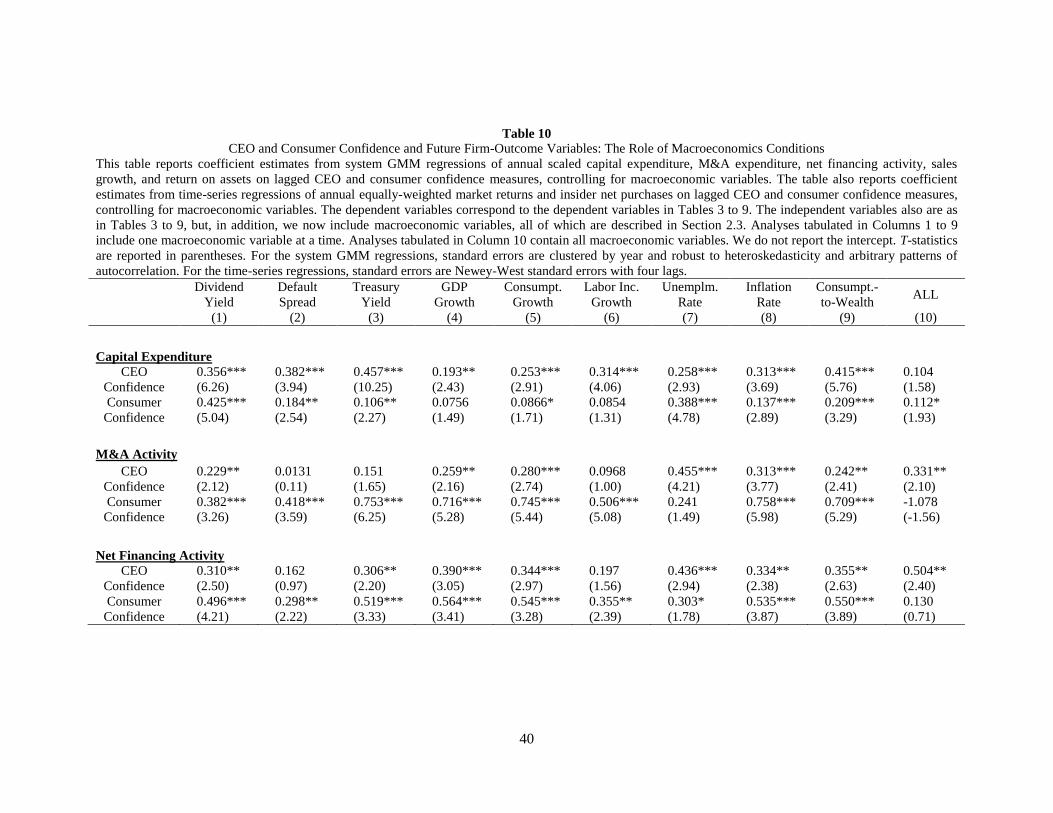
As reported in Table 10, the levels of investment and net financing activity generally
increase with CEO confidence even after accounting for macroeconomic conditions. This

24
observation holds when we control for macroeconomic conditions individually; it also holds
when controlling for all macroeconomic variables simultaneously. The evidence is more
ambiguous for consumer confidence. When controlling for macroeconomic variables
individually, consumer confidence continues to positively and significantly predict investment
and net financing activity. However, when accounting for all macroeconomic variables
simultaneously, consumer confidence only weakly positively relates to future investment and net
financing activity.
Table 10 also reveals that CEO (consumer) confidence continues to positively
(negatively) relate to future firm performance once controlling for macroeconomic conditions,
although the statistical significance is attenuated. Consumer confidence also remains negatively
and significantly related to earnings surprises. For insider trading, the coefficient signs remain
the same after including all the macro controls, although the statistical reliability of the
associations is weaker.
Ultimately, it appears that much of the negative relation between consumer confidence
and firm performance is due to the mistaken belief that the fundamental conditions that lead
consumers to be confident, such as low inflation and high labor income growth, also signal a
good time for firms to grow. CEO confidence, on the other hand, appears positively related to
both corporate expansion and firm performance after controlling for fundamental factors.
7. Conclusion
Consumer confidence is widely discussed in the financial press and generally treated as an
important piece of economic information. Many brokerage firms forecast its movements, and it
has been the subject of many academic studies (e.g. Ludvigson, 2004; Lemmon and
Portniaguina, 2006). Our study is the first to examine a similarly constructed measure of CEO

25
confidence, and we examine the relation between aggregate measures of CEO and consumer
confidence and corporate finance activities, firm performance, and insider trading.
We find that CEO confidence positively predicts future return on assets. In contrast,
consumer confidence is negatively related to ROA as well as equal-weighted stock market
returns and earnings surprises. The performance evidence suggests CEOs are less susceptible to
over-optimism than investors. Despite their opposite implications for future performance, we
find that capital expenditure, merger activity, and financing all increase with both CEO and
consumer confidence. Further, we find that CEOs sell shares in their personal accounts during
periods of high consumer confidence which is consistent with CEOs recognizing periods of
overconfidence among investors and using it as an opportunity to empire build.
Our study makes an important incremental step in the literature on behavioral corporate
finance by considering the possibility of irrational behavior by both CEOs and investors. Baker
and Wurgler (2012) argue that research that emphasizes behavioral biases among investors has
different corporate governance implications than research that focuses on manager biases. An
irrational investor view prescribes that managers’ incentives be aligned, but also suggests that
more rational/better informed managers be given the flexibility to make decisions that are
unpopular with investors. An irrational manager view, on the other hand, prescribes that
managers strongly respond to rational market-price signals with limited managerial discretion.
These differing normative implications necessitate research on their relative importance, and our
findings provide initial evidence on this matter.

26
References
Arif, S., and Lee, C. M. C. (2014). Aggregate Investment and Investor Sentiment. Review of
Financial Studies, 27, 3241-3279.
Baker, M., & Wurgler, J. (2002). Market Timing and Capital Structure. Journal of Finance,
57(1), 1-32.
Baker, M., & Wurgler, J. (2012). Behavioral Corporate Finance: An Updated Survey. In G.
Constantinides, M. Harris, & R. Stulz, Handbook of the Economics of Finance.
Baker, M., Wurgler, J., & Yuan, Y. (2012). Global, Local, and Contagious Investor
Sentiment. Journal of Financial Economics, 104(2), 272-287.
Baker, M., Pan, X., & Wurgler, J. (2012). The Effect of Reference Point Prices on Mergers and
Acquisitions. Journal of Financial Economics, 106(1), 49-71.
Baker, M., Stein, J. C., & Wurgler, J. (2003). When Does the Market Matter? Stock Prices and
the Investment of Equity-Dependent Firms. The Quarterly Journal of Economics, 118(3),
969-1005
Baker, M., & Wurgler, J. (2012). Comovement and Predictability Relationships between Bonds
and the Cross-Section of Stocks. Review of Asset Pricing Studies, 2(1), 57-87.
Ben-David, I., Graham, J. R., & Harvey, C. R. (2013). Managerial Miscalibration. The Quarterly
Journal of Economics, 128(4), 1547-1584.
Bergman, N., & Jenter, D. (2007). Employee Sentiment and Stock Option Compensation.
Journal of Financial Economics, 84(3), 667-712.
Bergman, N. K., & Roychowdhury, S. (2008). Investor Sentiment and Corporate
Disclosure. Journal of Accounting Research, 46(5), 1057-1083.
Cheng, Q., & Lo, K. (2006). Insider Trading and Voluntary Disclosures, Journal of Accounting
Research, 44(5), 815–848.
Cohen, L., Malloy, C., & Pomorski, L. (2012). Decoding inside information. Journal of
Finance, 67(3), 1009-1043.
Cooper, M. J., Gulen, H., & Schill, M. J. (2008). Asset Growth and the Cross-Section of Stock
Returns. Journal of Finance, 63(4), 1609-1651.
Cyert, R. M., & March, J. G. (1963). A Behavioral Theory of the Firm. Englewood Cliffs, NJ, 2.
Dong, D., Hirshleifer, D., Richardson, S., & Teoh, S. H. (2006). Does Investor Misvaluation
Drive the Takeover Market? Journal of Finance, 61(2), 725-762.

27
Erel, I. Julio, Kim, W., & Weisbach, M. (2012). Macroeconomic Conditions and Capital Raising,
Review of Financial Studies, 25(2), 341-376.
Fama, E. F., & French, K. R. (1988). Dividend Yields and Expected Stock Returns. Journal of
Financial Economics, 22(1), 3-25.
Galasso, A., & Simcoe, T. S. (2011). CEO Overconfidence and Innovation. Management
Science, 57(8), 1469-1484.
Goel, A. M., & Thakor, A. V. (2008). Overconfidence, CEO Selection, and Corporate
Governance. Journal of Finance, 63(6), 2737-2784.
Graham, John R., and Campbell R. Harvey. "The equity risk premium in January 2007: Evidence
from the global CFO outlook survey." Available at SSRN 959703 (2007).
Hackbarth, D. (2008). Managerial Traits and Capital Structure Decisions. Journal of Financial
and Quantitative Analysis, 43(4), 843-881.
Hambrick, D. C., & Mason, P. A. (1984). Upper Echelons: The Organization as a Reflection of
its Top Managers. Academy of Management Review, 9(2), 193-206.
Hayward, M. L., & Hambrick, D. C. (1997). Explaining the Premiums Paid for Large
Acquisitions: Evidence of CEO Hubris. Administrative Science Quarterly, 42(1), 103-127.
Hirshleifer, D., Low, A., & Teoh, S. H. (2012). Are Overconfident CEOs Better Innovators?
Journal of Finance, 67(4), 1457-1498.
Hovakimian, A., Opler, T., and Titman, S. (2001). The Debt‐Equity Choice. Journal of Financial
and Quantitative Analysis, 36(1), 1‐24.
Jung, K., Kim, Y., & Stulz, R. (1996). Timing, Investment Opportunities, Managerial Discretion,
and the Security Issue Decision. Journal of Financial Economics, 42(2), 159‐185.
Jensen, M. C. (1986). Agency Costs of Free Cash Flow, Corporate Finance, and Takeovers. The
American Economic Review, 76(2), 323-329.
Jenter, D., (2005). Market Timing and Managerial Portfolio Decisions. Journal of Finance,
60(4): 1903-1949.
Lemmon, M., & Portniaguina, E. (2006). Consumer Confidence and Asset Prices: Some
Empirical Evidence. Review of Financial Studies, 19(4), 1499-1529.
Lettau, M., & Ludvigson, S. (2001). Resurrecting the (C)CAPM: A Cross-Sectional Test when
Risk Premia are Time-Varying. Journal of Political Economy, 109(6), 1238-1287.
28
Ludvigson, S. (2004). Consumer Confidence and Consumer Spending. Journal of Economic
Perspectives, 18(2), 29-50.
Malmendier, U., & Tate, G. (2005). CEO Overconfidence and Corporate Investment. Journal of
Finance, 60(6), 2661-2700.
Malmendier, U., & Tate, G. (2005). Does Overconfidence Affect Corporate Investment? CEO
Overconfidence Measures Revisited. European Financial Management,11(5), 649-659.
Malmendier, U., & Tate, G. (2008). Who Makes Acquisitions? CEO Overconfidence and the
Market's Reaction. Journal of Financial Economics, 89(1), 20-43.
Malmendier, U., Tate, G., & Yan, J. (2011). Overconfidence and Early-Life Experiences: The
Effect of Managerial Traits on Corporate Financial Policies. Journal of Finance, 66(5), 1687-
1733.
McKeon, S. (2013). Firm-Initiated versus Investor-Initiated Equity Issues. Working Paper.
Nelson, R., & Winter, S. (1982). An Evolutionary Theory of Economic Change. Harvard
Business Press.
Rhodes-Kropf, M., Robinson, D., & Viswanathan, S. (2005). Valuation Wave and Merger
Activity: The Empirical Evidence. Journal of Financial Economics, 77(3), 561-603
Polk, C., & Sapienza, P. (2008). The Stock Market and Corporate Investment: A Test of Catering
Theory. Review of Financial Studies, 22(1), 187-217.
Qiu, L., & Welch, I. (2006). Investor Sentiment Measures. Working Paper.
Roll, R. (1986). The Hubris Hypothesis of Corporate Takeovers. Journal of Business, 59(2),
197-216.
Schwenk, C. R. (1988). The Cognitive Perspective on Strategic Decision Making. Journal of
Management Studies, 25(1), 41-55.
Simon, M., & Houghton, S. M. (2003). The Relationship between Overconfidence and the
Introduction of Risky Products: Evidence from a Field Study. Academy of Management
Journal, 46(2), 139-149.
Stambaugh, R. F., Yu, J., & Yuan, Y. (2012). The Short of It: Investor Sentiment and Anomalies.
Journal of Financial Economics, 104(2), 288-302.
Titman, S., Wei, K. C., & Xie, F. (2004). Capital Investments and Stock Returns. Journal of
Financial and Quantitative Analysis, 39(4), 677-700.

29
Tversky, A., & Kahneman, D. (1974). Judgment under Uncertainty: Heuristics and
Biases. Science, 185(4157), 1124-1131.

30
Figure 1
CEO and Consumer Confidence
The figure plots quarterly standardized values of our aggregate CEO and Consumer Confidence Indices. The survey
data is obtained from The Conference Board and covers the period 1976-2012. NBER recession periods are
designated by gray bars. The sample period covers 1976-2012.
-3
-2
-1
0
1
2
3
197
6
197
8
198
0
198
2
198
4
198
6
198
8
199
0
199
2
199
4
199
6
199
8
200
0
200
2
200
4
200
6
200
8
201
0
201
2
Consumer CEO

31
Table 1
Descriptive Statistics
This table reports descriptive statistics of the CEO and Consumer Confidence Indices and various macroeconomic variables. The confidence indices are
aggregated from quarterly surveys conducted by The Conference Board. The sample begins in 1976 and ends in 2012 (144 observations). Macroeconomic
variables are observed quarterly and seasonally adjusted (where appropriate). They include: dividend yield, measured as the total cash ordinary dividend of the
CRSP value-weighted index over the last four quarters and divided by the value of the index at the end of the current quarter (as in Fama & French, 1988);
default spread, measured as the difference between the yields to maturity on Moody’s Baa-rated and Aaa-rated bonds; the yield on three-month Treasury bills;
GDP growth, measured as 100 times the quarterly change in the natural logarithm of chained GDP (in 2005 dollars); consumption growth, measured as 100 times
the quarterly change in the natural logarithm of personal consumption expenditures; labor income growth, measured as 100 times the quarterly change in the
natural logarithm of labor income, computed as total personal income minus dividend income per capita and deflated by the PCE deflator; the unemployment
rate; the inflation rate from CRSP cumulated over the most recent three months; the consumption-to-wealth ratio from Lettau & Ludvigson (2001); and corporate
profitability, measured as corporate profits after tax (without Inventory Valuation Adjustment and without Capital Consumption Adjustment).Value-weighted
and equal-weighted stock market returns are from CRSP. Statistical significance at the 10%, 5%, and 1% levels are denoted by *, **, and ***.
Sample Statistics
Contemporaneous Correlations
Mean
Standard
Deviation Quartile 1 Median Quartile 3
CEO
Confidence
Consumer
Confidence
(CEO –
Consumer)
CEO Confidence 53.69 10.26 47.00 54.00 61.00
0.018
Consumer Confidence 92.36 24.47 77.30 96.25 107.05 0.018
Dividend Yield 1.32 0.39 1.04 1.34 1.65 -0.031 -0.448 0.405***
Default Spread 1.12 0.47 0.79 0.96 1.32 -0.214 -0.525 0.408***
Treasury Yield (3 month) 1.40 0.94 0.79 1.34 1.93 -0.132 0.174 -0.213**
GDP Growth 1.49 0.94 1.03 1.41 1.89 0.339 0.241 -0.092
Consumption Growth 1.57 0.83 1.11 1.50 2.02 0.227 0.249 -0.143*
Labor Income Growth 0.42 0.67 0.09 0.44 0.81 0.285 0.427 -0.285***
Unemployment Rate 6.46 1.61 5.30 6.03 7.42 0.363 -0.732 0.824***
Inflation Rate 0.97 0.99 0.47 0.87 1.47 0.003 0.022 -0.02
Consumption-to-Wealth 0.08 1.81 -1.05 0.04 1.58 -0.025 0.074 -0.08
Corporate Profits 1.91 5.93 -0.52 2.34 4.69 0.309 0.000 0.122
Equal-weighted Market Return 0.17 0.25 0.01 0.17 0.28 0.017 -0.276 0.266***

32
Table 2
Determinants of CEO and Consumer Confidence
This table reports coefficient estimates from time-series regressions of standardized CEO and Consumer Confidence Indices on lagged macroeconomic variables.
Macroeconomic variables are observed quarterly and seasonally adjusted (where appropriate). The confidence indices are aggregated from quarterly surveys
conducted by The Conference Board. The sample begins in 1976 and ends in 2012 (144 observations). We do not report the intercept. T-statistics are reported in
parentheses and are based on Newey-West standard errors with four lags.
CEO Confidence
Consumer Confidence
Single Regression Multiple Regression
Single Regression Multiple Regression
Coefficient Adj. R-squared Coefficient Adj. R-squared
Coefficient Adj. R-squared Coefficient Adj. R-squared
Dividend Yield 0.037
(0.10)
-0.007 -1.264
(-3.77)
0.599
-1.127 (-3.31)
0.184 -0.828
(-2.48)
0.695
Default Spread -0.103
(-0.34)
-0.005 -0.022
(-0.13)
-1.140
(-6.02)
0.288 -0.358
(-1.77)
Treasury Yield (3 month) -0.142
(-1.01)
0.011 0.131
(1.15)
0.147
(0.72)
0.012 0.410
(3.79)
GDP Growth 0.384
(2.57)
0.126 0.295
(3.31)
0.346
(2.61)
0.101 0.255
(2.54)
Consumption Growth 0.348
(1.94)
0.077 0.106
(0.80)
0.382
(2.55)
0.093 0.065
(0.69)
Labor Income Growth 0.298
(1.98)
0.033 0.101
(1.15)
0.663
(4.95)
0.188 0.222
(3.25)
Unemployment Rate 0.290
(4.67)
0.211 0.432
(6.26)
-0.408
(-5.28)
0.421 -0.261
(-4.08)
Inflation Rate -0.170
(-1.01)
0.021 -0.195
(-2.68)
0.000
(0.00)
-0.007 -0.145
(-2.25)
Consumption-to-Wealth 0.023
(0.36)
-0.005 0.077
(1.76)
0.055
(0.70)
0.003 -0.007
(-0.18)
Corporate Profits 0.051
(3.56)
0.085 0.040
(4.89)
0.003
(0.17)
-0.007 0.019
(1.90)
Equal-weighted Market
Return
3.636
(4.99)
0.173 1.652
(3.59)
0.493
(0.64)
-0.004 0.272
(0.69)

33
Table 3
CEO and Consumer Confidence and Future Capital Expenditure [%]
This table reports coefficient estimates from system GMM regressions of annual scaled capital expenditure on
lagged measures of CEO and consumer confidence. The dependent variable is the aggregate dollar amount of capital
expenditures (by firm i during fiscal year t) divided by the book value of total assetsi,t-1 [%]. The independent
variables include the most recent standardized CEO and Consumer Confidence Indices prior to the beginning of
firm i’s fiscal year, as well as the lagged dependent variable, Firm Size (market value of equity) measured at the
beginning of the fiscal year, and Tobin’s Qi,t-1. We do not report the intercept. T-statistics are reported in
parentheses. Standard errors are clustered by year and robust to heteroskedasticity and arbitrary forms of
autocorrelation.
(1) (2) (3)
CEO Confidence 0.373***
(4.51)
0.381***
(4.69)
Consumer Confidence
0.163*
(1.98)
0.182***
(2.97)
Lagged Capital Expenditure 0.429***
(19.68)
0.426***
(17.17)
0.427***
(19.96)
Firm Size -33.00***
(-4.93)
-40.54***
(-5.34)
-32.24***
(-4.55)
Tobin’s Q 0.617***
(18.99)
0.623***
(18.81)
0.611***
(18.19)
Firm Fixed Effects? Yes Yes Yes
Clusters 36 36 36
Observations 93,289 93,289 93,289

34
Table 4
CEO and Consumer Confidence and Future M&A Activity [%]
This table reports coefficient estimates from system GMM regressions of annual M&A expenditure on lagged
measures of CEO and consumer confidence. The dependent variable is the aggregate dollar amount spent on
mergers and acquisitions (by firm i during fiscal year t) divided by the book value of total assetsi,t-1 [%]. If firm i
does not conduct any M&A activity in a given fiscal year, the variable is set equal to zero. The independent
variables include the most recent standardized CEO and Consumer Confidence Indices prior to the beginning of firm
i’s fiscal year, as well as the lagged dependent variable, Firm Size (market value of equity) measured at the
beginning of the fiscal year, and Tobin’s Qi,t-1. We do not report the intercept. T-statistics are reported in
parentheses. Standard errors are clustered by year and robust to heteroskedasticity and arbitrary forms of
autocorrelation.
(1) (2) (3)
CEO Confidence 0.177*
(1.74)
0.209**
(2.07)
Consumer Confidence
0.673***
(5.15)
0.685***
(5.29)
Lagged M&A Activity 0.0964***
(11.14)
0.0941***
(10.97)
0.0940***
(10.98)
Firm Size -96.77***
(-6.37)
-98.60***
(-6.47)
-95.38***
(-6.23)
Tobin’s Q 1.825***
(17.08)
1.794***
(17.46)
1.785***
(17.34)
Firm Fixed Effects? Yes Yes Yes
Clusters 36 36 36
Observations 59,209 59,209 59,209

35
Table 5
CEO and Consumer confidence and Future Net Financing Activity [%]
This table reports coefficient estimates from system GMM regressions of an annual net financing activity measure
on lagged measures of CEO and consumer confidence. The dependent variable is the aggregate dollar amount raised
through both external equity and debt issuance (by firm i during fiscal year t) divided by the book value of total
assetsi,t-1 [%].The independent variables include the most recent standardized CEO and Consumer Confidence
Indices prior to the beginning of firm i’s fiscal year, as well as the lagged dependent variable, Firm Size (market
value of equity) measured at the beginning of the fiscal year, and Tobin’s Qi,t-1. We do not report the intercept. T-
statistics are reported in parentheses. Standard errors are clustered by year and robust to heteroskedasticity and
arbitrary forms of autocorrelation.
(1) (2) (3)
CEO Confidence
0.290**
(2.22)
0.309**
(2.45)
Consumer Confidence
0.503***
(3.42)
0.517***
(3.63)
Lagged Net Financing Activity 0.0502***
(5.03)
0.0492***
(4.72)
0.0489***
(4.76)
Firm Size -318.4***
(-9.82)
-323.9***
(-10.31)
-317.0***
(-9.68)
Tobin’s Q 4.595***
(23.40)
4.586***
(22.84)
4.576***
(23.03)
Firm Fixed Effects? Yes Yes Yes
Clusters 36 36 36
Observations 86,519 86,519 86,519

36
Table 6
CEO and Consumer Confidence and Future Return-on-Assets [%]
This table reports coefficient estimates from system GMM regressions of future ROA on lagged measures of CEO
and consumer confidence. The dependent variable is the return-on-assets of firm i during fiscal year t+1 [%].The
independent variables include the most recent standardized CEO and Consumer Confidence Indices prior to the
beginning of firm i’s fiscal year, as well as the lagged dependent variable, Firm Size (market value of equity)
measured at the beginning of the fiscal year, and Tobin’s Qi,t-1. We do not report the intercept. T-statistics are
reported in parentheses. Standard errors are clustered by year and robust to heteroskedasticity and arbitrary forms of
autocorrelation.
(1)
(2) (3)
CEO Confidence 0.678***
(6.75)
0.661***
(6.93)
Consumer Confidence
-0.433***
(-5.55)
-0.399***
(-6.37)
Lagged Return On Assets 0.627***
(31.69)
0.630***
(30.19)
0.627***
(31.47)
Firm Size 164.6***
(10.03)
146.9***
(7.70)
162.5***
(9.83)
Tobin’s Q 0.382***
(5.61)
0.420***
(6.05)
0.398***
(5.89)
Firm Fixed Effects? Yes Yes Yes
Clusters 36 36 36
Observations 93,289 93,289 93,289

37
Table 7
CEO and Consumer Confidence and Future Sales Growth [%]
This table reports coefficient estimates from system GMM regressions of future one-year sales growth on lagged
measures of CEO and consumer confidence. The dependent variable is the percentage change in sales growth of
firm i from the end of fiscal year t to the end of fiscal year t+1. The independent variables include the most recent
standardized CEO and Consumer Confidence Indices prior to the beginning of firm i’s fiscal year, as well as the
lagged dependent variable, Firm Size (market value of equity) measured at the beginning of the fiscal year, and
Tobin’s Qi,t-1. We do not report the intercept. T-statistics are reported in parentheses. Standard errors are clustered by
year and robust to heteroskedasticity and arbitrary patterns of autocorrelation.
(1) (2) (3)
CEO Confidence 0.693
(0.98)
0.758
(1.27)
Consumer Confidence
-2.252***
(-4.17)
-2.271***
(-3.98)
Lagged Sales Growth 0.112***
(8.59)
0.117***
(10.05)
0.113***
(9.34)
Firm Size -421.8***
(-7.37)
-435.1***
(-7.27)
-415.2***
(-8.02)
Tobin’s Q 2.563***
(10.09)
2.646***
(11.12)
2.641***
(11.02)
Firm Fixed Effects? Yes Yes Yes
Clusters 36 36 36
Observations 70,277 70,277 70,277
38
Table 8
CEO and Consumer Confidence and Future Earnings Surprises and Forecast Revisions[%]
This table reports coefficient estimates from time-series regressions of future (equal-weighted) forecast revisions
and earnings surprises on lagged measures of CEO and consumer confidence. In Panel A, the dependent variable is
forecast revisions, calculated as median difference between analysts’ first EPS forecast of the fiscal year and the last,
scaled by price. In Panel B, the dependent variable is the equal-weighted earnings surprises, which is the difference
between actual annual earnings and median across all forecasts, also scaled by price. The independent variables
include the most recent standardized CEO and Consumer Confidence Indices prior to the beginning of firm i’s fiscal
year, as well as the lagged dependent variable and lagged stock market performance. We do not report the intercept.
T-statistics are reported in parentheses and are based on Newey-West standard errors with four lags.
(1)
(2) (3)
Panel A: Forecast Revisions
CEO Confidence 0.071
(0.43)
0.073
(0.48)
Consumer Confidence
-0.277***
(-2.78)
-0.278***
(-2.63)
Lagged Earnings Revisions 0.443***
(4.42)
0.434***
(3.67)
0.421***
(3.75)
Lagged Stock Returns 0.014***
(2.65)
0.011*
(1.86)
0.011*
(1.84)
R-squared 0.348 0.377 0.373
Observations 118 118 118
Panel B: Earnings Surprises
CEO Confidence 0.234
(0.62)
0.366
(0.95)
Consumer Confidence
-0.561**
(-2.45)
-0.544**
(-2.33)
Lagged Earnings Surprise 0.279**
(1.99)
0.183*
(1.69)
0.240*
(1.86)
Lagged Stock Returns 0.041***
(2.89)
0.033**
(2.17)
0.032**
(2.14)
R-squared 0.146 0.190 0.167
Observations 118 118 118

39
Table 9
CEO and Consumer Confidence and Future Insider Net Purchases
This table reports coefficient estimates from time-series regressions of standardized aggregate quarterly insider net
purchases on measures of CEO and consumer confidence, lagged by one quarter (Panel A) and lagged by four
quarters (Panel B). Aggregate quarterly insider net purchases is the logarithm of one plus the aggregate value of
shares purchased minus the aggregate value of shares sold by CEOs during calendar quarter t, divided by the total
market capitalization in period t-1 [%]. We remove routine transactions as described in Section 5. The independent
variables include the standardized lagged CEO and Consumer Confidence Indices, as well as lagged GDP Growth,
lagged Consumption Growth, lagged Labor Income Growth, lagged Consumption-to-Wealth ratio, and lagged stock
market performance. We do not report the intercept. T-statistics are reported in parentheses and are based on
Newey-West standard errors with four lags.
(1) (2) (3)
Panel A: One-Quarter lagged Confidence Measures
CEO Confidence 0.084
(0.58)
0.006
(0.05)
Consumer Confidence
-0.320***
(-4.33)
-0.320***
(-4.26)
GDP Growth -0.307
(-1.66)
-0.092
(-0.49)
-0.093
(-0.49)
Consumption Growth -0.400*
(-1.77)
-0.265
(-1.59)
-0.268
(-1.52)
Labor Income Growth -0.249
(-1.24)
-0.104
(-0.64)
-0.109
(-0.57)
Consumption-to-Wealth -0.022
(-0.31)
0.006
(0.09)
0.006
(0.09)
Lagged Stock Returns 0.142
(0.31)
-0.070
(-0.17)
-0.065
(-0.16)
R-squared 0.152 0.250 0.240
Observations 81 81 81
Panel B: Four-Quarter lagged Confidence Measures
CEO Confidence 0.309*
(1.91)
0.235*
(1.90)
Consumer Confidence
-0.270***
(-3.96)
-0.283***
(-3.64)
GDP Growth -0.401**
(-2.49)
-0.317*
(-1.78)
-0.287*
(-1.72)
Consumption Growth -0.340*
(-1.73)
-0.160
(-1.45)
-0.311*
(-1.86)
Labor Income Growth -0.313
(-1.31)
0.032
(0.21)
-0.227
(-1.01)
Consumption-to-Wealth -0.007
(-0.10)
0.011
(0.20)
0.010
(0.18)
Lagged Stock Returns -0.144
(-0.35)
-0.331
(-1.01)
-0.110
(-0.24)
R-squared 0.192 0.221 0.302
Observations 80 80 80
40
Table 10
CEO and Consumer Confidence and Future Firm-Outcome Variables: The Role of Macroeconomics Conditions
This table reports coefficient estimates from system GMM regressions of annual scaled capital expenditure, M&A expenditure, net financing activity, sales
growth, and return on assets on lagged CEO and consumer confidence measures, controlling for macroeconomic variables. The table also reports coefficient
estimates from time-series regressions of annual equally-weighted market returns and insider net purchases on lagged CEO and consumer confidence measures,
controlling for macroeconomic variables. The dependent variables correspond to the dependent variables in Tables 3 to 9. The independent variables also are as
in Tables 3 to 9, but, in addition, we now include macroeconomic variables, all of which are described in Section 2.3. Analyses tabulated in Columns 1 to 9
include one macroeconomic variable at a time. Analyses tabulated in Column 10 contain all macroeconomic variables. We do not report the intercept. T-statistics
are reported in parentheses. For the system GMM regressions, standard errors are clustered by year and robust to heteroskedasticity and arbitrary patterns of
autocorrelation. For the time-series regressions, standard errors are Newey-West standard errors with four lags.
Dividend
Yield
(1)
Default
Spread
(2)
Treasury
Yield
(3)
GDP
Growth
(4)
Consumpt.
Growth
(5)
Labor Inc.
Growth
(6)
Unemplm.
Rate
(7)
Inflation
Rate
(8)
Consumpt.-
to-Wealth
(9)
ALL
(10)
Capital Expenditure
CEO
Confidence
0.356***
(6.26)
0.382***
(3.94)
0.457***
(10.25)
0.193**
(2.43)
0.253***
(2.91)
0.314***
(4.06)
0.258***
(2.93)
0.313***
(3.69)
0.415***
(5.76)
0.104
(1.58)
Consumer
Confidence
0.425***
(5.04)
0.184**
(2.54)
0.106**
(2.27)
0.0756
(1.49)
0.0866*
(1.71)
0.0854
(1.31)
0.388***
(4.78)
0.137***
(2.89)
0.209***
(3.29)
0.112*
(1.93)
M&A Activity
CEO
Confidence
0.229**
(2.12)
0.0131
(0.11)
0.151
(1.65)
0.259**
(2.16)
0.280***
(2.74)
0.0968
(1.00)
0.455***
(4.21)
0.313***
(3.77)
0.242**
(2.41)
0.331**
(2.10)
Consumer
Confidence
0.382***
(3.26)
0.418***
(3.59)
0.753***
(6.25)
0.716***
(5.28)
0.745***
(5.44)
0.506***
(5.08)
0.241
(1.49)
0.758***
(5.98)
0.709***
(5.29)
-1.078
(-1.56)
Net Financing Activity
CEO
Confidence
0.310**
(2.50)
0.162
(0.97)
0.306**
(2.20)
0.390***
(3.05)
0.344***
(2.97)
0.197
(1.56)
0.436***
(2.94)
0.334**
(2.38)
0.355**
(2.63)
0.504**
(2.40)
Consumer
Confidence
0.496***
(4.21)
0.298**
(2.22)
0.519***
(3.33)
0.564***
(3.41)
0.545***
(3.28)
0.355**
(2.39)
0.303*
(1.78)
0.535***
(3.87)
0.550***
(3.89)
0.130
(0.71)

41
Table 10 continued.
Dividend
Yield
(1)
Default
Spread
(2)
Treasury
Yield
(3)
GDP
Growth
(4)
Consumpt.
Growth
(5)
Labor Inc.
Growth
(6)
Unemplm.
Rate
(7)
Inflation
Rate
(8)
Consumpt.-
to-Wealth
(9)
ALL
(10)
Sales Growth
CEO
Confidence
0.755
(1.27)
0.976
(1.67)
0.644
(1.11)
1.020*
(1.98)
1.010*
(1.89)
0.921
(1.31)
0.338
(0.51)
1.069**
(2.13)
0.866
(1.42)
0.313
(0.36)
Consumer
Confidence
-2.288***
(-4.21)
-1.893***
(-3.83)
-2.204***
(-4.14)
-2.163***
(-4.06)
-2.129***
(-4.18)
-2.063***
(-3.24)
-1.537**
(-2.66)
-2.026***
(-4.81)
-2.008***
(-3.68)
-0.485
(-1.29)
Return On Assets
CEO
Confidence
0.647***
(8.64)
0.692***
(7.20)
0.694***
(8.35)
0.407***
(4.49)
0.567***
(6.04)
0.666***
(7.40)
0.527***
(5.04)
0.620***
(6.05)
0.697***
(7.71)
0.227**
(2.10)
Consumer
Confidence
-0.181**
(-2.17)
-0.355***
(-4.65)
-0.430***
(-6.91)
-0.548***
(-8.63)
-0.474***
(-7.31)
-0.392***
(-5.86)
-0.172**
(-2.16)
-0.429***
(-6.15)
-0.374***
(-5.65)
-0.127
(-1.42)
Forecast Revisions
CEO
Confidence
0.081
(0.57)
0.091
(0.54)
0.052
(0.36)
0.024
(0.17)
0.056
(0.39)
0.078
(0.47)
0.060
(0.40)
0.080
(0.60)
0.058
(0.38)
0.091
(0.37)
Consumer
Confidence
-0.438***
(-3.71)
-0.280**
(-2.35)
-0.308***
(-3.36)
-0.353***
(-3.12)
-0.336***
(-3.18)
-0.305**
(-2.57)
-0.337**
(-2.12)
-0.334***
(-3.45)
-0.335***
(-3.29)
-0.183
(-0.44)
Earnings Surprises
CEO
Confidence
0.269
(0.73)
-0.037
(-0.07)
0.064
(0.15)
0.695
(1.60)
0.417
(0.90)
0.153
(0.35)
0.543
(1.55)
0.116
(0.25)
0.051
(0.11)
0.794
(1.06)
Consumer
Confidence
-1.609***
(-4.11)
-1.054***
(-3.13)
-0.694**
(-2.06)
-0.487*
(-1.86)
-0.631**
(-2.25)
-0.718**
(-2.42)
-1.595***
(-2.67)
-0.832***
(-2.81)
-0.849***
(-2.81)
-1.535*
(-1.71)
Insider Net Purchases
CEO
Confidence
0.118*
(1.71)
0.193*
(1.73)
0.082
(0.90)
0.170*
(1.91)
0.171*
(1.70)
0.171
(1.30)
0.086
(0.90)
0.078
(0.82)
0.079
(0.83)
0.181
(1.59)
Consumer
Confidence
0.114
(0.78)
-0.333***
(-3.72)
-0.441***
(-3.96)
-0.353***
(-3.78)
-0.317***
(-3.93)
-0.311***
(-4.40)
-0.307
(-1.48)
-0.385***
(-3.91)
-0.385***
(-3.97)
0.045
(0.24)