Embed Size (px)
Citation preview
fraserinstitute.org FRASER RESEARCH BULLETIN 1
F R A S E R RESEARCH BULLETIN
2018
Summary
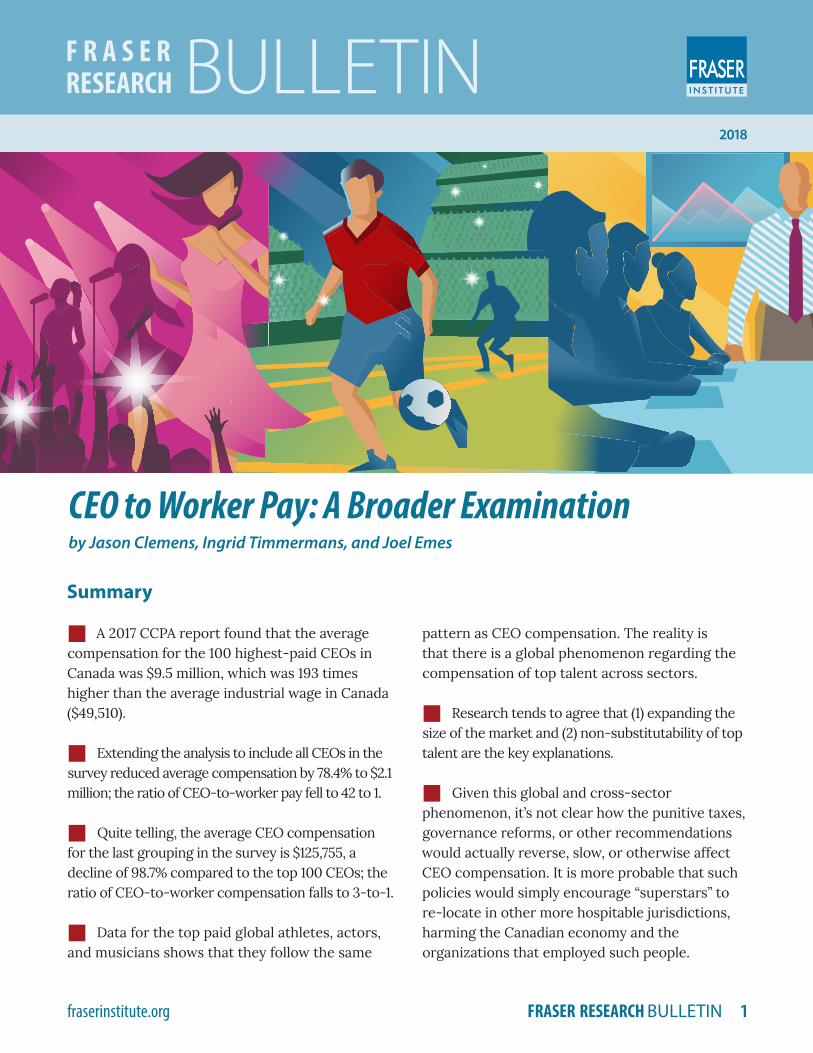
■■ A 2017 CCPA report found that the average compensation for the 100 highest-paid CEOs in Canada was $9.5 million, which was 193 times higher than the average industrial wage in Canada ($49,510).
■■ Extending the analysis to include all CEOs in the survey reduced average compensation by 78.4% to $2.1 million; the ratio of CEO-to-worker pay fell to 42 to 1.
■■ Quite telling, the average CEO compensation for the last grouping in the survey is $125,755, a decline of 98.7% compared to the top 100 CEOs; the ratio of CEO-to-worker compensation falls to 3-to-1.
■■ Data for the top paid global athletes, actors, and musicians shows that they follow the same
pattern as CEO compensation. The reality is that there is a global phenomenon regarding the compensation of top talent across sectors.
■■ Research tends to agree that (1) expanding the size of the market and (2) non-substitutability of top talent are the key explanations.
■■ Given this global and cross-sector phenomenon, it’s not clear how the punitive taxes, governance reforms, or other recommendations would actually reverse, slow, or otherwise affect CEO compensation. It is more probable that such policies would simply encourage “superstars” to re-locate in other more hospitable jurisdictions, harming the Canadian economy and the organizations that employed such people.
by Jason Clemens, Ingrid Timmermans, and Joel Emes
CEO to Worker Pay: A Broader Examination
CEO to Worker Pay: A Broader Examination
fraserinstitute.org FRASER RESEARCH BULLETIN 2
Introduction
The Canadian Centre for Policy Alternatives (CCPA) publishes an analysis at the beginning of each year comparing the compensation of the country’s top 100 CEOs with the wages of average workers. [1] The enormous gap between the two regularly garners significant media interest. The analysis suggests that this gap is restricted to CEOs and offers a num-ber of solutions including large tax increases, new regulations, and changes to corporate governance.
This Research Bulletin is intended to place the CCPA’s analysis in a broader framework and raise important questions about the compensation of society’s most successful people, not just in com-merce but in society more broadly. It begins with
a brief overview of the past CCPA work as well as the expectations for their 2018 analysis. The sec-tion then expands the CCPA’s analysis by examin-ing all the CEOs available in the database of the Globe and Mail (G&M). [2] This is done to better understand the extent to which the compensa-tion gap exists for all CEOs (or at least those in the G&M database) or whether it is restricted to only the very top CEOs. The second section of the essay provides a brief summary of the research on “superstar” compensation, the earnings of the very top talent across a wide range of sectors of the economy including not only commerce but also sports, culture, and entertainment. The Bulletin ends with a brief conclusion.
1. Summarizing and extending the CCPA’s analysis
The CCPA’s analysis relies on data provided by the Globe and Mail’s annual survey of the top 1,000 publicly traded companies in Canada. Compensation is broadly defined to include sal-ary, shares and options, pensions, other incentive plans, and other compensation such as director’s fees. The CCPA analysis compares the average worker’s compensation [3] to that of only the 100 top-paid CEOs in the G&M survey.
The CCPA’s 2017 report, which was based on 2015 data, found that the average pay for the 100 highest-paid CEOs was $9.5 million, 193 times higher than the average industrial wage in Canada ($49,510). The 2017 report also noted that this ratio had increased from 175 to 1 in 2008, the first year of data presented in the 2017 report, to its current ratio of 193 to 1. [4]
Based on 2016 data from the G&M survey and using the same methodology outlined in the CCPA
report, the expectation for their upcoming analy-sis is that the ratio of CEO-to-worker pay will in-crease slightly to 194 to 1: $9.6 million to $49,738. The report makes a number of recommendations including, for instance, removing compensa-tion from the discretion of the boards by making shareholder votes on pay mandatory and a host of tax changes.
It’s worth delineating the tax changes suggested since they would affect all Canadians, not just CEOs. The tax reforms recommended in the CCPA essay include changing the tax rules for stock options such that they would be taxed at twice their current rate, higher top marginal personal income-tax rates for all earners, altering (that is, increasing) taxes on grants of stock, increasing capital gains taxes such that they would be taxed as regular income, and the introduction of a new tax penalty based on a ratio of executive compen-sation to average pay.
CEO to Worker Pay: A Broader Examination
fraserinstitute.org FRASER RESEARCH BULLETIN 3
An interesting question, and one not directly an-swered by the CCPA analysis, is whether there is a general issue of the ratio of executive-to-worker pay or if this phenomenon is restricted to the upper echelons of executives, which the CCPA defines as the top 100 CEOs.
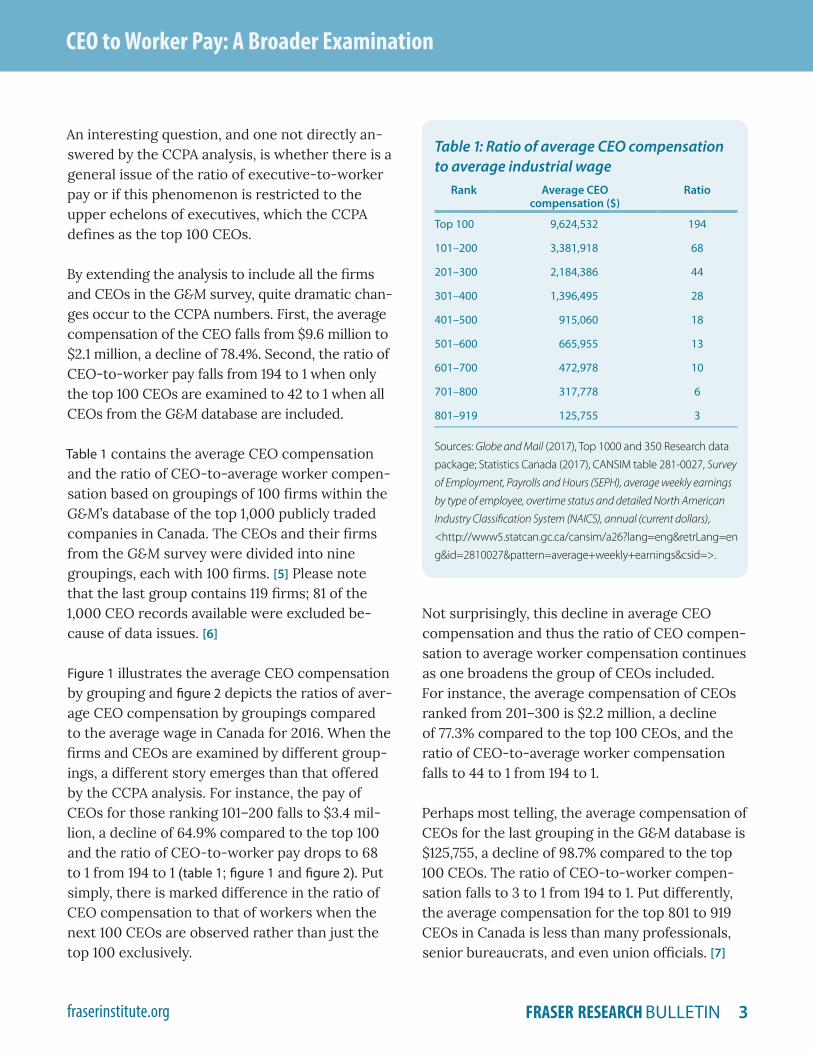
By extending the analysis to include all the firms and CEOs in the G&M survey, quite dramatic chan-ges occur to the CCPA numbers. First, the average compensation of the CEO falls from $9.6 million to $2.1 million, a decline of 78.4%. Second, the ratio of CEO-to-worker pay falls from 194 to 1 when only the top 100 CEOs are examined to 42 to 1 when all CEOs from the G&M database are included.
Table 1 contains the average CEO compensation and the ratio of CEO-to-average worker compen-sation based on groupings of 100 firms within the G&M’s database of the top 1,000 publicly traded companies in Canada. The CEOs and their firms from the G&M survey were divided into nine groupings, each with 100 firms. [5] Please note that the last group contains 119 firms; 81 of the 1,000 CEO records available were excluded be-cause of data issues. [6]
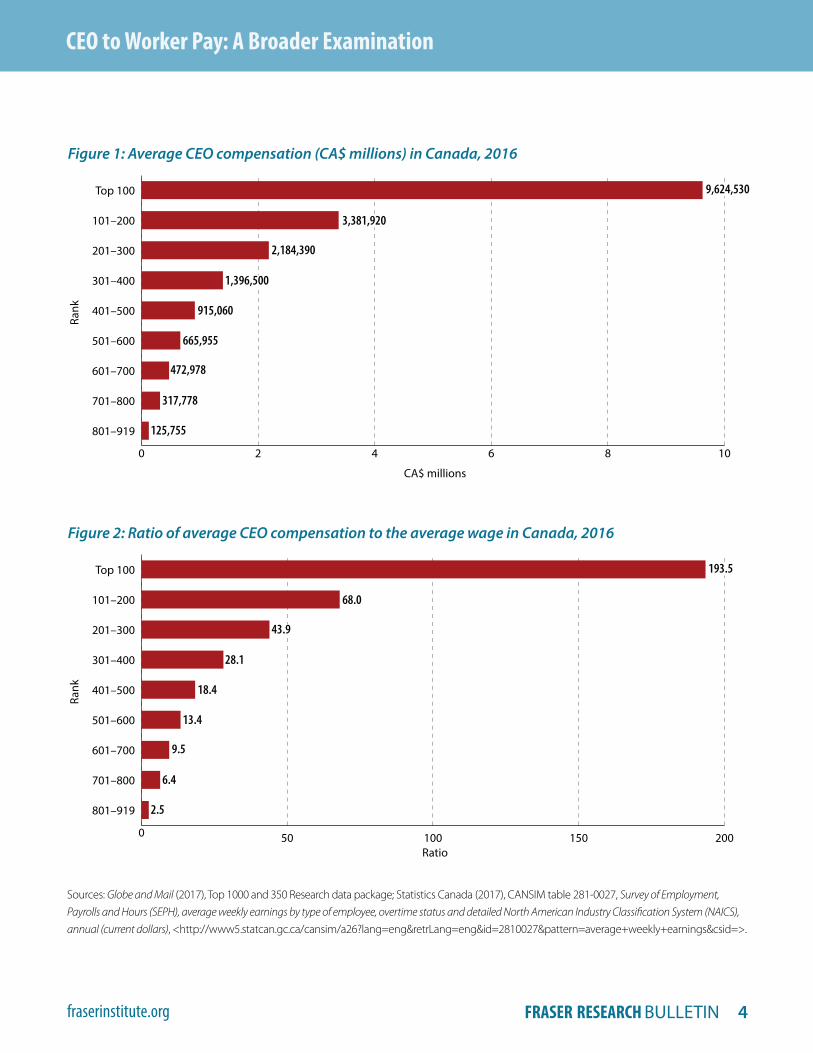
Figure 1 illustrates the average CEO compensation by grouping and figure 2 depicts the ratios of aver-age CEO compensation by groupings compared to the average wage in Canada for 2016. When the firms and CEOs are examined by different group-ings, a different story emerges than that offered by the CCPA analysis. For instance, the pay of CEOs for those ranking 101–200 falls to $3.4 mil-lion, a decline of 64.9% compared to the top 100 and the ratio of CEO-to-worker pay drops to 68 to 1 from 194 to 1 (table 1; figure 1 and figure 2). Put simply, there is marked difference in the ratio of CEO compensation to that of workers when the next 100 CEOs are observed rather than just the top 100 exclusively.
Not surprisingly, this decline in average CEO compensation and thus the ratio of CEO compen-sation to average worker compensation continues as one broadens the group of CEOs included. For instance, the average compensation of CEOs ranked from 201–300 is $2.2 million, a decline of 77.3% compared to the top 100 CEOs, and the ratio of CEO-to-average worker compensation falls to 44 to 1 from 194 to 1.
Perhaps most telling, the average compensation of CEOs for the last grouping in the G&M database is $125,755, a decline of 98.7% compared to the top 100 CEOs. The ratio of CEO-to-worker compen-sation falls to 3 to 1 from 194 to 1. Put differently, the average compensation for the top 801 to 919 CEOs in Canada is less than many professionals, senior bureaucrats, and even union officials. [7]
Table 1: Ratio of average CEO compensation to average industrial wage
Rank Average CEO compensation ($)
Ratio
Top 100 9,624,532 194
101–200 3,381,918 68
201–300 2,184,386 44
301–400 1,396,495 28
401–500 915,060 18
501–600 665,955 13
601–700 472,978 10
701–800 317,778 6
801–919 125,755 3
Sources: Globe and Mail (2017), Top 1000 and 350 Research data
package; Statistics Canada (2017), CANSIM table 281-0027, Survey
of Employment, Payrolls and Hours (SEPH), average weekly earnings
by type of employee, overtime status and detailed North American
Industry Classification System (NAICS), annual (current dollars),
<http://www5.statcan.gc.ca/cansim/a26?lang=eng&retrLang=en
g&id=2810027&pattern=average+weekly+earnings&csid=>.
CEO to Worker Pay: A Broader Examination
fraserinstitute.org FRASER RESEARCH BULLETIN 4
0 2 4 6 8 10
801–919
701–800
601–700
501–600
401–500
301–400
201–300
101–200
Top 100
Figure 1: Average CEO compensation (CA$ millions) in Canada, 2016
Rank
9,624,530
3,381,920
2,184,390
1,396,500
915,060
665,955
472,978
317,778
125,755
CA$ millions
Sources: Globe and Mail (2017), Top 1000 and 350 Research data package; Statistics Canada (2017), CANSIM table 281-0027, Survey of Employment, Payrolls and Hours (SEPH), average weekly earnings by type of employee, overtime status and detailed North American Industry Classification System (NAICS), annual (current dollars), <http://www5.statcan.gc.ca/cansim/a26?lang=eng&retrLang=eng&id=2810027&pattern=average+weekly+earnings&csid=>.
0 50 100 150 200
801–919
701–800
601–700
501–600
401–500
301–400
201–300
101–200
Top 100
Figure 2: Ratio of average CEO compensation to the average wage in Canada, 2016
Rank
193.5
68.0
43.9
28.1
18.4
13.4
9.5
6.4
2.5
Ratio
CEO to Worker Pay: A Broader Examination
fraserinstitute.org FRASER RESEARCH BULLETIN 5
The expanded data for CEO compensation pre-sented in table 1 indicates two important findings. First, as the CCPA essay concluded, there is a large gap between CEO compensation and aver-age workers for the very top echelon of CEOs. But second, this gap quickly declines as a broader
group of CEOs are examined. The emphasis on the compensation gap for the very top talent is import-ant because there is a body of research examin-ing the compensation of what have been termed
“superstars”, which is not included in the CCPA an-alysis. This research is examined in the next section.
2. The economics of “superstars”
For whatever reason, the CCPA work ignores the large and growing body of research on the compensation of “superstars”. Economist Sherwin Rosen’s seminal piece in the American Economic Review [8] in 1981 started a long line of research [9] focused on trying to understand the observation that is at the heart of the CCPA analysis: high com-pensation for the very top of the business world.
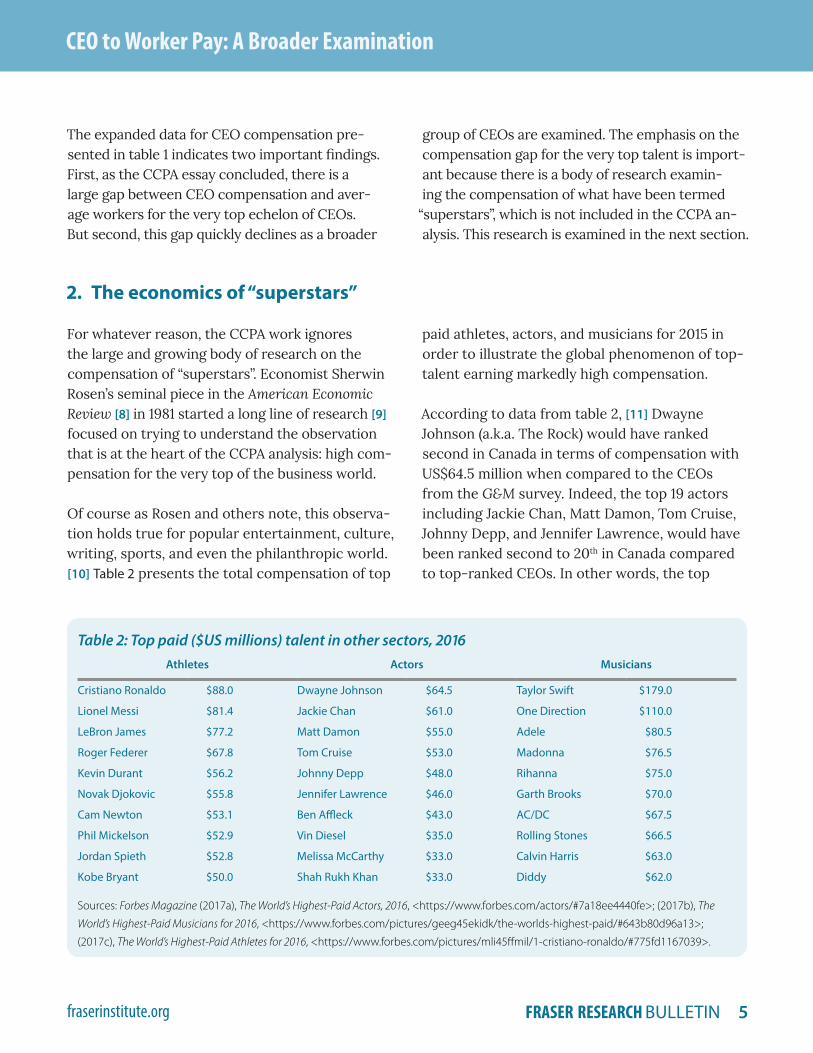
Of course as Rosen and others note, this observa-tion holds true for popular entertainment, culture, writing, sports, and even the philanthropic world. [10] Table 2 presents the total compensation of top
paid athletes, actors, and musicians for 2015 in order to illustrate the global phenomenon of top-talent earning markedly high compensation.
According to data from table 2, [11] Dwayne Johnson (a.k.a. The Rock) would have ranked second in Canada in terms of compensation with US$64.5 million when compared to the CEOs from the G&M survey. Indeed, the top 19 actors including Jackie Chan, Matt Damon, Tom Cruise, Johnny Depp, and Jennifer Lawrence, would have been ranked second to 20th in Canada compared to top-ranked CEOs. In other words, the top
Table 2: Top paid ($US millions) talent in other sectors, 2016Athletes Actors Musicians
Cristiano Ronaldo $88.0 Dwayne Johnson $64.5 Taylor Swift $179.0
Lionel Messi $81.4 Jackie Chan $61.0 One Direction $110.0
LeBron James $77.2 Matt Damon $55.0 Adele $80.5
Roger Federer $67.8 Tom Cruise $53.0 Madonna $76.5
Kevin Durant $56.2 Johnny Depp $48.0 Rihanna $75.0
Novak Djokovic $55.8 Jennifer Lawrence $46.0 Garth Brooks $70.0
Cam Newton $53.1 Ben Affleck $43.0 AC/DC $67.5
Phil Mickelson $52.9 Vin Diesel $35.0 Rolling Stones $66.5
Jordan Spieth $52.8 Melissa McCarthy $33.0 Calvin Harris $63.0
Kobe Bryant $50.0 Shah Rukh Khan $33.0 Diddy $62.0
Sources: Forbes Magazine (2017a), The World’s Highest-Paid Actors, 2016, <https://www.forbes.com/actors/#7a18ee4440fe>; (2017b), The
World’s Highest-Paid Musicians for 2016, <https://www.forbes.com/pictures/geeg45ekidk/the-worlds-highest-paid/#643b80d96a13>;
(2017c), The World’s Highest-Paid Athletes for 2016, <https://www.forbes.com/pictures/mli45ffmil/1-cristiano-ronaldo/#775fd1167039>.
CEO to Worker Pay: A Broader Examination
fraserinstitute.org FRASER RESEARCH BULLETIN 6
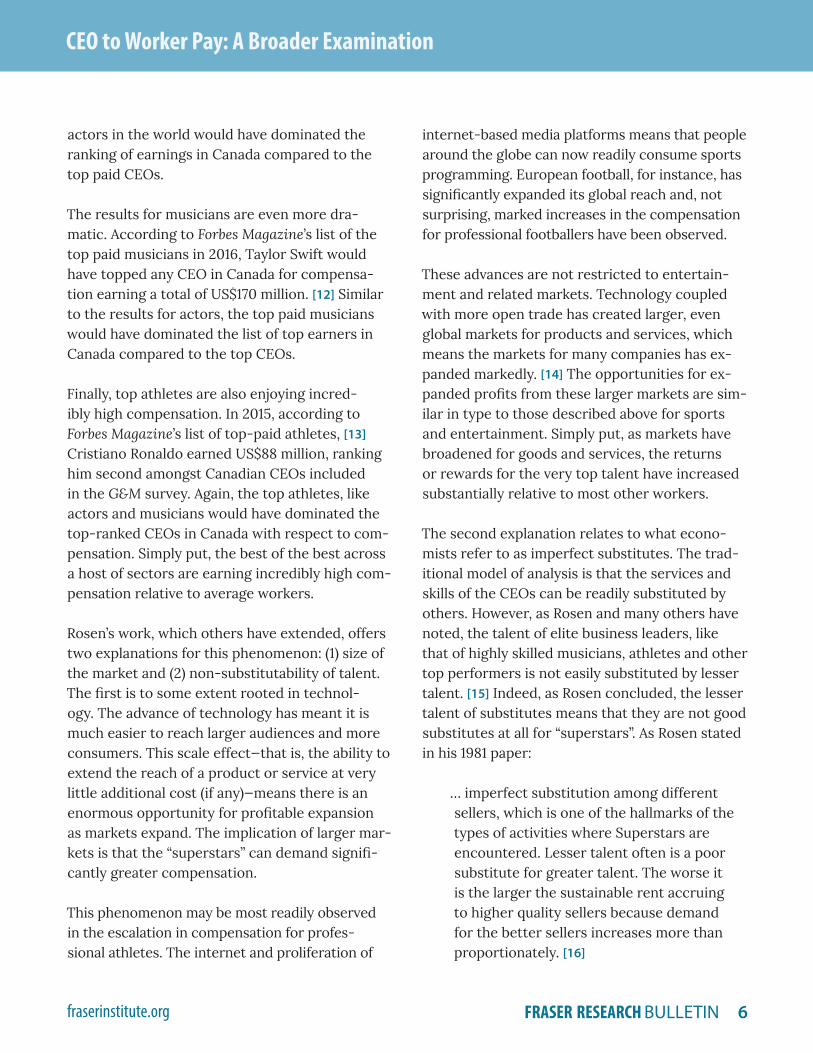
actors in the world would have dominated the ranking of earnings in Canada compared to the top paid CEOs.
The results for musicians are even more dra-matic. According to Forbes Magazine’s list of the top paid musicians in 2016, Taylor Swift would have topped any CEO in Canada for compensa-tion earning a total of US$170 million. [12] Similar to the results for actors, the top paid musicians would have dominated the list of top earners in Canada compared to the top CEOs.
Finally, top athletes are also enjoying incred-ibly high compensation. In 2015, according to Forbes Magazine’s list of top-paid athletes, [13] Cristiano Ronaldo earned US$88 million, ranking him second amongst Canadian CEOs included in the G&M survey. Again, the top athletes, like actors and musicians would have dominated the top-ranked CEOs in Canada with respect to com-pensation. Simply put, the best of the best across a host of sectors are earning incredibly high com-pensation relative to average workers.
Rosen’s work, which others have extended, offers two explanations for this phenomenon: (1) size of the market and (2) non-substitutability of talent. The first is to some extent rooted in technol-ogy. The advance of technology has meant it is much easier to reach larger audiences and more consumers. This scale effect—that is, the ability to extend the reach of a product or service at very little additional cost (if any)—means there is an enormous opportunity for profitable expansion as markets expand. The implication of larger mar-kets is that the “superstars” can demand signifi-cantly greater compensation.
This phenomenon may be most readily observed in the escalation in compensation for profes-sional athletes. The internet and proliferation of
internet-based media platforms means that people around the globe can now readily consume sports programming. European football, for instance, has significantly expanded its global reach and, not surprising, marked increases in the compensation for professional footballers have been observed.
These advances are not restricted to entertain-ment and related markets. Technology coupled with more open trade has created larger, even global markets for products and services, which means the markets for many companies has ex-panded markedly. [14] The opportunities for ex-panded profits from these larger markets are sim-ilar in type to those described above for sports and entertainment. Simply put, as markets have broadened for goods and services, the returns or rewards for the very top talent have increased substantially relative to most other workers.
The second explanation relates to what econo-mists refer to as imperfect substitutes. The trad-itional model of analysis is that the services and skills of the CEOs can be readily substituted by others. However, as Rosen and many others have noted, the talent of elite business leaders, like that of highly skilled musicians, athletes and other top performers is not easily substituted by lesser talent. [15] Indeed, as Rosen concluded, the lesser talent of substitutes means that they are not good substitutes at all for “superstars”. As Rosen stated in his 1981 paper:
… imperfect substitution among different sellers, which is one of the hallmarks of the types of activities where Superstars are encountered. Lesser talent often is a poor substitute for greater talent. The worse it is the larger the sustainable rent accruing to higher quality sellers because demand for the better sellers increases more than proportionately. [16]
CEO to Worker Pay: A Broader Examination
fraserinstitute.org FRASER RESEARCH BULLETIN 7
The wonderful example Rosen used to illus-trate this concept is a surgeon who is 10% more effective in saving lives than his peer group. People are willing to pay much more than a 10% premium to secure the doctor’s services. This
talent-driven effect combined with much larger markets through technological advances seems to explain much of the marked increases in the compensation of the “superstars” across a host of industries. [17]
Conclusion
While the CCPA analysis focuses on the com-pensation of the top 100 CEOs, the phenomenon of top talent receiving large compensation rela-tive to average workers exists across sectors of the economy including the arts, entertainment, culture, sports, and commerce. The reality, as shown by the work of Rosen and many others is that there is a global phenomenon under-way that is seeing larger compensation for the “superstars” across many sectors of society. Given these underlying trends that explain the rise of elite compensation, it is not entirely clear how the punitive taxes, governance reforms, or
other recommendations offered in the CCPA’s analysis would actually reverse, slow, or other-wise affect CEO compensation. Indeed, it is more probable that such policies would simply encourage “superstars” to relocate to other more hospitable jurisdictions. It is not clear how such migration of talent would ultimately bene-fit the Canadian economy, society more broadly, or the organizations where such people exer-cised their abilities. Put differently, the CCPA analysis offers a solution to an issue that is much broader and more complicated than their analysis suggests.
Notes
1 Hugh Mackenzie (2017), Throwing Money at the Problem: 10 Years of Executive Compensation. Canadian Centre for Policy Alternatives. <https://www.policyalternatives.ca/sites/default/files/uploads/publications/National%20Office/2017/01/Throwing_Money_at_the_Problem_CEO_Pay.pdf>.
2 Globe and Mail (2017), Top 1000 and 350 Research data package, from 2017 Top 1000 Canadian com-panies CEO compensation, <https://datastore.theglobeandmail.com/collections/top-1000-and-350-research-and-sales-prospecting-packages/products/2017-top-1000-and-350-research-package>.
3 Average worker compensation is defined as average weekly earnings (including or excluding over-time) for all employees. Weekly payrolls are defined as the portion of gross monthly payrolls that reflect work performed during the reference week. It represents the gross dollar value before de-ductions for income taxes, employment insurance contributions, and so on, including regular pay, overtime, and a portion of bonuses, commissions, and other type of special payments. The payroll concept excludes dollar amounts that are taxable allowances and benefits, certain types of non-wage compensation as well as employer contributions to employment insurance, Canada/Quebec pension plans, provincial medical plans, workers compensation and other welfare plans. Some an-nual special payments are excluded while other lump-sum special payments are adjusted to co-incide with the reference week period.
4 It’s worth noting, however, that the results for the top 100 CEOs are influenced by the highest com-pensated CEO in Canada, Michael Pearson of Valeant Pharmaceuticals International, who in 2015 recorded compensation of $182.9 million, of which $179.4 million was in the form of shares. This was substantially above the second-ranked CEO, Donald Walker of Magna International, who received $26.5 million in total compensation in 2015.
5 There were a number of companies (109) that reported multiple CEOs in 2016. In these cases, the compensation of the CEOs was averaged over the entire year.
6 Specifically, a company was left out of the analysis if it had no or incomplete compensation infor-mation, excluded compensation securities, had no CEO for the year of analysis, or did not pay com-pensation directly.
7 Data from the Ontario government’s sunshine list indicates that a number of union officials in that provinces received comparable compensation to that of the CEOs in the G&M database for those ranked 801–919. See <http://www.cbc.ca/news/canada/tories-release-union-leaders-100-000-salaries-1.285801#links>.
8 Sherwin Rosen (1981), The Economics of Superstars, American Economic Review 71, 5 (Dec: 845–858. Available at <http://home.uchicago.edu/~vlima/courses/econ201/Superstars.pdf>.
CEO to Worker Pay: A Broader Examination
fraserinstitute.org FRASER RESEARCH BULLETIN 8
9 See, for instance, Edward P. Lazear and Sherwin Rosen (1981), Rank-Order Tournaments as Opti-mum Labor Contracts, Journal of Political Economy 89, 5 (Oct): 841–864, <http://www.jstor.org/stable/1830810>; and Ulrike Malmendier and Geoffrey Tate (2009), Superstar CEOs, Quarterly Journal of Economics 124, 4 (Nov): 1593–1638, <http://www.jstor.org/stable/pdf/40506267>.
10 See, for instance, Alan B. Krueger (2005), The Economics of Real Superstars: The Market for Rock Concerts in the Material World, Journal of Labor Economics 23, 1 (Jan.): 1–30, <http://www.jstor.org/stable/10.1086/425431>; and Felix Koenig (2017), Superstar Earners and Market Size: Evidence from the Entertainment Industry, IZA Conference Paper, <http://conference.iza.org/conference_files/SUM_2017/koenig_f10098.pdf>.
11 Forbes Magazine (2017a), The World’s Highest-Paid Actors, 2016, <https://www.forbes.com/actors/#7a18ee4440fe>; (2017b), The World’s Highest-Paid Musicians for 2016, <https://www.forbes.com/pictures/geeg45ekidk/the-worlds-highest-paid/#643b80d96a13>; (2017c), The World’s Highest-Paid Athletes for 2016, <https://www.forbes.com/pictures/mli45ffmil/1-cristiano-ronaldo/#775fd1167039>.
12 Forbes Magazine (2017b), The World’s Highest-Paid Musicians for 2016, <https://www.forbes.com/pictures/geeg45ekidk/the-worlds-highest-paid/#643b80d96a13>.
13 Forbes Magazine (2017c), The World’s Highest-Paid Athletes for 2016, <https://www.forbes.com/pictures/mli45ffmil/1-cristiano-ronaldo/#775fd1167039>.
14 See Xavier Gabaix and Augustin Landier (2008), Why Has CEO Pay Increased So Much?, Quarterly Journal of Economics 123, 1 (Feb.): 49–100, <http://www.jstor.org/stable/25098894>. They conclude that “…the six-old increase of U.S. CEO pay between 1980 and 2003 can be fully attributable to the six-fold increase in market capitalization of large companies during that period” (p. 49).
15 Gabaix and Landier (2008), Why Has CEO Pay Increased So Much?
16 Rosen (1981), The Economics of Superstars: 846.
17 Felix Koenig (2017), Superstar Earners and Market Size: Evidence from the Entertainment Industry, IZA Conference Paper, <http://conference.iza.org/conference_files/SUM_2017/koenig_f10098.pdf> examined the roll-out of television in the mid-1950s to assess its effect on market size and the compensation of entertainers. He found that “[t]he number of entertainers in the top 1% of the income distribu-tion doubles, while the market size increases more than four-fold. The causal effect of market size on top earners is economically large and significant” (Abstract).
CEO to Worker Pay: A Broader Examination
fraserinstitute.org FRASER RESEARCH BULLETIN 9
CEO to Worker Pay: A Broader Examination
fraserinstitute.org FRASER RESEARCH BULLETIN 10
Jason Clemens is the
Executive Vice President
of the Fraser Institute. He
has an Honors Bachelors
Degree of Commerce and a
Master’s Degree in Business
Administration from the
University of Windsor as well
as a Post Baccalaureate Degree
in Economics from Simon
Fraser University. He has published over 70 major studies
on a wide range of topics, including taxation and entre-
preneurship. He has published over 300 shorter articles in
US, Canadian, and international newspapers.
Ingrid Timmermans was an
intern at the Fraser Institute
in the department of Health
Policy Studies from January to
May, 2016. She now works as a
Development Assistant at the
Institute. She holds a Master
of Science and Bachelor of
Science in Health and Society
from Wageningen University,
the Netherlands. During her studies, she completed an
internship at the University of Auckland, New Zealand,
where she did research on controlling the use of tobacco.
Joel Emes is a Fraser Institute
Senior Fellow. He holds a B.A.
and an M.A. in economics from
Simon Fraser University. He
rejoined the Institute after
a stint as a senior advisor to
British Columbia’s provincial
government. He previously
served as a senior analyst, then
as executive director (2009 to
2011), at the BC Progress Board. Prior to that, Joel was a
senior research economist at the Fraser Institute, where
he initiated and led several flagship projects in the areas
of tax freedom and government performance, spending,
debt, and unfunded liabilities.
AcknowledgmentsThe authors would like to thank the anonymous
reviewers for their comments and suggestions. Any
remaining errors or oversights are the sole re-
sponsibility of the authors. As the researchers have
worked independently, the views and conclusions
expressed in this paper do not necessarily reflect
those of the Board of Directors of the Fraser Insti-
tute, the staff, or supporters. This publication in no
way implies that the Fraser Institute, its directors,
or staff are in favour of, or oppose the passage of,
any bill; or that they support or oppose any par-
ticular political party or candidate.
About this PublicationCopyright © 2018 by the Fraser Institute. All rights
reserved. Without written permission, only brief pas-
sages may be quoted in critical articles and reviews.
ISSN 2291-8620
Media queries: call 604.714.4582 or e-mail: com-
Support the Institute: call 1.800.665.3558, ext. 548
or e-mail: [email protected]
Visit our website: www.fraserinstitute.org
Front cover: Tony Kempen.