Embed Size (px)
Citation preview
Slide 1
SIA ANALYST/MEDIA BRIEFINGQ2 and 1H FY2018-19 Results
14 Nov 2018
THE PARENT AIRLINEQ2 AND 1H FY18/19
RESULTS
Slide 3
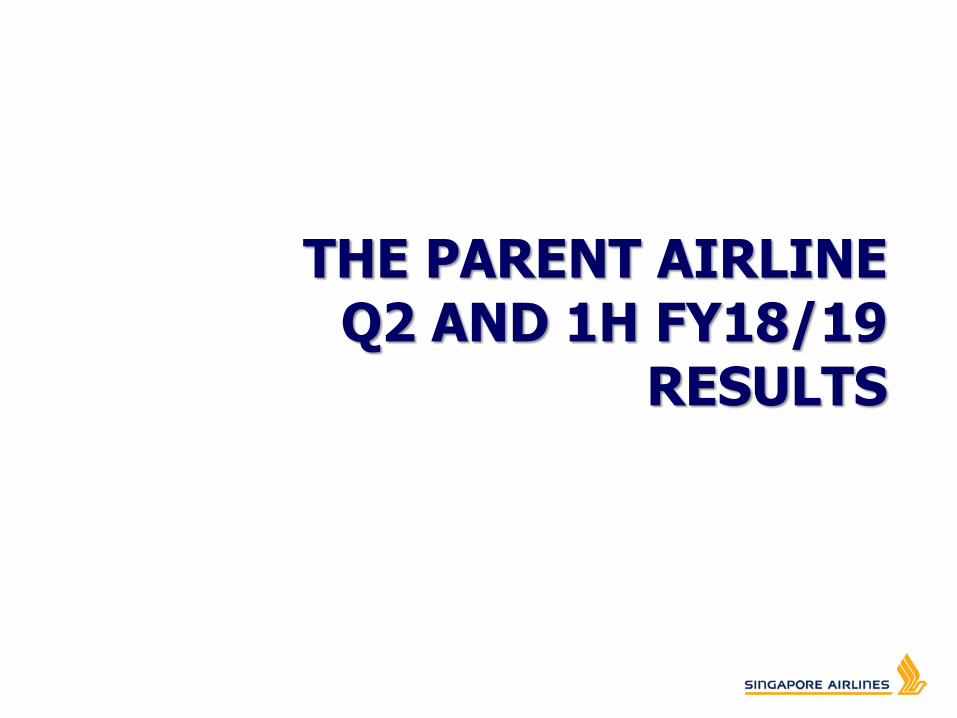
THE PARENT AIRLINE COMPANY (PAX)Q2 & 1H FY18/19
Passenger Unit Cost (¢/ask) 8.3 +5.1 8.2 +3.8
Passenger Unit Ex-fuel Cost (¢/ask) 5.5 - 5.4 -1.8
Passenger Breakeven Load Factor (%) 83.8 +4.8 pts 82.8 +4.6 pts
Pax Yield (¢/pkm) 9.9 -1.0 9.9 -2.0
Q2 Change 1H Change
FY18/19 % FY18/19 %
Available Seat-KM (M) 30,735.7 +2.3 60,519.6 +2.6
Revenue Passenger-KM (M) 26,173.6 +6.5 50,602.6 +6.0
Passenger Load Factor (%) 85.2 +3.4 pts 83.6 +2.7 pts
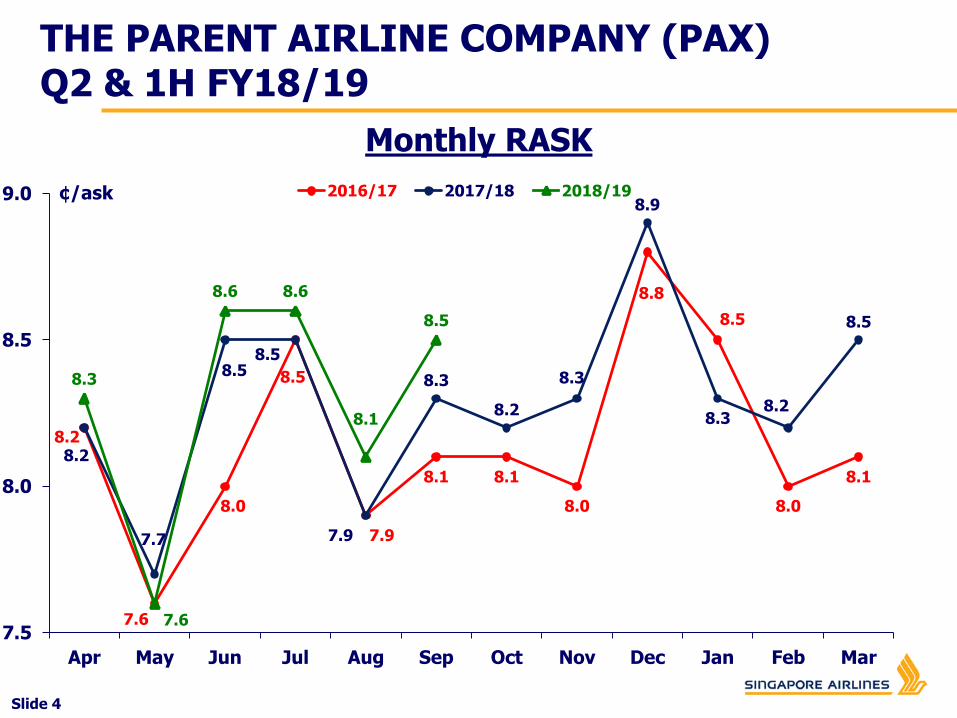
RASK (¢/ask) 8.4 +2.4 8.3 +1.2
Slide 4
Monthly RASK
THE PARENT AIRLINE COMPANY (PAX)Q2 & 1H FY18/19
8.2
7.6
8.0
8.5
7.9
8.1 8.1
8.0
8.8
8.5
8.0
8.1
8.2
7.7
8.58.5
7.9
8.3
8.2
8.3
8.9
8.38.2
8.5
8.3
7.6
8.6 8.6
8.1
8.5
7.5
8.0
8.5
9.0
Apr May Jun Jul Aug Sep Oct Nov Dec Jan Feb Mar
¢/ask 2016/17 2017/18 2018/19
Slide 5
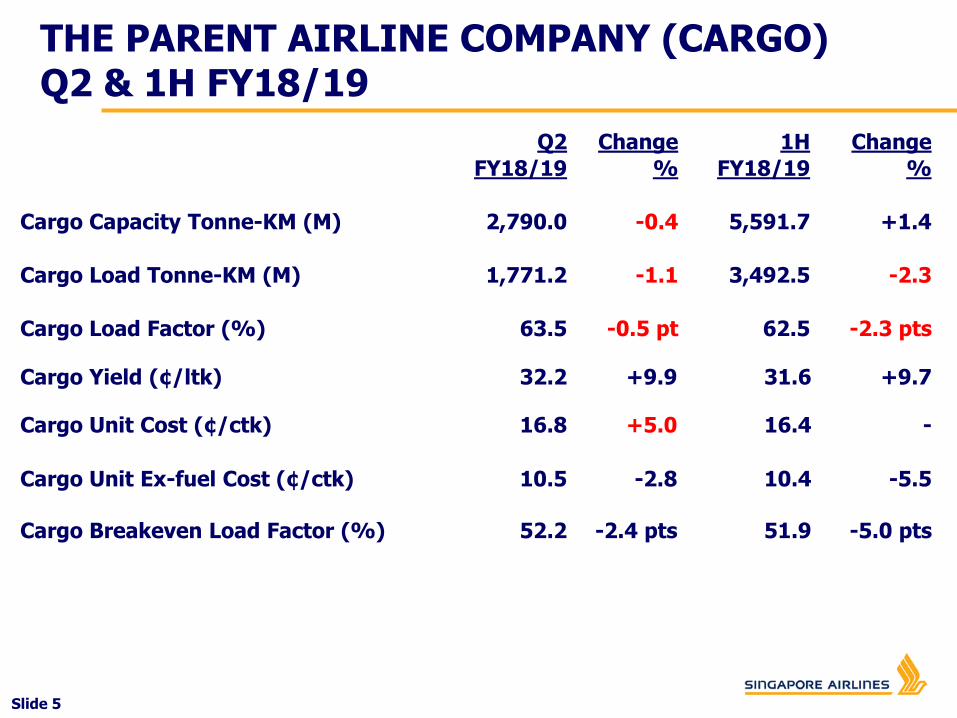
Cargo Unit Cost (¢/ctk) 16.8 +5.0 16.4 -
Cargo Unit Ex-fuel Cost (¢/ctk) 10.5 -2.8 10.4 -5.5
Cargo Breakeven Load Factor (%) 52.2 -2.4 pts 51.9 -5.0 pts
Cargo Yield (¢/ltk) 32.2 +9.9 31.6 +9.7
Q2 Change 1H Change
FY18/19 % FY18/19 %
Cargo Capacity Tonne-KM (M) 2,790.0 -0.4 5,591.7 +1.4
Cargo Load Tonne-KM (M) 1,771.2 -1.1 3,492.5 -2.3
Cargo Load Factor (%) 63.5 -0.5 pt 62.5 -2.3 pts
THE PARENT AIRLINE COMPANY (CARGO)Q2 & 1H FY18/19

Slide 6
Monthly Cargo Yields
26.726.5
26.926.6
27.0
27.5
28.1
29.1
29.8
27.6 27.728.1
28.6
27.828.2
28.829.1
29.9
30.2
32.3
34.1
29.629.9
30.2
30.6 30.6
31.8 31.832.1
32.7
25
26
27
28
29
30
31
32
33
34
35
Apr May Jun Jul Aug Sep Oct Nov Dec Jan Feb Mar
¢/ltk 2016/17 2017/18 2018/19
THE PARENT AIRLINE COMPANY (CARGO)Q2 & 1H FY18/19
Slide 7
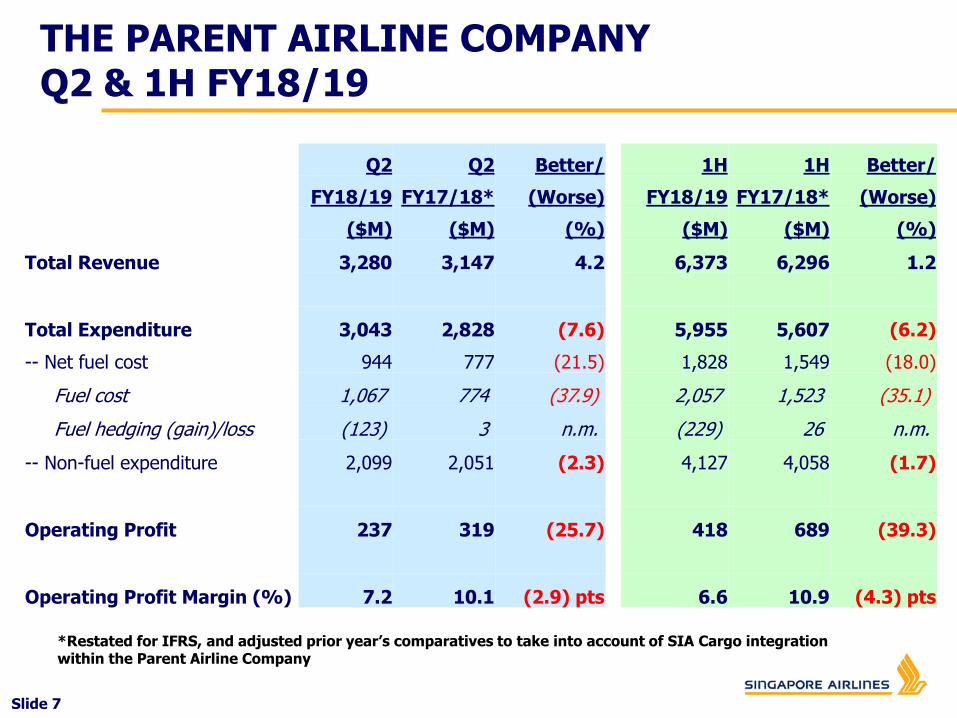
*Restated for IFRS, and adjusted prior year’s comparatives to take into account of SIA Cargo integration within the Parent Airline Company
Q2 Q2 Better/
FY18/19 FY17/18* (Worse)
($M) ($M) (%)
Total Revenue 3,280 3,147 4.2
Total Expenditure 3,043 2,828 (7.6)
-- Net fuel cost 944 777 (21.5)
Fuel cost 1,067 774 (37.9)
Fuel hedging (gain)/loss (123) 3 n.m.
-- Non-fuel expenditure 2,099 2,051 (2.3)
Operating Profit 237 319 (25.7)
Operating Profit Margin (%) 7.2 10.1 (2.9) pts
1H 1H Better/
FY18/19 FY17/18* (Worse)
($M) ($M) (%)
6,373 6,296 1.2
5,955 5,607 (6.2)
1,828 1,549 (18.0)
2,057 1,523 (35.1)
(229) 26 n.m.
4,127 4,058 (1.7)
418 689 (39.3)
6.6 10.9 (4.3) pts
THE PARENT AIRLINE COMPANYQ2 & 1H FY18/19
Slide 8
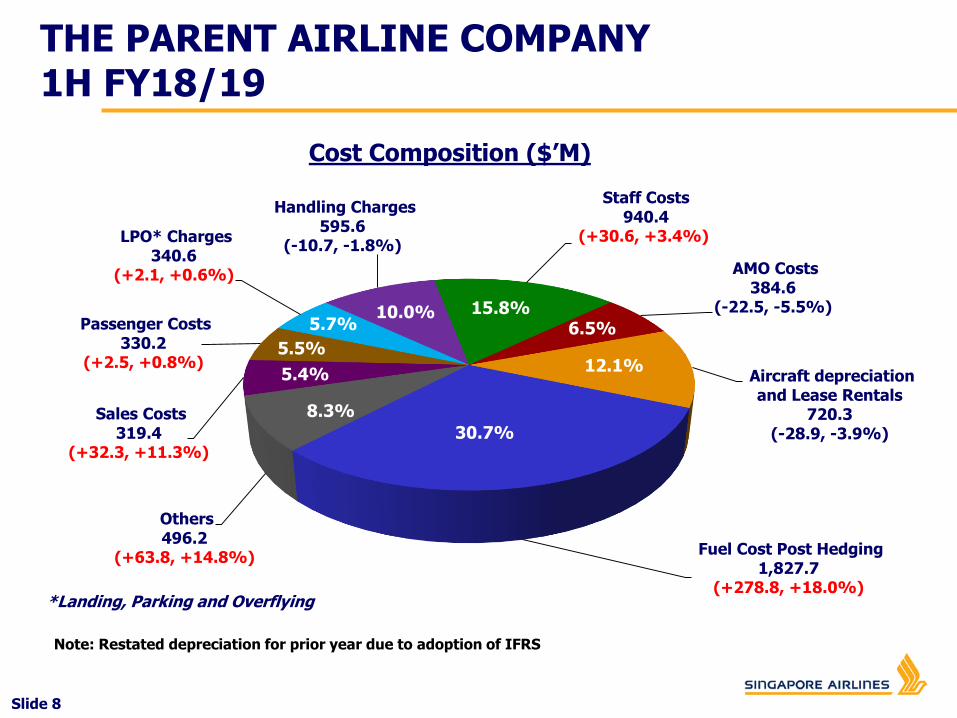
THE PARENT AIRLINE COMPANY1H FY18/19
Fuel Cost Post Hedging1,827.7
(+278.8, +18.0%)
Others496.2
(+63.8, +14.8%)
Sales Costs319.4
(+32.3, +11.3%)
Passenger Costs330.2
(+2.5, +0.8%)
LPO* Charges340.6
(+2.1, +0.6%)
Handling Charges595.6
(-10.7, -1.8%)
Staff Costs940.4
(+30.6, +3.4%)
AMO Costs384.6
(-22.5, -5.5%)
Aircraft depreciation and Lease Rentals
720.3(-28.9, -3.9%)
*Landing, Parking and Overflying
30.7%
8.3%
5.7%
5.4%
5.5%
15.8%
12.1%
6.5%10.0%
Note: Restated depreciation for prior year due to adoption of IFRS
Cost Composition ($’M)
Slide 9
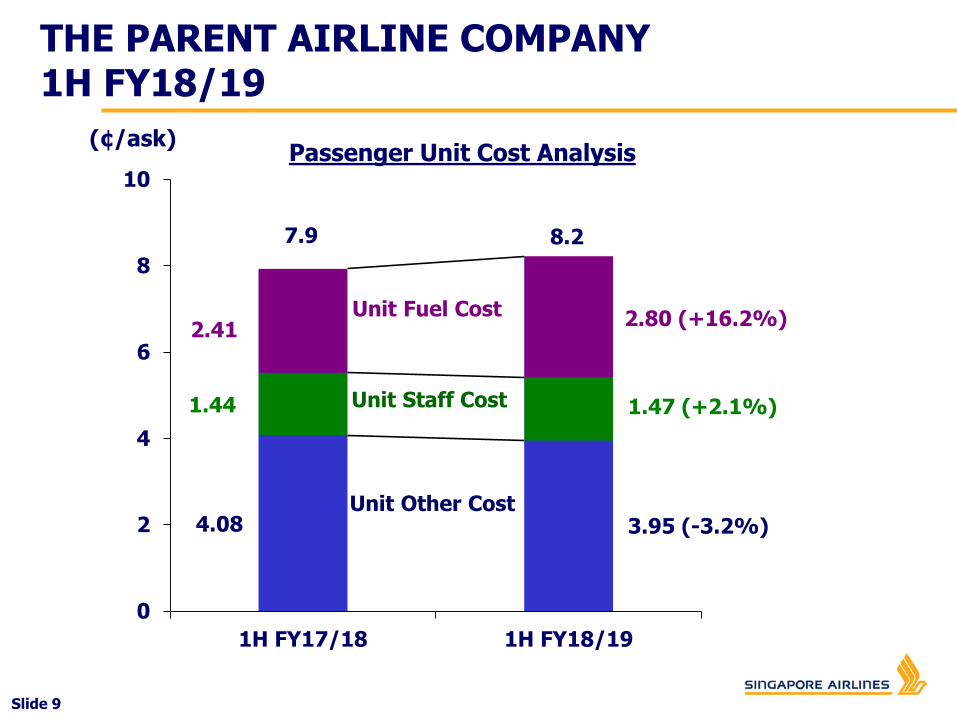
THE PARENT AIRLINE COMPANY1H FY18/19
(¢/ask)
7.9 8.2
4.08 3.95 (-3.2%)
1.44 1.47 (+2.1%)
2.412.80 (+16.2%)
0
2
4
6
8
10
1H FY17/18 1H FY18/19
Unit Fuel Cost
Unit Staff Cost
Unit Other Cost
Passenger Unit Cost Analysis
Slide 10
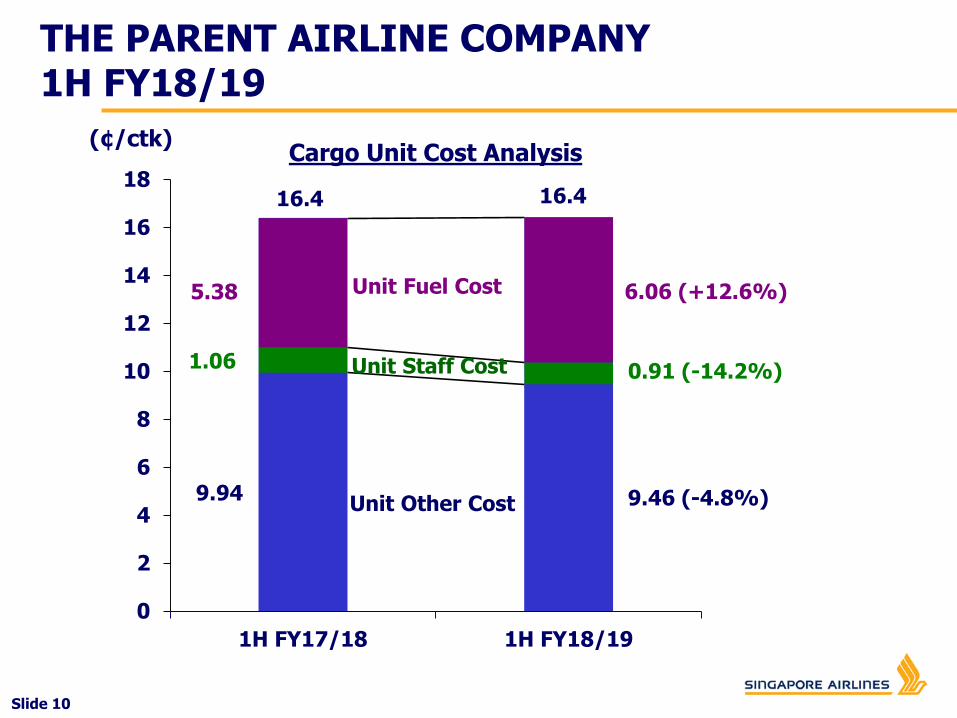
THE PARENT AIRLINE COMPANY1H FY18/19
(¢/ctk)
16.4 16.4
9.94 9.46 (-4.8%)
1.06 0.91 (-14.2%)
5.38 6.06 (+12.6%)
0
2
4
6
8
10
12
14
16
18
1H FY17/18 1H FY18/19
Unit Fuel Cost
Unit Staff Cost
Unit Other Cost
Cargo Unit Cost Analysis
SIA GROUP Q2 AND 1H FY18/19
RESULTS
Slide 12
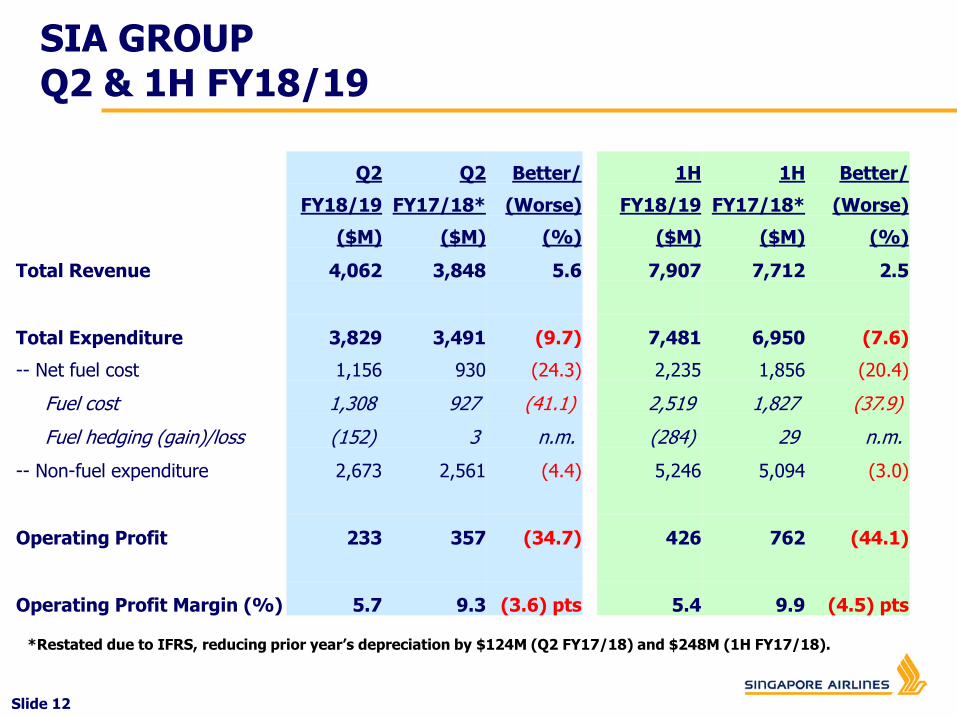
SIA GROUP Q2 & 1H FY18/19
Q2 Q2 Better/
FY18/19 FY17/18* (Worse)
($M) ($M) (%)
Total Revenue 4,062 3,848 5.6
Total Expenditure 3,829 3,491 (9.7)
-- Net fuel cost 1,156 930 (24.3)
Fuel cost 1,308 927 (41.1)
Fuel hedging (gain)/loss (152) 3 n.m.
-- Non-fuel expenditure 2,673 2,561 (4.4)
Operating Profit 233 357 (34.7)
Operating Profit Margin (%) 5.7 9.3 (3.6) pts
1H 1H Better/
FY18/19 FY17/18* (Worse)
($M) ($M) (%)
7,907 7,712 2.5
7,481 6,950 (7.6)
2,235 1,856 (20.4)
2,519 1,827 (37.9)
(284) 29 n.m.
5,246 5,094 (3.0)
426 762 (44.1)
5.4 9.9 (4.5) pts
*Restated due to IFRS, reducing prior year’s depreciation by $124M (Q2 FY17/18) and $248M (1H FY17/18).
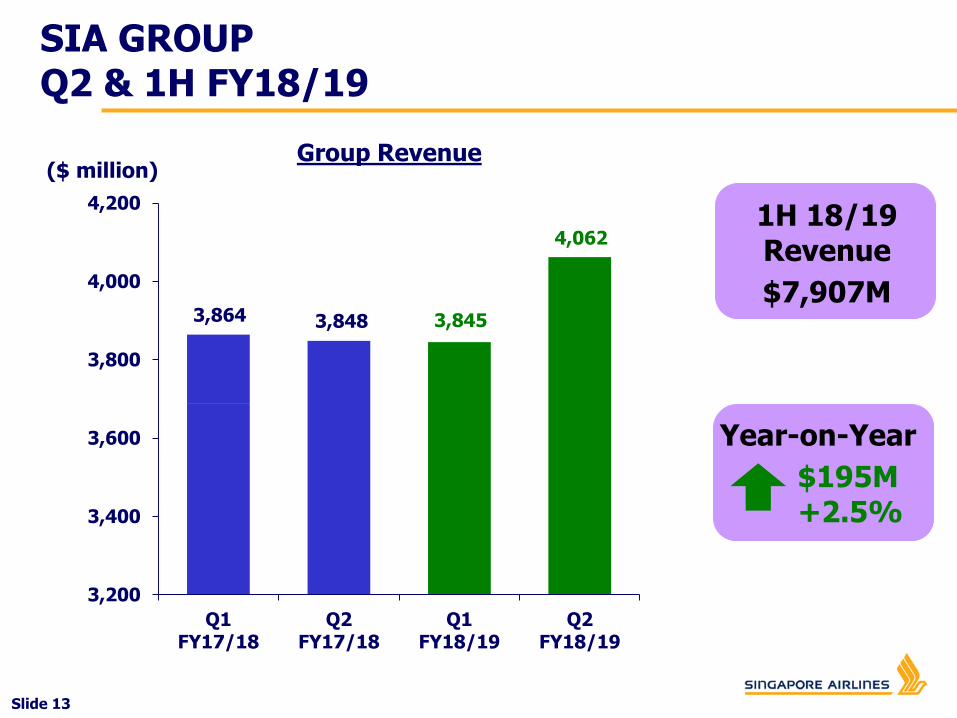
Slide 13
($ million)
1H 18/19Revenue
$7,907M
Year-on-Year
$9M-0.1%
Year-on-Year
$195M+2.5%
3,848 3,845
4,062
3,200
3,400
3,600
3,800
4,000
4,200
Q1FY17/18
Q2FY17/18
Q1FY18/19
Q2FY18/19
3,864
SIA GROUP Q2 & 1H FY18/19
Group Revenue
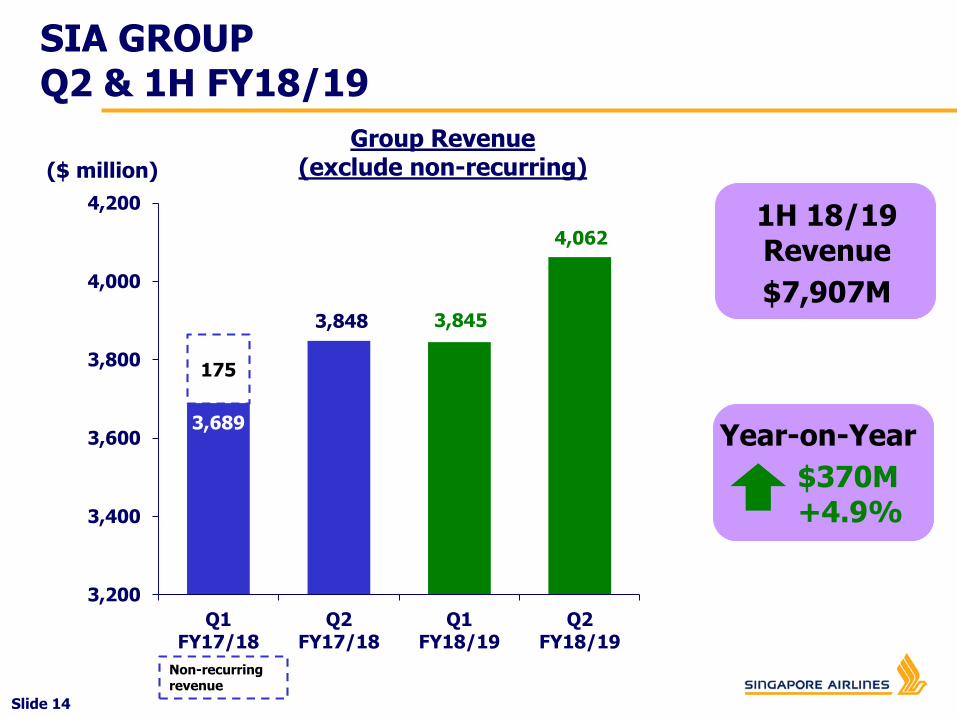
Slide 14
($ million)
1H 18/19Revenue
$7,907M
Year-on-Year
$9M-0.1%
Year-on-Year
$370M+4.9%
3,689
3,848 3,845
4,062
175
3,200
3,400
3,600
3,800
4,000
4,200
Q1FY17/18
Q2FY17/18
Q1FY18/19
Q2FY18/19
Non-recurring revenue
SIA GROUP Q2 & 1H FY18/19
Group Revenue (exclude non-recurring)
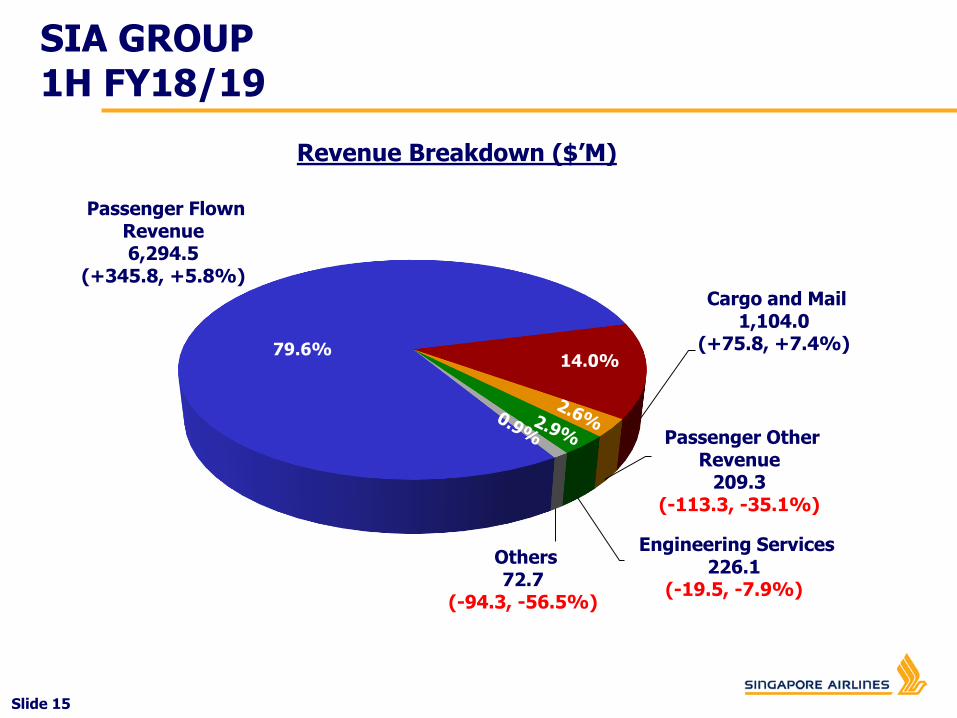
Slide 15
Passenger Flown Revenue6,294.5
(+345.8, +5.8%)
Cargo and Mail1,104.0
(+75.8, +7.4%)
Passenger Other Revenue
209.3(-113.3, -35.1%)
Engineering Services226.1
(-19.5, -7.9%)
Others72.7
(-94.3, -56.5%)
79.6%14.0%
SIA GROUP 1H FY18/19
Revenue Breakdown ($’M)

Slide 16
3,459 3,491
3,652
3,829
124124
3,200
3,400
3,600
3,800
4,000
Q1FY17/18
Q2FY17/18
Q1FY18/19
Q2FY18/19
1H 18/19Expenditure
$7,481M
Year-on-Year
$531M(+7.6%)
Restatement for prior year due to adoption of IFRS
($ million)Group Expenditure
SIA GROUP Q2 & 1H FY18/19
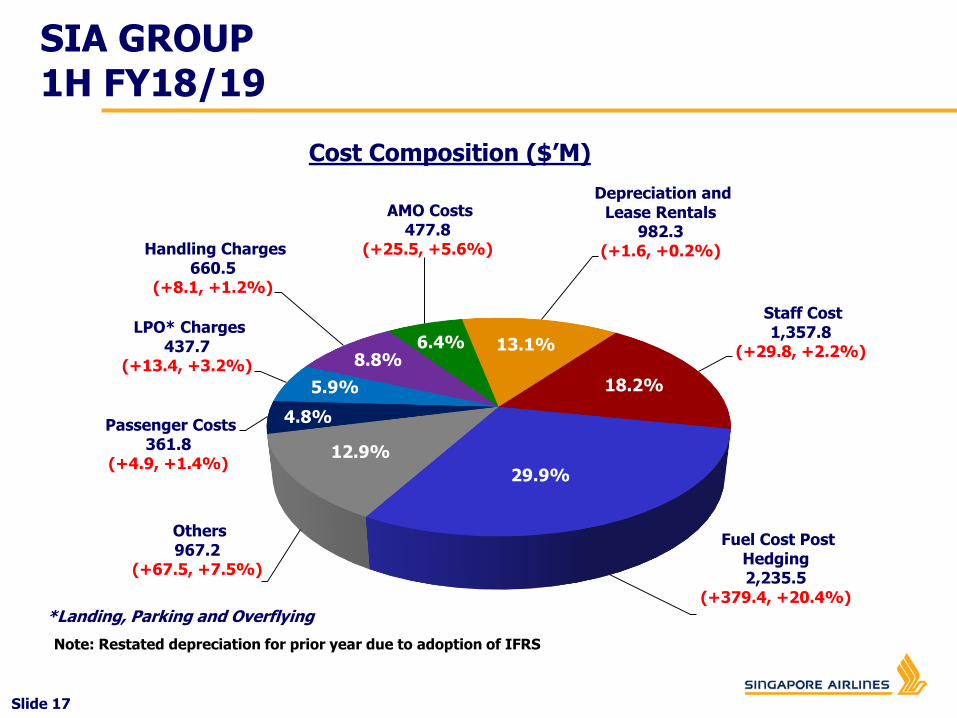
Slide 17
79.6%14.0%
Depreciation and Lease Rentals
982.3(+1.6, +0.2%)
Staff Cost1,357.8
(+29.8, +2.2%)
Fuel Cost Post Hedging2,235.5
(+379.4, +20.4%)
Others967.2
(+67.5, +7.5%)
Passenger Costs361.8
(+4.9, +1.4%)
LPO* Charges437.7
(+13.4, +3.2%)
Handling Charges660.5
(+8.1, +1.2%)
AMO Costs477.8
(+25.5, +5.6%)
29.9%
13.1%6.4%
18.2%
12.9%
4.8%
8.8%
5.9%
SIA GROUP 1H FY18/19
Cost Composition ($’M)
Note: Restated depreciation for prior year due to adoption of IFRS
*Landing, Parking and Overflying
Slide 18
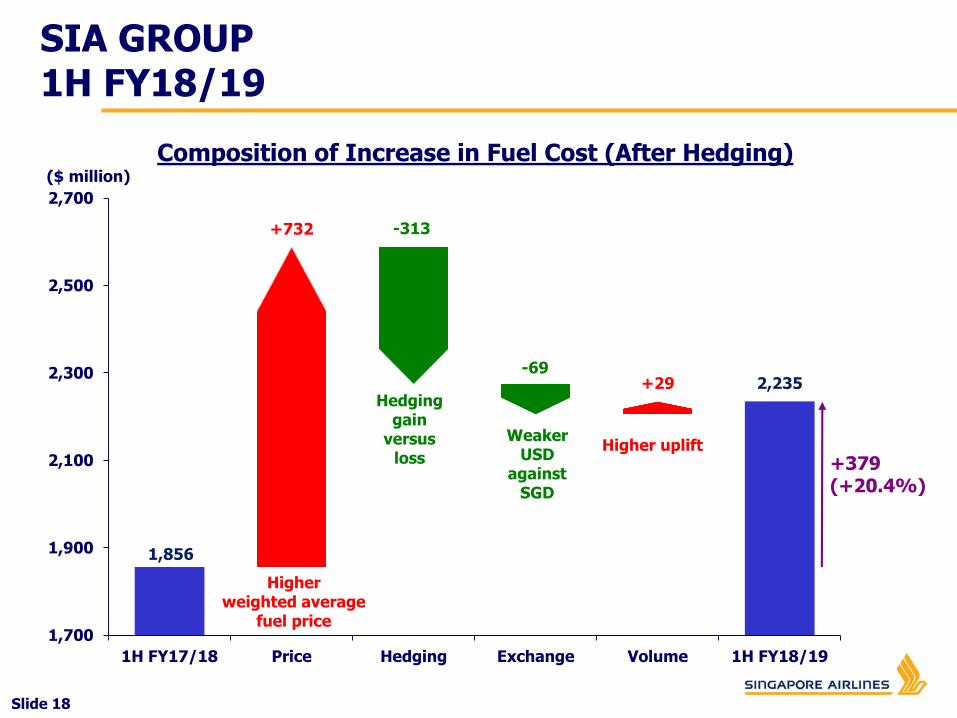
SIA GROUP 1H FY18/19
Composition of Increase in Fuel Cost (After Hedging)
1,856
+732 -313
-69+29 2,235
1,700
1,900
2,100
2,300
2,500
2,700
1H FY17/18 Price Hedging Exchange Volume 1H FY18/19
Higherweighted average
fuel price
Hedging gain
versus loss
Higher upliftWeaker
USD against
SGD
+379 (+20.4%)
($ million)
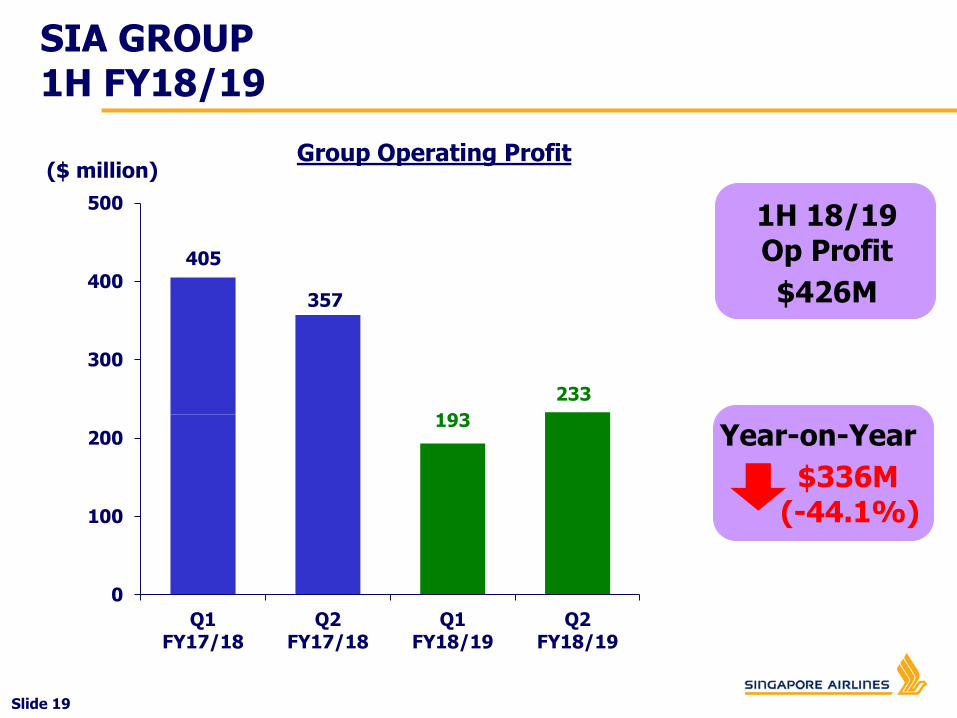
Slide 19
357
193
233
0
100
200
300
400
500
Q1FY17/18
Q2FY17/18
Q1FY18/19
Q2FY18/19
1H 18/19Op Profit
$426M
Year-on-Year
$336M(-44.1%)
($ million)
SIA GROUP 1H FY18/19
Group Operating Profit
405

Slide 20
230
357
193
233
175
0
100
200
300
400
500
Q1FY17/18
Q2FY17/18
Q1FY18/19
Q2FY18/19
1H 18/19Op Profit
$426M
Year-on-Year
$161M(-27.4%)
($ million)
SIA GROUP 1H FY18/19
Group Operating Profit (excluding non-recurring
revenue)
Non-recurring revenue
Slide 21
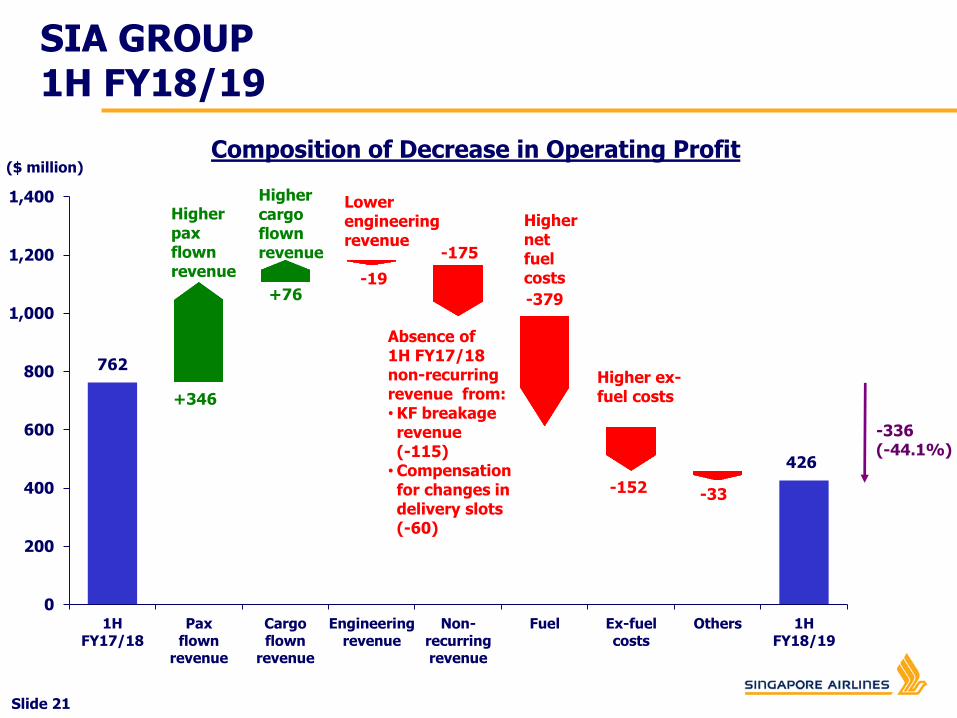
SIA GROUP 1H FY18/19
Composition of Decrease in Operating Profit
762
+346
+76-19
-175
-379
-152 -33
426
0
200
400
600
800
1,000
1,200
1,400
1HFY17/18
Paxflown
revenue
Cargoflown
revenue
Engineeringrevenue
Non-recurringrevenue
Fuel Ex-fuelcosts
Others 1HFY18/19
($ million)
-336(-44.1%)
Higher paxflown revenue
Higher net fuel costs
Lower engineering revenue
Absence of 1H FY17/18 non-recurring revenue from:•KF breakage revenue (-115)•Compensation for changes in delivery slots (-60)
Higher ex-fuel costs
Higher cargo flown revenue
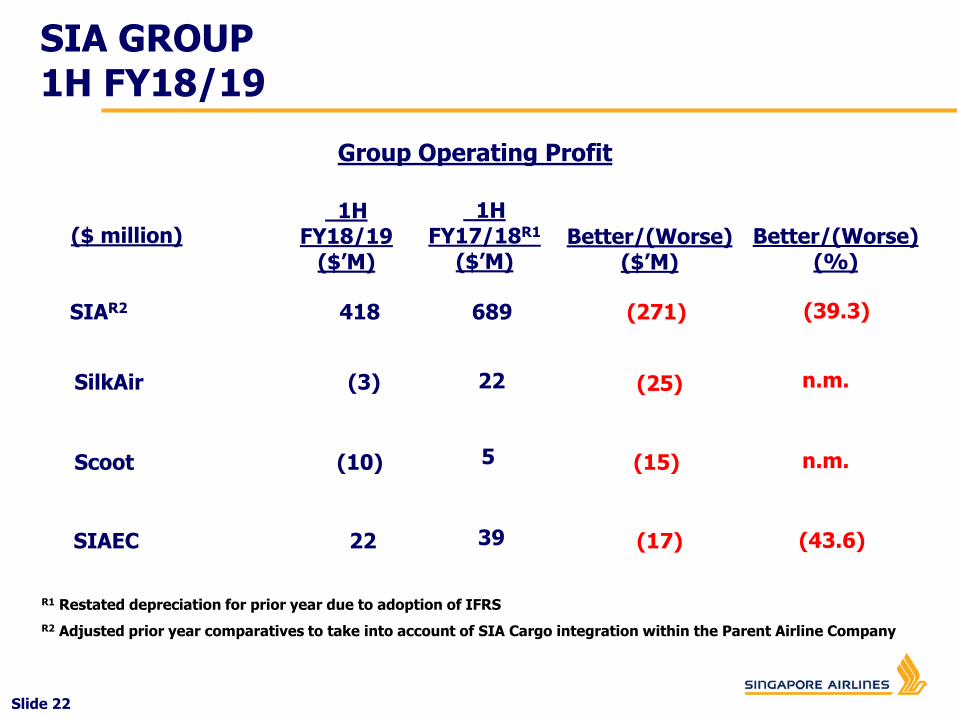
Slide 22
(271)689418SIAR2
1HFY18/19
($’M)
(25)22(3)SilkAir
(15)5(10)Scoot
Better/(Worse)($’M)
(39.3)
(17)3922SIAEC (43.6)
($ million)1H
FY17/18R1
($’M)Better/(Worse)
(%)
n.m.
n.m.
R1 Restated depreciation for prior year due to adoption of IFRS
R2 Adjusted prior year comparatives to take into account of SIA Cargo integration within the Parent Airline Company
SIA GROUP 1H FY18/19
Group Operating Profit
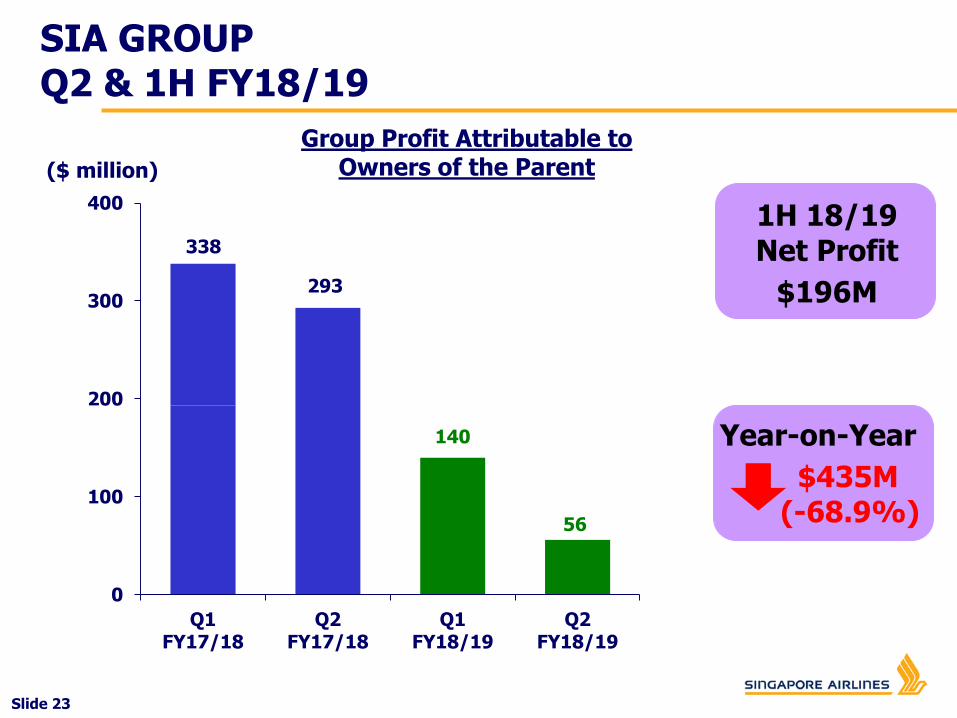
Slide 23
293
140
56
0
100
200
300
400
Q1FY17/18
Q2FY17/18
Q1FY18/19
Q2FY18/19
1H 18/19Net Profit
$196M
Year-on-Year
$435M(-68.9%)
($ million)
SIA GROUP Q2 & 1H FY18/19
Group Profit Attributable to Owners of the Parent
338
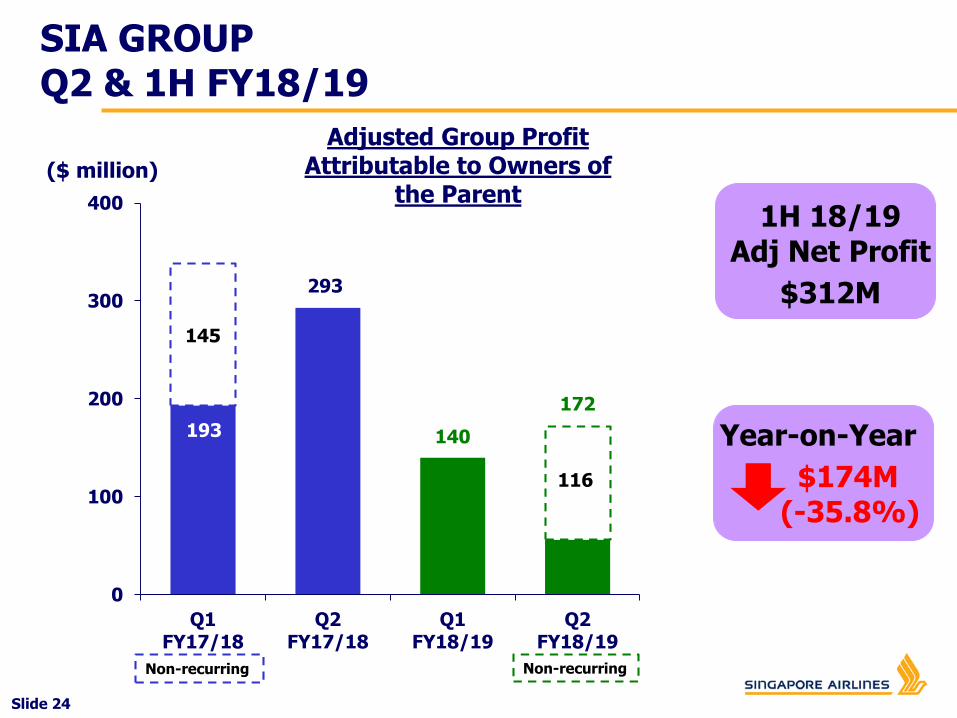
Slide 24
293
140
172
145
0
100
200
300
400
Q1FY17/18
Q2FY17/18
Q1FY18/19
Q2FY18/19
1H 18/19Adj Net Profit
$312M
Year-on-Year
$174M(-35.8%)
($ million)
SIA GROUP Q2 & 1H FY18/19
Adjusted Group Profit Attributable to Owners of
the Parent
193
116
Non-recurring Non-recurring
Slide 25
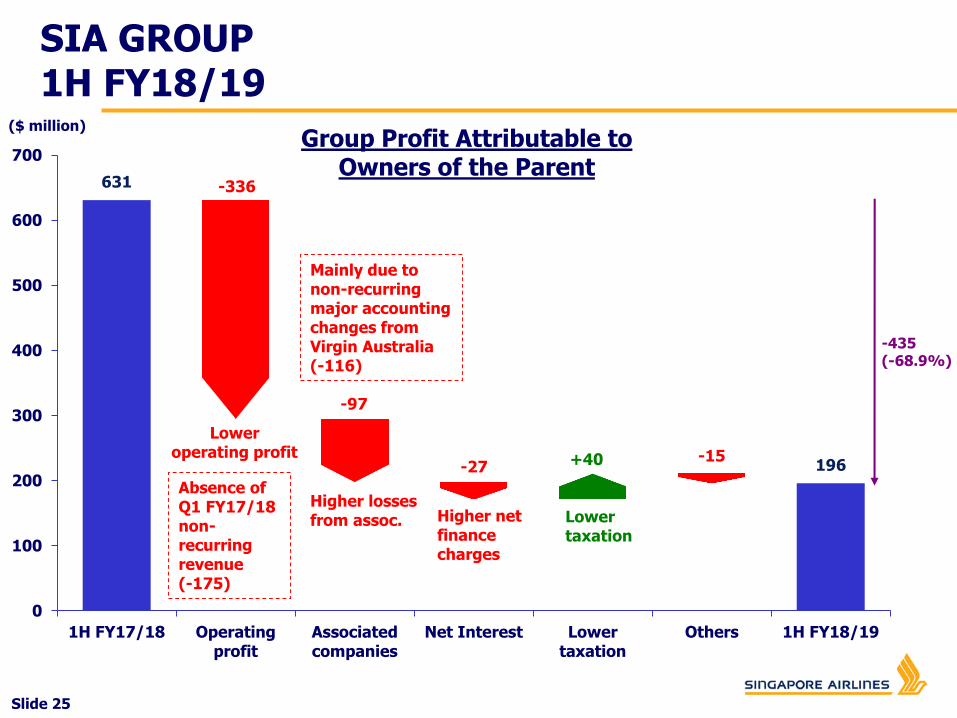
SIA GROUP 1H FY18/19
($ million)
631 -336
-97
-27 +40 -15196
0
100
200
300
400
500
600
700
1H FY17/18 Operatingprofit
Associatedcompanies
Net Interest Lowertaxation
Others 1H FY18/19
Lower operating profit
-435(-68.9%)
Group Profit Attributable to Owners of the Parent
Absence of Q1 FY17/18 non-recurring revenue(-175)
Mainly due to non-recurring major accounting changes from Virgin Australia (-116)
Higher losses from assoc. Higher net
finance charges
Lower taxation
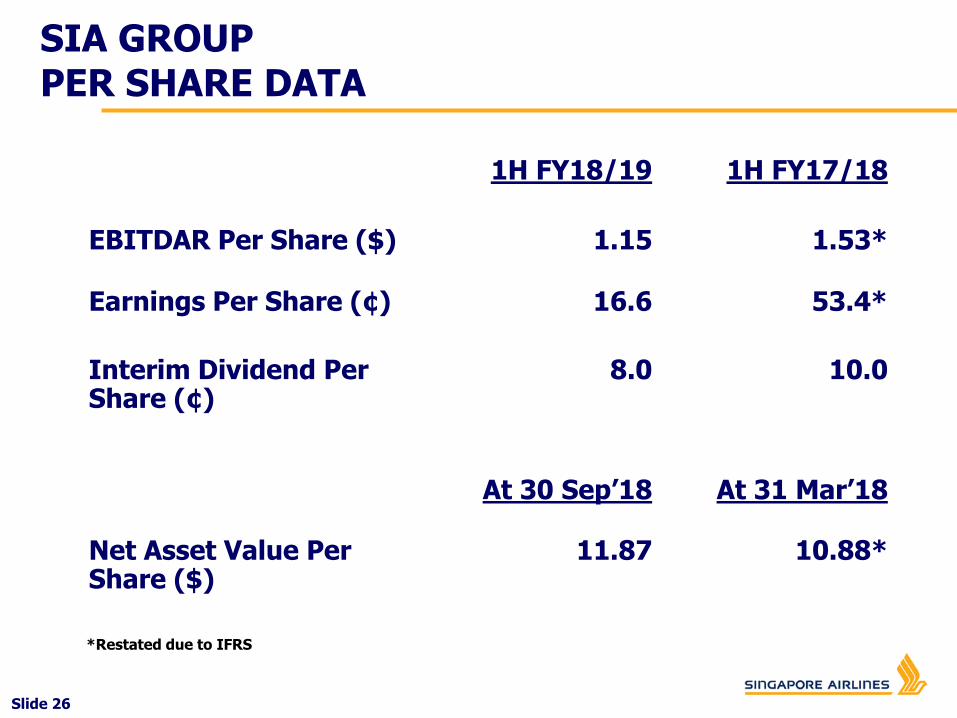
Slide 26
10.08.0Interim Dividend Per Share (¢)
1.53*1.15EBITDAR Per Share ($)
1H FY17/181H FY18/19
10.88*11.87Net Asset Value Per Share ($)
At 31 Mar’18At 30 Sep’18
53.4*16.6Earnings Per Share (¢)
SIA GROUP PER SHARE DATA
*Restated due to IFRS
Slide 27
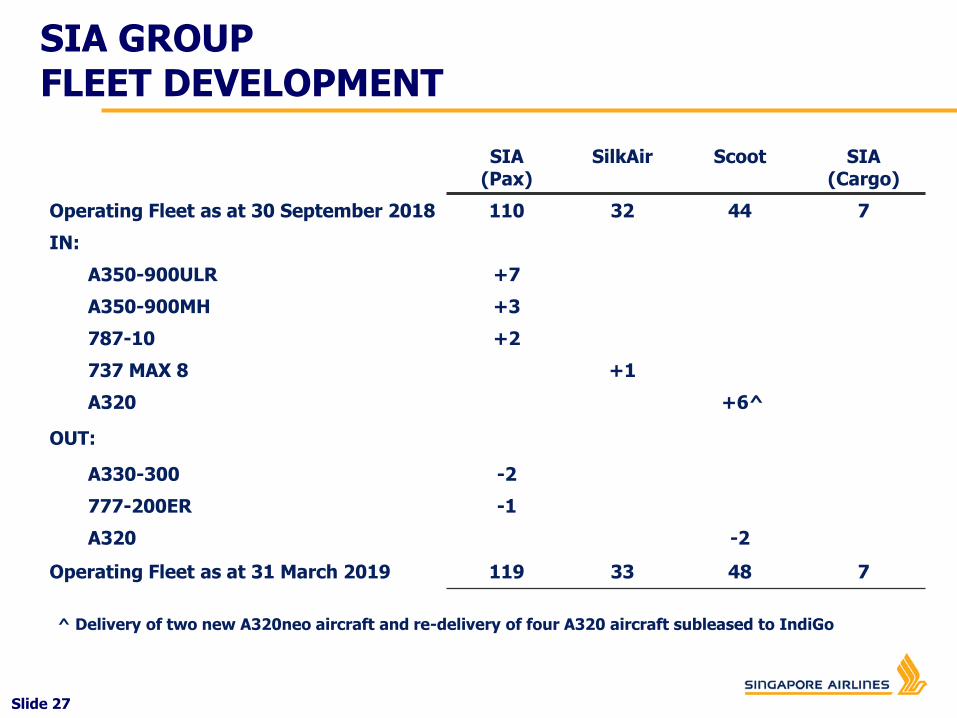
SIA(Pax)
SilkAir Scoot SIA(Cargo)
Operating Fleet as at 30 September 2018 110 32 44 7
IN:
A350-900ULR +7
A350-900MH +3
787-10 +2
737 MAX 8 +1
A320 +6^
OUT:
A330-300 -2
777-200ER -1
A320 -2
Operating Fleet as at 31 March 2019 119 33 48 7
^ Delivery of two new A320neo aircraft and re-delivery of four A320 aircraft subleased to IndiGo
SIA GROUP FLEET DEVELOPMENT
Slide 28
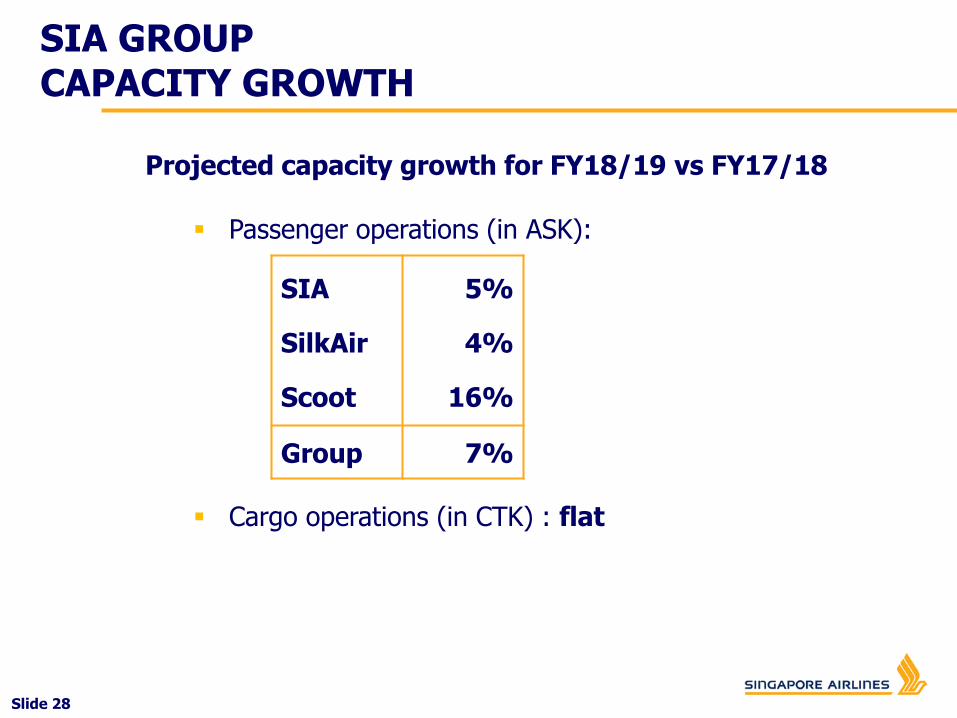
Projected capacity growth for FY18/19 vs FY17/18
Passenger operations (in ASK):
Cargo operations (in CTK) : flat
SIA
SilkAir
Scoot
5%
4%
16%
Group 7%
SIA GROUP CAPACITY GROWTH
Slide 29
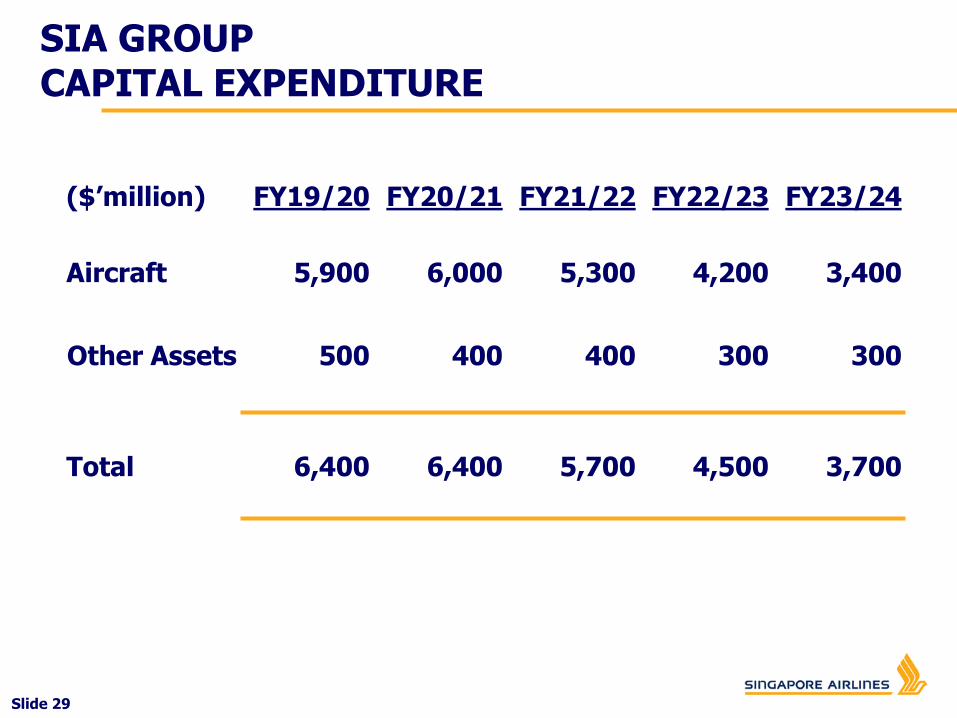
($’million) FY19/20 FY20/21 FY21/22 FY22/23 FY23/24
Aircraft 5,900 6,000 5,300 4,200 3,400
Other Assets 500 400 400 300 300
Total 6,400 6,400 5,700 4,500 3,700
SIA GROUP CAPITAL EXPENDITURE
Slide 30
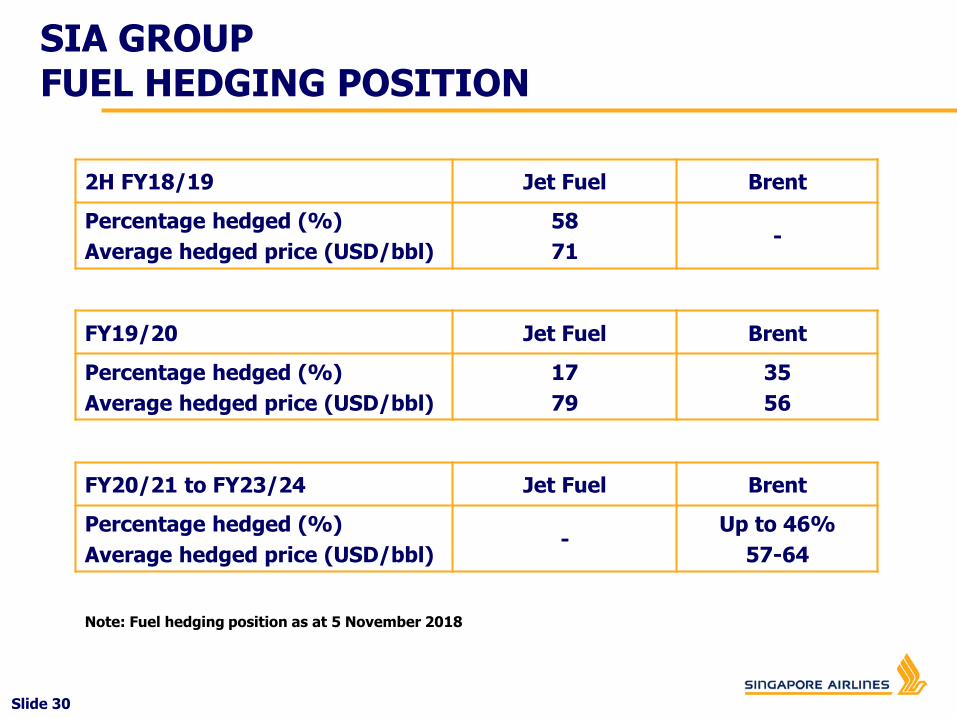
SIA GROUP FUEL HEDGING POSITION
2H FY18/19 Jet Fuel Brent
Percentage hedged (%)
Average hedged price (USD/bbl)
58
71-
FY19/20 Jet Fuel Brent
Percentage hedged (%)
Average hedged price (USD/bbl)
17
79
35
56
FY20/21 to FY23/24 Jet Fuel Brent
Percentage hedged (%)
Average hedged price (USD/bbl)-
Up to 46%
57-64
Note: Fuel hedging position as at 5 November 2018
STRATEGIC DEVELOPMENTS
Slide 32Slide 32
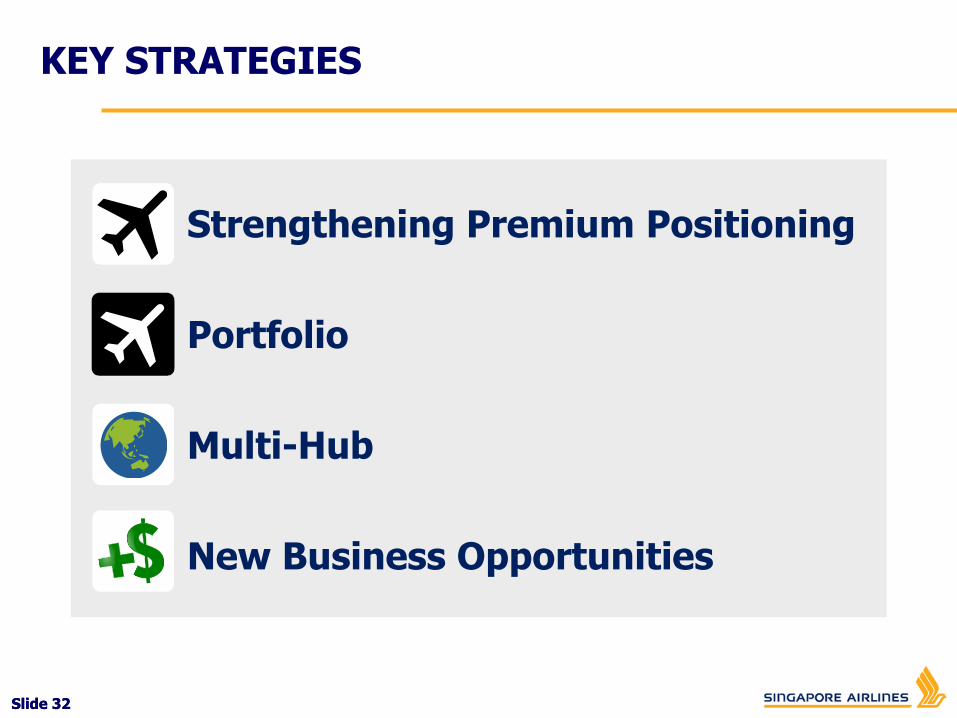
Strengthening Premium Positioning
Multi-Hub
Portfolio
New Business Opportunities
KEY STRATEGIES
Slide 33Slide 33
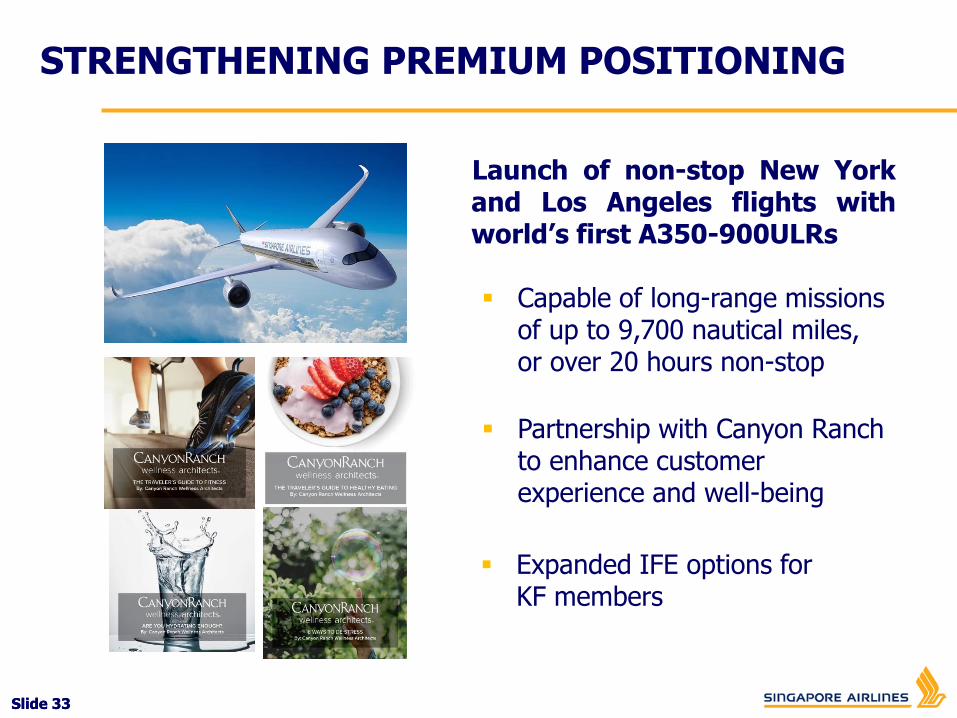
STRENGTHENING PREMIUM POSITIONING
Launch of non-stop New Yorkand Los Angeles flights withworld’s first A350-900ULRs
Capable of long-range missions of up to 9,700 nautical miles, or over 20 hours non-stop
Partnership with Canyon Ranch to enhance customer experience and well-being
Expanded IFE options for KF members
Slide 34Slide 34
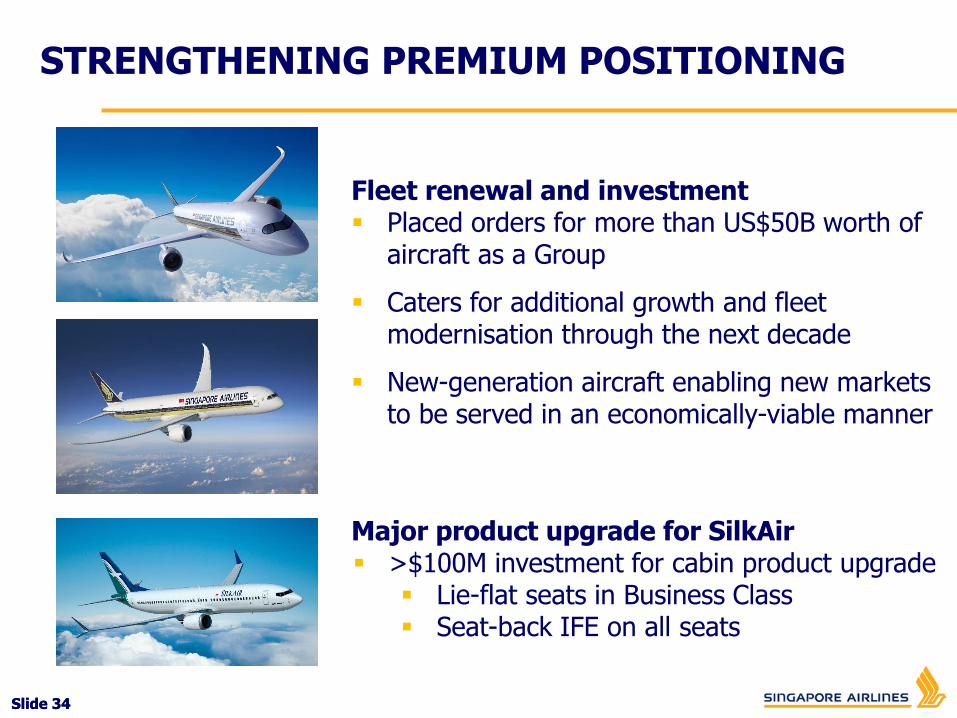
Fleet renewal and investment Placed orders for more than US$50B worth of
aircraft as a Group
Caters for additional growth and fleet modernisation through the next decade
New-generation aircraft enabling new markets to be served in an economically-viable manner
STRENGTHENING PREMIUM POSITIONING
Major product upgrade for SilkAir >$100M investment for cabin product upgrade
Lie-flat seats in Business Class Seat-back IFE on all seats
Slide 35Slide 35
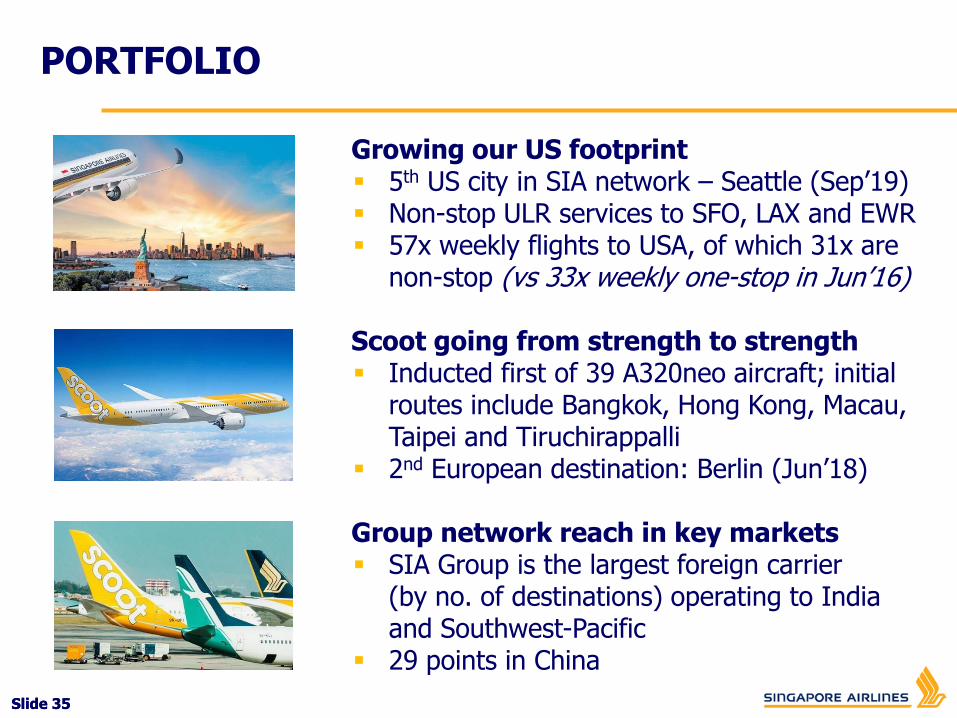
PORTFOLIO
Growing our US footprint 5th US city in SIA network – Seattle (Sep’19) Non-stop ULR services to SFO, LAX and EWR 57x weekly flights to USA, of which 31x are
non-stop (vs 33x weekly one-stop in Jun’16)
Scoot going from strength to strength Inducted first of 39 A320neo aircraft; initial
routes include Bangkok, Hong Kong, Macau, Taipei and Tiruchirappalli
2nd European destination: Berlin (Jun’18)
Group network reach in key markets SIA Group is the largest foreign carrier
(by no. of destinations) operating to India and Southwest-Pacific
29 points in China
Slide 36Slide 36
The SIA Group serves 140 destinations in 37 countries and territories
PORTFOLIO
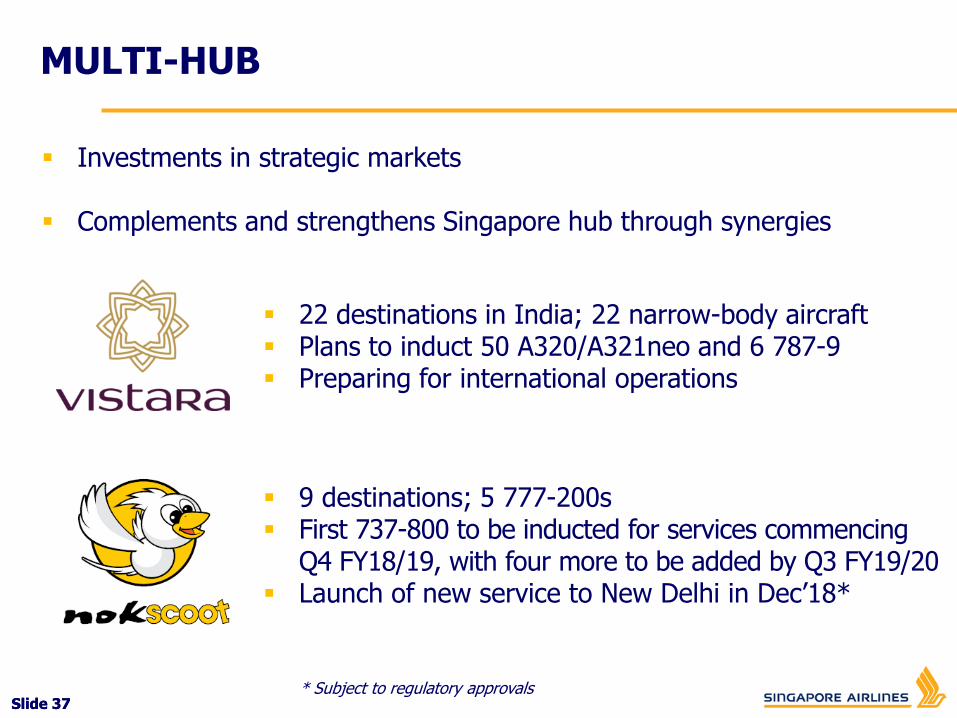
Slide 37Slide 37
Investments in strategic markets
Complements and strengthens Singapore hub through synergies
22 destinations in India; 22 narrow-body aircraft Plans to induct 50 A320/A321neo and 6 787-9 Preparing for international operations
9 destinations; 5 777-200s First 737-800 to be inducted for services commencing
Q4 FY18/19, with four more to be added by Q3 FY19/20 Launch of new service to New Delhi in Dec’18*
MULTI-HUB
* Subject to regulatory approvals
Slide 38Slide 38
NEW REVENUE & BUSINESS OPPORTUNITIES
SIA-CAE flight training centre Equally-owned JV for pilot training in Singapore Operations commenced in Aug’18 Provides full range of initial type rating and
recurrent training programmes for Boeing 737 MAX, 747, 777 and 787 aircraft types
Travel Retail Joint Venture Travel retail JV with DFASS and SATS under
KrisShop and Scootalogue brands Transforms existing programmes into omni-
channel e-commerce platforms
Slide 39Slide 39
DIGITAL TRANSFORMATION
Cultivate Digital Culture Company-wide training programmes and participation by
staff in innovation projects across the Group
Build Digital Capabilities Extensive IT-related recruitment and a shift to agile delivery
of IT projects
Revamp Technical Infrastructure Large-scale investment in IT infrastructure
Collaborate with External Communities Increased collaboration with global tech leaders, start-ups
and research institutes
Slide 40Slide 40
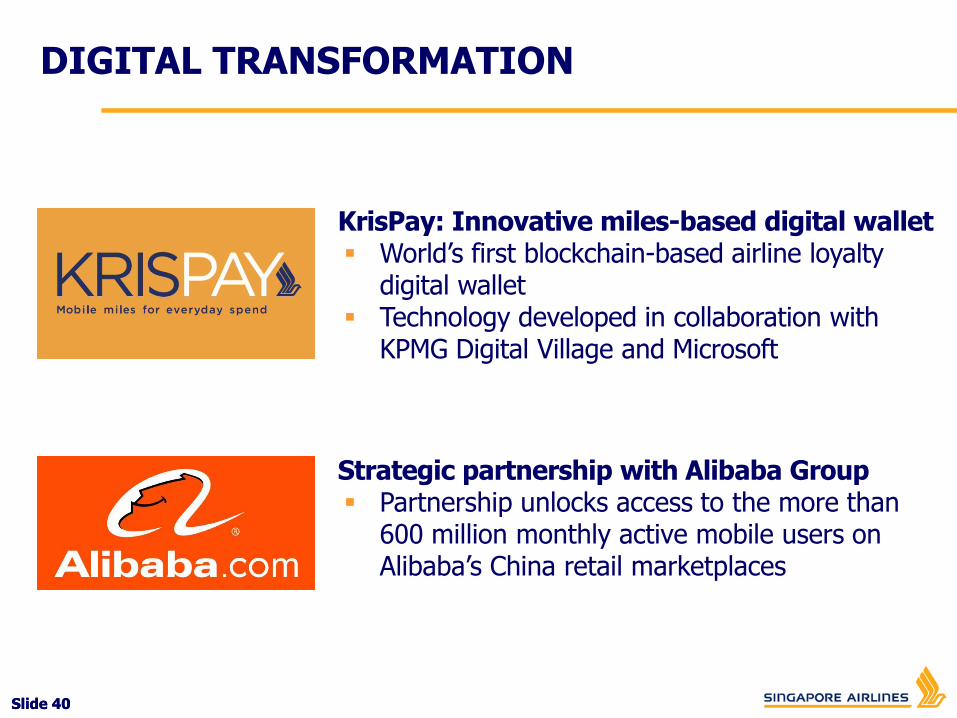
DIGITAL TRANSFORMATION
KrisPay: Innovative miles-based digital wallet World’s first blockchain-based airline loyalty
digital wallet Technology developed in collaboration with
KPMG Digital Village and Microsoft
Strategic partnership with Alibaba Group Partnership unlocks access to the more than
600 million monthly active mobile users on Alibaba’s China retail marketplaces
Slide 41Slide 41
TRANSFORMATION
Slide 42Slide 42
Transforming Customer Experience
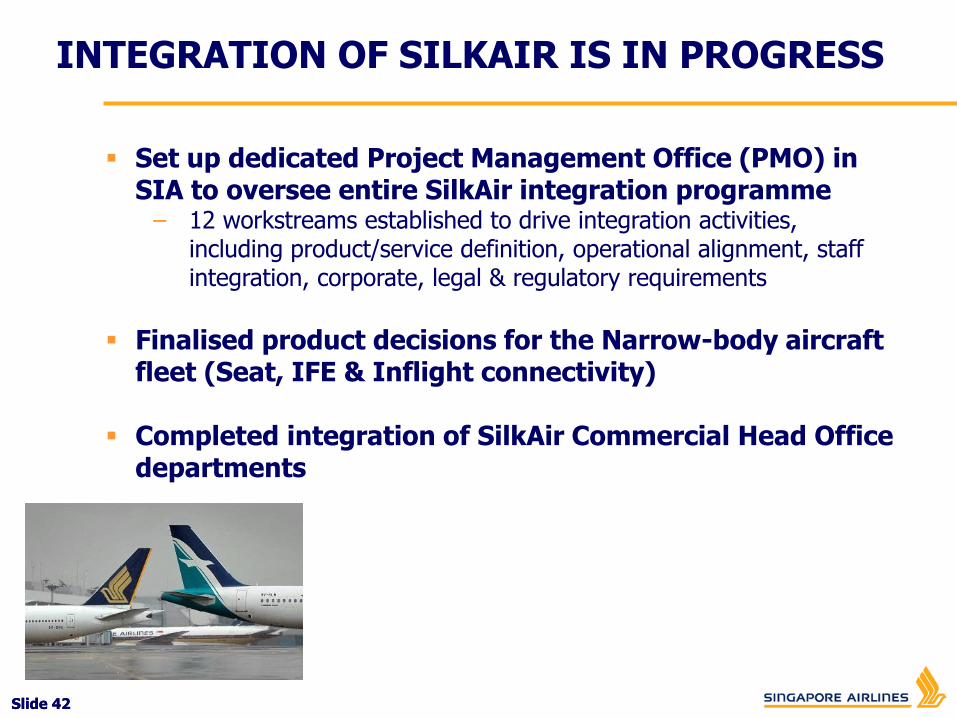
Set up dedicated Project Management Office (PMO) in SIA to oversee entire SilkAir integration programme
– 12 workstreams established to drive integration activities, including product/service definition, operational alignment, staff integration, corporate, legal & regulatory requirements
Finalised product decisions for the Narrow-body aircraft fleet (Seat, IFE & Inflight connectivity)
Completed integration of SilkAir Commercial Head Office departments
INTEGRATION OF SILKAIR IS IN PROGRESS
Slide 43Slide 43
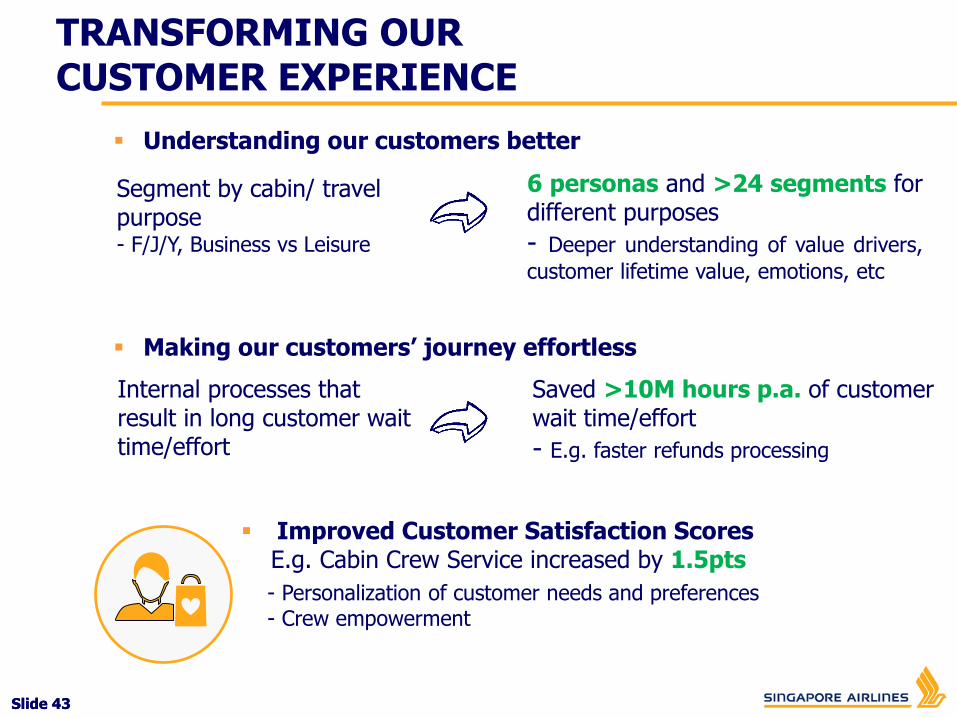
Transforming Customer Experience
Understanding our customers better
Segment by cabin/ travel purpose- F/J/Y, Business vs Leisure
Saved >10M hours p.a. of customer wait time/effort
- E.g. faster refunds processing
Making our customers’ journey effortless
Internal processes that result in long customer wait time/effort
Improved Customer Satisfaction ScoresE.g. Cabin Crew Service increased by 1.5pts
- Personalization of customer needs and preferences - Crew empowerment
6 personas and >24 segments fordifferent purposes
- Deeper understanding of value drivers,
customer lifetime value, emotions, etc
TRANSFORMING OUR CUSTOMER EXPERIENCE
Slide 44Slide 44
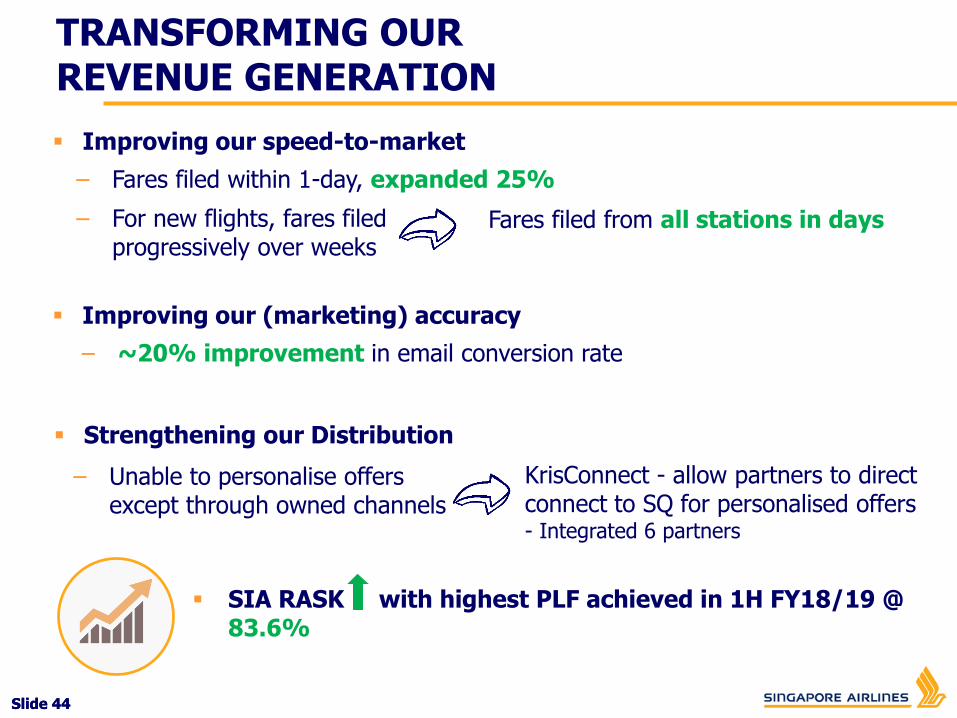
Fares filed from all stations in days
Improving our speed-to-market
Strengthening our Distribution
Improving our (marketing) accuracy
– For new flights, fares filed progressively over weeks
– Unable to personalise offers except through owned channels
KrisConnect - allow partners to direct connect to SQ for personalised offers - Integrated 6 partners
– ~20% improvement in email conversion rate
– Fares filed within 1-day, expanded 25%
SIA RASK with highest PLF achieved in 1H FY18/19 @ 83.6%
TRANSFORMING OUR REVENUE GENERATION
Slide 45Slide 45
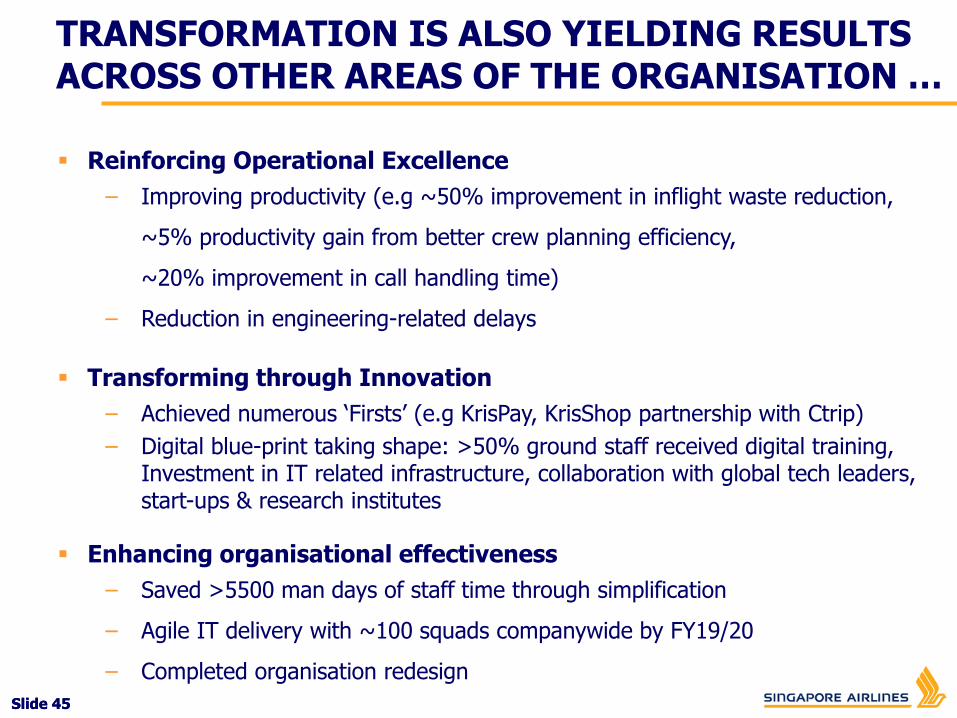
Reinforcing Operational Excellence
– Improving productivity (e.g ~50% improvement in inflight waste reduction,
~5% productivity gain from better crew planning efficiency,
~20% improvement in call handling time)
– Reduction in engineering-related delays
Transforming through Innovation
– Achieved numerous ‘Firsts’ (e.g KrisPay, KrisShop partnership with Ctrip)
– Digital blue-print taking shape: >50% ground staff received digital training, Investment in IT related infrastructure, collaboration with global tech leaders, start-ups & research institutes
Enhancing organisational effectiveness
– Saved >5500 man days of staff time through simplification
– Agile IT delivery with ~100 squads companywide by FY19/20
– Completed organisation redesign
TRANSFORMATION IS ALSO YIELDING RESULTS ACROSS OTHER AREAS OF THE ORGANISATION …
Slide 46Slide 46
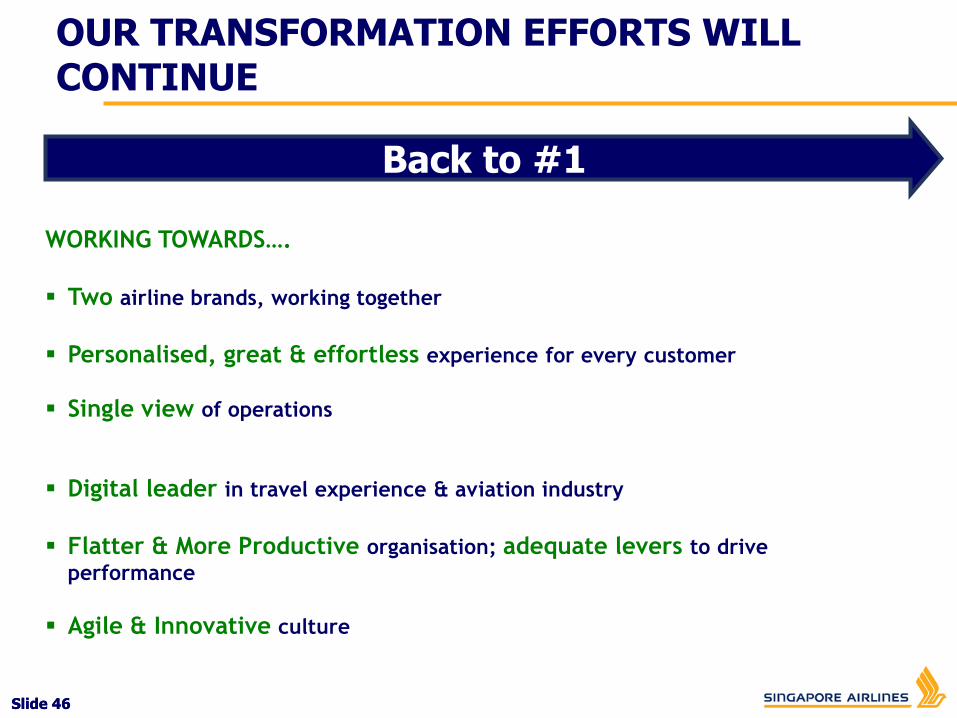
Transforming Customer Experience OUR TRANSFORMATION EFFORTS WILL CONTINUE
WORKING TOWARDS….
Two airline brands, working together
Personalised, great & effortless experience for every customer
Single view of operations
Digital leader in travel experience & aviation industry
Flatter & More Productive organisation; adequate levers to drive
performance
Agile & Innovative culture
Back to #1
Slide 47Slide 47
THANK YOU
![[FIFTH]SIXTH AMENDED AND RESTATED CERTIFICATE OF ... · Amended and Restated Certificate of Incorporation”). SEVENTH. This Sixth Amended and Restated Certificate of Incorporation](https://img.pdfslide.us/doc/110x75/5fe29d2b7a9b0944530b4233/fifthsixth-amended-and-restated-certificate-of-amended-and-restated-certificate.jpg)