Embed Size (px)
Citation preview

Korea
David EdwardsCEO & President
Korea
2
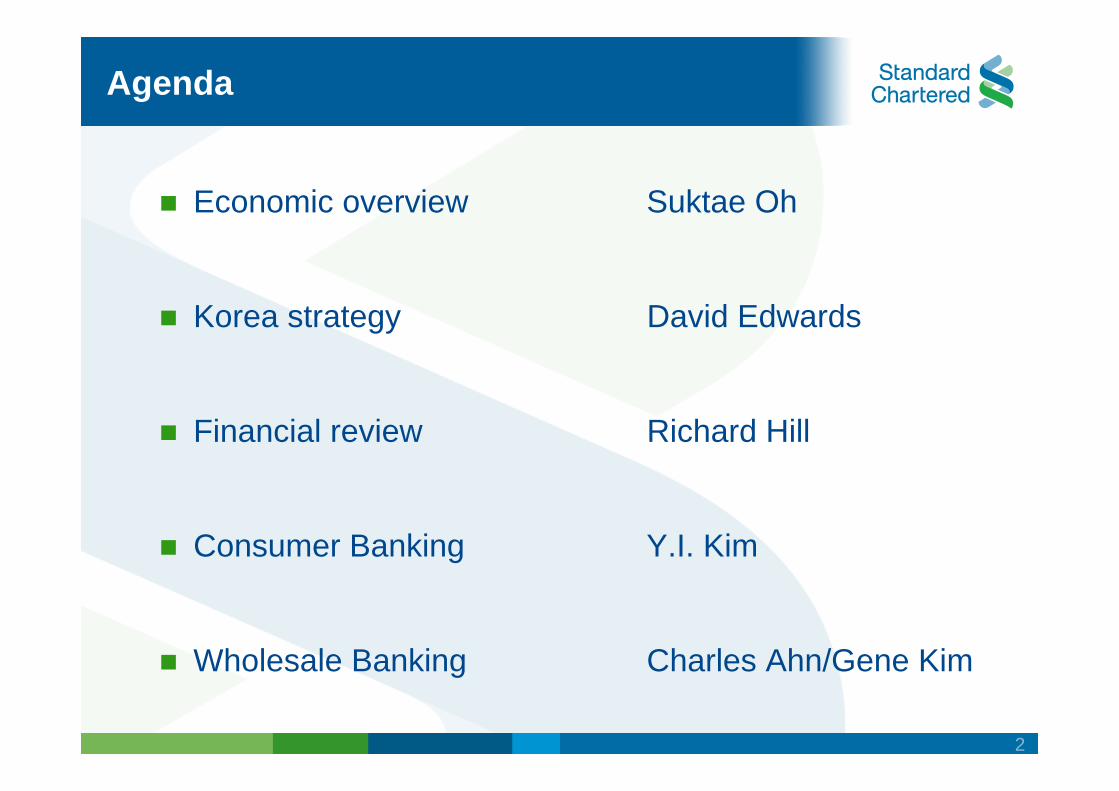
Agenda
Economic overview Suktae Oh
Korea strategy David Edwards
Financial review Richard Hill
Consumer Banking Y.I. Kim
Wholesale Banking Charles Ahn/Gene Kim

Korean economy
Suktae OhSenior Economist
4
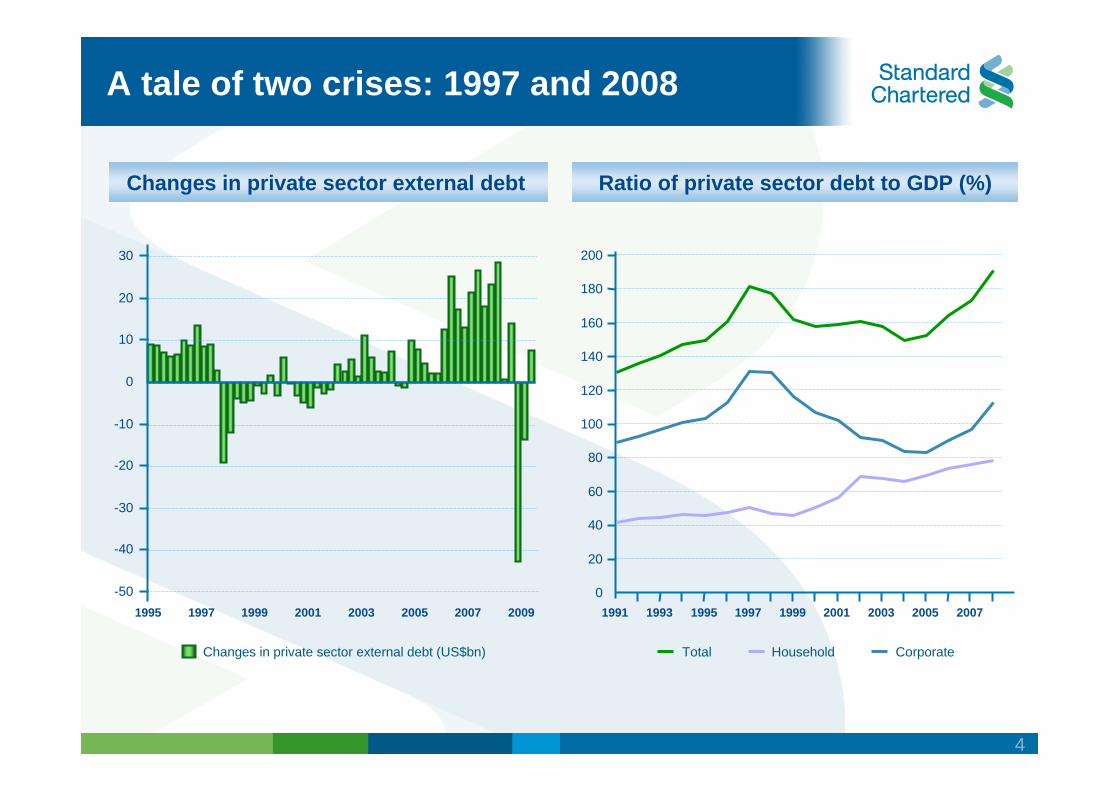
A tale of two crises: 1997 and 2008
Changes in private sector external debt Ratio of private sector debt to GDP (%)
1995 1997 1999 2001 2003 2005 2007 2009
Changes in private sector external debt (US$bn)
-50
-40
-30
-20
-10
0
10
20
30
0
20
40
60
80
100
120
140
160
180
200
1991 1993 1995 1997 1999 2001 2003 2005 2007
Total Household Corporate
5
What’s different between the two crises?
Regional (Asian) crisis vs. global crisis
Korean authorities were better prepared in 2008Large FX reserves, bilateral swap with major countries
The deficit in balance of paymentsCurrent account deficit in 1995-97 Equity capital outflow in 2006-08
6
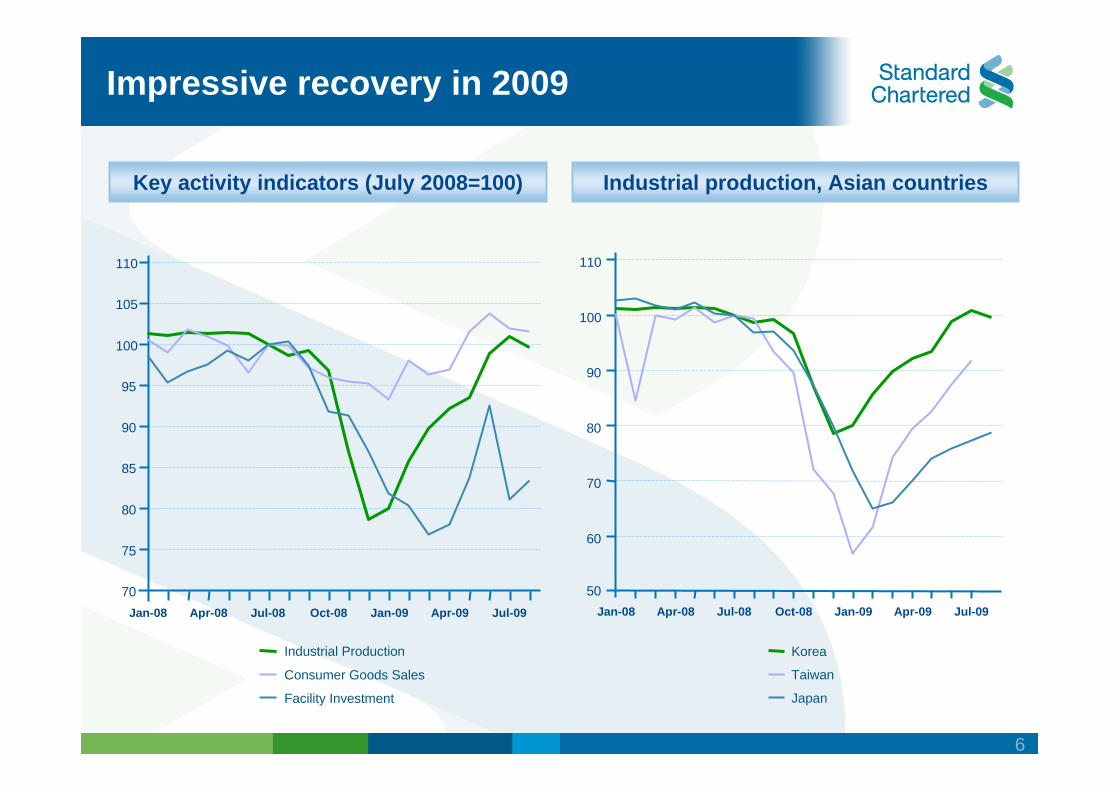
Impressive recovery in 2009
Key activity indicators (July 2008=100) Industrial production, Asian countries
70
75
80
85
90
95
100
105
110
Jan-08 Apr-08 Jul-08 Oct-08 Jan-09 Apr-09 Jul-09
Industrial Production
Consumer Goods Sales
Facility Investment
50
60
70
80
90
100
110
Jan-08 Apr-08 Jul-08 Oct-08 Jan-09 Apr-09 Jul-09
Korea
Taiwan
Japan
7
Factors behind strong recovery
Export competitivenessNot just an exchange rate story
Effective policiesMonetary and fiscal stimulusEmergency FX liquidity supports, roll-over of SME loan
Resilient private sectorImpressive strength of consumer and business sentiment

8
Three key assumptions for 2010
Recovery in developed economies
Cautious exit strategies
Mild deleveraging of private sector
9
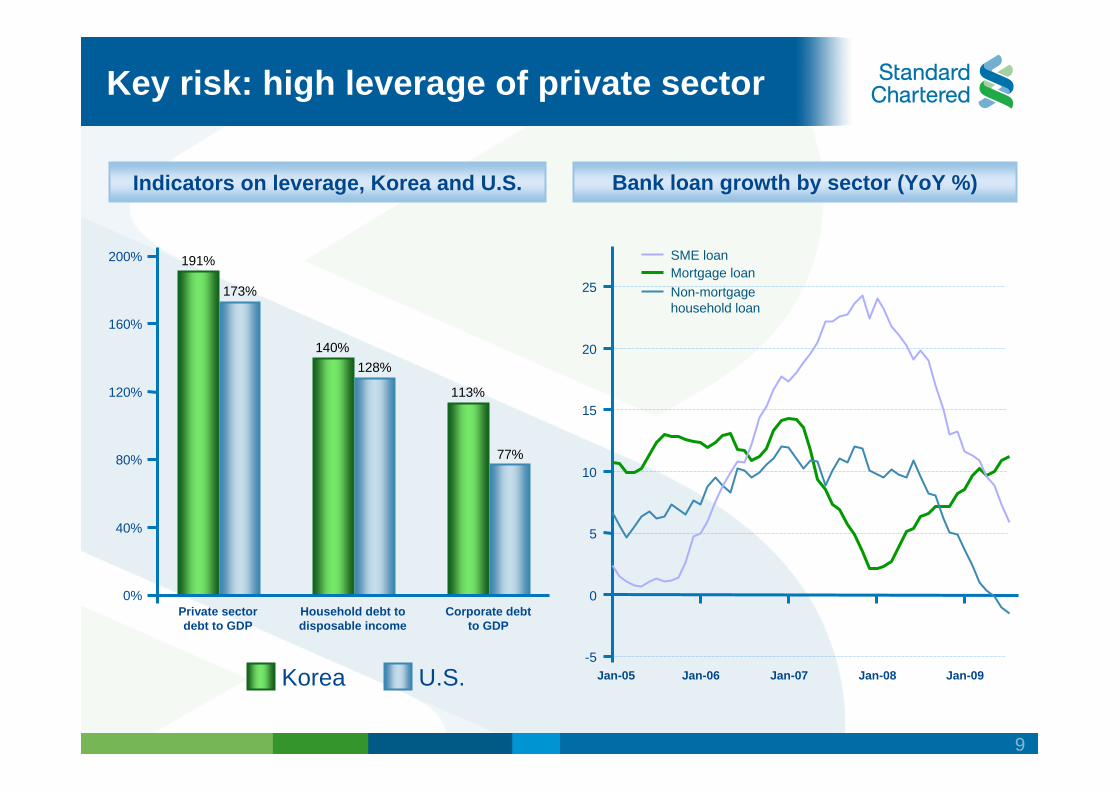
Key risk: high leverage of private sector
Indicators on leverage, Korea and U.S. Bank loan growth by sector (YoY %)
191%
140%
113%
173%
128%
77%
0%
40%
80%
120%
160%
200%
Private sectordebt to GDP
Household debt todisposable income
Corporate debtto GDP
Korea U.S.-5
0
5
10
15
20
25
Jan-05 Jan-06 Jan-07 Jan-08 Jan-09
Mortgage loanNon-mortgagehousehold loan
SME loan
10
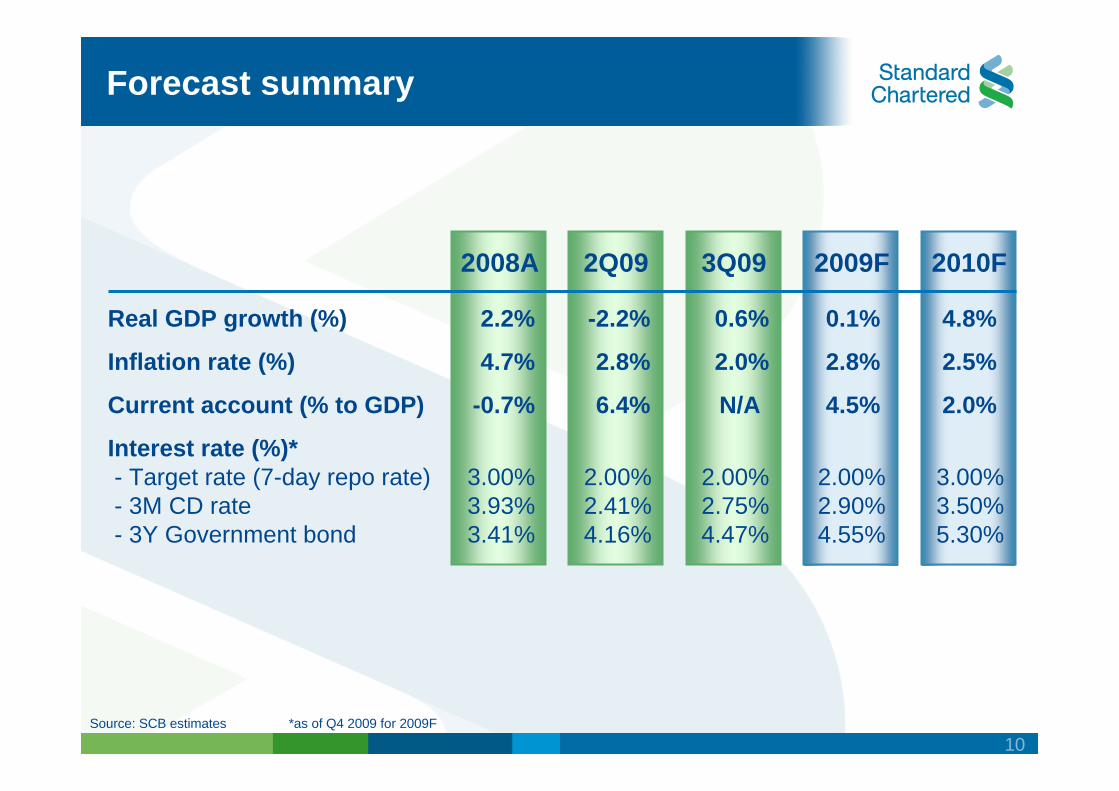
Forecast summary
Source: SCB estimates *as of Q4 2009 for 2009F
Real GDP growth (%)
Inflation rate (%)
Current account (% to GDP)
Interest rate (%)*- Target rate (7-day repo rate)- 3M CD rate- 3Y Government bond
2.2%
4.7%
-0.7%
3.00%3.93%3.41%
-2.2%
2.8%
6.4%
2.00%2.41%4.16%
0.6%
2.0%
N/A
2.00%2.75%4.47%
0.1%
2.8%
4.5%
2.00%2.90%4.55%
4.8%
2.5%
2.0%
3.00%3.50%5.30%
2008A 2Q09 3Q09 2009F 2010F

Korea
David EdwardsCEO & President
Korea
12
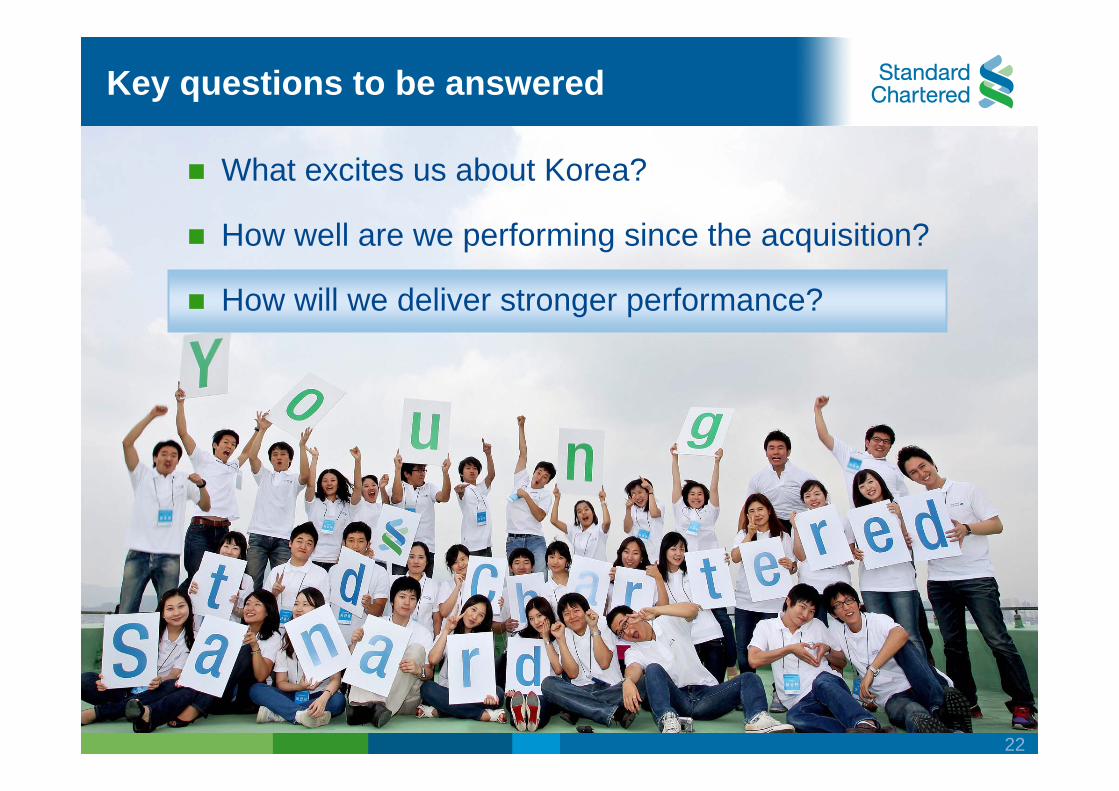
What excites us about Korea?
How well are we performing since the acquisition?
How will we deliver stronger performance?
Key questions to be answered
13
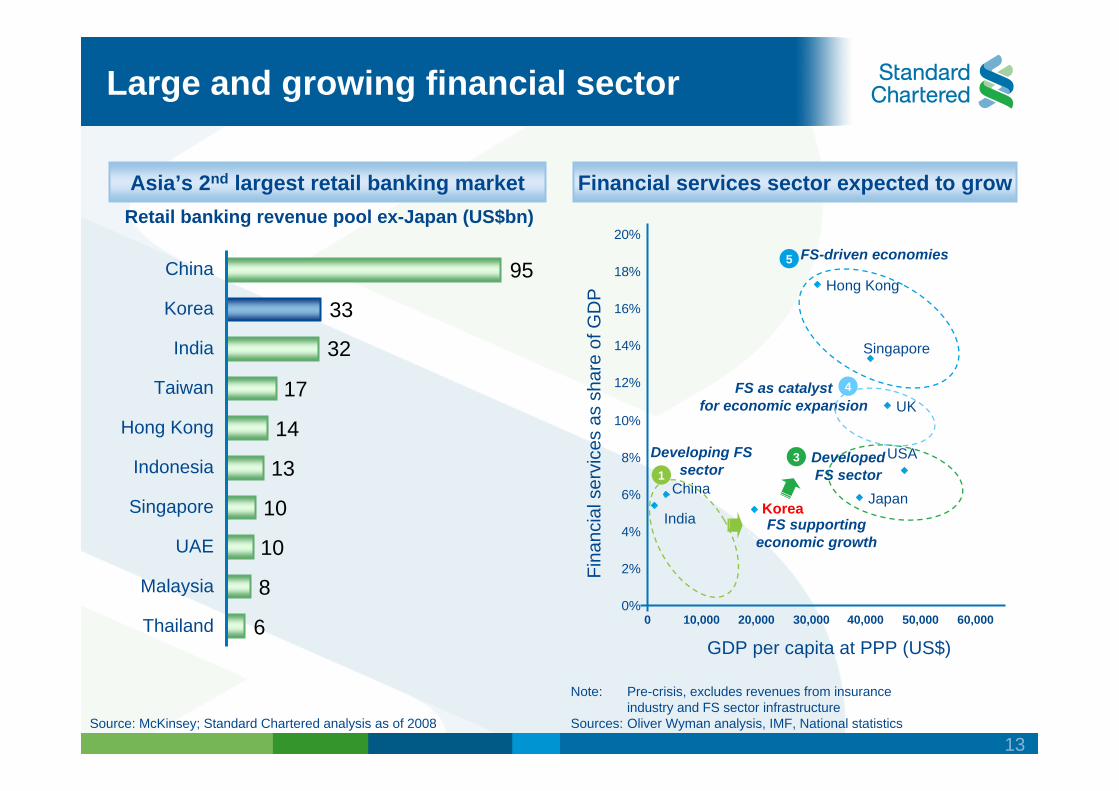
Asia’s 2nd largest retail banking market Financial services sector expected to grow
Large and growing financial sector
Source: McKinsey; Standard Chartered analysis as of 2008
UAE
Malaysia
Thailand
Singapore
Indonesia
India
Hong Kong
Taiwan
Korea
China
Retail banking revenue pool ex-Japan (US$bn)
Note: Pre-crisis, excludes revenues from insuranceindustry and FS sector infrastructure
Sources: Oliver Wyman analysis, IMF, National statistics
GDP per capita at PPP (US$)
Fina
ncia
l ser
vice
s as
sha
re o
f GD
P
Developing FS sector
FS as catalyst for economic expansion
FS-driven economies
Developed FS sector
FS supporting economic growth
3
2
4
5
1
6
8
10
10
13
14
17
32
33
95Hong Kong
UK
USA
Korea Japan
Singapore
India
China
0%
2%
4%
6%
8%
10%
12%
14%
16%
18%
20%
0 10,000 20,000 30,000 40,000 50,000 60,000
14
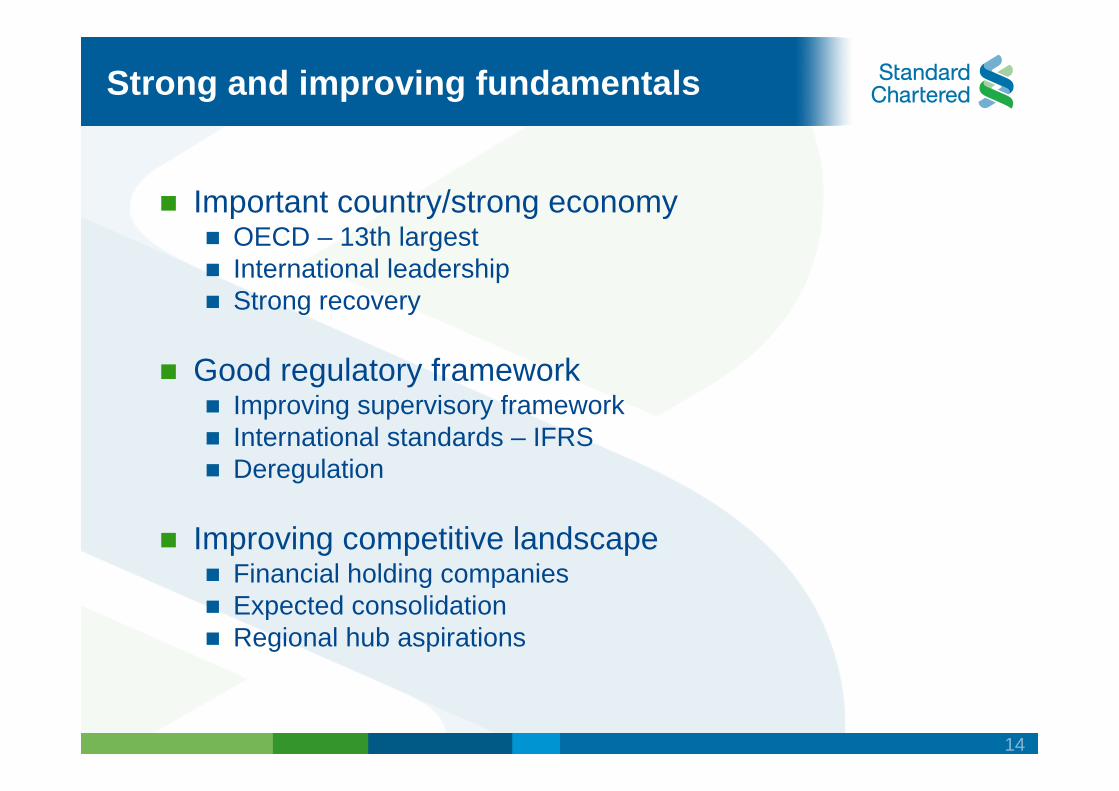
Strong and improving fundamentals
Important country/strong economyOECD – 13th largestInternational leadershipStrong recovery
Good regulatory frameworkImproving supervisory frameworkInternational standards – IFRS Deregulation
Improving competitive landscapeFinancial holding companiesExpected consolidationRegional hub aspirations
15
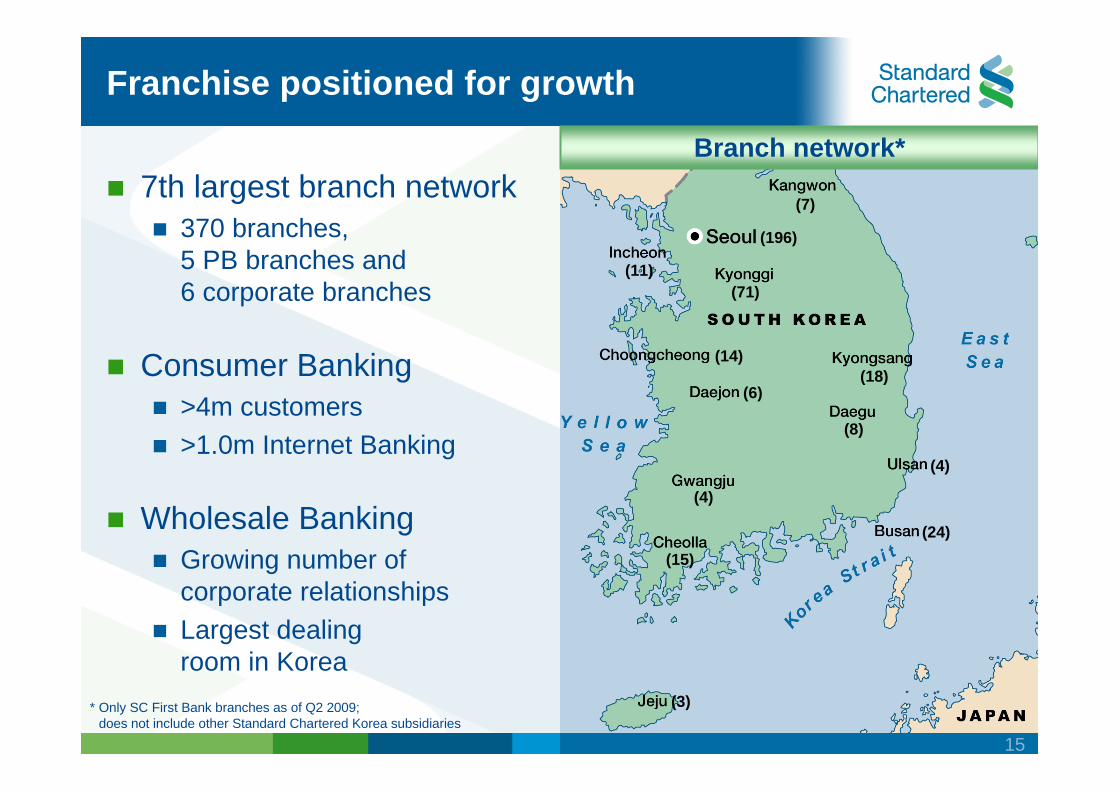
Franchise positioned for growth
7th largest branch network370 branches,5 PB branches and6 corporate branches
Consumer Banking>4m customers>1.0m Internet Banking
Wholesale BankingGrowing number ofcorporate relationshipsLargest dealingroom in Korea
* Only SC First Bank branches as of Q2 2009;does not include other Standard Chartered Korea subsidiaries
Branch network*
(7)
(196)
(11)
(14)(18)
(15)
(3)
(71)
(6)
(8)
(24)
(4)
(4)
16
What excites us about Korea?
How well are we performing since the acquisition?
How will we deliver stronger performance?
Key questions to be answered
17
Reflections on the acquisition
Strategically right acquisition at the right time
A challenging integration
Investment critical
18
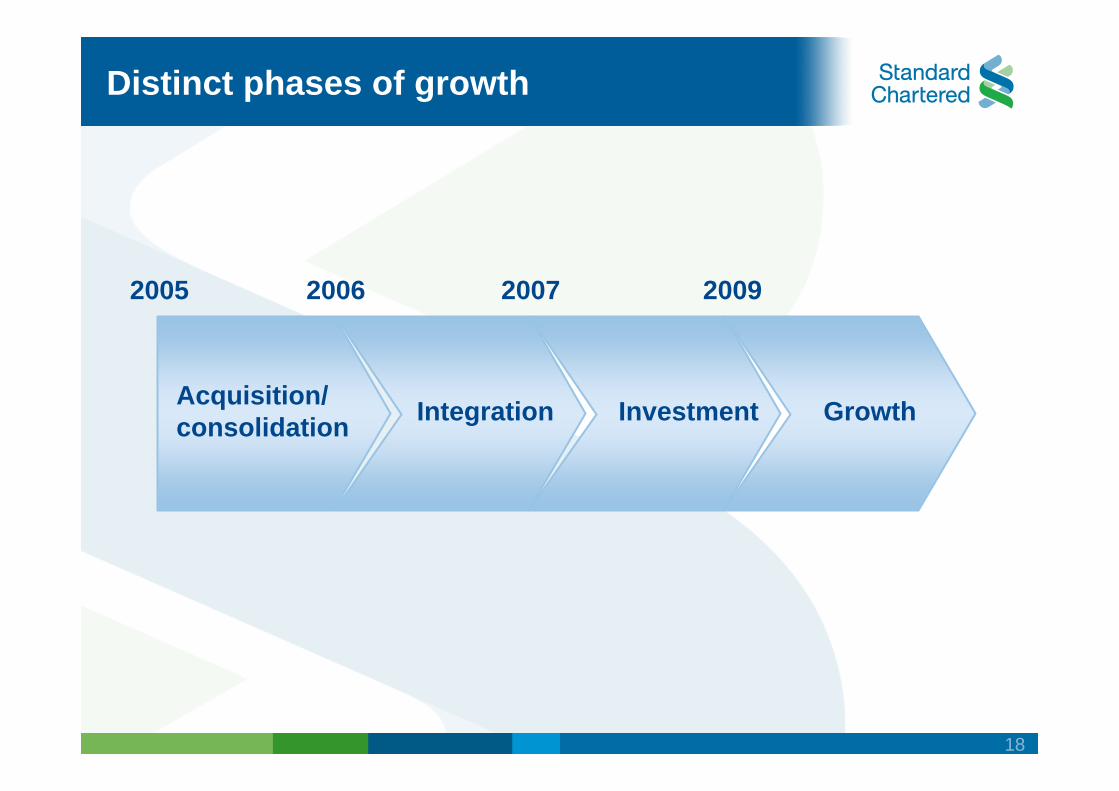
Acquisition/ consolidation Integration Investment Growth
2005 2007 20092006
Distinct phases of growth
19
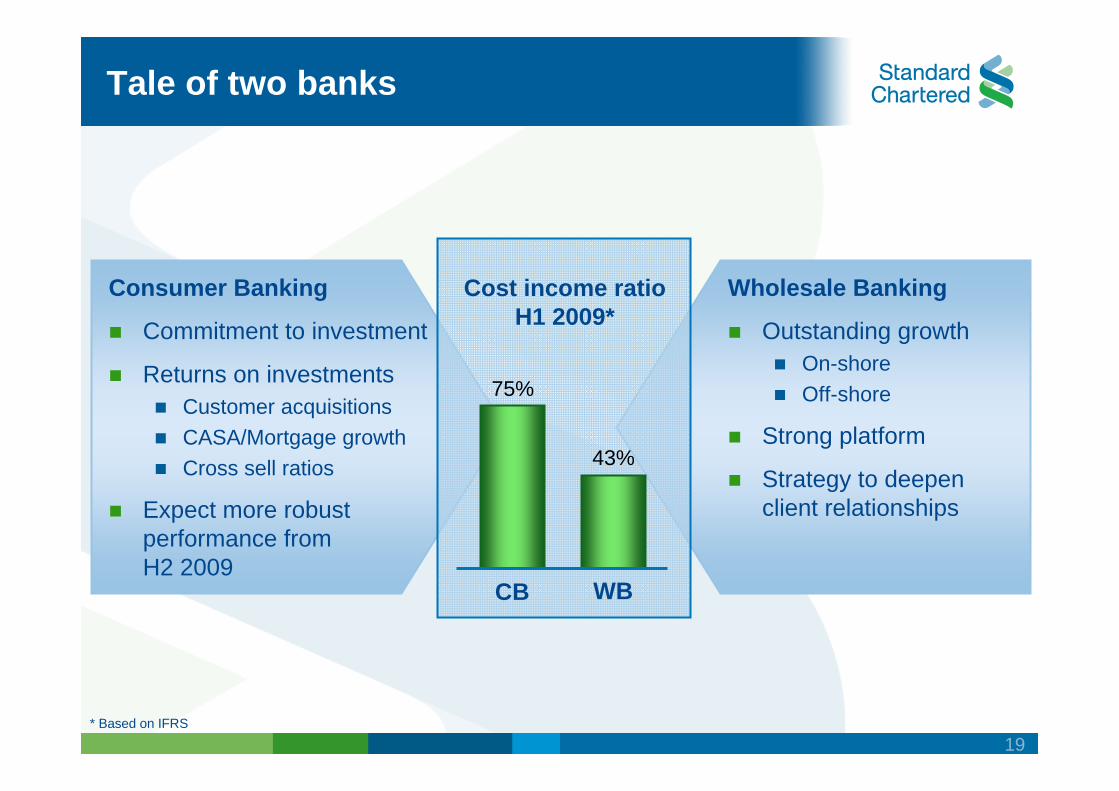
Tale of two banks
Consumer Banking
Commitment to investment
Returns on investmentsCustomer acquisitionsCASA/Mortgage growthCross sell ratios
Expect more robust performance fromH2 2009
Cost income ratioH1 2009*
WBCB
75%
43%
Wholesale Banking
Outstanding growthOn-shoreOff-shore
Strong platform
Strategy to deepen client relationships
* Based on IFRS
20
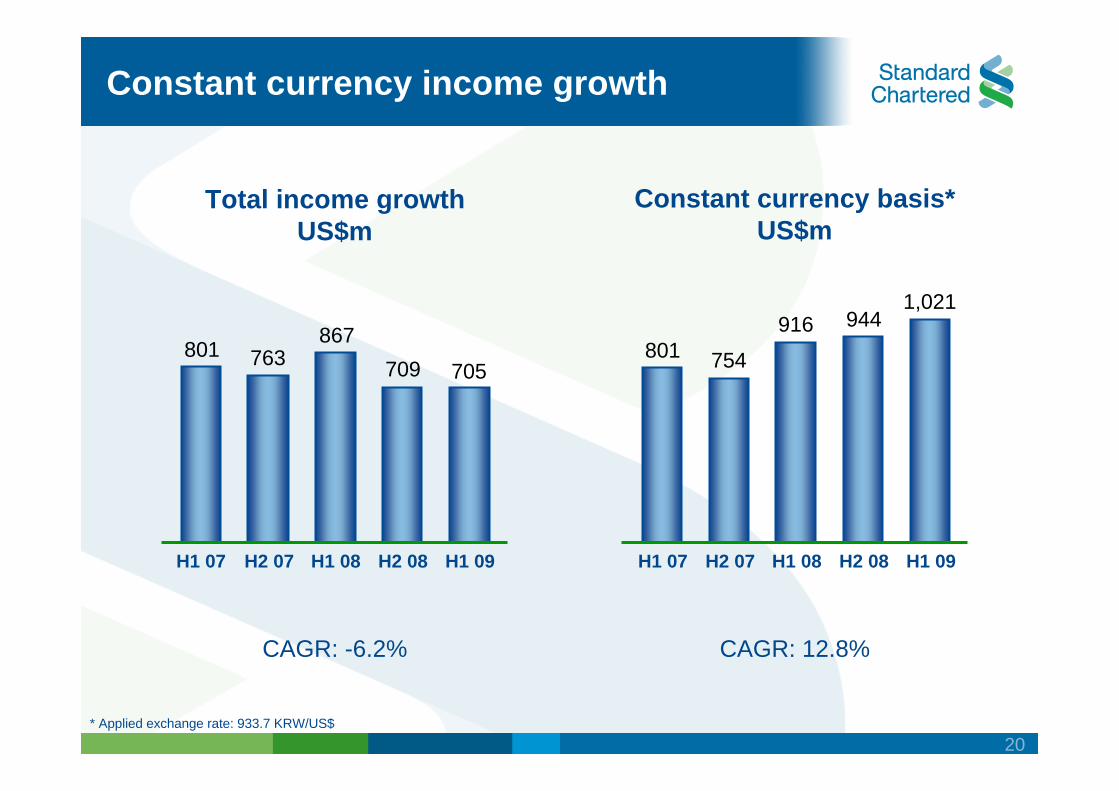
Constant currency income growth
H1 07 H2 07 H1 08 H2 08 H1 09 H1 07 H2 07 H1 08 H2 08 H1 09
Total income growthUS$m
Constant currency basis*US$m
CAGR: -6.2%
801 763867
709 705801 754
916 9441,021
* Applied exchange rate: 933.7 KRW/US$
CAGR: 12.8%
21
External factors improving
Recovery of KRW
Increasing interest rates
Loan impairments bottoming out
22
What excites us about Korea?
How well are we performing since the acquisition?
How will we deliver stronger performance?
Key questions to be answered
23
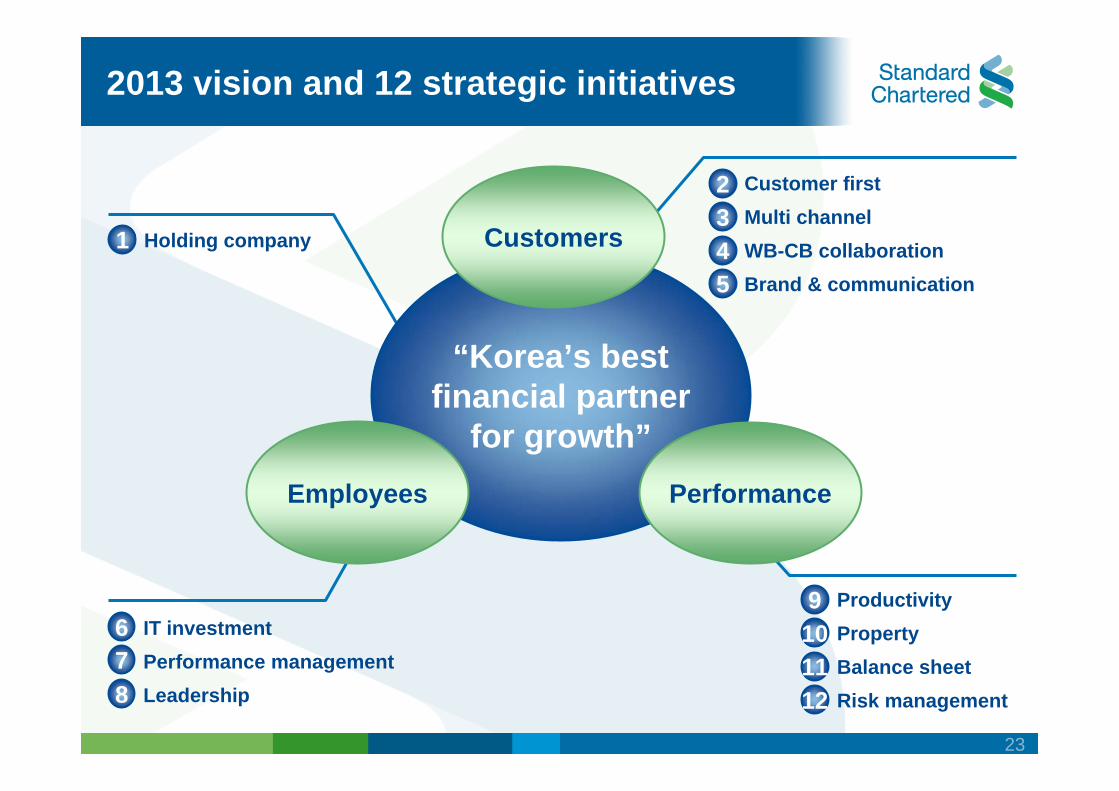
2013 vision and 12 strategic initiatives
ProductivityPropertyBalance sheetRisk management
Performance
“Korea’s best financial partner
for growth”
Customers1
9101112
Employees
Holding company
Customer firstMulti channelWB-CB collaboration Brand & communication
2345
IT investmentPerformance managementLeadership
678
24
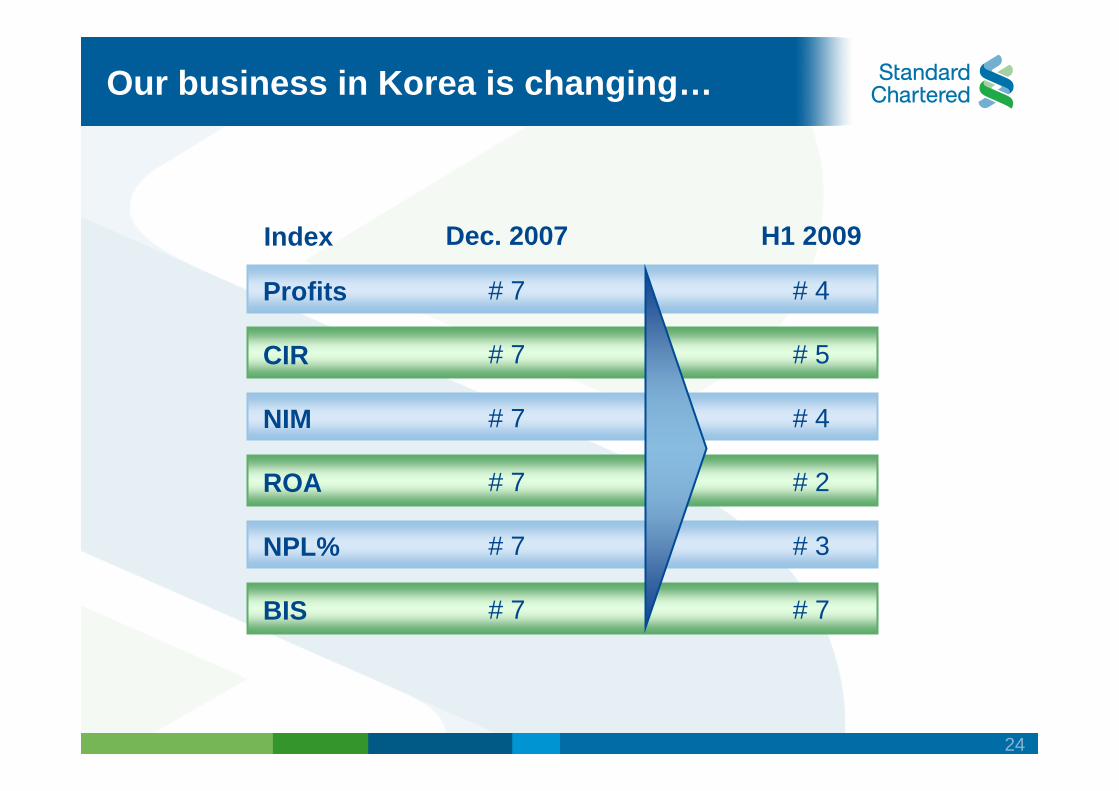
Profits
CIR
NIM
ROA
NPL%
BIS
Index
# 7
# 7
# 7
# 7
# 7
# 7
Dec. 2007
# 4
# 5
# 4
# 2
# 3
# 7
Our business in Korea is changing…
H1 2009
25
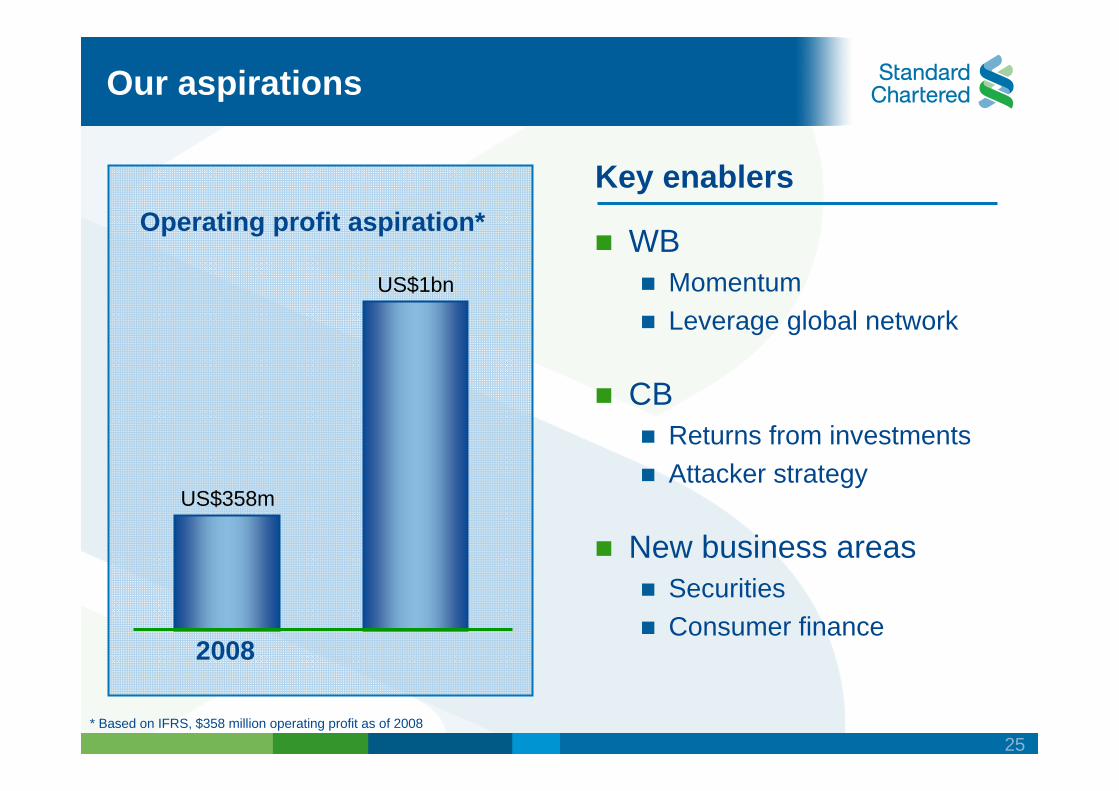
US$358m
US$1bn
Operating profit aspiration*Key enablers
WBMomentumLeverage global network
CBReturns from investmentsAttacker strategy
New business areasSecuritiesConsumer finance
* Based on IFRS, $358 million operating profit as of 2008
2008
Our aspirations

26
Q & A

Financial performance
Richard HillCFO and Head of Strategy
28
Creating the platform for growth
Stronger and more liquid balance sheet
Tight cost control
Disciplined re-investment
Performance momentum building
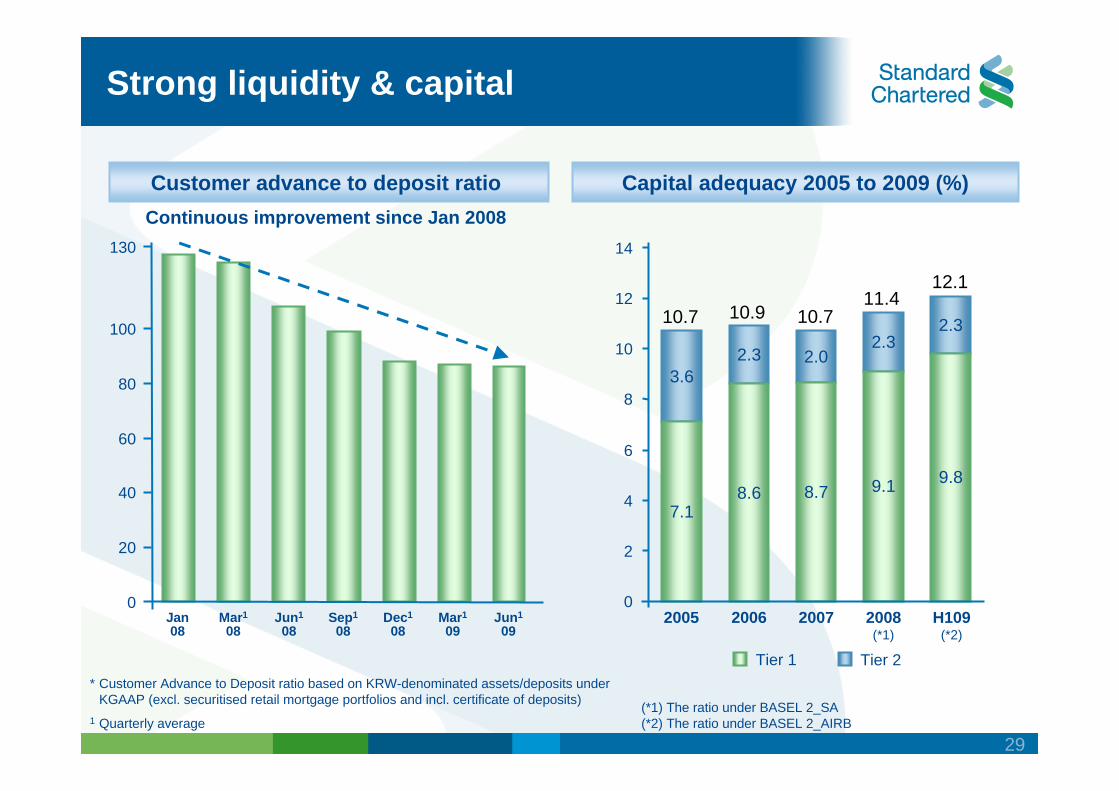
29
Capital adequacy 2005 to 2009 (%)Customer advance to deposit ratio
* Customer Advance to Deposit ratio based on KRW-denominated assets/deposits under KGAAP (excl. securitised retail mortgage portfolios and incl. certificate of deposits)
1 Quarterly average(*1) The ratio under BASEL 2_SA(*2) The ratio under BASEL 2_AIRB
Strong liquidity & capital
Continuous improvement since Jan 2008
Tier 2Tier 1
0
20
40
60
80
100
130
Mar1
08Jun1
08Sep1
08Dec1
08Mar1
09Jun1
09Jan 08
3.62.3 2.0
2.32.3
0
2
4
6
8
10
12
14
10.910.7 10.711.4
12.1
7.18.6 8.7 9.1 9.8
2005 2006 2007 2008(*1)
H109(*2)
30
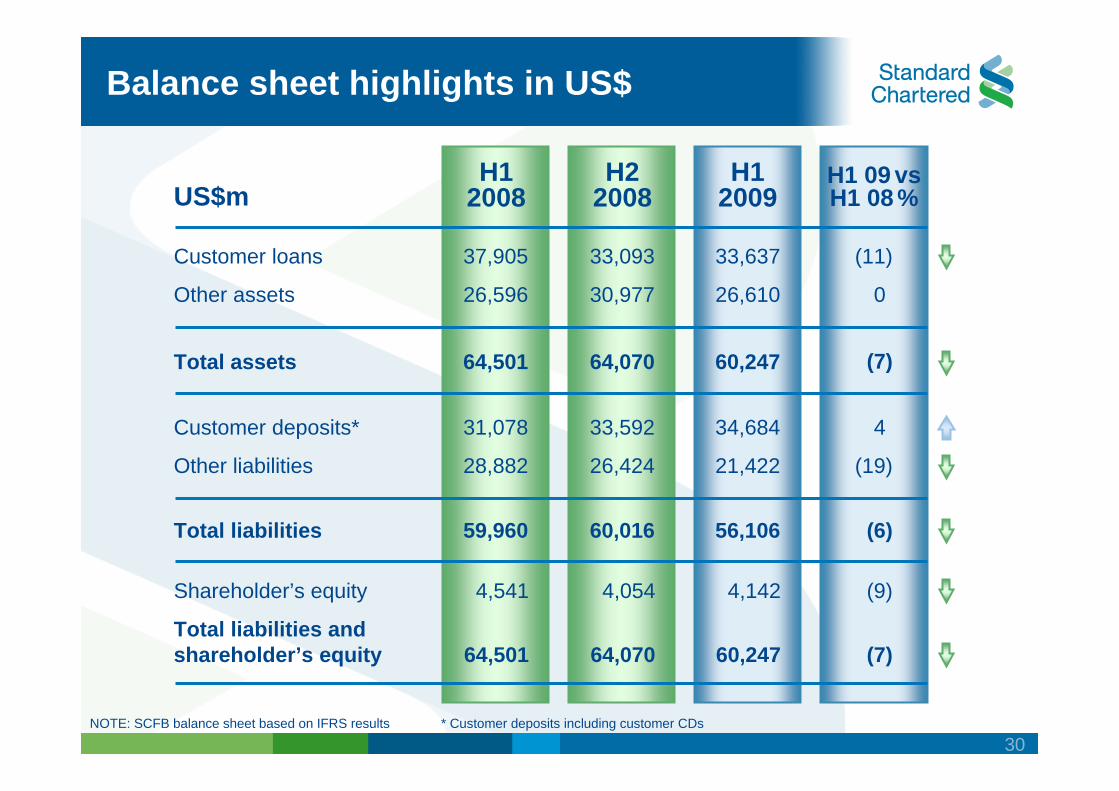
Balance sheet highlights in US$
US$m
Customer loans
Other assets
H1 2008
H1 09 vs H1 08 %
Customer deposits*
Other liabilities
H2 2008
H1 2009
NOTE: SCFB balance sheet based on IFRS results * Customer deposits including customer CDs
37,905
26,596
31,078
28,882
Total assets 64,501
Total liabilities
Shareholder’s equity
Total liabilities andshareholder’s equity
59,960
4,541
64,501
33,592
26,424
64,070
60,016
4,054
64,070
34,684
21,422
60,247
56,106
4,142
60,247
4
(19)
(7)
(6)
(9)
(7)
33,093
30,977
33,637
26,610
(11)
0
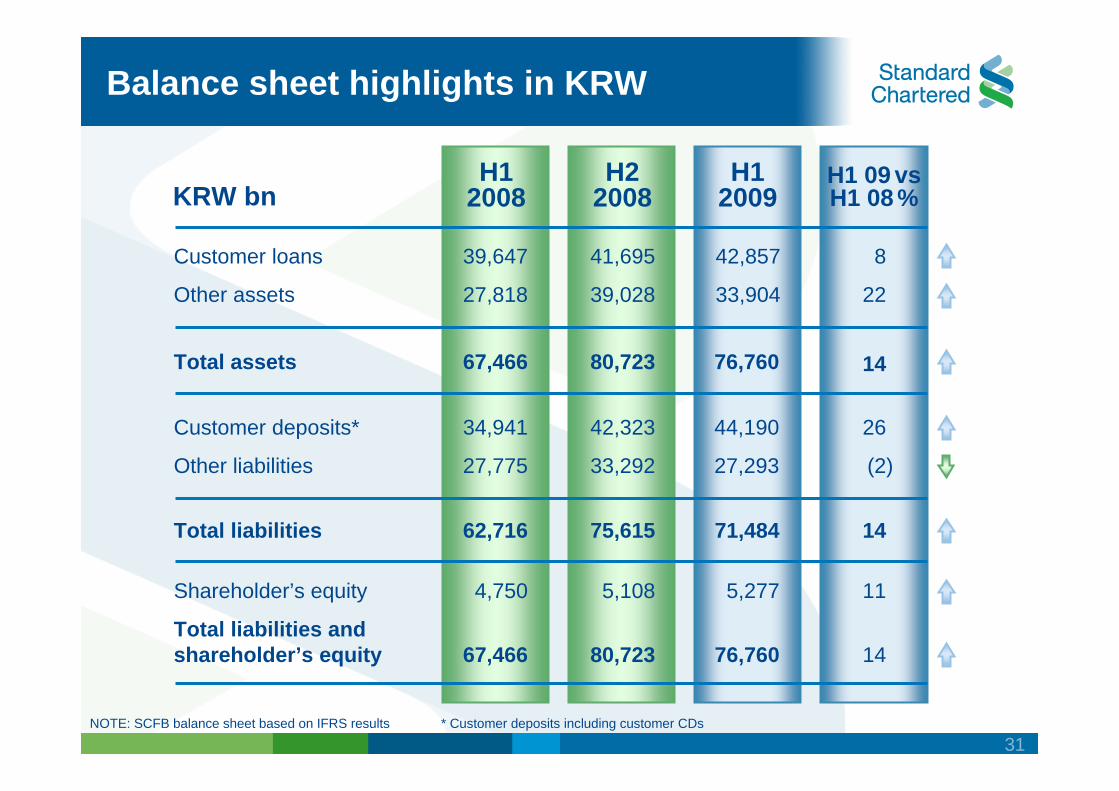
31
Customer loans
Other assets
H1 2008
H1 09 vs H1 08 %
Customer deposits*
Other liabilities
H2 2008
H1 2009
Total assets
Total liabilities
Shareholder’s equity
Total liabilities andshareholder’s equity
Balance sheet highlights in KRW
KRW bn
39,647
27,818
34,941
27,775
67,466
62,716
4,750
67,466
42,323
33,292
80,723
75,615
5,108
80,723
44,190
27,293
76,760
71,484
5,277
76,760
26
(2)
14
14
11
14
41,695
39,028
42,857
33,904
8
22
NOTE: SCFB balance sheet based on IFRS results * Customer deposits including customer CDs
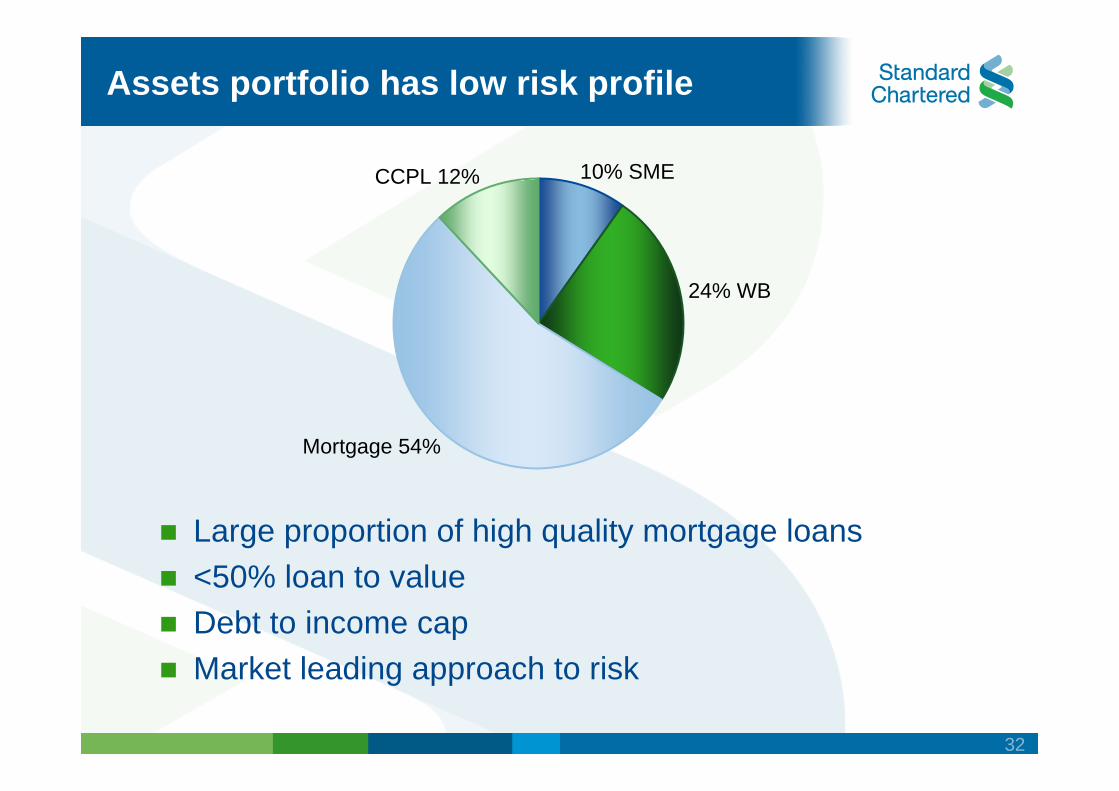
32
Assets portfolio has low risk profile
Large proportion of high quality mortgage loans <50% loan to value Debt to income capMarket leading approach to risk
10% SME
24% WB
Mortgage 54%
CCPL 12%
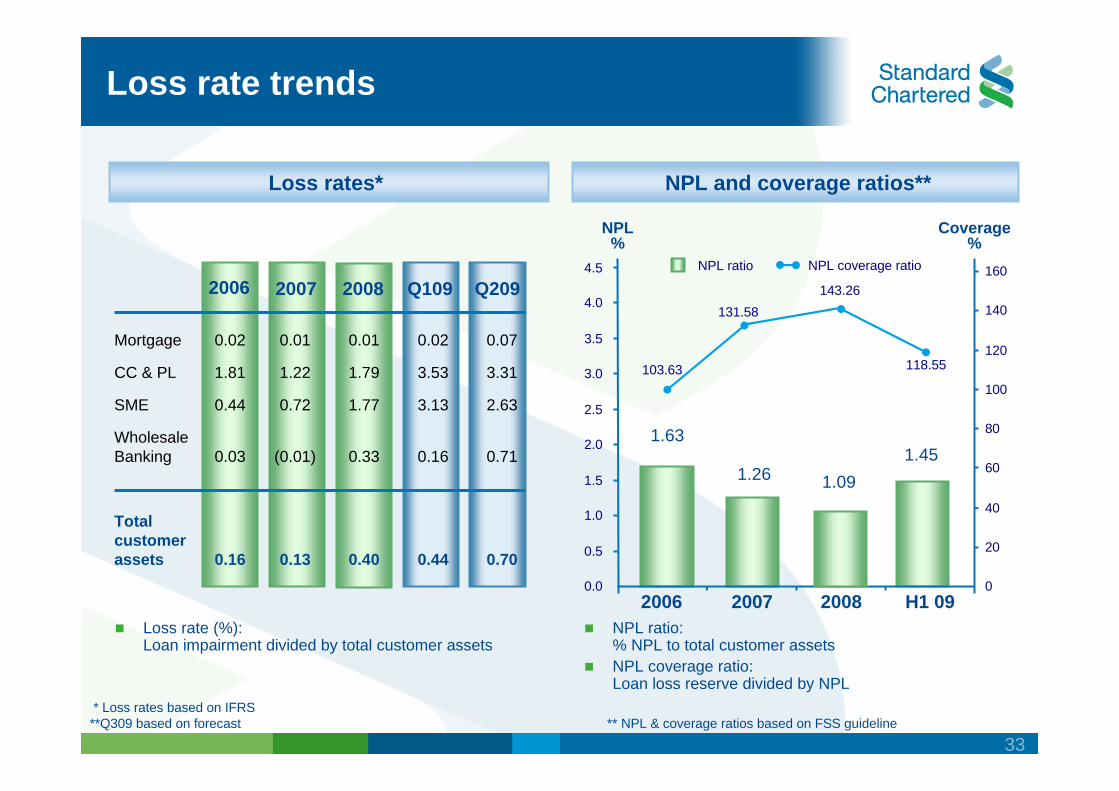
33** NPL & coverage ratios based on FSS guideline
NPL and coverage ratios**Loss rates*
NPL%
Coverage%
* Loss rates based on IFRS**Q309 based on forecast
Loss rate trends
Loss rate (%):Loan impairment divided by total customer assets
NPL ratio:% NPL to total customer assets NPL coverage ratio:Loan loss reserve divided by NPL
1.63
1.261.45
103.63
143.26
0.0
0.5
1.0
1.5
2.0
2.5
3.0
3.5
4.0
4.5
2006 2007 2008 H1 090
20
40
60
80
100
120
140
160NPL ratio NPL coverage ratio
1.09
131.58
118.55
2007 20082006 Q109 Q209
0.02
1.81
0.44
0.03
0.16
0.01
1.22
0.72
(0.01)
0.13
0.01
1.79
1.77
0.33
0.40
0.02
3.53
3.13
0.16
0.44
0.07
3.31
2.63
0.71
0.70
Mortgage
CC & PL
SME
WholesaleBanking
Total customer assets
34
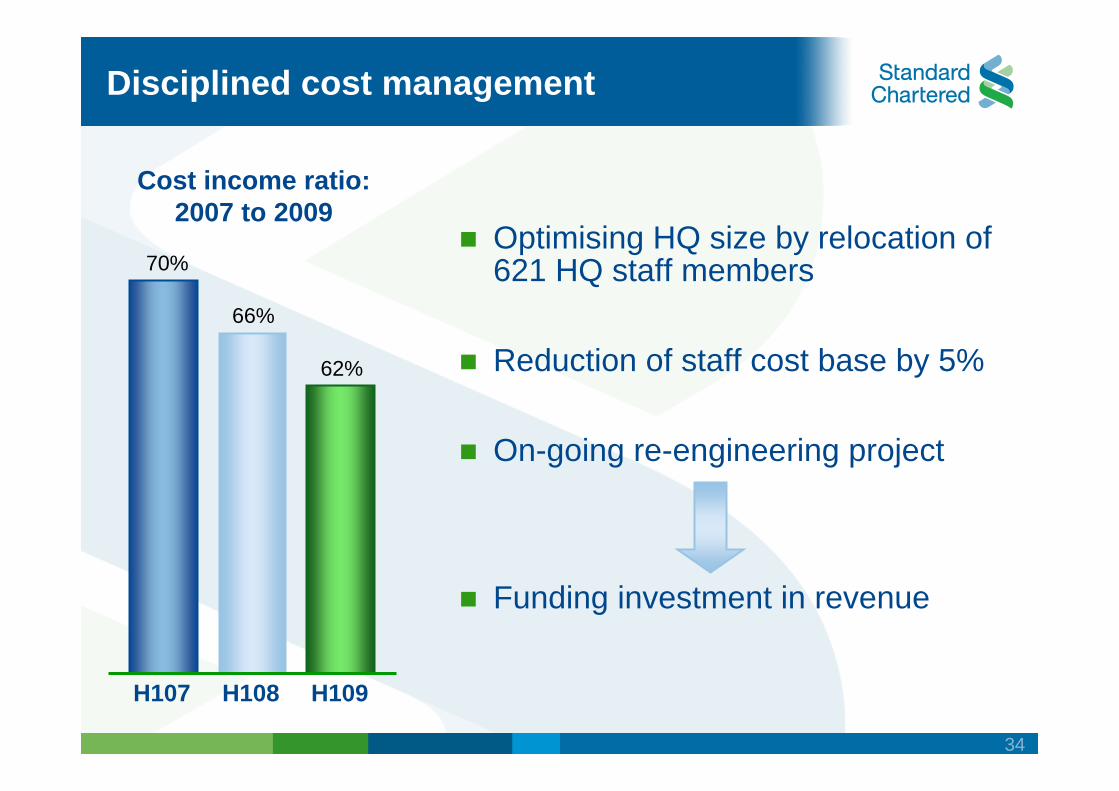
Disciplined cost management
H107
Cost income ratio:2007 to 2009
Optimising HQ size by relocation of 621 HQ staff members
Reduction of staff cost base by 5%
On-going re-engineering project
Funding investment in revenue
H108 H109
70%
66%
62%
35
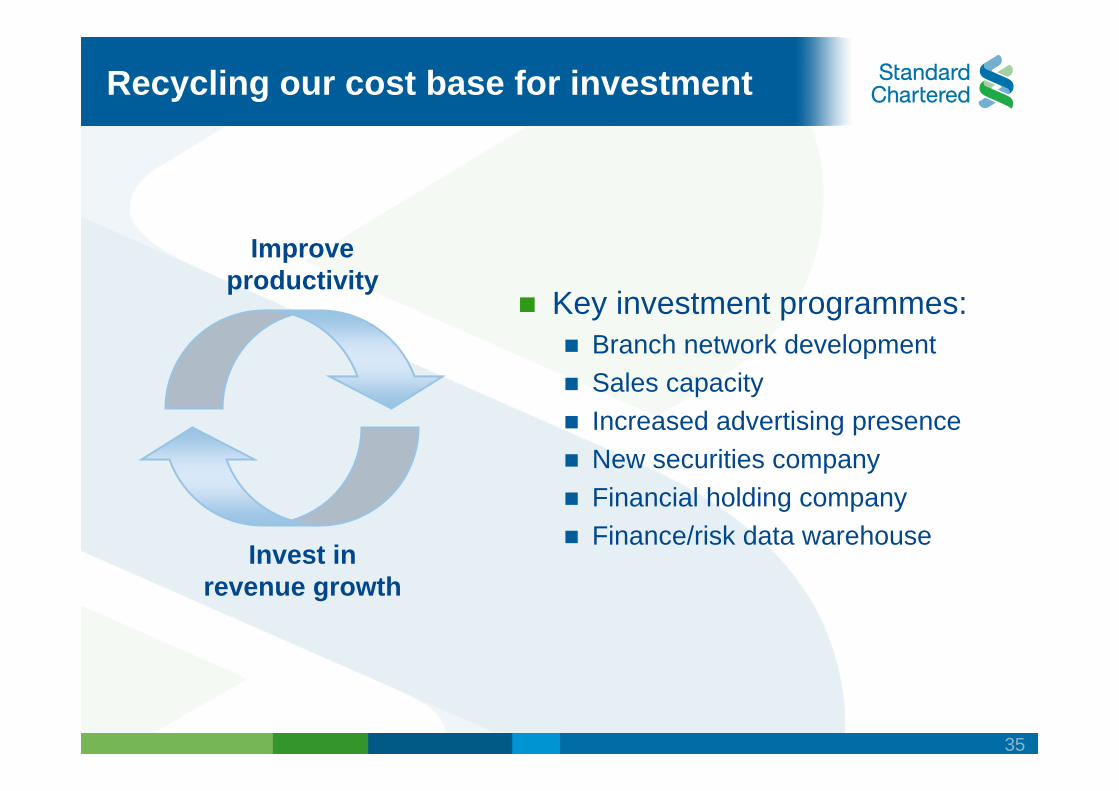
Recycling our cost base for investment
Improveproductivity
Invest inrevenue growth
Key investment programmes:Branch network developmentSales capacityIncreased advertising presenceNew securities companyFinancial holding companyFinance/risk data warehouse
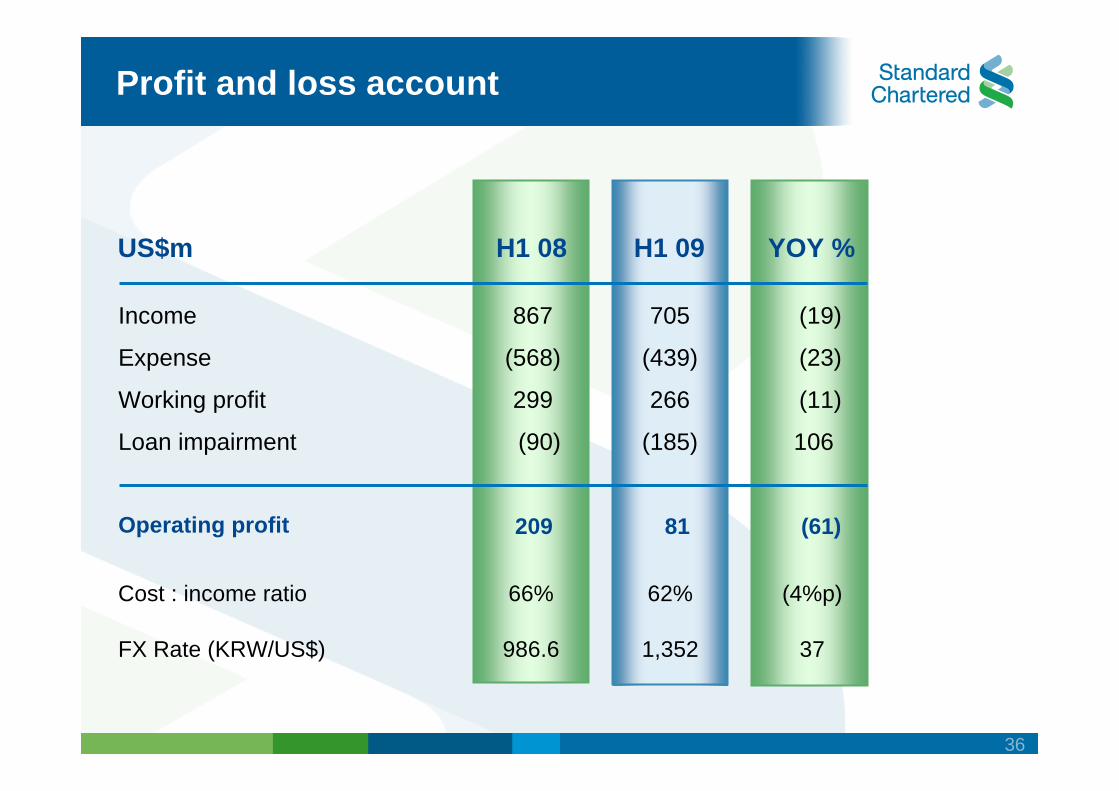
36
US$m H1 09 YOY %H1 08
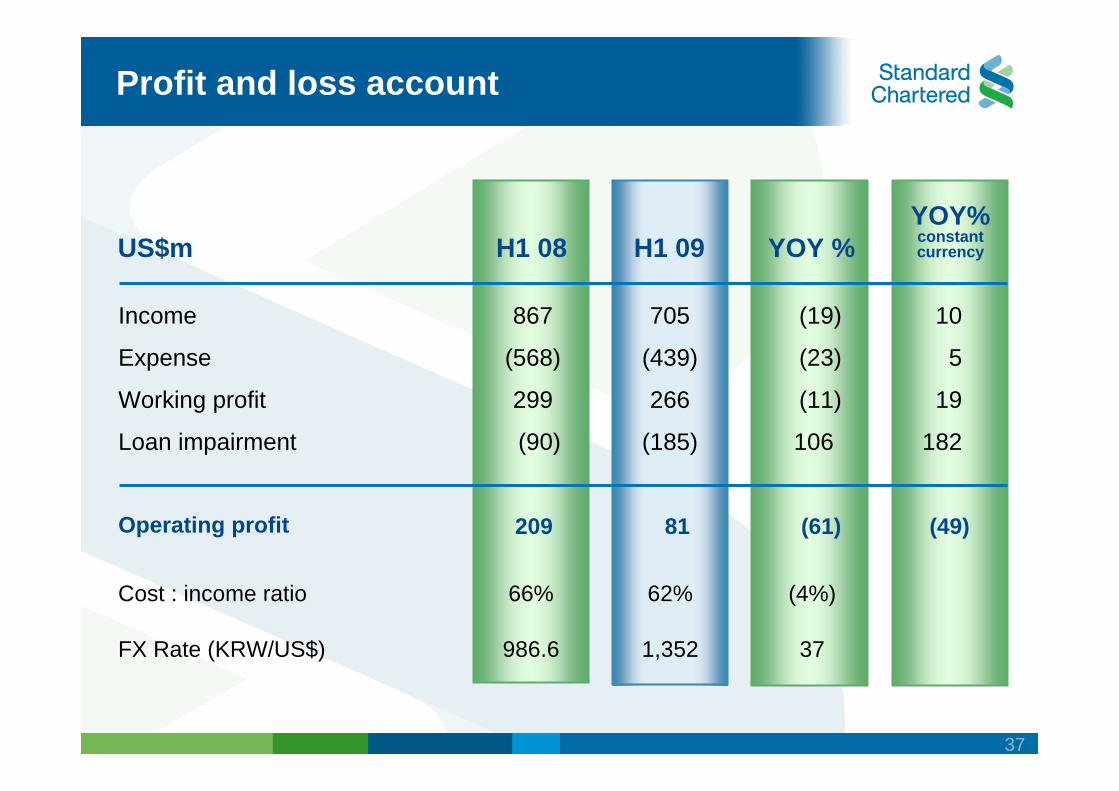
Profit and loss account
867
(568)
299
(90)
209
705
(439)
266
(185)
81
(19)
(23)
(11)
106
(61)
Income
Expense
Working profit
Loan impairment
Operating profit
Cost : income ratio
FX Rate (KRW/US$)
66%
986.6
62%
1,352
(4%p)
37
37
US$m H1 09 YOY %YOY%constant currencyH1 08
10
5
19
182
(49)
Profit and loss account
867
(568)
299
(90)
209
705
(439)
266
(185)
81
(19)
(23)
(11)
106
(61)
Income
Expense
Working profit
Loan impairment
Operating profit
Cost : income ratio
FX Rate (KRW/US$)
66%
986.6
62%
1,352
(4%)
37
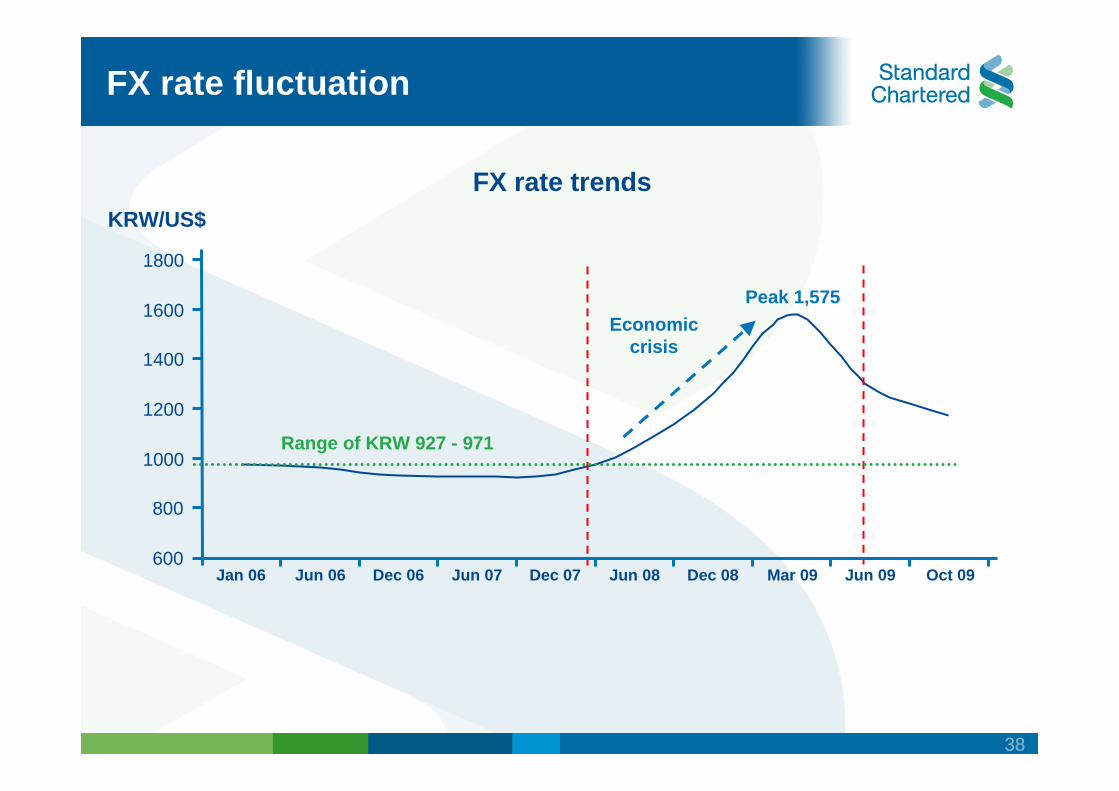
38
FX rate trends
600
800
1000
1200
1400
1600
1800
Jan 06 Jun 06 Dec 06 Jun 07 Dec 07 Jun 08 Dec 08 Mar 09 Jun 09 Oct 09
FX rate fluctuation
Peak 1,575Economic
crisis
Range of KRW 927 - 971
KRW/US$
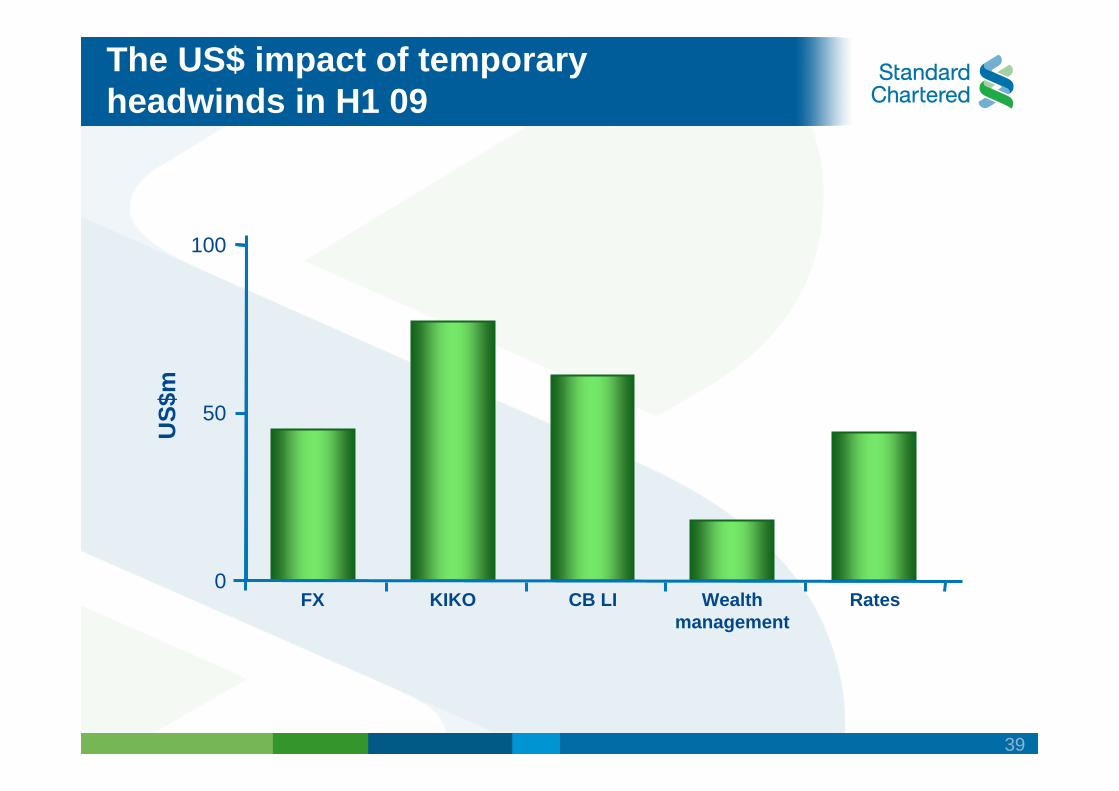
39
The US$ impact of temporaryheadwinds in H1 09
0
50
100
FX KIKO CB LI Wealthmanagement
Rates
US$
m
40
Summary
Stronger and moreliquid balance sheet
Tight cost control
Disciplined re-investment
Performancemomentum building

41
Q & A
Consumer Banking
YI KimHead of Consumer Banking
43
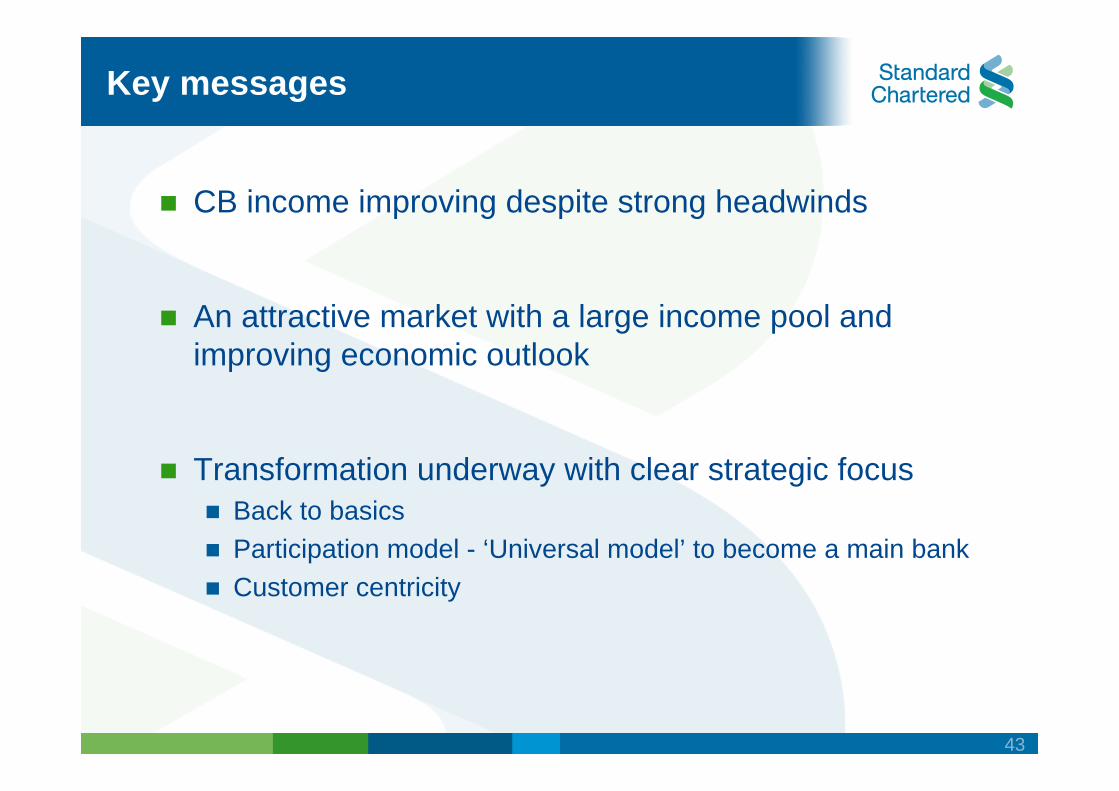
Key messages
CB income improving despite strong headwinds
An attractive market with a large income pool and improving economic outlook
Transformation underway with clear strategic focus Back to basicsParticipation model - ‘Universal model’ to become a main bankCustomer centricity
44
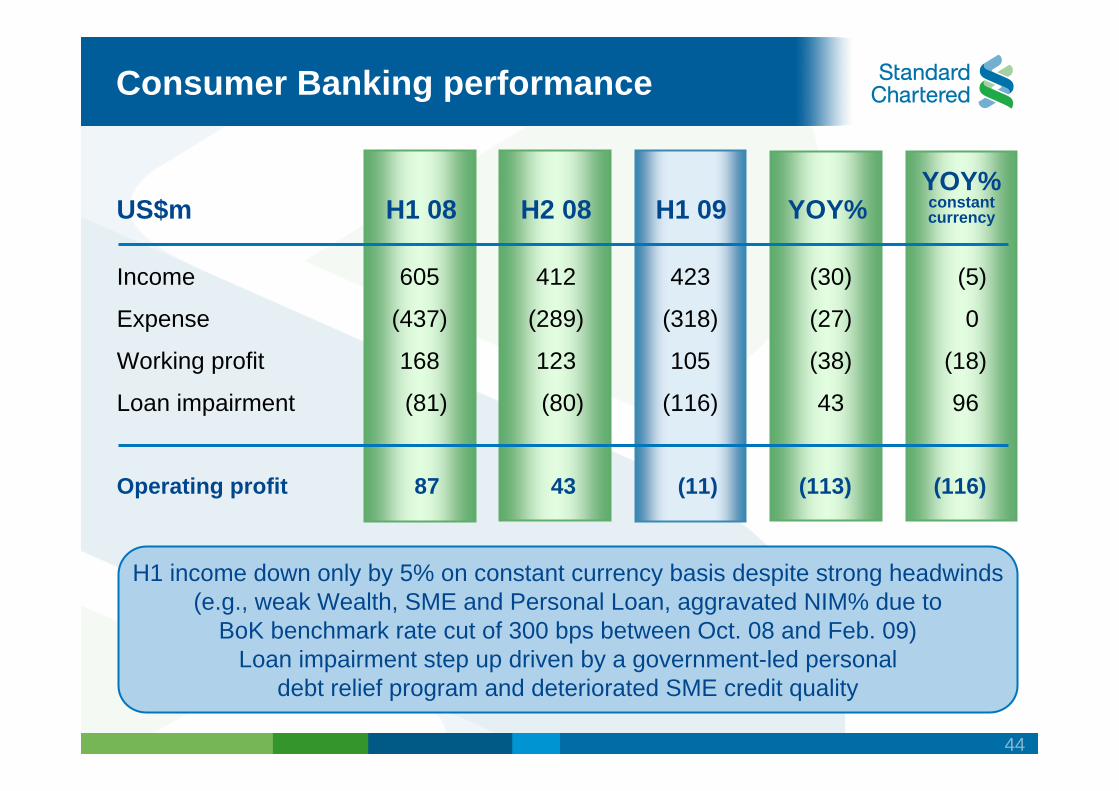
YOY%constant currency
(5)
0
(18)
96
(116)
H2 08
412
(289)
123
(80)
43
H1 09
423
(318)
105
(116)
(11)
YOY%
(30)
(27)
(38)
43
(113)
H1 08
605
(437)
168
(81)
87
US$m
Consumer Banking performance
H1 income down only by 5% on constant currency basis despite strong headwinds(e.g., weak Wealth, SME and Personal Loan, aggravated NIM% due to
BoK benchmark rate cut of 300 bps between Oct. 08 and Feb. 09)Loan impairment step up driven by a government-led personal
debt relief program and deteriorated SME credit quality
Income
Expense
Working profit
Loan impairment
Operating profit
45
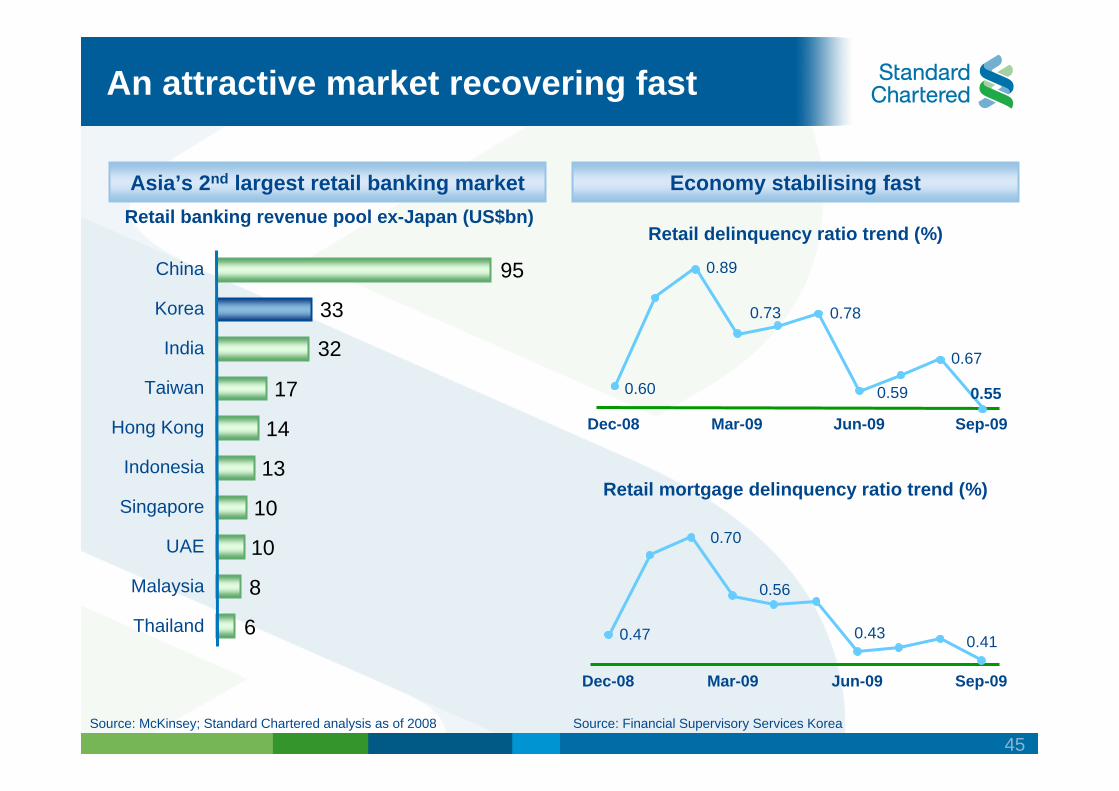
An attractive market recovering fast
Source: Financial Supervisory Services Korea
Retail delinquency ratio trend (%)
Retail mortgage delinquency ratio trend (%)
Asia’s 2nd largest retail banking market
UAE
Malaysia
Thailand
Singapore
Indonesia
India
Hong Kong
Taiwan
Korea
China
Retail banking revenue pool ex-Japan (US$bn)
6
8
10
10
13
14
17
32
33
95
Economy stabilising fast
0.60
0.89
0.78
0.59
0.67
0.73
0.55
Dec-08 Mar-09 Jun-09 Sep-09
0.47
0.70
0.56
0.410.43
Dec-08 Mar-09 Jun-09 Sep-09
Source: McKinsey; Standard Chartered analysis as of 2008
46
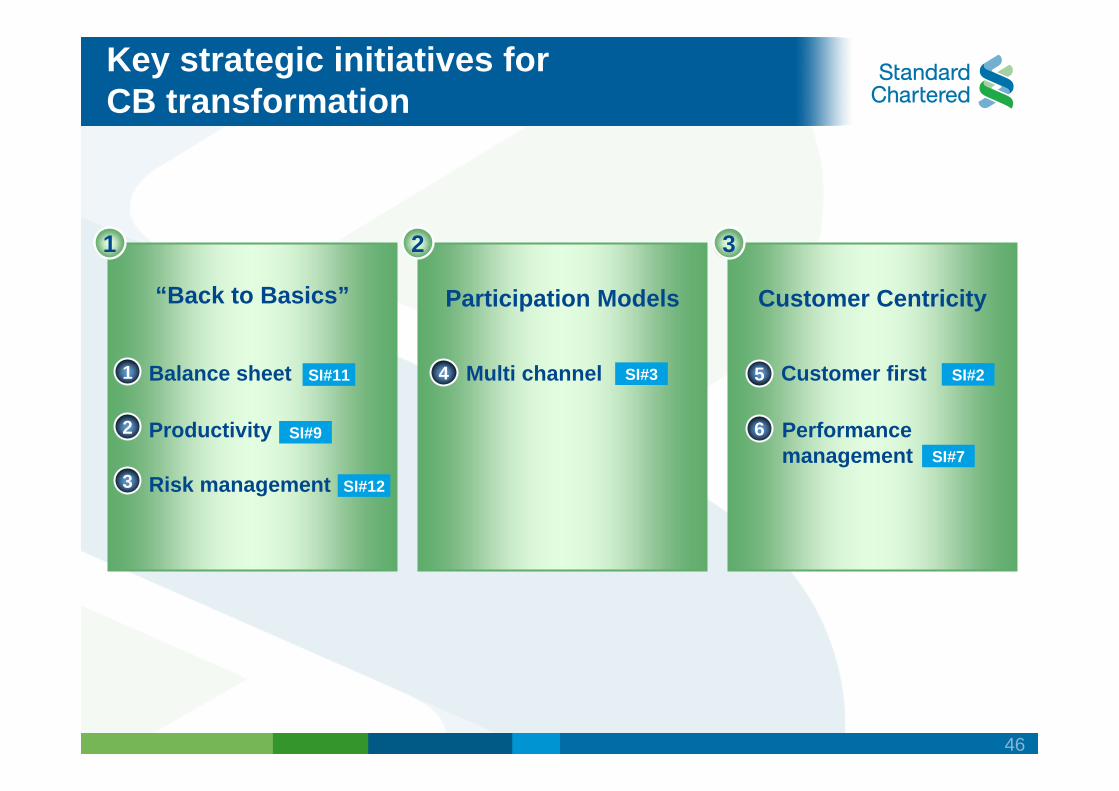
Key strategic initiatives forCB transformation
Participation Models Customer Centricity“Back to Basics”
1 2 3
1
2
3
SI#11
SI#9
SI#12
Balance sheet
Productivity
Risk management
4 SI#3Multi channel 5 Customer first
6
SI#2
SI#7Performance management
47
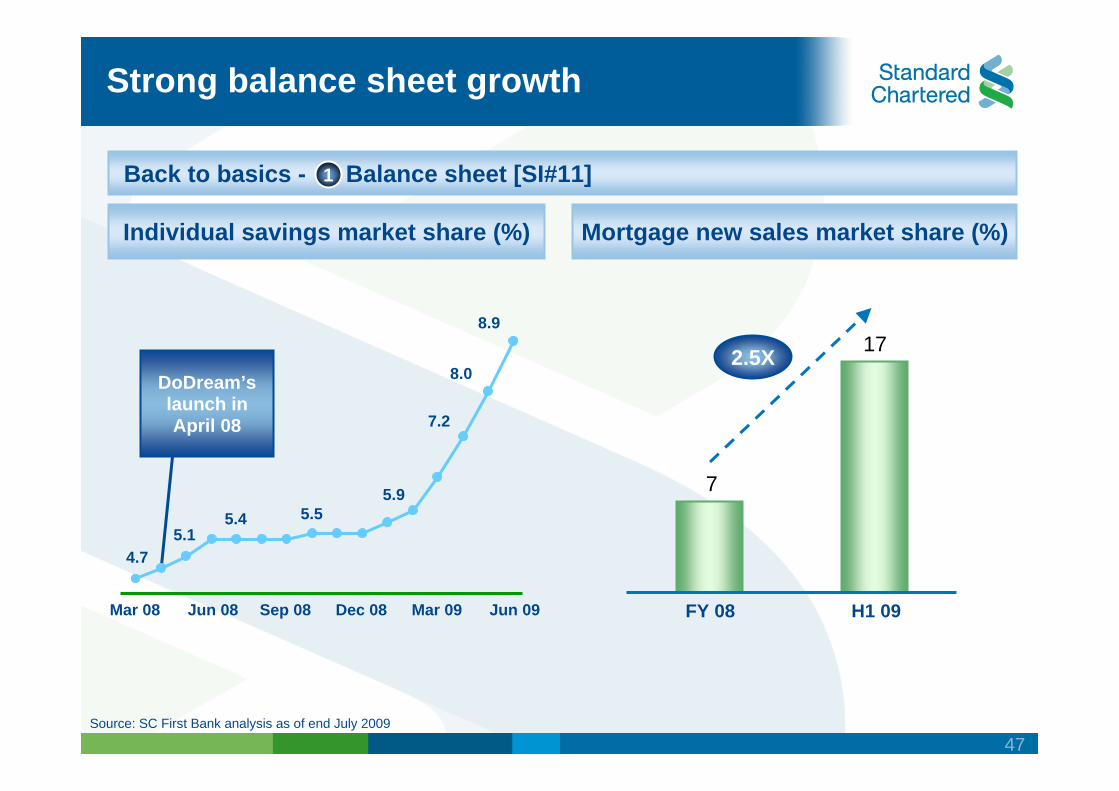
Strong balance sheet growth
Back to basics - Balance sheet [SI#11]
Mortgage new sales market share (%)Individual savings market share (%)
DoDream’s launch in April 08
2.5X
Source: SC First Bank analysis as of end July 2009
1
7
17
FY 08 H1 09
5.15.4 5.5
4.7
8.9
8.0
7.2
5.9
Mar 08 Jun 08 Sep 08 Dec 08 Mar 09 Jun 09
48
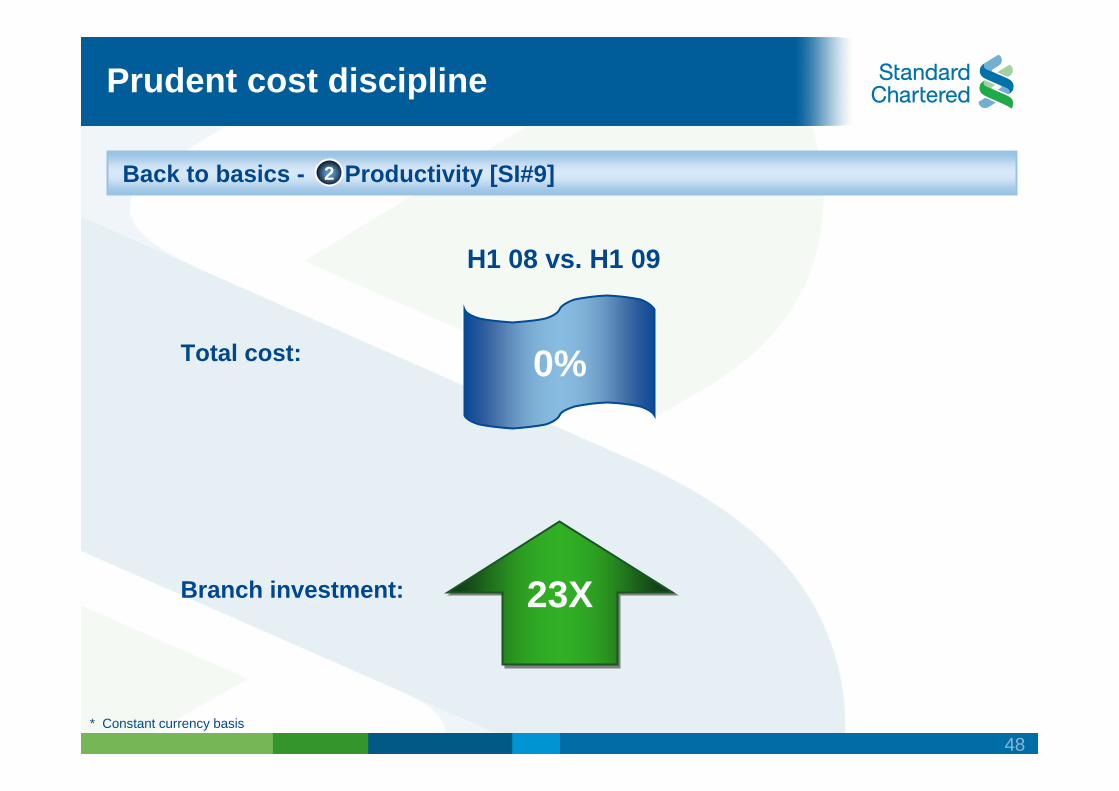
Prudent cost discipline
Back to basics - Productivity [SI#9]2
Total cost:
Branch investment: 23X
H1 08 vs. H1 09
* Constant currency basis
0%
49
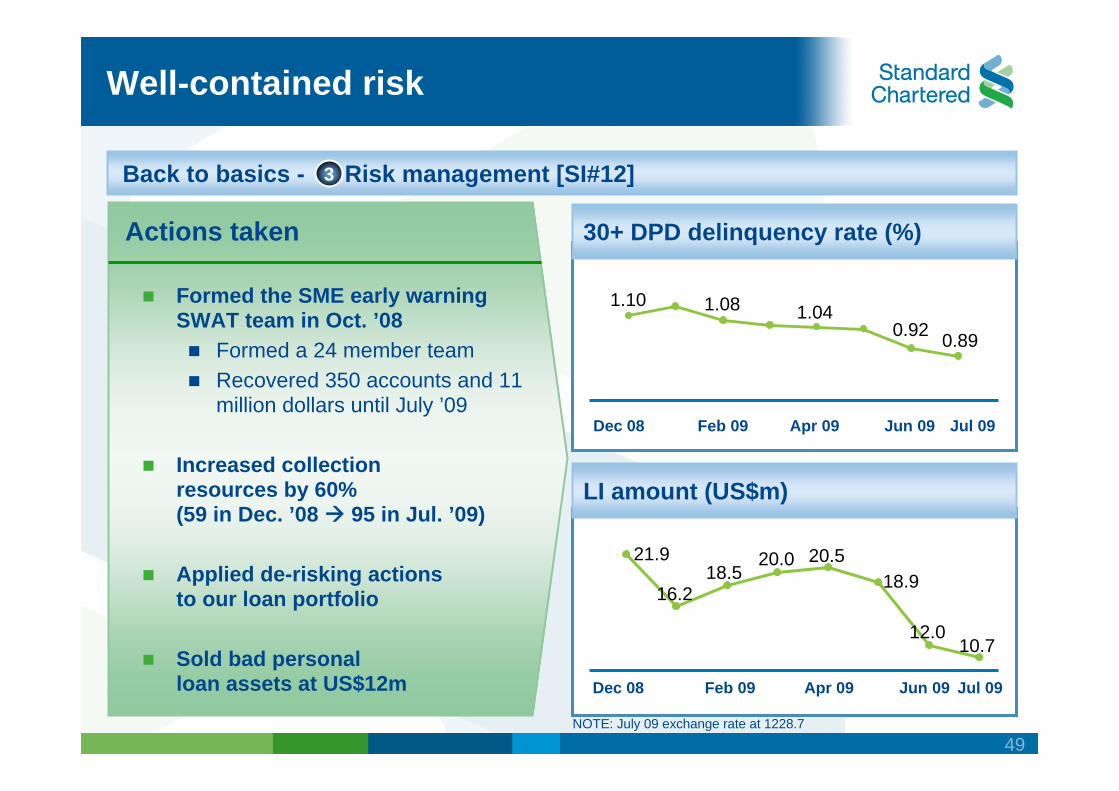
Well-contained risk
30+ DPD delinquency rate (%)
Formed the SME early warning SWAT team in Oct. ’08
Formed a 24 member teamRecovered 350 accounts and 11 million dollars until July ’09
Increased collectionresources by 60%(59 in Dec. ’08 95 in Jul. ’09)
Applied de-risking actionsto our loan portfolio
Sold bad personalloan assets at US$12m
Actions taken
LI amount (US$m)
Jul 09
0.89
Jun 09
0.92
Apr 09
1.04
Feb 09
1.08
Dec 08
1.10
Jul 09Jun 09Apr 09Feb 09Dec 08
Back to basics - Risk management [SI#12]3
NOTE: July 09 exchange rate at 1228.7
21.9 20.5
10.712.0
18.920.0
18.516.2
50
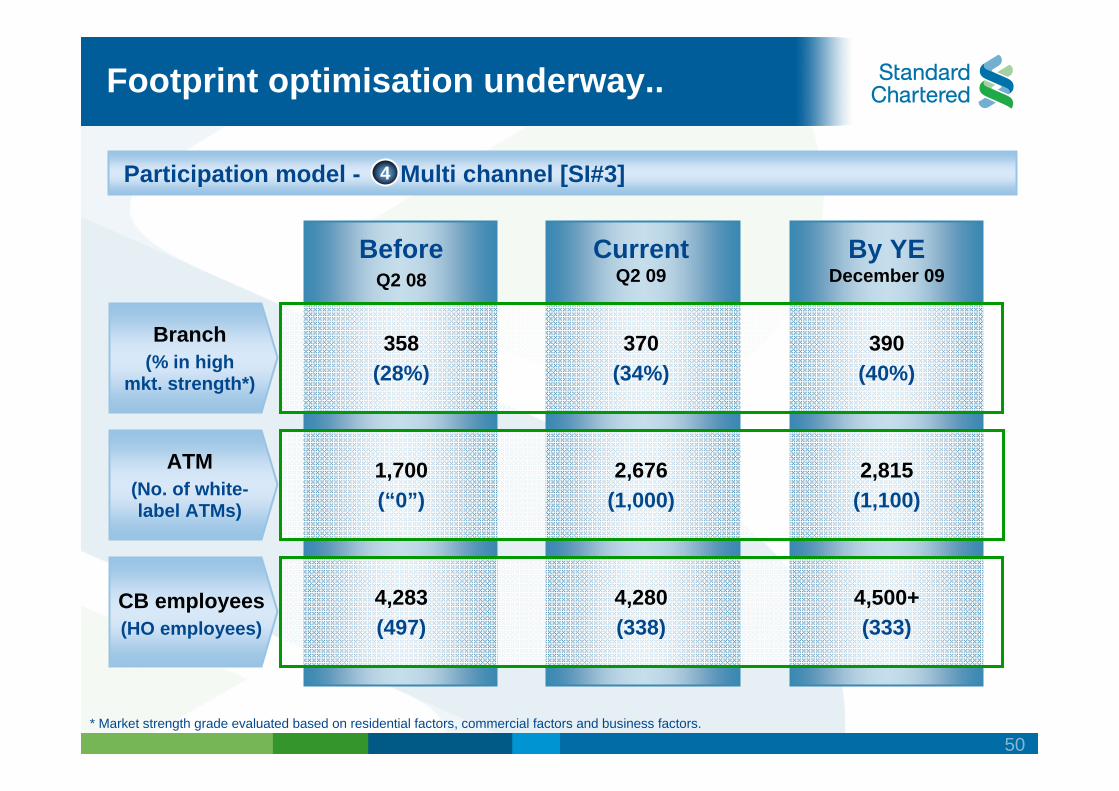
Footprint optimisation underway..
* Market strength grade evaluated based on residential factors, commercial factors and business factors.
ATM(No. of white-label ATMs)
CB employees(HO employees)
Branch(% in high
mkt. strength*)
358(28%)
370(34%)
390(40%)
1,700(“0”)
2,676(1,000)
2,815(1,100)
4,283(497)
4,280(338)
4,500+(333)
BeforeQ2 08
CurrentQ2 09
By YEDecember 09
Participation model - Multi channel [SI#3]4
51
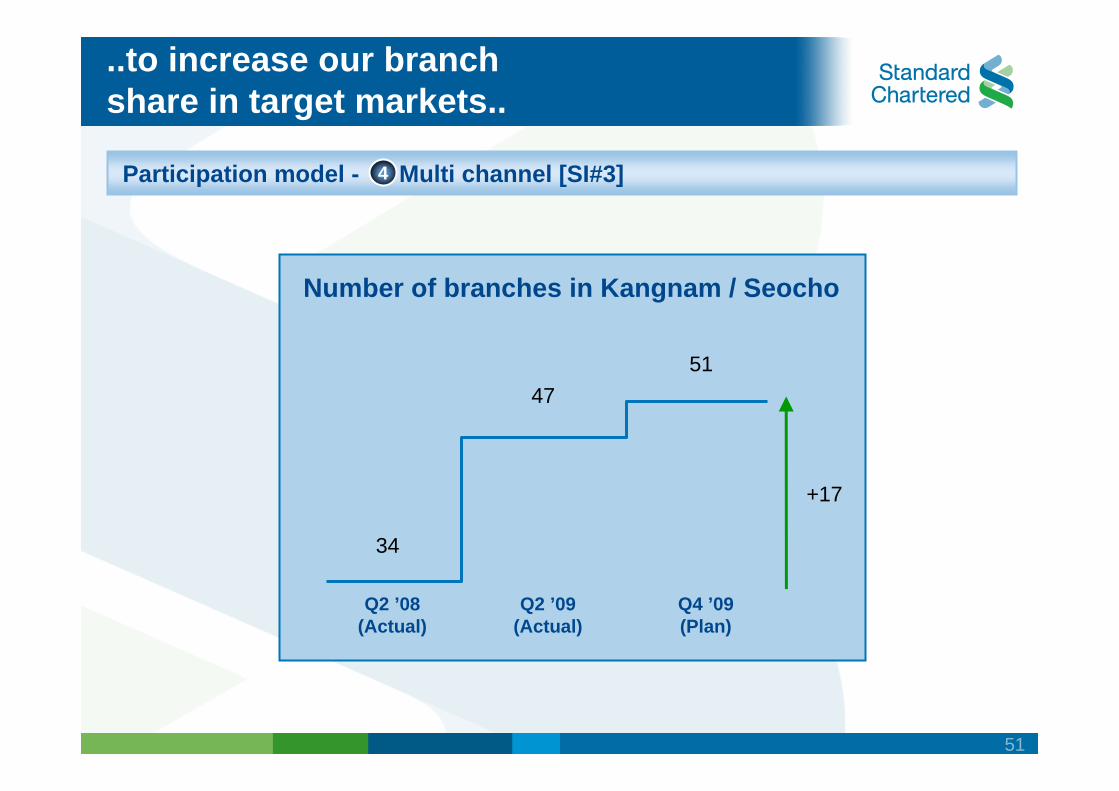
..to increase our branchshare in target markets..
Number of branches in Kangnam / Seocho
+17
Q2 ’08(Actual)
Q2 ’09(Actual)
Q4 ’09(Plan)
34
4751
Participation model - Multi channel [SI#3]4
52
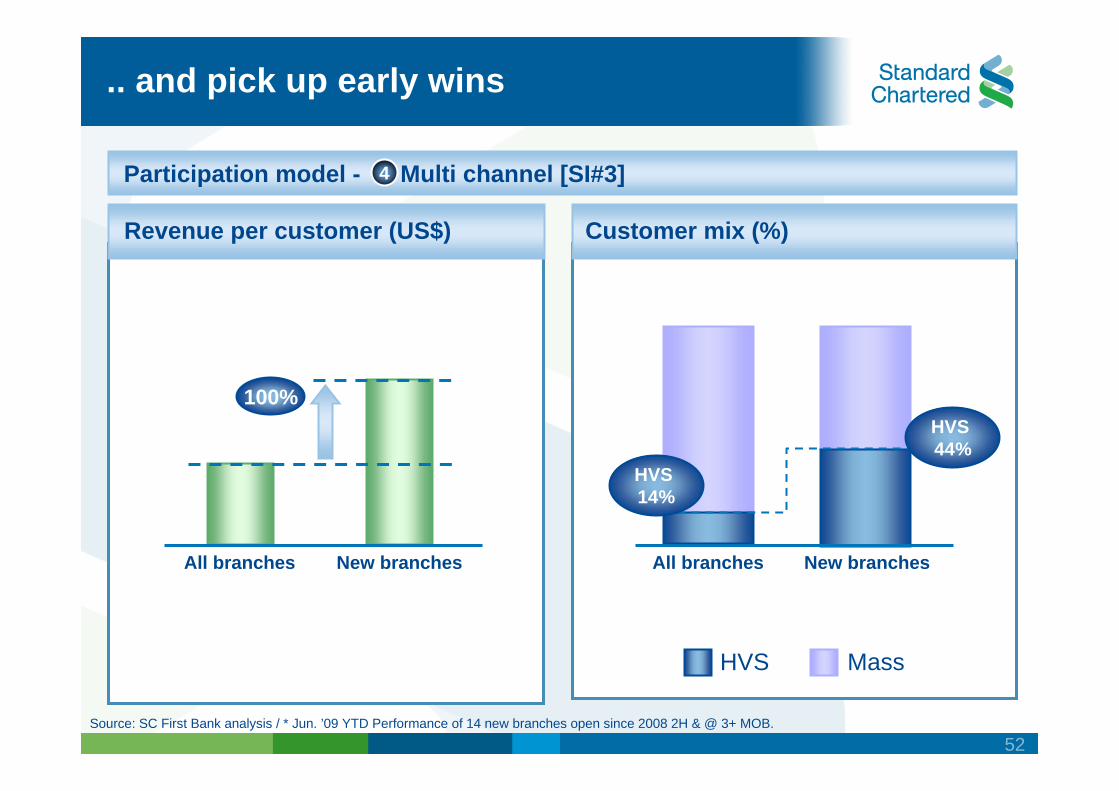
.. and pick up early wins
Source: SC First Bank analysis / * Jun. ’09 YTD Performance of 14 new branches open since 2008 2H & @ 3+ MOB.
Participation model - Multi channel [SI#3]4
Customer mix (%)Revenue per customer (US$)
All branches New branches All branches New branches
HVS Mass
HVS 14%
HVS 44%
100%
53
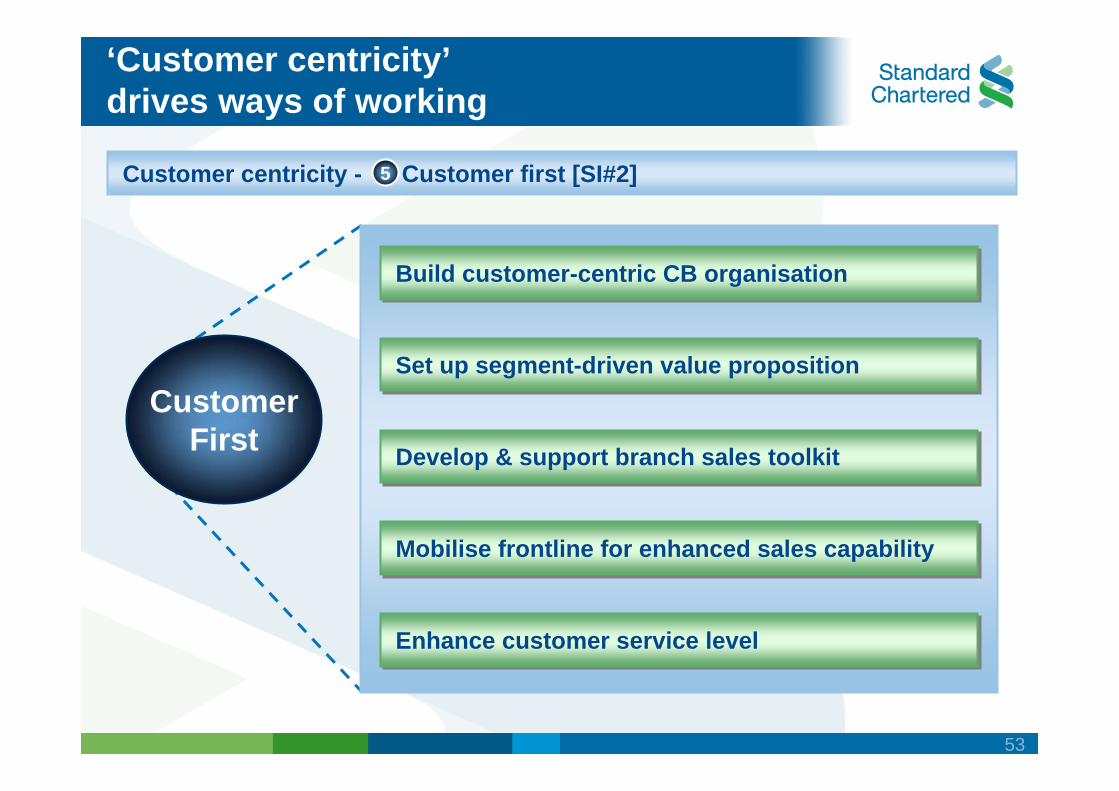
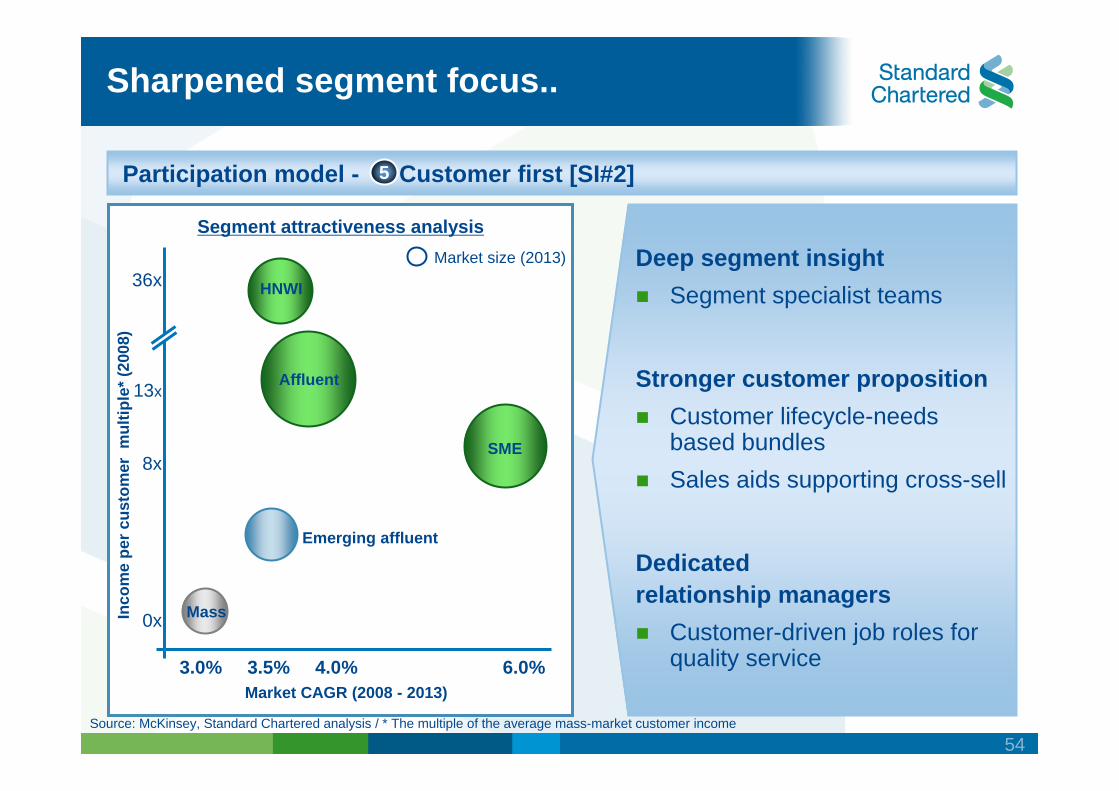
‘Customer centricity’drives ways of working
Customer centricity - Customer first [SI#2]5
CustomerFirst
Build customer-centric CB organisationBuild customer-centric CB organisation
Set up segment-driven value propositionSet up segment-driven value proposition
Develop & support branch sales toolkitDevelop & support branch sales toolkit
Mobilise frontline for enhanced sales capabilityMobilise frontline for enhanced sales capability
Enhance customer service levelEnhance customer service level
54
Inco
me
per c
usto
mer
mul
tiple
* (20
08)
Market size (2013)
3.0% 3.5% 4.0% 6.0%
36x
8x
0x
SME
Affluent
Emerging affluent
Mass
13x
Sharpened segment focus..
Market CAGR (2008 - 2013)
Source: McKinsey, Standard Chartered analysis / * The multiple of the average mass-market customer income
Participation model - Customer first [SI#2]5
HNWI
Segment attractiveness analysis
Deep segment insightSegment specialist teams
Stronger customer propositionCustomer lifecycle-needs based bundlesSales aids supporting cross-sell
Dedicatedrelationship managers
Customer-driven job roles for quality service
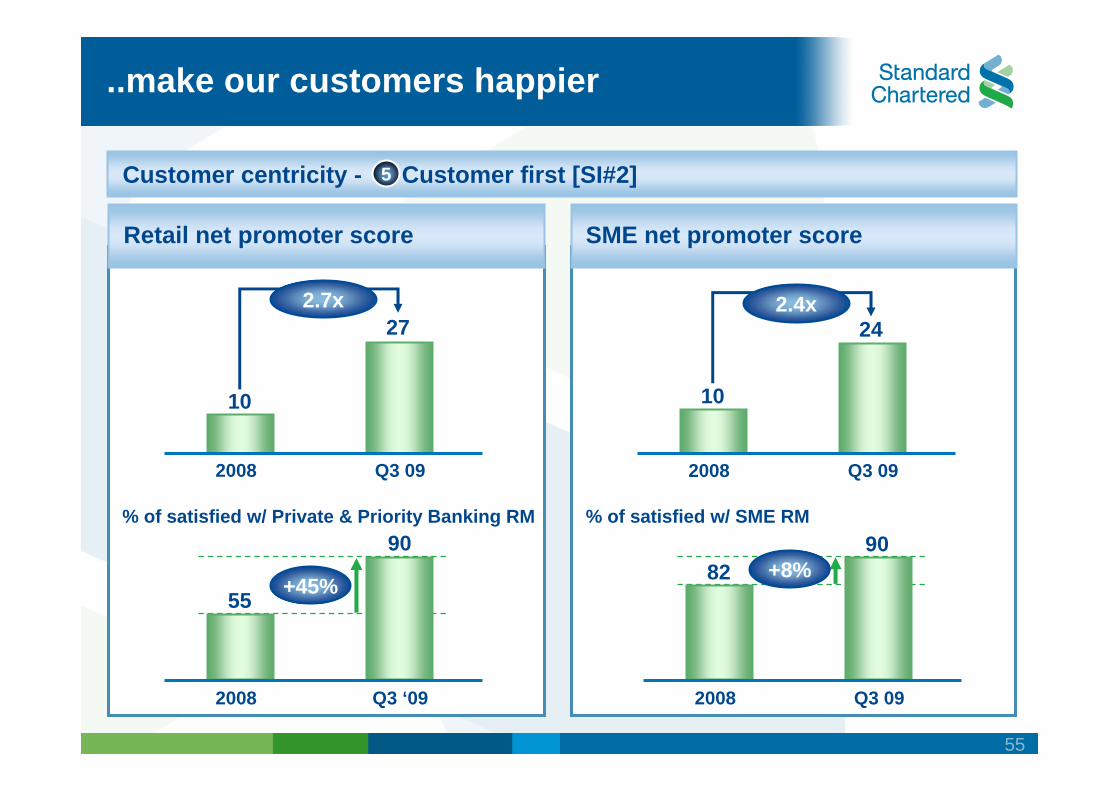
55
..make our customers happier
Customer centricity - Customer first [SI#2]5
SME net promoter scoreRetail net promoter score
10
27
2008 Q3 09
2.7x
10
24
2008 Q3 09
2.4x
55
90
2008 Q3 ‘09
% of satisfied w/ Private & Priority Banking RM
+45% 8290
2008 Q3 09
% of satisfied w/ SME RM
+8%
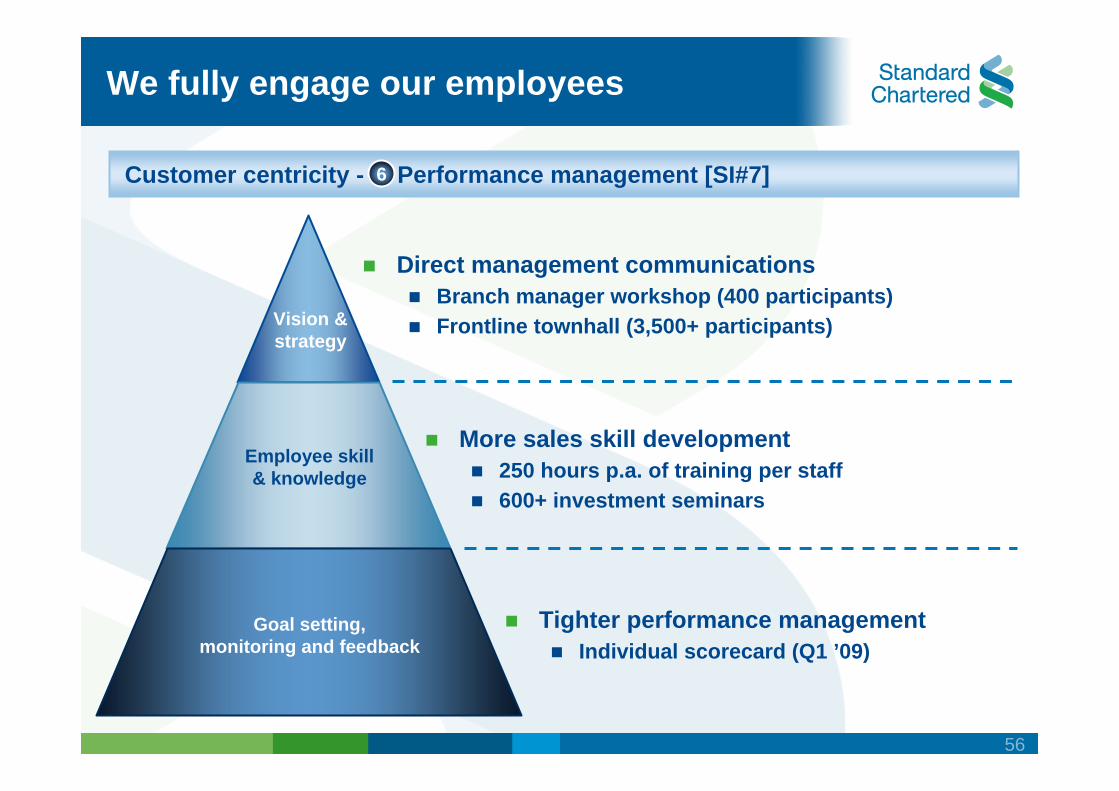
56
We fully engage our employees
Customer centricity - Performance management [SI#7]
Vision & strategy
Employee skill& knowledge
Goal setting,monitoring and feedback
Direct management communicationsBranch manager workshop (400 participants)Frontline townhall (3,500+ participants)
More sales skill development250 hours p.a. of training per staff600+ investment seminars
Tighter performance managementIndividual scorecard (Q1 ’09)
6
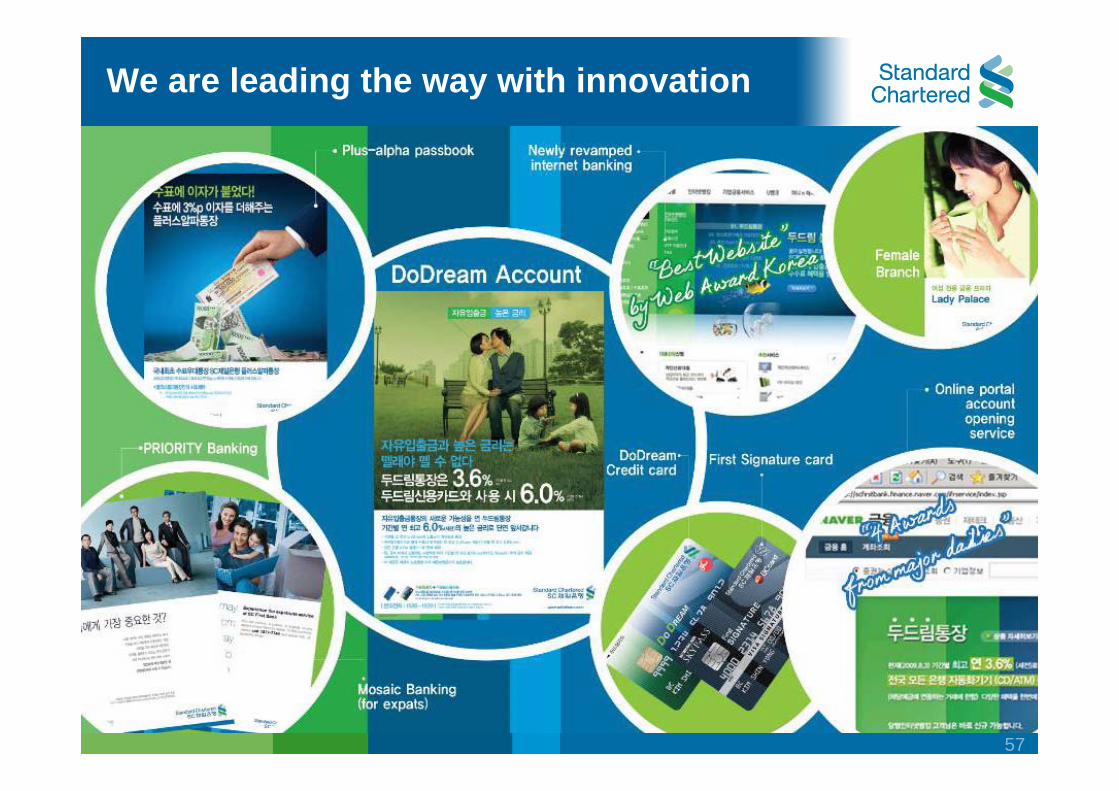
57
We are leading the way with innovation
58
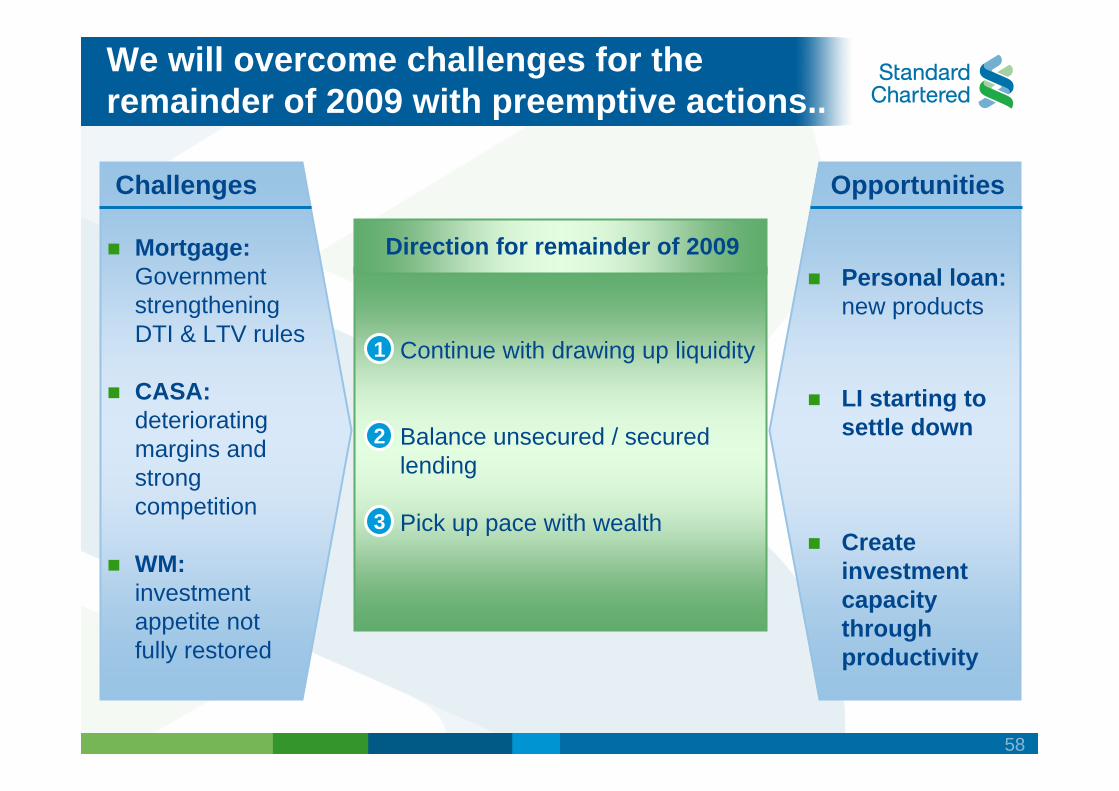
We will overcome challenges for the remainder of 2009 with preemptive actions..
Challenges Opportunities
1
2
3
Direction for remainder of 2009
Continue with drawing up liquidity
Balance unsecured / secured lending
Pick up pace with wealth
Mortgage:Government strengtheningDTI & LTV rules
CASA:deteriorating margins and strong competition
WM:investment appetite notfully restored
Personal loan: new products
LI starting to settle down
Create investment capacity throughproductivity
59
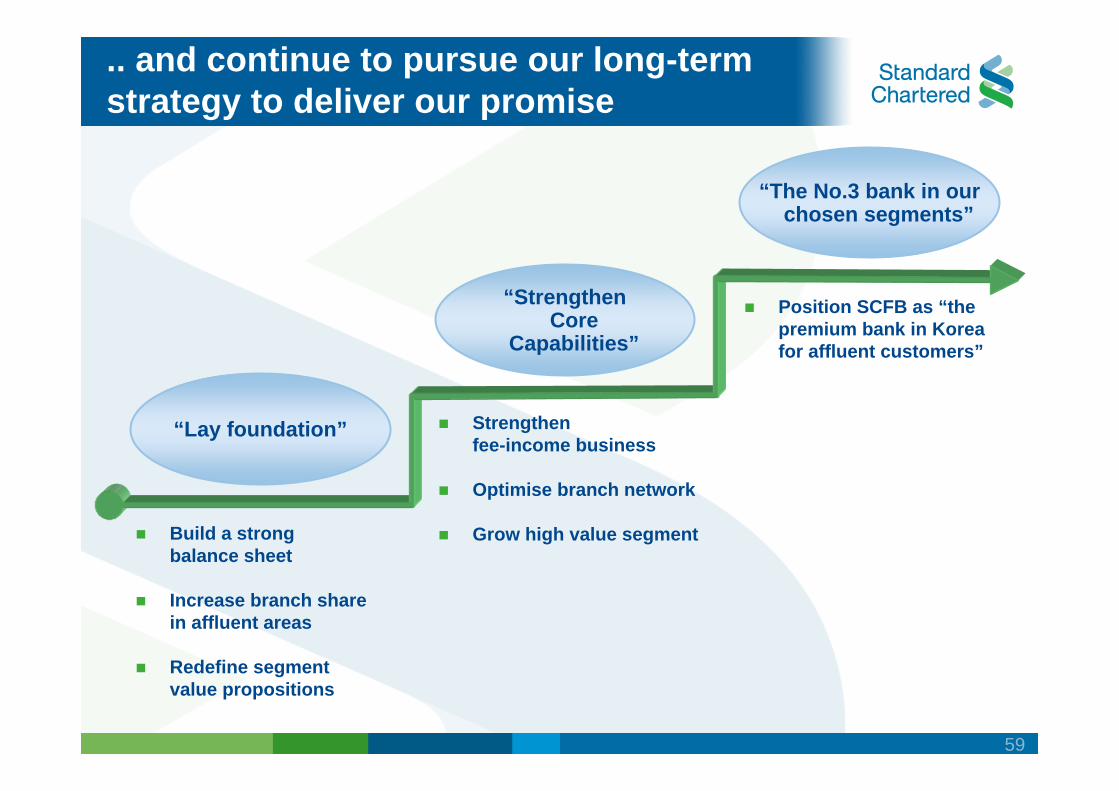
.. and continue to pursue our long-term strategy to deliver our promise
“Strengthen Core
Capabilities”
“The No.3 bank in ourchosen segments”
“Lay foundation”
Build a strongbalance sheet
Increase branch share in affluent areas
Redefine segmentvalue propositions
Strengthenfee-income business
Optimise branch network
Grow high value segment
Position SCFB as “the premium bank in Korea for affluent customers”
60
Q & A

Wholesale Banking
Charles Ahn, Gene KimWholesale Banking
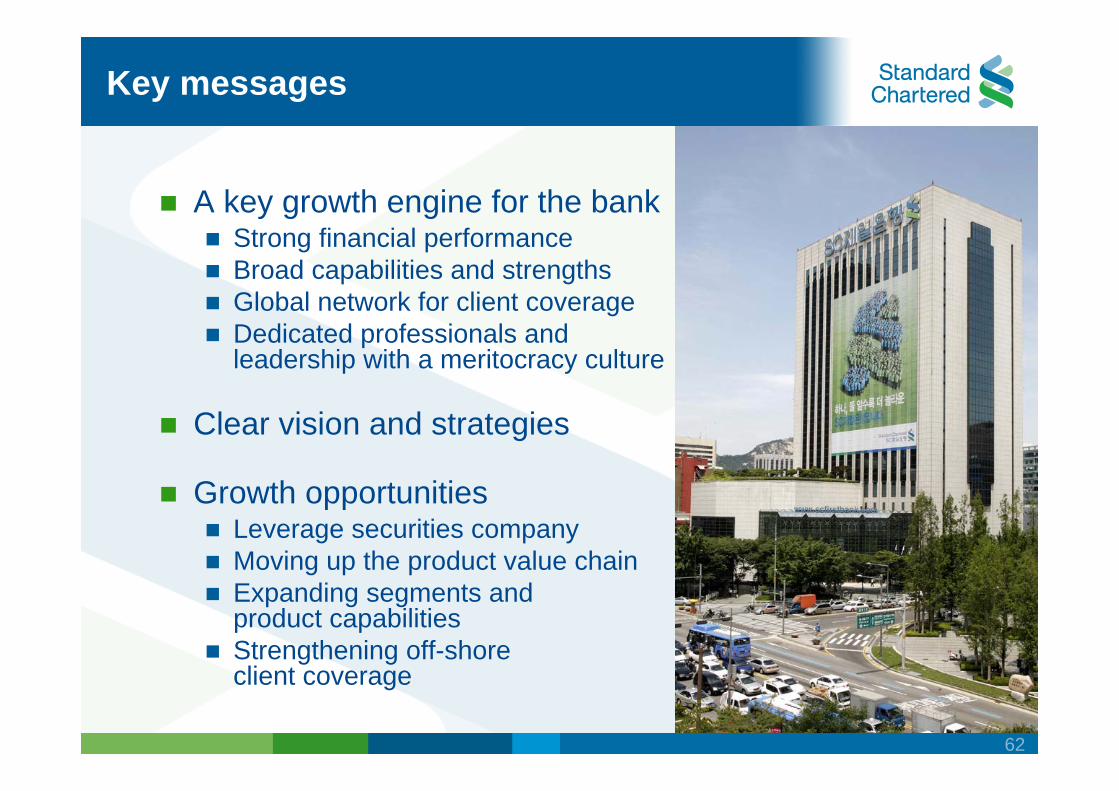
62
Key messages
A key growth engine for the bankStrong financial performanceBroad capabilities and strengthsGlobal network for client coverageDedicated professionals and leadership with a meritocracy culture
Clear vision and strategies
Growth opportunitiesLeverage securities company Moving up the product value chain Expanding segments andproduct capabilitiesStrengthening off-shoreclient coverage
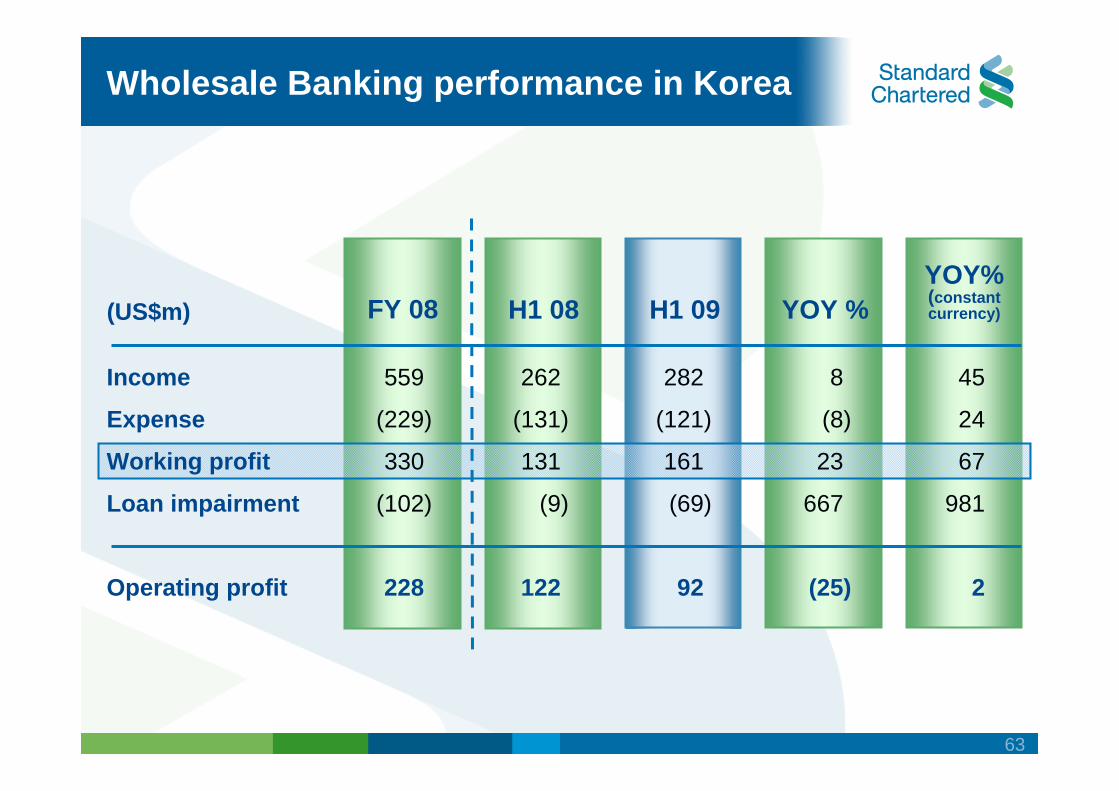
63
(US$m) H1 09 YOY %YOY%(constant currency)H1 08
45
24
67
981
2
Wholesale Banking performance in Korea
262
(131)
131
(9)
122
282
(121)
161
(69)
92
8
(8)
23
667
(25)
Income
Expense
Working profit
Loan impairment
Operating profit
FY 08
559
(229)
330
(102)
228
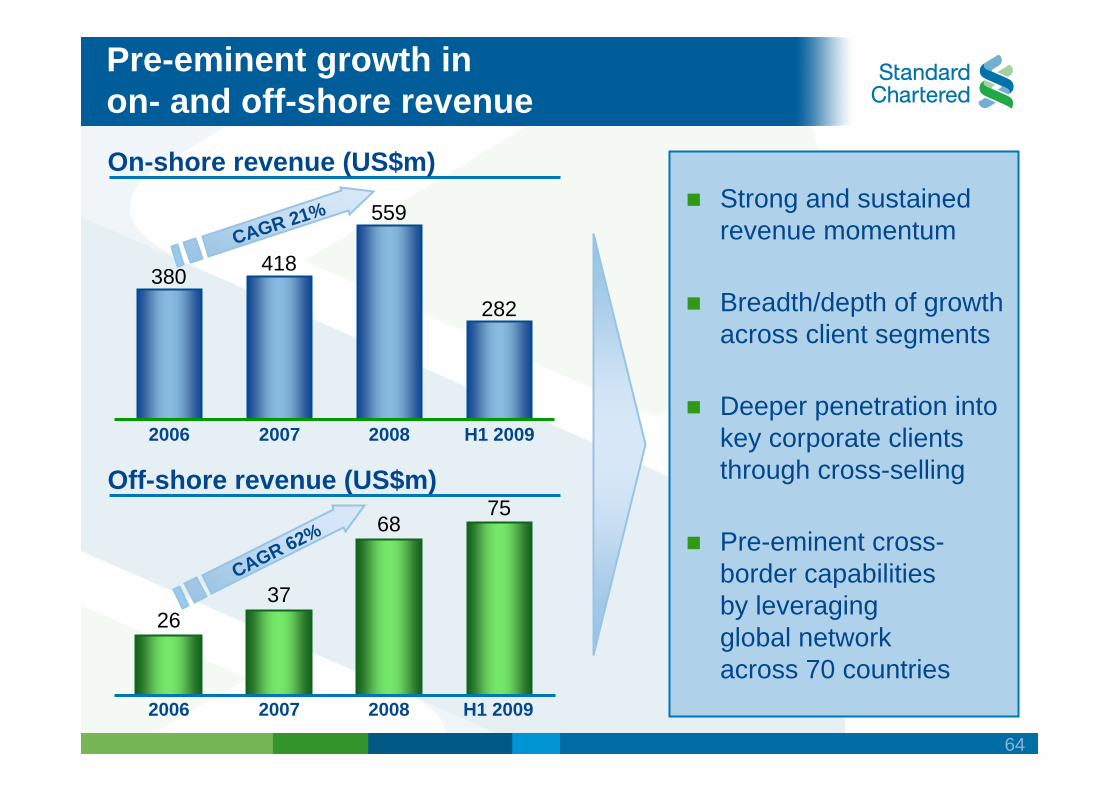
64
Pre-eminent growth inon- and off-shore revenue
Off-shore revenue (US$m)
On-shore revenue (US$m)
CAGR 62%
2006 2007 2008 H1 2009
2006 2007 2008 H1 2009
2637
6875
380 418
559
282
Strong and sustained revenue momentum
Breadth/depth of growth across client segments
Deeper penetration into key corporate clients through cross-selling
Pre-eminent cross-border capabilitiesby leveragingglobal networkacross 70 countries
CAGR 21%
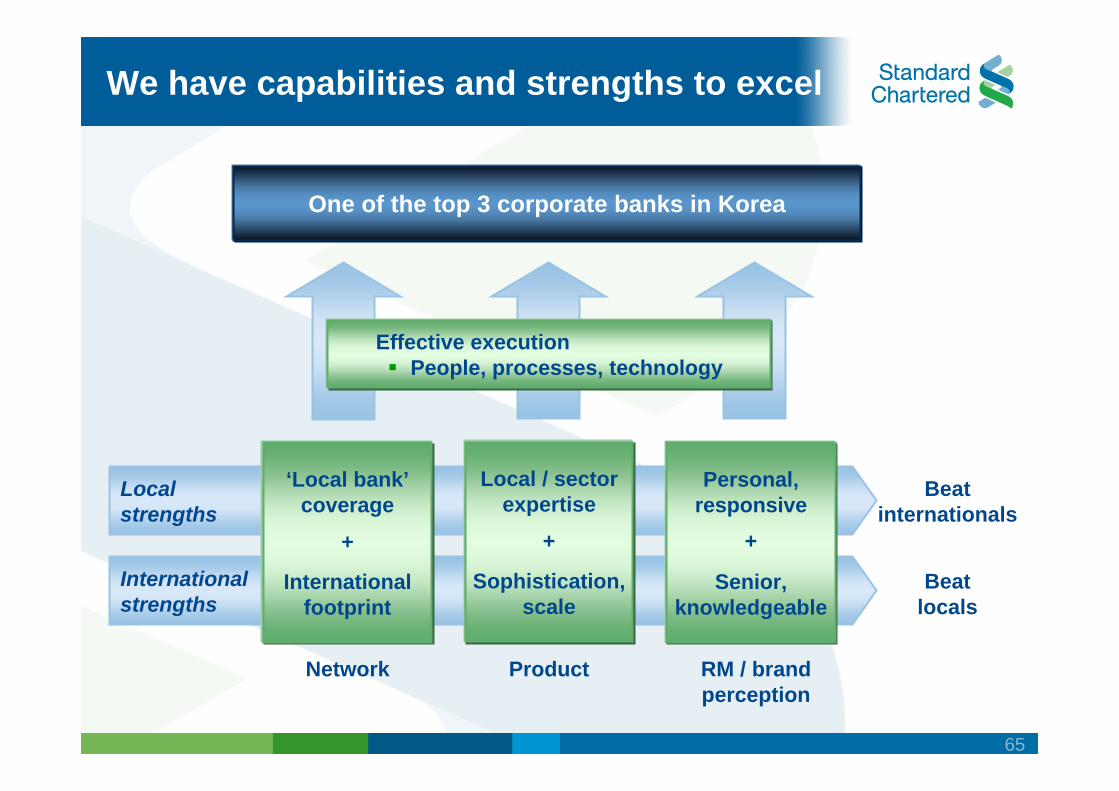
65
Internationalstrengths
Localstrengths
Beat internationals
Beatlocals
We have capabilities and strengths to excel
Network
‘Local bank’coverage
International footprint
+
Product
Local / sector expertise
Sophistication,scale
+
RM / brand perception
Personal, responsive
Senior, knowledgeable
+
One of the top 3 corporate banks in Korea
Effective executionPeople, processes, technology
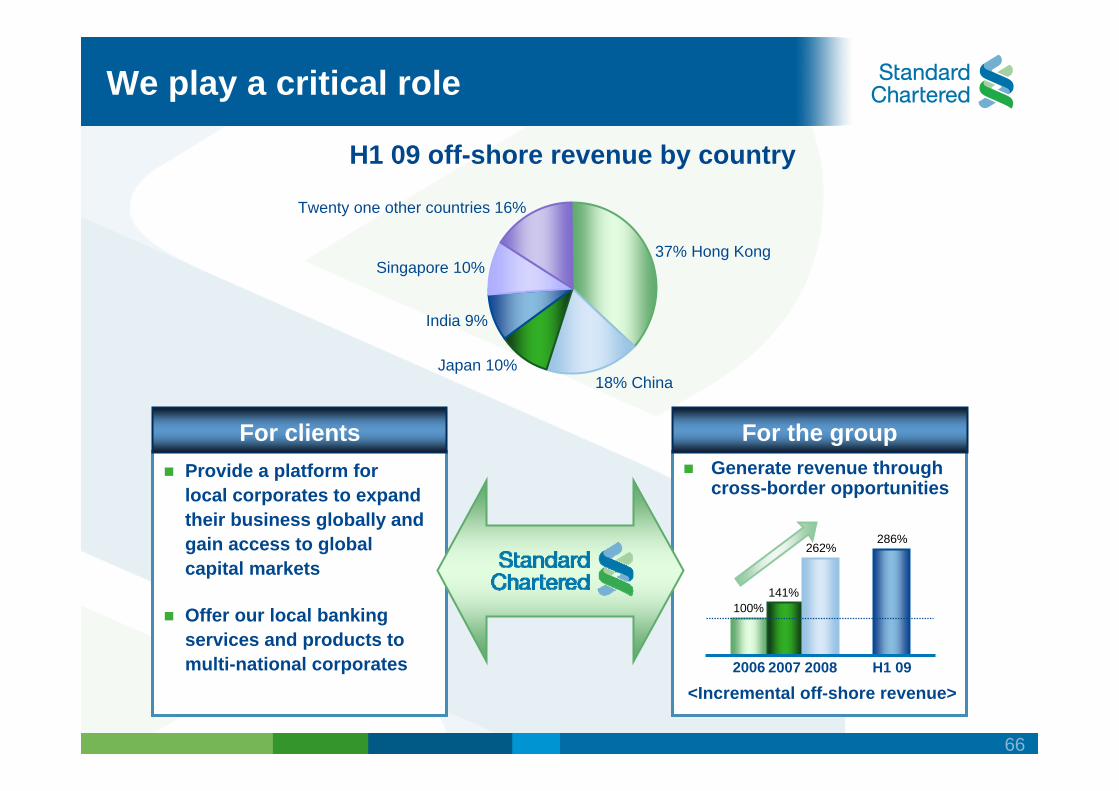
66
Generate revenue through cross-border opportunities
Provide a platform forlocal corporates to expand their business globally and gain access to global capital markets
Offer our local banking services and products to multi-national corporates
We play a critical role
For the groupFor clients
100%141%
262%
<Incremental off-shore revenue>2006
286%
H1 09 off-shore revenue by country
37% Hong Kong
18% ChinaJapan 10%
India 9%
Singapore 10%
Twenty one other countries 16%
2007 2008 H1 09
67
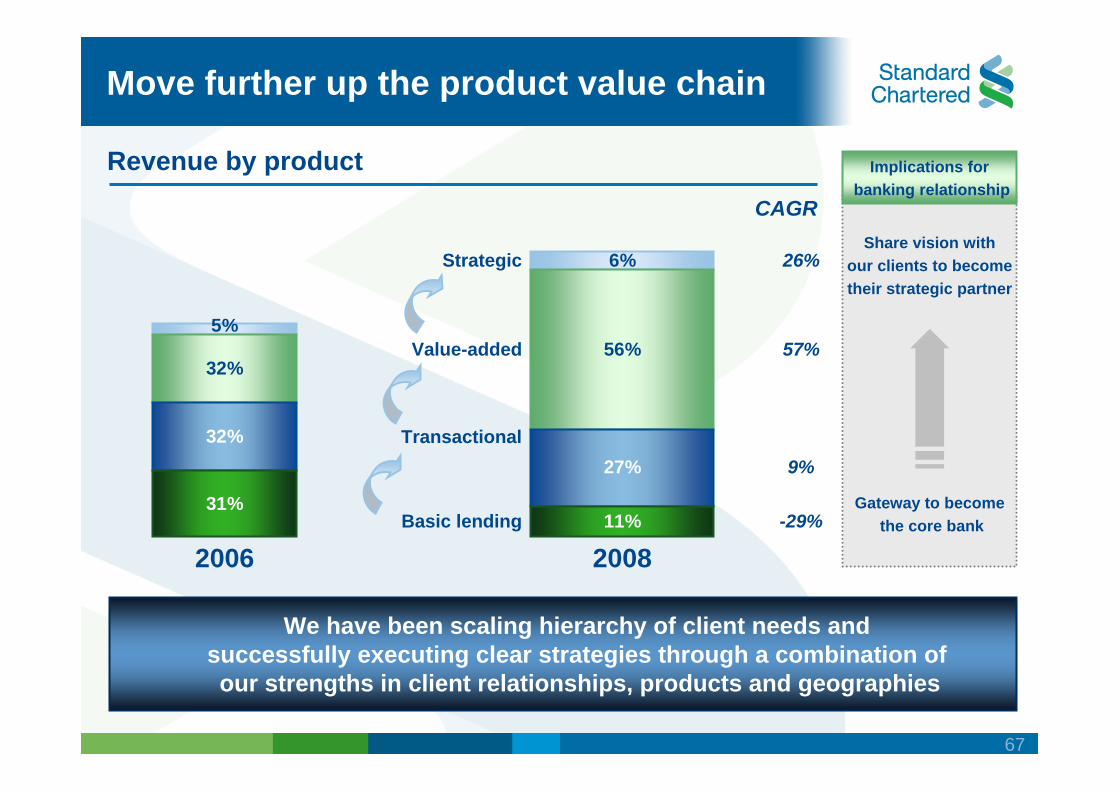
Move further up the product value chain
We have been scaling hierarchy of client needs and successfully executing clear strategies through a combination ofour strengths in client relationships, products and geographies
Revenue by product
2006 2008
31%
32%
32%
5%
CAGR
Implications forbanking relationship
Share vision withour clients to becometheir strategic partner
Gateway to becomethe core bankBasic lending
Transactional
Value-added
Strategic
11%
27%
56%
6%
57%
26%
9%
-29%
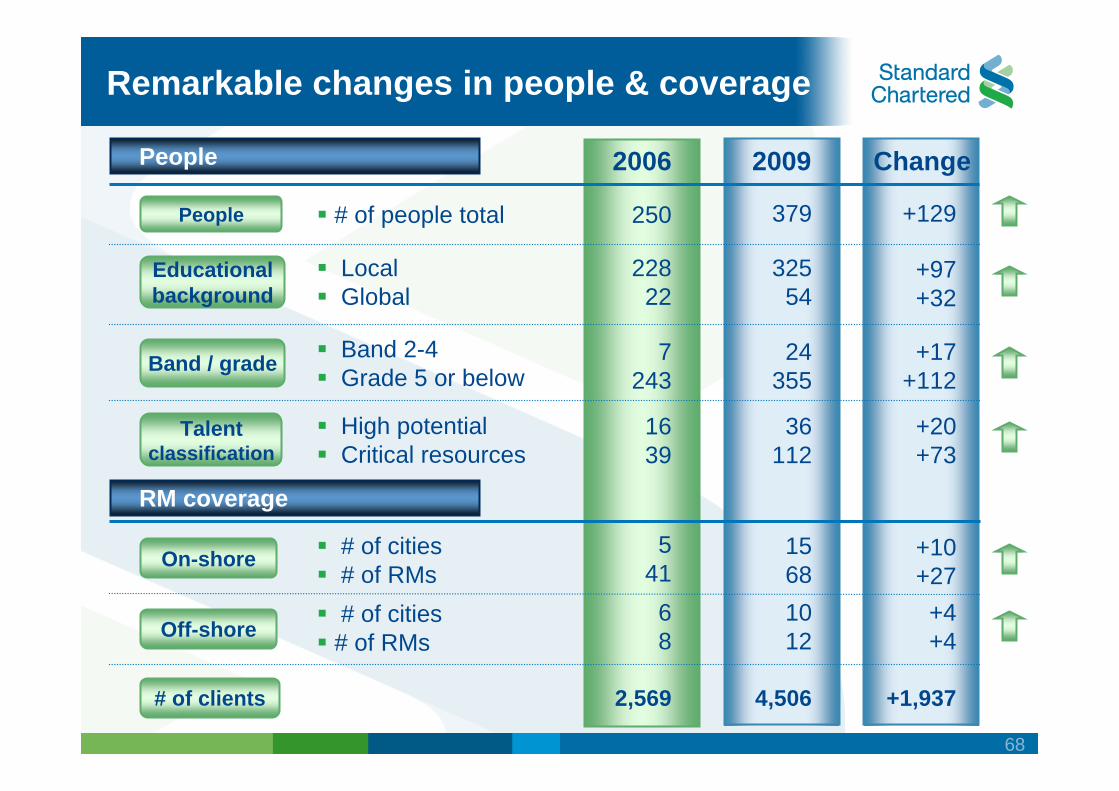
68
2006 Change
Educational background
Band / grade
2009
LocalGlobal
Band 2-4Grade 5 or below
Talent classification
High potentialCritical resources
On-shore # of cities# of RMs
Off-shore# of cities# of RMs
# of clients
22822
People # of people total 250 379 +129
7243
24355
+17+112
+97+32
32554
1639
36112
+20+73
People
RM coverage
541
1568
+10+27
68
1012
+4+4
2,569 4,506 +1,937
Remarkable changes in people & coverage
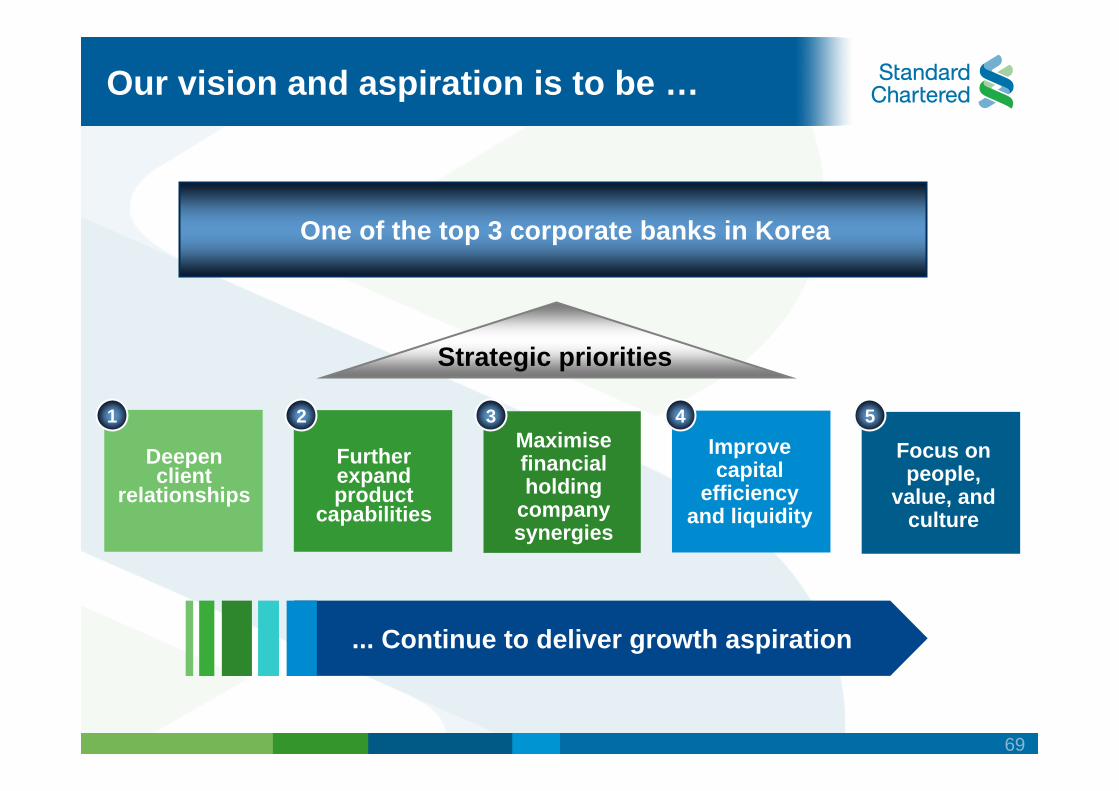
69
Our vision and aspiration is to be …
One of the top 3 corporate banks in Korea
Deepen client
relationships
Further expand product
capabilities
Maximisefinancial holding
company synergies
Improve capital
efficiency and liquidity
1 2 3 4 5
Strategic priorities
Focus on people,
value, and culture
... Continue to deliver growth aspiration
70
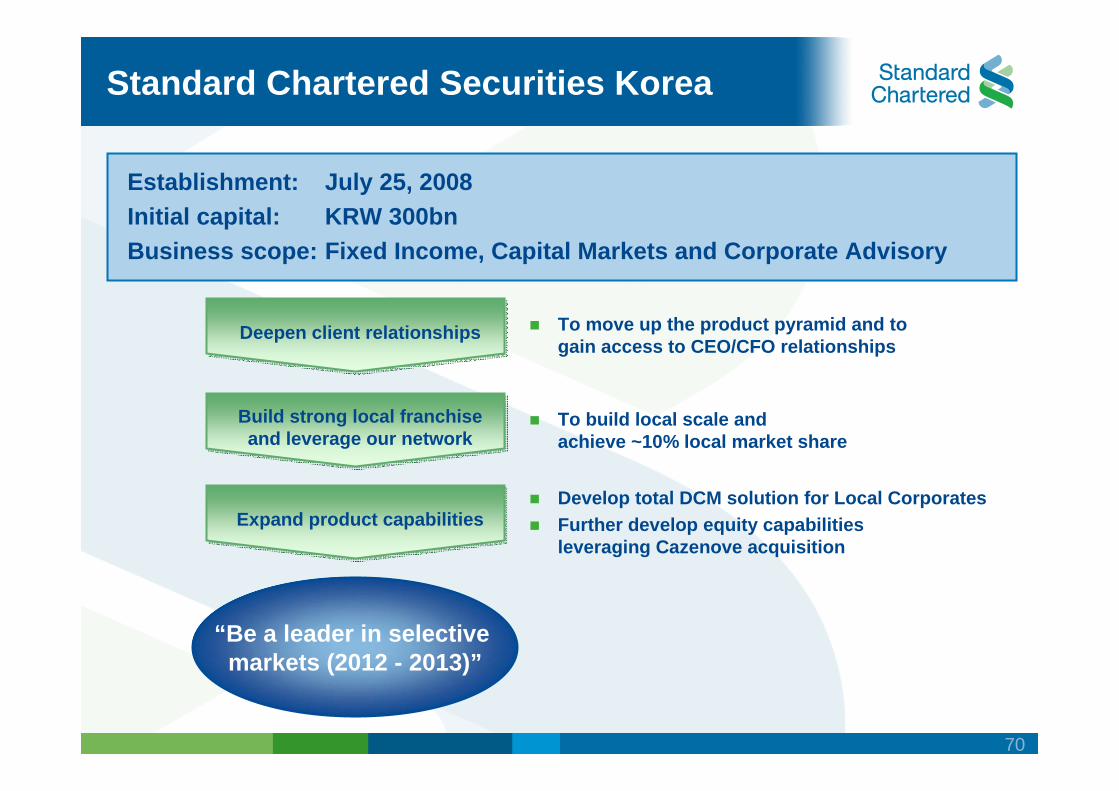
Standard Chartered Securities Korea
Establishment: July 25, 2008 Initial capital: KRW 300bn Business scope: Fixed Income, Capital Markets and Corporate Advisory
To move up the product pyramid and to gain access to CEO/CFO relationships
To build local scale andachieve ~10% local market share
Develop total DCM solution for Local Corporates Further develop equity capabilitiesleveraging Cazenove acquisition
Deepen client relationshipsDeepen client relationships
“Be a leader in selective markets (2012 - 2013)”
Build strong local franchise and leverage our network
Build strong local franchise and leverage our network
Expand product capabilitiesExpand product capabilities
71
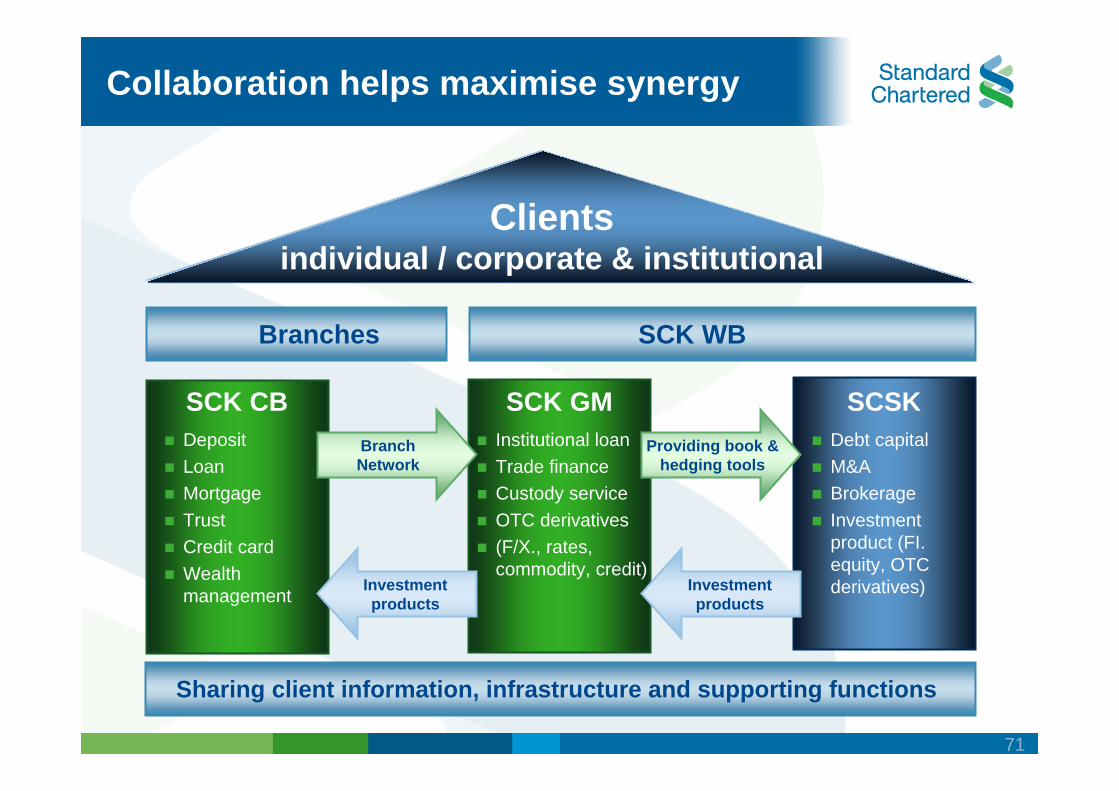
Collaboration helps maximise synergy
SCK WB
Clientsindividual / corporate & institutional
SCK GM SCSKInstitutional loan Trade financeCustody serviceOTC derivatives(F/X., rates, commodity, credit)
Debt capital M&A BrokerageInvestment product (FI. equity, OTC derivatives)
SCK CBDepositLoanMortgageTrustCredit cardWealth management
Branches
Sharing client information, infrastructure and supporting functions
Providing book &hedging tools
Investmentproducts
Investmentproducts
BranchNetwork
72
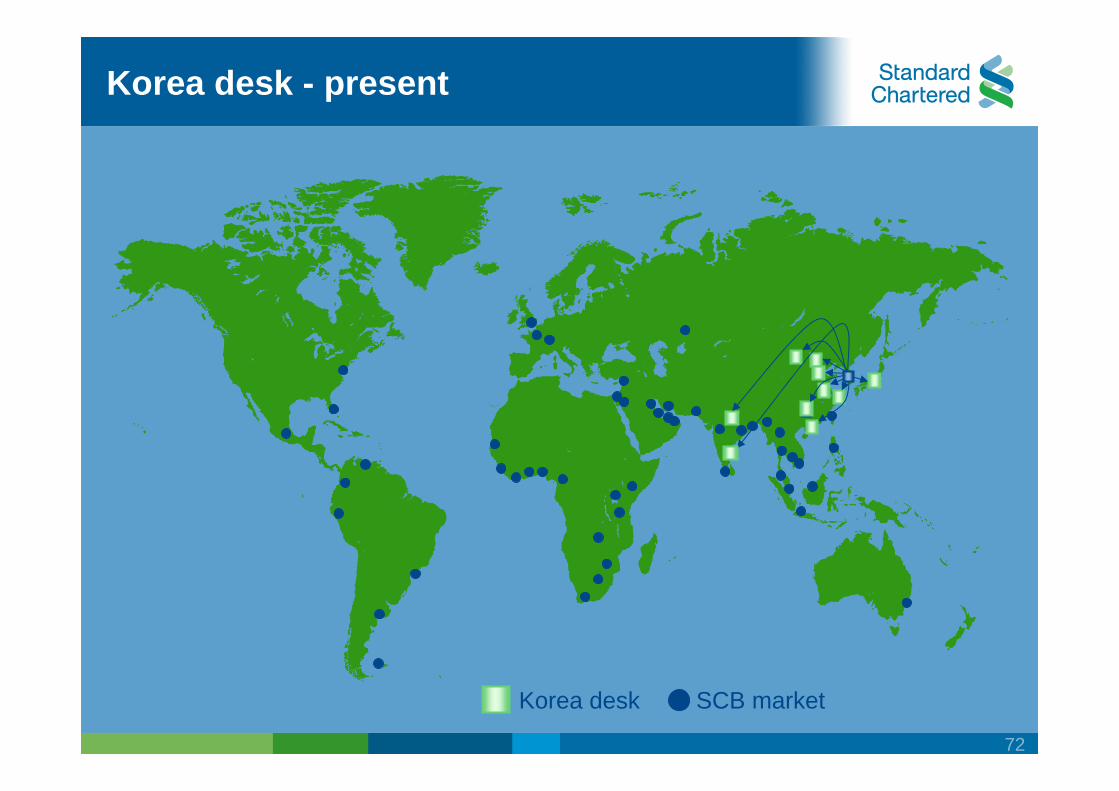
Korea desk - present
Korea desk SCB market
73
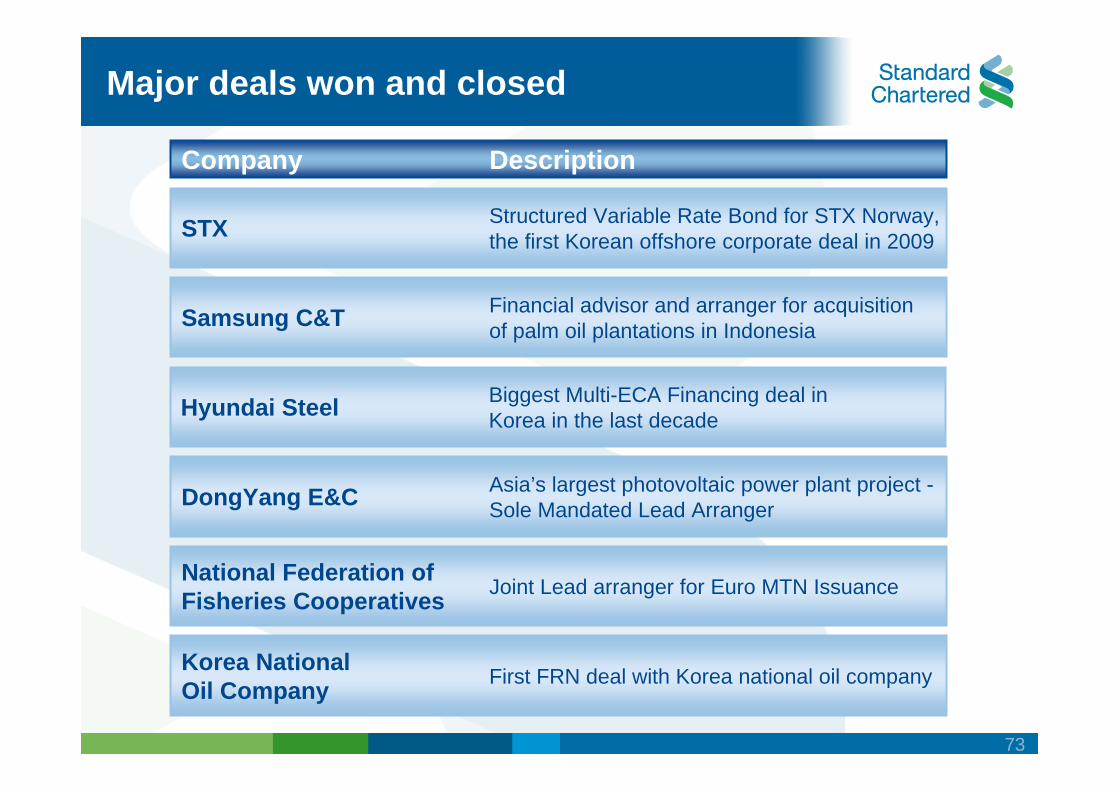
Company
Hyundai Steel
STX
National Federation ofFisheries Cooperatives
Samsung C&T
DongYang E&C
Korea NationalOil Company
Major deals won and closed
Biggest Multi-ECA Financing deal inKorea in the last decade
Structured Variable Rate Bond for STX Norway,the first Korean offshore corporate deal in 2009
Joint Lead arranger for Euro MTN Issuance
Financial advisor and arranger for acquisitionof palm oil plantations in Indonesia
Asia’s largest photovoltaic power plant project -Sole Mandated Lead Arranger
First FRN deal with Korea national oil company
Description
74
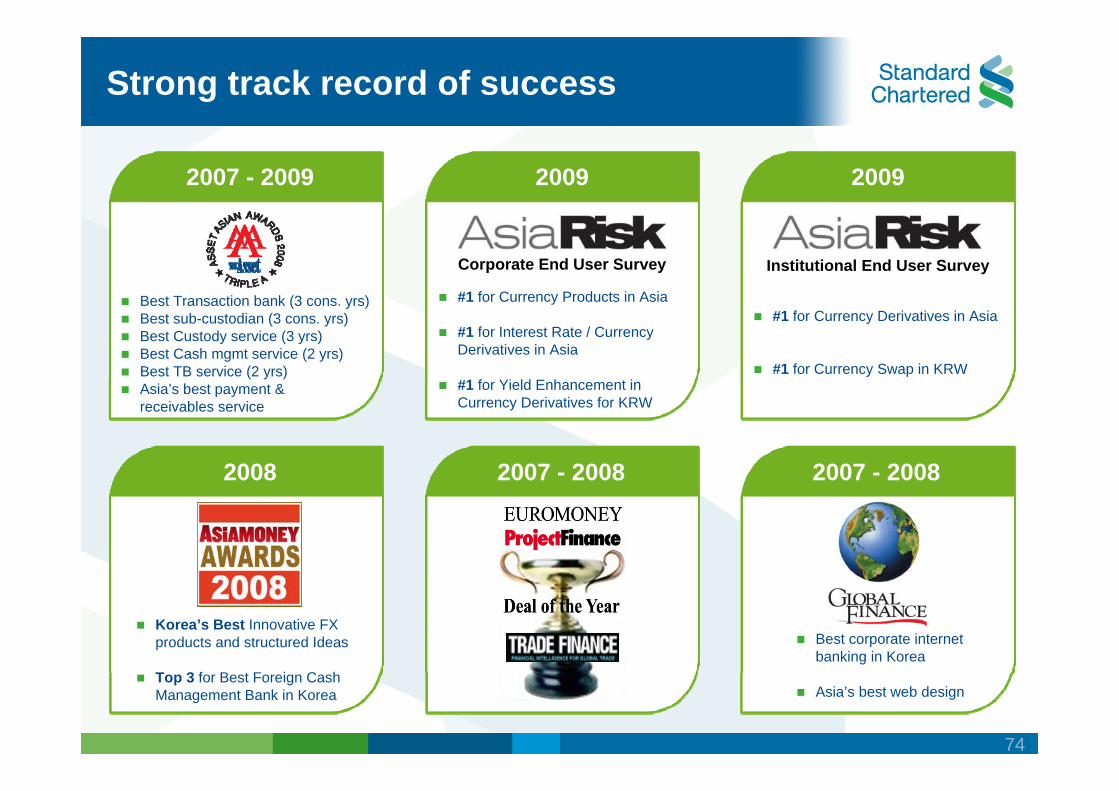
Strong track record of success
2007 - 2009
Best Transaction bank (3 cons. yrs)Best sub-custodian (3 cons. yrs)Best Custody service (3 yrs)Best Cash mgmt service (2 yrs)Best TB service (2 yrs)Asia’s best payment &receivables service
Korea’s Best Innovative FX products and structured Ideas
Top 3 for Best Foreign Cash Management Bank in Korea
Best corporate internetbanking in Korea
Asia’s best web design
2007 - 2008 2007 - 2008
2009
#1 for Currency Products in Asia
#1 for Interest Rate / Currency Derivatives in Asia
#1 for Yield Enhancement in Currency Derivatives for KRW
2009
#1 for Currency Derivatives in Asia
#1 for Currency Swap in KRW
Institutional End User SurveyCorporate End User Survey
2008
75
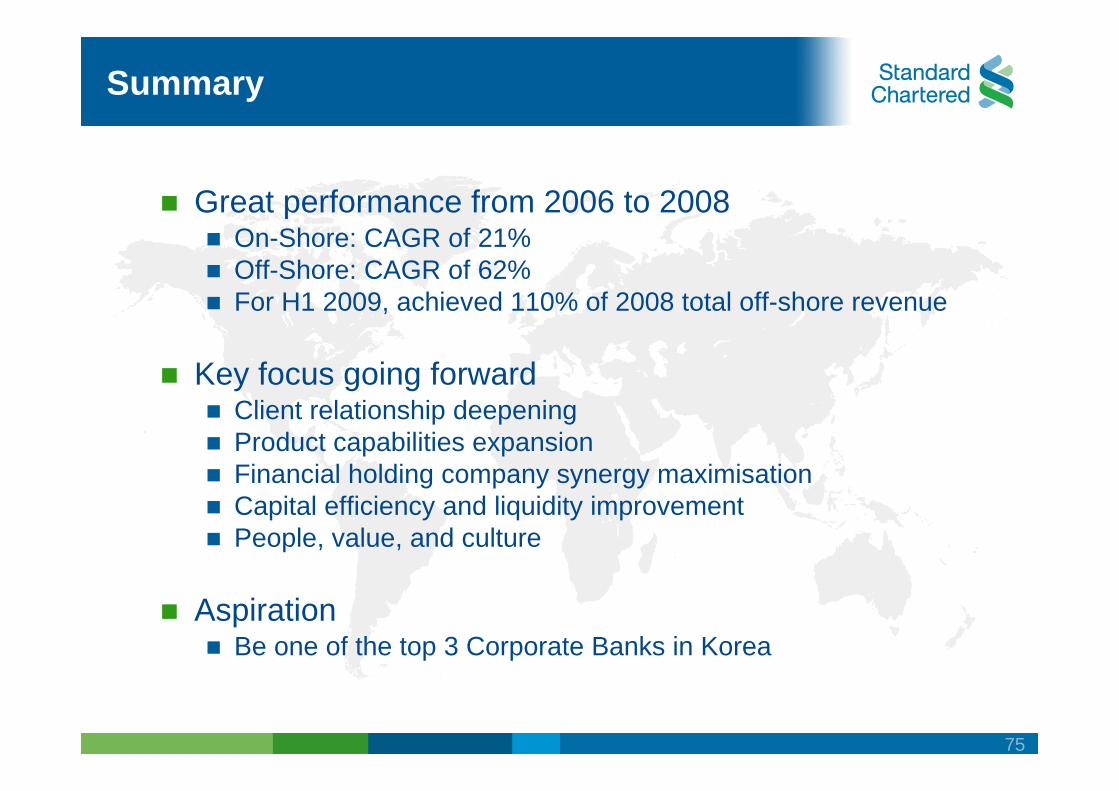
Summary
Great performance from 2006 to 2008On-Shore: CAGR of 21%Off-Shore: CAGR of 62%For H1 2009, achieved 110% of 2008 total off-shore revenue
Key focus going forwardClient relationship deepeningProduct capabilities expansionFinancial holding company synergy maximisationCapital efficiency and liquidity improvementPeople, value, and culture
AspirationBe one of the top 3 Corporate Banks in Korea

76
Q & A