Embed Size (px)
Citation preview
CEO Overconfidence, Corporate Investment Activity, and Performance: Evidence from REITs
Piet Eichholtz Maastricht University
Netherlands [email protected]
Erkan Yönder Maastricht University
Netherlands [email protected]
Preliminary draft May 13, 2011
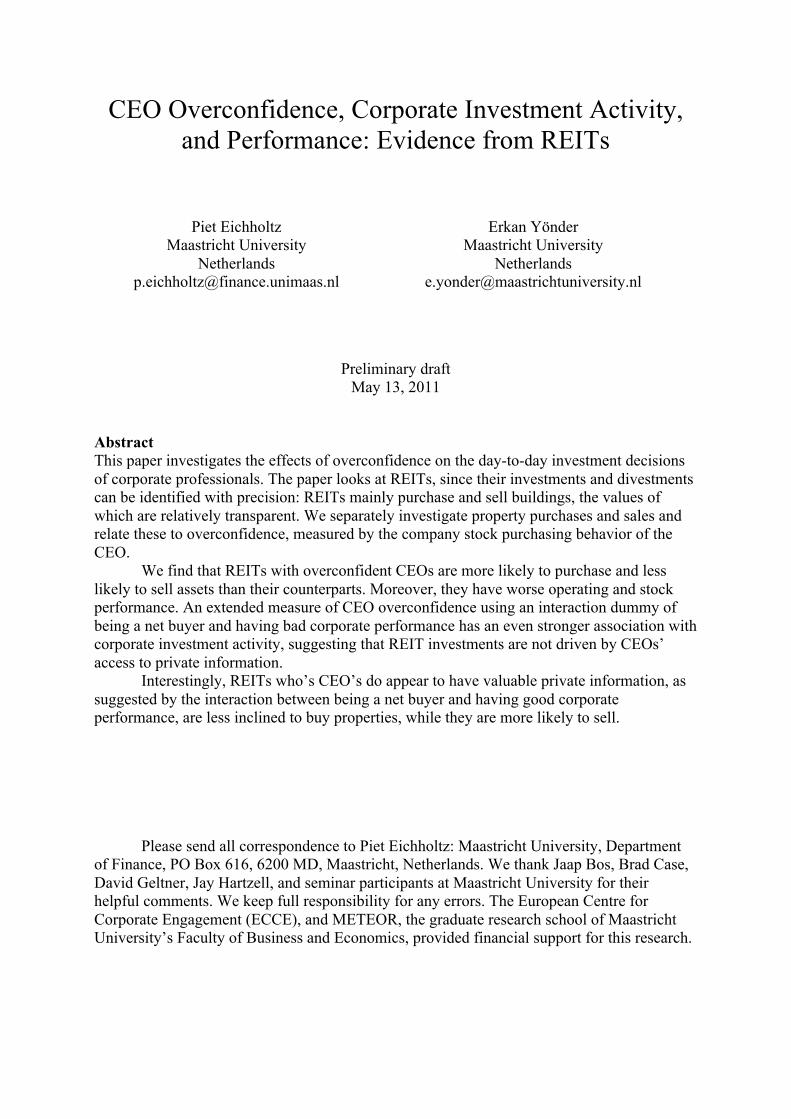
Abstract This paper investigates the effects of overconfidence on the day-to-day investment decisions of corporate professionals. The paper looks at REITs, since their investments and divestments can be identified with precision: REITs mainly purchase and sell buildings, the values of which are relatively transparent. We separately investigate property purchases and sales and relate these to overconfidence, measured by the company stock purchasing behavior of the CEO. We find that REITs with overconfident CEOs are more likely to purchase and less likely to sell assets than their counterparts. Moreover, they have worse operating and stock performance. An extended measure of CEO overconfidence using an interaction dummy of being a net buyer and having bad corporate performance has an even stronger association with corporate investment activity, suggesting that REIT investments are not driven by CEOs’ access to private information. Interestingly, REITs who’s CEO’s do appear to have valuable private information, as suggested by the interaction between being a net buyer and having good corporate performance, are less inclined to buy properties, while they are more likely to sell.
Please send all correspondence to Piet Eichholtz: Maastricht University, Department of Finance, PO Box 616, 6200 MD, Maastricht, Netherlands. We thank Jaap Bos, Brad Case, David Geltner, Jay Hartzell, and seminar participants at Maastricht University for their helpful comments. We keep full responsibility for any errors. The European Centre for Corporate Engagement (ECCE), and METEOR, the graduate research school of Maastricht University’s Faculty of Business and Economics, provided financial support for this research.

1
I. Introduction
Overconfidence is one of the main behavioral biases brought forward by behavioral finance
theory, and its existence has been well documented by anecdotal and academic evidence alike.
The main research question that arises in the literature is whether overconfidence affects
investor decisions and thereby performance. Overconfident people think that their decisions
are better and will bring superior outcomes, either in return or in risk. Benos (1998) states that
overconfident investors believe that their convictions are better than they are in reality.
Hirshleifer and Luo (2001) claim that overconfident investors will underestimate the risk of
their investments. As a result, they trade more frequently.
Most of the evidence supports the proposition that overconfidence negatively
impacts the outcomes of people’s decisions. This evidence mostly concerns individual
investors, and mostly deals with investor behavior regarding stock portfolios. Generally, these
studies investigate whether there is interdependence between overconfidence and trading
activity, where trading activity can be interpreted as a proxy for decisions – decisions to buy,
sell, or hold a stock. A common result of these studies is that the decisions of investors are
affected by overconfidence: overconfident investors are found to trade more than their non-
overconfident counterparts (Benos (1998), Odean (1998b), and Barber and Odean (2000)) .
This overtrading is generally found to be associated with weak investment performance,
implying that superior information is not the cause of the trading intensity.
The few exceptions that deal with the effect of overconfidence within a corporate
setting include most notably the empirical work by Malmendier and Tate (2005a, b, 2008) and
Malmendier, Tate and Yan (2006). They use a number of proxies for overconfidence, and
show that the interaction term of available cash and overconfidence is positively and
significantly related to the intensity of capital expenditure within corporations. This result
suggests that the investment decisions of corporations are affected by overconfidence of the
CEO.

2
We investigate the corporate investment activity in US Real Estate Investment Trusts
(REITs). The advantage of looking at REITs is that their investment projects can be exactly
identified. For most other corporations, such ease and precision of measurement is not
possible.
Furthermore, it is usually not possible to determine the value of individual
investment projects within a corporation. Here also, REITs offer a special opportunity for the
researcher, because information regarding the value of all the assets held by the REITs is
available. REITs are legally required to have 75 percent of their assets invested in real estate
assets, and in practice, they invest almost all their capital in it. The REITs in our sample had
on average 98.6 percent of their assets in real estate over the sample period. Therefore, the
projects that REITs undertake are predominantly the acquisition, operation, and sale of real
estate, and they report the acquisition and sales values.
Because of these reporting requirements, the beginning and the end of each project
can be clearly observed. So the econometrician can observe the time of the decisions to start
(acquisition), to hold (operation), or to end (sale) projects. Consequently, it is possible to
create measures of corporate investment activity. These are based on the dollar value of
purchases and sales of properties and the number properties purchased and sold. We
separately investigate corporate purchasing and sales activity, following Glaser and Weber
(2007) who find that buy and sell decisions are driven by different factors.
We estimate the relation between corporate investment activity and CEO
overconfidence measures, using appropriate control variables. CEO overconfidence is
approximated by the CEO’s trading in own-company stock. A CEO is said to be
overconfident if he is a net buyer of his own company’s stocks, i.e. if he buys more own
company stocks than he sells throughout the sample period.
3
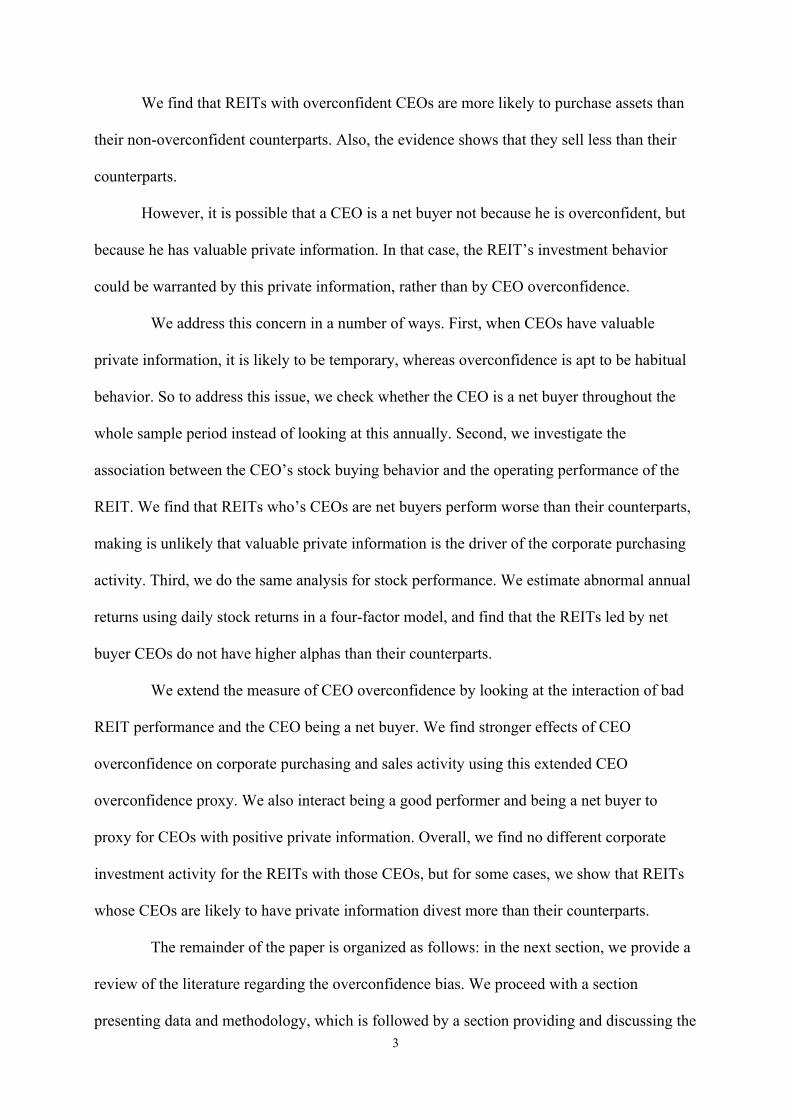
We find that REITs with overconfident CEOs are more likely to purchase assets than
their non-overconfident counterparts. Also, the evidence shows that they sell less than their
counterparts.
However, it is possible that a CEO is a net buyer not because he is overconfident, but
because he has valuable private information. In that case, the REIT’s investment behavior
could be warranted by this private information, rather than by CEO overconfidence.
We address this concern in a number of ways. First, when CEOs have valuable
private information, it is likely to be temporary, whereas overconfidence is apt to be habitual
behavior. So to address this issue, we check whether the CEO is a net buyer throughout the
whole sample period instead of looking at this annually. Second, we investigate the
association between the CEO’s stock buying behavior and the operating performance of the
REIT. We find that REITs who’s CEOs are net buyers perform worse than their counterparts,
making is unlikely that valuable private information is the driver of the corporate purchasing
activity. Third, we do the same analysis for stock performance. We estimate abnormal annual
returns using daily stock returns in a four-factor model, and find that the REITs led by net
buyer CEOs do not have higher alphas than their counterparts.
We extend the measure of CEO overconfidence by looking at the interaction of bad
REIT performance and the CEO being a net buyer. We find stronger effects of CEO
overconfidence on corporate purchasing and sales activity using this extended CEO
overconfidence proxy. We also interact being a good performer and being a net buyer to
proxy for CEOs with positive private information. Overall, we find no different corporate
investment activity for the REITs with those CEOs, but for some cases, we show that REITs
whose CEOs are likely to have private information divest more than their counterparts.
The remainder of the paper is organized as follows: in the next section, we provide a
review of the literature regarding the overconfidence bias. We proceed with a section
presenting data and methodology, which is followed by a section providing and discussing the

4
empirical findings regarding the relation between CEO overconfidence and corporate
investment activity. In that section, we also document the results of the robustness checks.
The final section concludes the paper.
II. Literature Review
Overconfident people tend to overestimate the outcomes of their decisions and underestimate
the risks associated with those decisions in the literature. Shiller (1999) defines confidence as
“an attitude that nothing can go wrong with the investment, that investors can sleep easy since
there is nothing to worry about”. Benos (1998) reasons that overconfidence can result from
investors believing that their convictions are better than they are in reality, which, in its most
extreme representation, leads investors to believe that they are always precisely correct.
Scheinkman and Xiong (2003) state that overconfidence results from an
overestimation of the precision of knowledge instead of information, calling it “illusion of
knowledge”. Miller and Ross (1975) claim that people tend to think that successes result from
their own ability, whereas failures result from bad luck. This means that people not only think
of themselves as being better than the average person, but also frame successes and failures in
a way that will shed a favourable light on them.
Hirshleifer and Luo (2001) define overconfidence as “overestimation of the precision
of private information signals”, which means that overconfident investors will simply
underestimate the risk of an investment. It is widely used in the literature on overconfidence,
see e.g. Chuang and Lee (2006), as well as Biais, Hilton, Mazurier, and Pouget (2005),
Daniel, Hirshleifer, and Subrahmanyam (1998, 2001), De Long, Shleifer, Summers, and
Waldmann (1991), and Odean (1998b).
What drives overconfidence among people has also been discussed in the literature.
Deaves et al. (2005) examine whether professional education and experience reduce
overconfidence. In a survey study of German financial market practitioners, they show that

5
market forecasters are extremely overconfident, and overconfidence is increased by successes
which they measure by correct predictions. Furthermore, they find that market experience,
commonly seen to be resulting from past successes, is positively related to overconfidence.
Deaves et al. explain this by cognitive dissonance, which leads people to forget
things that did not yield the expected results; self-attribution bias, which makes us
remembering successes very clearly and forget about failures; and confirmatory bias, which is
the tendency that is inherent in everybody to look for evidence that is consistent with the
existing beliefs and neglecting data that is inconsistent with them.
The question whether overconfidence stays out there or changes over time has also
been addressed. Menkhoff and Nikiforow (2009).show that the knowledge of behavioural
biases changes the way the managers perceive the markets, but not the way they see
themselves. The evidence consequently indicates that learning cannot remove overconfidence,
as this is a characteristic that is inherent within the person, not the market. Hirshleifer and Luo
(2001) model a market environment in which they can observe the evolution of the
overconfident and rational investor population, but where the individual overconfidence level
does not evolve over time.
Gervais and Odean (2001) develop a model in which they can observe the evolution
of overconfidence within investors as opposed to Hirshleifer and Luo (2001) who examine the
evolution of the overconfident and rational investor population. They show in a dynamic
multi-period market model that overconfidence resulting from self-attribution bias is a
personality trait that can be learned and that can vary over time, depending on recent
experience.
Glaser et al. (2005) directly compare overconfidence within professional traders and
investment bankers to a control group of students. Whilst their data reveals stable differences
between participants within tasks, correlations across different tasks are insignificant or even
negative. This indicates that somebody who is very overconfident in one task is not

6
necessarily as overconfident in another task; he might not be overconfident or even under-
confident in another task.
Taken together, their evidence corroborates the findings of D. Griffin and Tversky
(1992) who show that overconfidence for difficult tasks with low predictability tends to be
more prevalent within experts than beginners, but for less difficult tasks with high
predictability experts are found to be better calibrated than beginners.
Another aspect of the development of overconfidence, the importance of human
interaction, is highlighted by Cheng (2007) who, by examining electronic versus open outcry
markets, finds that, whilst all traders are overconfident, those participating in open outcry
markets tend to be more overconfident and consequently have a poorer performance
compared to those participating in electronic markets. He attributes this to the higher
interaction in the open outcry markets, where traders are able to see the reaction of others
unlike in an electronic market environment where traders act isolated from other traders.
De Long et al. (1991) create a model that allows them to show whether rational
traders or noise traders will dominate the market, or if one of the groups will even eventually
die out. Noise traders are defined as investors who wrongly interpret information and
underestimate risk, and therefore tend to take more risk than they usually would.
Whereas in the model of De Long et al. (1991) it is assumed that overconfident
investors simply tilt their portfolios extremely to the market portfolio because they
underestimate its risk, Hirshleifer and Luo (2001) develop a model where investors trade
more aggressively on their information since they underestimate the risk they take and
overestimate the expected value they get by trading.
Whereas De Long et al. (1991) argue it is because of higher risk taking that some
overconfident traders are successful and become very wealthy, Gervais and Odean (2001),
argue it is exactly the other way round. According to their reasoning it is not overconfidence
7
that makes traders wealthy. Traders are made overconfident by the process by which they
become wealthy and therefore there will always be overconfident traders in equilibrium.
Since overconfident people overestimate the outcomes of their decisions and
underestimate the risk associated with their decisions, they trade beyond the optimal level. As
a result, they may perform worse than their non-overconfident counterparts. The empirical
evidence suggests that this is the case: overconfident investors seem to perform worse than
the rational ones. (Brad M. Barber and Terrance Odean, 2001, 2002, 2000, Terrance Odean,
1999)
The theory developed by Dow and Gorton (1997) grounds on an agency problem
where portfolio management incentives are not correctly aligned to investor interest. This is
because investors cannot distinguish if a manager refrains from trading after conducting his
research because this is more beneficial than to trade or if he is simply doing nothing.
Consequently, managers might trade in order to justify their salary, simply gambling and
hoping for a satisfactory outcome, although it would be preferable not to trade. As a result
there will be “rational” noise trading in equilibrium.
Looking at empirical studies that examined overconfidence as a particular
behavioral bias, it has been suggested so far that overconfidence affects individual investors’
trading patterns as well as their returns. There is a vast literature on the effect of
overconfidence on individual investors’ returns; the literature on the effect of overconfidence
on investors’ trading behaviour is much less extensive. Generally this literature shows that
overconfident individual investors tend to trade more (Brad M. Barber and Terrance Odean,
2001, 2002, Alexandros V. Benos, 1998, Wen- I. Chuang and Bong-Soo Lee, 2006, Richard
Deaves, Erik Lüders and Guo Ying Luo, 2009, Simon Gervais and Terrance Odean, 2001,
Markus Glaser and Martin Weber, 2007, John R. Graham et al., 2005, Terrance Odean, 1999,
1998b), thereby harming their returns (Brad M. Barber and Terrance Odean, 2001, 2002,

8
2000, Bruno Biais, Denis Hilton, Karine Mazurier and Sébastien Pouget, 2005, Simon
Gervais and Terrance Odean, 2001, Terrance Odean, 1999).
Benos (1998) develops a strategic trading model based on a call auction market with
some overconfident investors where he shows that the profits of overconfident traders should
actually be higher than those of rational traders. The model shows that overconfident
investors increase trading, which is in line with Black’s (1986) noise theory in which trading
is induced by noise, i.e., a misevaluation of information.
Also studying market models that are built on the assumption that investors are
rational with the exception of how they value the available information, Odean (1998b) finds
that the most robust effect that is caused by overconfidence is that trading volume increases.
In a later empirical study based on the findings of these models Odean (1999)
explicitly tests the hypothesis that individual investors will trade too much with respect to
what could be expected from a rational point of view due to overconfidence. He shows that on
average the returns of investors are reduced due to trading, even after controlling for trades
that potentially are motivated by rational reasons such as liquidity needs, portfolio
rebalancing or tax-motivated sales.
The conclusion is that it is overconfidence that induces investors’ trading. The
results show that even in the absence of trading costs investors harm their performance with
their trading due to their stock selection, which is an even stronger result than the one
predicted by the overconfidence hypothesis.
The relationship between overconfidence and individual performance has also been
investigated. Barber and Odean (2000) show in their analysis of the portfolio performance of
individual investors that those trading most have the lowest returns net of trading costs, with a
negligible difference gross of trading costs, confirming the results of Odean (1999). In a
following study Barber and Odean (2001) link high trading to overconfidence by testing the

9
hypotheses that men trade more than women, and that because they trade more they have
lower returns.
Literature suggests that men tend to be more overconfident than women and this is
found to be most distinct for masculine tasks such as investment decisions (cp. Sylvia Beyer,
1990, Sylvia Beyer and Edward M. Bowden, 1997, Mary A. Lundeberg et al., 1994), and due
to this assumption they can test these overconfidence hypotheses. The evidence allows both
hypotheses to be confirmed, indicating that overconfidence influences trading and returns.
In studying an experimental market, Biais et al. (2005) find evidence that the
assumption of men being more overconfident than women might not be correct as they find
no correlation between miscalibration and gender. Their results show, however, that whereas
the performance of women is not significantly affected by miscalibration, miscalibration
harms the performance of men. Deaves et al. (2009) also develop an experimental market to
investigate the link between overconfidence and trading activity. Their results show a positive
relation between overconfidence and trading activity.
Gervais and Odean (2001) find that aggressive trading of overconfident investors
increases trading volume and leads to lower expected profits due to suboptimal behaviour.
This means that a successful investor’s expected profits may in fact be lower than the
expected profits of an investor that is less successful, and they conclude that although
successful investors are inclined to be good, they are less good than they themselves believe
they are.
Barber and Odean (2002) find additional evidence for the hypothesis that
overconfidence leads to increased trading. They show that after switching their brokerage
accounts from telephone-based trading to online trading, investors perform far worse than
before, despite lower trading costs. This fact is attributed to the higher trading frequency,
which is induced by overconfidence and negatively impacts on investor’s performance, a

10
phenomenon that was already observed by them in an earlier study (Brad M. Barber and
Terrance Odean, 2000).
Chuang and Lee (2006) suggest that overconfidence induces more trading than could
be rationally argued for. They also find that overconfident investors suffer from the self-
attribution bias and react more to private information than to public information. Because
traders believe by mistake that their information is superior and that they have better abilities
than other traders, they will trade. Furthermore, overconfident investors are also found to
trade more in riskier stocks.
Most of the studies in the overconfidence literature investigate individual investors.
There are very few papers evaluating overconfidence for corporations. Malmendier and Tate
(2005a) investigate overconfidence on corporations and prove that corporate investment by
overconfident CEOs is more sensitive to cash flow than corporate investment of non-
overconfident CEOs and when there is available cash flow, overconfident CEOs invest more.
In their paper, they do not evaluate individual investment decisions but instead use an overall
investment measure.
In a follow-up paper, Malmendier and Tate (2008) investigate whether CEO
overconfidence affects merger decisions. They find that CEOs pay more for target companies
and those mergers by overconfident CEOs are value-destroying. Internal financing also
strengthens the relationship.
Billett and Qian (2008) show that it is past successes that make CEOs overconfident.
They find evidence that following acquisitions that were successful CEOs are more likely to
engage in further acquisitions than after acquisitions that were not. However, these following
acquisitions are not profitable anymore. These findings are linked to Roll’s (1986) hubris
hypothesis, which predicts that, due to a positive valuation error, acquiring firms pay too high
a price for acquiring their targets because managers overestimate their abilities to create
synergies from the combination.
11
III. Data and Methodology
A. Measuring CEO Project Decisions
The task of measuring CEO project decisions represents quite a problem, as usually there are
so many decisions to be made within a corporate context and it is somehow unclear how to
measure them. It is also difficult to identify when the project begins and ends. However,
studying REITs provides the unique opportunity to observe corporate decisions that are made
by the management. The majority of a REIT’s business consists of buying and selling
property, because this is a legal requirement which they have to meet in order to qualify for
favourable tax treatment (75% income rule) so main decisions that are made by the
management of REITs are the sale and the acquisition of property. As these have to be
reported with the U.S. Securities and Exchange Commission (SEC), it is possible to observe
every single project decision that has been made by management.
Following the methodology of Brounen, Eichholtz, and Ling (2007), who examine
the effects of portfolio management intensity on the risk and return patterns of publicly traded
real estate companies, corporate investment activity is calculated separately for corporate
purchasing and sales with the obtained data in order to get a comprehensive picture.
Additionally, we calculate two different corporate purchasing and sales activity measures
using either USD value of properties or number of properties. Firstly, Salesit and Purchasesit
refer to the USD value of sales and purchases, respectively, and REit refers to the total asset
value of firm i at the end of year t. Secondly, we also use number of properties purchased and
sold in each year t to proxy Salesit and Purchasesit, and total number of properties in the
portfolio of REIT i at time t to proxy for REit. The equations are as follows:

12
(1) itti
it
REREPurchases
+− )1(
2
(2) itti
it
RERESales
+− )1(
2
The reason for evaluating sales and purchases separately is argued by Glaser and
Weber (2007). They find that the decision to buy or sell is driven by different factors. This is
because the choice of shares to be sold is limited to the shares that are in the portfolio
(assuming no short sales), whereas there is a virtually unlimited choice of shares to buy. The
same should apply to real estate, probably even more as for this reasoning to hold it is
necessary to assume that there is no short selling, and in real estate there actually is no short
selling that could potentially weaken the results.
Furthermore, when selling shares investors tend to consider both their past and
future performance whereas when buying shares they consider future performance only. This
phenomenon is commonly called disposition effect and is based on Kahneman and Tversky’s
(1979) prospect theory which posits that investors will sell their winning investments while
holding on to their losing investments in order to avoid regret. The disposition effect was first
thoroughly investigated by Shefrin and Statman (1985) and is well documented by several
other studies (e.g. Brad M. Barber, Yi-Tsung Lee, Yu-Jane Liu and Terrance Odean, 2007,
Brad M. Barber and Terrance Odean, 1999, Terrance Odean, 1998a).
Studying the disposition effect within REIT managers, Crane and Hartzell (2008)
investigate whether these also show signs of the disposition effect. They prove that, consistent
with the disposition effect, REIT managers tend to sell their winning properties and hold on to
their losing properties as measured by the price change since the acquisition of the properties.
Taking all this together, the effect of CEO overconfidence therefore might be different on
corporate purchases than on sales.

13
B. Measuring CEO Overconfidence
It is possible to define overconfidence as overestimation of ones own abilities and skills and
find out if people show signs of the better-than-average effect or the self-attribution bias.
CEO Overconfidence will be measured as in Malmendier and Tate (2005a). The CEOs who
fail to minimize the exposure of their personal wealth to company-specific risk are defined as
being overconfident. This is because failure to do so indicates an overestimation of their
companies’ future returns. As a large fraction of a CEO’s wealth is dependent on the company
he works for (regular income, health insurance, pension plan, etc.), he is not perfectly hedged,
unlike outside investors in the company.
A rational CEO has to consider the value of his own-company stocks and weigh it
against the costs of underdiversification. If a CEO buys more of his own-company stocks than
he sells, he exposes himself deliberately to company risk although he could invest the money
in the market portfolio which in theory is generally seen as more efficient as it has superior
risk-return characteristics but due to overconfidence a CEO might overestimate the
prospective returns of his own projects. Consequently, he believes that he is better able to
manage his company than the average CEO and expects that during his leadership the stock
price of his company will rise more than what can objectively be expected. Because of these
beliefs, overconfident CEOs will buy own-company stock in order to profit from the future
gains they expect.
Trading in own-company stock therefore can be used to classify a CEO as
overconfident because such behaviour can be interpreted in a way that the CEO thinks he is
better able to generate returns and even better risk-return characteristics. This implies that he
shows signs of both the better-than average effect and self-attribution bias. Consequently,
stock purchase behaviour of CEOs is used as a measure for CEO overconfidence, particularly
to measure the better-than-average effect, where CEOs overestimate their personal skills, and

14
the self-attribution bias, where CEOs attribute successes to their personal skills, and failures
to bad luck.
Following Malmendier and Tate (2005a), the measure of CEO overconfidence is the
Net Buyer measure. It exploits the fact that some CEOs tend to buy additional own-company
stock although their personal wealth is already highly exposed to company risk. The
phenomenon that CEOs buy more own-company stock after they have been classified as
overconfident than before has also been documented by Billett and Qian (2008).
Malmendier and Tate (2005a) define a CEO as overconfident according to this
measure if he was a net buyer of company stock during his first five years in the sample. As
the sample period in the present study is only six years, a CEO will be categorized as
overconfident if he was a net buyer of company stock during the sample period or during the
period the company is in the sample, whichever is longer. It should be noted that If CEO
overconfidence is detected, he will be defined as being overconfident for all years. We
establish a dummy variable with the value 1 meaning “overconfident”.
C. Data and Model
The whole dataset consists of US REITs listed by SNL Financial Real Estate in the period
between 2003 and 2008. It includes REITs that started or ceased operations during this period
in order not to deal with survivorship bias. Data on the dollar value of sales and acquisitions
and the number of properties sold and purchased are obtained from SNL Financial Real Estate
database on an annual basis. Data on the purchase and sales of own-company stock for each
CEO are directly collected from SEC filings, mostly from the proxy statements, but for some
companies the 10-K filings had to be consulted. Financial determinants are from SNL
Financial Real Estate and Worldscope.
We present descriptive statistics in Table 1. 35% of the CEOs in our sample are
measured as overconfident. We see that non-overconfident CEOs annually purchase 9% and

15
sell 4% of their total property portfolio value. However, overconfident CEOs raise their
property portfolio by 16% annually with purchasing properties, which is significantly higher
than non-overconfident counterparts. Their annual corporate sales activity is 3% of their total
property portfolio.
The size of REITs managed by overconfident CEOs is smaller than the counterparts.
They have similar debt ratios. Additionally, overconfident CEOs have lower cash and lower
market-to-book ratios.
– Insert Table I here –
In order to investigate the effect of CEO overconfidence on corporate investment
activity, we estimate the following equations applying random effects model:
(3) !"#$ℎ!"#$%!" =
!! + !!!"# !"#$%! + !!!!" + !!!"#$%"&' !"#$! + !!!"#$ !"##$! + !!"
(4) !"#$%!" =
!! + !!!"# !"#$%!" + !!!!" + !!!"#$%"&' !"#$!" + !!!"#$ !"!!"!" + !!"
where !"#$ℎ!"#$%!": Corporate purchasing activity of property by REIT i in year t
!"#$%!": Corporate sales activity of property by REIT i in year t
!"# !"#$%!: Net buyer dummy for CEO at REIT i
!!": Vector of financial determinants for REIT i in year t
!"#$ !"##$!: Vector of year dummies
IV. CEO Overconfidence and Corporate Investment Activity
A. Net Buyer and Corporate Investment Activity
16
We expect that corporate investment activity increases with CEO overconfidence. As CEO
becomes overconfident, he begins to believe that his decisions bring better outcomes than
others and as a result he overestimates the outcome of his decision and underestimates the risk
associated with the decision. Overall, our main research question is whether REIT CEOs
invest in more properties as the main investment decision if they are overconfident.
Following Glaser and Weber (2007), we separate corporate investment activity into
corporate purchasing and sales activity.1 We estimate corporate purchasing and sales activity
using both dollar value and number of properties. The estimation results are presented in
Table 2. Applying random effects model, we significantly find that overconfident CEOs
annually purchase 7.5-9.5% more properties of their available portfolio than non-
overconfident counterparts for both corporate purchasing specifications.2
We also control for the effects of financial determinants, property type and yearly
dummies on corporate purchasing decision applying random effects model. We use 1st lag of
financial determinants except the size and age variable. We find that corporate purchasing
activity increases with size when we use dollar values. There is a significantly positive
relationship between lagged cash to total assets and corporate purchasing activity measured
by number of properties. This result shows that when REITs have higher cash balances
relative to total assets, corporate purchasing activity increases accordingly. We also find that
mature REITs purchase less because they may already have stabilized their property portfolio.
– Insert Table II here –
1 We find consistent results with the literature when we look at the effect of CEO overconfidence on combined corporate investment activity. 2 The results are robust to OLS estimation. We could not apply fixed effects panel data model since we do not 2 The results are robust to OLS estimation. We could not apply fixed effects panel data model since we do not allow CEO overconfidence to change over time.
17
We find that lag of market-to-book significantly has a positive impact on corporate
purchasing activity. If we proxy market-to-book for investment opportunities, the finding
indicates that REITs increase property investment next year when there are higher investment
opportunities this year. Lagged leverage has significantly negatively effects on corporate
purchasing activity for both proxies. When REITs are highly leveraged, they purchase less.
We also find that corporate purchasing activity decreased during recent financial crisis in both
specifications. Additionally, there is significantly lower corporate purchasing activity for
residential and retail REITs if we use dollar value. When we use number of buildings, there is
significantly higher corporate purchasing activity for office REITs.
In the sales equations, we find that CEO overconfidence negatively affects corporate
investment activity within 5% and 10% significance levels supporting Glaser and Weber
(2007) that corporate sales and purchasing activities may be affected differently by different
factors. If the CEO is overconfident, he sells 2-2.5% less as a percentage of total property
portfolio value than the non-overconfident counterparts when taking into account both USD
value and number of properties.
The reason for a negative impact of CEO overconfidence on property sales may be
that as the overconfident CEO believes that his decisions bring positive outcomes, he
postpones selling the property until the outcome reaches the desired value. The desired value
of the investment is higher than the non-overconfident CEO and it takes more time to reach
the target or maybe it never reaches. As a result, they sell less frequently.
Corporate sales activity significantly increases with size but the relationship is
insignificant. There is no relationship between corporate sales activity and lagged debt ratio,
although, in unreported estimations, we significantly find that corporate sales activity
decreases with leverage at time t. As the property is used for collateral, it limits the corporate
sales activity. We could not find any significant relationship between corporate sales activity
and cash to total assets. There is a significant negative relationship between corporate sales
18
activity calculated using number of properties and lagged market-to-book, implying that when
investment opportunities increase, REITs sell less property. They may sell less in order not to
decrease the property portfolio, as they tend to grow more with better investment
opportunities. Age of REITs does not have any significant influence on corporate sales
activity.
REITs dealing with industrial properties significantly sell more properties than the
rest in Equation 3. Additionally, during the crisis years, there is no significant change in
property sales but in 2005 and 2006, before the crisis, they significantly increased property
sales.
B. Robustness Checks
i. CEO Overconfidence and Corporate Performance
According to Malmendier and Tate (2005a), it is important to evaluate private information
and separate it from CEO overconfidence. We claim that a CEO is overconfident if he buys
more of own stocks than he sells. However, when there is private information, then the
manager knows that the company will perform better and the firm value will increase. As a
result of private information, the manager may increase stock ownership to enhance
individual wealth.
When we evaluate overconfident behaviour, we see that CEO overconfidence has a
negative impact on performance, following Barber and Odean (2001), Cheng (2007), etc. As
CEO believes that the outcomes of his decisions are better, then he over-invests moving away
from the optimal level. As a result, the firm must perform worse than counterparts since the
investment level is beyond the optimal level, which is not the case for positive private
information.
Additionally, overconfidence is more habitual behaviour while private information
is time-specific, according to Malmendier and Tate (2005a). This is why we measure CEO

19
over the sample but not annually so our “net buyer” measure is more associated with CEO
overconfidence than private information.
However, it is still worth to evaluate the effect of being net buyer on firm
performance not only we have more robust results but also unique REIT structure gives us the
opportunity to evaluate the link between performance and CEO overconfidence in a stronger
way at corporate level. CEO Overconfidence affects corporate investment decisions. Worse
investment decisions may mitigate performance. REITs enable us to observe and investigate
most of the corporate investment activity since they mainly buy and sell properties. Since they
have to generate 75% of their income from real estate, property investment decisions have a
stronger link than M&A decisions to overall company performance than any type of
corporation.
However, in the previous literature these links have not been investigated directly
because it is difficult to observe investment decisions for regular corporations. Malmendier
and Tate (2008) investigate mergers and acquisition activities, which are only largest
investment decisions and the market reactions to those investment decisions but not overall
impact on the company itself. Therefore, studying the link between CEO overconfidence and
performance for corporations is an important contribution to the literature, to our knowledge.
– Insert Table III here –
We estimate different traditional performance measures on CEO overconfidence and
controls, reported in Table 3 below. Applying random effects panel data regressions, in all
equations we significantly find a negative impact of being a “net buyer” on operating
performance after controlling for financial determinants, property type and year.3 This implies
that being a net buyer is more associated with CEO overconfidence and mitigates the
3 Operating performance estimation results are robust when we apply median regression.
20
performance of the company but less for positive private information. Combining this finding
with results in the previous section, we find that CEO overconfidence increases corporate
purchasing activity and decreases firm performance.
Additional to operating performance regressions, we also investigate the effect of
being net buyer on stock performance. Firstly, we regress Fama-French (1993) and Carhart
(1997) 4-factor model on daily stock returns of each REIT. We estimate the model for each
REIT i separately in year t. Then, we obtain abnormal alphas annually. In the second stage,
weighting for standard errors of alphas in the first stage, we estimate variance-weighted least
squares regression of alphas on net buyer dummy and additional controls.4
We find that net buyer CEOs have worse stock performance than their non-net buyer
counterparts in 1 of 2 regressions. In model 2 of Table 3, the effect is still not significantly
positive. This implies that being a net buyer of own company’s stocks is more associated with
overconfident behavior rather than having private information and purchasing own company’s
stock following this information.
ii. Bad Performer, Good Performer and Net Buyer: An Extended Measure
In this section, we explore a different measure for CEO overconfidence. To measure CEO
overconfidence, we look at whether a CEO is a net buyer of own-company stock, following
Malmendier and Tate (2005a). We also claim and find that CEO overconfidence is associated
with worse performance while positive private information is more related to better
performance. Then, a measure that combines being a net buyer with being a worse performer
is a better proxy for CEO overconfidence; and a measure combines being a net buyer with
being a better performer is a better proxy for positive private information.
4 The results are similar when we apply ordinary least squares in the 2nd stage.

21
To do this, we annually rank companies according to performance measures; return
on assets, return on equity and alpha5. We call a company as a good performer and give 1 if
the annual performance variable is over the median, and as a bad performer and give 1 if it is
below the median. Then, we create interaction dummies by multiplying better performer and
worse performer dummies with net buyer dummy.
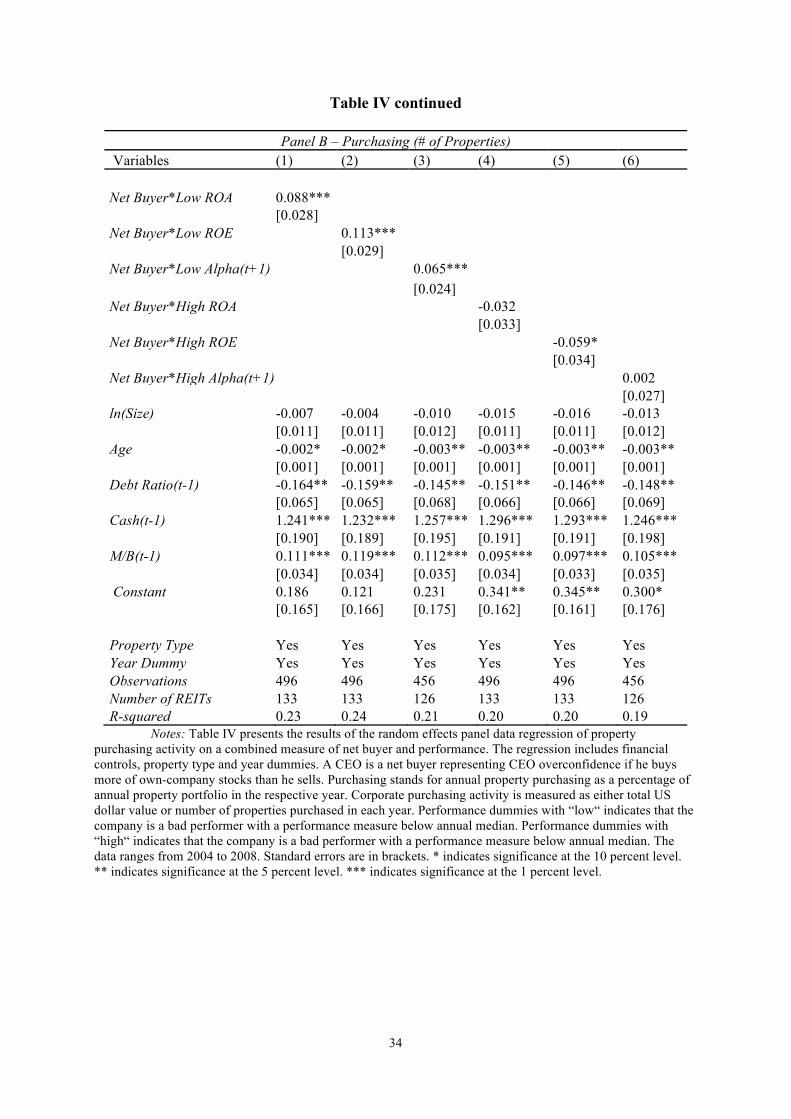
– Insert Table IV here –
The regression results on corporate purchasing activity are presented in Table 4. In
Panel A, we find that being a net buyer and worse performer significantly increases corporate
purchasing activity by around 13% of total portfolio value within 1% significance level for all
performance measures considering the operating performance. This effect is stronger than the
impact of net buyer dummy alone. The positively significant effect also holds for the alpha
interaction variable. However, being a net buyer and good performer does not significantly
affect corporate purchasing activity. Therefore, overconfident CEOs purchase more frequently
but CEOs with positive private information do not increase purchasing properties so do not
move away the optimal level of corporate investment.
We find similar results when using number of properties to calculate corporate
purchasing activity. In Equation 5, we even find negative effect of good performer & net
buyer dummy on corporate purchasing activity so managers with private information
purchase selectively and less.
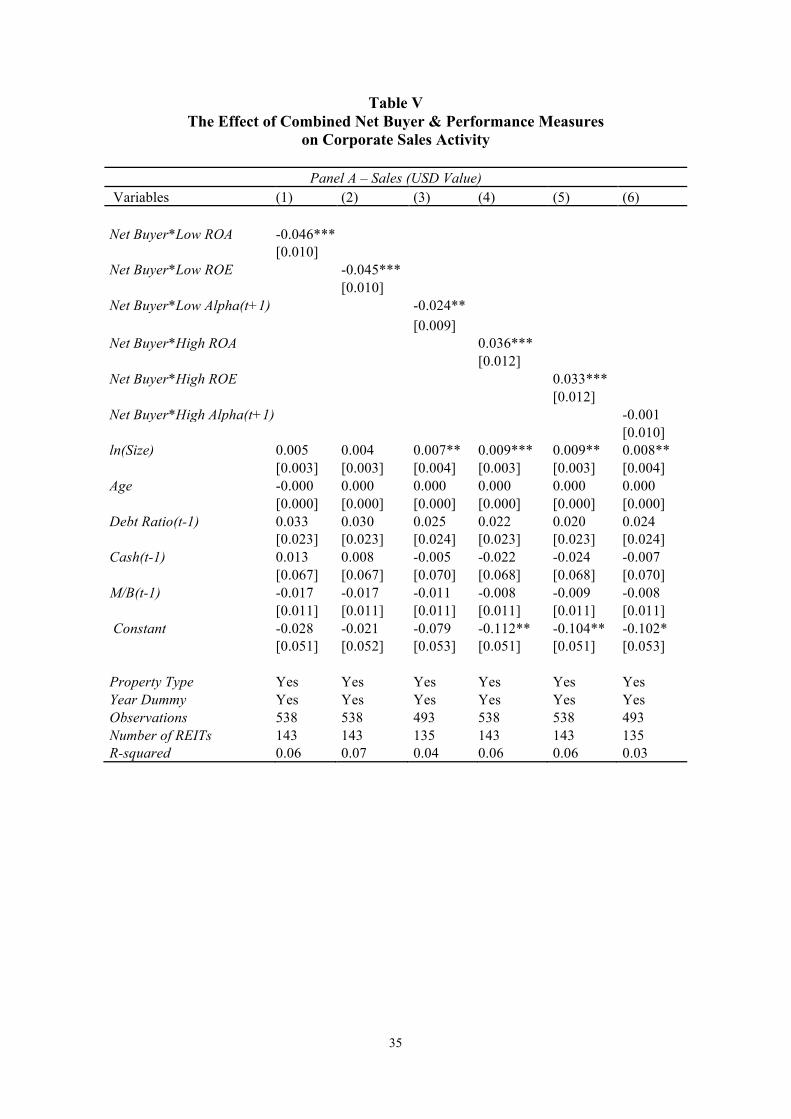
– Insert Table V here –
5 While ranking for alpha, we use t+1 because we believe that the CEO overconfidence first influences investment decisions, thus operating performance and investors realize worse performance and revise their stock valuations in the next period.
22
In Table 5, we report estimation results of our extended CEO overconfidence
measure on corporate sales activity. We find that overconfident CEOs sell less than the
counterparts by 3.5-4.5% when we use the extended CEO overconfidence dummy interacted
with operating performance measures. When we use alpha interaction dummy, overconfident
CEOs sell less by 2.4%. These effects increase from 2.1% when we use net buyer dummy
alone. Only exception in the results is that we lose significant effect of the alpha interaction
CEO overconfidence variable on corporate activity measured by number of properties.
Good performer & net buyer dummy even affects corporate sales activity positively,
indicating that managers with private information sell more frequently. Consistent with the
disposition affect proposed in Crane and Hartzell (2008), when managers have positive
information, they are more prone to sell their properties. In Panel B using number of
properties, we find similar results.
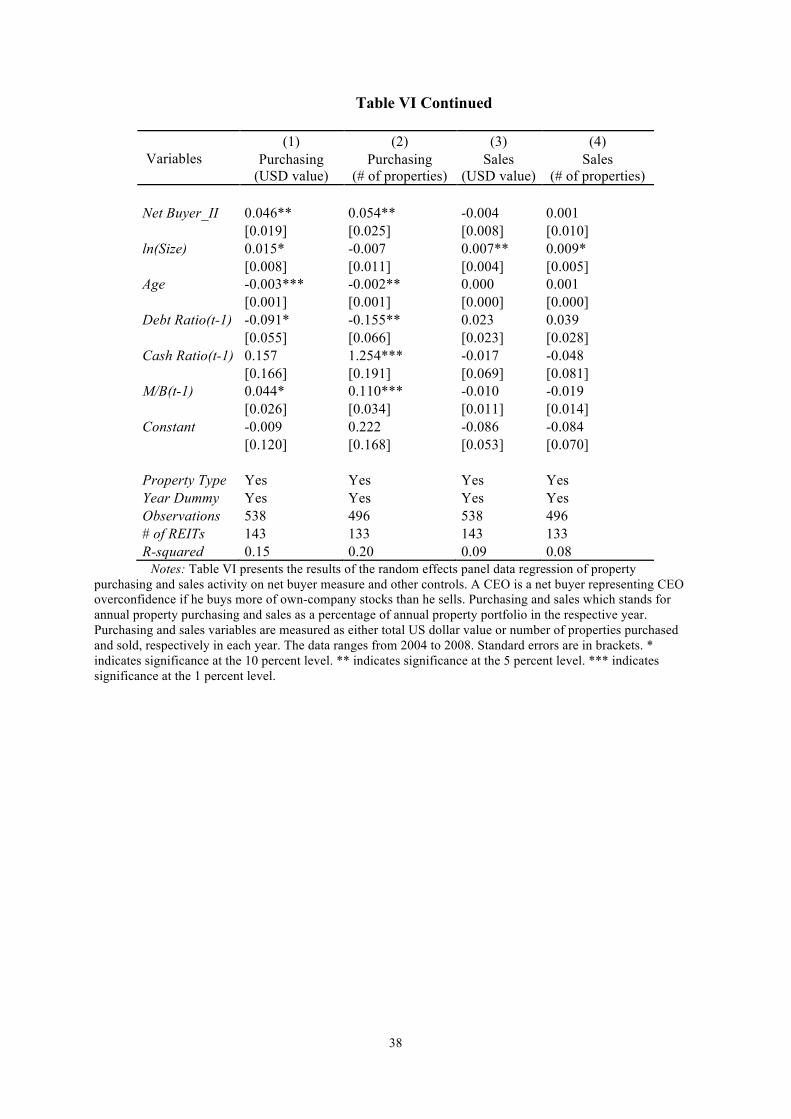
iii. Dynamic Net Buyer
In all estimations above, we assume that CEO overconfidence is a habitual behaviour so we
calculate being a net buyer over the whole period and take it constant over time. In this
section, we relax this assumption and calculate being a net buyer annually. Then, we create
two alternative net buyer measures.
Net Buyer_I is calculated as follows: When a CEO is net buyer in year t, Net
Buyer_I is assumed to be 1 and when a CEO is a net seller, Net Buyer_I gets -1. If there is no
stock trading by CEOs, Net Buyer_I is assumed to be equal to 0. Net Buyer_II is assumed to
be constant over time but takes into account annual stock trading frequency. Net Buyer_II is
calculated using the following equation:
(5) !"# !"#$%_!! = # !" !"#$% !"#$% !"# !"#$%!# !" !"#$% !"#$% !"# !"##"$# !" !"#$% !"!#$!%$&

23
– Insert Table VI here –
Estimation results are presented in Table 6. Using alternative net buyer measures we
find weaker but still significantly positive effect of being net buyer on corporate purchasing
and sales activity indicating that habitual net buyer measure supports the hypothesis that CEO
overconfidence increases corporate purchasing activity stronger. The positive effect declines
to 2.5-4% with the alternative net buyer measures.
In corporate sales activity regressions we find significantly negative effect of CEO
overconfidence in 1 out of 4 regressions so there is still some evidence with alternative net
buyer measures that overconfident managers sell less than their non-overconfident
counterparts.
V. Concluding Remarks
Outside of mutual funds, the effects of behavioral biases of professional managers have not
been intensively investigated. This is likely due to the difficulty to identify and track
individual decisions of managers. The few exceptions that do investigate the effect of
behavioral biases within a corporate setting include most notably the empirical studies by
Malmendier and Tate (2005a, b, 2008), Malmendier, Tate, and Yan (2006), and Crane and
Hartzell (2009). Malmendier and Tate (2005a) relate overconfidence to investment–cash-flow
sensitivity of CEOs and show that CEO overconfidence has a positive effect on investment,
which is measured using firm capital expenditures.
Crane and Hartzell (2008) investigate a different behavioral aspect, the disposition
effect, using a REIT sample. REITs offer an ideal setting to investigate professional
managers’ investment decisions. Investment and divestment decisions can easily be identified
24
since REITs mainly purchase and sell buildings, so most of the investment decisions can be
followed by the researcher. Additionally, REIT asset values are transparent, making it
possible to observe how much a firm spent when investing in a project.
We investigate the effect of CEO overconfidence on corporate investment activity
using REITs. Using a REIT sample gives us the opportunity to identify each investment
decision and observe how frequently REIT managers invest and to relate corporate investment
activity to CEO overconfidence, and do that separately using corporate purchases and sales.
We define a CEO as overconfident if he buys more of his own company stock than he sells
throughout the whole sample period, following Malmendier and Tate (2005a). We find that
overconfident CEOs significantly purchase more properties than non-overconfident
counterparts. Between 6% and 13%, we also document that overconfident CEOs are
significantly more likely to hold properties than their non-overconfident counterparts. Our
results are robust to alternative net buyer measures.
A CEO being a net buyer of his own company’s stock might either indicate CEO
overconfidence or access to private information. However, with private information, we
expect managers to perform better, while overconfident CEOs trade non-optimally so must
have worse performance. We evidence that overconfident CEOs significantly have worse
operating performance than their non-overconfident counterparts. As a result, their operating
performance worsens.
Additionally, we also investigate the relationship between stock performance and net
buyer dummy. We find that there is no significant positive effect of being net buyer of own
company’s stock on the stock performance. In one specification, we even find significantly
negative impact of net buyer dummy on the abnormal returns. These results support that our
net buyer measure is more associated with CEO overconfidence rather than buying stocks
following private information.
25
To separate overconfident managers from those who have access to private
information, we combine being a net buyer of own company stock with the performance of
the company. First, we interact net buyer with bad performance to have an extended measure
of CEO overconfidence. Additional to this, we also interact a net buyer dummy with a good
performer dummy to proxy for managers having private information. An interaction dummy
of being a bad performer and being a net buyer of own company stocks gives stronger results
than the net buyer dummy alone. Overconfident CEOs purchase more and sell less. When we
use an interaction dummy of being a good performer and a net buyer of own company stocks,
it even has opposite impacts on corporate purchasing and sales activities indicating that CEOs
with private information behave and trade different from overconfident CEOs. Interaction
dummies calculated using alphas also show similar results.

26
References
Akerlof, George A. 1970. "The Market for "Lemons": Quality Uncertainty and the Market Mechanism." The Quarterly Journal of Economics, 84(3), 488-500. Barber, Brad M.; Yi-Tsung Lee; Yu-Jane Liu and Terrance Odean. 2007. "Is the Aggregate Investor Reluctant to Realise Losses? Evidence from Taiwan." European Financial Management, 13(3), 423-47. Barber, Brad M. and Terrance Odean. 2001. "Boys Will Be Boys: Gender, Overconfidence, and Common Stock Investment." The Quarterly Journal of Economics, 116(1), 261-92. Barber, Brad M. and Terrance Odean. 1999. "The Courage of Misguided Convictions." Financial Analysts Journal, 55(6), 41. Barber, Brad M. and Terrance Odean. 2002. "Online Investors: Do the Slow Die First?" The Review of Financial Studies, 15(2), 455-87. Barber, Brad M. and Terrance Odean. 2000. "Trading Is Hazardous to Your Wealth: The Common Stock Investment Performance of Individual Investors." The Journal of Finance, 55(2), 773-806. Benos, Alexandros V. 1998. "Aggressiveness and Survival of Overconfident Traders." Journal of Financial Markets, 1(3-4), 353-83. Bernardo, Antonio E. and Ivo Welch. 2001. "On the Evolution of Overconfidence and Entrepreneurs," SSRN eLibrary. Bessembinder, Hendrik; Kalok Chan and Paul J. Seguin. 1996. "An Empirical Examination of Information, Differences of Opinion, and Trading Activity." Journal of Financial Economics, 40(1), 105-34. Bessembinder, Hendrik and Paul J. Seguin. 1993. "Price Volatility, Trading Volume, and Market Depth: Evidence from Futures Markets." The Journal of Financial and Quantitative Analysis, 28(1), 21-39. Beyer, Sylvia. 1990. "Gender Differences in the Accuracy of Self-Evaluations of Performance." Journal of Personality and Social Psychology, 59(5), 960-70. Beyer, Sylvia and Edward M. Bowden. 1997. "Gender Differences in Seff-Perceptions: Convergent Evidence from Three Measures of Accuracy and Bias." Pers Soc Psychol Bull, 23(2), 157-72. Biais, Bruno; Denis Hilton; Karine Mazurier and Sébastien Pouget. 2005. "Judgemental Overconfidence, Self-Monitoring, and Trading Performance in an Experimental Financial Market." Review of Economic Studies, 72(2), 287-312. Billett, Matthew T. and Yiming Qian. 2008. "Are Overconfident Ceos Born or Made? Evidence of Self-Attribution Bias from Frequent Acquirers." MANAGEMENT SCIENCE, 54(6), 1037-51. Black, Fischer. 1986. "Noise." The Journal of Finance, 41(3), 529-43. Brounen, Dirk; Piet Eichholtz and David Ling. 2007. "Trading Intensity and Real Estate Performance." The Journal of Real Estate Finance and Economics, 35(4), 449-74. Brueggeman, William B. and Jeffrey D. Fisher. 2002. Real Estate Finance and Investments. Boston [u.a.]: McGraw-Hill Irwin. Camerer, Colin and Dan Lovallo. 1999. "Overconfidence and Excess Entry: An Experimental Approach." The American Economic Review, 89(1), 306-18. Campbell, John Y.; Tarun Ramadorai and Allie Schwartz. 2009. "Caught on Tape: Institutional Trading, Stock Returns, and Earnings Announcements." Journal of Financial Economics, 92(1), 66-91. Carhart, M. M. 1997. "On Persistence in Mutual Fund Performance." Journal of Finance, 52(1), 57-82.
27
Carpenter, Jennifer N. and Barbara Remmers. 2001. "Executive Stock Option Exercises and inside Information." The Journal of Business, 74(4), 513-34. Cheng, Philip Y. K. 2007. "The Trader Interaction Effect on the Impact of Overconfidence on Trading Performance: An Empirical Study." Journal of Behavioral Finance, 8(2), 59 - 69. Chordia, Tarun; Sahn-Wook Huh and Avanidhar Subrahmanyam. 2007. "The Cross-Section of Expected Trading Activity." Rev. Financ. Stud., 20(3), 709-40. Chuang, Wen- I. and Bong-Soo Lee. 2006. "An Empirical Evaluation of the Overconfidence Hypothesis." Journal of Banking & Finance, 30(9), 2489-515. Crane, Alan D. and Jay C. Hartzell. 2008. "Is There a Disposition Effect in Corporate Investment Decisions? Evidence from Real Estate Investment Trusts," Working Paper. SSRN, Daniel, Kent D.; David Hirshleifer and Avanidhar Subrahmanyam. 1998. "Investor Psychology and Security Market under- and Overreactions." Journal of Finance, 53(6), 1839-85. Daniel, Kent D.; David Hirshleifer and Avanidhar Subrahmanyam. 2001. "Overconfidence, Arbitrage, and Equilibrium Asset Pricing." The Journal of Finance, 56(3), 921-65. De Long, J. Bradford; Andrei Shleifer; Lawrence H. Summers and Robert J. Waldmann. 1990. "Noise Trader Risk in Financial Markets." Journal of Political Economy, 98(4), 703. De Long, J. Bradford; Andrei Shleifer; Lawrence H. Summers and Robert J. Waldmann. 1991. "The Survival of Noise Traders in Financial Markets." The Journal of Business, 64(1), 1-19. Deaves, Richard; Erik Lüders and Guo Ying Luo. 2009. "An Experimental Test of the Impact of Overconfidence and Gender on Trading Activity." Review of Finance, 13(3), 555-75. Deaves, Richard; Erik Lüders and Michael Schröder. 2005. "The Dynamics of Overconfidence: Evidence from Stock Market Forecasters," SSRN eLibrary. Dow, James and Gary Gorton. 1997. "Noise Trading, Delegated Portfolio Management, and Economic Welfare." The Journal of Political Economy, 105(5), 1024-50. Fama, Eugene F. and Kenneth R. French. 1993. "Common Risk Factors in the Returns on Stocks and Bonds." The Journal of Financial Economics, 33(1), 3-56. Fischhoff, Baruch; Paul Slovic and Sarah Lichtenstein. 1977. "Knowing with Certainty: The Appropriateness of Extreme Confidence." Journal of experimental psychology. Human perception and performance, 3(4), 552. Gallant, A. Ronald; Peter E. Rossi and George Tauchen. 1992. "Stock Prices and Volume." The Review of Financial Studies, 5(2), 199-242. Gervais, Simon and Terrance Odean. 2001. "Learning to Be Overconfident." The Review of Financial Studies, 14(1), 1-27. Glaser, Markus and Martin Weber. 2007. "Overconfidence and Trading Volume." The GENEVA Risk and Insurance Review, 32(1), 1-36. Glaser, Markus and Martin Weber. 2009. "Which Past Returns Affect Trading Volume?" Journal of Financial Markets, 12(1), 1-31. Glaser, Markus; Martin Weber and Thomas Langer. 2005. "Overconfidence of Professionals and Lay Men: Individual Differences within and between Tasks?," SSRN eLibrary. Graham, John R.; Campbell R. Harvey and Hai Huang. 2005. "Investor Competence, Trading Frequency, and Home Bias," SSRN eLibrary. Griffin, Dale and Amos Tversky. 1992. "The Weighing of Evidence and the Determinants of Confidence." Cognitive Psychology, 24(3), 411-35.

28
Griffin, John M.; Federico Nardari and Rene M. Stulz. 2007. "Do Investors Trade More When Stocks Have Performed Well? Evidence from 46 Countries." Rev. Financ. Stud., 20(3), 905-51. Hales, Jeffrey. 2009. "Are Investors Really Willing to Agree to Disagree? An Experimental Investigation of How Disagreement and Attention to Disagreement Affect Trading Behavior." Organizational Behavior and Human Decision Processes, 108(2), 230-41. Hall, Brian J. and Kevin J. Murphy. 2002. "Stock Options for Undiversified Executives." Journal of Accounting and Economics, 33(1), 3-42. Harris, Milton and Artur Raviv. 1993. "Differences of Opinion Make a Horse Race." The Review of Financial Studies, 6(3), 473-506. Hirshleifer, David. 2001. "Investor Psychology and Asset Pricing." Journal of Finance, 56(4), 1533-97. Hirshleifer, David and Guo Ying Luo. 2001. "On the Survival of Overconfident Traders in a Competitive Securities Market." Journal of Financial Markets, 4(1), 73-84. Jensen, Michael C. 1969. "Risk, the Pricing of Capital Assets, and the Evaluation of Investment Portfolios." The Journal of Business, 42(2), 167-247. Jin, Li and S. P. Kothari. 2008. "Effect of Personal Taxes on Managers' Decisions to Sell Their Stock." Journal of Accounting and Economics, 46(1), 23-46. Kahneman, Daniel and Amos Tversky. 1979. "Prospect Theory: An Analysis of Decision under Risk." Econometrica, 47(2), 263-91. Kandel, Eugene and Neil D. Pearson. 1995. "Differential Interpretation of Public Signals and Trade in Speculative Markets." The Journal of Political Economy, 103(4), 831-72. Karpoff, Jonathan M. 1987. "The Relation between Price Changes and Trading Volume: A Survey." The Journal of Financial and Quantitative Analysis, 22(1), 109-26. Kyle, Albert S. and F. Albert Wang. 1997. "Speculation Duopoly with Agreement to Disagree: Can Overconfidence Survive the Market Test?" The Journal of Finance, 52(5), 2073-90. Lee, Charles M. C. and Bhaskaran Swaminathan. 2000. "Price Momentum and Trading Volume." The Journal of Finance, 55(5), 2017-69. Lundeberg, Mary A.; Paul W. Fox and Judith Puncochar. 1994. "Highly Confident but Wrong: Gender Differences and Similarities in Confidence Judgments." Journal of Educational Psychology, 86(1), 114-21. Malmendier, Ulrike and Geoffrey Tate. 2005a. "Ceo Overconfidence and Corporate Investment." The Journal of Finance, 60(6), 2661-700. Malmendier, Ulrike and Geoffrey Tate. 2005b. "Does Overconfidence Affect Corporate Investment? Ceo Overconfidence Measures Revisited." European Financial Management, 11(5), 649-59. Malmendier, Ulrike and Geoffrey Tate. 2008. "Who Makes Acquisitions? Ceo Overconfidence and the Market's Reaction." Journal of Financial Economics, 89(1), 20-43. Malmendier, Ulrike; Geoffrey A. Tate and Jun Yan. 2006. "Corporate Financial Policies with Overconfident Managers," Working Paper. SSRN, Menkhoff, Lukas and Marina Nikiforow. 2009. "Professionals' Endorsement of Behavioral Finance: Does It Impact Their Perception of Markets and Themselves?" Journal of Economic Behavior & Organization, 71(2), 318-29. Miller, Dale T. and Michael Ross. 1975. "Self-Serving Biases in the Attribution of Causality: Fact or Fiction?" Psychological Bulletin, 82(2), 213-25. NAREIT. 2009. "Ftse Nareit Us Real Estate Index," National Association of Real Estate Investment Trusts, Oberlechner, Thomas and Carol L. Osler. 2008. "Overconfidence in Currency Markets," SSRN eLibrary.

29
Odean, Terrance. 1998a. "Are Investors Reluctant to Realize Their Losses?," Journal of Finance. 1775-98. Odean, Terrance. 1999. "Do Investors Trade Too Much?" The American Economic Review, 89(5), 1279-98. Odean, Terrance. 1998b. "Volume, Volatility, Price, and Profit When All Traders Are above Average." The Journal of Finance, 53(6), 1887-934. Roll, Richard. 1986. "The Hubris Hypothesis of Corporate Takeovers." The Journal of Business, 59(2), 197-216. Scheinkman, José A. and Wei Xiong. 2003. "Overconfidence and Speculative Bubbles." The Journal of Political Economy, 111(6), 1183-219. Shefrin, Hersh and Meir Statman. 1985. "The Disposition to Sell Winners Too Early and Ride Losers Too Long: Theory and Evidence." Journal of Finance, 40(3), 777-90. Shiller, Robert J. 1999. "Measuring Bubble Expectations and Investor Confidence," National Bureau of Economic Research Working Paper Series. Shleifer, Andrei and Lawrence H. Summers. 1990. "The Noise Trader Approach to Finance." Journal of Economic Perspectives, 4(2), 19-33. Simpson, John Andrew and Edward S. C Weiner eds. 1989. The Oxford English Dictionary. Oxford: Oxford University Press. Statman, Meir; Steven Thorley and Keith Vorkink. 2006. "Investor Overconfidence and Trading Volume." Rev. Financ. Stud., 19(4), 1531-65. Svenson, Ola. 1981. "Are We All Less Risky and More Skillful Than Our Fellow Drivers?" Acta Psychologica, 47(2), 143-48. Taylor, Shelley E. and Jonathon D. Brown. 1988. "Illusion and Well-Being: A Social Psychological Perspective on Mental Health." Psychological Bulletin, 103(2), 193-210. Wang, F. Albert. 2001. "Overconfidence, Investor Sentiment, and Evolution." Journal of Financial Intermediation, 10(2), 138-70. Wang, F. Albert. 1998. "Strategic Trading, Asymmetric Information and Heterogeneous Prior Beliefs." Journal of Financial Markets, 1(3-4), 321-52. Weinstein, Neil D. 1980. "Unrealistic Optimism About Future Life Events." Journal of Personality and Social Psychology, 39(5), 806-20.

30
Table I Descriptive Statistics
VARIABLE Firm-Years Mean Std. Dev. Min Max Net Buyer 653 0.35 0.48 0 1 Non-Net Buyer Purchasing 466 0.09 0.15 0 1.08 Sales 466 0.04 0.08 0 0.62 ln(Size) 424 14.57 1.31 8.06 18.39 Debt Ratio 424 0.52 0.17 0 0.94 Cash Ratio 422 0.26 0.05 0 0.58 M/B 423 1.46 0.38 0.69 4.64 Net Buyer Purchasing 242 0.16 0.25 0 1.64 Sales 242 0.03 0.09 0 0.95 ln(Size) 229 13.64 1.17 8.06 15.73 Debt Ratio 229 0.52 0.19 0 1.02 Cash Ratio 236 0.32 0.05 0 0.37 M/B 223 1.28 0.31 0.60 2.74
Notes: Table I presents the descriptive statistics for being net buyer or not. A CEO is a net buyer representing CEO overconfidence if he buys more of own-company stocks than he sells. Purchasing and sales stands for annual property purchasing and sales as a percentage of annual property portfolio in the respective year. Size stands for total assets. CGQ Index is general governance quality measure ranging from 0 to 100. Board represents governance quality related to board structure ranging from 1 to 5.

31
Table II The Effect of CEO Overconfidence
on Corporate Purchasing and Sales Activity
Variables (1) (2) (3) (4)
Purchasing (USD value)
Purchasing (# of properties)
Sales (USD value)
Sales (# of properties)
Net Buyer 0.094*** 0.074** -0.021** -0.024* [0.023] [0.031] [0.010] [0.013] ln(Size) 0.019** -0.005 0.006 0.006 [0.008] [0.012] [0.004] [0.005] Age -0.003*** -0.002** 0.000 0.001 [0.001] [0.001] [0.000] [0.000] Debt Ratio(t-1) -0.103* -0.162** 0.028 0.043 [0.055] [0.066] [0.023] [0.028] Cash Ratio(t-1) 0.126 1.258*** -0.005 -0.035 [0.165] [0.191] [0.068] [0.081] M/B(t-1) 0.052** 0.112*** -0.013 -0.024* [0.026] [0.034] [0.011] [0.014] Retail -0.034 -0.016 -0.015 -0.009 [0.026] [0.036] [0.012] [0.015] Office 0.003 0.083** 0.006 0.023 [0.027] [0.036] [0.012] [0.015] Industrial 0.005 0.021 0.048*** -0.014 [0.036] [0.049] [0.016] [0.020] Residential -0.061** 0.004 0.017 0.006 [0.029] [0.039] [0.013] [0.016] D2005 0.017 -0.032 0.022** 0.025** [0.023] [0.025] [0.009] [0.011] D2006 -0.021 -0.052** 0.031*** 0.023** [0.024] [0.026] [0.010] [0.011] D2007 -0.061** -0.103*** 0.025** 0.011 [0.026] [0.028] [0.011] [0.012] D2008 -0.132*** -0.113*** 0.009 0.003 [0.025] [0.026] [0.010] [0.011] Constant -0.111 0.160 -0.053 -0.029 [0.120] [0.175] [0.054] [0.072] Observations 538 496 538 496 # of REITs 143 133 143 133 R-squared 0.17 0.21 0.10 0.09
Notes: Table II presents the results of the random effects panel data regression of property purchasing and sales activity on net buyer measure and other controls. A CEO is a net buyer representing CEO overconfidence if he buys more of own-company stocks than he sells. Purchasing and sales which stands for annual property purchasing and sales as a percentage of annual property portfolio in the respective year. Purchasing and sales variables are measured as either total US dollar value or number of properties purchased and sold, respectively in each year. The data ranges from 2004 to 2008. Standard errors are in brackets. * indicates significance at the 10 percent level. ** indicates significance at the 5 percent level. *** indicates significance at the 1 percent level.

32
Table III CEO Overconfidence and Corporate Performance
Variables (1) (2) (3) (4) (5) Alpha Alpha Tobin’s Q ROA ROE
Net Buyer -0.011* -0.006 -0.186*** -0.823** -6.265** [0.006] [0.007] [0.039] [0.353] [2.704] Debt Ratio -0.036** -0.047** -0.350*** -5.305*** 11.660* [0.018] [0.020] [0.079] [0.916] [6.845] ln(Size) 0.003 -0.117*** -1.690*** -6.621*** [0.007] [0.018] [0.223] [1.647] ln(FFO) 0.001 0.077*** 1.704*** 5.551*** [0.007] [0.013] [0.187] [1.360] Constant 0.015 -0.044 2.419*** 13.300*** 36.115** [0.010] [0.041] [0.205] [2.088] [15.825] Property Type Yes Yes Yes Yes Yes Year Dummy Yes Yes Yes Yes Yes Observations 637 572 577 577 577 Number of REITs 154 147 154 154 154 R-squared 0.39 0.32 0.12 Chi-Squared 28.20 32.63 Prob. 0.0017 0.0011
Notes: Table III presents the results of variance-weighted least squares (WLS) regression of abnormal returns and the random effects panel data regressions of operating performance on net buyer measure and other controls. Using daily stocks of each REIT, Fama-French-Carhart 4 factor model is regressed and annual alphas calculated for each REIT. In the 2nd stage, alphas are regressed applying WLS using standard errors of alphas in the 1st stage. The coefficients presented in Model 1 and 2 are multiplied by 100. A CEO is a net buyer representing CEO overconfidence if he buys more of own-company stocks than he sells. The data ranges from 2004 to 2008. Standard errors are in brackets. * indicates significance at the 10 percent level. ** indicates significance at the 5 percent level. *** indicates significance at the 1 percent level.

33
Table IV The Effect of Combined Net Buyer & Performance Measures
on Corporate Purchasing Activity
Panel A – Purchasing (USD Value) Variables (1) (2) (3) (4) (5) (6) Net Buyer*Low ROA 0.120*** [0.023] Net Buyer*Low ROE 0.135*** [0.023] Net Buyer*Low Alpha(t+1) 0.053** [0.022] Net Buyer*High ROA -0.024 [0.029] Net Buyer*High ROE -0.041 [0.029] Net Buyer*High Alpha(t+1) 0.031 [0.024] ln(Size) 0.018** 0.020*** 0.013 0.008 0.008 0.011 [0.007] [0.007] [0.008] [0.008] [0.008] [0.008] Age -0.002*** -0.002*** -0.003*** -0.003*** -0.003*** -0.003*** [0.001] [0.001] [0.001] [0.001] [0.001] [0.001] Debt Ratio(t-1) -0.108** -0.102* -0.119** -0.081 -0.078 -0.117** [0.054] [0.053] [0.056] [0.056] [0.056] [0.056] Cash(t-1) 0.110 0.116 0.194 0.205 0.210 0.179 [0.164] [0.162] [0.162] [0.166] [0.166] [0.164] M/B(t-1) 0.050** 0.056** 0.022 0.035 0.036 0.015 [0.025] [0.025] [0.027] [0.026] [0.026] [0.026] Constant -0.092 -0.143 0.031 0.084 0.085 0.065 [0.111] [0.112] [0.121] [0.117] [0.116] [0.120] Property Type Yes Yes Yes Yes Yes Yes Year Dummy Yes Yes Yes Yes Yes Yes Observations 538 538 493 538 538 493 Number of REITs 143 143 135 143 143 135 R-squared 0.20 0.21 0.15 0.14 0.14 0.14
34
Table IV continued
Panel B – Purchasing (# of Properties) Variables (1) (2) (3) (4) (5) (6) Net Buyer*Low ROA 0.088*** [0.028] Net Buyer*Low ROE 0.113*** [0.029] Net Buyer*Low Alpha(t+1) 0.065*** [0.024] Net Buyer*High ROA -0.032 [0.033] Net Buyer*High ROE -0.059* [0.034] Net Buyer*High Alpha(t+1) 0.002 [0.027] ln(Size) -0.007 -0.004 -0.010 -0.015 -0.016 -0.013 [0.011] [0.011] [0.012] [0.011] [0.011] [0.012] Age -0.002* -0.002* -0.003** -0.003** -0.003** -0.003** [0.001] [0.001] [0.001] [0.001] [0.001] [0.001] Debt Ratio(t-1) -0.164** -0.159** -0.145** -0.151** -0.146** -0.148** [0.065] [0.065] [0.068] [0.066] [0.066] [0.069] Cash(t-1) 1.241*** 1.232*** 1.257*** 1.296*** 1.293*** 1.246*** [0.190] [0.189] [0.195] [0.191] [0.191] [0.198] M/B(t-1) 0.111*** 0.119*** 0.112*** 0.095*** 0.097*** 0.105*** [0.034] [0.034] [0.035] [0.034] [0.033] [0.035] Constant 0.186 0.121 0.231 0.341** 0.345** 0.300* [0.165] [0.166] [0.175] [0.162] [0.161] [0.176] Property Type Yes Yes Yes Yes Yes Yes Year Dummy Yes Yes Yes Yes Yes Yes Observations 496 496 456 496 496 456 Number of REITs 133 133 126 133 133 126 R-squared 0.23 0.24 0.21 0.20 0.20 0.19
Notes: Table IV presents the results of the random effects panel data regression of property purchasing activity on a combined measure of net buyer and performance. The regression includes financial controls, property type and year dummies. A CEO is a net buyer representing CEO overconfidence if he buys more of own-company stocks than he sells. Purchasing stands for annual property purchasing as a percentage of annual property portfolio in the respective year. Corporate purchasing activity is measured as either total US dollar value or number of properties purchased in each year. Performance dummies with “low“ indicates that the company is a bad performer with a performance measure below annual median. Performance dummies with “high“ indicates that the company is a bad performer with a performance measure below annual median. The data ranges from 2004 to 2008. Standard errors are in brackets. * indicates significance at the 10 percent level. ** indicates significance at the 5 percent level. *** indicates significance at the 1 percent level.
35
Table V The Effect of Combined Net Buyer & Performance Measures
on Corporate Sales Activity
Panel A – Sales (USD Value) Variables (1) (2) (3) (4) (5) (6) Net Buyer*Low ROA -0.046*** [0.010] Net Buyer*Low ROE -0.045*** [0.010] Net Buyer*Low Alpha(t+1) -0.024** [0.009] Net Buyer*High ROA 0.036*** [0.012] Net Buyer*High ROE 0.033*** [0.012] Net Buyer*High Alpha(t+1) -0.001 [0.010] ln(Size) 0.005 0.004 0.007** 0.009*** 0.009** 0.008** [0.003] [0.003] [0.004] [0.003] [0.003] [0.004] Age -0.000 0.000 0.000 0.000 0.000 0.000 [0.000] [0.000] [0.000] [0.000] [0.000] [0.000] Debt Ratio(t-1) 0.033 0.030 0.025 0.022 0.020 0.024 [0.023] [0.023] [0.024] [0.023] [0.023] [0.024] Cash(t-1) 0.013 0.008 -0.005 -0.022 -0.024 -0.007 [0.067] [0.067] [0.070] [0.068] [0.068] [0.070] M/B(t-1) -0.017 -0.017 -0.011 -0.008 -0.009 -0.008 [0.011] [0.011] [0.011] [0.011] [0.011] [0.011] Constant -0.028 -0.021 -0.079 -0.112** -0.104** -0.102* [0.051] [0.052] [0.053] [0.051] [0.051] [0.053] Property Type Yes Yes Yes Yes Yes Yes Year Dummy Yes Yes Yes Yes Yes Yes Observations 538 538 493 538 538 493 Number of REITs 143 143 135 143 143 135 R-squared 0.06 0.07 0.04 0.06 0.06 0.03

36
Table V continued
Panel B – Sales (# of Properties) Variables (1) (2) (3) (4) (5) (6) Net Buyer*Low ROA -0.035*** [0.012] Net Buyer*Low ROE -0.037*** [0.012] Net Buyer*Low Alpha(t+1) -0.006 [0.010] Net Buyer*High ROA 0.019 [0.014] Net Buyer*High ROE 0.019 [0.014] Net Buyer*High Alpha(t+1) -0.005 [0.011] ln(Size) 0.006 0.005 0.008* 0.010** 0.009** 0.008* [0.005] [0.005] [0.005] [0.005] [0.005] [0.005] Age 0.001 0.001 0.001 0.001 0.001 0.001 [0.000] [0.000] [0.000] [0.000] [0.000] [0.000] Debt Ratio(t-1) 0.045 0.042 0.041 0.039 0.038 0.041 [0.028] [0.028] [0.028] [0.028] [0.028] [0.028] Cash(t-1) -0.021 -0.023 -0.029 -0.043 -0.044 -0.026 [0.081] [0.080] [0.081] [0.081] [0.081] [0.082] M/B(t-1) -0.026* -0.028* -0.019 -0.019 -0.020 -0.018 [0.014] [0.014] [0.015] [0.014] [0.014] [0.014] Constant -0.027 -0.016 -0.074 -0.094 -0.090 -0.076 [0.068] [0.069] [0.068] [0.068] [0.068] [0.068] Property Type Yes Yes Yes Yes Yes Yes Year Dummy Yes Yes Yes Yes Yes Yes Observations 496 496 456 496 496 456 Number of REITs 133 133 126 133 133 126 R-squared 0.10 0.10 0.09 0.08 0.08 0.09
Notes: Table V presents the results of the random effects panel data regression of property sales activity on a combined measure of net buyer and performance. The regression includes financial controls,
property type and year dummies. A CEO is a net buyer representing CEO overconfidence if he buys more of own-company stocks than he sells. Sales activity stands for annual property purchasing as a percentage of annual
property portfolio in the respective year. Corporate sales activity is measured as either total US dollar value or number of properties sold in each year. Performance dummies with “low“ indicates that the company is a bad
performer with a performance measure below annual median. Performance dummies with “high“ indicates that the company is a bad performer with a performance measure below annual median. The data ranges from 2004
to 2008. Standard errors are in brackets. * indicates significance at the 10 percent level. ** indicates significance at the 5 percent level. *** indicates significance at the 1 percent level.

37
Table VI The Effect of Alternative Net Buyer
on Corporate Purchasing and Sales Activity
Variables (1) (2) (3) (4)
Purchasing (USD value)
Purchasing (# of properties)
Sales (USD value)
Sales (# of properties)
Net Buyer_I 0.034*** 0.027* -0.014** -0.006 [0.012] [0.015] [0.005] [0.006] ln(Size) 0.015* -0.009 0.006 0.008 [0.008] [0.011] [0.004] [0.005] Age -0.003*** -0.003** 0.000 0.001 [0.001] [0.001] [0.000] [0.000] Debt Ratio(t-1) -0.088 -0.153** 0.026 0.040 [0.055] [0.066] [0.023] [0.028] Cash Ratio(t-1) 0.165 1.278*** -0.006 -0.043 [0.166] [0.191] [0.068] [0.081] M/B(t-1) 0.044* 0.105*** -0.013 -0.021 [0.026] [0.034] [0.011] [0.014] Constant -0.018 0.244 -0.057 -0.064 [0.118] [0.167] [0.052] [0.069] Property Type Yes Yes Yes Yes Year Dummy Yes Yes Yes Yes Observations 538 496 538 496 # of REITs 143 133 143 133 R-squared 0.16 0.21 0.09 0.09
38
Table VI Continued
Variables (1) (2) (3) (4)
Purchasing (USD value)
Purchasing (# of properties)
Sales (USD value)
Sales (# of properties)
Net Buyer_II 0.046** 0.054** -0.004 0.001 [0.019] [0.025] [0.008] [0.010] ln(Size) 0.015* -0.007 0.007** 0.009* [0.008] [0.011] [0.004] [0.005] Age -0.003*** -0.002** 0.000 0.001 [0.001] [0.001] [0.000] [0.000] Debt Ratio(t-1) -0.091* -0.155** 0.023 0.039 [0.055] [0.066] [0.023] [0.028] Cash Ratio(t-1) 0.157 1.254*** -0.017 -0.048 [0.166] [0.191] [0.069] [0.081] M/B(t-1) 0.044* 0.110*** -0.010 -0.019 [0.026] [0.034] [0.011] [0.014] Constant -0.009 0.222 -0.086 -0.084 [0.120] [0.168] [0.053] [0.070] Property Type Yes Yes Yes Yes Year Dummy Yes Yes Yes Yes Observations 538 496 538 496 # of REITs 143 133 143 133 R-squared 0.15 0.20 0.09 0.08
Notes: Table VI presents the results of the random effects panel data regression of property purchasing and sales activity on net buyer measure and other controls. A CEO is a net buyer representing CEO overconfidence if he buys more of own-company stocks than he sells. Purchasing and sales which stands for annual property purchasing and sales as a percentage of annual property portfolio in the respective year. Purchasing and sales variables are measured as either total US dollar value or number of properties purchased and sold, respectively in each year. The data ranges from 2004 to 2008. Standard errors are in brackets. * indicates significance at the 10 percent level. ** indicates significance at the 5 percent level. *** indicates significance at the 1 percent level.