Embed Size (px)
Citation preview
CEO Network Centrality and IPO Performance
Dobrina Georgieva University of St. Thomas
Tomas Jandik
University of Arkansas
Weineng Xu University of Arkansas
This draft: June 2016 Abstract: IPO outcomes are affected by the position of the firm’s chief executive officer (CEO) within the hierarchy of all worldwide business executives, as measured by the CEO’s network centrality. IPO firms with high-centrality CEOs are associated with higher underpricing, lower likelihood of offer price increases from the initial filing range, and lower likelihood of positive overall net wealth effects for the pre-IPO investors. These results suggest that the influence and power derived from high network centrality allows CEOs to insulate themselves from monitoring of their activities and to achieve greater entrenchment, which leads to increased risk of the IPO. JEL classification: G32, L14 Keywords: Network Centrality, IPOs, Underpricing Research is supported in part by the National Science Foundation through grants MRI #0722625 (Star of Arkansas), MRI-R2 #0959124 (Razor), ARI #0963249, #0918970 (CI-TRAIN), and a grant from the Arkansas Science and Technology Authority, with resources managed by the Arkansas High Performance Computing Center. Send correspondence to Dobrina Georgieva ([email protected], Tel: (651) 962-5844), Tomas Jandik ([email protected], Tel: (479) 575-6147), and Weineng Xu ([email protected], Tel: (479) 575-5370). The authors thank seminar participants at University of Arkansas for helpful comments.
1
1. Introduction
The purpose of this paper is to examine the link between the outcomes of Initial Public
Offerings (IPOs) and the personal social network of the Chief Executive Officer (CEO) leading
the firm at the time of the IPO. We build on fast growing literature that deals with importance of
social ties – such as shared past employment, shared educational overlaps or joint top positions in
social clubs – in finance. So far, financial research has documented both benefits and costs of such
connections. Personal ties facilitate transfer of information among corporate decision makers,
which leads to more efficient loan contracting (Engelberg, Gao, and Parsons, 2012), better analyst
performance (Cohen, Malloy, and Frazzini, 2010), improved portfolio manager performance
(Cohen, Frazzini, and Malloy, 2008), greater M&A synergies (Cai and Sevilir, 2012), and overall
better corporate performance (Fracassi, 2014). On the other hand, inter-personal connections have
been found to interfere with optimal corporate governance and monitoring of managers (Fracassi
and Tate, 2012), to increase transaction costs (Cai, Walkling, and Yang, 2015), as well as to lead
to collusion among contracting managers at the expense of investors (Ishii and Xuan, 2014).
In the context of IPOs, finance studies so far have documented large benefits due to social ties.
Cooney, Madureira, Singh, and Yang (2015) find that investment banks are more likely to be
included in the IPO underwriting syndicate, and are more likely to serve in a leading role within
the syndicate, if bankers have bilateral social links to the IPO firm managers. The linked
investment banks also receive higher compensation and larger IPO share allocation. At the same
time, though, linked underwriters are also able to generate greater wealth gains for the pre-IPO
shareholders (the gains on the shares those investors retain significantly exceed losses due to
underpricing). Chuluun (2015) shows that IPOs underwritten by investment banks that occupy
more central position in the overall bank network, as well as banks that work with partners with

2
previous industry experience are associated with higher likelihood of large positive IPO
subscription price revisions, as well as with higher short-run IPO stock returns.
Our paper builds on the previous IPO-related research, but unlike the effect of bilateral social
links (Cooney et al., 2015), our focus is on the overall position of CEOs within the full network of
all business decision makers - officers and directors of both public and private firms worldwide.
Our approach allows us to capture the concept of social hierarchy. Bilateral ties often do not have
equal impact for the connected parties. People who are in higher social hierarchical positions show
have superior opportunities to transmit, gather, and control information, making such individuals
more influential and powerful (e.g. Mizruchi and Potts 1998). We follow graph theory studies
(Proctor and Loomis, 1951; Sabidussi, 1966; Freeman, 1977; Bonacich, 1972) that establish that
social network centrality – a set of measures that characterizes the overall position of an individual
within a network – describes the personal ability to influence information flows as well as
contractual outcomes ((e.g. Padgett and Ansell, 1993; Jackson, 2010). In contrast to previous
studies based on bilateral ties, we are able to capture the ability of the CEO to affect information
flows that pass through the entire network, and influence others even if no prior link exist. We
focus on two centrality measures commonly utilized in social network research: degree centrality
(the number of direct links between the CEO and any other members of the network) that assesses
the personal network size, as well as eigenvector centrality that evaluates the relevance of the
personal network (by giving greater weight to well-connected individuals linked to the CEO). Both
of these measures have been associated with greater individual influence and power (e.g. Mizruchi
and Potts 1998). Consequently, we utilize the measures of CEO influence and power to analyze
the IPO outcomes in order to answer the following questions: Are IPOs lead by well-connected
CEOs associated with greater or lower underpricing? Do underwriters of IPOs with central CEOs

3
tend to adjust subscription prices prior to the IPO launch date? And, ultimately, do initial pre-IPO
owners gain or lose during IPOs managed by central CEOs?
Our emphasis on the centrality within individual networks (based on nearly 800,000 business
executives and board members of worldwide public and private firms, tracked by BoardEx
database) is also conceptually different from studies that examine the effects of overall firm
connectedness – that is, a position of a firm in the overall network of companies, typically based
on board overlaps. The key difference is that more central firms should unambiguously generate
benefits for the investors from the positions of higher influence and power. Larcker, So, and Wang
(2013) show that high-centrality firms have superior accounting performance, Chuluun, Prevost,
and Puthenpurackal (2014) link high firm centrality to lower loan costs and overall improved debt
contracting, and Chuluun (2015) finds that more central underwriters are associated with more
valuable IPO outcomes. However, individual managers may utilize their higher influence and
power derived from more central network positions both for firm and personal benefits. Fogel,
Jandik, and McCumber (2015) show that high-centrality CFOs tend to negotiate debt contracts that
benefits their firms in the form of lower loan spreads and less restrictive covenant structures. On
the other hand, El-Khatib, Fogel, and Jandik (2015) document that high-centrality CEOs of
acquiring firms tend to launch M&A deals that benefit CEOs (in terms of higher pecuniary and
non-pecuniary benefits), but generate losses to the bidder shareholders. El-Khatib et al. (2015)
further find that high-centrality status enables CEOs to increase entrenchment, and mitigate both
internal and external monitoring and disciplining of their activities. Consequently, the ultimate
impact of CEO centrality on IPO outcomes examined in our study is an empirical issue.1
1 Another difference between previous research on firm centrality and our focus on individual networks is the computational complexity. Firm networks typically contain at most several thousands of nodes, and thus firm centralities can be computed relatively quickly. On the other hand, individual networks involve hundreds of thousands of nodes connected by many millions of links, making centrality computation very high computer memory-intensive.
4
There are several reasons CEO centrality should affect IPO outcomes. Financial literature (e.g.
Chava and Purnanandam, 2009; Graham, Harvey, and Puri, 2013) has documented that CEOs are
the main firm decision makers whose actions have the greatest impact on firm performance. The
CEOs of IPO firms should have even greater influence on their firms, because IPO companies tend
to be relatively young and small. IPO research ever since Rock (1986) has shown that information
asymmetry between IPO insiders and outside shareholders is positively associated with the
magnitude of IPO underpricing (i.e. the stock return on the IPO first trading day). High information
asymmetry makes investment by outsiders more risky, creating the need for higher underpricing
in order to induce outside investor participation in the IPO. Since greater network influence should
allow CEOs superior access to information and better ability to communicate information (Burt,
2011; Jackson, 2010; Newman, 2010), CEO centrality can reduce the information asymmetry
between insiders and outside investors. High-centrality CEOs may also be considered more
trustworthy information sources, as networks facilitate information filtering, screening and
monitoring (Burt 1997, 2005, 2011; Nahapiet and Ghosal, 1998). Next, network centrality may
facilitate reputation effects via voluntary bonding of highly central individuals, because networks
allow easier sanctioning of negative behavior and creating social liabilities (Boot et al., 1993; Burt,
2005; Brass and Labianca, 2006). All of the above arguments imply that IPOs lead by well-
connected CEOs should be less risky due to lower degree of information asymmetry, and as such
associated with smaller underpricing. On the other hand, high-centrality managers may be isolated
from monitoring and market discipline, allowing them to pursue activities that enrich managers at
the expense of shareholders. El-Khatib et al. (2015) find that highly central bidder CEOs are less
likely to be fired after value destroying acquisitions, and that they use their superior access to
For example, eigenvector centrality calculations for the network on links that exist in 2012 takes more than three days to converge.

5
information to benefit from insider trades – especially inside selling.2 These results suggest that
well-connected CEOs may have tendencies to get engaged in self-serving activities at the expense
of shareholders. If high-centrality CEOs of IPO companies have similar incentives, then new
shareholders may perceive such IPOs as risky and demand higher compensation in the form of
greater underpricing for their willingness to invest.
While IPO research traditionally associates greater underpricing with risky IPOs subject to
large information asymmetry, some papers (e.g., Krigman, Shaw, and Womack, 2001) consider
higher underpricing a sign of IPO success due to effective marketing effort of underwriters. Even
though IPO companies suffer monetary losses due to underpricing, and Dunbar (2000) shows that
underwriters that underprice their IPOs tend to subsequently lose market share, we analyze
additional IPO factors in order to provide truly unambiguous tests regarding the benefits and costs
of having a well-connected CEO at the time of an IPO. First, we study the determinants of the
likelihood of offer price increase from the initial filing range. Second, and more importantly, we
analyze the total net gain to pre-IPO owners due to the IPO process. We follow Cook, Kieschnick,
and Van Ness (2006) and define the net IPO gain as the difference between IPO “wealth effect”
(difference between the closing first trading day price and the midpoint of the IPO’s initial filing
range for the portion of shares pre-IPO owners retain) and IPO “dilution effect” (the difference
between the closing first trading day price and the offer price for the portion of IPO shares sold).
If high-centrality CEOs generate primarily benefits for the pre-IPO owners, then the likelihood of
positive IPO net gain should be an increasing function of CEO centrality.
Our worldwide network of executives and directors of public and private companies is
2 El-Khatib et al. (2015) document that a change from 25th to 75th sample percentile bidder CEO centrality is associated with a 7.24 percentage point reduction in three-month returns following inside sell orders throughout CEO careers. The overall mean and median career post-selling returns are negative for high-centrality CEOs.

6
constructed utilizing BoardEx database. BoardEx tracks information on interpersonal links created
through past work relationships, joint educational overlaps, and memberships in social clubs,
charities, etc. We compute individual degree and eigenvector centralities based on annual networks
created from past employment in public and private companies worldwide. Such links are typically
reliably verifiable, not subject to self-reporting bias, and most likely describe relationships where
two linked individuals indeed met each other (unlike educational links based on attending the same
educational institution, often with dozens of thousands of students). 3 We assume that once
established, links between two parties exist until one participant dies. As a result, our social
networks grow in size over time. In the last sample year, 2013, our worldwide network contains
nearly 41 million employment links formed by almost 560,000 executives and directors of
companies.
Based on a sample of 906 IPOs between 2001 and 2013, we find that high-centrality CEOs are
associated with higher underpricing. A firm whose CEO is in the 90th sample percentile of
eigenvector centrality has the initial underpricing return higher by 4.09 percentage points
compared to a firm whose CEO is in the 10th sample centrality percentile. This is a significant
change compared to the median 8.16% first day return for the firms in our sample. At the same
time, IPO firms with high-centrality CEOs have significantly lower likelihood of offer price
increase from the initial filing range. Ultimately, we document that companies with well-connected
CEOs have the lowest chance to generate positive IPO net wealth effects – that is, the value-
reducing dilution effect on shares sold dominates wealth gains on shares retained for pre-IPO
owners in these firms. All of our findings are consistent with the overall negative impact of CEO
influence and power – as proxied by network centrality – in the context of IPO process.
3 In unreported robustness analysis, we create networks based on alternative definitions of links – such as educational and social overlaps. Our findings are similar to those presented in the main tables of this study.

7
We further show the underpricing is the highest, and the likelihood of positive net wealth
effects lowest, for IPOs with high-centrality CEOs whose networks are “inefficient” – that is, large
in size (high degree centrality), but devoid of influential nodes (low eigenvector centrality). Such
networks are least likely to mitigate information costs and aid information transfer to investors,
and thus our results suggest that despite prevailing first-order value reducing impact for pre-IPO
investors, CEO centrality still has an important information asymmetry-reducing benefits in the
IPO process – particularly if the CEO networks “efficiently.”
Our results hold under various robustness checks. Most importantly, CEO centrality effects are
unaffected even if we control for past relationships between the IPO firm managers and the
underwriters (Cooney et al., 2015). Also, our results are very similar to those presented in this
study if we substitute CEO centrality with the “excess centrality” (the difference between actual
centrality and its predicted level based on centrality determinants). Additionally, our results still
hold after we control for effects of CEO’s age and years in position.4 Consequently, the findings
in this paper are likely due to network effects associated with CEO centrality, as opposed to
omitted variables related to centrality.
Our study makes several notable contributions. First, we add to the growing research on the
importance of social networks in financial contracting. We are among the first studies to examine
the effects of individual – as opposed to firm – position within the whole social network of all
business decision makers, and the first paper to study the role of individual network centrality in
the context of IPOs.5 A more central place puts the CEO higher in the social network hierarchy,
4 In unreported results, we find that being an older CEOs can reduce the impact of CEO centrality on IPO underpricing, but being a long tenured CEO does not have significant impact on IPO underpricing. 5 Other notable papers that study individual centralities in finance include El-Khatib et al. (2015) who examine the role of bidder CEO centrality in the process of mergers and acquisitions, and Fogel et al. (2015) who analyze the impact of CFO centralities on the forms and costs of loan contracts.
8
and enables the CEO to be more influential and powerful. Our findings suggest that new IPO
investors recognize that higher influence and power allows the CEOs to achieve greater
entrenchment and to diminish the effectiveness of monitoring of CEO activities. Consequently,
new investors demand higher compensation in the form of greater underpricing for their
willingness to invest, which causes substantial dilution effects on IPO shares sold, and leaves pre-
IPO investors with lower likelihood of positive net wealth effects as the consequence of the IPO.
In this regard, our study provides contrasting view on the role of networking in the IPO process to
papers that found prevailing beneficial effects for bilateral connections between IPO and
underwriter managers (Cooney et al., 2015) and for the underwriter firm-specific centralities
(Chuluun, 2015).6
Second, we extend the literature on determinants of IPO underpricing and IPO overall wealth
effects. We show that in addition to known firm- and deal-specific determinants, the personal
characteristics of the CEO, such as influence and power proxied by the network centrality, matter
for IPO processes.
Third, we contribute to research on the role of personal traits in corporate finance (e.g.
Malmendier and Tate, 2008; Billett and Qian, 2008; Cronquist, Makhija, and Yonker, 2012; Otto,
2014). However, unlike many previous studies where the personal traits of managers are based on
surveys or questionnaires (e.g. Kaplan, Klebanov, Sorensen, 2012; Graham, Harvey, Puri, 2013),
CEO influence and power examined in our paper is based on quantifiable measures of network
centrality, which utilizes objectively observable existence of social links. Importantly, the network
6 We do not claim, however, that CEO centrality generates no benefits to investors. First, we find that underpricing is lower, and the likelihood of positive IPO net wealth effects for pre-IPO owners is higher in cases of IPOs with CEOs who have “efficient” networks (i.e., networks that are not characterized by the combination of high degree, but low eigenvector centrality). Second, high CEO network centrality may produce significant advantages for firm’s day-to-day operations. The findings in this study suggest, though, that CEO network centrality may cause challenges within the actual IPO process – that is, the sale of IPO shares to new investors.

9
centrality based on past work-related relationships is unlikely to be endogenous to the IPO
outcomes we investigate. Network centrality is thus an idea measure for studying the impact of
managerial behavior on corporate outcomes, because it does not bring issues of potential reverse
causality.
The paper proceeds as follows. Section 2 describes our data. Section 3 presents the results.
Section 4 concludes.
2. Data
2.1 Centrality data
We construct our centrality measures using data available from BoardEx. BoardEx contains
information about bilateral connections, education background and employment history, as well
demographical and tenure information of the board members and senior executives of the firms all
over the world. BoardEx forms different networks based on geographical regions and the way that
people in the networks overlap. The entire network contains individual from all geographical
regions with overlaps in employment, education and social activities. It contains 574,645
individuals with 60 million links in its maximum network in 2013. In our paper, we use centrality
measures generated from individuals overlap in employment worldwide because that is the most
reliable connection type. Education and social activity connections are less reliable in that the size
of the institution where two overlapping people attend tends to be big and therefore chances are
slim that two overlapping people even actually met during the years they both attend the institution.
Our global network with employment overlapping results a total of 559,490 individuals with 41
million bilateral connections.
Centrality measures how powerful an individual is in a network. According to EI-Khatib et al.

10
(2015), a powerful individual in a network might be efficient in reaching others and transferring
information. Also that may also mean a better position for bargaining and negotiation. Two
common measures of centrality are constructed in this paper: degree and eigenvector. Degree
centrality measures how many nodes an individual is directly connected to. The more direct
connections an individual has, the higher his/her degree centrality is. Eigenvector centrality
measures how important an individual is within a network. An individual gets a higher eigenvector
centrality measure if he/she has more connections with high degree centrality measures.
We identify CEO for the IPO firm in the IPO year through the BoardEx database. If a firm has
two or more co-CEOs in the IPO year, we pick the CEO with the highest centrality measure
because we believe that the CEO with the highest centrality measure should have more influence
on the board. To make our centrality measures comparable between the years, we construct
percentile values for both degree centrality and eigenvector centrality by year, and the value ranges
from 0, the lowest centrality, to 99, the highest centrality. The percentile value reflects the ranking
position of an individual in the entire network that we use, not just the ranking within the sample
CEOs. This transformation enables rank-order comparison of centrality values across different
years, since percentiles within each of the annual networks do not reflect the monotonously
increasing size of the annual networks. In addition, the percentile transformation allows clear
interpretation of centrality-related results, especially because the eigenvector centrality values do
not have clear economic interpretation. In all tables and regression models described below, CEO
centrality is utilized in terms of percentages. However, significances of CEO centrality coefficients
are similar if we use raw centrality scores instead. We use the centrality measures of the CEOs in
the year prior to the firm’s IPO year to eliminate the timing concerns about the centrality measures
and IPO. In the regression analysis, we use natural logarithm of percentile ranking as the centrality

11
measure because there should be a diminishing marginal effect on the increases in percentile
ranking. For example, a CEO increases her centrality ranking from 10th percentile to 20th percentile
should have greater impact on the firm than another CEO who increases her centrality ranking
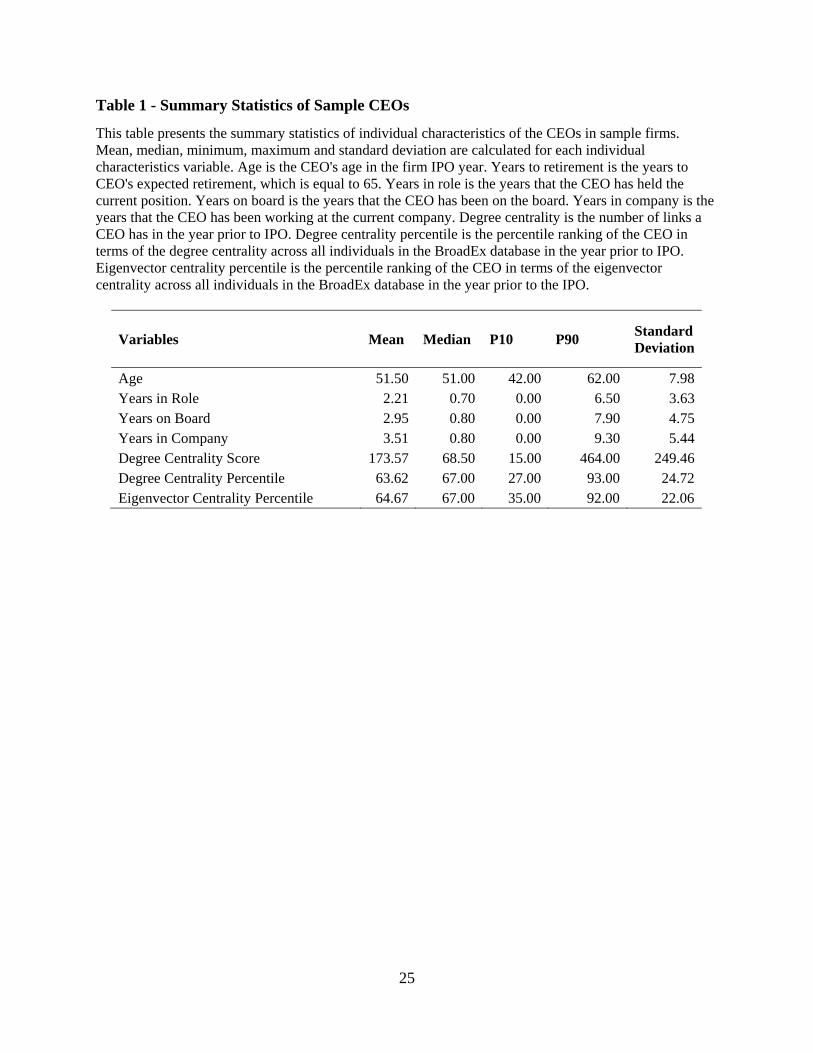
from 80th percentile to 90th percentile. Table 1 summarizes the personal characteristics of CEOs in
our sample. The mean age of CEOs in our sample is 52, and they have been on the board for an
average of 3 years. They on average have 174 connections in the broad network and have a mean
degree centrality percentile of 64 and mean eigenvector centrality percentile of 65.
[Table 1 here (CEO summary statistics)]
In addition to CEO centrality percentiles, we introduce another centrality measure: efficient
networking. The efficient networking is measured as CEO’s eigenvector centrality percentile
minus degree centrality percentile. Since eigenvector centrality measures the importance of the
connections whereas degree centrality only measures the number of connection, one with efficient
networking should rank higher in terms of eigenvector centrality than in degree centrality. We rank
the efficient networking values and use an inefficient dummy, which takes 1 if the CEO’s efficient
networking ranking is below 33th percentile within the sample CEOs and 0 otherwise.
2.2 IPO and firm financial Data
We collect data of IPOs from 2001 to 2013 from Thomson Financial’s SDC new issues data
base. We only include IPOs domiciled in U.S. and exclude all close-end funds and unit offerings.
Also the IPO will not be in our sample if the financial data of the company is not available in
CRSP. We then manually match the IPO firms in SDC database with BoardEx database, and keep
those observations that are available in both databases. We then drop the IPO firm observations
that the CEO information is not available in BoardEx in the IPO year. Finally, we have a sample

12
of 906 IPO firm-CEO observations. We obtain IPO proceeds, number of shares offered to number
of shares outstanding, price revision, whether an IPO is venture backed, Nasdaq return 2 weeks
prior to IPO, and whether the IPO is listed on NYSE from SDC database. We also obtain
underwriter compensation, measured by gross spread and selling concession from SDC database.
We obtain underwriter ranking and firm age data from Jay Ritter’s website. We discover whether
CEO has bilateral connections, prior to the IPO, with the underwriter using BoardEx database.
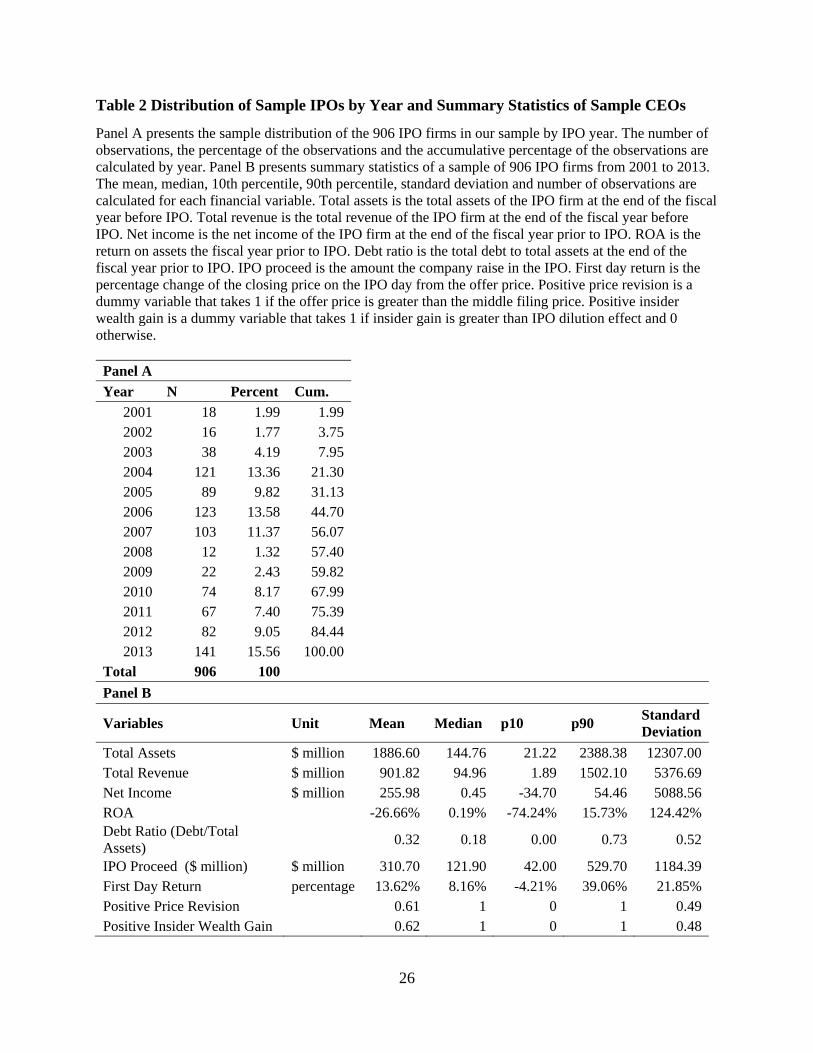
Table 2 Panel A shows the distribution of sample IPOs by year. Due to the nature of BoardEx that
the bilateral connections between any two people disappears when any one of them deceased.
Therefore, we have more IPO samples in later years than in earlier years because we have more
CEOs to capture in later years. We obtain firm financial data from CRSP database. Firm financial
data are based on the fiscal year-end prior to the IPO year. Overall, we have 906 IPO firms in the
sample, which also means 906 CEOs in the sample. Table 2 Panel B reports the summary statistics
of the sample firm’s financial variables and IPO variables. On average, our sample firms have a
total assets of 1.9 billion dollars with a mean net income of 256 million dollars.
[Table 2 here (IPO sample distribution)]
We measure IPO performance in three ways: first day return, price revision and insider wealth
gain. The first day return is measured as the percentage gain at the close price on the first trading
day of the IPO as comparing with the offer price. Price revision is measured as the difference
between the offer price and the middle filing price for the IPO. Insider wealth gain captures
whether the insiders are better-off from the IPO by comparing the appreciation of their holding
shares during the IPO and value loss from the selling of their holdings during the IPO. Before
perform formal analysis on CEO network centrality and IPO performance, we divide the sample
into three subsamples based on CEO’s centrality percentile rankings: top 33%, middle 33% and
13
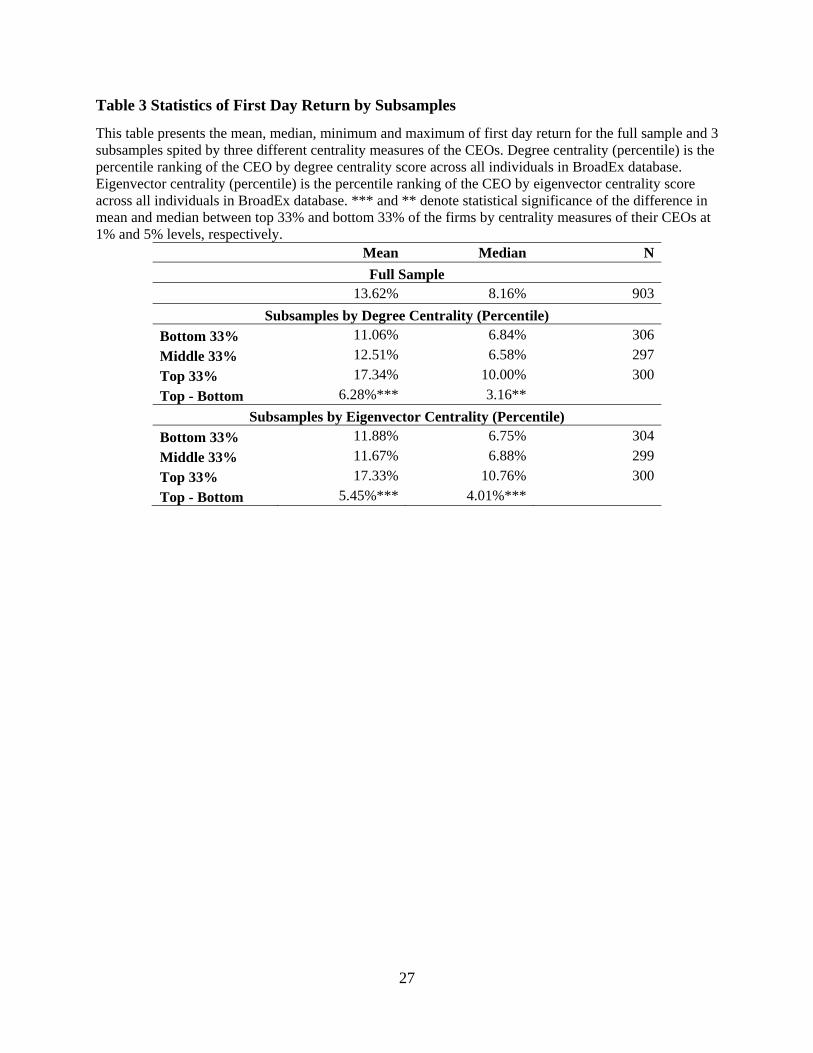
bottom 33% and compare the initial return between the three subsamples. Table 3 shows the
comparison results. Top 33% subsample contains about one-third of CEOs in the sample that have
the highest respective centrality percentile rankings. Bottom 33% subsample contains about one-
third of CEOs in the sample that have the lowest respective centrality percentile rankings. The rest
of the CEOs in the sample are in middle 33% subsample. We average the first day return of their
IPO firm and find the difference in mean between the top 33% and bottom 33% are statistically
significant for both degree and eigenvector centralities. We then compute the median first day
returns for all subsamples and perform a Wilcoxon test, and the results indicate that the difference
in median between the top and bottom subsample are also statistically significant. We observe that
high network centrality is associated with high initial first day return. This holds true for both
degree centrality and eigenvector centrality.
[Table 3 here (First day return comparison by 3 subsamples)]
3. CEO Network Centrality and IPO Performance
3.1 Initial IPO Return
One of the most important measures of IPO performance is the return of the stock on the first
day of public trading. CEO centrality can either have a good side and a bad side effect to the IPO
firm. IPO is a risky practice because of information asymmetric. On the good side, first, CEOs
with high centrality may use their position in the network to efficiently gather and transfer private
information so that it creates value for the company in the IPO process. Second, network effect
incentivizes CEOs to care more about their reputations. According to Fogel et al. (2015), the
existence of network makes it easier for others in the network to penalize the CEO who conducts
harmful behaviors to their firms and investors. Many scholars find that this phenomenon is more

14
profound for individuals standing at “the center of the stage” like CEO (see Boot et al. 1993; Burt,
2005; Brass and Labianca, 2006). Moreover, Graham et al (2005) find that the first career concern
for CFOs is to maintain their reputations. If CEOs act similarly, we could see the importance of
reputation for the CEOs and expect to see they strive to behave positively to maintain their
reputation. On the other hand, CEO centrality has bad side to the IPO firm. According to EI-Khatib
et al. (2015), central CEOs may take advantage of their power on the board to influence the
decisions of the board and thus reap private benefits, which makes an IPO riskier. Alternatively,
CEO with high centrality might be easier to get around market discipline and monitoring. For
example, Liu(2010) argues that CEOs are more likely to find a new position with both financial
and non-financial favor no matter for what reasons they were laid off. If CEO centrality creates
value for the IPO firm, we expect to see low initial return on the first trading day of IPO because
underwriter may upward revise the subscription price in conjunction with high demand on the
firm’s stocks. If CEO centrality does not creates value of the firm, but instead increase the riskiness
of IPO, we expect to see a high IPO initial return because underwriter must lower the filling price
to compensate the extra risk associated with the IPO.
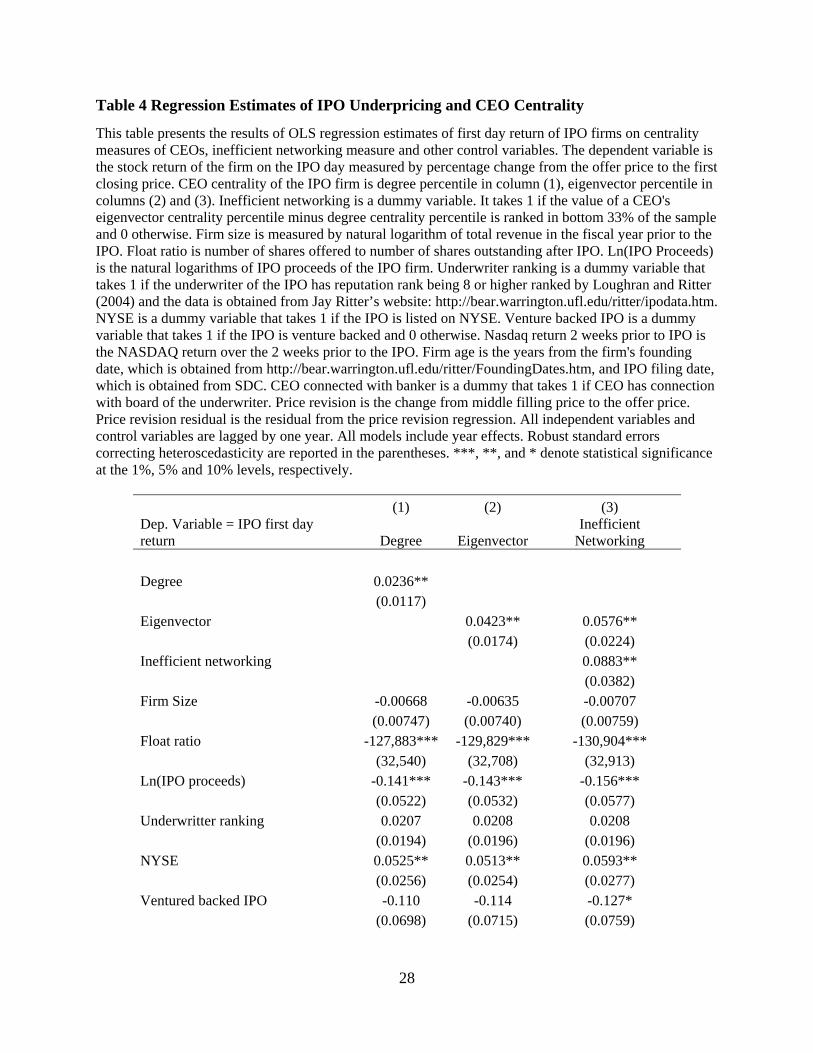
Table 4 reports the OLS regression estimates of IPO first day return on CEO centrality,
controlling for IPO and firm characteristics. The dependent variable is the stock return of the firm
on the IPO day measured by percentage change from the offer price to the first closing price. Model
(1) uses degree centrality as CEO centrality measure, model (2) and (3) use eigenvector centrality
as CEO centrality measures, and model (3) adds inefficient networking dummy. The results in all
models show that CEO centrality is positively significant in predicting IPO first day return. In
other words, firms with more centered CEO have significantly higher IPO first day returns than
firms with less centered CEO. This holds true in both degree and eigenvector centrality measures.

15
The results in model (3) shows that inefficient networking is positively correlated with high IPO
initial returns. The results seems to be supporting our hypothesis that CEO centrality actually
increases the riskiness of IPO and thus results in a higher IPO initial return. Moreover, the results
shows that inefficient networking increases the risk of IPO evidenced by increasing 8.83
percentage points, on average, to the initial return of IPO. In all models, we control the firm size
effect, IPO characteristics, firm characteristics and the effect of IPO price revision. CEO centrality
measures are still positively significant with all the controls.
[Table 4 here (Initial return regression results)]
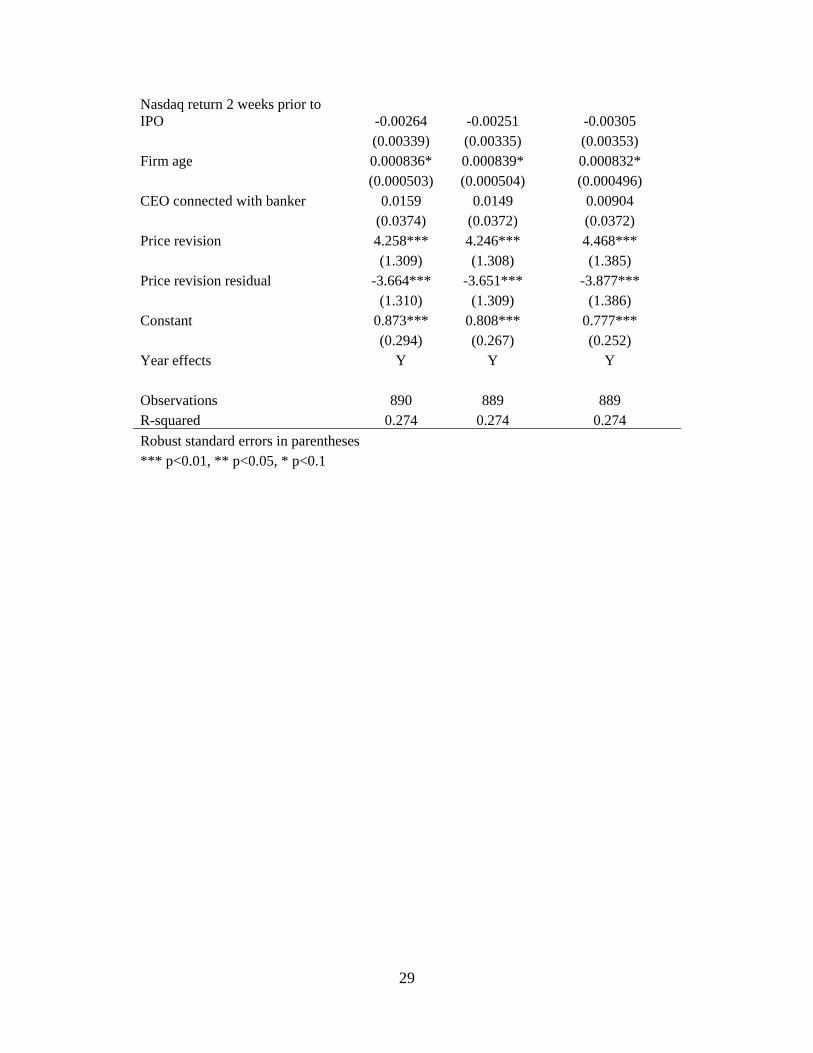
The economic significance of CEO centrality measures is also high. We find that all else equal,
if CEO degree centrality moves from 25th to 75th percentile ranking within the sample, IPO initial
return would increase by 1.5 percentage points. If CEO eigenvector centrality moves from 25th to
75th percentile ranking within the sample, IPO initial return would increase by 2.2 percentage
points. If CEO eigenvector centrality moves from 25th to 75th percentile ranking within the sample
controlling for inefficient dummy, IPO initial return would increase by 2.9 percentage points.
Although the results shown in table 4 support our hypothesis about the bad side effect of CEO
centrality, our assertions about the good side and bad side CEO centrality and its relations with
relative high or low IPO initial return may be flawed: it can be the case that when CEO centrality
has good impact on the firm, the firm’s stock would be popular during its IPO and thus generate
high initial returns. In the next section, we attempt to disentangle this effect by showing IPO
centrality and its relations with price revision and insider wealth effect. In the end we show that
the IPO underpricing is in fact caused by the bad side effects of CEO centrality.
16
3.2 Positive price revision
In this section, we investigate the relationship between IPO initial return and its relation with
positive price revision. Price revision means underwriter revise the subscription price from the
initial filling price. It is one of another important measures of IPO performance (Corwin and
Schultz, 2005). A positive price revision not only benefits IPO firm by raising more capital but
also benefits shareholders before the IPO by increasing in their wealth (Cooney et al., 2015). If
CEO centrality has a positive impact on the firm and thus generate popularity on firm’s IPO shares,
we expect to see more likelihood of positive price revision associated with high CEO centrality.
That is because underwriter would upward revise the subscription price of firm’s stock after seeing
high demand for the stock in order to raise more capital in IPO. However, we do not see positive
relations between high CEO centrality and high likelihood of positive price revision.
Table 5 shows the probit regression estimation of probability of positive price revision on CEO
centrality controlling for firm size effects, IPO characteristics, and firm characteristics. The
dependent variable is a dummy variable that takes 1 if the IPO has a positive price revision from
middle filing price and 0 otherwise. Model (1) uses degree centrality as CEO centrality measure,
and model (2) uses eigenvector centrality as CEO centrality measures. We control the effect of
CEO being connected with the underwriter by adding a dummy that takes 1 if CEO of the IPO
firm has social connection with board members of the underwriter. We also include other control
variables that are important in predicting price revision according to Cook et al. (2006). The results
show that degree centrality is not significant in whether the IPO price has been upward revised or
not, but eigenvector centrality is negatively significant. That means high centrality CEO’s firm is
less likely to receive a positive price revision. This result is economically significant as well. All
else equal, an IPO firm with a within-sample 75th percentile centrality ranked CEO is 3.74% less

17
likely to receive an upward price revision than an IPO firm with a within-sample 25th percentile
centrality ranked CEO.
[Table 5 here (Regression results of positive revision)]
The results do not support the hypothesis that CEO centrality has a positive impact on the firm.
Rather, firms with high centrality CEO are perceived as riskier and thus its IPO need to be
underpriced more to compensate the risk that investors are bearing. Therefore, underwriter is thus
less likely to upward revise the subscription price.
3.3 Insider wealth gain
According to Loughran and Ritter (2002), Bradley and Jordan (2002) and (Cooney et al., 2015),
initial return and price revision do not show a comprehensive picture of IPO performance. Pre-
IPO shareholders’ main goal is to obtain wealth gain through the IPO. Hence, a successful IPO
should gain wealth for the insiders. We examine whether high centrality CEO is associated with
positive wealth gain for the pre-IPO shareholders. If CEO’s high centrality has positive effect on
IPO firm, it should associated with higher likelihood of pre-IPO shareholder gaining wealth and
vice versa. Pre-IPO shareholders gain wealth when IPO firm has a positive price revision from
initial filling price and positive return on the first day of trading for the shares that they retain from
pre-IPO to post-IPO. Pre-IPO shareholders lose wealth when they sell the shares at offer price and
the price per share increases thereafter, which cause them “leave the money on the table”. We
compute pre-IPO shareholders wealth gain from retained shares net of wealth loss from sold shares
in IPO. We then investigate if high centrality CEO is associated with high likelihood of positive
wealth gain by pre-IPO shareholders.
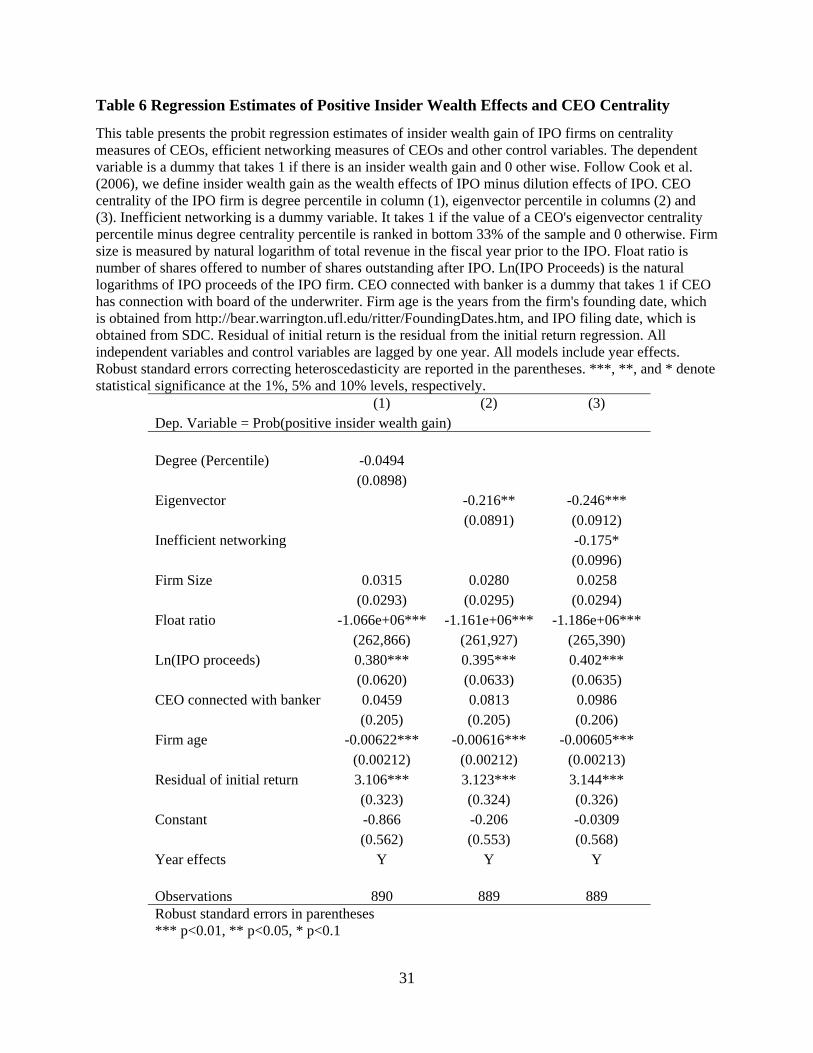
Table 6 shows the results of probit regression of probability of positive wealth gain by pre-IPO

18
shareholders on CEO centrality, IPO characteristics, firm characteristics and connection between
CEO and underwriter’s board members. Model (1) uses degree centrality as CEO centrality
measure, model (2) and (3) use eigenvector centrality as CEO centrality measures, and model (3)
adds inefficient networking dummy. The results show that eigenvector centrality is negatively
associated with the likelihood of positive wealth gain by the pre-IPO shareholders. This is
consistent with our hypothesis that high CEO centrality has a negative impact on IPO firms. Model
(3) indicates that inefficient networking would further reduce the likelihood of positive wealth gain
by the pre-IPO shareholders, which is consistent with our findings in initial return part that
inefficient networking of the CEOs has a negative impact on the IPO firm.
[Table 6 here (Regression results for positive insider wealth gain)]
Our results are economically significant as well. All else equal, a firm with a CEO at within-
sample 75th percentile centrality ranking would have 4.07 percentage points less likely to have a
positive wealth gain by pre-IPO shareholders than a firm with a CEO at within-sample 25th
percentile centrality ranking.
Overall, our findings in Tables 3-6 provide evidence on significant links between CEO
centrality and firm’s IPO performance. High centrality CEOs are associated with high IPO
underpricing for the firm. However, the underpricing of the IPO does not reflect the success of the
IPO. Instead, it reflects the excess risk the market perceives and thus a larger discount in offer
price evidenced by less likelihood of positive price revision and less likelihood of pre-IPO
shareholders’ wealth gains. Additionally, we find CEOs that are inefficiently networked have more
negative impacts on firms’ IPO performance.
In additional unreported analysis, we find some evidence consistent with higher risk of IPOs
managed by high-centrality CEOs. Following Jenter and Kanaan (2015), we use Hazard regression
19
to test how post-IPO accounting performance (measured by the change in Returns on Assets (ROA)
between three years after the IPO and the ROA of the IPO year) impact the odds of the CEO
leaving the firm after the IPO. Controlling for the CEO age, we find that more central CEOs (those
in top tercile of sample distribution) have lower odds of leaving the firm after the IPO. Even more
importantly, while negative post-IPO accounting performance increases chances of CEO departure
in general (consistent with Jenter and Kanaan, 2015), as well as for the CEOs with low centrality,
the odds of high-centrality CEOs leaving the company are unaffected by the bad post-IPO
accounting performance. These findings are consistent with El-Khatib et al. (2015), and suggest
that high-centrality CEOs can use their influence and power to mitigate the functioning of
managerial labor market designed to replace poorly-performing firm decision makers.
3.4 Robustness Analysis
3.4.1 Bilateral connections between underwriters and IPO firm managers
Cooney et al. (2015) find that the bilateral connection between CEO and underwriter would
improve IPO outcome, both for shareholders of the IPO company and the underwriters in terms of
their compensation. Therefore, in unreported analysis, we control for past relationships between
the IPO firm managers and underwriters. Our centrality-related results are unaffected in terms of
signs and statistical significances by the inclusion of a dummy variable denoting the existence of
underwriter-manager bilateral connection. Additionally, we find that more central CEOs are more
likely to connect with underwriters, but higher centrality CEOs are not associated with better IPO
outcome for the company they lead.7
7 In unreported analysis, we also regress the underwriter compensation, measured by gross spread and selling concessions, on CEO centrality measures controlling for CEO-underwriter relationships. We find that the CEO centrality measure does not significantly impact underwriter compensation.
20
3.4.2 Centrality determinants and excess centrality
CEO centrality is related to various firm- and individual-specific factors. We utilize the
following determinants: company’s sales revenue, ROA, leverage ratio, IPO first day return, IPO
year dummy, industry dummy, CEO age, and CEO years with the company to create the “excess
centrality” measure equal to the difference between the actual and predicted (based on the above
determinants) centrality values. This allows us to mitigate the concern that our results are due to
omitted firm or personal characteristics, proxied by centrality. In unreported analysis, we re-run
all of our models presented in Tables 3-6, with “excess centrality” used instead of actual centrality
values. Our results have very similar significances, and the same signs, suggesting that the
centrality measures indeed reflect the impact of CEO influence and power, as opposed to the
effects of omitted variables.
3.4.3 The impact of CEO age
In unreported analysis, we include CEO’s age and years in position and interact with centrality
measures in our models. The original centrality determinants retain the same signs and very similar
significances as those reported in Tables 3-6, while thee interactive coefficients are mostly
insignificant. Moreover, we find that the coefficient for the years in position is not statistically
significant. Hence, we find evidence that our results are neither determined by CEO tenure, nor
driven by firms seeking high centrality CEOs right before IPO.
4. Conclusion
We show that CEO network centrality is statistically and economically meaningful determinant
of IPO outcomes. IPOs of firms with high-centrality CEOs are associated with significantly greater
underpricing returns. These IPOs also have a lower likelihood of positive offer price adjustments

21
from their initial filing range, as well as lower likelihood of generating positive net IPO wealth
effects for the pre-IPO shareholders. Our results suggests that new investors may perceive IPOs
with well-connected CEOs as riskier, consistent with high-centrality CEOs being able to utilize
their influence and power derived from higher positions within the social network hierarchy to
entrench themselves and to thwart optimal corporate governance. We find, however, some
evidence of possible benefits associated with highly central CEOs. Namely, underpricing is lower,
and the chance of positive net wealth effects higher for IPOs with high-centrality CEOs whose
networks are “efficient” (networks that do not feature many connections to uninfluential
individuals).
We contribute to the growing literature on social networks in finance. Our paper is the first to
show that individual position within social network hierarchy – which leads to higher influence
and power, and can be proxied by social network centrality – affects IPO outcomes. We provide
extension of previous research chiefly based on bilateral connections (e.g. Engelberg et al. 2012;
Ishii and Xuan, 2014; Cai and Sevilir, 2012; Cohen et al., 2010). In addition, our results are
consistent with detrimental impact of CEO centrality on wealth of pre-IPO shareholders, and thus
they provide an important contrast to existing research on social networks in the context of IPO,
which has so far mainly documented benefits of networks due to bilateral connections between
IPO managers and underwriters (Cooney et al., 2015), or due to high firm-specific centrality of
underwriters (Chuluun, 2015).

22
References
Billett, M. T., & Qian, Y. (2008). Are overconfident CEOs born or made? evidence of self-attribution bias from frequent acquirers. Management Science, 54(6), 1037-1051.
Bonacich, P. (1972). Factoring and weighting approaches to status scores and clique identification. Journal of Mathematical Sociology, 2(1), 113-120.
Boot, A. W., Greenbaum, S. I., & Thakor, A. V. (1993). Reputation and discretion in financial contracting. The American Economic Review, , 1165-1183.
Burt, R. S. (1997). The contingent value of social capital. Administrative Science Quarterly, , 339-365.
Burt, R. S. (2005). Brokerage and closure: An introduction to social capital OUP Oxford.
Burt, R. S. (2010). Neighbor networks: Competitive advantage local and personal Oxford University Press.
Cai, J., Walkling, R. A., & Yang, K. (2014). The price of street friends: Social networks, informed trading, and shareholder costs. Journal of Financial and Quantitative Analysis (JFQA), Forthcoming,
Cai, Y., & Sevilir, M. (2012). Board connections and M&A transactions. Journal of Financial Economics, 103(2), 327-349.
Chava, S., Livdan, D., & Purnanandam, A. (2009). Do shareholder rights affect the cost of bank loans? Review of Financial Studies, 22(8), 2973-3004.
Chuluun, T. (2015). The role of underwriter peer networks in IPOs. Journal of Banking & Finance, 51, 62-78.
Chuluun, T., Prevost, A., & Puthenpurackal, J. (2014). Board ties and the cost of corporate debt. Financial Management, 43(3), 533-568.
Cohen, L., Frazzini, A., & Malloy, C. (2008). The Small World of Investing: Board Connections and Mutual Fund Returns,
Cohen, L., Frazzini, A., & Malloy, C. (2010). Sell‐side school ties. The Journal of Finance, 65(4), 1409-1437.
Cook, D. O., Kieschnick, R., & Van Ness, R. A. (2006). On the marketing of IPOs. Journal of Financial Economics, 82(1), 35-61.
Cooney, J. W., Madureirav, L., Singh, A. K., & Yang, K. (2015). Social ties and IPO outcomes. Journal of Corporate Finance,
Cooney, J., Madureira, L., Singh, A. K., & Yang, K. (2014). IPO underwriting syndicates: Do social ties help get a seat at the table? Available at SSRN 2179491,
Corwin, S. A., & Schultz, P. (2005). The role of IPO underwriting syndicates: Pricing, information production, and underwriter competition. The Journal of Finance, 60(1), 443-486.
Cronqvist, H., Makhija, A. K., & Yonker, S. E. (2012). Behavioral consistency in corporate finance:

23
CEO personal and corporate leverage. Journal of Financial Economics, 103(1), 20-40.
Dunbar, C. G. (2000). Factors affecting investment bank initial public offering market share. Journal of Financial Economics, 55(1), 3-41.
El-Khatib, R., Fogel, K., & Jandik, T. (2015). CEO network centrality and merger performance. Journal of Financial Economics, 116(2), 349-382.
Engelberg, J., Gao, P., & Parsons, C. A. (2012). Friends with money. Journal of Financial Economics, 103(1), 169-188.
Fogel, K., Jandik, T., & McCumber, W. R. (2014). CFO network centrality and private debt. Available at SSRN 2396268,
Fracassi, C. (2014). Corporate finance policies and social networks. AFA 2011 Denver Meetings Paper,
Fracassi, C., & Tate, G. (2012). External networking and internal firm governance. The Journal of Finance, 67(1), 153-194.
Freeman, L. C. (1977). A set of measures of centrality based on betweenness. Sociometry, , 35-41.
Graham, J. R., Harvey, C. R., & Puri, M. (2013). Managerial attitudes and corporate actions. Journal of Financial Economics, 109(1), 103-121.
Graham, J. R., Harvey, C. R., & Rajgopal, S. (2005). The economic implications of corporate financial reporting. Journal of Accounting and Economics, 40(1), 3-73.
Ishii, J., & Xuan, Y. (2014). Acquirer-target social ties and merger outcomes. Journal of Financial Economics, 112(3), 344-363.
Jackson, M. O. (2008). Social and economic networks Princeton University Press Princeton.
Kaplan, S. N., Klebanov, M. M., & Sorensen, M. (2012). Which CEO characteristics and abilities matter? The Journal of Finance, 67(3), 973-1007.
Krigman, L., Shaw, W. H., & Womack, K. L. (2001). Why do firms switch underwriters? Journal of Financial Economics, 60(2), 245-284.
Labianca, G., & Brass, D. J. (2006). Exploring the social ledger: Negative relationships and negative asymmetry in social networks in organizations. Academy of Management Review, 31(3), 596-614.
Larcker, D. F., So, E. C., & Wang, C. C. (2013). Boardroom centrality and firm performance. Journal of Accounting and Economics, 55(2), 225-250.
Liu, Y. (2010). The role of networks in the CEO and director labor market.
Loughran, T., & Ritter, J. R. (2002). Why don't issuers get upset about leaving money on the table in IPOs? Review of Financial Studies, 15(2), 413-444.
Malmendier, U., & Tate, G. (2008). Who makes acquisitions? CEO overconfidence and the market's reaction. Journal of Financial Economics, 89(1), 20-43.
Mizruchi, M. S., & Potts, B. B. (1998). Centrality and power revisited: Actor success in group decision making. Social Networks, 20(4), 353-387.
Nahapiet, J., & Ghoshal, S. (1998). Social capital, intellectual capital, and the organizational

24
advantage. Academy of Management Review, 23(2), 242-266.
Newman, M. (2010). Networks: An introduction Oxford University Press.
Otto, C. A. (2014). CEO optimism and incentive compensation. Journal of Financial Economics, 114(2), 366-404.
Padgett, J. F., & Ansell, C. K. (1993). Robust action and the rise of the medici, 1400-1434. American Journal of Sociology, , 1259-1319.
Proctor, C., & Loomis, C. (1951). Analysis of sociometric data. research methods in social relations: Part two, selected techniques.
Rock, K. (1986). Why new issues are underpriced. Journal of Financial Economics, 15(1), 187-212.
Sabidussi, G. (1966). The centrality index of a graph. Psychometrika, 31(4), 581-603.
25
Table 1 - Summary Statistics of Sample CEOs
This table presents the summary statistics of individual characteristics of the CEOs in sample firms. Mean, median, minimum, maximum and standard deviation are calculated for each individual characteristics variable. Age is the CEO's age in the firm IPO year. Years to retirement is the years to CEO's expected retirement, which is equal to 65. Years in role is the years that the CEO has held the current position. Years on board is the years that the CEO has been on the board. Years in company is the years that the CEO has been working at the current company. Degree centrality is the number of links a CEO has in the year prior to IPO. Degree centrality percentile is the percentile ranking of the CEO in terms of the degree centrality across all individuals in the BroadEx database in the year prior to IPO. Eigenvector centrality percentile is the percentile ranking of the CEO in terms of the eigenvector centrality across all individuals in the BroadEx database in the year prior to the IPO.
Variables Mean Median P10 P90 Standard Deviation
Age 51.50 51.00 42.00 62.00 7.98Years in Role 2.21 0.70 0.00 6.50 3.63Years on Board 2.95 0.80 0.00 7.90 4.75Years in Company 3.51 0.80 0.00 9.30 5.44Degree Centrality Score 173.57 68.50 15.00 464.00 249.46Degree Centrality Percentile 63.62 67.00 27.00 93.00 24.72Eigenvector Centrality Percentile 64.67 67.00 35.00 92.00 22.06
26
Table 2 Distribution of Sample IPOs by Year and Summary Statistics of Sample CEOs
Panel A presents the sample distribution of the 906 IPO firms in our sample by IPO year. The number of observations, the percentage of the observations and the accumulative percentage of the observations are calculated by year. Panel B presents summary statistics of a sample of 906 IPO firms from 2001 to 2013. The mean, median, 10th percentile, 90th percentile, standard deviation and number of observations are calculated for each financial variable. Total assets is the total assets of the IPO firm at the end of the fiscal year before IPO. Total revenue is the total revenue of the IPO firm at the end of the fiscal year before IPO. Net income is the net income of the IPO firm at the end of the fiscal year prior to IPO. ROA is the return on assets the fiscal year prior to IPO. Debt ratio is the total debt to total assets at the end of the fiscal year prior to IPO. IPO proceed is the amount the company raise in the IPO. First day return is the percentage change of the closing price on the IPO day from the offer price. Positive price revision is a dummy variable that takes 1 if the offer price is greater than the middle filing price. Positive insider wealth gain is a dummy variable that takes 1 if insider gain is greater than IPO dilution effect and 0 otherwise. Panel A
Year N Percent Cum.
2001 18 1.99 1.992002 16 1.77 3.752003 38 4.19 7.952004 121 13.36 21.302005 89 9.82 31.132006 123 13.58 44.702007 103 11.37 56.072008 12 1.32 57.402009 22 2.43 59.822010 74 8.17 67.992011 67 7.40 75.392012 82 9.05 84.442013 141 15.56 100.00
Total 906 100 Panel B
Variables Unit Mean Median p10 p90 Standard Deviation
Total Assets $ million 1886.60 144.76 21.22 2388.38 12307.00Total Revenue $ million 901.82 94.96 1.89 1502.10 5376.69Net Income $ million 255.98 0.45 -34.70 54.46 5088.56ROA -26.66% 0.19% -74.24% 15.73% 124.42%Debt Ratio (Debt/Total Assets)
0.32 0.18 0.00 0.73 0.52
IPO Proceed ($ million) $ million 310.70 121.90 42.00 529.70 1184.39First Day Return percentage 13.62% 8.16% -4.21% 39.06% 21.85%Positive Price Revision 0.61 1 0 1 0.49Positive Insider Wealth Gain 0.62 1 0 1 0.48
27
Table 3 Statistics of First Day Return by Subsamples
This table presents the mean, median, minimum and maximum of first day return for the full sample and 3 subsamples spited by three different centrality measures of the CEOs. Degree centrality (percentile) is the percentile ranking of the CEO by degree centrality score across all individuals in BroadEx database. Eigenvector centrality (percentile) is the percentile ranking of the CEO by eigenvector centrality score across all individuals in BroadEx database. *** and ** denote statistical significance of the difference in mean and median between top 33% and bottom 33% of the firms by centrality measures of their CEOs at 1% and 5% levels, respectively.
Mean Median N
Full Sample
13.62% 8.16% 903
Subsamples by Degree Centrality (Percentile)
Bottom 33% 11.06% 6.84% 306
Middle 33% 12.51% 6.58% 297
Top 33% 17.34% 10.00% 300
Top - Bottom 6.28%*** 3.16**
Subsamples by Eigenvector Centrality (Percentile)
Bottom 33% 11.88% 6.75% 304
Middle 33% 11.67% 6.88% 299
Top 33% 17.33% 10.76% 300
Top - Bottom 5.45%*** 4.01%***
28
Table 4 Regression Estimates of IPO Underpricing and CEO Centrality
This table presents the results of OLS regression estimates of first day return of IPO firms on centrality measures of CEOs, inefficient networking measure and other control variables. The dependent variable is the stock return of the firm on the IPO day measured by percentage change from the offer price to the first closing price. CEO centrality of the IPO firm is degree percentile in column (1), eigenvector percentile in columns (2) and (3). Inefficient networking is a dummy variable. It takes 1 if the value of a CEO's eigenvector centrality percentile minus degree centrality percentile is ranked in bottom 33% of the sample and 0 otherwise. Firm size is measured by natural logarithm of total revenue in the fiscal year prior to the IPO. Float ratio is number of shares offered to number of shares outstanding after IPO. Ln(IPO Proceeds) is the natural logarithms of IPO proceeds of the IPO firm. Underwriter ranking is a dummy variable that takes 1 if the underwriter of the IPO has reputation rank being 8 or higher ranked by Loughran and Ritter (2004) and the data is obtained from Jay Ritter’s website: http://bear.warrington.ufl.edu/ritter/ipodata.htm. NYSE is a dummy variable that takes 1 if the IPO is listed on NYSE. Venture backed IPO is a dummy variable that takes 1 if the IPO is venture backed and 0 otherwise. Nasdaq return 2 weeks prior to IPO is the NASDAQ return over the 2 weeks prior to the IPO. Firm age is the years from the firm's founding date, which is obtained from http://bear.warrington.ufl.edu/ritter/FoundingDates.htm, and IPO filing date, which is obtained from SDC. CEO connected with banker is a dummy that takes 1 if CEO has connection with board of the underwriter. Price revision is the change from middle filling price to the offer price. Price revision residual is the residual from the price revision regression. All independent variables and control variables are lagged by one year. All models include year effects. Robust standard errors correcting heteroscedasticity are reported in the parentheses. ***, **, and * denote statistical significance at the 1%, 5% and 10% levels, respectively.
(1) (2) (3) Dep. Variable = IPO first day return Degree Eigenvector
Inefficient Networking
Degree 0.0236**
(0.0117)
Eigenvector 0.0423** 0.0576** (0.0174) (0.0224)
Inefficient networking 0.0883** (0.0382)
Firm Size -0.00668 -0.00635 -0.00707 (0.00747) (0.00740) (0.00759)
Float ratio -127,883*** -129,829*** -130,904*** (32,540) (32,708) (32,913)
Ln(IPO proceeds) -0.141*** -0.143*** -0.156*** (0.0522) (0.0532) (0.0577)
Underwritter ranking 0.0207 0.0208 0.0208 (0.0194) (0.0196) (0.0196)
NYSE 0.0525** 0.0513** 0.0593** (0.0256) (0.0254) (0.0277)
Ventured backed IPO -0.110 -0.114 -0.127* (0.0698) (0.0715) (0.0759)
29
Nasdaq return 2 weeks prior to IPO -0.00264 -0.00251 -0.00305
(0.00339) (0.00335) (0.00353) Firm age 0.000836* 0.000839* 0.000832*
(0.000503) (0.000504) (0.000496) CEO connected with banker 0.0159 0.0149 0.00904
(0.0374) (0.0372) (0.0372) Price revision 4.258*** 4.246*** 4.468***
(1.309) (1.308) (1.385) Price revision residual -3.664*** -3.651*** -3.877***
(1.310) (1.309) (1.386) Constant 0.873*** 0.808*** 0.777***
(0.294) (0.267) (0.252) Year effects Y Y Y
Observations 890 889 889 R-squared 0.274 0.274 0.274
Robust standard errors in parentheses
*** p<0.01, ** p<0.05, * p<0.1
30
Table 5 Regression Estimates of IPO Positive Price Revision and CEO Centrality
This table presents the probit regression estimates of positive price revision of IPO firms on centrality measures of CEOs, and other control variables. The dependent variable is a dummy variable that takes 1 if there is a positive price revision from middle filling price to offer price and 0 otherwise. CEO centrality of the IPO firm is degree percentile in column (1), and eigenvector percentile in columns (2) and (3). Inefficient networking is a dummy variable. It takes 1 if the value of a CEO's eigenvector centrality percentile minus degree centrality percentile is ranked in bottom 33% of the sample and 0 otherwise. Firm size is measured by natural logarithm of total revenue in the fiscal year prior to the IPO. Ln(IPO Proceeds) is the natural logarithms of IPO proceeds of the IPO firm. NYSE is a dummy variable that takes 1 if the IPO is listed on NYSE. Venture backed IPO is a dummy variable that takes 1 if the IPO is venture backed and 0 otherwise. Nasdaq return 2 weeks prior to IPO is the NASDAQ return over the 2 weeks prior to the IPO. Firm age is the years from the firm's founding date, which is obtained from http://bear.warrington.ufl.edu/ritter/FoundingDates.htm, and IPO filing date, which is obtained from SDC. CEO connected with banker is a dummy that takes 1 if CEO has connection with board of the underwriter. All independent variables and control variables are lagged by one year. All models include year effects. Robust standard errors correcting heteroscedasticity are reported in the parentheses. ***, **, and * denote statistical significance at the 1%, 5% and 10% levels, respectively.
(1) (2) (3)
Dep. Variable = Prob(positive offer price revision) Degree Eigenvector Inefficient
Networking
Degree -0.0790
(0.0875)
Eigenvector -0.193** -0.215**
(0.0943) (0.0975)
Inefficient networking -0.147
(0.0944)
Firm Size 0.00336 0.00310 0.00257
(0.0304) (0.0305) (0.0304)
Ln(IPO proceeds) 0.426*** 0.434*** 0.441***
(0.0652) (0.0661) (0.0665)
NYSE -0.232** -0.228** -0.238**
(0.114) (0.115) (0.114)
Ventured backed IPO 0.321*** 0.341*** 0.345***
(0.105) (0.105) (0.105)
Nasdaq return 2 weeks prior to IPO 0.0217 0.0212 0.0214
(0.0144) (0.0144) (0.0144)
Firm age -0.00261 -0.00259 -0.00242
(0.00201) (0.00200) (0.00201)
CEO connected with banker 0.0164 0.0365 0.0483
(0.194) (0.193) (0.194)
Constant -1.613*** -1.193** -1.060*
(0.532) (0.541) (0.557)
Year effects Y Y Y
Observations 906 905 905
Robust standard errors in parentheses
*** p<0.01, ** p<0.05, * p<0.1
31
Table 6 Regression Estimates of Positive Insider Wealth Effects and CEO Centrality
This table presents the probit regression estimates of insider wealth gain of IPO firms on centrality measures of CEOs, efficient networking measures of CEOs and other control variables. The dependent variable is a dummy that takes 1 if there is an insider wealth gain and 0 other wise. Follow Cook et al. (2006), we define insider wealth gain as the wealth effects of IPO minus dilution effects of IPO. CEO centrality of the IPO firm is degree percentile in column (1), eigenvector percentile in columns (2) and (3). Inefficient networking is a dummy variable. It takes 1 if the value of a CEO's eigenvector centrality percentile minus degree centrality percentile is ranked in bottom 33% of the sample and 0 otherwise. Firm size is measured by natural logarithm of total revenue in the fiscal year prior to the IPO. Float ratio is number of shares offered to number of shares outstanding after IPO. Ln(IPO Proceeds) is the natural logarithms of IPO proceeds of the IPO firm. CEO connected with banker is a dummy that takes 1 if CEO has connection with board of the underwriter. Firm age is the years from the firm's founding date, which is obtained from http://bear.warrington.ufl.edu/ritter/FoundingDates.htm, and IPO filing date, which is obtained from SDC. Residual of initial return is the residual from the initial return regression. All independent variables and control variables are lagged by one year. All models include year effects. Robust standard errors correcting heteroscedasticity are reported in the parentheses. ***, **, and * denote statistical significance at the 1%, 5% and 10% levels, respectively.
(1) (2) (3) Dep. Variable = Prob(positive insider wealth gain)
Degree (Percentile) -0.0494
(0.0898)
Eigenvector -0.216** -0.246***
(0.0891) (0.0912)
Inefficient networking -0.175*
(0.0996)
Firm Size 0.0315 0.0280 0.0258
(0.0293) (0.0295) (0.0294)
Float ratio -1.066e+06*** -1.161e+06*** -1.186e+06***
(262,866) (261,927) (265,390)
Ln(IPO proceeds) 0.380*** 0.395*** 0.402***
(0.0620) (0.0633) (0.0635)
CEO connected with banker 0.0459 0.0813 0.0986
(0.205) (0.205) (0.206)
Firm age -0.00622*** -0.00616*** -0.00605***
(0.00212) (0.00212) (0.00213)
Residual of initial return 3.106*** 3.123*** 3.144***
(0.323) (0.324) (0.326)
Constant -0.866 -0.206 -0.0309
(0.562) (0.553) (0.568)
Year effects Y Y Y
Observations 890 889 889 Robust standard errors in parentheses *** p<0.01, ** p<0.05, * p<0.1


![Closeness Centrality Extended To Unconnected Graphs : The ...EN]ASNA09.pdf · Closeness Centrality Extended To Unconnected Graphs : The Harmonic Centrality Index Yannick Rochat1 Institute](https://img.pdfslide.us/doc/110x75/5e68c4d8d85073536033bf7b/closeness-centrality-extended-to-unconnected-graphs-the-enasna09pdf-closeness.jpg)