Embed Size (px)
Citation preview
CEO Climate Change Task Force MeetingA Wall Street Perspective
Karl H. Pfeil III Managing DirectorPublic Power
December 3, 2007

www.fitchratings.com 2
The Credit Impact of Environmental Compliance
> Criteria – Managing Your Risks.
> Public Powers’ Environmental Credit Drivers
www.fitchratings.com 3
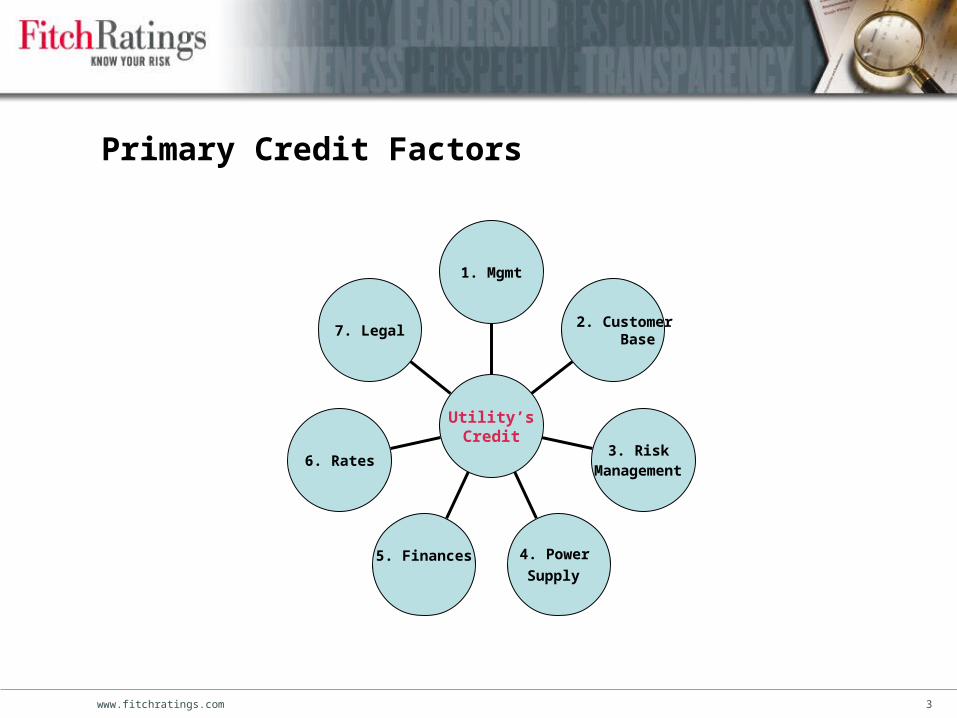
Primary Credit Factors
1. Mgmt
2. Customer Base
3. Risk Management
4. Power
Supply 5. Finances
6. Rates
7. Legal
Utility’sCredit

www.fitchratings.com 4
Location, Location, Location
> Each region has distinct
characteristics affecting the utilities’
credit profile:
— Fuel supply of wholesale market.
— Status of deregulated markets.
— Status of transmission
environment.
— Regional politics.
— Service territory characteristics.
— Environmental mandates.
—Ability to implement?

www.fitchratings.com 5
CO2 Regulation: Not if but when
> Fitch believes that there will be a carbon law at the federal level; however, it may
be a number of years off.
> Increasing number of state regulators are placing a cost on carbon in rate making
proceedings.
> More traditional Wall Street investors are now looking at carbon issues.
> Desire of industry participants to reduce regulatory risk by reducing uncertainty.

www.fitchratings.com 6
Current Industry Response to a Carbon Constrained Environment
> Build Clean Coal Plants
> Estimate and inform Investors as to Possible Costs
> Improved Efficiency
> Demand Side Management
www.fitchratings.com 7
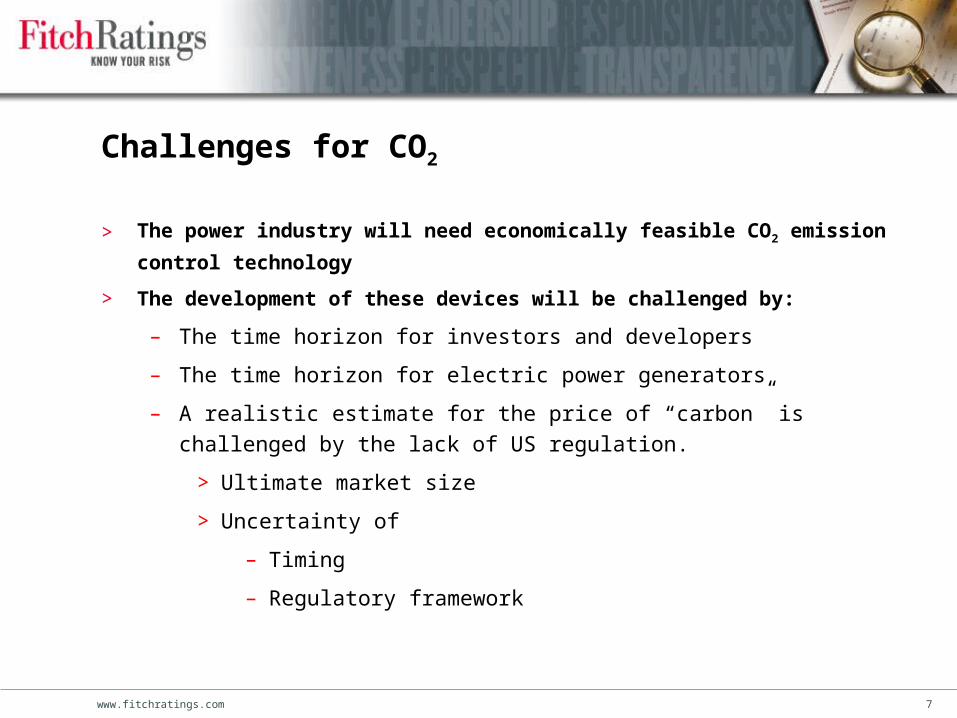
Challenges for CO2
> The power industry will need economically feasible CO2 emission control
technology
> The development of these devices will be challenged by:
– The time horizon for investors and developers
– The time horizon for electric power generators
– A realistic estimate for the price of “carbon” is challenged by the lack of US
regulation.
> Ultimate market size
> Uncertainty of
– Timing
– Regulatory framework
www.fitchratings.com 8
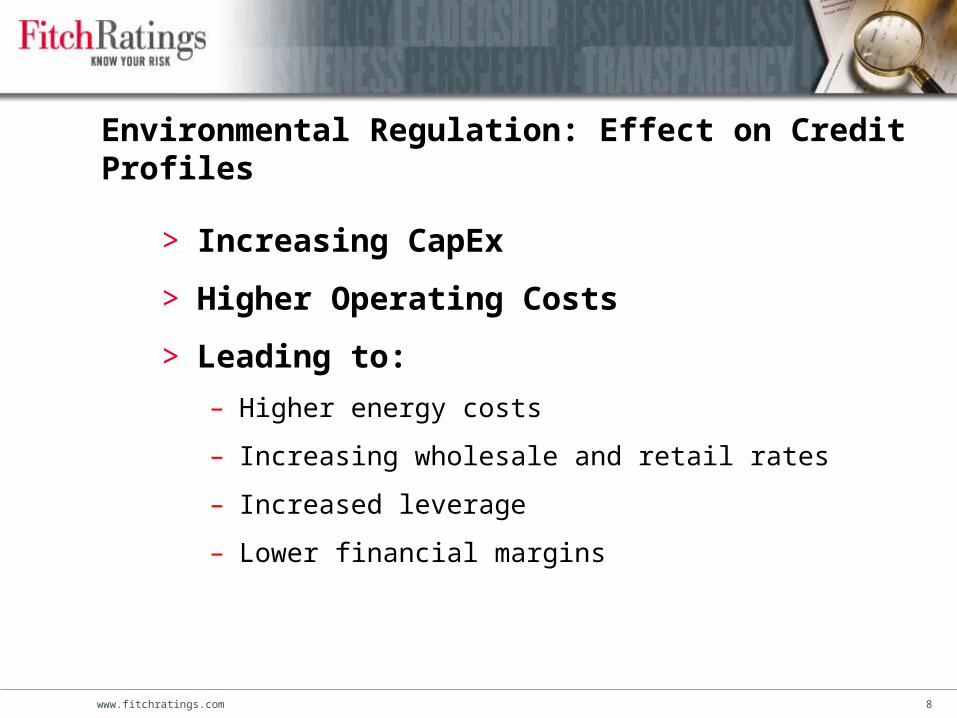
Environmental Regulation: Effect on Credit Profiles
> Increasing CapEx
> Higher Operating Costs
> Leading to:
– Higher energy costs
– Increasing wholesale and retail rates
– Increased leverage
– Lower financial margins
www.fitchratings.com 9
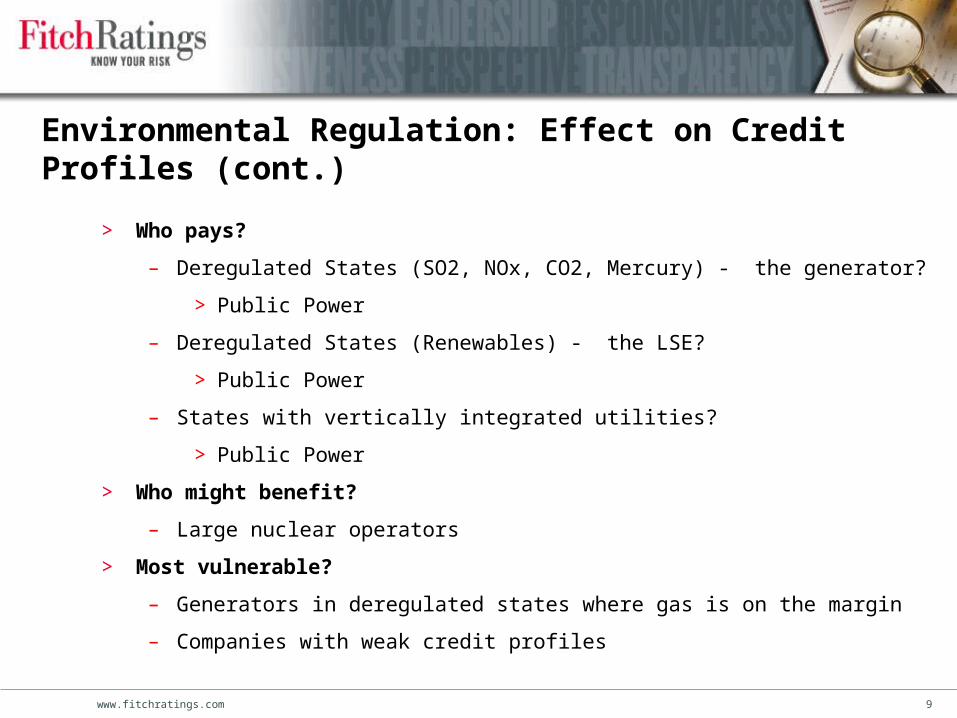
Environmental Regulation: Effect on Credit Profiles (cont.)
> Who pays?
– Deregulated States (SO2, NOx, CO2, Mercury) - the generator?
> Public Power
– Deregulated States (Renewables) - the LSE?
> Public Power
– States with vertically integrated utilities?
> Public Power
> Who might benefit?
– Large nuclear operators
> Most vulnerable?
– Generators in deregulated states where gas is on the margin
– Companies with weak credit profiles

www.fitchratings.com 10
Renewable Portfolio Standards (and Goals)
State Goal
☼ PA: 18%¹ by 2020
☼ NJ: 22.5% by 2021
CT: 23% by 2020
MA: 4% by 2009 + 1% annual increase
WI: requirement varies by utility; 10% by 2015 goal
IA: 105 MW
MN: 25% by 2025(Xcel: 30% by 2020)
TX: 5,880 MW by 2015
☼ AZ: 15% by 2025
CA: 20% by 2010
☼ *NV: 20% by 2015
ME: 30% by 200010% by 2017 - new RE
State RPSHI: 20% by 2020
RI: 16% by 2020
☼ CO: 20% by 2020 (IOUs)
*10% by 2020 (co-ops & large munis)
☼ DC: 11% by 2022
☼ NY: 24% by 2013
MT: 15% by 2015
IL: 25% by 2025
VT: RE meets load growth by 2012
Solar water heating eligible
*WA: 15% by 2020
☼ MD: 9.5% in 2022
☼ NH: 23.8% in 2025
*VA: 12% by 2022
MO: 11% by 2020
☼ *DE: 20% by 2019
☼ NM: 20% by 2020 (IOUs) 10% by 2020 (co-ops)
☼ NC: 12.5% by 2021 (IOUs)10% by 2018 (co-ops & munis)
ND: 10% by 2015
OR: 25% by 2025 (large utilities)5% - 10% by 2025 (smaller utilities)
☼ Minimum solar or customer-sited RE requirement* Increased credit for solar or customer-sited RE
¹PA: 8% Tier I / 10% Tier II (includes non-renewables)
Source: DSIRE (www.dsireusa.org), September 2007

www.fitchratings.com 11
“Renewable” Technologies (state specific)
Frequently on the list
> Wind
> Solar thermal electric
> Photovoltaic
> Landfill gas/methane
> Fuel cells
> Municipal solid waste
> Geothermal electric
> Biomass
> Tidal/wave/ocean thermal
Also included
> Geothermal heat pump
> Hydroelectric
> Small power generation
> Poultry litter
> Sustainably harvested biomass
> Resource recovery facilities
> Ethanol, methanol, biodiesel
> Anaerobic digestion
> Waste energy
> Coal bed methane

www.fitchratings.com 12
Where the Wind Blows
RIDGE CREST ESTIMATES (LOCAL RELIEF > 1000 FT)
1234567
WIND POWER WIND POWERW/m2
M / S MPH W/m2M / S MPH
0 0 0 0 0 0
100 4.4 9.8 200 5.5 12.5
150 5.1 11.5 300 6.4 14.3
200 6.7 12.5 400 7.0 15.7
250 7.0 13.4 500 7.5 16.8
300 6.4 14.3 600 8.0 17.9
400 7.0 15.7 800 8.8 19.7
1000 9.4 21.1 2000 11.9 26.6
WORLD
POWERCLASS
10m (33ft) 50M (164 FT)
SPEED SPEED

www.fitchratings.com 13
Where the Sun Shines
www.fitchratings.com 14
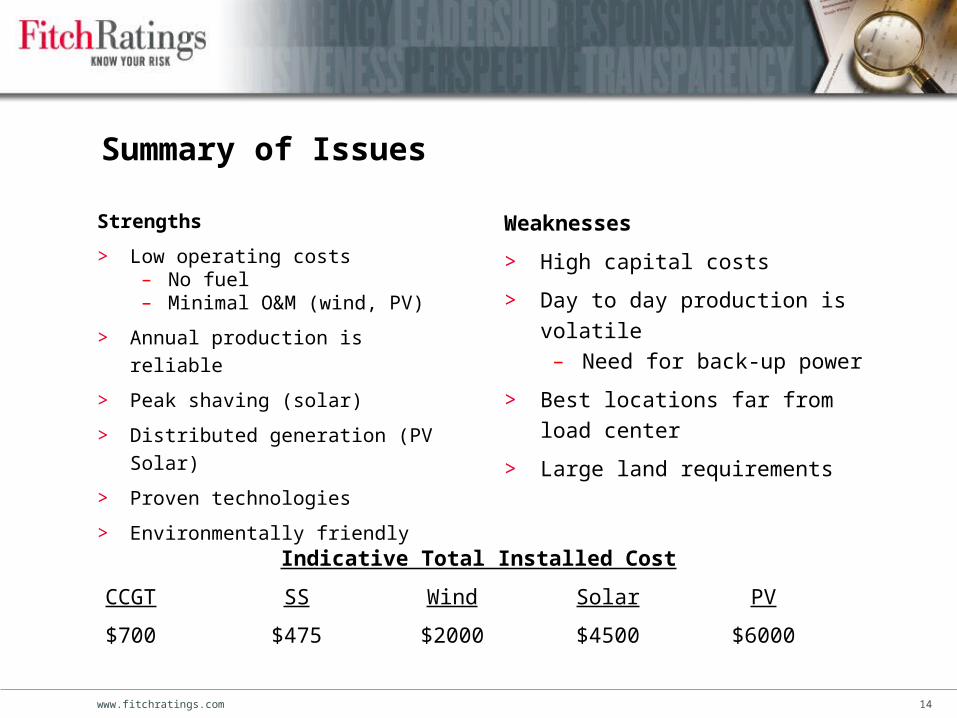
Summary of Issues
Strengths
> Low operating costs– No fuel– Minimal O&M (wind, PV)
> Annual production is reliable
> Peak shaving (solar)
> Distributed generation (PV Solar)
> Proven technologies
> Environmentally friendly
Weaknesses
> High capital costs
> Day to day production is volatile– Need for back-up power
> Best locations far from load center
> Large land requirements
Indicative Total Installed Cost
CCGT SS Wind Solar PV
$700 $475 $2000 $4500 $6000

www.fitchratings.com 15
RPS Compliance vs. Technology Issues
> Expect wind to be primary means of compliance.
– Requires additional investment for back-up capacity
– Increased ancillary services
> Prime locations for wind and solar are distant from load.
– Significant transmission
– Difficult to satisfy in-state production requirements
> Allow purchase of green credits (especially in Southeast)
> Encourage consumer involvement
– Financial incentives to conserve
– Financial incentives to self-generate (PV solar)

www.fitchratings.com 16
The Credit Impact

www.fitchratings.com 17
Many coal units will be replaced
US Coal-Fired Generating Plants
0
2,000
4,000
6,000
8,000
10,000
12,000
14,000
16,000
18,000
200520001995199019851980197519701965196019551950194519401935193019251920
Date Placed in Service
Tota
l Nam
epla
te C
apac
ity (M
W)

www.fitchratings.com 18
For a Stable Sector – The issues are very complex
Housing Declines
Housing Declines
Rates / Regulation
Rates / Regulation
Fuel Costs
Fuel Costs
EnvironmentalRegulation
EnvironmentalRegulation New GenerationNew Generation
Increasing Capital Costs
Increasing Capital Costs
www.fitchratings.com 19
Governance / Management
> Single most important credit factor
that affects all other areas of a utility.
– Organizational strategy.
– Working relationship between
Management and Board of
Directors (council).
– Ability to get things done (track
record).
– How will this impact your utility
compared to others in your
region?
– Know your risk – The more you
understand your risks the better you
can plan for them.

www.fitchratings.com 20
Fitch Public Power Credit Outlook for 2008
> Outlook for 2008 is Stable with the longer term Outlook reflecting increasing
Negative pressures.
> While our near-term outlook for the sector is stable, the public power industry
remains vulnerable to challenges that could pressure some credit ratings into the
future.
> Public power has historically proven itself to be a very solid investment despite past
complexities facing the industry such as deregulation, fuel price volatility, and the
corporate credit crisis.
> Q: Going forward how will public power address the new issues: growing power
resource needs, higher capital and labor costs, and uncertainties associated with
environmental policies and renewable portfolio standards, which have made it
harder to build new coal-fired generation and limits the options for new base-load
power resources?
– The answer rests with management!

Fitch Ratings
www.fitchratings.com
London
Eldon House
2 Eldon Street
London EC2M 7UA
UK
+44 207 417 4222
Singapore
7 Temasek Blvd.
Singapore 038987
+65 6336 6801
New York
One State Street Plaza
New York, NY 10004
+1 212 908 0500
+1 800 75 FITCH
The Fitch Group Fitch Ratings Algorithmics Fitch Training