Embed Size (px)
Citation preview

entro Europa Ricerche - CER - is a research institute whose main field is the applied economic analysis and policy. CER produces short and medium-term forecast of the Italian economy, evaluations on economic policy, reports on public finance, fiscal, monetary and industrial policy. CER is regularly invited to auditions for the Italian Parliament on the economic outlook and public finance trends. CER prepares a "consensus forecast" for the Italian Ministry of the Economy jointly with other research institutes. CER's forecasting and simulation expertise is embodied in its econometric models, which are continuously updated to take into account structural changes in the national and international economy. The econometric models are used to test the impact of policy measures as well as provide forecasts of economic and financial variables. The micro-simulation model, using data on wages and consumer expenditure, is used to evaluate the distribution impact of tax and tariff measures on Italian households. CER's reports are available to subscribers as are presentations and workshops on the reports organised and sponsored by CER and attended to by experts and leading personalities and policy makers.
CENTRO EUROPA RICERCHE

Centro Europa Ricerche S.r.l. Via di Villa Emiliani 14, 00197 Roma Tel. (0039) 06 8081304 E-mail: [email protected] www.centroeuroparicerche.it Presidente: Giorgio Ruffolo Amministratore delegato: Ettore Carettoni Direttore: Manin Carabba Comitato scientifico: Stefan Collignon (presidente), Salvatore Tutino (coordinatore), Vincenzo Atella, Manin Carabba, Luca De Benedictis, Claudio De Vincenti, Antonio Di Majo, Maurizio Di Palma, Enrico Flaccadoro, Sergio Ginebri, Pier Carlo Padoan, Maurizio Pala, Antonio Pedone, Giovanni Battista Pittaluga, Giorgio Rodano, Giorgio Ruffolo, Nicola Scalzini, Luigi Spaventa. Rapporto CER: pubblicazione periodica a carattere economico. Anno XXVII Direttore responsabile: Anna Maria Lombroso Iscrizione n. 177 del 6 maggio 1998 del Registro della Stampa del Tribunale di Roma Proprietario della testata: Centro Europa Ricerche S.r.l. C.C.I.A.A. Roma: R.E.A. 480286 Progetto grafico: Gruppo GASS Edizione: Centro Europa Ricerche S.r.l.
Printed out at Cer - April 2009

5 SUMMARY 7 EUROPE IN THE CRISIS I. The Origins of the Crisis: America in the World System - The consequences of financial deregulation - Global imbalances - II. The Euro Area in the Turmoil - From financial to economic crisis - Euro Area imbalances - The Macroeconomic Policy Mix in the Euro Area - European Union Bonds - II. The Crisis in the New Member States - IV. The agenda for change - Coordinating policy assignments - Stimulating economic activity - Cleaning up the financial system 57 THE MORAL ECONOMY OF MONEY AND THE FUTURE OF EUROPEAN CAPITALISM The Normativity of Money and Capital - The exchange economy - The contract economy Political normativity - Models of capitalism - Models of welfare capitalism Redefining the political agenda - The state and democracy - Monetary policy - Conclusion 69 UNIT LABOUR COST DYNAMICS IN EUROPE AND ITALY Introduction - Unit labour costs in Europe: dynamics and explanations - Italy: income policy and wages dynamics - Italian public - sector salaries: indicators - New pay policy Box: Bargaining power of public administration sectors: wage dynamics Box: Wage bargaining in Italy. 81 ENERGY POLICY Europe’s energy efficiency - Energy intensity - Energy sources - A panel model for Energy Intensity BIBLIOGRAPHY
REPORT ON EUROPE TITLE ?????????????

The following authors have contributed to this report: Luca Cappellani, Alessandro Carettoni, Stefan Collignon, Stefano Fantacone, Rosanna Gualotto, Pierluigi Morelli.

5
he present economic crisis , had its origin in the United States and spread to the rest of the world through globally integrated financial and product markets an. The subprime crisis was the shock, which hit a brittle financial system. The financial system had become fragile as a consequence of a series of interacting micro and macroeconomic decisions, which each in itself seemed quite harmless, but their accumulation was devastating. At the micro level, financial deregulation had enable a financial bubble and pushed banks into high dependency on short term funds, causing a mismatch between long term assets and short term liabilities. Once interest rates started to climb after 2004, the asset bubble burst - causing the process of deleveraging by banks that became a general credit crunch. At the macro level, the highly accommodative monetary policy by the US Fed fuelled the bubble, because consumer prices were tied down by high competition in the global economy. The asset bubble reinforced the global imbalances because American consumers had less incentive to save, while current account surpluses from Asia financed the expansion. Europe’s macroeconomic performance has been more balanced, largely because the ECB policy has remained more prudent. The euro has thereby contributed to the stability of the European and global economy. However, serious imbalances are now emerging within the Euro Area and between the new member states in Central and Eastern Europe. The Report discusses the diverging dynamics in unit labour costs between Northern and Southern Europe and warns that the new wage setting arrangements in Italy are not likely to remove the loss of competitiveness. The Report gives evidence for the large exposure of Western European Banks to new member states in Central and Eastern Europe. A major default in any of these countries could have devastating effects for the European banking system. It recommends tighter and more centralized financial supervision and involvement by international financial institutions like IMF and BERD. It rejects, however, the suggestion that these member states could join the Euro Area without appropriately meeting the Maastricht criteria. The financial crisis has raised questions regarding the moral economy of money. But a modern market economy is based on norms that cannot be separated from financial contracts and the moral economy of money. They are also constitutive of the political values of modern democracies, namely freedom and equality. The intellectual answer to the crisis is not the return to «real values» and morality, but the development of an economic paradigm that allows to use governments for the stabilization of the economy and investment for long term growth. The Euro Area needs a proper European government . Monetary policy close to zero-bound interest rates rises new challenges. This report is critical of monetary easing. Flooding the world with cheap liquidity is, however, less a danger for future inflation, as globalization keeps a check on wage costs. Instead, the likelihood is large that negative real interest rates will ignite the next asset bubble and
EXECUTIVE SUMMARY

6
renew a boom-bust cycle. The European Central Bank’s policy prudence should remain the benchmark. The fiscal stimulus packages decided by European governments are problematic. They often are little more than window dressing of previously decided programs. They also do not focus sufficiently on public investment, which we find is the main driver of growth. In order to get Europe out of the crisis, governance structures must be strengthened. Europe needs a government in charge of administrating public goods and policies, which affect all European citizens. Fiscal policy needs more coordination and focus on public investment for cross-border projects. Financial supervision needs to be centralized at the Euro Area level for large financial institutions. Commercial banks need to write off their non-performing assets. The Report recommends the creation of a Good Europe Bank, which would help to recapitalize banks’ balance sheets, without substantial costs to tax papers.

7
eace, prosperity, democracy. On this promise Europe is built. But increasingly, the promise appears broken. Europe is going through its deepest economic crisis since the treaty of Rome was signed. While peace is still preserved within the Union, economic protectionism, Euroscepticism and xenophobia are undermining the very foundations on which European integration is based. And to many citizens, Europe’s democratic deficit has warranted voting against new treaties in national referenda. It is time, European policy makers are facing up to these realities. At this critical moment, finding answers to Europe’s problems requires solving the economic crisis. In this chapter, we will look at possible solutions in the context of Europe’s integration into the world economy, the internal dynamics of the Euro Area and its interaction with the new Member States. In Chapter 2 we will discuss some broader issues regarding the future of capitalism. Chapter 3 analyses sectoral aspects of wage determination in the . Chapter 4 takes a look at energy policy in Europe. The economic crisis is both a threat and an opportunity. It is a threat to the livelihood of millions of citizens. But it is also an opportunity to remedy mistakes of the past and to change the way policies are made. It is an opportunity to go beyond the neoliberal paradigm, which has influenced policy makers in Europe and the world for the last 30 years. This does not mean that policies, which aimed at liberating market forces, were mistaken. For Europe, the creation of a Single Market with the abolition of national impediments and administrative obstacles was a source of innovation and dynamism that benefited millions by creating jobs, raising productivity and preserving the economic foundations of Europe’s social model. In 1988, the Cecchini Report calculated that the cost of Non-Europe were at the order of 5-6 percent of GDP; Baldwin (1989; 1993) found that the dynamic gains where even more substantial. Subsequent evaluations after the creation of the Single Market where hampered by methodological problems, but most research recorded positive and significant effects from More-Europe by freeing market forces in the European Union (European Commission, 2002; Italianer, 1994). What has gone wrong with the neoliberal paradigm was the neglect of externalities, i.e. of the fact that isolated decisions may have effects on others. The idea that the market mechanism will reconciliate the interests of selfishly motivated individuals without imposing costs on those who were not part of the transaction was always ludicrous. But policy makers did not understand this. Quizzed before the US House Oversight and Government Reform Committee in September 2008, Alan Greenspan said: «I made a mistake in presuming that the self-interest of organizations, specifically banks, were such that they were best able in protecting their own shareholders and the equity in their firms. (…) So the problem here is, something which looked to be a very solid edifice and, indeed, a critical pillar to market competition and free markets, did break down. And I think that, as I said, shocked me. I still do not fully understand why it happened» (1). Ignoring the external consequences and spillovers of individual acts for society at large has been at the root of the excessive deregulation in financial markets, but it has also contributed to the accumulation of macroeconomic imbalances in the world economy. This Age of
(1) See http://voices.washingtonpost.com/washingtonpostinvestigations/2008/10/snow_-photo20081023ph200810230.html
EUROPE IN THE CRISIS

8
irresponsibility has now crashed. Dealing with the crisis requires more than imposing some new regulations on banks or simply stimulating the economy. What is needed is a new way of policy thinking, a different way of policy making. In the present economic crisis, the cost of non-Europe is the incapacity to act, the failure of policy coordination, the unilateralism by which governments believe they can protect their citizens. The consequences are serious. I. The Origins of the Crisis: America in the World System The consequences of financial deregulation The epicenter of the world crisis has been Wall Street. Before dealing with Europe, we will therefore need to understand what happened in America. The shock wave caused by the Lehman insolvency has swept over the globalized banking system, causing an epidemy of distrust, which has pulled down real investment, exports and demand, leading to a second wave of bankruptcies and credit defaults. Here is not the place to retell the unfolding of the crisis (see CER no.4, 2008 for details). But it is important to understand the interaction between financial markets and the so-called “real economy”. They cannot be separate. Let us also be clear what we mean by the causes of the crisis. The financial crisis did not happen because Lehman Brothers went bankrupt. Nor did it happen because bankers and mortgage brokers were greedy and immoral, or because home owners and investors were naïve and ill-informed. All this is the natural condition of mankind. The crisis occurred, because the financial systems in the United States and in Europe were fragile and it was hit by a series of shocks in the form of the Bear Sterns subprime losses (20 June 2007) and the related placing into conservatorship of Fannie Mac and Freddie Mac by US Federal Authority (7 September 2008), followed by the Lehman Brothers insolvency (15 September 2008). A few days later, the shocks spilled over the Atlantic. First, a British mortgage bank, Northern Rock was unable to meet its liabilities, then Hypo Real Estate followed in Germany. The financial system had become fragile as a consequence of a series of interacting micro and macroeconomic decisions, which each in itself seemed quite harmless, but their accumulation was devastating. At the micro level, the deregulation of the financial system had prepared the scene for the subsequent drama. Especially lifting the categorical distinction between commercial and investment banking (Barth et alt. 2000), i.e. between utility and high-risk banking, had opened the way for a structural mismatch between long term commitments and short term liabilities (Eichengreen, 2008). After the deregulation of the banking system, commercial banks and even insurance companies started to compete with investment banks’ traditional activities. They took away fee income from investment and soon were forced to pay interest on deposits in order to attract funds. The changing income and cost structure pushed investment banks to develop new products like originating and distributing asset-backed and mortgage-backed securities, using higher leverage by funding themselves through the money market. Commercial banks were anxious to put their overnight money to work and responded to investment banks’ needs for short-term financing. Thus, the competition between banks also created a mutually re-enforcing dependency. The development of these new business opportunities for investment and commercial banks, which occurred in the USA as well as in Europe, made them also increasingly dependent on the availability of short term liquidity provided by central banks. Accommodating monetary policies were, therefore, the pre-requisite for the transformation and fragilization of the banking system.

9
Macroeconomic policy contributed to making the system more vulnerable. Liquidity was created by overly accommodating American monetary policies. After the dot.com bubble burst in March 2000, the Federal Reserve System lowered interest rates aggressively and continued with this policy after the September 11th attack for 3 years (figure 1 and 2). US STOCK INDEX Figure 1
400
600
800
1,000
1,200
1,400
1,600
1996 1998 2000 2002 2004 2006 2008
09/29/2000end ofdot.com bubble
04/23/2004Fed fund rise
9/13/2007Northern Rock
Lehman 9/15/20089/11/2001Attack
Bear StearnProblems
ClintonPresidency
SHORT AND LONG TERM INTEREST RATES Figure 2
0
1
2
3
4
5
6
7
8
9
90 92 94 96 98 00 02 04 06 08
Federal Funds Rate10 yr Government Bond YieldsInflation trend
Clinton
9/11/2001 Subprimecrisis
This had two consequences: it encouraged risk taking by banks, and it caused a maturity mismatch. First, the low expected returns on traditional lending business pushed financial institutions into leveraging their activities and seek higher returns for riskier operations. Risk taking banks Securitization was one method. By packaging and tranching, different mortgages of different qualities were put into one package, serving as collateral for a mortgage-backed security that had different risk features than the original assets. These asset-backed securities were effectively mortgage portfolios, which could be standardized and sold like commodities. Banks sold their credit risk to third party investors in capital markets and thereby liberated resources for additional lending. In early 2007 financial officers of the British bank Northern Rock estimated that they could lend to customers three times more credit, per unit of own capital,

10
than five years earlier. Packaging mortgage contracts seemed a good way to reduce the risk of asymmetric information, which often hampered classical lending practices. Instead of dealing with the risks of personal borrower-lender relationships, asset backed securities had anonymous probability distributions of risks. The increased supply of credit also made it more attractive for investors to buy these assets (Hellwig, 2008). Markets became deeper and by making credit more easily available, the transformed banking system became an engine of economic growth. The new system was rational under the assumption that default risks would be uncorrelated as postulated by portfolio theory. However, many of these derivative products did not have proper markets. Their pricing was often complex, based on opaque mathematical models, which few bankers and regulators understood. The system of «originating and distributing» these new securities increased the fragility of the system and laid the foundation for the subsequent world-wide contagion and crash. By mid-2007 faith in the system started to crack. Irresponsible lending practices by some American mortgage companies had lowered the quality of loans issued and defaults started to rise. Once the market turned down, defaults became highly correlated and losses became huge. As a consequence of globalization and banking deregulation, bad debt contagion rapidly swept the banking system across the world. The default by one large debtor in this leveraged chain of mutual debt commitments then caused a cumulative chain reaction of subsequent defaults. The inability of A to meet obligations to B may impair B’s ability to meet obligations to C, and so on. Sound banks will seek to avoid being caught short of liquidity. Informational asymmetries and adverse selection problems make banks reluctant to give credit. The deleveraging process by risk-averse banks was steep and rapid. The resulting credit crunch caused the crisis in the real economy. Maturity mismatch Second, when real interest rates are negative, it is preferable to hold wealth in real assets. Figure 3 shows that American short and long term real interest rates started to head down after the NASDAQ-dot.com crash in September 2000 and fed funds fell below the inflation rate after September 11th. This was of no major concern to the Fed, as the prevailing monetary policy consensus was primarily focused on maintaining price stability and risks of deflation seemed larger than inflation. Although the Fed started to tighten monetary policy in 2004, negative real short term rates lasted until June 2005. In this situation, the investment asset par excellence is real estate. As property prices go up, the net worth of house owners increases. Between the first quarter 2000 and the second quarter 2006, the Case-Shiller Housing Price Index rose by 89 percent. Rising prices for real estate made borrowing particularly attractive for ordinary savers who could leverage their investment by borrowing up to 100 percent of the property price against the collateral of their property. The faster property prices rose, the higher are the leveraging opportunities (2). Lenders could diversify their risk away, by putting these «sub-prime» mortgages into diversified packages, which they could sell. (2) See the following observation by Block (2006): «Many baby boomers appear to have decided that the stock market won’t provide them with sufficient assets with which to retire, and have taken advantage of “hot” real estate markets and low (e.g., 5 percent) down payments to speculate in residential real estate. The number of homes bought for investment jumped 50 percent during the four year period ending in 2004, according to the San Francisco research firm Loan Performance». Block, Ralph (January 1, 2006). Investing in REITs: Real Estate Investment Trusts. Bloomberg Press. p. 268.

11
REAL INTEREST RATES IN THE US Figure 3
-4
-2
0
2
4
6
90 92 94 96 98 00 02 04 06 08
Real Fed Fund Rates10 yr Government Bond Yields
Clinton
9/11/2001attack
Subprimecrisis
End ofdot.combubble
However, real estate investments are lumpy with long economic lifetimes. Financing long term investment by short term funds creates a maturity mismatch risk for financial intermediaries (refinancing risk) whose profits get wiped out when interest rates go up, or for the final debtor who wishes to realize the value of the asset before the end of the maturity (valuation risk). This mismatch is a classic feature for fragile banking systems. It was at the root of the great crash in the German banking system in the 1931 (Adalet, 2005), the US Savings and Loans crisis in the 1980s (Hellwig, 2008), it contributed to the financial crisis in Japan in the early 1990s (Mayr, 2008), and the Asian crisis in 1997 (Eichengreen, 2008). In each of these cases, a brittle system collapsed when it was hit by a shock. The tipping point in a financial mismatch occurs when short term interest rates are rising. The cost of refinancing cannot be passed on by the lender to the borrower and profit margins shrink. Particularly toxic assets were Adjustable Rate Mortgages (ARM), which caused serious liquidity difficulties for many borrowers, when the Fed fund rate increased from 1 to 5 percent. With rising interest rates, defaults and foreclosures started to become more frequent and property price increases slowed down before turning negative in 2005. In June 2007, the subprime crisis broke, when two hedge funds managed by Bear Stern declared large losses. In July 2007 Industrie Kreditbank, a subsidy of Kreditanstalt für Wiederaufbau that had built up large holdings of sub-prime mortgage-backed securities, needed urgent rescue. In September 2007, Northern Rock was no longer able to refinance its obligations and for the first time in decades, a major bank run by depositors occurred in an advanced industrial state. With losses accumulating, financial institutions had to unwind their investments and deleverage, i.e. cutting back on the amount borrowed relative to equity. Asset prices started to fall rapidly, which aggravated banking losses, given the mark-to-market accounting rules. At that point, governments in many countries, including the United States, came to bail out banks from the ensuing credit crisis by guaranteeing bank deposits and then by injecting capital funds, nationalizing banks, at least partially. But these microeconomic developments were only part of the unfolding drama. They were grounded in a broader macroeconomic environment.

12
Global imbalances The American asset bubble did not only make the American banking system brittle, it also weakened the international economy by widening global imbalances. These disequilibria are manifested in large current account imbalances in the world, undervalued currencies in Asia, and high savings in emerging and low savings in industrialized economies. All these factors contributed to the asset bubble in financial markets. Explaining the US deficit The US economy has been running large current account deficits for years (figure 4). In 2007 the American deficit was nearly entirely financed by surpluses from East Asia (table 1). With the exception of Japan, all these economies had pegged their currencies to the US dollar. The currency pegs have supported export-led growth, because sustained competitive exchange rate levels have kept wage costs low relative to advanced industrialized economies, but also because they minimized exchange rate volatility and macroeconomic uncertainty (Collignon, 2008). Both dimensions of the fixed exchange rate strategy were important in fostering rapid catch up growth in Asia – as they were in Europe after World War II. They allowed China to open up and get integrated into the world market, and they became the basis for regional integration in East Asia. However, given that local currencies were pegged to the USD, Asian current account surpluses were primarily kept in US dollar assets and this has contributed to the financial imbalances in the United States. As unintended consequence of the emergence of large currency blocs with fairly fixed exchange rates is that the fundamental equilibrium exchange rates between floating currencies become more volatile (Collignon 2002). Japan avoided this fate by reducing its exchange rate volatility relative to the USD during the last decade (see Collignon 2008). But this put even more pressure on the euro. Between 1995 and 2000 the euro depreciated by over 42 percent against the dollar, in the following 8 years it appreciated by 46 percent. Despite these large fluctuations, the managed to maintain fundamental macroeconomic balance (3). Figure 4 shows the s current account close to equilibrium, with a small surplus in the earlier part of the decade, when the euro was still weak. Economists have sought explanations for America’s current account deterioration. According to conventional wisdom, the current account position is explained by aggregate savings and investment decisions of firms, households and governments. While this is always true ex post, this explanation does not take into account that aggregate savings consist of household decisions and windfall profits by firms. In other words, investment decisions dominate savings decisions. Only if windfall profits of firms were zero, would current accounts reflect aggregate savings decisions. A proper explanation of the global imbalances must take into consideration investment and the generation of profits. The explanation that the US deficit was homemade, because households were irresponsibly living above their means and did not save enough, is therefore not entirely defendable. It has been argued that American households were able to save so little, because the United States have the «exorbitant privilege» (de Gaulle) of being able to issue the dollar as an international reserve currency (Dunaway, 2009). But the euro is now a potential alternative reserve currency. Size and depth of financial markets in Europe and America represent each approximately 40 percent of all financial markets in the world (Collignon, 2006). The question is: why did Asian countries not diversify their foreign assets more into the euro, thereby reducing the American current account deficit and augmenting the European? The answer is related to keeping reserves in the currency of the exchange rate peg. (3) In macroeconomics, the concept of fundamental balance signifies the simultaneous realization of price and labour market stability with a balanced current account position.

13
CURRENT ACCOUNT BALANCES 2007 Table 1 ASIA
Current Account bn USD
United States -738.6Korea, South 6.0Philippines 6.4Indonesia 11.0Thailand 14.9Hong Kong 25.5Malaysia 26.1Taiwan 31.7Singapore 39.2Japan 212.8China 360.7Balance -4.5
Euro Area 25.3
Source: CIA Factbook 2008 for Asia and AMECo 2008 for Euro Area An alternative explanation for the US current account deficit, first proposed by Bernanke (2005), suggests that the USA were the victim of external forces. A substantial shift in the current accounts of emerging market nations has resulted in a «global savings glut», which has swamped US financial markets and boosted equity and housing prices. As foreign savings became available to finance investment, American households were able to increase their consumption and save less. However, this still begs the question, why savings are so high in Asia. CURRENT ACCOUNT POSITIONS Figure 4
-8
-6
-4
-2
0
2
4
6
92 94 96 98 00 02 04 06 08 10
United States United KingdomJAPAN Euro area
negative realinterest ratesin the USA
Euro
The role of emerging Asia No doubt, both above mentioned theories contain some truth. Drawing their lessons from the Asian crisis in 1997, Asian emerging economies, particularly China, have sought to build up

14
larger foreign currency reserves in order to be less dependent on sudden capital flow reversals. Hence, they have increased their current account surpluses. The mirror image is the higher domestic savings rate in Asia. However, although household savings out of income are high compared to advanced industrialized countries, Asian savings consist to a large degree of windfall profits for export firms. The dismantling of the old socialist welfare system in China has certainly given greater urgency to precautionary savings, and this may explain the rise in recorded Chinese household savings. But the full extent of these estimates is doubtful, given that more than half of the Chinese savings rate is explained by «residuals» (Kraay, 2000). It is more reasonable to explain a large position in Chinese savings by windfall profits and the low wage levels relative to export markets. These windfall profits are the result of stable and significant currency undervaluations, which have helped to integrate Asian economies into the world economy (4). China’s and Asia’s growth and success depends on exports. Any policy recommendation that does not take this into account will fail. Therefore, the claim that the propensity to consume is too low in China or elsewhere in Asia, is too simplistic and misleading. More domestic Asian spending would not resolve global imbalances. Similarly, making exchange rates more flexible would have unintended detrimental consequences. Higher consumption or higher social contributions would raise Asian wages, and exchange rate appreciations would erase the competitive advantage on which rapid catch-up growth strategies are built. «Flexible» exchange rates would increase macroeconomic uncertainty and lower the rate of investment (5). Such policies, which are often recommended by Western think tanks and policy makers, would switch off the engine of growth which has been driving world trade for decades. This can hardly be in the interest of the European or American economies, which are increasingly dependent on exports and imports from Asia. The role of the Fed’s monetary policy However Asian currency undervaluations also have draw-backs for Asia itself. They have kept local financial markets under-developed, because the savings are largely held in financial assets denominated in US dollars. Investing their savings in developed and apparently efficient capital markets with attractive opportunities for capital gains seemed a rational investment strategy for surplus countries. But it is only in conjunction with loose macroeconomic policies in the USA that significant imbalances in the world economy could emerge. It is therefore not correct that the USA were the victims of a «global savings glut». If capital inflows from the rest of the world have fuelled the asset bubble in America, this was only possible because the Federal Reserve System has not sterilized the capital inflow and has kept interest rates low. It has done so, because it was primarily concerned with avoiding inflation. The real puzzle is: why have low interest rates and the savings glut produced in East Asia not generated inflation? The answer is that they have – although not by increasing prices for goods and services but in the form of asset price inflation. This separation of financial and goods markets is a consequence of globalization. Over the last two decades the world economy has been characterized by a unique economic constellation, which has defied conventional theories of monetary policy and is much closer to earlier theories by Sir Arthur Lewis (1954), who earned the Nobel Prize for his theory of development with unlimited supply of labour. The opening up of the Chinese and Indian (4) Collignon, 2008 calls this monetary mercantilism. (5) For a formal model see Collignon, 2002.
15
HOUSEHOLD SAVINGS RATIO Figure 5
-5
0
5
10
15
20
25
92 94 96 98 00 02 04 06 08 10
United States CANADAAUSTRALIA IRELANDITALY FRANCEGERMANY FINLANDNETHERLANDS JAPAN
US Bull market US Bull market
WORLD STOCK EXCHANGES Figure 6
0
1,000
2,000
3,000
4,000
5,000
6,000
90 92 94 96 98 00 02 04 06 08
AUSTRALIA
0
10,000
20,000
30,000
40,000
90 92 94 96 98 00 02 04 06 08
BELGIUM
0
10,000
20,000
30,000
40,000
90 92 94 96 98 00 02 04 06 08
CHINA
0
100
200
300
400
500
600
90 92 94 96 98 00 02 04 06 08
DENMARK
0
5,000
10,000
15,000
20,000
90 92 94 96 98 00 02 04 06 08
FINLAND
0
2,000
4,000
6,000
8,000
10,000
90 92 94 96 98 00 02 04 06 08
GERMANY
0
2,000
4,000
6,000
8,000
90 92 94 96 98 00 02 04 06 08
GREECE
0
2,000
4,000
6,000
8,000
90 92 94 96 98 00 02 04 06 08
IRELAND
0
10,000
20,000
30,000
40,000
90 92 94 96 98 00 02 04 06 08
ITALY
0
10,000
20,000
30,000
40,000
90 92 94 96 98 00 02 04 06 08
JAPAN
0
10
20
30
40
50
60
90 92 94 96 98 00 02 04 06 08
NEDERLANDS
0
500
1,000
1,500
2,000
90 92 94 96 98 00 02 04 06 08
RUSSIA
0
400
800
1,200
1,600
2,000
90 92 94 96 98 00 02 04 06 08
SPAIN
0
100
200
300
400
500
90 92 94 96 98 00 02 04 06 08
SWEDEN
500
1,000
1,500
2,000
2,500
3,000
3,500
90 92 94 96 98 00 02 04 06 08
UK
0
400
800
1,200
1,600
90 92 94 96 98 00 02 04 06 08
US
economies and of the formerly planned economies under Soviet influence has roughly doubled the labour force in the world market. With low transportation costs for goods, people and ideas, the removal of trade barriers, and with productivity in the manufacturing sector being higher than in the traditional economy, labour supply has become quasi perfectly elastic in emerging economies. Thus, international competition has fixed the world reservation wage

16
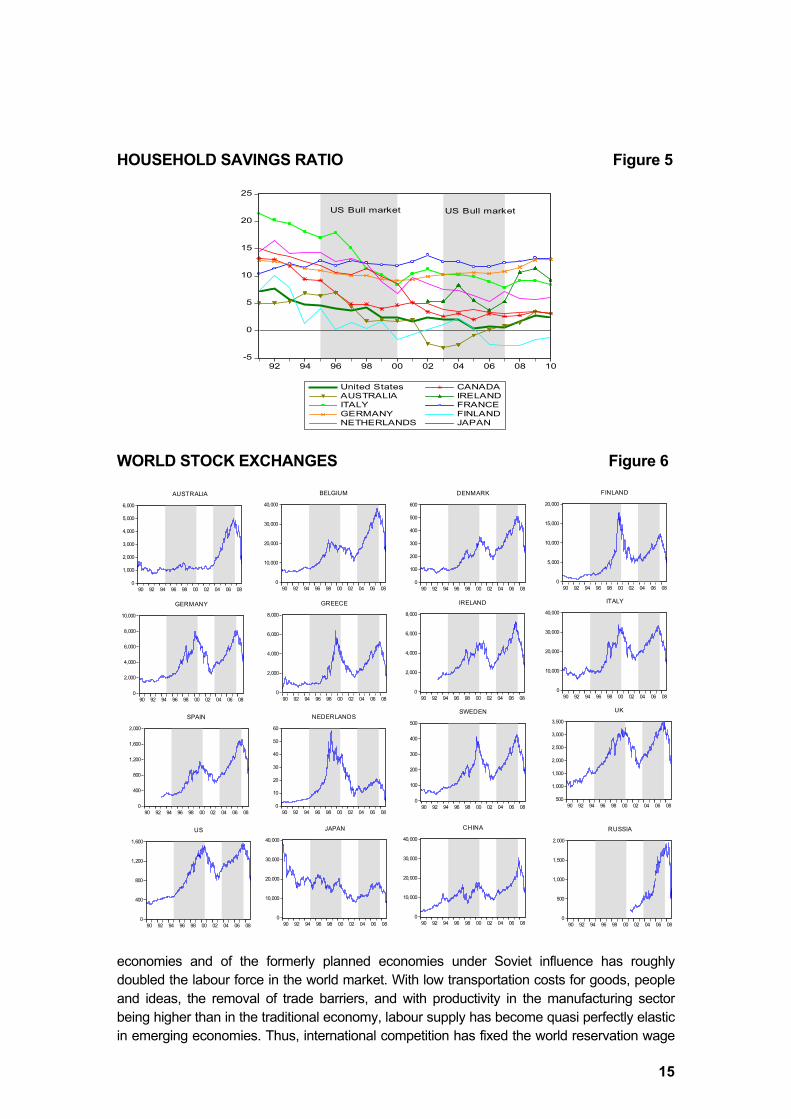
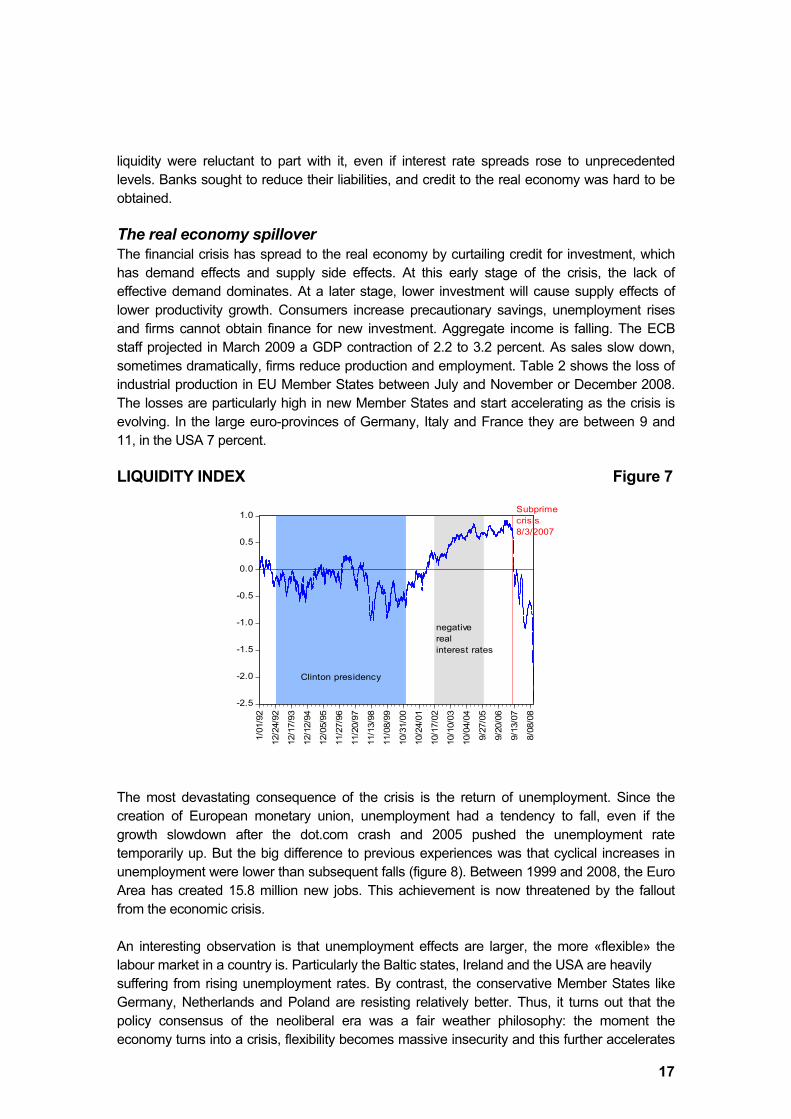
for unskilled labour, and labour costs in the world economy do not rise significantly (Bean, 2006). The NAIRU (non-accelerating inflation rate of unemployment fell and monetary policy was able to become more accommodative. This has kept prices for goods and services in the tradable sector stable (in fact many economists feared the risk of deflation), while the rising amount of liquidity has fuelled the inflation of asset prices. In the United States, the inflation of house prices and the stock market, gave ordinary households the impression that saving out of income was no match for capital gains. It was better to borrow and invest than save. The savings rate of US households fell close to zero (figure 5). This reflects perfectly rational behavior, given that the rapid appreciation of assets in the housing and stock markets has increased wealth faster than any saving out of income possibly could. Investment was financed out of capital inflows (the savings glut), which were attracted by the gains promised in financial markets. Interestingly, the savings ratio has fallen in most advanced industrial countries over the last decade, with the exception of Germany, where the labour market reforms by the Schröder Government increased precautionary savings. This is not surprising, given that asset prices all over the world were inflated (figure 6). II. The Euro Area in the Turmoil From financial to economic crisis In our story so far, Europe is mainly a marginal by-stander. It is preoccupied with internal quarrels of minor importance and silent on the management of the world economy. And yet, it is now hit by the crisis with a violence that few would have imagined possible. The financial shock The transmission of the US crisis to Europe had two channels: through banking and trade. The huge losses in the US housing market were transmitted to banks which had bought mortgage-backed securities. Many of these buyers were second-order players in Europe, who had hoped to get a slice in the financial boom. The losses then spread to other derivative products such as CDS (6). These banking losses induced now the European de-leveraging cascade. By early 2009, the Washington-based Institute for International Finance estimated the write-downs of large banks in industrialised countries USD 1000 billion. The Bank of England (2008) has calculated the value of bank losses due to price adjustments under mark-to market rule equal to USD 2800-3400 billion, and the Asian Development Bank estimated that financial assets worldwide have fallen by more than USD 50 000 billion – a figure equivalent to the value of world output (Loser, 2009). As a consequence, liquidity dried up in the interbank markets in Europe as in the US, despite massive interventions by central banks who provided liquidity as substitutes for inter-bank lending. Figure 7 shows the liquidity index as published by the Bank of England. It is an average of several indicators and clearly shows the excess liquidity creation during the period of negative real interest rates in the USA and the collapse after the subprime crisis broke out. With liquidity less available, financial risks and uncertainties increased dramatically. Owners of
(6) A credit default swap (CDS) is a credit derivative contract between two counterparties. The buyer makes periodic payments to the seller, and in return receives a payoff if an underlying financial instrument defaults. CDS contracts have been compared with insurance, because the buyer pays a premium and, in return, receives a sum of money if one of the specified events occur.
17
liquidity were reluctant to part with it, even if interest rate spreads rose to unprecedented levels. Banks sought to reduce their liabilities, and credit to the real economy was hard to be obtained. The real economy spillover The financial crisis has spread to the real economy by curtailing credit for investment, which has demand effects and supply side effects. At this early stage of the crisis, the lack of effective demand dominates. At a later stage, lower investment will cause supply effects of lower productivity growth. Consumers increase precautionary savings, unemployment rises and firms cannot obtain finance for new investment. Aggregate income is falling. The ECB staff projected in March 2009 a GDP contraction of 2.2 to 3.2 percent. As sales slow down, sometimes dramatically, firms reduce production and employment. Table 2 shows the loss of industrial production in EU Member States between July and November or December 2008. The losses are particularly high in new Member States and start accelerating as the crisis is evolving. In the large euro-provinces of Germany, Italy and France they are between 9 and 11, in the USA 7 percent. LIQUIDITY INDEX Figure 7
-2.5
-2.0
-1.5
-1.0
-0.5
0.0
0.5
1.0
1/01
/92
12/2
4/92
12/1
7/93
12/1
2/94
12/0
5/95
11/2
7/96
11/2
0/97
11/1
3/98
11/0
8/99
10/3
1/00
10/2
4/01
10/1
7/02
10/1
0/03
10/0
4/04
9/27
/05
9/20
/06
9/13
/07
8/08
/08
Subprimecrisis8/3/2007
Clinton presidency
negativerealinterest rates
The most devastating consequence of the crisis is the return of unemployment. Since the creation of European monetary union, unemployment had a tendency to fall, even if the growth slowdown after the dot.com crash and 2005 pushed the unemployment rate temporarily up. But the big difference to previous experiences was that cyclical increases in unemployment were lower than subsequent falls (figure 8). Between 1999 and 2008, the Euro Area has created 15.8 million new jobs. This achievement is now threatened by the fallout from the economic crisis. An interesting observation is that unemployment effects are larger, the more «flexible» the labour market in a country is. Particularly the Baltic states, Ireland and the USA are heavily suffering from rising unemployment rates. By contrast, the conservative Member States like Germany, Netherlands and Poland are resisting relatively better. Thus, it turns out that the policy consensus of the neoliberal era was a fair weather philosophy: the moment the economy turns into a crisis, flexibility becomes massive insecurity and this further accelerates

18
the downward spiral. It may be that economies with low social safety systems may also turn the corner more rapidly, but whether that is still true remains to be seen. A deep and short recession may or may not be more costly in welfare terms than a more moderate and drawn out crisis. The interdependence between leading industrialized economies is particularly clear from data for industrial production. Granger causality tests show high significance levels for growth of USA causes growth of Japan, that between UK and USA the causal link is bidirectional, that growth in the Euro Area causes growth in Japan and that growth in UK causes growth in . Stimulating world trade Because the American economy was the engine driving world demand for years, the sharp US recession has reduced demand for imports and therefore for exports from the rest of the world. The WTO expects world trade to contract by 9 percent in 2009. LOSS OF INDUSTRIAL PRODUCTION Table 2
From July 2008 to:November 08 December 08
% %
LT -13.5 SK -19.7EE -12.7 RO -18.5
LUC -12.6 SI -15.1SI -11.6 EE -14.8RO -10.9 LT -12.5ES -8.9 LU -12.2IT -8.5 SE -12.1SE -8.3 ES -12.1BE -8.1 IT -10.8SK -8.0 DE -10.7PT -7.7 CZ -10.2LV -7.6 LV -10.0CZ -7.5 BG -9.8DK -7.5 PT -9.7PL -7.5 PL -9.6FR -7.4 FR -9.0BG -6.3 FI -8.8DE -6.1 DK -7.7HU -6.1 IE -7.6GR -5.8 US -7.5US -5.7 GR -7.1UK -5.4 UK -7.0FI -5.3 NL -2.4CY -2.3NL -1.2AT -0.4IE 3.0

19
The export channel has been the mechanism, in addition to financial contagion, by which the US-crisis has become a world crisis. This is documented by the fact that production in tradable sectors like manufacturing has fallen at significantly higher rates than non-tradable sectors like services. Hence, overcoming the crisis requires reviving world trade. All forms of protectionism are therefore counterproductive and aggravate the crisis. Yet, as the crisis drags on, the pressure grows for governments to push the cost of the crisis on other countries and protect the home turf. CHANGES IN UNEMPLOYMENT RATES Table 3
Rank Country Unemployment 6/1/2008
Unemployment 1/1/2009 Change %points
1 BG 5.7 5.3 -0.42 PL 7.1 6.7 -0.43 DE 7.3 7.3 0.04 SK 9.8 9.8 0.05 NL 2.7 2.8 0.16 MT 5.9 6.0 0.17 FI 6.4 6.6 0.28 BE 7.0 7.2 0.29 AT 3.7 4.0 0.310 PT 7.8 8.1 0.311 SI 4.5 4.9 0.412 CY 3.7 4.3 0.613 CZ 4.4 5.0 0.614 FR 7.7 8.3 0.615 Euro 7.5 8.2 0.716 LU 4.4 5.1 0.717 HU 7.8 8.6 0.818 DK 3.2 4.3 1.119 SE 5.8 7.4 1.620 IE 5.9 8.8 2.921 ES 11.0 14.8 3.822 EE 4.5 8.6 4.123 LT 5.2 9.8 4.624 LV 6.3 12.3 6.025 RO 5.7 n.a. n.a.26 UK 5.5 n.a. n.a.27 IT 6.8 n.a. n.a.
JP 4.1 4.1 0.0US 5.6 7.6 2.0
A number of measures could stimulate trade. Given the malfunctioning of the financial system, governments guarantees for trade financing could be an important leverage to re-ignite private funding. Another measure is increasing development aid. However, the initial stimulus for higher trade has to come from reviving demand, i.e. investment and consumption in the world economy. Stimulating this demand requires policy coordination. But there is a high risk of coordination failure due to collective action problems. The danger is that individual countries

20
UNEMPLOYMENT RATES Figure 8 (monthly data)
2
3
4
5
6
7
8
9
10
11
1996 1998 2000 2002 2004 2006 2008
EURO JAPAN USA
Euro dot.combubbleends
9/11attack
subprimecrisis
will try to pass the buck of raising debt to someone else, hoping to benefit from the growth stimulus undertaken by others. But this logic applies to each actor and the likelihood is therefore high that nothing will be done at all, or that the stimulus packages agreed remain significantly below the levels required. At this moment, the US government is the only international player, maybe together with China, with a clear vision for the need of large concerted stimulus packages. Europe, led by Germany, is dragging its feet, incapable of taking bold action, when action is required. In different times, American leadership would have been sufficient to overcome the obstacle, but the United States are now too weak. The European dwarfs, who have been calling for multilateralism under President Bush, are now failing to deliver, when President Obama is granting them the opportunity to get what they said they wanted. If benevolent hegemony and cooperative multilateralism become impossible, a coalition of the willing must lead the way out of the cul-de-sac. But who should be America’s partner? Europe and America cover each approximately 22 percent of world GDP, China 11 percent and Japan 7 percent. The whole of East Asia (ASEAN plus 3 – China, Japan, Korea) are approximately of the same size as the EU (figure 9a). But the euro has created financial markets of equal size to the US, while Asia does not (yet) have then. Hence, Europe is the natural partner for the United States and it must assume the responsibilities which come with having the second most important currency. Europe’s political impotence is only matched by its intellectual ignorance. If Europe does not get its act together, China will have to take the lead. Stimulating investment In last year’s Rapporto Europa, CER found that especially in Europe investment responds to higher demand (the accelerator model) more than to lower costs of capital. This justifies the huge demand stimulus packages proposed by governments. In fact, they may still be too small and not well structured (see below). Government spending and public debt have two functions in the present crisis: creating demand for goods and services, and stabilizing the financial system. First, while consumer confidence and private spending is down, government expenditure has to substitute for it. We will discuss the stimulus packages below, but here we need to

21
TOTAL EXPORTS AND IMPORTS: EXTRA AND INTRA EU Figure 9 (monthly data)
40,000
60,000
80,000
100,000
120,000
140,000
160,000
99 00 01 02 03 04 05 06 07 08
Export Euro AreaImports Euro Area
Euro Area
800
1,200
1,600
2,000
2,400
2,800
3,200
99 00 01 02 03 04 05 06 07 08
Exports AT Imports AT
Austria
2,000
3,000
4,000
5,000
6,000
7,000
8,000
9,000
10,000
99 00 01 02 03 04 05 06 07 08
Exports BE Imports BE
Belgium
0
200
400
600
800
1,000
1,200
99 00 01 02 03 04 05 06 07 08
Exports BG Imports BG
Bulgaria
0
40
80
120
160
200
240
99 00 01 02 03 04 05 06 07 08
Exports CY Imports CY
Cyprus
0
400
800
1,200
1,600
2,000
2,400
99 00 01 02 03 04 05 06 07 08
Exports CZ Imports CZ
Czech Republic
800
1,000
1,200
1,400
1,600
1,800
2,000
2,200
99 00 01 02 03 04 05 06 07 08
Exports D K Imports D K
Denmark
0
50
100
150
200
250
300
99 00 01 02 03 04 05 06 07 08
Exports EE Imports EE
Estonia
400
800
1,200
1,600
2,000
2,400
2,800
99 00 01 02 03 04 05 06 07 08
Exports FI Imports FI
Finland
6,000
7,000
8,000
9,000
10,000
11,000
12,000
13,000
14,000
99 00 01 02 03 04 05 06 07 08
Exports FR Imports FR
France
8,000
12,000
16,000
20,000
24,000
28,000
32,000
99 00 01 02 03 04 05 06 07 08
Exports D E Imports D E
Germany
0
400
800
1,200
1,600
2,000
2,400
99 00 01 02 03 04 05 06 07 08
Exports GR Imports GR
Greece
0
400
800
1,200
1,600
2,000
2,400
99 00 01 02 03 04 05 06 07 08
Exports H U Imports H U
Hungary
800
1,200
1,600
2,000
2,400
2,800
3,200
99 00 01 02 03 04 05 06 07 08
Exports IE Imports IE
Ireland
4,000
6,000
8,000
10,000
12,000
14,000
16,000
99 00 01 02 03 04 05 06 07 08
Exports IT Imports IT
Italy
0
40
80
120
160
200
240
99 00 01 02 03 04 05 06 07 08
Exports LV Imports LV
Latvia
0
200
400
600
800
1,000
99 00 01 02 03 04 05 06 07 08
Exports LT Imports LT
Lithuania
0
100
200
300
400
500
600
700
800
99 00 01 02 03 04 05 06 07 08
Exports LU Imports LU
Luxembourg
0
40
80
120
160
200
240
99 00 01 02 03 04 05 06 07 08
Exports MT Imports MT
Malta
0
4,000
8,000
12,000
16,000
20,000
99 00 01 02 03 04 05 06 07 08
Exports NL Imports NL
Netherlands
0
400
800
1,200
1,600
2,000
2,400
2,800
3,200
3,600
99 00 01 02 03 04 05 06 07 08
Exports PL Imports PL
Poland
200
400
600
800
1,000
1,200
1,400
1,600
99 00 01 02 03 04 05 06 07 08
Exports PT Imports PT
Portugal
0
400
800
1,200
1,600
2,000
99 00 01 02 03 04 05 06 07 08
Exports RO Imports RO
Romania
0
200
400
600
800
1,000
1,200
1,400
99 00 01 02 03 04 05 06 07 08
Exports SK Imports SK
Slovakia
100
200
300
400
500
600
700
99 00 01 02 03 04 05 06 07 08
Exports SI Imports SI
Slovenia
0
2,000
4,000
6,000
8,000
10,000
12,000
99 00 01 02 03 04 05 06 07 08
Exports ES Imports ES
Spain
1,200
1,600
2,000
2,400
2,800
3,200
3,600
4,000
4,400
4,800
99 00 01 02 03 04 05 06 07 08
Exports SE Imports SE
Sweden
6,000
8,000
10,000
12,000
14,000
16,000
18,000
99 00 01 02 03 04 05 06 07 08
Exports UK Imports UK
United Kingdom
40,000
60,000
80,000
100,000
120,000
140,000
160,000
180,000
200,000
220,000
99 00 01 02 03 04 05 06 07 08
Exports US Imports US
United States of America
2,000
3,000
4,000
5,000
6,000
7,000
8,000
99 00 01 02 03 04 05 06 07 08
Exports JP Imports JP
Japan
emphasize that private investment has the highest impact on re-igniting economic growth, followed by public investment. Public consumption and cutting taxes seem unsuitable to raise growth rates, although they may still be useful in short run demand management. Investment is also crucial for improving productivity and employment in the medium and long term. New additions to the capital stock incorporate usually new technology and thereby increase total factor productivity. Jobs are created when the rate of capital accumulation exceeds the rate of investment per worker (the growth rate of capital intensity). Hence, stimulating investment is the single most important policy variable in today’s efforts to overcome the crisis. Targeted tax policies can stimulate private investment by creating selected incentives. One method with the highest impact is the introduction of accelerated schedules for the depreciation of capital. In recent years, several European governments have abolished accelerated depreciation rates in favour of rates that cover the full life of an equally asset. While this may reflect more truthful accounting, it has slowed down economic growth and advancements in productivity. It would be desirable to return to more dynamic depreciation tax schedules. Second, investment is constrained by the lack of trust in the financial system and bank’s need for deleveraging to reduce risk. Hence, restoring stability to the financial system is a necessary condition for reviving the economy. Here, too, government debt can play a useful role.

22
WORLD GDP 2007 Figure 9a (in ppp dollars)
United States21%
China11%
Japan7%
India5%
Russia3%
Brazil3%
Mexico2%
Canada2%
Korea, South2%
Turkey1%
Indonesia1%
Australia1% Iran
1%Taiwan
1%
RoW17%
Germany4%
United Kingdom3%
France3%
Italy3%
Spain2%
RoEU6%Other
22%
United States China Japan India Russia Brazil Mexico
Canada Korea, South Turkey Indonesia Australia Iran Taiwan
RoW Germany United Kingdom France Italy Spain RoEU Deleveraging means reducing credits to the private sector. New credits are only given to borrowers with lowest possible risk exposure. However, it is usually assumed that government debt in own currency represents one of the lowest risk titles, because governments have the power to tax to ensure their capacity of servicing debt. Therefore, if governments issue debt to finance the stimulus packages, they provide low risk securities for the banking system, which could strengthen banks’ balance sheets. This argument must be qualified with respect to the criteria of (strong) sustainability of debt: markets must be convinced that public debt levels will not increase without limits and that the issuing government is indeed capable of taxing its citizens. In Europe, these conditions are met for all Member States except for Italy, which has the highest debt/GDP ratio, and a primary surplus (necessary to service the debt) at the limits of taxpayers acceptance (7).
Euro Area imbalances Mistaken current account figures Although the Euro Area has resisted better to the crisis than non-Euro Member States, there are signs of increasing imbalances within the monetary union that risk becoming disruptive. They are making the Euro Area economically and politically more fragile and future shocks could become fatal unless decisive policy corrections are made now (8). But action requires proper understanding of the issues involved. Unfortunately, economic
(7) When the last Prodi government increased taxes to consolidate public finances, the opposition called for a tax boycott (sciopero fiscale) and the government was soon replaced by a prime minister who has publicly declared that paying more than 30 percent taxes is «immoral». (8) The European Commission has also pointed these risks out in a confidential note to the Eurogroup, dated 25.11.2008

23
thinking in Europe is very confused. Eurostat and national statistics continue to publish current account figures for individual Member States. Several observers, including the European Commission (2009), have called the attention to the fact that the external balance for the Euro Area, although close to zero, is hiding significant internal disequilibria between Member States (table 1 and figure 10). Deficits are high and rising in the South, they are matched by surpluses in North. The discrepancies have dramatically increased since monetary union started 10 years ago. Germany’s surpluses are close to € 200 billion, Spain’s deficit around € 100 billion. Yet, these deficits are not of the same quality as the US or Euro Area current account positions, because Euro Area Member States do not have their own currencies. The current account is the mirror image of the sum of the capital and financial transactions in foreign currency, together with changes in official reserves. A current account surplus increases a country's net foreign assets, and a current account deficit does the reverse. At the end of the third quarter of 2008, the outstanding international investment position were assets amounting to 152.4 percent of Euro Area GDP, the liabilities were 165.0 percent and the net position was a liability of 12.6 percent (9) CURRENT ACCOUNT EURO AREA Figure 10 (in billion dollars)
-120
-80
-40
0
40
80
120
160
200
1980 1985 1990 1995 2000 2005
Euro area (12 countries) FINLANDFRANCE GERMANYIRELAND ITALYNETHERLANDS PORTUGALSPAIN
In the Euro Area, calculating current account balances for individual Member States is deeply misleading, for it mixes claims denominated in foreign currencies with claims in domestic (i.e. euro) currency. To make this logic clear, assume Deutsche Bank holds a claim against Caixa. This is an asset for Deutsche Bank and a liability for Caixa. If Caixa needs to repay, it can use its own liquidity reserves or borrow from the ECB, which will always provide liquidity through the «open discount window» in its function as lender of last resort. Thus, Deutsche Bank is always guarantied reimbursement, as long as Caixa is not insolvent. A prudent bank will therefore carefully monitor the creditworthiness of its business partners. But, and this is the point, it does not matter, whether Caixa is a Bank in Germany or Portugal, as long as it is solvent. By contrast, if Deutsche Bank holds a claim against Pekao Bank in Poland, it matters
(9) ECB Monthly Bulletin, 03-2009

24
that the claim is denominated in a different currency. When Pekao wants to settle a debt with Deutsche Bank, it needs euros, which it will get either from drawing on its own assets in euros, or by going to the Polish National Bank, which will draw on its foreign exchange reserves. Here is the difference: there is no international lender of last resort. Pekao may be a perfectly successful and solvent bank, but if the country’s net foreign assets are drawn down, Pekao will not be able to meet its obligations to a foreign bank. Because commercial debt obligations are settled by transferring money through the banking system, the same applies for payment obligations between non-banks: only foreign currency transaction are «foreign». A claim by a German supplier for payment by an Italian client is no more a foreign asset, than a claim by a supplier in New York on a client in New Jersey or a debt by a Milan company to a supplier in Torino. In economic terms, a «country» is the currency area. It is a Fundamental Assignment Error to believe that the logic of jurisdictions (and states) coincides with the functional logic of the economy. The issue here is that although there are significant imbalances within the Euro Area, it would be misleading to lump them together with the international current account positions. For example, Germany’s apparent current account surplus is not comparable with Japan’s, because nearly 2/3 of it are generated by intra-EU trade. In other words, of the apparent € 200 billion Euro Area surplus, € 140 billion are denominated in euros and reflect nothing else but interbank liabilities generated by companies operating in the single market. The other € 60 billion euros are the contribution that German firms make to the current account balance of the Euro Area. This allows companies in other Member States to buy imports from outside the Euro Area, without being constrained by foreign exchange restrictions. According to everything we know from trade theory, this is a good thing, for it allows the Euro Area economy to grow and become more efficient. Instead of running out of foreign exchange reserves, Spain can buy petrol in Mexico and cars from Germany. Competitiveness One may, of course, fancy to evaluate the claims economic agents have on each other in foreign currency. This could indicate the relative position of competitiveness. But in this case we need to separate foreign currency transactions from euro transactions. Figure 11 gives the quarterly current account position of the Euro Area vis-à-vis some selected countries. It appears that Euroland commands fairly stable current account surpluses with respect to UK, Sweden, Switzerland, Canada and the USA and rising surpluses with the rest of the EU; the structural deficit with Japan has a tendency to increase. An alternative view of competitiveness is obtained by looking at the trade balances. Eurostat publishes separate data sets for intra-EU and extra-EU trade in goods. These figures do not take into account services and foreign remittances and this can make a significant difference between the trade balance and the misleading figure for national «current accounts». The trade balance between Member States is, however, significant as an indicator for relative competitiveness within the single market (see below). Differences between external and intra-EU trade balances may be due to Euro Area structural factors, but if they are both negative, they are likely to signal competitiveness problems (table 4). If current account balances are not an appropriate tool for assessing competitiveness issues in the Euro Area, we need another indicator. The proper measure is the relative position of the level of unit labour costs (ULC). They indicate the wage cost per unit of output and depend on nominal wage and productivity developments. If productivity is high, nominal wages can also be high, without loss of competitiveness. An economy will gain (loose) in competitiveness if its wages grow less (more) than its productivity.

25
CURRENT ACCOUNT POSITION Figure 11 EUROLAND VIS À VIS SELECTED COUNTRIES (quarterly data)
Diverging unit labour costs Although statistics on changes of ULC are easily obtained, estimates of levels are less frequent. figure 12 gives our version. The problem is determining a significant base year to estimate relative positions. Rather than taking the year 2000 as the index base (index = 100), we have taken the levels of real unit labour costs for 2000 as the base for ULC levels. Real unit labour costs are identical with the wage share and are therefore an indicator for profit margins. If we assume that under perfect competition profit margins would converge in the single market with a single currency, deviations in the wage share at the beginning of monetary union are a reasonable indicator for different competitiveness positions, which have subsequently improved or deteriorated due to wage settlements and productivity developments in the individual Member States. Before the start of monetary union, we saw significant shifts in relative unit labour costs caused by exchange rate realignments during the ERM crisis in 1992-3. While devaluations in Italy, Spain, Portugal and Greece brought labour cost levels below the Euro-average, Germany, Austria and Belgium became seriously overvalued as a mirror image. Hence, nominal exchange rate flexibility did not only eliminate distortions, but actually created new ones. By the time European monetary union started, these distortions were at least partially corrected, although Portugal started out with the highest real unit labour costs (the lowest
-30
-20
-10
0
10
20
30
2003 2004 2005 2006 2007 2008
WORLD
5
10
15
20
25
30
2003 2004 2005 2006 2007 2008
UK
-0.5
0.0
0.5
1.0
1.5
2.0
2003 2004 2005 2006 2007 2008
SWEDEN
0
1
2
3
4
5
2003 2004 2005 2006 2007 2008
DENMARK
0
4
8
12
16
20
2003 2004 2005 2006 2007 2008
Other EU
-5
0
5
10
15
20
2003 2004 2005 2006 2007 2008
USA
-14
-12
-10
-8
-6
-4
2003 2004 2005 2006 2007 2008
JAPAN
0
1
2
3
4
5
6
2003 2004 2005 2006 2007 2008
CANA
-2
0
2
4
6
2003 2004 2005 2006 2007 2008
SWITZERLAND

26
CURRENT ACCOUNT BALANCES 2007 Table 4 Current Account Trade Balance in Goods
Global Total EU Trade Intra EU Extra EUbn USD bn USD bn USD bn USD
Spain -144.6 -128.8 -59.3 -69.5France -73.1 -61.4 -65.7 4.2Greece -43.7 -52.3 -28.6 -23.7Italy -36.5 -12.9 7.8 -20.7Portugal -22.1 -26.5 -19.3 -7.2Ireland -14.0 37.8 18.7 19.1Slovakia -3.8 -2.0 5.7 -7.8Cyprus -2.1 -7.2 -4.9 -2.3Slovenia -1.9 -1.4 -2.4 0.9Malta -0.4 -1.4 -1.7 0.3Luxembourg 4.9 -5.0 -0.3 -4.7Belgium 11.1 18.5 36.4 -17.8Austria 12.3 0.6 -10.5 11.1Finland 13.0 8.3 -1.2 9.4Netherlands 75.7 57.8 182.0 -124.2Germany 250.5 266.1 167.3 98.9Balance 25.3 90.1 224.0 -133.9Source: CIA Factbook 2008 for Asia and AMECO 2008 for Euro Area UNIT LABOUR COST LEVELS Figure 12 (2000=adjusted wage share)
.3
.4
.5
.6
.7
.8
.9
90 92 94 96 98 00 02 04 06 08 10
ULCAUT ULCBEL ULCDEUULCESP ULCEU ULCFINULCFRA ULCGRC ULCIRLULCITA ULCLUX ULCNLDULCPRT
profit margins) in the Euro Area and nominal ULC have unabatedly grown at above-average rates until today. Spain, Greece and Italy have also had rapid increases in ULC, moving from below-average to above-average labour cost levels. Today, Spain, Portugal and Greece are the most expensive labour locations in Europe (we consider Luxemburg with its high banking concentration as a special case). The opposite is true for Germany. It first kept ULC stable in nominal terms, while they were rising in the ; unit labour costs then actually fell in absolute

27
terms after the Hartz-reforms started to bite. Today Germany is the cheapest labour cost location in the . Finland devalued in the early 1990s and has maintained this initial competitive advantage. Austria has followed the German wage trajectory until Germany started the Hartz-Reforms. The overall picture shows the South of Euroland (Greece, Italy, Spain, Portugal and Ireland) pushing aggregate unit labour cost inflation above the ECB price stability target, while the North (Germany, Austria and Finland) are keeping it down. If this were a persisting structural feature, it would be worrisome: North and South would drift apart, with the South becoming increasingly less competitive. While the accumulation of competitive advantage has strengthened the export performance, particularly in Germany, it has made export economies also more vulnerable in the present crisis, when American import demand has disappeared and world trade has slowed down. If unchecked, such development could lead to the breakup of European monetary union. We analyse these unit labour cost divergences in further detail in Chapter 3 of this report. The issue is important, for unless high unit labour cost levels return to average, monetary union would become unsustainable. Evidence so far is that with the exception of Germany, most Member States seem to return slowly to the Euro aggregate. But the adjustment process is slow and painful, causing what Olivier Blanchard has called «rotating slumps». Unit labour cost developments are also important because they affect the impact and the efficiency of macroeconomic stimulus packages in the Member States and interact with monetary policy. To improve the speed of adjustment and reduce the welfare cost, the CER Rapporto Europa 2008 has called for a reform of the Macroeconomic Dialogue. We suggested to make European wage bargaining more transparent by transferring the competences for the Macroeconomic Dialogue from the Council to the European Parliament. This remains an important policy agenda. The divergence of unit labour costs in the is of major importance in the context of combating the financial crisis: if government spending stimulates economic demand, but the North has substantial price advantages over the South, the effects of stimulus packages will be highly unequal. The North will attract demand from the South and move much faster out of the recession than the South. This would create social and political tensions, as taxpayers in the South feel the rising tax burden without visible improvement of their productivity. By contrast the North will argue that they do not need to implement fiscal stimulus. The Macroeconomic Policy Mix in the Euro Area The purpose of macroeconomic stabilisation policy is to reduce economic uncertainty, create a stable environment for economic decision makers and in the crisis to restore investor confidence. Until the present troubles started, the aggregate macroeconomic performance has remained remarkably close to fundamental balance: prices have remained stable, unemployment has come down and the current account was roughly in equilibrium. We now look at the contribution that monetary and fiscal policy can make in restoring growth after the crisis.

28
INFLATION IN EURO AREA Figure 13
0
1
2
3
4
5
6
7
99 00 01 02 03 04 05 06 07 08
HICP - Overall indexHICP - All-items excluding energy and unprocessed foodFROOPPNONFROOPP
European monetary policy The European Central Bank is the only properly functioning European institution in the present crisis (10). This is because it is a unified, coherent and independent institution, to which clearly defined policy tasks have been delegated, so that the «collective action problems» of free-riding and moral hazard are avoided. This is an important lesson for other economic policy domains. Monetary policy in the Euro Area is committed to the primary objective of price stability, but conditional on meeting this target the European Central Bank has to support the other objectives of the European Union, such as «to promote economic and social progress and a high level of employment and to achieve balanced and sustainable development» (Treaty on European Union, art. 2). Evidence over the last decade shows that the ECB takes both missions seriously, including the hierarchical ranking of these objectives. The ECB has been close to its target with an average inflation rate of 2.1 percent in the Harmonised Consumer Price Index (HCPI) from January 1999 to February 2009 (figure 13). It has accommodated occasional price shocks, such as the energy and food price inflation in 2008, but the core inflation rate from January 1999 to February 2009 has been 1.8 percent However, many consumers have complained that the official price index underestimates inflation. In many Member States, the euro has become identified with high cost of living. This is a misperception by consumers, due to framing effects: Eurostat has now constructed two price indices, one for frequent out of pocket purchases (FROOPP), one for non-frequent purchases (11). Figure 13 reveals that FROOPP prices, such as parking, drinks in a café, etc. have exceeded the inflation target most of the time. These prices are highly visible because they are paid on a nearly daily basis, while other items, such as industrial goods excluding energy, have remained close to zero over the whole decade, but are less visible. National inflation rates within the have also converged. The annual standard deviation of national inflation rates for the Euro Area-14 (excluding Slovakia and Slovenia) has been stable (10) We agree with this statement by the former German Chancellor Helmut Schmidt, pronounced at the ECB Conference on Commemorating 10 Years of the Euro in Frankfurt on 2. April 2009 (11) Data in figure 13 before 2006 are annual, thereafter monthly.

29
since monetary union started. If all 16 countries are included in the sample, then the same stability is observed after these two new member stated were able to qualify for entrance (figure 14). Although regional asset inflation did develop in some Member States, they were primarily caused as the effect of the rapid reduction in interest rates after the introduction of the Euro, primarily in Spain, Greece and Portugal and to some extend in Italy. Ireland’s economic boom and asset bubble were less caused by interest rate reductions than by the undervalued exchange rate, which resulted from the Irish devaluation during the ERM-crisis in the early 1990s. It is interesting that all these boom countries are also the Euro members states with above-average consumer price and unit labour cost inflation and large current account deficits. Thus, the South of Europe, in particular Spain and Greece, but also Ireland, have followed a macroeconomic strategy that resembles the American model of asset price inflation and low savings. INFLATION DIVERGENCE WITHIN EURO AREA Figure 14
.00
.01
.02
.03
.04
.05
90 92 94 96 98 00 02 04 06 08 10
Standard deviation acrross Euro14Standard deviation acroos Euro 16
Euro
EURO INTEREST RATES Figure 15
1
2
3
4
5
6
99 00 01 02 03 04 05 06 07 08
ECB policy 3m 10 y gov bondrce: ECB
2000m10dot.combubble
9/11/2001 NorthernRock
USsubprime

30
However, aggregate increases in unit labour costs have remained below the ECB inflation target («below, but close to 2 percent»), and aggregate wage developments have supported monetary policy. But, as we saw above, this stability was mainly due to the falling unit labour costs in Germany. This is a dangerous development, not only because of the North-South drift, but also because it makes monetary policy less efficient. Traditionally, in countries with centralized wage bargaining the central bank can «signal» to wage bargainers that they are exceeding norms of price stability. With decentralized wage bargaining, they can raise interest rates and adjustment takes place through unemployment. But if the unit labour cost increases in the South are compensated by lower one’s in the North, the ECB has no ground to react and divergence becomes persistent. Chapter 3 of this report analyses the factors behind this development in further detail. Zero interest rate policies European monetary policy has been more conservative than in the United States. It has been slower in adjusting interest rates, and the amplitudes of the rate swings have been more moderate. Short term interest rates rarely dipped below the inflation rate, so that holding financial assets in euro remained a rational allocation of wealth. European monetary policy was avoided a home-made asset bubble. The ECB has now cut the interest rate for main refinancing facilities to 1.25 percent. This low level is justified in view of the dramatically reduced inflation perspectives, with price increases falling below 1percent. The rate for the overnight deposit facility is now 0.25 percent and it is unlikely that the ECB will reduce the main rate below 1 percent. Given the perceived danger of deflation and the low level of interest rates in the world, questions have been raised to what degree monetary policy is still effective and capable of re-igniting economic demand. Japan has been an example that 0 percent-interest rates do not necessarily stimulate the economy. (See also Chapter 2 of this report). Like Japan after the 1990s crisis, the US, the UK, and the are now caught in a liquidity trap: interest rates have been cut world-wide and are close to or equal to zero. Money supply is rapidly decelerating. Inflation expectations are bordering deflation. The ECB projects 0.5 percent price increases for 2009 and this is supported by market sentiments expressed in inflation-linked bond markets (12). In these circumstances, cutting interest rates may no longer have much effect. However, even if the price for liquidity were pinned to zero, the central bank can still increase the quantity of central bank money by expanding its balance sheet. This expansion is referred to as quantitative easing (Bernanke and Reinhart, 2004). The question is whether and how increasing money supply may affect the economy. The usual mechanism is through portfolio substitution effects, when investors respond to higher non-interest bearing money balances by switching to higher yielding long term maturities. However, in the present context financial markets are not operating optimally. It has therefore been suggested that central banks should buy long term debt, thereby bringing long term interest rates down. The Federal Reserve System has announced that it will buy US government bonds worth of USD 300 billion. This monetization of government debt has two advantages: first, it yields seignorage income to the Treasury and thereby makes the debt burden easier on tax payers although there are limits how for this can go. Secondly, it also should stimulate investment in the corporate sector by
(12) See ECB, Monthly Bulletin, 2009.03: 34

31
lowering the cost of finance across the full maturity range. Central banks all over the world have responded to the crisis by lowering short term interest rates. The ECB has pursued a policy of «enhanced credit support», through which it is providing banks with as much liquidity as they request at the given interest rate and against a broad range of collateral. Although it avoids the expression monetary easing, the ECB acknowledges applying «non-conventional» measures. As a consequence of enhanced credit support, the deposit facility at which banks can park liquidity over night, and which sets the floor to ECB policy rates, has become a bench mark for market rates. It now stands at 0.25 percent. The ECB considers that these instruments are for the moment sufficient insofar interest rates for longer maturities have also come down. The Bank also argues that the has less need for monetary easing than the USA or the UK, because the structure of the euro financial system is very different from Anglo-Saxon countries, with banks taking a more important role than capital markets (Trichet 2009). This may be true, but some factors make monetary easing particularly problematic and probably prevent this policy tool from being used in Europe (13). The existence of a risk free yield curve plays an important role in the transmission of monetary policy. In the United States, the risk free benchmark are government securities and the FED could influence the yield curve by buying long term securities. However, in the different government bonds are not perfect substitutes, mainly for reasons of market liquidity and risk considerations regarding public debt sustainability. One of the consequences of the recent crisis has been the sharp widening of intra- government bond yield spreads, despite the fact that bond yields are increasingly driven by common factors and the money market. This makes it difficult for the ECB to intervene in this market without distorting individual government’s credit risk. In the US and UK, central banks have moved to «monetary easing», providing liquidity to banks by buying long term government bonds from banks rather than relying on short term money market operations. There are two justification for this: one is related to the seignorage argument of providing money to the government when markets are no longer able to absorb the rapid increase in government securities. This is essentially a fiscal policy argument: the central bank monetizes unsellable public debt. It creates «outside money» (it «prints» money), which has usually inflationary effects, but does little to stimulate growth. The other argument in favour of monetary easing is that it makes the banking system more liquid and should help to make banks lend again. While commercial banks continue to mistrust each others, in most countries, central bank liquidity has risen relative to the total assets of the banking system. If banks are awash with cheap liquidity, they should be more likely to lend it out and earn some revenue. But, as we have seen, in the present climate of uncertainty, the banks will rather deposit liquidity at the ECB’s low deposit facility rate than lending it to other commercial banks. What is needed is a reduction of the liquidity premium due to uncertainty in the economy. In this setting, quantitative easing would not be helpful in the Euro Area. It would raise expectations about inflation and thereby of future monetary tightening. This is not conducive to stimulating investment. The main argument in favour of quantitative easing is the fear of deflation. From a theoretical point of view, this argument implies a belief in monetarism. But if wages are essentially fixed by elastic labour supply in the globalised economy, the increase in money supply will translate (13) In Chapter 2 of this report, we argue that the monetarist view that underlies the idea of monetary easing, may itself be problematic.

32
in the medium to long run, in a new asset bubble and not in consumer price inflation. We have seen that it was exactly the combination of stable unit labour costs and abundant liquidity that created the recent asset bubble after the dot-com bubble crash. Such policies are not sustainable. Enhanced credit support should prevent short run liquidity problems for banks and restore confidence in the system. Central banks must ensure that high liquidity creation will not become the source of the next crisis. William Bagehot advised 200 years ago that in a crisis, the central bank should lend without limit at high rates (see Chapter 2). We believe that this advice needs to be qualified. The most important benchmark for the sustainability of monetary stability is keeping real interest rates positive, but at a low level. Negative real interest rates are an indication that the nominal value of real assets increases faster than the return from financial assets. Investors are therefore ill advised to keep an important share of their wealth in financial investments; if real rates are negative, and this reduces the scope for firms to obtain long term funds for increasing the capital stock. Thus, while it may be justifiable to lower interest rates below inflation expectations to respond to very short run liquidity requirements in the banking system, over the medium to long run real interest rates must be kept positive. REAL SHORT TERM INTEREST RATES Figure 16
-4
-2
0
2
4
6
1994 1996 1998 2000 2002 2004 2006 2008
Real fedfund EUROREAL3MRATE
Euro 9/11/2001 NorthernRock
Lehman
If the concern is deflation, i.e. a general fall in the price level of goods and services, then the appropriate instrument to counter it is a generalized increase in wages. They have the advantage of pushing price expectations up, which is what advocates of quantitative easing seek, and it pumps effective demand into the economy by raising income and consumption. The problem with such strategy is the risk of free-riders. If my partners increase their wages, and I do not, my competitive position improves and I can benefit at the expense of my partners. By bringing wages into the policy tool box, one has to improve macroeconomic policy coordination at a large scale. This is of prime concern within the Euro Area (see Chapter 3). Between different currency areas, exchange rate policies could be used to correct and counterbalance uncooperative policies. Fiscal policy in Euroland If monetary policy is subject to diminishing returns, fiscal policy must come to its help. In

33
European Monetary Union, monetary policy has been centralized in the ECB, but fiscal policy remains essentially under the authority of national Member States. The Stability and Growth Pact was designed to put limits to new public borrowing, but it is not an instrument to give a coherent response to a crisis like the one Europe is facing today. After European monetary union started, budget deficits in many Member States have been limited to the 3 percent of GDP, which are the norm of the Excessive Deficit Procedure in the Maastricht Treaty, but few have kept their budget «in balance or in surplus over the medium term», as stipulated by the Stability and Growth Pact (figure 17). The forecast by the European Commission expects France, Greece, Ireland, Portugal and Spain to exceed the 3 per cent limit in 2009 and 2010 as a consequence of the economic crisis. We think that these estimates are too conservative. The important negative growth of GDP and income should lead to significantly higher deficits as a consequence of the automatic stabilizers and voluntary stimulus packages. Some observers have expressed concern that the Stability and Growth Pact may be an obstacle to the conduct of fiscal policy action in the present crisis. However, in today’s crisis deficits above 3 percent do not violate the SGP, because the Pact foresees the possibility of suspending the 3 percent rule in the case of «severe recessions» (14). The financial and economic crisis has led governments to respond with two sets of rescue plans. One is to restore stability and confidence in financial markets by giving guaranties for deposits and other bank liabilities and by buying toxic assets or recapitalizing banks. The other is with respect to large stimulus packages, intended to compensate for the lack of effective demand resulting from the credit crunch. The Obama administration has passed a USD 789 billion stimulus package, twice the amount of Europe, consisting of increased government spending on current expenditure, public investment and tax cuts. The European Union has passed an Economic Recovery Plan amounting to euro 200 billion. 50 billion of this program are supposedly coming out of the European budget, while 150 are left to the discretion of national finance ministers. Unfortunately, this European Economic Recovery Plan is largely inconsequential window dressing. European fiscal policy suffers from so called collective action problems as no individual government wants to be seen «to be paying for others». While the French government initially pushed for a strong concerted stimulus, having implemented the largest national stimulus, it has now stopped after Germany’s «Mrs. No» (Chancellor Merkel) refused to follow President Sarkozy. More recently, the dominant discourse has become «we need to see the effect of previous measures» before doing more, while the US government had called for an additional and concerted stimulus package of 2 per cent of GDP in 2009 and 2010. The European wait-and-see attitude is an elegant way of avoiding any further commitment. Member States are effectively trying to free-ride on their colleagues’ policy decisions. But as we know from the theory of collective action, if every player is hoping to benefit from the actions undertaken by others, while trying to avoid making his own contribution, the overall results are always suboptimal. Europe’s fiscal policy response to the crisis is inadequate, because governments ignore the externalities of their policy decisions
(14) Severe recessions are defined as involving a drop in real GDP of 0.75 percent or more.

34
BUDGET POSITION: EUROLAND AND USA Figure 17 .
-6
-5
-4
-3
-2
-1
0
1985 1990 1995 2000 2005 2010
Austria
-12
-8
-4
0
4
1985 1990 1995 2000 2005 2010
Belgium
-8
-6
-4
-2
0
2
4
1985 1990 1995 2000 2005 2010
Cyprus
-6
-4
-2
0
2
1985 1990 1995 2000 2005 2010
Euro area (12 countries)
-10
-5
0
5
10
1985 1990 1995 2000 2005 2010
Finland
-8
-6
-4
-2
0
1985 1990 1995 2000 2005 2010
France
-6
-4
-2
0
2
1985 1990 1995 2000 2005 2010
Germany
-15
-10
-5
0
1985 1990 1995 2000 2005 2010
Greece
-12
-8
-4
0
4
8
1985 1990 1995 2000 2005 2010
Ireland
-16
-12
-8
-4
0
1985 1990 1995 2000 2005 2010
Italy
-4
-2
0
2
4
6
8
1985 1990 1995 2000 2005 2010
Luxembourg
-12
-10
-8
-6
-4
-2
0
1985 1990 1995 2000 2005 2010
Malta
-6
-4
-2
0
2
4
1985 1990 1995 2000 2005 2010
Netherlands
-10
-8
-6
-4
-2
0
1985 1990 1995 2000 2005 2010
Portugal
-40
-30
-20
-10
0
1985 1990 1995 2000 2005 2010
Slovakia
-10
-8
-6
-4
-2
0
2
1985 1990 1995 2000 2005 2010
Slovenia
-8
-6
-4
-2
0
2
4
1985 1990 1995 2000 2005 2010
Spain
-12
-8
-4
0
4
1985 1990 1995 2000 2005 2010
United States
and do not consider the impact on the as a whole. The institutional set-up for fiscal policy in the is not able to deal with the financial and economic crisis. Nobel Prize winner Paul Krugman has therefore concluded that Europeans made a mistake to introduce the Euro 10 years ago. But this is the wrong conclusion from a correct observation of facts. He did not consider the currency distortions and additional shocks that would result from diverging national monetary policies. Central and Eastern Europe could teach Krugman a lesson. What Europe needs is a new institutional framework with binding and democratically legitimate policy decisions regarding aggregate fiscal policy stance in the European Union Bonds Furthermore, with respect to the budget of the European Union, it is not clear whether the announced stimulus of € 50 billion is of any help. Is it considered an addition to the ordinary expenses foreseen by the 5 year Financial Framework or does it consist in some advance expenditure under given budget plans? The easy way out is to use money that was not spent under previously authorized titles. But then it is far-fetched to call this a stimulus. In this context, an idea first expressed by then Commission President Jacques Delors has found renewed interest, especially in Italy: issuing European Union Bonds to enable the Union to finance European-wide infrastructure projects. Such bonds would also have the advantage of creating a market for government bonds independent of member state risks. Today, such bond issues are not possible, because the European budget must always be

35
balanced and it is financed by Member State contributions. Hence, the creation of European Union Bonds would require a change in Treaty provisions. Given that the Lisbon Treaty is still not ratified, this does not look like an easy option to finance the needed economic stimulus. It is also not clear, how such European Union Bonds are to be serviced. If it is done out of member state budgets, it is understandable why Greece, Ireland or Italy would like such bonds: the spread of their government debt over German bonds makes financing national deficits significantly more expensive and by issuing Union Bonds, Southern Member States could hope to free ride on Germany. But it is also clear, that the German government would not want to pay the interest for other Member States. Bundesbank president Axel Weber made this clear by stating that Area Euro bond would be exactly the wrong road. Common liability for national state finances is not desirable and would not be in agreement with the constitutional framework of the EU – the so-called no bail-out clause. It must be clear that individual nations take responsibility for their fiscal policy (15). One may argue, that financing the stimulus is in the interest of the European Union and that Germany would benefit from the returns in the long run. This may be true. But logically, if spending from the European budget affects all European citizens, it should be paid by a European tax, which could then be used to cover the debt service for European Union Bonds. Financial markets would then asses these bonds on their own merit. Such a solution requires profound constitutional changes and could not be envisaged without addressing the issue of democracy («No taxation without representation»). The efficiency of fiscal stimulus Fiscal policy has to find a difficult balance between stimulating demand, and keeping public debt sustainable and continuing the path of fiscal consolidation. The passing of the stimulus packages has not been easy. In the United States, Republican politicians have criticised the built up of additional debt and the expansion of public sectors. In Germany the discourse is about tax burden for future generations. Other critiques doubt that public spending is actually efficient in stimulating economic growth in the present context. But the tax burden argument is largely mistaken. If governments borrow to spend, they issue securities, which are bought and held by savers, because this is how they wish to keep their wealth. These bond owners are either wealthy individuals, or institutional investors, mainly pension funds or banks. Hence for any euro of debt liability issued, there is also the counterpart of a wealth owner who holds the new security; the two balance out. In aggregate, government bonds are neither net wealth, nor a burden on future generations. While it is true that debt service of government bonds will be funded out of taxes, this does not create intergenerational disequilibria, because some future tax payers are also receivers of this debt payment. However, it is true that in many societies government bonds are held by wealthier individuals so that the tax is a transfer from low income tax paying groups to richer financial investors. Concerns of justice regarding the tax burden should therefore not be addressed in terms of intergenerational justice, but rather in terms of the distribution of costs and benefits of public spending. If a large part of the government spending benefits (15) http://www.moneyweek.com/news-and-charts/economics/can-quantitative-easing-help-rescue-the-eurozone-14662.aspx

36
lower income groups in the society, government spending fulfils criteria of fairness. With respect to the efficiency of public spending, some researchers have recently attempted to look at the quality of public finances and their impact on economic growth (see Afonso, et alt. 2005). There is now increasing evidence that public spending on investment increases the economic growth rate, while this is less obvious for government consumption. We sought to assess the usefulness for the Euro Area of the government stimulus packages. In order to assess their impact on economic growth in Europe, we have used a panel regression of the main Member States of the Euro Area looking at major factors contributing to economic growth (16). The dependent variable in our model is the per capita growth rate of GDP at constant prices relative to population in labouring-age (i.e. labour force plus inactive people of age between 15 and 64 years). As exogenous variables we have included time series for the growth of labour productivity and a deterministic time trend as a proxy for technological factors. Public finances are split into current expenditure net of interest payment and into public investment, both expressed in relation to potential GDP. We have also tested the ratio of public investment to public consumption as a proxy for the composition of public spending. Fiscal burden is measured by the ratio of total tax income to potential GDP. As endogenous variables we included the difference between long term real interest rates and GDP growth per capita, the dollar-euro exchange rate to measure the external competitiveness of the euro-area (both as growth rates and in levels), and private sector investment relative to potential GDP. The difference between the long run real interest rate and the economic growth rate (GDP p.c.) is a proxy for monetary policy. According to economic theory (the so-called Ramsey Rule), this difference should be zero if the policy stance is neutral, positive when it is restrictive and negative when it is accommodating. All data are expressed in logarithmic form with the exception of interest rates. We used data from the European Commission Ameco database as far as they were available. We have found complete data for Austria, Belgium, Finland, France, Germany, Italy, Netherlands and Portugal from 1980 to 2007 and for Greece and Ireland from 1988 to 2007. We have estimated all equations either with the ordinary least square methodology or with cross-section SUR, which eliminates heteroskedasticity and multicollinearity in the error terms. We also used the fixed coefficient model which shows the country-specific effects in the constant intercept. The results of the estimates are shown in table 5. Our first set of estimations measures the short term impact of a variation of the independent variables on growth of GDP. Equation 1 shows that all variables are strongly significant, except fiscal burden, which has a positive coefficient but is barely significant. The most important variables influencing economic growth are productivity, with an elasticity of nearly 50 percent, and private investment with a coefficient of 15 percent. Monetary policy affects growth with an elasticity of 10 percent in the short run. The euro relative to the dollar has the right sign (an appreciation slows down growth), but it is significant only if considered in levels, with a coefficient around 2 percent. In this context, a change in the composition of public spending in favour of public investment has a clearly positive impact on economic growth. The panel SUR method confirms the parameters signs and increases the statistical
(16) We have followed and built on the methodology and build of Savona and Viviani 2003.

37
significance of the estimated regression, in particular of tax burden and trend. We also tested the lagged values of tax burden in the equation, but the coefficients were not significant. The estimated sign of tax burden is counter-intuitive. It may result from the procyclicality of tax revenue or it may indicate that output grows because agents seek to increase their net income. In either case, it throws doubts on the popular claim that tax cuts stimulate the economy. In equation 2 we have introduced the two elements of public spending separately. Public investment has a clearly positive effect on economic growth with an elasticity of approximately 2.5 percent. However current expenditure has a negative coefficient, although it is only significant with a lag (lags between one and three years are strongly significant). This is consistent with the results obtained by Savona and Viviani (2003), who also found that public current expenditure is neutral with respect to economic growth in the same year, but lowers growth in the longer run. In our equation 2, the tax burden and the time trend are not significant. If we eliminate the growth of productivity from the equation - the most significant, but exogenous variable - to check for robustness, we find in equation 3 that the signs and significance of coefficients do not change and there are little variations in their absolute values. In equation 4 and 5 we have excluded Greece and Ireland, and extended the panel for the remaining eight countries until 1980. In these estimates it was necessary to use short term interest rates rather than long term rates, because Portugal does not have time series for long term interest rates before 1985. Our previous estimates are confirmed, provided we use nominal rather than real interest rates; presumably this reflects earlier inconsistencies in price deflators. Again the signs and significance of coefficients do not change, and their values are similar to our earlier estimates. In these estimates we have used annual changes in the variables. They imply that increasing public investment (relative to potential GDP) raises the economic growth rate, while public consumption is rather neutral or negative and tax cuts tend to have the opposite effect. In order to better identify the relationship between short and long term effects we have estimated a form of error correction model in equation 6 and 7. Here the growth rate of GDP is related not only to the growth rate of the independent variables but also to lagged levels. These estimates show a long term relationship with almost unitary coefficient between per-capita income, and labour productivity and the growth-adjusted interest rate. There are also significant long term relationships between the dependent variable and the exchange rate and private investment, although with lower coefficients. If we regress the ratio of public investment to current expenditure on the dependent variable, only the short term coefficient is significant, and its sign is positive. Short run changes in productivity, monetary policy and private investment as well as the exchange rates are also significant. When we regress public investment and current expenditure separately on the dependent variable, the former is significantly positive in the short run; the latter, on the contrary, is significantly negative, but only in the long run. Hence, we find that fiscal policy matters only in the short run, but not for long term growth. We conclude that government stimulation packages with a strong public investment component will help to re-ignite economic growth, although in the long run economic growth

38
seems to be independent of the composition of public finances and spending, even if negatively affected by current expenditure. Given the dominant policy discourse and the emphasis on tax cuts, we also checked for the role of tax burden in the set of the independent variables, but the results are neither robust or conclusive: in equation 6, tax burden is significant only in the long period and its coefficient is negative; in equation 7 the same variable is significant only in the short period and its coefficient is positive. Because these results are so contradictory, it seems difficult to prove any specific influence from tax burden on growth. Finally, we also re-ran all previous specifications using GDP growth rates as dependent variable, instead of the growth of GDP relative to population; we also used ratios to current GDP instead of ratios to potential GDP: in all cases, the previous results are confirmed. DESCRIPTION OF VARIABLES Table 5
Total population (National accounts) (NPTD) POP
Population: 15 to 64 years (NPAN) POPL
Employment, persons: total economy (National accounts) (NETN) OCC
Gross fixed capital formation at current prices: private sector (UIGP) - ECU/EUR IFLPN
Gross domestic product at current market prices (UVGD) - ECU/EUR PIL
Price deflator gross domestic product at market prices (PVGD) - ECU/EUR DPIL
Gross domestic product at 2000 market prices (OVGD) - ECU/EUR PILK
Nominal long-term interest rates (ILN) RNL
Nominal short-term interest rates (ISN) RNB
Total revenue: general government :- ESA 1995 (URTG) TAX
Total current expenditure: general government :- ESA 1995 (UUCG) UC
Interest : general government :- ESA 1995 (UYIG) IP
Gross fixed capital formation: general government :- ESA 1995 (UIGG0) IFLPU2
ECU-EUR exchange rates :- Units of national currency per EUR/ECU (XNE) CAM_USA
Potential GDP, at 2000 market prices PILP
Trend @TREND
Labour productivity: PRODL=PILK/OCC PRODL
Real long-term interest rates: RNL_R=RNL-D(LOG(DPIL)) RNL_R
Real short-term interest rates: RNB_R=RNB-D(LOG(DPIL)) RNB_R
Ratios to potential GDP: var_PP=var/(PILP*DPIL) var_PP

39
Table 5a
Dependent: D(LOG(PILK/POPL)Sample period (adjusted): 1988-2007 1989-2007 1988-2007 1990-2007 1988-2007 1990-2007Method: Least Squares Cross-section SUR Least Squares Cross-section SUR Least Squares Cross-section SURPool observations: 199 (unbalanced) 190 (balanced) 198 (unbalanced) 180 (balanced) 198 (unbalanced) 180 (balanced)
Indipendent variables Coefficient Prob. Coefficient Prob. Coefficient Prob. Coefficient Prob. Coefficient Prob. Coefficient Prob.
C 0.0451 0.0000 0.0473 0.0000 0.0321 0.0000 0.0374 0.0000 0.0638 0.0000 0.0549 0.0000RNL_R/100-D(LOG(PILK)) -0.0958 0.0000 -0.0872 0.0000 -0.0786 0.0000 -0.0691 0.0000 -0.1154 0.0000 -0.1143 0.0000D(LOG(IFLPU2/(UC?-IP))) 0.0297 0.0000 0.0283 0.0000D(LOG(IFLPU2_PP)) 0.0247 0.0005 0.0255 0.0000 0.0281 0.0016 0.0299 0.0000D(LOG(UC_PP(-1)-IP_PP(-1))) -0.1190 0.0000 -0.0929 0.0000 -0.0787 0.0196 -0.0486 0.0097D(LOG(IFLPN_PP)) 0.1462 0.0000 0.1457 0.0000 0.1440 0.0000 0.1493 0.0000 0.1726 0.0000 0.1627 0.0000CAM_USA -0.0173 0.0007 -0.0207 0.0000 -0.0150 0.0019 -0.0195 0.0000 -0.0124 0.0393 -0.0105 0.0347D(LOG(PRODL)) 0.4771 0.0000 0.4687 0.0000 0.5515 0.0000 0.5242 0.0000D(LOG(TAX_PP)) 0.0427 0.0801 0.0616 0.0000@TREND -0.0002 0.0492 -0.0002 0.0088 -0.0007 0.0000 -0.0005 0.0011
UnweightedR2 0.84 0.83 0.85 0.84 0.76 0.75D.W. 1.33 1.25 1.42 1.36 1.53 1.57
WeightedR2 0.96 0.94 0.91D.W. 1.81 1.91 1.90
EQUATION 1 EQUATION 2 EQUATION 3
Table 5b
Dependent: D(LOG(PILK/POPL)Sample period (adjusted): 1980-2007 1982-2007 1980-2007 1982-2007Method: Least Squares Cross-section SUR Least Squares Cross-section SURPool observations: 220 (unbalanced) 208 (balanced) 220 (unbalanced) 208 (balanced)
Variable Coefficient Prob. Coefficient Prob. Coefficient Prob. Coefficient Prob.
C 0,0260 0,0000 0,0297 0,0000 0,0134 0,0000 0,0131 0,0000RNL_R/100-D(LOG(PILK))RNB/100-D(LOG(PILK)) -0,0790 0,0000 -0,0872 0,0000 -0,0387 0,0137 -0,0516 0,0000D(LOG(IFLPU2/(UC-IP)))D(LOG(IFLPU2_PP)) 0,0348 0,0000 0,0258 0,0000 0,0348 0,0000 0,0265 0,0000D(LOG(UC_PP(-1)-IP_PP(-1))) -0,0941 0,0008 -0,0851 0,0000 -0,1040 0,0003 -0,0865 0,0001D(LOG(IFLPN_PP)) 0,1564 0,0000 0,1360 0,0000 0,1718 0,0000 0,1421 0,0000CAM_USA -0,0083 0,0253 -0,0119 0,0028D(LOG(PRODL)) 0,3889 0,0000 0,4389 0,0000 0,4060 0,0000 0,4638 0,0000D(LOG(TAX_PP)) 0,0662 0,0131 0,0797 0,0000@TREND
UnweightedR2 0,78 0,77 0,75 0,76D.W. 1,02 0,92 0,98 0,91
WeightedR2 0,85 0,82D.W. 1,43 1,33
EQUATION 4 EQUATION 5

40
Table 5c
Dependent: D(LOG(PILK/POPL)Sample period (adjusted): 1988-2007 1989-2007 1988-2007 1988-2007Method: Least Squares Cross-section SUR Least Squares Cross-section SURPool observations: 199 (unbalanced) 190 (balanced) 199 (unbalanced) 190 (balanced)
Variable Coefficient Prob. Coefficient Prob. Coefficient Prob. Coefficient Prob.
C -0,5236 0,0000 -0,6208 0,0000 -0,5505 0,0000 -0,6521 0,0000LOG(PILK(-1)/POPL(-1)) -0,0921 0,0000 -0,1092 0,0000 -0,1289 0,0000 -0,1509 0,0000LOG(PRODL(-1)) 0,1070 0,0000 0,1296 0,0000 0,1546 0,0000 0,1922 0,0000D(LOG(PRODL)) 0,5396 0,0000 0,5559 0,0000 0,5459 0,0000 0,5799 0,0000(RNL_R(-1)/100-D(LOG(PILK(-1)))) -0,0945 0,0000 -0,0915 0,0000 -0,1055 0,0000 -0,0925 0,0000D(RNL_R/100-D(LOG(PILK))) -0,0700 0,0002 -0,0534 0,0000 -0,0758 0,0000 -0,0528 0,0000D(LOG(IFLPU2/(UC-IP))) 0,0290 0,0000 0,0288 0,0000D(LOG(IFLPU2_PP)) 0,0175 0,0094 0,0216 0,0000LOG((UC_PP(-1)-IP_PP(-1))) -0,0466 0,0000 -0,0571 0,0000LOG((IFLPN_PP(-1))) 0,0227 0,0006 0,0242 0,0000 0,0196 0,0015 0,0219 0,0000D(LOG((IFLPN_PP))) 0,1481 0,0000 0,1448 0,0000 0,1383 0,0000 0,1360 0,0000CAM_USA(-1) -0,0132 0,0130 -0,0150 0,0001 -0,0098 0,0265 -0,0118 0,0002D(CAM_USA) -0,0127 0,0515 -0,0137 0,0030
UnweightedR2 0,86 0,86 0,88 0,88D.W. 1,32 1,23 1,36 1,26
WeightedR2 0,94 0,96D.W. 1,73 1,72
EQUATION 6 EQUATION 7
These results are not good news. Reducing the overall tax burden does nothing to stimulate the economy. Increasing current government expenditure reduces growth. The only really powerful leverage is public investment. What impact did the stimulus packages have, which were decided by governments since last autumn? The answer is difficult because of the lack of transparency and double accounting in the announced packages. We have used the detailed analysis by Saha and v. Weitzsäcker (2009). In general, the data are incomplete and sometimes difficult to classify between investment, current spending and tax reductions. They are also characterized by excessive window dressing. For example the Italian government has declared its stimulus is worth € 80 bn, but most of it is re-cycling of previous unspent budget items. In fact, Saha and v. Weitzsäcker (2009) find that Italy is in reality moderately consolidating its finance. The German government has presented a € 50 billion package over 2 years with a mix of tax reduction, current spending and investment. The French stimulus looks less important in absolute terms, but is larger in terms of GDP. Given these uncertainties, we have sought to simulate the impact by making a few simple assumptions. We have eliminated the tax reduction part of the programs, given its uncertain impact on the growth rate. We have identified the investment component from Saha and v. Weitzsäcker (2009), and considered the difference between total spending and investment plus tax reductions as current spending. Given that the starting levels of the public investment and consumption quota are different between Member States (table 6, column 1) the percentage rates of increase are different (column 2). Multiplied with the estimated coefficient from equation 2 in table 5 we get the contribution of each stimulus package to the aggregate growth rate. We find that the overall impact is little more than ½ a percent of GDP. The French stimulus has the largest impact of all Member States because of its strong investment component and the relative weight of its economy. By contrast the German program is highly disappointing, due to its high current

41
spending orientation and low public investment. The Italian program has even a negative impact because it spends little on investment. Hence, a better coordination between the three largest three Euro member states could produce significantly better results for stimulating the European economy and returning to economic growth. III. The Crisis in the New Member States The new Member States in Central and Eastern Europe have sought to achieve rapid catch up growth by fully integrating into the European Union and attracting capital inflows. These flows were facilitated by structural funds from the European Union, but also by aggressive lending and investment strategies by major European banks, particularly in Austria, Italy and Germany. As a consequence, Eastern European development repeated some of the classical policies mistakes that were already observed during the financial crisis in East Asia in the 1990s: instead of borrowing in local currencies, local firms (and governments) built up significant stocks of foreign debt denominated in foreign currency. They built up a currency mismatch that made them vulnerable to sudden changes in capital flows. These foreign borrowing policies were supported by the fact that exchange rates were fixed or even appreciated against the euro. Figure 18 shows the bilateral exchange rates of non- currencies against the euro. An increase in the price of the euro reflects a depreciation of the GROWTH CONTRIBUTION OF STIMULUS PACKAGES Table 6
1 2 3 4Values in 2007 Impulse (1) Impulse (2) Response GDP Share(in % of GDP) (in % of GDP) (% rate of increase) (increase of GDP in %) in bn €
Current Current Current Current (2007)Public public Public public Public public Public public
investment spending investment spending Total investment spending investment spending Total
AUS 1.0% 43.2% 0.06% 0.15% 0.2% 6.1% 0.4% 0.16% -0.03% 0.12% 270.8 3.5%
BEL 1.6% 42.2% 0.04% 0.85% 0.9% 2.5% 2.0% 0.06% -0.19% -0.12% 334.9 4.3%
FIN 2.6% 43.7% 179.7 2.3%
FRA 3.3% 46.0% 2.74% 0.29% 3.0% 83.0% 0.6% 2.12% -0.06% 2.06% 1892.2 24.3%
GER 1.5% 38.9% 0.63% 2.88% 3.5% 42.6% 7.4% 1.09% -0.69% 0.40% 2422.9 31.1%
GRE 3.0% 36.5% 228.2 2.9%
IRL 4.2% 29.9% 0.00% 0.00% 0.0% 0.0% 0.0% 0.00% 0.00% 0.00% 190.6 2.4%
ITA 2.4% 39.3% 0.00% 0.22% 0.2% 0.2% 0.6% 0.00% -0.05% -0.05% 1535.5 19.7%
OLA 3.4% 40.0% 0.00% 0.02% 0.0% 0.0% 0.0% 0.00% 0.00% 0.00% 567.1 7.3%
POR 2.3% 39.4% 163.1 2.1%
Average EU10 2.4% 40.9% 0.87% 1.05% 1.9% 33.8% 2.7% 0.86% -0.25% 0.61% 7785.1 100.0%
Coeff. SUR 0.02550 -0.09290
national currency, and inversely a fall on appreciation. We find that the UK, Sweden and Denmark maintained fairly stable exchange rates in the middle period of the last decade, but with the exception of Denmark, these currencies depreciated dramatically when they were hit by the crisis. The three Baltic States and Bulgaria have pegged against the euro with a currency board, and they have maintained the stability of the exchange rate. This makes them highly vulnerable to shocks coming from exports because with currency boards a reduction in

42
NOMINAL EXCHANGE RATES AGAINST EURO Figure 18
0.5
0.6
0.7
0.8
0.9
1.0
99 00 01 02 03 04 05 06 07 08
UK
8
9
10
11
12
99 00 01 02 03 04 05 06 07 08
SE
7.40
7.42
7.44
7.46
7.48
99 00 01 02 03 04 05 06 07 08
DK
1.90
1.92
1.94
1.96
1.98
2.00
99 00 01 02 03 04 05 06 07 08
BG
20
24
28
32
36
40
99 00 01 02 03 04 05 06 07 08
CZ
15.5
15.6
15.7
15.8
15.9
99 00 01 02 03 04 05 06 07 08
EE
3.2
3.4
3.6
3.8
4.0
4.2
4.4
99 00 01 02 03 04 05 06 07 08
LT
.52
.56
.60
.64
.68
.72
99 00 01 02 03 04 05 06 07 08
LV
220
240
260
280
300
320
99 00 01 02 03 04 05 06 07 08
HU
3.0
3.5
4.0
4.5
5.0
99 00 01 02 03 04 05 06 07 08
PL
1
2
3
4
5
99 00 01 02 03 04 05 06 07 08
RO
0.8
1.0
1.2
1.4
1.6
99 00 01 02 03 04 05 06 07 08
US
80
100
120
140
160
180
99 00 01 02 03 04 05 06 07 08
JP
foreign exchange earnings causes a reduction in money supply and aggregate income. The Czech Republic, Poland and Romania saw their currencies appreciate over the last 4-5 years, although Hungary in recent years although with greater volatility, and the collapse of the exchange rate was even greater once the economic environment changed. Interestingly, while the US and Japan had their currencies depreciated against the euro since 2001, they suddenly appreciated when the crisis in financial markets broke out. One explanation for this weakness of the euro may be related to the latent reserve currency function of the euro: when liquidity dried up in the USA, American banks and corporations started to repatriate and convert some of their euro reserve assets. The nominal exchange rate policies translated into real appreciations for all new Member States (figure 19). When exchange rates were fixed, like in the Baltic States, capital inflows seemed to guarantee financial stability, even if the ensuing real appreciation eroded earlier competitive advantage. However, whether fixed or flexible, exchange risk considerations were forgotten and local borrowers preferred to borrow in low-interest foreign currencies, mainly euros and in the case of Hungarian mortgages even Swiss francs, rather than in local high interest currencies. Like in Asia in the 1990s, a substantial currency mismatch between domestic income and asset valuations and foreign currency liabilities has been built up in Central and Eastern Europe. Only in Slovenia and Slovakia was this risk eliminated by joining the euro, just in time before the crisis. The other countries are now paying the price for not having used their time and implement convergence policies.

43
REAL EFFECTIVE EXCHANGE RATES Figure 19
80
90
100
110
120
130
94 96 98 00 02 04 06 08
EA12
70
80
90
100
110
94 96 98 00 02 04 06 08
UK
80
90
100
110
120
94 96 98 00 02 04 06 08
SE
96
100
104
108
112
116
94 96 98 00 02 04 06 08
DK
40
60
80
100
120
140
94 96 98 00 02 04 06 08
EE
40
60
80
100
120
140
94 96 98 00 02 04 06 08
LT
60
80
100
120
140
94 96 98 00 02 04 06 08
LV
40
60
80
100
120
140
160
94 96 98 00 02 04 06 08
BG
60
80
100
120
140
160
180
94 96 98 00 02 04 06 08
RO
60
80
100
120
140
160
180
94 96 98 00 02 04 06 08
CZ
80
100
120
140
160
94 96 98 00 02 04 06 08
HU
60
80
100
120
140
94 96 98 00 02 04 06 08
PO
80
85
90
95
100
105
110
94 96 98 00 02 04 06 08
US
60
70
80
90
100
110
120
94 96 98 00 02 04 06 08
JP
The Eastern European growth strategies based on capital inflows are unsustainable. The boom was ready to collapse when the world economy was hit by the crisis: with the disappearance of export markets, exchange rates tumbled and the debt service of euro-denominated debt increased by 30-40 percent or more. In the new Member States, private companies are pushed into liquidation and unemployment is rising. In the old Member States, banks are sitting on non-performing loans that were extended to these countries. The crisis in the East is returning to the West with a vengeance: it risks now destabilizing the European financial system. Three countries, Hungary, Latvia and Romania have already asked for EU credit to resolve current account difficulties. The governments in Latvia, Hungary and Czech Republic have collapsed. The default of major borrowers in Central and Eastern Europe (CEEU), could devastate the balance sheets of Western banks, which have taken important positions in these countries. In an environment, where write-offs from capital losses have already weakened their balance sheets, an additional shock could wipe out bank’s capital funds and push them into insolvency. This risk is particularly high for some of the most important European banks. To understand the risks, a starting point is to compare the total assets of the major banks of some European countries relative to GDP (17) Because financial supervision is still in the
(17) We selected 33 banks, considering the three institutions in each country with a significant weight in the Bloomberg 500 index at the beginning of February 2009 (data are from the latest balance sheet

44
jurisdictional framework of Member States, we took national and not Euro Area GDP as reference. Results are reported in table 7. In the major Euro Area countries, the assets of the largest «national» bank are close to the size of GDP: in particular banks in France, Spain and Germany are in top positions. In some smaller Mediterranean economies the ratio is lower for the single largest bank, but the sum of the three biggest banks also reaches the size of GDP. In non Euro Area countries, the financial vulnerability is even larger, because of the combination of relatively small economies and large financial centres: apart from Switzerland (which in fact hosts international banks), the British data exceed more than three times GDP. This dimension of banks’ asset sheets shows the fragility of the banking system in a recession context characterized by the diffusion of «toxic» assets. In line with traditional capital ratios, share capital of these banks amounts to approximately 5 percent of GDP. The insolvency of any major bank in any member state would cause huge rescue costs. The problem is aggravated by the maturity mismatch between long term assets and short term liabilities. Table 8 gives an indication for the liabilities of some selected banks (18). In France and Germany, as in the UK and Switzerland, major banks are to a large extend financed by short term non-deposit liabilities. In the smaller Southern European countries, the role of deposits is more important. This means that trust is paramount to keep the system stable. The system has now been stabilized by broad-ranged deposit insurances. But long term debt is relatively low for many European banks. On the Euro Area average, there is an equal amount of long and short term market borrowing, while deposits cover nearly half of the total liabilities. These relatively heterogeneous features suggest that it is important to find an indicator for the degree of interconnection in the European banking network in order to evaluate the potential risk of a «domino effect». The geographic distribution of the bank assets is one indicator. Table 9 reports the average asset composition of 28 selected banks (19). On average, foreign assets - especially those invested in other European countries - represent a substantial part of the total, although there is a high variation within the considered sample. This proportion increases to more than 50 percent for non-Euro Area banks. Thus, the overall picture is one whereby Europe’s financial system is highly interdependent and at the same time highly concentrated on a few major players in each member state. This system is not robust. If a major shock hit one of the leading banks in a Euro Area Member State, it could tear down banks in many other countries. A significant danger exists for such a shock to occur as a consequence of the economic crisis in Central and Eastern Europe. Table 10 shows the share of assets invested by European banks in Central and Eastern European Member States and banks’ net income and capital .
available). These are the banks chosen: Deutsche Bank, Commerzbank, Landesbank BNP-Paribas, Credit Agricole, Societe Generale, Banco Santander, Bbva, Banco pop.espan., Intesa San Paolo, Unicredit, Monte Paschi Siena, Pohjola Bank, Erste, Raiffeisen, National Bank Greece, Efg Ergasias, Alpha Bank, Banco Commercial Portugues, Banco Espirito Santo, Banco Bpi, Allied Irish banks, Nordea, Svesta, Skandinaviska, Dnb Nor, Danske, Hsbc, Royal bank of Scotland, Barclays, Ubs, Credit Suisse, Julius Baer. (18) Balance sheet data can register significant shift from one quarter to another. (19) Information is not available for Commerzbank, Landesbank Berlin, Banco Santander, Pohjola Bank and Erste.
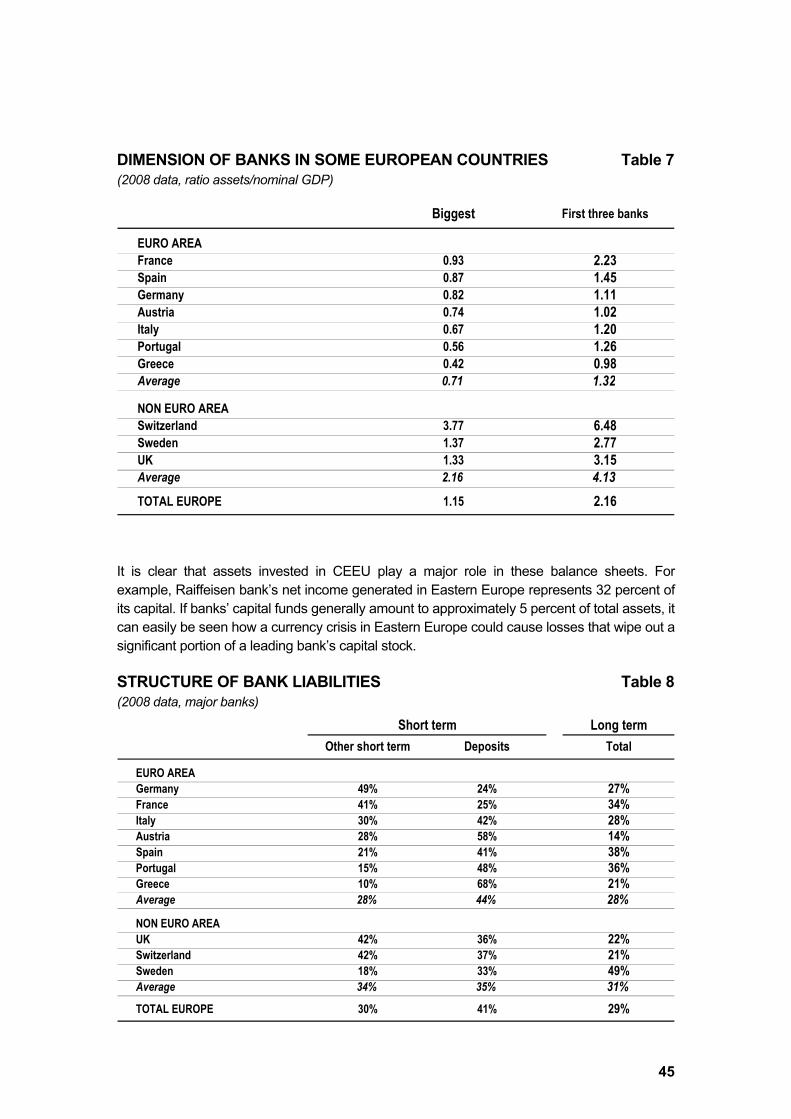
45
DIMENSION OF BANKS IN SOME EUROPEAN COUNTRIES Table 7 (2008 data, ratio assets/nominal GDP)
Biggest First three banks
EURO AREAFrance 0.93 2.23Spain 0.87 1.45Germany 0.82 1.11Austria 0.74 1.02Italy 0.67 1.20Portugal 0.56 1.26Greece 0.42 0.98Average 0.71 1.32
NON EURO AREASwitzerland 3.77 6.48Sweden 1.37 2.77UK 1.33 3.15Average 2.16 4.13TOTAL EUROPE 1.15 2.16
It is clear that assets invested in CEEU play a major role in these balance sheets. For example, Raiffeisen bank’s net income generated in Eastern Europe represents 32 percent of its capital. If banks’ capital funds generally amount to approximately 5 percent of total assets, it can easily be seen how a currency crisis in Eastern Europe could cause losses that wipe out a significant portion of a leading bank’s capital stock. STRUCTURE OF BANK LIABILITIES Table 8 (2008 data, major banks)
Short term Long termOther short term Deposits Total
EURO AREAGermany 49% 24% 27%France 41% 25% 34%Italy 30% 42% 28%Austria 28% 58% 14%Spain 21% 41% 38%Portugal 15% 48% 36%Greece 10% 68% 21%Average 28% 44% 28%
NON EURO AREAUK 42% 36% 22%Switzerland 42% 37% 21%Sweden 18% 33% 49%Average 34% 35% 31%TOTAL EUROPE 30% 41% 29%

46
EUROPEAN BANK ASSETS: GEOGRAFIC PANORAMA Table 9 (percentage)
Asset locationNational Other Europe Rest of world
NOT WEIGHTEDEuro Area banks 68.2 22.1 9.7Non Euro Area banks 44.9 31.2 23.9All Europe 59.1 25.7 15.3
memo: standard dev 24.4 16.5 18.0
NOT WEIGHTEDEuro Area banks 55.2 27.0 17.8Non Euro Area banks 35.8 28.7 35.6All Europe 45.0 27.9 27.1
SELECTED EUROPEAN BANKS: Table 10 PRESENCE IN OTHER EAST EUROPEAN COUNTRIES
% of total % of total net Net income Own capitalNationality assets income (mln of euros) (mln of euros)
Raiffeisen AUT 59.2 64.3 3752 7587Erste AUT na 52.9 6115 11095Efg Ergasias GRE 15.3 na na 5058Unicredit ITA 10.9 23.1 26296 60152Banco Comercial Portugues POR 9.6 na na 6248Allied Irish Banks IRE 6.8 16.2 49 10950Skandinaviska SWE 5.7 7.2 12415 7639Dnb Nor NOR 4.2 7.9 3942 8400
Source: Bloomberg Reforming EU banking supervision Given the high risk of financial weakness in some Central and Eastern European countries, some lessons should be drawn from previous bank failures, particularly Iceland, which is a member of the European Economic Area and has, therefore, benefitted from a similar regulatory framework as non Euro member states of the Union. 1. The European banking system should be subject to European-wide financial supervision. Experience has shown that the existing so-called Lamfalussy Process of involving different parties at different levels with national supervisory authorities cooperating in committees has not been efficient. Two reports (De Larosière, 2009 and Turner, 2009) have recently started to clarify the issues involved with financial supervision in the EU. The problem is that single market rules allow banks in one country to operate as branches in another, with the supervision of solvency and of whole bank liquidity subject to the home country supervisor. As a consequence, a national host country supervisor has only limited powers regarding the supervision of local liquidity. The two reports have drawn similar conclusions: significant regulatory inconsistencies exist in the European single financial market, while an efficient market should have a harmonized set of core rules. Such rules concern, among others, reporting obligations, capital definitions evaluation of risk assessments, bank deposit insurance, insurance companies’ technical provisions. A new independent EU Supervisory

47
Authority should be set up, alongside the ECB, invested with regulatory powers and the intention of reinforcing host country supervisory powers over liquidity. We believe that a strong role for the European System of Central Banks is necessary, given that euro-liquidity is at the core of the system. 2. The European Union, must be prepared to give liquidity support to non-Member States, and possibly beyond. The IMF estimates that «the financing gap» – money needed from international financial institutions, the EU and governments – will be $123bn this year and $63bn next, or $186bn in total (20). Financial support should be channeled through the European Union and multilateral institutions, such as IMF and EBRD. For example the EBRD's 2009 Business Plan and Budget allows for an increase of about 20 per cent in the Bank’s annual business volume in 2009 to approximately €7 billion. Half of the €1 billion in extra spending is earmarked for Central and Eastern Europe. The Bank will support the banking sectors and ensure that financing flows continue, in particular to small and medium sized enterprises. 3. Several observers have suggested that vulnerable non-euro member States should rapidly join the. The IMF has now also backed this idea (FT 06.04.2009). It is not always clear, whether these observers recommend unilateral euroisation, i.e. adopting the euro as the local currency without being part of the institutional framework of the Euro Area (Bratkowski and Rostowski, 2001), or rapidly joining the European monetary union. In the first case, euroized member states would lose the ability to respond to a sudden run on bank deposits by acting as a lender of last resort. This is not helpful in the present context. In the second case, local banks would gain full access to the liquidity provided by the European Central Bank without any exchange risk or foreign exchange constraints. Although early membership is a valid argument from a technical point of view, we do not agree with the recommendation of waving the convergence criteria in order to accelerate membership in the . Membership must be seen in the broader context of macroeconomic developments of future Member States. The development within the European monetary union since 1999 has shown that Member States, which do not fully adapt national price and wage setting procedures to the requirements of the overall monetary strategy of the ECB, are contributing to tensions within the currency area. See Chapter 3 below. New euro-members from economically more heterogeneous economies; they have not changed their behavioural patterns in accordance with the requirements of monetary union and this could create tensions within the Euro Area, if they were members. This would complicate the conduct of monetary policy significantly. Meeting the Maastricht criteria For this reason the Maastricht Treaty has set up a number of minimum criteria which must to be met in order to join monetary union. They can be regrouped into two baskets: the first is related to fiscal policies, in order to ensure that future Member States of the monetary union are able to conform with the Excessive Deficit Procedure and the Stability and Growth Pact, which are the European framework for the conduct of fiscal policy within the single currency area. The second basket is about nominal criteria of monetary convergence. The most important criterion is, of course, price stability - defined here as the average inflation rate of the three lowest performing countries. In order to evaluate the sustainability of such inflation performance, an additional criterion is the convergence of long term interest rates, insofar as they are reflecting differences in inflation expectations. The Maastricht Treaty also stipulated
(20) Financial Times, 06.04.2009

48
adherence to the exchange rate mechanism II (ERM II) of the European monetary system for a period of two years. Finally, a third additional requirement, which has been used by Sweden to avoid joining the Euro, is the institutional compatibility of national central banks with the strong rules of central bank independence that apply in the euro system. Figure 20 shows the development of the fiscal criteria and their forecast over the next three years according to the European Commission AMECO database. The figure shows the debt-GDP ratio at the vertical axis and the deficit-GDP ratio at the horizontal axis. The Maastricht criteria stipulate that the countries joining the must have a deficit below 3 percent and a debt-GDP ratio that is below or moving to the 60 percent. We have used three observation points: 2005, 2008 and forecast by the Commission for 2010. Today there are precisely three Member States who meet these criteria: Denmark, Sweden and Bulgaria. The Czech Republic is moving in this direction. Poland fulfils the debt, but not the deficit criterion MAASTRICHT CRITERIA: Figure 20 PUBLIC FINANCES IN SELECTED EU MEMBERS (in the green area criteria are respected, bigger points are for 2010 forecast)
although the Polish budget position may be temporarily moving into the range. The three Baltic republics all have stayed within the range of the fiscal criteria although they are now rapidly moving out. This is also true for Romania, where the deterioration of fiscal position is even more accelerated. The UK used to have a highly favourable debt position, but, due to the crisis, its recent fiscal policy stance is deteriorating fast both in terms of debt and deficit positions. With respect to financial markets, the nominal convergence criteria show an even less convincing picture for most Central and Eastern European countries. Our chart is here handicapped by the facts that we have no estimates for future interest rates. We therefore applied the 2008 rates also for 2010. Only Sweden and Denmark fulfil the nominal criteria unambiguously. The Czech Republic and the UK are moving out of the qualifying range. All other Member States, possibly with the sole exception of Poland, are far removed from the required inflation target, and financial markets clearly indicate the lack of credibility of anti-inflation policies pursued by those Member States. Again the Baltic states and Romania are by far the worst candidates.

49
MAASTRICHT CRITERIA: Figure 21 INFLATION AND LT INTEREST RATES IN SELECTED EU MEMBERS (in the green area criteria are respected, bigger points are for 2010 forecast)
Since the on-set of the crisis, the Swedish krona has devalued by 30 percent. This risks setting an inflationary spiral in motion, and the Swedish government is rightly concerned by exchange rate volatility, which contributes to the general climate of instability. Given this analysis it is possible and desirable that the Scandinavian countries, Denmark and Sweden, join the euro as quickly as possible. The data also show that Central and Eastern European countries have not used their time to prepare themselves for joining the euro since they joined the European Union. The price for inaction is now high and there are increasing the risks of economic deterioration and financial instability as a consequence for the shocks coming from the world economy. However, in the interest of the stability and sustainability of the euro, it is not recommendable to make any concessions for softening the membership criteria. IV. The agenda for change Coordinating policy assignments To get the world economy out of the crisis and re-igniting economic growth in Europe, action is required at three levels: within Member States, at the European level, and cooperation at the world scale. Action required at home Economic policies in Europe are primarily designed and implemented by Member States. While this may be functionally justified (Member States spend the money), an integrated and coherent policy approach would yield better effects. But Member States cater for their local constituencies. When the French President wants to repatriate manufacturing locations of French car makers from the Czeck Republic, he does not think of the consequences for the single market or even for French consumers. When the German chancellor resists public spending on grounds of the ordo-liberal economic ideology that dominates Germany, she does not consider the externalities for the Euro Area economy or even the impact for German manufactures. Compare this to the USA, where the Obama administration is setting up an

50
integrated anti-crisis strategy for the entire continental economy. One may disagree with the program, but at least it is a program. Europe is incapable of designing a coherent plan that is more than empty words. If the German government resists an economic stimulus, if the French government seeks to protect some local firms against competition in the European single market, they inflict damage to all European citizens – including German or French. However, their behaviour is not irrational: they are elected in national constituencies and the essential bulk of their policies cover only national citizens. The single most important reform would be a transformation of the European economic governance. Policy action at the national level needs to be closely coordinated with the policies of other Member States in order to avoid negative externalities and encourage positive spillover effects. This has been the pro-European discourse for years, but it is less and less likely to be followed by actions as the number of member states increases (21). With respect to macroeconomic policy, a successful anti-crisis agenda requires more policy centralization at the European level. But policy makers have resisted acting in the interest of European citizens out of institutional self-interest or narrow identification with nationalism. An international coordinated stimulus would have significantly higher effects than a sequence of individual national stimulus programs. The wait-and-see position is not appropriate. The first priority must be the restructuration of the financial system in order to get banks and other financial institutions lending to businesses and households again. Without a stable financial infrastructure, no economic growth is possible and unemployment will remain high. The most important measure is cleaning up banks’ balance sheets. In the US, the government has focussed on borrowing or buying toxic assets from banks. Alternatively, banks should write down their non-performing assets and recapitalize to keep themselves solvent. These principles also apply to European banks. However, the regulations under which this is done must be set at the European level, given the high degree of financial integration. Member States should abstain from supporting purely national solutions. This is no longer the time to foster national champions. In fact national champions cost tax payers money that should be used to create efficient jobs with high productivity instead of distorting markets. We discuss a proposal below, how a European bank recapitalization could be structured by setting up a Good Europe Bank. Once financial stability has returned, economic policies to stimulate demand will become fully effective. Without a return to financial stability increasing government debt is not likely to have the spillover effects that are necessary to return to economic growth and job creation. After financial stabilisation is achieved, government expenditure for investment must be significantly increased. The public investment ratio has been falling consistently for over a decade or more, and in many Member States it has now reached levels of 2 percent of GDP or less. All Member States should commit to doubling this investment ratio, possibly at the expense of government consumption (current spending). Policy action at the European level At the level of the European Union there is no longer any time for complacency. European Member States’ governments must return to the spirit of cooperation which has been the founding mark of the European Union. This is no time for playing power games, affirming national interests at the detriment of European citizens and resisting the need for collective cooperative action. (21) For a thorough discussion of collective action problems due to the rising number of member states, see Collignon, 2003

51
The present crisis clearly proves that economic policies are now a common public good that affects all European citizens. National governments are ill-suited to manage these goods because they only represent partial interests and constituencies. Some studies estimate that 1/3 of all legislation in the EU originates at the European level. This means that the genuine European policies, which affect all Europeans, are constantly distorted by the political interests of national governments who have no legitimacy to speak and act for citizens who cannot vote for them. Increasing the efficiency of European policy making requires dealing with the issue of democratic legitimacy. The French government has frequently called for a «government économique», although it often looks as if France wanted to assume this role as pars pro toto. Such an idea is rightly rejected. But intergovernmentalism is also not adequate to govern Europe. National governments represent national interests. They cannot represent the common concerns that are shared by all European citizens. Except in a few cases, were all partial interests coincide with the general interest, national policy agents will seek to preserve the narrow advantages of their constituency (not of their country!) and thereby block policies that could further the welfare of all citizens. For example some Member States of the European Union seek more fiscal stimulus, others do not wish to increase public debt. In a «normal» democracy, a debate would take place and the decision would be taken by a vote in Parliament that more or less reflects public preferences. Note, however, that the emergence of public preferences is itself a result of the debates about possible policy choices. If the decision a particular government was wrong and did not work, voters could change government at the next opportunity. But in Europe, the benefits of concerted action are lost, because the ideology of non-intervention has captured national governments and European agencies and there is no mechanism, by which citizens are entitled to make a choice with respect to decisions that affect all of them. Policy inefficiencies are a direct consequence of the democratic deficit. Lack of action has been an important factor in the unfolding of the crisis. For years, there have been plenty of warnings about insufficient regulation and macroeconomic imbalances; but what is needed to prevent disaster from occurring is an agent that can take measures to remedy the situation. Under the previous neoliberal consensus, this was taboo and the institutional weakness was used to impose a radical market agenda on Europe, because citizens had no choice. Times have now changed. What Europe needs is a democratic government that manages the common public goods, which affect all citizens and therefore gives them a right to choose how they wish to see themselves governed. The role of the State is to defend common interest of citizens. However, in Europe the common interest has many dimensions: it concerns people in their Communes and Regions, it covers national identities, but there is also an European common interest that affects all European citizens in the same way. The common European interest is clearly more developed in the than outside. Governments are agents of citizens, who are elected to represent citizens’ interests at each of these different levels. However, at the European level no government exists. Therefore the common interests of European citizens are not represented in a democratic way. Citizens should have the choice over the European policies to be pursued, and not governments, who represent local and partial constituencies and are able to block the realization the common interest. Unless Europe affirms its will to act courageously in the common interest of all citizens there is a risk of financial meltdown due to coordination failure and insufficient institutions. The

52
Lisbon Treaty needs to be ratified quickly and rapidly and Member States who resist this should be marginalized. The price for blocking progress for Union citizens should be the refusal of community solidarity. The European Union and especially the Euro Area have to assume full responsibility for the consequences of rapid enlargement of the European Union in recent years. In practical terms this means that unless sufficient arrangements for avoiding financial contagion from potential defaults in East Central and Eastern Europe are made, there is a danger that the whole European house of cards will collapse. The EU should provide funds to prevent currency crises, but the lending should e subject to harsh conditionality with the objective to make policies and performances converting to joining the Euro Area. A strict adherence to the core convergence criteria is necessary to preserve the credibility of the fundamental norms on which European monetary union is built. Membership in the Euro Area can be an important stabilizing factor. Several of the new Member States have already joined the euro, as they have been committed to under the contractual agreements of the European Union. Countries who have not pulled their weight in pursuing convergence policies to the Maastricht criteria, must urgently implement the necessary policy reforms. In this context one should consider whether Maastricht criteria should not be complemented by a more thorough evaluation of unit labour cost and the competitive position of the joining Member States as it is stated in the Treaty. Experience from the past has shown that Member States entering the European Monetary Union with undervalued exchange rates will develop more rapidly than those who have overvalued unit labour cost levels. Action at the world level Europe has to cooperate also with the other important players in the world economy. First and foremost the European Union and in particular the should cooperate with the new American administration in order to stabilize financial markets and re-stimulate economic growth and world trade. Europe has a particular role to play, given that the euro financial markets are approximately equal to the dollar markets and both together cover approximately 80 percent of world financial market. Economic cooperation requires also to acknowledge the new role of Asia, in particular of China and India. The framework for such enlarged coordination is the G20. The 20 countries cover 2/3 of the world population and 90 percent of world GDP. However, with 20 members, the group is too large and we are witnessing already that policy making is bureaucratic and lacking decisiveness. Political leadership must come from a smaller axis of cooperation. The G7 or G8 has lost its steering capacity and should be abolished. It consists of an outdated composition of representatives from nations that dominated the 19th century but are largely marginal in the 21st. It seems absurd that the UK, France, Germany and Italy, which represent less than 1 percent of world population and 3 percent of world GDP should be sitting in the driving seat of the world economy. A G3 of the United Stated, the and Asia should become the leading triad steering the world economy and providing leadership in the G20. Talk about Bretton Woods is misleading as it will turn our minds to the past instead of the future. However it is important that the triad of America, Europe and Asia will tackle the issue of global imbalances. The crisis has shown that America alone can no longer be the consumer of last resort in the world economy. Europe would have to bear its share and both

53
Europe and United States should run moderate current account deficits which would allow Asia and other emerging economies in the world to run exports surpluses and stimulate economic development. Such policy requires some form of exchange rate coordination. The present world crisis was partially caused by the exclusive exchange rate peg of Asia to the dollar at highly competitive levels. Unless one wishes to destroy the Asian growth dynamic, one should not seek to eliminate this undervaluation. But Asian export orientation and exchange rate pegging should be more equally spread between Europe and the United States and Asia. While the American economy goes through its internal adjustment, it may require greater exchange rate flexibility. During this transition period, Europe should deepen its monetary and economic coordination and cooperation with Japan, China and Asia and provide alternative outlets for Asian exports. The current account surpluses would then be re-invested in the euro financial markets and this would also stimulate the EU-economy. It would increase the euro’s role as a second international reserve currency, but at the same time it should cooperate with China and Japan about creating a stable framework for exchange rate management and capital flows. This requires, of course, that Europe is able to define a clear long term vision of how Europe and Asia could enhance each other’s economic and political security. Unless this is done rapidly, Europe will miss out on the Asian century (Mahbubani, 2009). The world would soon be led by a Chinese-American Directoire. A greater role for emerging economies should also be reflected in the augmentation of IMF quotas and the funding that would allow the IMF to fulfil its role as an emergency lender, when Member States are in difficulty. The G20 meeting in London has confirmed previous financial pledges to the IMF, and agreed additional amount of Special Drawing Rights (SDR) valued at USD 250 billion. Other multilateral credit agencies like the Asian Development Bank also need to see their lending capacities augmented. The G20 agreed that these institutions should provide USD 100 billion of new lending. Macroeconomic finance is also important in order to stimulate world trade. Japan has offered a credit line to the IMF of USD 100 billion – a measure promptly called «the largest loan in the history of mankind» by Dominique Strauss-Kahn, IMF Managing Director. The European Union has subsequently followed suit by committing a similar amount (22). Stimulating economic activity We have so far outlined the general policy framework. We will now make some practical policy proposals to get Europe out of the crisis. The first priority is to stop the downward spiral in the real economy. For this purpose it is necessary to restore confidence into the financial system, but this can only happen if the bankruptcy of firms and the disappearance of jobs will not further undermine the confidence in the financial sphere. Europe must therefore focus on a double strategy of restoring demand for goods and services and stabilizing the financial system. The policy mix For this reason, macroeconomic stimulation of demand is the first priority. However short term measures must be made consistent with long term sustainability. Sustainable policies are understood as not requiring sudden policy changes. Only sustainable policies will have the confidence of economic agents which are necessary to stimulate the economy today.
(22) See Financial Times, 2.4.2009

54
Sustainable stimulation of economic activity requires the coordination of monetary, income and fiscal policies. With respect to European monetary policy, we are skeptical about monetary easing and consider that except for very short and exceptional periods, real short term interest rates should be positive. We do not believe that there is a looming danger of consumer price inflation created by the huge creation of central bank liquidity, because the fundamental parameters of globalization have not changed. However, unless the recent huge creation of liquidity is soon withdrawn, it is likely to re-ignite a new asset bubble. If that were to occur, central banks should pick the asset price bubble at an early stage. In other words, monetary policy must be symmetrical, avoiding excessive credit creation and credit contraction. Wage and income policy could be another, much ignored channel for stimulating economic consumption and activity. However, the most important policy reform in this respect is the reduction of the growing divergence of unit labour costs across the Euro Area. This requires reforms of wage bargaining institutions within the member states of the Euro Area (see Chapter 3), but also better transparency across borders (see CER Report on Europe 2008 and Collignon, 2009). Fiscal policy is the joint task of the European Union and the Member States. They need to cooperate in budgetary terms with the European Union. Given the econometric evidence, fiscal policy should focus on spending on public infrastructure and not on government consumption. Tax reduction could even have a negative growth effect. Private investment remains however the most important stimulus channel available. Because in Europe the ratio of public investment to GDP has fallen consistently for decades, there is now an opportunity to implement necessary infrastructure projects. The European budget should support pan-European infrastructural projects (such as transports, research, etc.). As long as the European budget is financed by national budgets, Finance ministers will always resist paying for others. The consequence is a systematic undersupply of public goods and the neglect of European citizens’ concerns. It is therefore time to introduce a European tax to finance the European budget. However such tax would require full democratic control by the Council and the European Parliament («No taxation without representation»). When, and only when, a European tax has been introduced, Euro-Bonds could be introduced to finance European public investments. The debt service will then be able to be covered by the European tax and no longer by national households. Cleaning up the financial system Stimulating the economy will not bear fruits, unless commercial banks’ balance sheets have been cleaned of worthless assets. This is therefore the second major priority for reform. Unfortunately, national governments have failed to take the necessary measures and the European Commission has failed to safeguard the common interest of European citizens. The next European Parliament should push Commission and Council to move in the right direction. The stabilization of the financial system also requires a European solution. Confining financial supervision to national authorities is no longer appropriate in an economy with large border-transcending debt among private banks. The ECB must be more closely involved in financial supervision. Such supervisory extension of competences could be modeled on European competition policy, where the European Commission has responsibilities for European-wide operating companies, while national antitrust authorities remain focused on local markets (Principle of subsidiarity).

55
The present financial crisis has been used as an opportunity to build national banking monopolies to the detriment of banking clients and consumers. Nationalizing banks often has a protectionist character. Such measures do not reduce economic uncertainty or support the common interest of European citizens. Deposit insurance should be unified, Financial Supervision delegated to a European Authority. Governments have jumped on the opportunity to close loopholes in tax evasion at the G20 meeting. Although this may be justified from a fairness point of view, and may bring some extra income into the treasury, this is not a measure that will create jobs or prevent future financial crises. A Good Europe Bank Instead of nationalizing banks it would be more useful to Europeanize the stabilization of the banking system. We propose that this could be done through creating a Good Europe Bank. Previous proposals for the creation of a Bad Bank have focused on the assets side of bank balance sheets. A Bad Bank should acquire toxic assets to re-establish trust between banks. However, likelihood is that such Bad Bank will end up with a large amount of non-performing assets, which will have to be covered by the tax payer. The performance of the German Treuhandsanstalt, which took over the non-performing assets of the previous German Democratic Republic, is an example for such holding company and the high cost to the tax payers. A Good Europe Bank would focus on the liability side of banks. It would resemble a European investment fund exclusively for banks. Its purpose would be to help banks to recapitalize when and after they have written off their non-performing assets. The fund would invest and increase the share capital of banks and their capital reserve ratios and encourage them to lend to the real economy. This would be a solution conform to market’s principles. Increasing bank’s share capital would slow down or stop the deleveraging process, which has presently so dramatic consequences for the real economy. The Good Europe Bank would be financed by public and private investors. Governments and other institutions such as the European Investment Bank and the Bank for European Reconstruction and Development as well as private investment funds would take up the share capital of the Good Europe Bank. In addition the Bank will issue interests paying preference shares, which will be largely bought by member state governments. The interest paid on preference shares will be higher than the interests of Member States than the interests rates of government debt. In this way the financing of the Good Europe Bank will not represent a financial burden to tax payers. By recapitalizing the banking sector the Good Europe Bank will stop the chain reaction of de-leveraging that has accelerated the crisis today. It also opens perspectives for attractive long term returns on capital for private investors. As a European institution that participates in commercial banks’ share capital, it could also make a contribution to the efficient surveillance of banking and restructuring of financial institutions in difficulties. It is clear that these policies require stronger policy making mechanisms within the European Union. We wish to encourage European policy makers to start discussing the terms and conditions under which a democratic European government could assume responsibilities for economic and other policy areas. The economic crisis has made clear that Europe’s present governance system is not optimal. It renders more fragile the integration process and its achievements. The issue at stake today is whether Europe will have the courage and move forward, or whether it will fall apart and return to the warring states of earlier centuries. It would then have broken all promises.

56

57
arl Marx, was he right - after all? The financial and economic crisis has raised new questions about the future of the capitalist system. 20 years after the fall of the Wall in Berlin, the alternative is clearly no longer a planned economy, Soviet style, but the fragility of the capitalist system is again apparent to everyone. Curiously, Marx never fully understood the nature of money, finance and capital. He explained the capitalist crisis by the fall of return on real capital, but the system’s systemic instability resides in the financial sphere. Financial crises have occurred frequently in the history of capitalism. Their re-occurrence was slowed down after central banks assumed responsibilities as lender of last resort, although the inter-war period saw major breakdowns in 1919-20 (UK), 1924 (France), 1929 (US, Germany, Austria, Hungary) (see Kindleberger, 1984). The period of Bretton Woods was marked by exceptional stability, but after the collapse of the System in 1971, successive waves of crisis have again occurred around the world: the turmoil of 1972-73 in the exchange markets was followed by Herstatt bank failure in Germany in 1974 and the fringe bank crisis in the UK 1974-5; the LDC debt crisis threatened the stability of the world financial system in the early 1980s. The 1990s saw the ERM crisis in Europe (1992-3), the Japanese and Swedish banking crisis, the Mexican peso crisis in 1994, the Asian crisis in 1997, the Russian crash in 1998 followed by the near-bankruptcy of the LTCM hedge fund (Goodhart and Illing, 2002). It may not be a coincidence that these disturbances started to become more frequent in an era when neoliberalism was on the ascent. Re-thinking the future of capitalism requires today re-examining the fundamental assumptions underlying the economic model that has dominated policy making for the last 40 years. In this chapter, we will look at some paradigmatic foundations of economic policy in a modern monetary economy and then draw conclusions for policy making. The Normativity of Money and Capital Are money, banks and finance good or bad? People are angry. Trillions of euros have been spent on bailing out banks, which are thought to be responsible for the economic mess we are in, while no funds are available for schools hospitals or higher wages. After the excesses of the financial bubble, the conservative reaction is to go back to the fundamentals of the «real» economy. The French President Nicolas Sarkozy has declared «Anglo-Saxon» capitalism for dead (23) and called for the «moralization of capitalism» (24). But what does it mean? Is it moral if profit is made with ecology, but greed if it is obtained by financial derivatives? Is the source of all misery the economic rationality the price system of markets that allocates scarce resources to the satisfaction of unlimited wants, or is it the «irrational exuberance» of financial markets? Should companies adapt a rule book of ethical corporate governance? If the provision of public goods conflicts with private goods, are the first morally right and the second evil? Or is it the other way round? In the confused debate about these issues, one is reminded of the phrase by Coluche, the French satirist: «Capitalism is the exploitation of man by man, socialism is the opposite».
(23) At the G20 Meeting in London, 2 March 2009. (24) At the United Nations in New York, 23 September 2008.
THE MORAL ECONOMY OF MONEY AND THE FUTURE OF EUROPEAN CAPITALISM

58
Marx (1845) famously wrote: «Philosophers have only interpreted the world differently; what matters is to change it». However, he did not see that how we interpret the world, determines how it is. Norms and values give sense and direction to human actions and are the intentional content of institutions. For this reason, economic doctrines shape the world we live in. Capitalism has its own ethos, a normativity that is functional to the system and that has determined the values of modern society. Some of its elements, notably the issue of balancing liberty against equality are immanent to the modern capitalist economy; others have their roots in traditional hierarchical economic systems and are opposed to a modern democratic society. Historically, capitalism has emerged together with the financial system. In fact, it was the invention of banking, the de-penalization of usury and the acceptance of interest taking, together with the introduction of double-entry bookkeeping in the Renaissance that ended the repressive culture of the middle ages and liberated individuals: the transformation, which took place between the 17th and 19th century in Europe was the gradual and sometimes violent substitution of the traditional norms of hierarchy by the modern principle of contracts. This principle presupposes and at the same time generates freedom and equality as political norms. Economic agents must be free to conclude (or not) contracts, and they are equal in their freedom. As a consequence, freedom and equality are the two dimensions, which define the modern political space in which individual autonomy and emancipation become possible. The entire political philosophy of modernity is based on this pair of values. Without the contract economy and without financial markets, modernity remains incomprehensible. These modern values became dominant – Gramsci would have called them hegemonic – after the American and French Revolutions. While the articulation of «freedom» became the rallying cry of liberalism, «equality» was trumpeted by social democrats and socialists. However, both these political ideologies and movements are grounded on the same economic principle: contractarian individualism. They stood in stark contrast to conservative hierarchy, which emphasized subordination of individuals to the community and allocation of resources according to the hierarchy of rank and status. John Locke (1988/1689) was the first to design a clear modern counter-program to the conservative Tory ideology defended by his opponent Robert Filmer (1991/1680). It was based on the private property of free and equal individuals. Karl Popper (1995) has later described the cleavage as the conflict between «the open society and its enemies». The exchange economy Political values must be consistent with the functional norms on which the reproductive system of a society is based. But the specifics of a moral economy depend on the interpretation of economic paradigms (25). The dominant paradigm in economic theory is the exchange economy, where people improve their welfare by exchanging goods, of which they produce more than they need. Money is supposed to be at best a neutral means of exchange, which facilitates barter transactions, but otherwise can only cause harm and does not contribute to «real wealth». If too much of it is put into circulation, inflation distorts the efficient allocation of resources by markets. Thus, monetarists emphasize the control of money supply and price stability as primary objectives for monetary policy. This is the core idea behind Milton
(25) The term moral economy was first coined by Edward Palmer Thompson (1971) and James Scott (1977). For an application to the monetary economy, see also Muldrew 1998.

59
Friedman’s monetarism, but it has deep roots in the exchange paradigm of classical economic thought, starting with John Locke, Adam Smith and David Hume. Continuing this line of thought, neoclassical economics has shown that exchanging goods in spot markets in proportion to their marginal utility will maximize individual’s welfare (Efficient Market Hypothesis). Subsequently the rational expectations revolution has introduced an intertemporal dimension to the exchange economy. In these models utility is not only maximized by market transactions today, but also by exchanges into the indefinite future. As a consequence, modern economic theory starts with the assumption of «complete markets», where there is a system of markets for every good. By carefully defining «good» to include the date and environment in which a commodity is consumed, economists are able to consider consumption, production and investment choices in a multi-period, risky world. Using the same utility theory developed to analyze timeless certainty (Flood, 1991). Complete markets provide consumers, producers and investors with perfect flexibility in allocating payoffs and planning for uncertain contingencies. In this context, markets for futures and options are shown to improve the efficiency of marketplaces and this has far-reaching implications for regulatory policy. Even if it is acknowledged that in the real world markets are not complete, they still often serve as a theoretical benchmark. In practical terms this approach has reduced uncertainty to calculable risk and has set off the dramatic development of financial derivative products and markets, through Hedge Funds, forward contracts, futures options, swaps and similar products.
In political terms, the idea that every contingent state of the world could be traded on a market opened the door for the neoliberal distortion of liberalism, according to which distributional issues and the principle of equality have no place in modern economics and politics. When privatization, liberalization, deregulation and monetarism become the dominant political creed, what role is left for politics? (26) All of the most influential New Classical and New Keynesian theorists have worked with the ‘complete markets paradigm’. But, as Buiter (2009) has pointed out, in a world where there are markets for contingent claims, which span all possible states of nature (all possible contingencies and outcomes), and in which intertemporal budget constraints are always satisfied by assumption, default, bankruptcy and insolvency are impossible. It is then not terribly surprising that critical questions regarding the functioning of a modern market economy were never answered nor even asked. The contract economy This is different in the economic paradigm, which is influenced by the «banking view» of monetary theory. It goes back to Keynes and owes to Minsky, Riese (2001), Goodhart and Stiglitz. It sees market agents constrained by limited information and explains the need for money by its function of means of payment, caused by the existence of uncertainty (Goodhart, 1989). In an uncertain world, where people lack trust in their trading partners’ willingness and ability to make promised future payments, sellers of spot goods (goods that are delivered now) require immediate payment by transfer of a reliable asset. This asset is money (Keynes,
(26) As Michael Heseltine, a minister in Margaret Thatcher’s government once said, «Ideally government will meet once a year to hand out the subcontracts».

60
1930), because money is liquidity and has the «advantage of immediacy» (Demsetz, 1968). Holding money gives security. Giving up this advantage has a price: the interest rate. In an uncertain environment liquidity trumps other assets. The higher the uncertainty in the economy, the higher the price of safe liquidity. This may lower the demand for credit, but could also create an adverse selection bias, which would constrain the supply of credit (Stiglitz and Greenwald, 2003). Thus, trust and stability in the macroeconomic environment will increase the likelihood that people will pay with money, buy things and lend against promises. In a modern economy liquidity is provided by the central bank. Commercial banks obtain central bank money by «discounting» debt against cash, debt they have themselves previously issued or acquired. The need of banks and other agents to hold liquid assets as reserves allows the central bank to steer the interest rate for the whole economy. This has two implications: first, there is a structural shortage in the money market, created by the fact that when a loan plus interest are repaid, more money is needed for repayment than initially borrowed. This additional money must come from the central bank itself and commercial banks have an excess demand for central bank reserve assets. The structural shortage in the money market makes money «the scarce asset» par excellence. The structural shortage in the money market allows the central bank to set the conditions under which money is obtained. Hence, if the interest rate reflects the scarcity price of money, at zero interest rate money becomes dysfunctional because money is free. In the long run a zero interest rate policy is the euthanasia of capitalism. Second, in order to be able to service the debt and repay a credit plus interest, a borrower must generate additional income. If money is created by central banks who buy credit contracts issued by the corporate sector, then the real economy must produce a surplus. This is how money has become the engine of growth. Marx has correctly described the mechanism by which this surplus is produced. What he did not understand was the interaction between liquidity, uncertainty and credit contracts with the need to produce a surplus. Contrary to what Marx thought, the prime driving force of economic development has been the stick of honoring debt obligations, rather than the carrot of profit. Profit may be the incentive, but obligation makes performance persistent. Because dynamic equilibrium is attained when the growth rate equals the interest rate, maintaining a positive real interest rate is the best guarantee for long run economic growth. However, there is a fundamental distinction between private and public sector debt:: the first is serviced out of profits and future income, the second out of taxes. As David Ricardo and Robert Barro (1974) have shown, given certain informational assumptions, rational consumers should internalize the government's budget constraint, whereby the present value of future tax liabilities is equal to the value of newly issued government debt. Tax payers will then reduce consumption and start saving today to pay future taxes. The government’s choice is between taxing today or taxing in the future, so that public borrowing does not add to the net wealth of society. This is different for investment, private and public, because investment does create additional income. Debt, which finances investment, is serviced by wealth increases and not by reduction in future spending. Keynes taught us that the purpose of macroeconomic policy must be the creation of a stable macroeconomic environment which minimizes uncertainty, so that the liquidity premium is minimized. Before anything else, Keynes was a philosopher of probability. He saw the fragility of financial markets and thought that fiscal policy could play a stabilizing role when the

61
economy was trapped in the liquidity trap. But his thought was more subtle than subsequent Keynesianism, which reduced his vision of a monetary production economy to the so-called neoclassical synthesis (27). When Keynesianism failed in the 1990s, it was precisely because mainstream economics had returned to the exchange paradigm, forgetting the unstable nature of money in an environment of uncertainty. The monetarist Anti-Keynesian revolution by Milton Friedman was the logically consistent reformulation of this move. The essential difference between the two economic paradigms consists in the treatment of uncertainty: in the classic/neoclassic/monetarist tradition, uncertainty is by definition reduced to temporary disturbances (shocks), which disappear automatically. In most econometric models, these shocks are calculable and assumed to follow a normal distribution. This assumption provides the rational for the often highly complex mathematical models underlying financial derivatives. They have ignored «unforeseeable» shocks with infinitesimally small probability and statistical distributions with fat tails that have become so fatal when the financial markets took a general downturn. In the Keynesian/informational paradigm uncertainty is inherent to the human condition and there is no guarantee that the probability characteristics of past observable events will also govern the probability distribution of future events. If that is so, uncertainty requires management. The implications for economic policy are important. If capitalism and markets have a natural tendency to return to a long run equilibrium, the role for policy and government is limited: keep out of the way and make markets flexible, because utility maximizing economic agents would then do whatever it takes to overcome the shock. But if uncertainty is an natural condition, which may distort and prevent the return to equilibrium, then government has to stabilize the macroeconomy. Political normativity The two paradigms have also implications for political values and morality. In a neoclassical world, people strive to maximize their utilities, where more is better. The dominant political value that allows to achieve this is what Isaiah Berlin (1958) called «negative liberty», i.e. the protection against interference by others. In economic terms, negative freedom signifies free markets. There is a consistent theme from Lockian liberty to Adam Smiths’s invisible hand, from modern property rights schools to neoliberalism: reduce the sphere of public/government interference. Few questions are asked about the nature of governments, as long as they successfully implement free market policies. Thus, Friedman (1987) could call Pinochet’s Chile «an amazing political miracle». This reduction of freedom to negative liberty is what defines neoliberalism. With the alternative Keynesian paradigm, governments have a role to play as guarantors of systemic stability. They must minimize uncertainty; this is the role for macroeconomic policy. However, this is not all. The monetary economy imposes its own normativity on society. It opens the gateway to «positive» liberty, namely the capacity of individuals to determine their lives as free and equal masters. The most important institution in a modern economy is the contract. By understanding money as a mean of payment that extinguishes debt contracts, the Keynesian paradigm sees the monetary economy founded in an extensive web of contracts. As we have seen, this implies the normative matrix of freedom and equality. Keynesian (27) Keynes explained his Monetary Theory of Production in the Festschrift for Spiethoff in 1933. (Keynes, 1987: 408-412). The neoclassical synthesis was developed by Hicks (1937) and later formalized and popularized by Paul Samuelson.

62
liberalism is the political liberalism of equal individuals, and not by coincidence do American neo-conservatives define political liberalism as being to the left of the political spectrum. This normative framework of modernity is distinct from the holistic values that dominated traditional societies and nowadays re-appear in neo-conservative ideology. In the pre-modern paradigm, resources are allocated by hierarchy and power and the holistic society demands the individual to surrender to the authority of the leader, the dogma of belief, the imperatives of community. In the traditional society, the individual exits to serve the whole; for the modern individual, society is there to empower her individual self-realization (28). Not surprisingly these two views give rise to two very different interpretations of the State and government. In the traditional/holistic perspective, the State is the incarnation of hierarchical authority. It has the monopoly of power and can legitimately interfere with individuals’ freedom. The modern view sees the State founded in the social contract by free and equal citizens, who are owners of common public goods as well as owners of private goods and decide themselves how to use these goods. Hence, the modern state is democratic, the traditional is authoritarian. It is the collective determination of the public good through democratic public deliberation and choice that gives citizens the positive liberty of determining their life plans, of being their own master. This distinction between the authoritarian and the democratic State is prior and more fundamental than the conflict between freedom and equality, between economic liberalism and social democracy. The contract economy is the foundation of modern democracy. If free and equal citizens conclude the social contract, they must have equal rights to appoint governments as their agent, and to charge them with the implementation of policies which reflect their collective preferences. They need a government that is accountable. Contrary to the role of government in traditional societies, where legitimacy is derived from collective identity and cultural homogeneity, modern government is functional and preference choice oriented. These normative considerations have important consequences for how one perceives the interaction between governments and markets. The Anti-Keynesian revolution by Friedman and the monetarists in the 1970s has given priority to the exchange paradigm of microeconomics and ignored the need for macroeconomic policy in minimizing uncertainty. The reduction of liberty to the «negative» concept of non-interference has prevented using the democratic state as an instrument for positively defining the collective preferences of individual citizens. It therefore has also minimized the redistributive function of the State. Neoliberalism became a program to dismantle the social welfare State. Re-defining a new policy agenda for the post-neoliberal era requires a return to the fundamental norms of modernity. Models of Capitalism The credit economy has been the historic engine of growth, but also of growing social inequality. Owners of securities have a claim on the increase of income and wealth. The accumulation of capital concentrates property in the hands of few, unless some form of redistribution re-establishes the balance. Thus, the freedom of economic liberalism remains purely formal, unless it is counterbalanced by principles of equality and fairness. The modern social democratic approach to redistribution is to use the democratic state, where citizens are free and equal and will establish a fair balance between economic freedom and equality
(28) See Popper (1995) for the full development of these ideas.

63
according to their tastes, even if the balance may shift over time. The conservative approach is to use the authority of the state in conjunction with communitarian identity to restrain the unfettered liberty of the market. Thus, if the monetary economy has produced freedom and equality as fundamental norms of modern individualism, they have interacted, sometimes uneasily, with the norms of traditional society. Communism, fascism and now Islamic fundamentalism are attempts to return to authoritarian, hierarchical forms of social relations that suppress the individual. In Western Europe, as in the United States, modern individualism has prevailed, although conservatism has often become an ally of either economic liberalism or socialism. Nevertheless, Europe’s greatest achievement after the Second World War was to have found a social equilibrium, which has preserved individual freedom and equality in the context of a stable monetary economy. European monetary union is the pinnacle of this long process. Models of welfare capitalism The emergence of modern individualism as the dominant political philosophy does not mean that Europe has to converge to a single model of capitalism. In fact, despite the common normative structure of a modern contract economy, social models in Europe are highly diversified. Some countries have given greater weight to liberal market freedom, others to social equality. These political norms translate into specific institutional forms with respect to the regulation of capitalism. Each country has developed its own mechanism for providing social protection to less privileged groups and classes. Three basic models of welfare capitalism may be distinguished (Esping-Anderson, 1990): the liberal Anglo-Saxon model, the social democratic Scandinavian model and the conservative model at the centre of the European continent. In addition there are some variations in Southern and Eastern Europe that are different, but largely dominated by traditional values of patriarchy and political clientelism. Is there an optimal social model? What is the «best-practice» of capitalism in the face of increasing international competition not only for firms, but also for the institutional fitness in the globalization process? A number of different answers have been discussed in the political economy literature (29). Most prominently, Peter Hall and David Soskice (2001) have argued that the choice of social models is not arbitrary and cannot be «switched» at will, because each institutional arrangement must be seen in its functional context. For example, the Anglo-Saxon model, which they call liberal market economy, is more short-term oriented due to the dominance of financial markets, and therefore also requires highly flexible labour markets; this institutional set-up supports technical innovation. By contrast, the German model of coordinated market economy has a long term bias due to banking regulations and with that goes the long term orientation in the labour market, that produces the German skill machine and a comparative advantage for product development. Edwards and Fischer (1994) have challenged the consensual view according to which the Anglo-Saxon model is capital market orientated and Germany is dominated by bank-financed structures. Banks are not more involved with running businesses in Germany than in the USA. And the contagion of German banks by the meltdown in the US subprime market for mortgages is proof that even in Germany securitization had progressed significantly. Vitols (1998) found that at least until the 1990s the uniqueness of the German banking system lied
(29) For an overview see Sopart, 2005

64
(1) in its unusually high capacity to provide industrial finance in the form of long-term debt capital, and (2) in its avoidance of the «speculative boom-credit crunch cycle» experienced by almost every other advanced industrialized country in the 1980s and early 1990s. These two key characteristics are attributable to a regulatory framework, which involves strict prudential regulation, access to long-term refinancing sources, and a federalist form of corporatism. However, these features have been gradually eroded in recent years, due to the creation of a single European banking market, the globalization of capital markets and neoliberal economic policies. Nevertheless, these institutional characteristics have made an important contribution to Germany’s spectacular economic stability after the introduction of Social Market Economy in 1949. Even if there is no way back to the old days, there may be lessons to be learned from Germany for a future restructuration of Europe’s financial system. Redefining the policy agenda A new policy agenda for the post-neoliberal Era requires preserving the fundamental norms of economic and political modernity, namely freedom and equality. The first, economic, priority must be to stabilize the financial system, so that credit becomes the engine of growth again. This implies rules for financial regulation that restore trust in individual banks, and also macroeconomic policies that stabilize the economy. The second, political, priority must be to prevent conservatism from destroying individual freedom and equality. The narrowing of political discourse to the provincialism of local identities (30) contributes to this as much as the protection of national communities by authoritarian means of the State. They are counterproductive if economic prosperity is to be re-established. In both respects public authorities need to interact with markets. In fact, markets cannot exist without governments because governments guarantee their functionality. This insight is not new, but the two dimensions of government interference need to be acknowledged. For example German ordo-liberals always recognized the need for a strong state as the guardian of market rules, but they were strongly opposed to Keynesian market intervention, where governments become market participants (Tietmayer, 1999). On the other side, French interventionism was fond of an active state, but refused to let the government’s hands be bound by the functional logic of markets. A proper design of an efficient European market economy must combine prudential supervisory rules with macroeconomic management for the entire Euro Area, without inhibiting individuals from becoming market participants. The state and democracy The financial crisis does not invalidate the viability of the financial system. Conservatives call for a return to the «real» economy and the «good old moral values» of decency and trust. But the problem is that trust depends on systemic stability and this requires government action. There is, today, a real risk that one throws the baby out with the bath water, that the recognition of the excesses of the last decade leads to excessive repression of contractual liberty. The conservative backlash blames greedy bankers, fantastic bonuses, and financial derivatives for the crisis; it seeks returning to pre-modern forms of regulation, either by imposing authoritarian rules or oppressive morality. In the European context, the backlash takes the form of economic protectionism and the defense of national identities. These
(30) As G. Tremonti has superbly formulated: «People no longer believe in the future, but in tomorrow; they no longer believe in the nation, but in the village».

65
ideological reflexes are incompatible with monetary union or a single European market. By definition a single market implies the development of free and equal opportunities to conclude contracts and transactions without the impediments of borders or regulative competition between local authorities. But the democratic will of free and equal citizens must decide a legal framework, within which private contracts may be negotiated without harming others. With the single European market, such legal framework must be European, not national. When the French president declares (31) «we cannot be naïve, we must protect our industry», he announces double damage to French and European citizens: he prevents international trade from stimulating demand in the European market, which would support French companies, which do not have the privilege of being «protected»; and he denies French consumers the right to buy goods and services at lower prices and better quality. Similarly, to impose limits on how much a person may earn, as discussed in Germany and even in America, does not remove the growing gap between rich and poor. Rethinking European policies requires now a further step. The ultimate function of the State is to manage and regulate the externalities, which arise from individual actions. As we have seen, the modern State does so by giving a say to individual citizens, who are affected by policy decisions. It is citizens who have the ultimate authority (sovereignty) to decide how they want their interests pursued. In the European Union, an increasing number of policies affects all European citizens, particularly if they use the euro as their currency. But policy making is dominated not by concerns for collective European interests, but by fractional interests of national governments who often justify their usurpation of power by reference to the defense of national identity. This form of governance is incompatible with the modern idea of free and equal citizens, who are masters of their own destiny. The fundamental break-through of the French Revolution, inspired by the liberalism of the first Dutch Republic (Israel, 2004), was the principle that people, citizens, are Sovereign, not governments. Citizens conclude the social contract to further their interests, not because they «belong» to a community with a given identity. Hence, European citizens must have the authority to agree on appointing a European government as the agent of their common concerns and interests. The economic crisis opens the perspective for re-founding Europe's polity. It is time that European democrats start thinking about delegating policy making for issues that concern all European citizens to a democratically elected European government. A European government must assume responsibility for macroeconomic policies. Intergovernmental coordination is no longer sufficient to obtain welfare maximizing policy results, because many macroeconomic policy issues require coherent discretionary decisions and that cannot be achieved by non-binding guidelines or open methods of coordination. Most importantly, if the liquidity premium contained in the price of money reflects macroeconomic uncertainty, then it is unthinkable that a policy making institution is not responsible for the whole of a given currency area. Thus, European monetary union calls for a European government. French policy élites have proposed to set up a «gouvernement économique», without ever specifying what it meant. The notion of an economic government is misleading. In order to be coherent with the political-economic norms of modern societies, a modern government must be democratic and accountable to its citizens, who can collectively choose between different (31) Speech before the European Parliament on 21.10. 2008. http://www.spiegel.de/international/europe/0,1518,585558,00.html

66
policy options. The age of paternalism is gone. Citizens must choose between options elaborated and presented by political parties. The nature of government is political. The problem with the gouvernement économique is that it is necessarily bureaucratic and authoritarian, because of its technocratic reduction to the sole economic sphere. A democratic government must be able to propose policy compromises across the entire range of policies, including economics, security, foreign policy. Otherwise citizens’ preference-frustration, which emerges when specific issues are rejected without compensating policies in a different domain, will impede the democratic policy consensus that is necessary for a well-functioning democracy. Thus, Europe needs a democratic government. Such a European government does, of course, have a privileged role with respect to economic policies. Here are some of its tasks.
Monetary policy
A European government’s overall purpose must be the maintenance of financial and economic stability in the Euro Area in order to minimize the general uncertainty under which investment decisions are made. This is necessary because in a monetary union all financial contracts are written and settled in the same currency, and most economic decisions depend on monetary and interest rate decisions by the ECB. Thus, macroeconomic stability is the precondition for raising the rate of capital accumulation, creating jobs, improving productivity and sustaining equitable standards of living. Monetarists have argued that an economic crisis is best remedied by providing liquidity to the banking system. They see the cause for the crisis in the collapse of the money stock and seek restoring the flow of money to the economy through open market operations and «quantitative easing». They believe that if the central bank «prints» enough money, economic activity will return. However, a crucial requirement for this strategy to work is that financial markets operate smoothly, so that banks efficiently redistribute the liquidity provided by the central bank. Clearly, this is not the case in the present crisis. The «banking view», which understands money as an information tool in an uncertain environment, allows a better interpretation of monetary policy in the present crisis. Asymmetric information and lack of trust have disrupted the interbank market. In this context, the most important task is to preserve money's role as a reserve asset. Because of asymmetrical information and externalities in the interbank market, banks may be denied access to liquidity, so that they may become illiquid, despite being solvent, and therefore they need assistance. The central bank must, therefore, act as a lender of last resort. The IMF could do so in the international context with respect to international reserve assets. The need for the central bank to act as a lender of last resort was already formulated by Bagehot in 1873 (32) and its role has been summarized by Goodhart (2002: 227) in three propositions: - lend freely, - at a high rate of interest, - on good banking securities. Central banks practices in recent month have been closer to the monetarist view. They have lent freely, at low interest rates, on bad collateral. The ECB has lost € 10 billion by having bought toxic assets and ECB president Jean Claude Trichet has evaluated the bank’s balance
(32) See Goodhart and Illing 2002 for excepts of his book.
67
sheet risk at € 600 billion, equivalent to 6 per cent of euro Area GDP (Trichet 2009). In this situation, government borrowing can become a stabilizing factor, not only because it stimulates demand, but also because it provides banks with low-risk assets and therefore reduces the need for de-leveraging in a financial crisis. Liberal economists and political moralists have asked: should governments bail out banks? Should they rescue other companies, such as car or steel factories? The answers are: yes and no! There is a fundamental distinction between the financial and the «real» sector. Banks deal with words, the corporate sector with things. Financial contracts are promises and require trust; companies produce goods and services, which depend on the quality of the products. The default of one debtor can affect other debtors like a cascade, and systemic stability, the employment and livelihood of workers, require that this is avoided. Therefore banks need to be rescued if lack of trust risks bringing down the system. But the bankruptcy of a manufacturing or service company is first of all a sign that it did not produce the quality clients desired. Form this point of view, such a corporation does not deserve to be rescued by public authorities. In fact, the elimination of uncompetitive companies is welfare augmenting, as it would allow other competitors to take up markets shares with better products. There is, however a sting: when a corporation declares bankruptcy, it will default on part of its debt. This could destabilize its creditors, if it is large enough. Defaults by property companies have brought down American banks. But even if the bankruptcy does not have systemic consequences, it may still affect subcontractors, workers and the activities in regional economies. The political response to such situation therefore requires differentiated forms of intervention: public authorities must avoid systemic risk and facilitate alternative investment and the implantation of new production units. Yet, corporate difficulties may also be caused by a lack of effective demand in the economy. One car manufacturer may produce bad cars. But if all car makers are making losses, it is because people do not spend money on cars. In this case, governments must focus on stimulating the economy as a whole, rather than protecting specific sectors. Conclusion To summarize, the future of capitalism is its past: credit and interest are the engine of growth in the modern economy, but also the foundation of moral economy of capitalism. Like all morality, the moral economy of money is ambivalent: the functional norms are freedom and equality, the factual reality is material constraint and inequality. Average income per person is today 12 times higher than it was 200 years ago (Clark, 2007) and this development of «real wealth» would not have been possible without the financial sphere. But the system-immanent tendency of capital creating inequality requires an authority capable of leaning against the wind, of correcting social injustice, of providing a stable legal framework. Capitalism remains a fragile construct: uncertainty makes it potentially unstable and the accumulation of wealth in the hands of few is a permanent challenge to the modern idea of justice, which is based on freedom and equality. The modern democratic state is the ultimate guarantor for the sustainability of capitalism. The democratic state is not the authoritarian imposition of traditional values on a liberal economy, but the instrument by which free and equal citizens jointly determine their preferences and how they wish to set the balance between liberty and equality; the democratic state integrates externalities of policy decisions, which affect all citizens. But the validity of modern norms does not guarantee their
68
implementation in actual life. In Europe, too many governments behave as authoritarian agents, irresponsive to citizens’ preferences and life designs. And European citizens have been denied a European government that would allow all of them together to make choices about the policies that determine their prosperity and future wealth. It is time this changes.

69
Introduction n the first Report on Europe – Cer 1/2008 – we stressed the importance of unit labour costs (ULCs), i.e. the ratio between wages and productivity as the crucial variable in the interaction between monetary policy and income policy. ULCs variations are represented by the difference between the variations of nominal wages and the variation of labour productivity. If nominal wages grow faster than labour productivity, ULCs increase and this generates inflationary pressures. Moreover, if ULCs grow at the same rate as inflation, the wage share remains constant. Nonetheless, this latter fact implies that, if price inflation is greater than the Central Bank target – 2 per cent – through a wage-price bargaining process aimed at keeping the wage share constant, inflation will rise to a rough vicious spiral. The Central Bank then has the duty to increase interest rates and stop inflationary pressures. A successful policy-mix should keep ULCs at a level coherent with the Central Bank’ s inflation target. The latter rule has been suggested by the European Council in the Integrated Guidelines for Growth and Employment, in 2005. If any company, any region and any member State would increase wages at a rate exactly equal to the sum between labour productivity and ECB inflationary target, price stability would be guaranteed and the wage share would also be stable. Competitiveness of companies, regions and Member States, would also be unchanged, despite the fact that substantial nominal wage differentials would emerge among sectors with different productivity. However, wage bargaining in member states follows very different institutional rules, which normally do not take into account the European inflation target. The Euro Area ULCs average has remained below the ECB inflation target. In some countries, like Germany, ULCs were below average, while in other countries they were substantially higher – namely Greece, Spain and Italy. For what concerns Italy, if we ignore the public sector, the private sector wage dynamics is in line with the Euro Area average. Thus, the wage level of the public sector seems to be responsible for pushing Italy above the Euro Area average. In what follows we analyze ULCs dynamics of some member states, with respect to some specific sectors of the economy, in order to discover if and which wages have the power to influence the wage bargaining of other sectors of the economy. With respect to tradable sectors, we know that they are exposed to international competition and that they consequently negotiate wages compatible with international competition. Non tradable sectors, on the contrary, are not exposed to international labour competition and will therefore tend to negotiate wages that are compatible with consumers’ purchasing power. We expect that in an economy where the power of wages is exercised by tradable sectors, ULCs are going to grow slower than in an economy where wage are led by non-tradable sectors. Our analysis is based on Euklems data for the period 1999 – 2005. We considered agriculture, manufacturing, constructions, trade, transportations, communications, public (33) and private services (34). Member states considered are: Italy, Germany, France, Spain, (33) Sectors included are: public administration, defense, social security, education, health security, garbage management, cultural and sport activities. (34) Sectors included are: finance, insurance companies, real estate, pension funds, legal activities and other business activities.
UNIT LABOUR COST DYNAMICS IN EUROPE AND ITALY

70
Greece, Portugal , Ireland and Finland. The variables analyzed are: ULCs, average hourly wages and average hourly productivity. Following the sectoral analysis, we focus on the reasons for the Italian differential between private and public sector. Unit labour costs in Europe: dynamics and explanations The ULCs average yearly variation for Europe over the 1999-2006 period (table 11) is 0.6 percent. This result stems from a high dispersion of the rate of growth among single countries: 4 percent for Ireland, 3 percent for Italy, Spain and Greece, 2 percent for France and 0.11 percent for Germany. In Finland we observe a negative growth (-0.02 percent). Among the considered countries, France is thus the only one that is characterized by ULCs dynamics in line with the ECB inflation target of 2 percent. Mediterranean countries tend to move towards the target, while Ireland is still far way from the stability target. On the other hand, Germany and Finland undershoot the European target. This compensate for the increases in the other economies so that European ULC remains well under the 2 per cent target, i.e. deflationary pressures are prevailing in the Euro Area The average ULCs dispersion index (latest row) is 1.48 percent and takes a position between the nominal wages index - 1.75 percent - and average productivity - 1.22 percent. This seems to indicate that growth differentials are mainly determined by nominal wages variations (35), so that we have to investigate more on the wage models prevailing in single countries. UNIT LABOUR COST PER UNIT OF OUTPUT, Table 11 NOMINAL WAGES, PRODUCTIVITY (annual average change, 1999-2005)
Unit labour cost perunit of output
Nominal wages Productivity Target rule
Italy 2.56 2.83 0.27 2.27Germany 0.11 1.57 1.47 3.47France 2.09 3.70 1.61 3.61Spain 2.78 3.18 0.40 2.40Greece 2.77 5.74 2.98 4.98Portugal 2.91 3.58 0.67 2.67Ireland 4.39 7.15 2.76 4.76Finland -0.02 3.38 3.40 5.40
Euro Area 0.56 1.66 1.10 3.10
Inter-countries variability index 1.48 1.75 1.22
CER on data Euklems 2008
TOTAL ECONOMY
(35) The dispersion index has been calculated as standard deviation:
n
xxìni
x
2
1
−∑
=
−
=
σ

71
UNIT LABOUR COSTS PER UNIT OF OUTPUT Table 12 (annual average change, 1999-2005)
Agricolture Manufacturing Construction Trade, transport,communication
Other"private"services
Other"public"services
Intersectoralvariability
index
Italy 1.25 2.88 3.06 1.15 3.30 3.21 1.00Germany -2.53 -0.98 1.12 -0.71 2.10 0.81 1.68France 3.20 -0.66 4.14 1.73 2.62 3.35 1.70Spain 2.05 1.95 4.65 2.39 2.78 3.05 0.99Greece 8.09 3.04 6.13 1.06 2.85 4.13 2.53Portugal 1.64 0.90 5.07 2.41 1.24 4.64 1.78Ireland 8.46 -1.87 9.59 2.70 2.52 8.69 4.59Finland -2.25 0.18 -0.04 -0.92 1.79 0.34 1.35
Euro Area -0.74 -0.29 0.82 0.32 1.77 1.16 0.93Inter-countries variability index 4.10 1.83 2.99 1.39 0.66 2.57
CER on data Euklems 2008 Sectoral dynamics can reveal some deal of information on the prevailing wage model in the single countries. In order to perform the sectoral analysis, we build two dispersion indices (table 12). The first index is a dispersion index across countries - calculated as the standard deviation around the average of the considered countries per each sector- and we call it Country Index (CI). The second index is built around the average of the single sectors considered per each country – and we call it Sector Index (SI). High Country Indexes highlight a strong differential among the countries for the selected variable and consequently that common dynamics are not present among them. This could be considered as a lack of convergence towards a common European target (or more broadly speaking, a lack of common target). The Sector Index, reveals the type of relationship among the sectors of the economy of a single country. High figures for this index, will indicate the lack of a common dynamics among the sectors within the same country, while a low index shows the existence of leading sectors which influence nominal wages variations of the total economy. In this case, we have to discover whether wage leadership is managed by tradable or non-tradable sector. Generally speaking, we observe higher figures for CI than for SI so that we can conclude that European countries are still strongly differentiated among them, while wage dynamics are more homogeneous within sectors of a single country, The analysis of the indices disaggregated across sectors also stresses the presence of a different behaviour of ULCs between tradable and non-tradable sectors. Higher dispersion is observed in the non-tradable sectors, for both indexes. And the sectoral analysis confirms the role of Germany and Finland in reducing the average nominal wages growth in the Euro Area. Finally, we can argue than in the member states where the ULCs dynamics are following the ECB target, ULCs could be influenced by a wage-lead of the sectors exposed to international competition, such as manufacturing; by contrast the member states overshooting the ECB target are experiencing a wage-lead by the so called «protected sectors».

72
Italy: income policy and nominal wages dynamics Euklems data for Italy show an economy characterized by ULCs average growth rates higher than the average of Euro Area (2.6 per cent per year for the total economy), with increase in the nominal wages (2.8 per cent per year for the total economy) higher than European average (2.3 percent) and productivity was lagging far behind. In the sectoral analysis we observe that the sectors remaining under the ECB inflation targets are agriculture and «trade, transports and telecommunications». Sectors that move away from the target are «other private services» and «other public services». Manufacturing sector stays between these two extremes. While the Italian dispersion index for Sectors is 1, which says that there is uniformity in the evolution of average ULCs for the whole productive system. Among non-tradable sectors, the sector characterized by the highest nominal wages growth rate is the «public services» sector, (3.4 percent average per year). In fact, despite a homogeneous legislation concerning income policy in both the private and public sector, the latter has always shown substantially different dynamics and highly favourable wage differentials. The Italian public sector has a long history of higher nominal wages relative to the private sector: in the following section we try and give an explanation of this regularity. Italian public sector salaries: indicators A Bank of Italy working paper (36) analyses the wage differentials between the private and public sector through data on family budgets collected from 1980 to 2006. It confirms a positive and stable wage differential performance in favour of the public sector of around 12 percent, from the 90ties on. It also shows how this phenomenon is present at all levels of the managerial hierarchy, except for top managers that have higher salaries in private companies. This evidence could be explained by various facts. In the public sector, a higher level of hierarchy is achieved when performing an equivalent activity in the private sector. Secondly, a higher level of education is required by the public sector at the same corresponding level of the private sector. In the latter, the percentage of workmen with a low level of education, represents 40 percent (data 2004) of the employees. The average wage differential between the two sectors has in fact largely been determined by the managerial component of the labour force (37). The wage premium guaranteed in the public sector is counter-cyclical. As a matter of fact, public administration employees have a lower sensitivity to changes in the performance of the economy, but are in turn more prone to changes due to fiscal balance constraints and the election cycle. Another difference between public and private sectors, are the periods in which contracts have to be renewed and wage increase takes place. The increase in the basic part of the salary – called parte tabellare – is usually bargained not only with great delay on the due date, but also follows electoral cycles and is linked to budget constraints. Thus, the increase
(36) I differenziali salariali tra i settori pubblico e privato in Italia, Raffaela Giordano, Banca D’Italia, preliminary version: Aprile 2008 (37) Pubblico e privato nelle retribuzioni, Lavoce.info, 14/12/2006.

73
is due more to the presence of salary arrears (in the Public Administration about 2.1 percentage points per year, about 84 percent of the differential). In fact, in the private sector, this delay is almost irrelevant (38). The contractual delays that we are discussing here, refer to national wage bargaining at the first level, and do not include the ancillary salary (secondary level), which also distinguishes the public and the private sector. It is also worth noticing that, while in the public sector temporary contracts are more protected because they have the same juridical and economical guarantees of the indeterminate term contracts. Due to the fact that in the public sector it is difficult to measure productivity, the public sector has developed an automatic mechanism for wage updating: salary increases are due to seniority promotions (decided by the manager) and careers improve thanks to internal promotions. Second level bargaining in the public administration, differently from what happens in the private sector, is codified in art. 40 co. 3 of d.lgs n.165 of 2001, which requires that the Public Administration activates autonomous levels of additional bargaining. The ancillary parts of wages, have become even more important in the Public Administration, with the introduction of horizontal career progressions. These are widely used to progress in the hierarchy and to obtain wage increases, without having to pass a public selection. Horizontal progression is also easier to achieve thanks to the fact that it is not financed directly by the budget, which is under the control of the Corte dei Conti. Summing up the dynamics of wage differentials between private and public sector is due to: - different levels of education; - the delay in the wage bargaining renegotiation; NOMINAL HOURLY WAGES CHANGE Table 13 (annual average change, 1999-2005)
Agricolture Manufacturing Construction Trade, transport,communication
Other"private"services
Other"public"services
Intersectoralvariability
index
Italy 2.26 3.01 3.36 2.22 1.79 3.41 0.68Germany -0.03 2.26 1.66 1.21 1.68 1.03 0.78France 4.39 2.95 4.37 3.18 3.53 4.40 0.67Spain 2.08 3.33 3.87 2.51 3.51 3.48 0.69Greece 11.34 5.97 5.68 5.49 2.48 5.85 2.87Portugal 0.56 3.33 3.53 2.38 1.89 4.76 1.46Ireland 13.22 4.94 7.11 4.88 7.43 8.74 3.08Finland 3.17 3.69 3.54 3.09 3.31 3.35 0.23
Euro Area 0.60 2.26 0.90 1.66 1.71 1.48 0.60Inter-countries variability index 4.95 1.20 1.64 1.42 1.88 2.25
CER on data Euklems 2008
(38) Retribuzioni pubbliche, inflazione e produttività del lavoro, Lavoce.info, 06/02/2007.

74
- higher increases in the ancillary part of the salary and the widespread use of horizontal career progressions in public sector; - more protected types of temporary contracts in the public sector. In the analysis of the differential between Public and Private sector wages, a crucial role is played by the different rules applied for wage determination in CC with respect to CNC (see Box «Bargaining power of public administration sectors: wage dynamics»). CC and CNC sectors show a cumulated differential of about 5 percent in the 8 years considered (table 13). We understand that the latter is due mainly to the secondary or ancillary part of the salary. This is particularly true for CNC that have registered from 1999 to 2006 an average cumulate differential 19 percent higher with respect to CNC, in the ancillary part of the salary. The differential for basic salary has been limited and in favour of CC, with an average cumulate 4 percent. New pay policy For the last 16 years, Italy’s income policy has been based on the July 1993 Labour Agreement. It was now replaced by a new General Agreement signed in January 2009. The new experimental agreement framework on pay policy (see BOX «Wage bargaining in Italy»), while covering both the public and private sector, has internal differences which could become significant for the determination of wages between the two sectors. The most obvious element of differentiation is the way salary dynamics have to be linked. For the private sector wages are now linked with a forecast index built on the basis of the consumer price index harmonized with Europe for Italy (IPCA - harmonized consumer price index) minus the price dynamics of imported Energy. A third party, of recognized authority and reliability, shall make the forecast index. The forecast index for the public sector is also identified through the IPCA (harmonized consumer price index) excluding the prices of imported energy, but the rule is stated that public wages will be linked to the minor between the IPCA and the former TIP (Planned Rate of Inflation) The determination of the basis for the calculation is also different for the two sectors. In the public sector the calculation basis is determined by the basic part of the salary plus special allowances, therefore, unlike the Agreement of 1993, it excludes the ancillary part of the salary. Instead, in the private sector, contractual parties with specific contractual agreements will define the part of salary to which applies the index. Further differences are in the period over which the deviation between estimated and effective inflation will be recovered (always minus imported energy). In the private sector recovery will be within the contract’s term, while in the public sector it will happen over the next three years, as already outlined in the Agreement of 1993. For the private sector, recovery of the inflation differential is expected to occur only if there is a significant divergence between expected and actual inflation. The agreement does not specify what is meant by significant divergence.

75
TOLO DA TROVARE???? BARGAINING POWER OF PUBLIC ADMINISTRATION SECTORS: WAGE DYNAMICS The Italian Public Administration is divided into two main categories, called comparti: comparti contrattualizzati (CC) and comparti non contrattualizzati (CNC). CNC include workers in the diplomatic career, penitentiary career, prefectorial career, in the police, army and other armed forces, the magistracy; all the remaining sectors of the public administration belong to CC. The wage bargaining process for the CC sectors, happens as an agreement between Agenzia per la Rappresentanza Negoziale delle pubbliche amministrazioni (ARAN) and Trade Unions. By contrast, wage increases for CNC sectors are decided unilaterally through DPR (decree of the President of the Republic) in both sectors, CC and CNC managers salaries are decided separately from the rest of the labour force. In 2006, CNC represented 16 per cent of the total labour force of the Public Administration (table A), with average wage increases of about 33 per cent (table B). PUBLIC AUTHORITY EMPLOYMENT Table A (year 2006)
DIVISIONS WITH EMPLOYMENT CONTRACT
Managerialstaff
Nonmanagerial
staffTotal Total staff % Managerial
staff/Tot. PA
% Nonmanagerial
staff/Tot. PA Tot./Tot. PATot.PA/Tot. PA
Fiscal agencies 1,988 56,969 58,957 0.06% 1.58% 0.00% 1.63%Research agencies 190 20,111 20,301 0.01% 0.56% 0.00% 0.56%Public companies non economic 1,268 63,143 64,411 0.04% 1.75% 0.00% 1.78%Government departments 4,290 199,730 204,020 0.12% 5.53% 0.00% 5.65%Monopolies (Indipendent companies); Fire brigades 775 35,368 36,143 0.02% 0.98% 0.00% 1.00%Prime minister offices 552 4,051 4,603 0.02% 0.11% 0.00% 0.13%Regions and local autonomies 10,577 602,025 612,602 0.29% 16.68% 0.00% 16.98%Regions with special statute and self-gouvernment Provinces 1,802 78,570 80,372 0.05% 2.18% 0.00% 2.23%School and A.F.A.M. 7,882 1,157,576 1,165,458 0.22% 32.08% 0.00% 32.30%National Health Service 145,915 583,689 729,604 4.04% 16.17% 0.00% 20.22%Universities 391 62,984 63,375 0.01% 1.75% 0.00% 1.76%
Total with employment contract 175,630 2,864,216 3,039,846 4.87% 79.37% 0.00% 84.24%
DIVISIONS WITHOUT EMPLOYMENT CONTRACT
Diplomatic career 1,036 1,036 0.00% 0.00% 0.03% 0.03%Penitentiary career 507 507 0.00% 0.00% 0.01% 0.01%Prefectorial career 1,630 1,630 0.00% 0.00% 0.05% 0.05%Police force 1,775 332,012 333,787 0.05% 9.20% 0.00% 9.25%Army and other armed forces 2,969 121,924 124,893 0.08% 3.38% 0.00% 3.46%The magistracy 10,749 10,749 0.00% 0.00% 0.30% 0.30%force and Army) 16,479 16,479 0.00% 0.00% 0.46% 0.46%Secretaries Region Valle D'Aosta 55 55 0.00% 0.00% 0.00% 0.00%Researchers 79,713 79,713 0.00% 0.00% 2.21% 2.21%
Total without employment contract 4,744 453,936 110,169 568,849 0.13% 12.58% 3.05% 15.76%
TOTAL 180,374 3,318,152 110,169 3,608,695 5.00% 91.95% 3.05% 100.00%Source: CER on data of Ragioneria Generale dello Stato (2008)

76
Among the CNC, the highest wage increases are observed for Prefects (93 percent) which represented in 2006 the 0.05 percent of the public labour force. In the CC, Research institutes (0.6 percent of labour force) and Health institutions (20 percent of labour force) and have registered the highest figures for wages increases, 30 and 28 per cent respectively. SALARY CHANGES AND LABOUR COST Table B IN PUBLIC AUTHORITY EMPLOYMENT (1999 - 2006, var.%)
DIVISIONS WITH EMPLOYMENT CONTRACT
Fixedaverage
salary
Averageadditional
salary
Totalaverage
salary
Totalemployment
Total fixedsalary
Totaladditional
salary
Totalsalaries
Totallabour
cost
Fiscal agencies ….. ….. ….. ….. ….. ….. ….. …..Research agencies 26.9 48.8 30.0 -1.8 24.6 46.1 27.7 78.3Public companies non economic 21.7 12.4 18.5 84.7 124.8 107.6 118.9 48.5Government departments 19.8 23.1 20.5 -29.1 -15.0 -12.7 -14.5 -5.9Monopolies (Indipendent companies); Fire brigades 24.7 29.0 26.0 -24.5 -5.9 -2.6 -4.9 16.7Prime minister staff ….. ….. ….. ….. ….. ….. ….. …..Regions and local autonomies 27.7 84.7 36.7 -6.5 19.4 72.8 27.8 12.7gouvernment Provinces ….. ….. ….. ….. ….. ….. ….. …..School and A.F.A.M. 9.8 318.7 20.8 27.9 40.4 435.5 54.5 55.3National Health Service 35.9 5.6 27.7 -0.9 34.7 4.7 26.6 48.8Universities 20.7 35.4 22.8 67.6 102.2 127.0 105.8 41.0Town clerks ….. ….. ….. ….. ….. ….. ….. …..Total with employment contract 23.7 46.3 27.4 12.3 38.8 64.3 43.0 44.4
DIVISIONS WITHOUT EMPLOYMENT CONTRACT
Diplomatic career 58.9 197.0 74.1 10.4 75.5 228.0 92.3 86.2Penitentiary career ….. ….. ….. ….. ….. ….. ….. …..Prefectorial career 96.3 85.7 93.3 -14.3 68.2 59.2 65.6 99.9Police force 22.0 65.1 35.9 74.4 112.7 187.9 137.0 41.5Army and other armed forces 24.4 48.0 30.8 -56.8 -46.3 -36.0 -43.5 50.2The magistracy 39.2 27.6 37.9 6.7 48.5 36.1 47.1 47.9Total without employment contract 20.1 65.7 32.8 -6.8 11.9 54.3 23.7 45.4TOTAL 23.2 47.9 27.7 9.2 34.5 61.6 39.5 44.5ANNUAL AVERAGE 3.3 6.8 4.0 1.3 4.9 8.8 5.6 6.4Total with employment contract 3.4 6.6 3.9
Total without employment contract 2.9 9.4 4.7"Private" 3.1 1.7 5.2
Source: CER on data of Ragioneria Generale dello Stato (2008)

77
TOLO DA TROVARE???? WAGE BARGAINING IN ITALY Wage bargaining regulations for the Public Sector The contract model launched by the Agreement of July 1993 provided for the adjustment of the private sector’s contractual model to the public one. In this way, the legislator aimed at improving efficiency, streamlining costs and giving more autonomy to managers, in order to efficiently achieve the goals that every structure of the Public Administration was aiming for. The reform of 1993 sought to draw from the «industrial model» the rules for relations with trade unions, although in the public sector the dialogue between government and unions was possible only through specific regulatory precepts. Essentially the 1993 Agreement gave a more prominent role to the collective national negotiation (CCNL). To this end it was decided to create an independent negotiation agency for public administrations (ARAN), which had the task of negotiating the level of wages and regulatory conditions of employment for most areas of the Public Administration sector. Wage bargaining in the Public Administration covers two levels of bargaining, with different purposes and which affect two components of wages: the fixed component and the ancillary one. The fixed component of wages is determined by first-level bargaining, which is undertaken at a national and centralized level. This component is based on three elements: the professional positioning (basic salary), the supplementary allowances and individual seniority pay. The ancillary wage component is determined through second-level bargaining, which integrates national bargaining and is regulated within each compartment of Public Administration. The ancillary wage thus determined includes benefits, bonuses for individual performance quality and for the improvement of collective productivity. The ARAN negotiates the first level of bargaining only for CC. The determination of wages for CC is accomplished through the confrontation of ARAN with trade unions. The renewal of the contract covers both the economic part (every two years) and the rules and regulations (every four years). For government funded public administrations resources are found in the national budget within the document for economic and financial planning (DPEF), while remaining public administrations are funded through their own budgets, according to the financial details of the DPEF. Every time an agreement is reached for a renewal of the national contract between ARAN, trade unions, workers and category committees, this must be counter approved by the Court of Auditors for the economic par. Only after this will it become definitive. A different matter are CNC which are not subject to contractual forms such as the armed forces whose contract is implemented by Presidential Decree after consultation. The subjects of second level or integrative negotiation are outlined in the CCNL. The second-level bargaining covers those components of the salary that concern: - Productivity; - Any indemnities, including those related to danger or damages in the ordinary course of 'employment; - Equal opportunities; - Staff training; - The quality of work; - Employee professionalism. Resources for integrative bargaining are all placed in a single fund. This single Fund is characterized mainly by: - Autonomy of usage irrespective of sources; - The introduction of funding channels not subject to any ceiling; - The establishment of careers constituted by horizontal career paths rather than vertical. Differences between public and private contractual bargaining There are two levels of negotiation in the private sector: the national level and the integrative one. The national collective negotiation is national Industry-wide bargaining. The Industry-wide Collective Agreement (CCNL) is renewed every four years for the legislative part and every two years for the economic one.
78
There must be no overlap and no repeat negotiation between first and second level bargaining, this means that the determination of the basic salary or qualifications must be treated exclusively only in one of the two levels. Three months before the expiry of the economic part a term must be set for presenting the industry-wide bargaining platforms. During this period all parties must refrain from any form of initiative. Once the economic part of CCNL has expired, if within three months the parties have not yet reached an agreement, the salary will be guaranteed by an amount equal to 30 percent of the TIP, which will become 50 percent after six months. The fixed increases set by collective national bargaining are meant to safeguard purchase power, with a readjustment phase after two years from signing the contract, if the planned forecasts diverge from the effective inflation. The CCNL sets the subjects and rules for integrative bargaining; the CCNL lasts for four years. Integrative bargaining can be developed both at company or territorial level, as long as such bargaining is contemplated by the CCNL. The resources to be used for salary increase resulting from integrative or second level bargaining are subject to the amount that each company sets aside for this goal. Salary increases resulting from integrative bargaining are determined in accordance with agreements reached between the elected representatives within the business and the organizations that stipulated the collective national agreement. The wages, subject to integrative bargaining, should cover increases in productivity, product quality and company profits. The framework agreement on the reform of contractual arrangements On 22nd January 2009 the Government and the social partners, except Cgil, came to define a new experimental agreement, which substitutes the agreement in force since July 1993, concerning the rules and procedures for negotiation and management of collective bargaining. The bargaining model orders the regulations for both the public and the private sector, it confirms the two level bargaining and outlines a three year long harmonization of the normative and economic part. Between the end of the contract and its subsequent renewal a mechanism is established that recognizes an economic cover, which will be determined in the individual collective agreements. The wage will be linked to a forecast index built on the basis of the consumer price index harmonized with Europe for Italy (IPCA) minus the prices of imported energy. The preparation of the forecast will be entrusted to a third party. However a readjustment is foreseen between forecast and real rate of inflation. Within the national bargaining further forms of bilateralism may be defined for the functioning of supplementary welfare services. Second level of bargaining is also harmonized to three years It is strengthened with the aim of «increasing, structure and render accessible all measures designed to stimulate, in terms of reduction of taxes and contributions, integrative bargaining. By linking economic incentives to the achievement of productivity goals, profitability, quality, efficiency, effectiveness and other elements to improve competitiveness and performance linked to economic trends of enterprises». Second-level bargaining is exercised over matters delegated, in whole or in part, by the national contract or by law and should cover matters and institutions that have not been previously negotiated in other levels of bargaining. In order to increase the spread of second-level bargaining in small to medium enterprises, «the specific agreements may, depending on size, provide special terms and conditions such as the adoption of economic guarantees or similar forms, to the extent and to the conditions agreed in the national contracts, with particular regards to situations of economic or productive difficulty». «To govern both territorially and in terms of industry, crisis situations or to promote economic development and employment, the specific agreements may define special procedures, terms and conditions to modify, all or part of, even experimentally or temporally, single financial institutes or rules of Industry-wide national agreements» In the public sector, the definition of the calculation of resources scheduled for wage increases will be entrusted to the competent ministries, after consultation with the unions, in compliance within the limits of programming provided by the Financial budget, assuming the real IPCA index, minus the cost of imported energy products, as a benchmark for the identification of the forecast index, which is applied on a basis of calculation made from pay items and maintained unchanged for the three years of planning.

79
The verification of any deviations will be made on expiry of the three-year contract, after comparison with the social partners, with the aim of recovering any difference within the next three years, taking into account the effective trends of salaries for the entire industry. As regards to the measures to favour the development of the second-level bargaining in the public sector, the fiscal incentive will be given gradually and according to the constraints of public finance, with bonuses linked to the achievement of quantified targets for improvement in productivity and quality of services offered; a ulterior aim of the social partners is to reduce and simplify the number of Industry-wide national agreements in the various departments.

80
In the public sector recovery must take into account the real trends of full wages for the entire sector. This means that it is sufficient for one section of the Public Administration to have an increase in differential of full salaries, causing the average full salary for the entire sector to go above the forecast index, and consequently conditions for recovery of the inflation differential will be lacking. This hypothesis is very likely, as wage increases in the public administration are very high within some areas of CNC for example, from 1999 to 2006 the unitary salaries of the Prefecture career increased by 12 percent annually. The framework agreement between different Trade Unions would seem to be going towards a containment of the dynamics of ULC, both in the private and in the public sector. And the separation of wage setting rules in the private and public sectors is likely to strengthen the tradable sectors wage lead and therefore reduce the deviation of Italian wages from the Euro-average. But the wage bargaining process still has a weak institutional link to European developments or institutions.

81
Europe’s energy efficiency t the present moment, Europe is rightly preoccupied with restoring economic growth. Ecological considerations have been pushed into the background. Nevertheless, the crisis is also an opportunity to redirect investment into more energy efficient modes of production. President Obama has started policies to reduce external energy dependency of the United States and, if successful, this will transform the power relations in world politics. Europe has agreed a political agenda to achieve its core energy objectives of sustainability, competitiveness and security of supply, by reducing greenhouse gas emissions by 20 per cent, increasing the share of renewables in the energy consumption to 20 per cent and improving energy efficiency by 20 per cent, all of it by 2020. According to the European Commission, this agenda means substantial change in Europe's energy system over the coming years, with public authorities, energy regulators, infrastructure operators, the energy industry and citizens all actively involved. It means choices and investments during a time of much change in global energy markets and international relations (39). In this chapter, we look at the potential for improving energy efficiency within the European Union. Energy intensity The total amount of energy consumed by a country depends on its economic dimension as well on its economic structure, i.e. the weight of different branch of activities. Indeed, there exist industrial sectors, which are characterized by an intensive use of energy. Another relevant factor which affects the energy needs of a given country is the population density, because as lower the density the bigger are the mean distances within the country and therefore the higher will be freight costs. Moreover, energy needs are affected by the climate of the area where the country is located which influences the extent of residential energy uses. Due to these facts, the overall energy uses of a given country cannot be considered an ideal indicator of its industrial development or, for a given level of development, as an indicator of energy efficiency use. As results from figure 22, on the basis of data published by the Energy Information Administration of USA, in year 2006 USA has been the biggest consumer of energy, with a total consumption of about 100 quadrillion of British Termal Units (40). In Europe, Germany has recorded the highest figure, with a consumption of about 15 quadrillion of BTU, followed by France (11 trillion), United Kingdom (10 trillion) and Italy (8 trillion). When normalized to population (figure 23), in Europe energy consumption is at its highest level in Luxembourg, Belgium, Netherlands and the Nordic Countries, where the average individual yearly consumption of energy is equal or higher than 250 million BTU per person. The average energy consumption is significantly lower in the rest of Europe and quotes its minimum value in southern countries where the per capita energy consumption is comprised between 100 and 150 million BTU per person.
(39) See http://ec.europa.eu/energy/strategies/2008/doc/2008_11_ser2/strategic_energy_review_memo.pdf (40) A British Termal Unit (BTU thereafter, is the amount of heat required to raise the temperature of one pound of water from 60° to 61° Fahreneit degrees at a constant pressure of one atmosphere; 1 quadrillion = 1015 BTU.
ENERGY POLICY
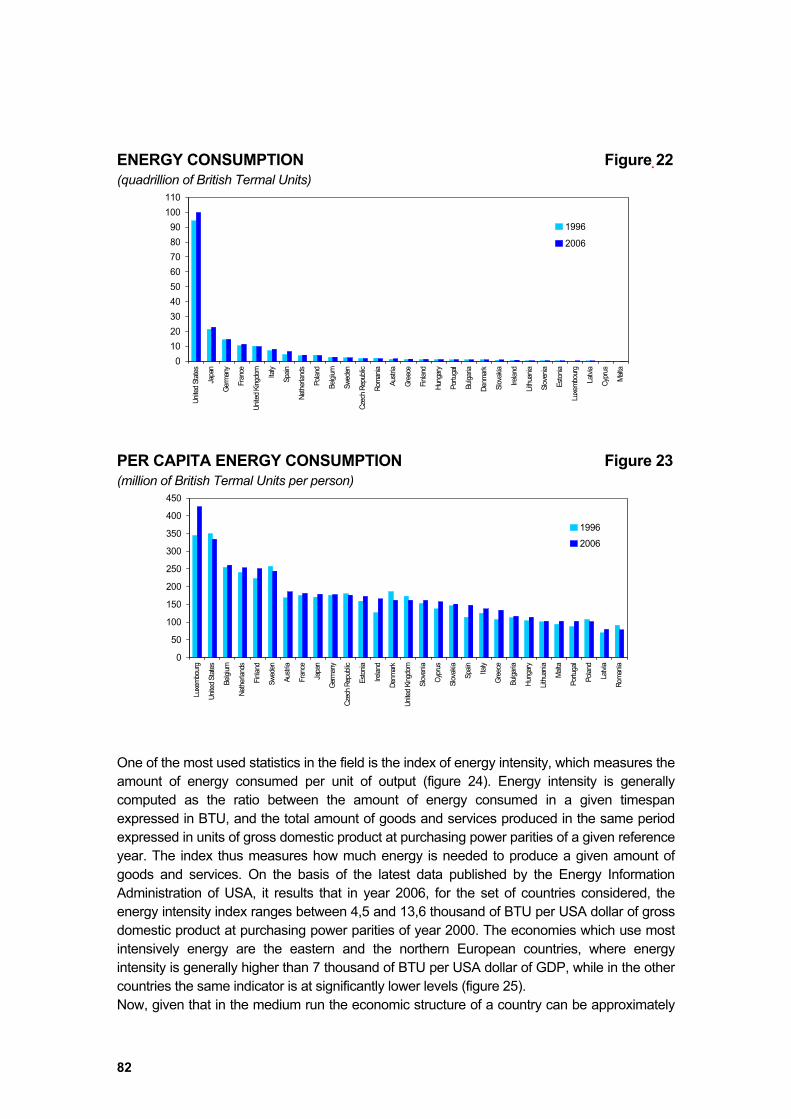
82
ENERGY CONSUMPTION Figure 22 (quadrillion of British Termal Units)
0102030405060708090
100110
Unite
d Stat
es
Japa
n
Germ
any
Fran
ce
Unite
d King
dom
Italy
Spain
Nethe
rland
s
Polan
d
Belgi
um
Swed
en
Czec
h Rep
ublic
Roma
nia
Austr
ia
Gree
ce
Finlan
d
Hung
ary
Portu
gal
Bulga
ria
Denm
ark
Slov
akia
Irelan
d
Lithu
ania
Slov
enia
Eston
ia
Luxe
mbou
rg
Latvi
a
Cypr
us
Malta
19962006
PER CAPITA ENERGY CONSUMPTION Figure 23 (million of British Termal Units per person)
0
50
100
150
200
250
300
350
400
450
Luxe
mbou
rg
Unite
d Stat
es
Belgi
um
Nethe
rland
s
Finlan
d
Swed
en
Austr
ia
Fran
ce
Japa
n
Germ
any
Czec
h Rep
ublic
Eston
ia
Irelan
d
Denm
ark
Unite
d King
dom
Slov
enia
Cypr
us
Slov
akia
Spain Italy
Gree
ce
Bulga
ria
Hung
ary
Lithu
ania
Malta
Portu
gal
Polan
d
Latvi
a
Roma
nia
19962006
One of the most used statistics in the field is the index of energy intensity, which measures the amount of energy consumed per unit of output (figure 24). Energy intensity is generally computed as the ratio between the amount of energy consumed in a given timespan expressed in BTU, and the total amount of goods and services produced in the same period expressed in units of gross domestic product at purchasing power parities of a given reference year. The index thus measures how much energy is needed to produce a given amount of goods and services. On the basis of the latest data published by the Energy Information Administration of USA, it results that in year 2006, for the set of countries considered, the energy intensity index ranges between 4,5 and 13,6 thousand of BTU per USA dollar of gross domestic product at purchasing power parities of year 2000. The economies which use most intensively energy are the eastern and the northern European countries, where energy intensity is generally higher than 7 thousand of BTU per USA dollar of GDP, while in the other countries the same indicator is at significantly lower levels (figure 25). Now, given that in the medium run the economic structure of a country can be approximately

83
ENERGY INTENSITY Figure 24 (British Termal Units per USD of GDP at purchasing power parities of year 2000)
02.0004.0006.0008.000
10.00012.00014.00016.00018.00020.00022.00024.000
Bulga
ria
Eston
ia
Slov
akia
Czec
h Rep
ublic
Finlan
d
Belgi
um
Unite
d Stat
es
Roma
nia
Swed
en
Nethe
rland
s
Polan
d
Lithu
ania
Slov
enia
Malta
Hung
ary
Cypr
us
Luxe
mbou
rg
Fran
ce
Japa
n
Germ
any
Spain
Austr
ia
Latvi
a
Gree
ce
Portu
gal
Italy
Denm
ark
Unite
d King
dom
Irelan
d
1996
2006
ENERGY INTENSITY CHANGE Figure 25 (percentage change in period 1996- 2006)
-55-50-45-40-35-30-25-20-15-10-50
Eston
ia
Latvi
a
Lithu
ania
Polan
d
Roma
nia
Bulga
ria
Slov
akia
Hung
ary
Slov
enia
Swed
en
Irelan
d
Denm
ark
Czec
h Rep
ublic
Unite
d King
dom
Unite
d Stat
es
Finlan
d
Luxe
mbou
rg
Belgi
um
Nethe
rland
s
Gree
ce
Fran
ce
Germ
any
Austr
ia
Malta
Cypr
us
Japa
n
Italy
Portu
gal
Spain
considered constant, the ten year change in the energy intensity index can be considered an indicator for efficiency gains in the use of energy. Indeed, the lower the energy intensity of a given country, the higher will be the efficiency of energy use and viceversa. All the considered countries have experienced a reduction in the energy intensity index in the period 1996-2006, i.e. have recorded an increase of efficiency in the use of energy at an aggregate macroeconomic level. Notwithstanding, our cross-country comparison shows that the efficiency gain has been dramatically different among countries. Indeed, highest efficiency gains between 1996 and 2006 have been recorded by Eastern European countries which used energy most intensively at the beginning of the sample; Sweden, Ireland, Denmark and the United Kingdom have registered a reduction in the index of about 25 per cent. A significant reduction in the same indicator, comprised between 20 and 10 percentage points, has been also recorded in USA, Finland, Belgium, Netherlands, Greece, France, Germany and Austria. In other countries the efficiency gain has been lower; Italy, Portugal and Spain have not recordered any significant reduction of energy needs relative to their production level in the timespan considered.

84
PRIMARY ENERGY CONSUMPTION BY SOURCE Table 14 (as a percentage of domestic energy consumption)
Oil Natural gas Coal Nuclear HydroeletricWorld 35.6% 23.8% 28.6% 5.6% 6.4%Usa 39.9% 25.2% 24.3% 8.1% 2.4%European Union 40.4% 24.9% 18.2% 12.1% 4.4%Japan 44.2% 15.7% 24.2% 12.2% 3.7%Germany 36.2% 23.9% 27.7% 10.2% 2.0%France 35.8% 14.8% 4.7% 39.1% 5.6%United Kingdom 36.2% 38.1% 18.1% 6.5% 1.0%Italy 46.4% 39.0% 9.7% 0.0% 4.9%Spain 52.4% 21.0% 13.4% 8.3% 4.9%Poland 25.7% 13.1% 60.5% 0.0% 0.7%Netherlands 52.9% 36.4% 9.6% 1.0% 0.0%Belgium & Luxembourg 56.1% 20.7% 7.6% 14.8% 0.8%Sweden 33.5% 1.9% 4.4% 30.4% 29.9%Czech Republic 22.9% 18.5% 43.6% 13.7% 1.3%Romania 27.2% 37.1% 22.7% 4.0% 9.1%Greece 63.5% 10.6% 23.7% 0.0% 2.2%Austria 41.5% 24.6% 9.8% 0.0% 24.1%Finland 38.7% 13.3% 16.6% 19.7% 11.6%Hungary 31.3% 43.4% 11.8% 13.6% 0.0%Portugal 60.1% 16.3% 13.8% 0.0% 9.8%Bulgaria 26.5% 13.7% 39.6% 16.2% 4.0%Denmark 51.4% 22.6% 26.0% 0.0% 0.0%Slovakia 21.6% 30.1% 22.7% 19.8% 5.9%Ireland 62.6% 28.5% 7.1% 0.0% 1.7%Lithuania 32.2% 37.9% 2.7% 24.7% 2.4%Source: British Petroleum, data on Cyprus, Estonia, Malta, Latvia and Slovenia are not available Energy sources It is also important to consider the impact of different energy sources across Europe i.e., the weight of different processes of energy generation in the set of considered countries. For example, British Petroleum publishes data on energy consumption by state disaggregated by the fuel; the available public dataset distinguishes between oil, natural gas, coal, nuclear energy and hydroelectric (table 14) (41). According to the latest available data, which refer to year 2007, Oil is the principal source of energy across the countries members of the European Union, as in the rest of the world. Within the European Union, oil guarantees 40 per cent of overall energy needs; the second source of energy in order of importance is natural gas which covers, on average, a quarter of the overall use of energy; its incidence is high in all the countries of the Union apart from Sweden. The remaining energy needs are covered by Coal, Nuclear power generation and from Hydroelectric power generation with patterns wich vary significantly from country to country. Coal is still an important energy source in many countries of the Union, especially in the eastern European countries and in Germany, United Kingdom, Greece and Denmark. (41) In the statistics published by British Petroleum are not included as fuels wood, peat, animal wastes, wind, geothermal and sloar power generation.

85
A PANEL MODEL FOR ENERGY INTENSITY Table 15
Dependent Variable: LOG(Energy/Gross Domestic Product)Method: Pooled Least SquaresSample (adjusted): 1980 2006Included observations: 27 after adjustmentsCross-sections included: 17Total pool (balanced) observations: 459
Variable Coefficient Std. Error t-Statistic Prob. C 0.8 0.4 1.8 0.077LOG(Gross Domestic Product/Population) 1.7 0.3 6.5 0.000LOG(Gross Domestic Product/Population)2 -0.3 0.0 -7.4 0.000LOG(Population/Area) 0.6 0.0 15.9 0.000LOG(Population/Area)2 0.1 0.0 16.9 0.000LOG(Temperature)2 0.0 0.0 -7.2 0.000Employment share of agriculture -3.1 0.2 -16.1 0.000Employment share of manufacturing -4.7 0.2 -19.6 0.000Employment share of energy and water 62.6 5.9 10.6 0.000Employment share of construction 3.9 0.4 10.3 0.000
R-squared 0.83 Mean dependent variabl 2.03Adjusted R-squared 0.82 S.D. dependent variable 0.26S.E. of regression 0.11 Akaike info criterion -1.48Sum squared residuals 5.23 Schwarz criterion -1.16Log likelihood 375.66 Hannan-Quinn criterion -1.35F-statistic 60.49 Durbin-Watson statistic 0.09Prob(F-statistic) 0.00
Nuclear power generation has a minor incidence, but it generally covers an important fraction of domestic energy needs where it has been developed like in France, Sweden, Finland, Belgium. Lastly, hydroelectric power generation has an high incidence in the overall domestic energy generation process in Sweden, Austria, Finland, Portugal and Romania, while it is less important in the remaining countries of the Union. A panel model for Energy Intensity In the preceding paragraph we have seen that intertemporal and cross country comparisons in the field of energy uses generally focus on the index of Energy Intensity, that is the amount of energy needed to produce, on average, one unit of output. In the following we estimate an econometric model for Energy Intensity within a panel approach in order to identify the main determinants of energy needs of a given country and to assess its relative weights. Given that some relevant variable is not available for all the countries considered in the preceding

86
DISTANCE FROM THE THEORETICAL MODEL Table 16 2002-2006
Ranking Difference from the predicted energy intensity
Ireland 1 -21.4%Denmark 2 -16.1%UNK 3 -15.7%Japan 4 -8.8%Sweden 5 -6.0%Germany 6 -4.5%France 7 -2.8%Finland 8 -2.6%The Netherland 9 0.9%United States 10 3.0%Greece 11 4.7%Italy 12 8.5%Luxembourg 13 9.0%Spain 14 11.0%Belgium 15 11.8%Austria 16 13.9%Portugal 17 28.0% paragraph, we have chosen to focus on the following countries: Austria, Belgium, Denmark, Finland, France, Germany, Greece, Ireland, Italy, Japan, Luxembourg, Netherlands, Portugal, Spain, Sweden, United Kingdom and United States. The econometric analysis relative to the period 1980-2006 has led to the identification of a model without individual effects, but with time period fixed effects, where energy intensity of a given country is a function of many geographical and economic factors (table 15). In details, it has been found that energy intensity as measured by the ratio between Energy Consumption in quadrillion of British Termal Units and Gross Domestic Product (GDP) at purchasing power parities in dollar of year 2000 is positively related at the ratio of GDP to population and it is negatively related to the square of per capita GDP. Moreover, energy intensity is positively related to the population density measured by the ratio of total population to the area of the country in squared kilometers and it is also related to the square of the population density. The econometric analysis has also found that energy intensity is negatively related to the square of average yearly temperature measured in the capital of the country. As additional control variables have been added employment quotas in Agriculture, in the Manufacturing, in the Energy and in the Construction sectors. The model explains more than 80 per cent of overall variance and it has been employed to provide a theoretical energy intensity value. From the analysis of the difference of the observed value and its theoretical counterpart (table 16, figure 26) we observe that at the end of the considered timespan, there are significant differences in the energy intensity among countries. The country who uses energy in the best way seems to be Ireland where at the beginning of the Eighties the use of energy was in line with other countries and in the first half of this decade the energy intensity index was more than 20 percentage points lower of what implied by the model. Significant increases in the efficiency degree of energy uses have been achieved during the timespan considered also by Denmark, United Kingdom and Sweden

87
RESIDUALS OF THE PANEL MODEL FOR ENERGY INTENSITY Figure 26
-.2
-.1
.0
.1
.2
1980 1985 1990 1995 2000 2005
_AUT Residuals
-.12
-.08
-.04
.00
.04
.08
.12
.16
1980 1985 1990 1995 2000 2005
_BEL Residuals
-.3
-.2
-.1
.0
.1
.2
1980 1985 1990 1995 2000 2005
_DEN Residuals
-.12
-.08
-.04
.00
.04
.08
.12
1980 1985 1990 1995 2000 2005
_FIN Residuals
-.12
-.08
-.04
.00
.04
.08
.12
1 98 0 1985 1990 1995 2000 2 00 5
_FRA Residuals
-.2
-.1
.0
.1
.2
.3
1980 1985 1990 1995 2000 2005
_GER Residuals
-.4
-.3
-.2
-.1
.0
.1
.2
1980 1985 1990 1995 2000 2005
_GRC Residuals
-.3
-.2
-.1
.0
.1
.2
1980 1985 1990 1995 2000 2005
_IRE Residuals
-.12
-.08
-.04
.00
.04
.08
.12
1980 1985 1990 1995 2000 2005
_ITA Residuals
-.3
-.2
-.1
.0
.1
.2
1 98 0 1985 1990 1995 2000 2 00 5
_JPN Residuals
-.2
-.1
.0
.1
.2
.3
1980 1985 1990 1995 2000 2005
_LUX Residuals
-.12
-.08
-.04
.00
.04
.08
.12
1980 1985 1990 1995 2000 2005
_NDL Residuals
-.3
-.2
-.1
.0
.1
.2
.3
1980 1985 1990 1995 2000 2005
_POR Residuals
-.15
-.10
-.05
.00
.05
.10
.15
1980 1985 1990 1995 2000 2005
_SPA Res iduals
-.12
-.08
-.04
.00
.04
.08
.12
1 98 0 1985 1990 1995 2000 2 00 5
_SWE Residuals
-.2
-.1
.0
.1
.2
1980 1985 1990 1995 2000 2005
_UNK Residuals
-.12
-.08
-.04
.00
.04
.08
.12
1980 1985 1990 1995 2000 2005
_USA Residuals
who are currently positioned among the most efficient countries in the use of energy, while it results that Japan is structurally characterized by lower need of energy with respect to other countries. At the opposite, it has been found that countries such as Austria, Belgium, Greece, Italy, Spain and Portugal have significantly worsened their relative position during the timespan considered and are currently characterized by an energy intensity index significantly higher than the theoretical value implied by the estimated panel model.

88
Bibliography Adalet, M. 2005. Fundamentals, Capital Flows and Capital Flight: The German Banking Crisis of 1931; http://www.ata.boun.edu.tr/ehes/Istanbul%20Conference%20Papers-%20May%202005/adalet.pdf Afonso, A., W. Ebert, L. Schuknecht and M. Thöne, 2005. Quality of Public Finances and Growth. ECB Working Paper Series No. 438 / February 2005 Baldwin, R. 1989. On the Growth Effects of 1992. NBER Working Paper 3119 Baldwin, R. 1993. On the Measurement of Dynamic Effects of Integration; Empirica 20: 129-145. Bank of England, 2008. Financial Stability Report, October 2008 Barro, R. J., 1974. Are Government Bonds Net Wealth? Journal of Political Economy 82.6.1095-1117 Barth, James R., R. Dan Brumbaugh Jr., James A. Wilcox, 2000. The Repeal of Glass-Steagall and the Advent of Broad Banking; The Journal of Economic Perspectives, Vol. 14. 2:191-204 (Spring) Bean, Charles, 2006. Globalisation and Inflation; Bank of England Quarterly Bulletin Q4:468-475 www.bankofengland.co.uk/publications/speeches/2006/speech287.pdf. Berlin, I. 2008 (1958). Two Concepts of Liberty; in: Isaiah Berlin: Liberty, ed. by Henry Hardy, Oxford University Press Bernanke, B. S. 2005. The Global Savings Glut and the U.S. Current Account Deficit; download: http://www.federalreserve.gov/boarddocs/speeches/2005/200503102/ Bernanke, B. S. and V. S. Reinhart, 2004. Conducting monetary Policy at Very Low Short-Term Interest Rates.; http://www.federalreserve.gov/boarddocs/speeches/2004/200401033/default.htm Bratkowski, A. and Rostowski, J. 2001. “Unilateral Adoption of the Euro by EU Applicant Countries: The Macroeconomic Aspects”, in: Orlowski, L. (ed.), Transition and Growth in Post-Communist Countries: The 10 Year Experience, pp. 125-47. Buiter, W. 2009. The unfortunate uselessness of most “state of the art” academic monetary economics. http://blogs.ft.com/maverecon/2009/03/the-unfortunate-uselessness-of-most-state-of-the-art-academic-monetary-economics/ Cecchini, P. 1988. The European Challenge:1992. The Benefits of a Single Market; Wildwood House, Aldershot CER, (Centro Europa Ricerche), 2008, Rapporto 4, Roma Collignon, S. 2002. Monetary Stability in Europe; Routledge, London and New York Collignon, S. 2006. Adjusting the U.S. Current Account Deficit: What Role for the Dollar, Euro and Yen? In: Journal of Asia-Pacific Business, Vol. 7(2) 2006 Collignon, S. 2008. Monetary Mercantilism and Economic Growth in East Asia; Paper presented at Harvard conference, Kuala Lumpur Collignon, S. 2009. Wage developments in Euroland or: the Failure of the Macroeconomic Dialogue; CER Discussion Paper Collignon, S. 2003. The European Republic. The Federal Trust, London. Download: http://www.stefancollignon.de/PDF/The%20European%20Republic-text1.pdf De Larosière, J. 2009. The High-Level Group on Financial Supervision in the EU. Bruxelles Dunaway, S. 2009. Global Imbalances and the Financial Crisis. Council for Foreign Relations. Special Report, No 44, March Edwards, J. and K. Fischer, 1994. Banks, Finance and Investment in Germany Cambridge University Press

89
Eichengreen, B., 2008, Origins and Responses to the Current Crisis, CESinfo Forum 4/2008 Esping Andersen, 1990. The Three Worlds of Welfare Capitalism. Cambridge: Polity Press & Princeton: Princeton University Press, European Commission, 2009. Quarterly Report on the Euro Area, Vol 8, No. 1; Brussels Flood, M. D., 1991. An Introduction to Complete Markets; Federal bank reserve of St. Louis, mars/april Friedman, M. 1987. The essence of Friedman. Leuber K. R. (ed.). Hoover Institution Press, Stanford University, California. Goodhart, C.A.E.1989. Money, Information and Uncertainty. Macmillan Education Ltd (2nd ed.), London. Hall, Peter, and David Soskice, eds. 2001. Varieties of Capitalism: the institutional foundations of comparative advantage. New York: Oxford University Press. Hellwig, M. 2008. The Causes of the Financial Crisis; CESinfo Forum 4/2008 Italianer, A. 1994. Whither the Gains from European Economic Integration? Revue économique, 45. 3: 689-702 Kindleberger, 1984. The Financial History of Western Europe; George Allen & Unwin, London Knight, Frank H., 1921. Risk, Uncertainty, and Profit; Boston, MA: Hart, Schaffner & Marx Kraay, A. 2000. Household Savings in China, World Bank Economic Review, September Lewis, W. Arthur (1954). “Economic Development with Unlimited Supplies of Labor,” Manchester School of Economic and Social Studies, Vol. 22, pp. 139-91. Loser, C. M. 2009. Global Financial Turmoil and Emerging Market Economies: Major Contagion and a Shocking Loss of Wealth? Asian Development Bank (ADB), Manila Mahbubani, K. 2009. Be quick Europe, or miss out on the Asian century; Europe’ World, Spring 2009. http://www.europesworld.org/NewEnglish/Home/Article/tabid/191/ArticleType/ArticleView/ArticleID/21345/BequickEuropeormissoutontheAsiancentury.aspx Mayr, J. 2008. The Financial Crisis in Japan – Are There Similarities to the Current Situation? CESinfo Forum 4/2008 Popper, K. 1995: The Open Society and its Enemies. Routledge, London. Ranis, G. 2004. Arthur Lewis’ contribution to development thinking and policy; Yale University Economic Growth Center Discussion Paper No. 891 http://www.econ.yale.edu/~egcenter/ Savona, P. e C. Viviani, 2003. Gli Effetti sullo sviluppo reale del Patto die stabiltà et crescita: automatismo o discrezionalità; Economia Italiana, N.2 Maggio-Agosto Sopart, D. 2005 A state-of-art literature report on Varieties of Capitalism approach. NEZ, Munster, 25.01.2005. Download: http://nez.uni-muenster.de/download/Literaturbericht_Dominik%20mit%20Deckblatt.pdf Trichet, J.-C. 2009. Introductory statement with Q&A, Press conference 5 March 2009 www.ecb.int/press/pressconf/2009/html/is090305.en.html Turner, A. 2009. The Turner Review. A regulatory response to the global banking crisis; FSA, March 2009, London Vitols, S. ,1998. Are German Banks different? Small Business Economics 10: 79–91