Embed Size (px)
Citation preview
CENTRO AGRONÓMICO TROPICAL
DE INVESTIGACIÓN Y ENSEÑANZA
GRADUATE SCHOOL
The influence of habitat complexity and landscape context on the
biodiversity conservation value of cacao agroforests in Waslala,
Nicaragua
by
Boris Miguel Arevalo Jimenez
Thesis submitted for consideration to the Graduate School
As a requirement for the degree of
Master of Science in Management and Conservation of Tropical Forests and
Biodiversity
Turrialba, Costa Rica, 2010

II

III
DEDICATORY
To my parents
and all cacao growers of Waslala

IV
ACKNOWLEDGEMENTS
I would like to acknowledge with great pleasure all people and organizations mention below
for their assistance and support. I know that saying thank you is not enough for all the help
given to me but indeed I say to you all, many thanks. If I miss anyone, I deeply apologize.
My deepest gratitude to my dearest family for always supporting and encouraging me to
continue with my studies, thank you Mom and Dad, without your support I would not be here.
Thank YOU for making me believe in myself.
My appreciation to Fabrice DeClerck, for his patience while reviewing my many thesis drafts,
above all for his constructive criticism in how to improve my work; Thanks for the
conversations during the mornings of bird banding where we had time to discuss much of the
results and for making me go a step further, many thanks, Fabrice.
To Olivier Deheuvels and Sergio Velásquez, for the time you took to review my work and for
always being open to hear my concerns and helped me clear my doubts.
To Diego Delgado for reviewing and commenting on my work, for the times we had those
conversations based on the many facets of how to measure biodiversity and for being there
and listening to me as a friend.
I am in debt with you, Marvin Benito Zeledon, for all the time spent with me in the field, no
matter if it was sunny or rainy, for being my motorcycle buddy and for the many good
conversations and advices you gave to me will on our way to those difficult to reach sampling
sites.
To Sergio Vilchez, for your help, patience and experience in statistics and for always taking
me out of my doubts in regards to the statistical analyses.
To Don Rogelio Perez Zamora, for helping me with transportation, without that help it would
have been impossible to conclude my field work.
A sincere thank you to all cacao growers who without knowing me were willing to participate
in this study and for sharing a plate of food and a cup of coffee with me: Efraín Gómez
González, Jose Victor Raudez Jarquín, Rosa Aura López Méndez, Candido Duarte Mercado,
Francisco Arostegui Castillo, Migdalia Jerónima Rodríguez Lara, Virgilio Herrera, Ana
Cointa Castro Zamora, Oscar Espinoza Ortega, José Ernesto Ortega Orozco, Sotero Sevilla
Castro, Eulalio Martínez Ochoa, Rosendo Sánchez Hernández, Isabel Centeno Rodríguez,
Margarito Gómez López, Jorge Olivas Ocampo, Santos Blandón González, Crecencio
Hernández Páez, Rogelio Pérez Zamora, Riman López Martínez, Reynaldo Cantarero, Rafael
Gómez, José, Ramón Orozco González, Orlando Orozco González, Reynaldo Cantarero, Noel
Suazo Calderón, Aurelio Mendoza Rodriguez, Sixto Mendoza Hernández, Matías, Mendoza
Hernández, Lizandro Flores Luna, Presentación Hernández, Benito Díaz Zeledón, Etanislao

V
Blandón Montenegro, Julio Figueroa Días, Francisco Cordero, Natividad García Ochoa, Isidro
Granado Montoya, Maria Saba Garcia Dávila, Tomasa Montoya, Margarito Gómez López,
Nelson Figueroa.
Very special thanks to Marjorie Cristina Diaz Lopez, for being with me in the good and in the
not so good times and for always lending me a hand when I was in need; thanks for your
understanding, I love YOU.
Many thanks, Byron Molinares Zeledon for allowing me to use your herpetofauna data; to
Daniel Chavarria Saenz, Ana Yakarely Alaniz, Aura Matey Centeno, Merling and Lesther, for
being kind in sharing some of your botanical data and for your hard work while establishing
the sampling unit network, your help is highly appreciated.
My deepest gratitude to Wilber Martinez, from Birds without Borders, Belize, for kindly
donating binoculars for this study.
To Wilfredo “El Doctor Willy” Chavez, for the many times we spent talking about almost
every topic of life and for always being willing to help, many thanks my friend, Willy.
Alejandra Martinez thanks for the constructive comments you gave in how to improve my
work and for reviewing my data.
To Grimaldo Soto for sharing his knowledge on herpetofauna with me.
Luis Orozco, I appreciate the help you gave me and made my stay in Waslala more pleasant,
thanks.
Proyecto Cacao Centroamérica (PCC), for allowing me to use your field equipment, many
thanks.
To all my “Boscosos” friends, thanks for sharing nice moments together and for being tolerant
with my comments during many classes.
Floriana Hernandez and Celestino Sandoval, for the good chats we had during our meal times,
which made me reflect on many aspects of my academic life, thank you a lot.

VI
BIOGRAPHY
Boris Miguel Arevalo Jimenez was born in Belize. He obtained a Bachelor of Science from
the University of Belize in 2005, with a major in Biology. During the past four years he
worked as an environmental consultant for organizations such as Belize Environmental
Consultancies Ltd. and Belize Tropical Forest Studies. Major tasks included environmental
impact assessments, biological inventories, rapid ecological assessments and the development
of protected areas‟ management plans. During the last two years he has distributed his time
between being an environmental consultant and a tour guide, guiding expeditions for scientists
interesting in the natural history of Belize, especially for the collection of flora specimens.
The author has participated in various workshops related to Belize‟s natural resources
management and sustainable development. In 2009, he initiated his postgraduate studies at the
Tropical Agronomical Centre for Investigation and Higher Education (CATIE), obtaining a
Master‟s degree in Management and Conservation of Tropical Forests and Biodiversity in
2010.

VII
TABLE OF CONTENTS
DEDICATORY ...................................................................................................................... III
ACKNOWLEDGEMENTS .................................................................................................... IV
BIOGRAPHY ......................................................................................................................... VI
TABLE OF CONTENTS ...................................................................................................... VII
RESUMEN ............................................................................................................................. IX
SUMMARY ............................................................................................................................ XI
TABLE INDEX ................................................................................................................... XIII
FIGURE INDEX ................................................................................................................. XVI
ABBREVIATIONS AND ACRONYMS .......................................................................... XVIII
1 INTRODUCTION ........................................................................................................... 1
1.1 Study objectives .......................................................................................................... 2
1.1.1 General objective .................................................................................................. 2
1.1.2 Specific objectives ................................................................................................. 3
1.2 Study hypothesis ......................................................................................................... 3
2 LITERATURE REVIEW ................................................................................................ 4
2.1 Community ecology .................................................................................................... 4
2.1.1 The Theory of the Island Biogeography ............................................................... 4
2.1.2 Habitat heterogeneity and cacao agroforests ....................................................... 5
2.1.3 Landscape spatial configuration and heterogeneity ............................................. 6
2.1.4 Landscape fragmentation ..................................................................................... 6
2.1.5 The Matrix effect ................................................................................................... 7
2.2 Ecological consequences of habitat fragmentation ..................................................... 8
2.3 Cacao agroforests ........................................................................................................ 9 2.4 Cacao agroforests in Mesoamerica ............................................................................. 9 2.5 The conservation value of cacao agroforestry systems ............................................ 10 2.6 Avian diversity in cacao agroforestry systems ......................................................... 11
2.7 Cacao agroforests‟ and landscapes‟ context role in herpetofauna conservation ...... 12
3 METHODOLOGY ........................................................................................................ 14
3.1 Site description ......................................................................................................... 14 3.2 Cacao agroforest selection ........................................................................................ 16
3.2.1 Habitat structural and floristic complexity ......................................................... 16

VIII
3.2.2 Cacao agroforestry types based on structural parameters ................................ 17
3.3 Landscape characterization ....................................................................................... 17
3.4 Characterization of avian and herpetofauna communities ........................................ 19
3.4.1 Avian communities characterization .................................................................. 19
3.4.2 Characterization of herpetofauna communities ................................................. 20
3.4.3 Avian composition ............................................................................................... 21
3.4.4 Avian and herpetofauna composition and diversity within each habitat............ 22
3.4.5 Avian and herpetofauna richness, abundance and diversity comparison between
habitats ----------------------------------------------------------------------------------------------23
3.4.6 Avian and herpetofauna community relationship with habitat complexity and
landscape context. ............................................................................................................. 24
4 RESULTS ...................................................................................................................... 26
4.1 Landscape characterization ....................................................................................... 26
4.1.1 Relationship between avian and herpetofauna communities with landscape
metrics ----------------------------------------------------------------------------------------------26
4.2 General description of habitats studied ..................................................................... 27
4.3 Bird, amphibian and reptile community composition .............................................. 30
4.3.1 Bird, amphibian and reptile community composition description ...................... 30
4.3.2 Comparison of bird, amphibian and reptile communities among habitats studied-
---------------------------------------------------------------------------------------------------------35
4.3.3 Relationship between bird and herpetofauna communities with habitat structural
and floristic composition. ................................................................................................. 47
5 DISCUSSION ................................................................................................................ 54
5.1 The effect of the landscape context on avian and herpetofauna diversity ................ 54 5.2 Habitat comparison ................................................................................................... 57 5.3 Avian and herpetofauna community comparison in cacao agroforests and secondary
forest remnants ...................................................................................................................... 57 5.4 Effects of habitat structure and composition on avian and herpetofauna diversity .. 60
6 CONCLUSIONS ........................................................................................................... 63
7 RECOMMENDATIONS FOR THE CONSERVATION AND MANAGEMENT OF
AVIAN AND HERPETOFAUNA DIVERSITY ...................................................................... 65
8 REFERENCES .............................................................................................................. 67
ANNEXES .............................................................................................................................. 76

IX
RESUMEN
Arevalo, BM. 2010. The influence of habitat complexity and landscape context on the
biodiversity conservation value of cacao agroforests in Waslala, Nicaragua. Thesis Mag. Sc.
CATIE, Turrialba, CR. 88 p.
La deforestación de los bosques naturales ha conllevado a investigar el papel que juegan los
agroecosistemas en la conservación de la biodiversidad. Cultivos agrícolas bajo sombra, como
los sistemas agroforestales de cacao, se ven prometedoras en la conservación de la
biodiversidad en matrices agrícolas. El objetivo de la investigación fue evaluar dos elementos
críticos para la conservación de la biodiversidad: complejidad de hábitat y contexto
paisajístico. Comprobamos el impacto tanto independiente como en conjunto de estos
elementos sobre la avifauna y herpetofauna registrada en los sistemas agroforestales de cacao
en Waslala, Nicaragua.
Para examinar el efecto de estructura de hábitat y contexto paisajístico, muestreamos 36
cacaotales y 6 fragmentos de bosque secundario, cuales se utilizaron como hábitat de
referencia. Nosotros medimos la composición botánica y estructura de hábitat utilizando
parcelas de 20 × 50 m. Utilizando las variables de composición botánica y estructura de
hábitat se identificaron tres tipologías de los sistemas agroforestales de cacao, mediante un
análisis de conglomerados. Estas tipologías se clasificaron en un gradiente de complejidad de
hábitat, yendo de lo más simple a lo más complejo: cacao-banano, cacao dos-estratos y cacao
diversificado.
El contexto paisajístico y su efecto sobre la biodiversidad, se analizo a diferentes escalas,
utilizando “buffers” con radios de 500, 1000, 1500, 2000, 2500 y 3000 metros, donde se
cuantifico la cobertura forestal. Caracterizamos la avifauna utilizando puntos de conteo con
radios fijos de 25 m. Nosotros muestreamos la herpetofauna basados en la metodología de
Whitfield.
Se observaron un total de 2914 aves perteneciendo a 174 especies, 195 anfibios de 12 especies
y 258 reptiles perteneciendo a 19 especies. De las 174 especies de aves, 158 fueron

X
registradas en los cacaotales, mientras que las 12 especies de anfibios y 18 de las 19 especies
de reptiles fueron registradas en los cacaotales. Se registro la mayor riqueza de aves en el
cacao diversificado (34.92 ± 1.75) que en cacao-banano (25.5 ± 2.57) y cacao dos-estratos
(29.18 ± 1.53), mientras que los bosques secundarios registraron una riqueza intermedia. La
riqueza (F = 0.66, p = 0.5847) y abundancia (F = 1.59, p = 0.2087) de anfibios no varió entre
las tipologías. Registramos diferencias significativas para la riqueza (F = 3.29, p = 0.0315) de
reptiles pero no para la abundancia (F=2.52, p = 0.0735). Mayor riqueza de reptiles se registro
en cacao-banano y bosques secundarios, mientras que en el cacao diversificado se registro la
menor riqueza. El análisis de similitud indico diferencias significativas en base a la
composición de especies de aves (r = 0.3111, p = 0.00009990), anfibios (r = 0.1147, p =
0.047395) y reptiles (r= 0.157, p = 0.015998). Sin embargo las diferencias fueron distintas
para cada taxón. Riqueza y abundancia de árboles e índice de estructura vertical (índice de
Thiollay) fueron los mejores predictores de la riqueza y abundancia de aves; mientras que la
riqueza y abundancia de anfibios tuvo una relación negativa con el porcentaje de suelo
desnudo. La riqueza de reptiles no fue explicada por las variables de composición y estructura
de hábitat; sin embargo la abundancia obtuvo una relación positiva con la abundancia de
Musaceae y presencia del sotobosque. Las métricas de paisaje fueron ineficientes en explicar
la riqueza, abundancia y diversidad de aves, anfibios y reptiles. Esto puede ser a consecuencia
del alto grado de fragmentación y homogeneidad del paisaje.
El presente estudio demuestra el valor de conservación de la biodiversidad que juegan los
sistemas agroforestales de cacao complejos en estructura y composición botánica, pero
enfatiza la idea que no son substitutos de los bosques naturales ya que no proveen los recursos
necesarios para especies especialistas de bosque. Esto fue evidente ya que los bosques
registraron la mayor riqueza de aves especialistas de bosque.
Palabras claves: biodiversidad, sistemas agroforestales de cacao, avifauna, herpetofauna,
fragmentación, paisaje

XI
SUMMARY
Arevalo, BM. 2010. The influence of habitat complexity and landscape context on the
biodiversity conservation value of cacao agroforests in Waslala, Nicaragua. Thesis Mag. Sc.
CATIE, Turrialba, CR. 88 p.
The rapid rate of deforestation and its implications on biodiversity conservation has lead to
investigate the role that agroecosystems play in biodiversity conservation. Shaded crops, such
as cacao agroforestry systems, are promising anthropogenic habitats for biodiversity
conservation within an agricultural matrix. The objective of this study was to examine the
effect of two critical elements for biodiversity conservation in agricultural landscapes: habitat
structural complexity and landscape context. We tested the independent and combined impacts
of these effects on birds, amphibians, and reptiles found in cacao agroforestry systems of
Waslala, Nicaragua.
To examine the effect of habitat structure and landscape context, we sampled 36 cacao
systems and 6 secondary forest fragments, used as reference systems. We measured habitat
floristic and structural complexity using a 20 × 50 m quadrant and identified three agroforestry
systems utilizing habitat floristic and structural complexity variables through a cluster
analyzes. These systems can be classified along a gradient of complexity going from
structurally simple to diverse systems: Cacao-Banana, Two-Strata Cacao and Diversified
Cacao agroforests.
To test the effect of landscape context on biodiversity conservation, we measured the
proportion of secondary forest cover at six different radii from the sample point: 500, 1000,
1500, 2000, 2500 and 3000 meters. We characterized avian community composition using 25
m fix radius point counts. We sampled the herpetofauna by following Whitfield‟s
methodology.
During the study, we observe a total of 2914 birds belonging to 174 species, 195 amphibians
from 12 species and 258 reptiles from 19 species in all habitats. Of the total 174 bird species
recorded, 158 occurred within cacao agroforests, while the 12 of the amphibian species and 18

XII
of the 19 reptile species recorded were found within cacao systems. We recorded the greatest
mean bird richness in Diversified Cacao systems (34.92 ± 1.75) than in both Cacao-Banana
(25.5 ± 2.57) and the Two-Strata (29.18 ± 1.53) systems, while Secondary Forest had an
intermediate richness. Amphibian mean richness (F = 0.66, p = 0.5847) and abundance (F =
1.59, p = 0.2087) showed no significant difference among treatments; while reptile mean
richness was significantly different among treatments (F = 3.29, p = 0.0315) but not for
abundance (F=2.52, p = 0.0735). Greatest mean reptile richness occurred in both cacao-banana
systems and secondary forests, while diversified cacao systems had the lowest mean richness.
Global ANOSIM results showed significant differences for bird (r = 0.3111, p = 0.00009990),
amphibian (r = 0.1147, p = 0.047395) and reptile (r= 0.157, p = 0.015998) species
composition among habitats. However, these differences differed by taxa. Tree richness,
abundance and vertical structure complexity index (Thiollay‟s Vegetation Index) were best
predictors of bird richness and abundance, while amphibian richness and abundance were
negatively related to percentage of bare ground. Reptile richness did not respond to any
habitat variable measured, while abundance had a positive relationship with understory cover
and Musaceae abundance. On the other hand the landscape metrics calculated were not
efficient in explaining bird, amphibian and reptile species richness, abundance and diversity.
This may result as a consequence of landscape homogeneity and high degree of forest
fragmentation.
This study shows the biodiversity conservation value of floristic and structural complex cacao
agroforestry systems but stress the idea that such habitats are no substitute to natural forests as
they fall short in providing habitat and food resource to most forest affiliated species. This
was evident as secondary forests supported greatest richness and abundance of forest specialist
birds.
Key words: biodiversity, cacao agroforests, avifauna, herpetofauna, fragmentation, landscape

XIII
TABLE INDEX
Table 1. Description of the landscape metrics calculated using the software Fragstat 3.3 for
each of the established buffers around each sampling unit. ............................................. 18
Table 2. Guild classification schemes used to study avian composition supported by cacao
agroforests. ........................................................................................................................ 22
Table 3. Diversity indices measured and their respective formula and description. ................ 23
Table 4. Mean plus standard deviation, minimum, maximum and coefficient of variance (CV)
values by buffer for the landscape metrics calculated. Note: distance to water body was
calculated once .................................................................................................................. 27
Table 5. Mean comparison of the environmental variables measured in the 42 sampling units
utilized to construct the dendrogram. (Cacao-Banana Agroforest (n = 6), Two-Strata
Cacao Agroforest (n = 17), Diversified Cacao Agroforest (n = 13), Secondary Forest (n =
6)). ..................................................................................................................................... 30
Table 6. Observed and estimated bird, amphibian and reptile richness and sampling efficiency
by habitat (Cacao-Banana Agroforest (n = 6), Two-Strata Cacao Agroforest (n = 17),
Diversified Cacao Agroforest (n = 13), Secondary Forest (n = 4)). Estimated species
richness was calculated using Clench‟s Model; while percentage sampling efficiency was
calculated using observed and estimated richness.**for birds S_For, n=6 ...................... 35
Table 7. Mean species richness, abundance and diversity index for the bird, amphibian and
reptile communities recorded in 42 sampling units in Waslala, Nicaragua. (Cacao-Banana
Agroforest (n = 6), Two-Strata Cacao Agroforest (n = 17), Diversified Cacao Agroforest
(n = 13), Secondary forest (n = 6)). Different letters indicate significant difference (p <
0.05). * = variable was rank transformed. ........................................................................ 36
Table 8. Mean comparison of preferred foraging strata for species richness and abundance of
bird recorded in 42 sampling units in Waslala, Nicaragua. (Cacao-Banana agroforest (n =
6), Two-Strata Cacao agroforest (n = 17), Diversified Cacao agroforest (n = 13),
Secondary Forest (n = 6)). Different letters indicate significant difference (p < 0.05). .. 38

XIV
Table 9. Mean comparison of avian dietary guilds. (C_B_AF = Cacao-Banana Agroforest (n =
6), S_C_AF = Two-Strata Cacao Agroforest (n = 17), D_C_AF = Diversified Cacao
Agroforest (n = 13), S _For (n = 4)). ................................................................................ 39
Table 10. Observed and estimated richness and sampling efficiency for birds‟ degree of forest
dependence (Cacao-Banana Agroforest (n = 6), Two-strata Cacao Agroforest (n = 17),
Diversified Cacao Agroforest (n = 13), Secondary forest (n = 6)). Estimated species
richness was calculated using Clench‟s Model; while percentage sampling efficiency was
calculated using observed and estimated richness ............................................................ 40
Table 11. Mean comparison for degree of forest dependence for species richness and
abundance of bird recorded in 42 sampling units in Waslala, Nicaragua. (Cacao-Banana
agroforest (n = 6), Two-Strata Cacao agroforest (n = 17), Diversified Cacao agroforest (n
= 13), Secondary forest (n = 6)). Different letters indicate significant difference (p <
0.05).* = variable values were rank transformed. ............................................................. 41
Table 12. Observed and estimated bird richness and sampling efficiency for degree of
sensitivity to human disturbances (Cacao-Banana agroforest (n = 6), Two-Strata Cacao
agroforest (n = 17), D_C_AF = Diversified Cacao agroforest (n = 13), Secondary forest
(n = 6)). Estimated species richness was calculated using Clench‟s Model; while
percentage sampling efficiency was calculated using observed and estimated richness .. 43
Table 13. Mean comparison of the degree of sensitivity to human disturbances for species
richness and abundance of bird recorded in 42 sampling units in Waslala, Nicaragua.
(Cacao-Banana agroforest (n = 6), Two-Strata Cacao agroforest (n = 17), Diversified
Cacao agroforest (n = 13), Secondary forest (n = 6)). Different letters indicate significant
difference (p < 0.05). * = variable was rank transformed................................................. 44
Table 14. Pair wise ANOSIM results for bird, amphibian and reptile species composition
based on 10,000 permutations utilizing Bray-Curtis distance. ......................................... 44
Table 15. Indicator species analysis based on bird abundance for the four different habitats. 45
Table 16. Indicator species analysis based on amphibian abundance for the four different
habitats. ............................................................................................................................. 46
Table 17. Indicator species analysis based on reptile abundance for the four different habitats
.......................................................................................................................................... 46

XV
Table 18. Simple linear regressions for bird richness, abundance, diversity index and evenness
with habitat variables, regressor variables shown are those with statistical significance. *
= dependant variable was squared root transformed. ....................................................... 48
Table 19. Habitat variables that had a significant relationship with herpetofauna richness and
abundance based on the results obtained from the generalized linear models. ................ 49
Table 20. Habitat variables that had a significant relationship with degree of forest dependence
for bird species richness and abundance based on results obtained from simple linear
regression models. * = dependent variable was square root transformed. ...................... 50
Table 22. Mulivariate regressions for bird food guilds based on bird richness with habitat
variables, regressor variables shown are those with statistical significance. * = dependant
variable was squared root transformed. ............................................................................ 51
Table 23. Spearman Correlation Analysis between bird composition and habitat structural and
compositional variables. ................................................................................................... 52
Table 24. Pearson‟s Correlation Analysis between amphibian species composition and habitat
structural and compositional variables. ............................................................................ 53
Table 25. Pearson‟s Correlation Analysis between reptile species composition and habitat
structural and compositional variables. ............................................................................ 53

XVI
FIGURE INDEX
Figure 1. Land use map of Waslala, Nicaragua. ....................................................................... 15
Figure 2. Design of the spatial arrangement of concentric circles (buffers) around each
sampling unit (blue dot), where landscape metrics were calculated. ................................ 18
Figure 3. Sampling plot design, doted circle represents the point counts; grid represents the
sampling parcels (20 m × 50 m) used for structural complexity and floristic composition
measures for each site; red star represents center point of study site; green polygon
represents cacao field; filled black dot represents the location of sampling parcel within
the cacao field. .................................................................................................................. 20
Figure 4. Representation of herpetofauna sampling plot design; grid = vegetation sampling
plot; filled red squares = 5 m × 5m herpetofauna survey sub-parcels; filled red dot =
central point of sampling plot. .......................................................................................... 20
Figure 5. Dendrogram showing the four habitat types obtained through the cluster analysis of
habitat structural and compositional variables for the 42 sampling units in Waslala,
Nicaragua. ......................................................................................................................... 28
Figure 6. Biplot of the four habitat typologies in association with the habitat structural and
compositional variables. ................................................................................................... 29
Figure 7. Composition of bird (n = 34), amphibian (n = 6) and reptile (n = 6) families based on
the number of species recorded for each, in Waslala, Nicaragua. .................................... 31
Figure 8. Bird, amphibian and reptile Rank-Abundance Curves for the four habitats studied in
Waslala, Nicaragua (C_B_AF = Cacao-Banana Agroforest (n = 6), S_C_AF = Two-
Strata Cacao Agroforest (n = 17), D_C_AF = Diversified Cacao Agroforest (n = 13), S
_For (n = 4)). **note for birds S-For, n = 6 ..................................................................... 33
Figure 9. Birds‟, amphibians‟ and reptiles‟ Rarefaction curve and respective confidence
intervals for the four habitats studied in Waslala, Nicaragua (C_B_AF = Cacao-Banana
Agroforest (n = 6), S_C_AF = Two-strata Cacao Agroforest (n = 17), D_C_AF =
Diversified Cacao Agroforest (n = 13), S _For (n = 4)).** note for birds S-For, n = 6. .. 34

XVII
Figure 10. Status for species richness and abundance mean comparisons for bird communities
recorded in 42 sampling units in Waslala, Nicaragua. (C_B_AF = Cacao-Banana
agroforest (n = 6), S_C_AF = Two-Strata Cacao agroforest (n = 17), D_C_AF =
Diversified Cacao agroforest (n = 13), S _For (n = 6)). Different letters indicate
significant difference (p < 0.05) ....................................................................................... 37
Figure 11. Mean comparison of amphibian and reptile abundance on different habitat strata.
(C_B_AF = Cacao-Banana Agroforest (n = 6), S_C_AF = Two-Strata Cacao Agroforest
(n = 17), D_C_AF = Diversified Cacao Agroforest (n = 13), S _For (n = 4)). Different
letters indicate significant difference (p < 0.05); * = variables were ranked transformed.
.......................................................................................................................................... 39
Figure 13. Rarefaction Curves with confidence intervals based on abundance for birds‟ degree
of forest dependence (C_B_AF = Cacao-Banana Agroforest (n = 6), S_C_AF = Two-
strata Cacao Agroforest (n = 17), D_C_AF = Diversified Cacao Agroforest (n = 13), S
_For (n = 6)). ..................................................................................................................... 41
Figure 14. Species rarefaction curve with confidence intervals for birds degree of sensitivity to
human disturbances (C_B_AF = Cacao-Banana Agroforest (n = 6), S_C_AF = Two-
Strata Cacao Agroforest (n = 17), D_C_AF = Diversified Cacao Agroforest (n = 13), S
_For (n = 6)). ..................................................................................................................... 43

XVIII
ABBREVIATIONS AND ACRONYMS
AIC: Akaike‟s Information Criterion
AFS: Agroforestry System
ANOSIM: Analysis of Similarity
ANOVA: Analysis of Variance
CATIE: Centro Agronómico Tropical De Investigación y Enseñanza
cm: centimetre
DBH: diameter at breast height
ETM+: Enhance Thematic Mapper Plus
GLM: Generalized Linear Model
ha: hectare
IUCN: International Union for the Conservation of Nature
Km: kilometre
m: metre
m.a.s.l.: metres above sea level
MANOVA: Multivariate Variance Analysis
MEA: Millennium Ecosystem Assessment
PCA: Principal Component Analysis
PCC: Proyecto Cacao Centroamérica

1
1 INTRODUCTION
Anthropogenic activities are fundamentally, and to a significant extent irreversibly causing
biodiversity loss (Bennett 2004; McNeely and Scherr 2008). These changes have been
occurring more rapidly in the past 50 years than at any other time in human history. The
drivers responsible for this biodiversity loss accompanied by the concomitant change in
ecosystems‟ services are indicating a steady increase with no indications of a decline (MEA
2005; Butchart et al. 2010). This has lead to a rapid rate of deforestation resulting in a race
among conservationists to protect remaining forest remnants that are increasingly being
isolated by an expanding agricultural matrix (Reitsma et al. 2001). These trends have led a
growing number of scientists to investigate the role that agroecosystems play in providing
habitat for tropical organisms (Lindell et al. 2004; Dahlquist et al. 2007; Cassano et al. 2009).
Within tropical agricultural landscapes, there is significant amount of area managed as
agroforestry systems (SAF). These systems are characterized by a diverse structural
complexity, providing critical resources (food and habitat) necessary for the conservation of
many varieties of biodiversity (Alcorn 1990; Perfecto et al. 1996). Although evidence
suggests that these systems are not a substitute for natural forests (Rice and Greenberg 2000;
Butchart et al. 2010; Milder et al. 2010), these economically important anthropogenic habitats
are gaining increasing conservation value with the continued deforestation of tropical forest
(Pimentel et al. 1992; Cassano et al. 2009). Shaded agroforests, such as cacao SAF, provide
habitat for some forest dependent species (Greenberg et al. 2000; Rice and Greenberg 2000;
Greenberg 2008; Cassano et al. 2009) but their conservation value has been questioned due to
their local scale of occurrence and because they essentially provide habitat and food for more
generalized species (McNeely and Scherr 2008). Thus it is essential to understand which
attributes contribute to conservation of forest dependent species.
Some biodiversity studies in cacao AFS show that biodiversity can be substantially higher
than in other non-shaded agricultural systems even supporting some forest dependent species
(Greenberg et al. 2000; Reitsma et al. 2001; Philpott et al. 2004; Cassano et al. 2009). Cacao
agroforests vary in their structural and botanical complexity, two factors that play an important

2
role in determining their conservational value (Reitsma et al. 2001; Harvey and Gonzalez
Villalobos 2007; Deheuvels et al. in Prep.). Many studies to date have confirmed the
importance of plant compositional and structural complexity on biodiversity conservation in
agroforests (Greenberg et al. 2000; Reitsma et al. 2001; Perfecto et al. 2004; Faria et al. 2007;
Clough et al. 2009; Deheuvels et al. in Prep.), however less understood is the contribution of
the greater landscape context (Florian 2005; Ranganathan et al. 2007). In addition, the spatial
context of cacao agroforests in regards to the immediate landscape, particularly their distance
to natural habitats, can determine the level of biodiversity being supported (Ricketts 2001;
Tasser et al. 2009).
Agroforests apart from providing habitat can act as important corridors or stepping stones
particularly if located between forested areas. For example, an agroforest placed between
reserves, or forest patches may contribute to connectivity, or an agroforest adjacent to a forest
may play a buffering role, increasing the core area of the forest patch (Clough et al. 2009),
increasing species permeability in a fragmented and human modified matrix (Murphy and
Lovett-Doust 2004; Umetsu and Pardini 2007). In the island biogeography and
metapopulation theory, a matrix of altered habitats is regarded as homogeneous and
inhospitable (Vandermeer and Carvajal 2001) but recently, several authors have pointed out
that landscape connectivity depends not only on the distance between remnants, but also on
the presence of corridors, stepping stones and on the permeability of the matrix to the
movement and occurrence of species.
The objective of this study is to evaluate and compare the effect that structural complexity and
landscape context has on the conservation value of cacao agroforests in Waslala, Nicaragua.
1.1 Study objectives
1.1.1 General objective
To examine the effect that structural complexity and landscape context has on the
biodiversity conservation value of cacao AFS in Waslala, Nicaragua.

3
1.1.2 Specific objectives
Evaluate the effect that landscape structure and composition has on the ability of cacao
agroforest to maintain biodiversity.
Characterize avian and herpetofauna diversity and composition supported by cacao
agroforest.
Compare avian and herpetofauna diversity among the different habitats studied.
Evaluate the effect that habitat structure and composition has on the ability of cacao
agroforests to support avian and herpetofauna diversity.
1.2 Study hypothesis
The level of biodiversity sustained by cacao agroforests is positively correlated with
the structural complexity of the plantation.
The degree and repartition of forest cover in the landscape has a positive effect on the
degree of biodiversity present in cacao plantations.
An increase in the amount of forest cover in the landscapes have a positive relationship
on the ability of cacao plantation in supporting biodiversity.
4
2 LITERATURE REVIEW
2.1 Community ecology
2.1.1 The Theory of the Island Biogeography
The Theory of Island Biogeography focuses on presence or absence of species in relation to
patch (island) area (MacArthur and Wilson 1967). It suggests that larger islands (patches) are
able to support greater species diversity (MacArthur and Wilson 1967) but decreases with
increasing distance between patches. The theory stresses the role of area and geographical
isolation as the main factor affecting biodiversity by affecting their colonization and extinction
rates (MacArthur et al. 1972).
This idea can be applied to cacao agroforests because these are typically of limited size,
embedded in an agricultural matrix with varying distance from remnant forests, affecting
species richness and population density (McNeely and Scherr 2008). Root (1973) and
MacArthur et al. (1972) propose two hypotheses explaining the relationship between animal
population density and area. The first is the resource concentration hypothesis (Root 1973) and
the second is the density compensation hypothesis (MacArthur et al. 1972). The first
hypothesis suggests that animal population density is greater in larger areas because such areas
are able to sustain higher amounts of critical resources (habitat, food, nesting and roosting site)
than smaller parches (Root 1973). In contrast, the density compensation hypothesis proposes
that individual species occurring in patches occur at greater densities on smaller patches in
comparison to larger ones, due to the low species richness that can be sustained by these
patches, reducing interspecific competition (MacArthur et al. 1972). The density
compensation hypothesis stresses that larger patches have low population density as a
consequence of high species richness indicating a negative patch area effect on density
(MacArthur et al. 1972).

5
2.1.2 Habitat heterogeneity and cacao agroforests
Cacao agroforests, are considered structurally diverse agricultural habitats able to sustain some
forest dependent species (Greenberg et al. 2000; Reitsma et al. 2001; Faria et al. 2007; Harvey
and Gonzalez Villalobos 2007; Greenberg 2008; Clough et al. 2009). This conservation value
is attributed to the variability in their structural and compositional complexity (Faria et al.
2006; Abrahamczyk et al. 2008). Agroforests maintaining a complex floristic composition,
such as the rustic cacao systems, offer more resources to birds and other animals, than
structurally homogenous habitats (Somarriba and Harvey 2003; Perfecto et al. 2004; Faria et
al. 2007; Harvey and Gonzalez Villalobos 2007; Greenberg 2008). The degree of species
richness supported by structural and floristically heterogeneous cacao agroforests can be
explained by the habitat heterogeneity hypothesis (Cramer and Willig 2005). The hypothesis
suggests that there exists a positive linear effect between habitat structural and floristic
heterogeneity and species diversity due to an increase in the number of niches that can be
filled favouring specialization and decreasing interspecies competition for available resources
(Cramer and Willig 2005; Koh et al. 2006). Greenberg et al. (1995) suggests that maintaining
habitat heterogeneity can be a means of conserving species richness in agricultural landscapes,
allowing high species richness conserves both forest dependent and generalist species (Laiolo
2002).
Plant species diversity and density determine the physical structure of terrestrial habitats
having an impact on the distribution and interactions of fauna (Cramer and Willig 2005; Koh
et al. 2006). In this regard it is important to acknowledge the conservation value of many
cacao agroforests due to their structural and floristic complexity within agricultural dominated
landscapes (Schroth and Harvey 2007). MacArthur (1955) found that habitat structural
complexity is more important than its floristic composition in maintaining forest bird
diversity. However we must be critical in drawing conclusions on such findings, especially
for cacao agroforests as these vary not only in structural and floristic composition but as well
in their spatial distribution within the landscape, as what is perceived to be adequate habitat
for one species may be perceived as habitat fragmentation for another species (Tews et al.
2004).

6
2.1.3 Landscape spatial configuration and heterogeneity
Landscape spatial configuration is defined as the specific arrangement of spatial elements or
patch structure in the landscape (Turner et al. 2001). Configuration has implications on the
conservation value of a landscape (Chardon et al. 2003). In highly fragmented landscapes
species‟ survival rates are determined by their ability to disperse thus maintaining structural
connectivity between remnant patches lowers the extinction risk of wild populations (Bennett
2004; Schroth and Harvey 2007). Connectivity of habitat patches within a landscape has
therefore become a key issue in biodiversity conservation.
Habitat spatial heterogeneity has been recognized as an important factor in animal population
dynamics (O'Neill et al. 1988; McGarigal and Cushman 2005; Castilla et al. 2009; Fraterrigo
et al. 2009). These authors argue that although theoretical studies have suggested that space is
a critical factor affecting species distribution and existence, spatial models indicate that patch
configuration influences population dynamics. Spatial configurations of habitat can affect
population dynamics by altering the likelihood that organisms will locate and gain access to
patches suitable for occupancy (Wiens et al. 1993; Fahrig 2003). Because colonization is
controlled by organisms‟ mobility, patch isolation as a consequence of fragmentation can be
detrimental to the persistence of dispersal-limited species (Fraterrigo et al. 2009). An
understanding of the processes driving species richness and of the scales at which they operate
is crucial for conserving biodiversity in agricultural landscapes (Dauber et al. 2005).
2.1.4 Landscape fragmentation
Fragmentation and loss of natural habitats are of global concerns due to negative implications
on biodiversity conservation (Lauga and Joachim 1992; Wiens et al. 1993; Fraterrigo et al.
2009). Anthropogenic activities have modified the natural environment to the point that the
most common landscape is a mosaic of human settlements, farmlands and fragmented natural
ecosystems surrounding protected areas (Cox et al. 2004; Fitz-Gibbon et al. 2007). As is the
case for Waslala, habitat fragmentation has been so great that presently it has a pastureland
matrix, where natural forests represent only 11 to 15% of the total land cover (CATIE 2009).

7
Habitat fragmentation is an active and dynamic process resulting in the reduction in size and
isolation of natural systems over time (Cox et al. 2004). According to Bennett (2004) and Cox
et al. (2004), “fragmentation” is defined as the changes that occur when contiguous natural
habitats are broken into small and scattered remnants. Fragmentation begins as a gap
surrounded by natural vegetation, which has little effect on species composition, structure and
richness but as the gap size and degree of isolation between remnants increase, natural
communities become heavily impacted causing conservation concerns (Ritters et al. 1997;
Ritters et al. 2000; Fitz-Gibbon et al. 2007).
According to Bennett (2004), fragmentation is characterized by: a) loss of natural habitat in
the landscape, b) natural habitat size reduction, c) isolation of habitat fragments and, d) human
use of the matrix surrounding isolated fragments increase and intensified. This process leads
to the formation of marked edges (abrupt transitions between natural vegetation and adjacent
altered habitat) creating a distinctive contrast in the structural and floristic composition
between different patches (Kupfer et al. 2004; 2006). Marked edges impact species
movement patterns through the landscape affecting species ability to colonize adequate
habitats and by limiting their access to food (Hinsley et al. 1996; Alderman et al. 2005).
2.1.5 The Matrix effect
The landscape‟s matrix refers to the dominant mosaic of land cover including pastures,
croplands, plantations and secondary forests in which remnant forests are isolated from each
other (Umetsu and Pardini 2007). The matrix impacts biodiversity through what is known as
the “matrix effect” acting as a filter for the movement of organisms through the landscape
(Kupfer et al. 2004; 2006).
The matrix in human dominated landscapes were seen as static, homogeneous and
inhospitable acting as an obstacle in landscapes‟ structural and functional connectivity
(Vandermeer and Carvajal 2001) but recently, several authors have pointed out that landscape
connectivity is determined not only by the distance among remnants, but also by the matrix

8
degree of permeability to the movement, occurrence and colonization of species (Murphy and
Lovett-Doust 2004; Umetsu and Pardini 2007). For example, in Waslala this concept is
important because the landscape is dominated by an agricultural matrix that will directly
impact diversity in forest remnants and cacao agroforests as the distance between these
increases.
The matrix influences species diversity (Gascon et al. 1999; Kupfer et al. 2006; Haynes et al.
2007a; Haynes et al. 2007b) by altering their needs through resource depletion (Berry et al.
2005; Haynes et al. 2007a; Haynes et al. 2007b) and by affecting their mobility in the
landscape (Ricketts 2001). However, the matrix is not homogeneous, its characteristics and
impacts on the natural environment are as a consequence of the intensity and extent of the land
uses within it (Umetsu and Pardini 2007). Berry et al. (2005) state that in order to develop
effective and concrete conservation strategies in human dominated landscapes it is essential to
consider both the composition of patches and their configuration within the matrix.
2.2 Ecological consequences of habitat fragmentation
The major impact of fragmentation is species loss due to habitat loss and size reduction (Cox
et al. 2004; Fitz-Gibbon et al. 2007; Moser et al. 2007; Mapelli and Kittlein 2009); larger
fragments conserve greater diversity of flora and fauna compared to small and isolated patches
(MacArthur and Wilson 1967); Kupfer et al. 2004). When species become isolated in a
fragment, their survival depends on fragment size, quality and spatial configuration of
remnants (Brouwers and Newton 2009), species‟ dispersal ability and population dynamics
(Lauga and Joachim 1992; Castelletta et al. 2005).
Reduction in habitat cover, patch size and connectivity have been argued to have negative
effects on tropical forest species (Castelletta et al. 2005; Develey and Metzger 2006) but the
response to these parameters is dependent on species‟ perception of habitat. Uezu et al (2005)
found that frugivorous birds in the fragmented Brazilian Atlantic forest were more affected by
patch size than insectivorous species, being more abundant in interconnected forests. Some

9
authors suggest that forest bird species survival in fragmented landscapes with limited suitable
habitats (less than 30% of habitat cover), depends on the size and structural connectivity
among remaining patches (Andren 1994; Metzger and Decamps 1997; Uezu et al. 2005).
2.3 Cacao agroforests
According to McNeely and Scherr (2008), agroforestry refers to the system of land use in
which harvestable trees or shrubs are grown among or around crops or on pastureland, as a
mean of preserving or enhancing productivity; this is done simultaneously or in a sequential
manner in order to make the best use of the available resources. This concept encompasses a
wide array of practices that include tree polyculture with crops, live fences, shade stripes of
vegetation along water ways, kitchen gardens, and multistory to multispecies home-gardens
(Somarriba and Harvey 2003). Cacao agroforests can be defined as shade grown cacao farms
in which other plants, including timber trees, fruit trees and food crops, are grown together
with cacao (Asare 2006).
2.4 Cacao agroforests in Mesoamerica
In Central America cacao agroforests are in the hands of small indigenous farmers. Cacao
growers under the scope of Proyecto Cacao Centroamérica (PCC) cultivate 7,996 hectares
producing around 1,515 tons of certified cacao, with an aggregated value of 2.12 million U.S.
dollars per year (PCC 2007). These plantations coincide with the Atlantic Mesoamerican
Biological Corridor and with other key biodiversity conservation areas (Somarriba and Harvey
2003). Countries such as Belize, Nicaragua and Panama include cacao production as a
poverty alleviation strategy through the concept of crop diversification (PCC 2007).
According to PCC (2007) cacao agroforests occur at altitudes between 30-900 m above sea
level, with farm size ranging from 0.2 to > 5 ha per farm. Average size is 1 ha. These
agroforestry systems have an average density of 200 to 900 cacao plants per hectare depending
on the country and can contain up to 125-145 tree species in their shade canopy (based on a 25
ha cacao agroforest assessment by country), while average tree density is 122 per ha-1
with a

10
range of 85-198 tress per ha-1
(PCC 2007). Many of these trees additionally serve as sources of
firewood, lumber, medicine and fruits (Somarriba and Harvey 2003). Shade trees are of
varying heights, but are distributed among 50:30:20 % of the total density in three vertical
strata (low strata <10 m; medium strata 10-20 m and high >20 m) (PCC 2007). The cacao
plantations of Nicaragua are among those having greatest tree diversity of all six countries
investigated in the PCC project.
2.5 The conservation value of cacao agroforestry systems
In general, agroecosystems dominate tropical landscapes, where isolated forest remnants are
embedded in an agricultural matrix (Pimentel et al. 1992; Cassano et al. 2009). Many forest
species interact with the surrounding agricultural landscape, especially in agroforestry
systems, where forest dependent species are able to exploit available resources (Abrahamczyk
et al. 2008; Greenberg 2008) but it is important to underscore that agroforests are not
substitutes for natural forests but provide secondary habitats for organisms (Reitsma et al.
2001; Asare 2006; Harvey and Gonzalez Villalobos 2007; Schroth and Harvey 2007; Cassano
et al. 2009). Because of their diverse shade tree composition (PCC 2007), agroforests provide
critical resources for wildlife (Greenberg et al. 2000), they are promoted as conservation tools
especially within biological corridors and in buffer zones of protected areas where they act as
transition zones reducing edge effect and increasing connectivity within the matrix (Bos et al.
2007; McNeely and Scherr 2008; Clough et al. 2009). Although cacao AFS are recognized as
biodiversity friendly agricultural systems it is still uncertain if these agroecosystems provide
adequate forested habitat and sustainable resources or serve as second class habitats increasing
wildlife movement permeability within an otherwise hostile matrix (Faria et al. 2006; Kupfer
et al. 2006; Lozada et al. 2007).
Rustic and highly diverse cacao agroforests are able to support moderated diversity of forest
dependent species, while serving as adequate habitat for more generalists (Greenberg et al.
2000; Rice and Greenberg 2000; Faria et al. 2007). The ability of cacao agroforests to support
forest dependent species is highly dependent to their structural complexity and spatial
11
configuration in regards to forest remnants (Somarriba and Harvey 2003; Harvey and
Gonzalez Villalobos 2007). Greenberg (2008) and Abrahamczyk et al. (2008), support the
idea that cacao agroforests found close to forest fragments support more forest dependent bird
and other animal species than do isolated agroforests. Young (1994), (cited by Faria et al.
2007) makes a similar statement for invertebrates, including cacao pollinators.
2.6 Avian diversity in cacao agroforestry systems
Many avian diversity studies in cacao agroforests have shown substantially greater diversity
than found in other non-shaded agricultural systems that include some forest species
(Greenberg et al. 2000; Reitsma et al. 2001; Perfecto et al. 2004; Faria et al. 2006; Faria et al.
2007; Harvey and Gonzalez Villalobos 2007; Schroth et al. 2007; Cassano et al. 2009).but
support more generalist species. In Mexico Greenberg (2008) found that structurally complex
cacao agroforests and remnant forests share a high proportion of common species, both
resident and migratory, including forest-dependent migrants. This study also coincides with
the results obtained by Robbins et al. (1992) in Belize were the cacao plantations had the most
similar migrant assemblage to natural forest than other agricultural land uses.
In Southeastern Costa Rica, Reitsma et al. (2001), compared avifaunal diversity in forests,
abandoned cacao and managed cacao plantations and reported 130, 131, and 144 total species
respectively. Abandoned and managed cacao had significantly more individual birds than
forest but forest specialists occurred less in cacao plantations. Reitsma et al. (2001) found that
cacao density, canopy height, canopy cover, shade tree abundance and diversity as well as
distance from forest had an effect on forest dependent bird diversity. Clough et al (2009)
conclude that many forest specialists are unlikely to exist in cacao plantations without the
immediate proximity of natural forest. Frugivores and nectivores, generally being forest
specialists, show a remarkable decrease in diversity as distance between cacao agroforests and
remnants increase but not the case for insectivorous (Reitsma et al. 2001; Clough et al. 2009).
12
2.7 Cacao agroforests’ and landscapes’ context role in herpetofauna
conservation
Herpetofauna are important ecological indicators and play a critical role in the demonstrating
the effect of land use change on biodiversity (Bell and Donnelly 2006). Bell and Donnelly
(2006) report that amphibians and reptiles are not severely affected by forest fragmentation as
they reported 75% of forest dependent species in remnants studied. Russell et al. (2002) and
Loehle et al.(2005) suggest that amphibian diversity is more dependent upon the availability
of water bodies in the landscape than on the size and shape of the forest remnants, due to their
unique reproductive requirements. This statement is conclusive with that of Bell and Donnelly
(2006) who state that anuran diversity in a given habitat is highly dependent on the availability
of breeding habitats.
Vallan (2000) suggests that edge effect has negative implications on anuran diversity due to
changes in microclimatic conditions. Consequently, anurans are affected due to their
permeable skin, shell-less eggs and aquatic habitat requirements. This assumption is
contradictory to Dixo and Martins (2008), who found that despite the variation in structure
between forest interior and edge, no significant differences were found in herpetofaunal
abundance, richness and diversity between forest edge and interior.
Limited research has been conducted within cacao agroforests to evaluate their contribution to
herpetofauna conservation (Wanger et al. 2009). It is highly suspected that cacao agroforests
are essential agricultural habitats for the conservation of amphibians and reptiles due to their
high structural diversity. A study conducted by Wanger et al. (2009) in Central Sulawesi,
Indonesia found that 50% of all identified herpetofauna species within cacao AFS were forest
specialists; stressing the important role that cacao agroforests play in the conservation of these
taxa. The investigators conclude that high species diversity is a consequence of the structural
complexity and high degree of fallen logs and thick leaf litter supported by these systems; this
investigation also supports the assumption made by Loehle et al. (2005). Dixo (2001) (cited
by Faria et al. 2007) in his study conducted in Una, Brazil, found no difference in the

13
abundance and species richness of leaf-litter herpetofauna between cacao agroforests and
forest remnants.
Although the conservation value of cacao agroforests is highly dependent on intrinsic habitat
characteristics the landscape context upon which they are found also plays a crucial role in this
matter (Ryan et al. 2002). Research by Faria et al (2007) in cacao agroforests of Bahia, Brazil
indicate that there is higher herpetofaunal diversity in cacao agroforests within a landscape
with limited forest cover but when forest cover increases within the landscape, these
agroecosystems become less important for biodiversity conservation. Overall they report that
81% of the total anuran species and 85% of reptiles reported to occur in forest fragments were
recorded in the cacao agroforests.

14
3 METHODOLOGY
3.1 Site description
We conducted the study in the municipality of Waslala located in the extreme southeast of the
North Atlantic Autonomous Region of Nicaragua. Its geographic centre is 13o20‟ north
latitude and 85o22‟ west longitude, with an extension of 1,333 km
2 and mean altitude of 420 m
above sea level. Waslala has a tropical moist climate with annual temperatures oscillating
between 18 and 26°
C and mean annual precipitation ranging between 2000 and 3000 mm
(CATIE 2009). To the north and east, it is bordered by the municipality of Siuna; to the south
by Rio Blanco and Rancho Grande; and to the west by the municipalities of Cua, Bocay and
Rancho Grande (CATIE 2009). It is found within the buffer zone of BOSAWAS Biosphere
(being one of the largest protected area in Central America with an extension of 20,000 km2,
translating to 14% of the total Nicaraguan territory) and also borders Cerro Banacruz Nature
Reserve. According to the Holdgridge‟s life zone classification system, Waslala can be
classified as very humid subtropical forest, now dominated by a matrix of agricultural lands
with remnant semidecidious broadleaf forests (Figure 1).
Waslala‟s topography characterized as undulating to rolling hills with 32° slopes (Philipp and
Gamboa 2003) making the area unsuitable for agriculture even though most of Waslala‟s
population is engaged in traditional agriculture which consists of the main economic activity
in the region. In recent years cattle ranching have shown a steady increase (Proyecto CATIE-
Mesoterra 2009).

15
Figure 1. Land use map of Waslala, Nicaragua.

16
3.2 Cacao agroforest selection
For this study, we selected a total of 36 cacao agroforests and 6 secondary forest remnants.
These patches were distributed among 16 communities throughout the municipality (Annex 1)
in a sampling network established by the PCC. Criteria use to select the sampling units
included willingness of the proprietor to participate and accessibility to the site. The mean area
of sampled cacao agroforests was1.01 ± 0.55 ha, with a minimum and maximum area of 0.40
and 2.5 ha respectively. Mean area for the forest remnants was 6.84 ha with a minimum and
maximum area of 2.5 and 14.8 ha respectively.
3.2.1 Habitat structural and floristic complexity
We characterize floristic composition by establishing a 20 × 50 m (0.1 ha) sampling parcel in
the “central” point of each cacao plantation. The central point was visually estimated and
selected whether the 0.1 ha plot would fit allowing the maximum distance from the plantation‟s
edge, in order to reduce edge effect. The 0.1 ha sampling unit was subdivided into 10 subunits
each measuring 10 × 10 m. Within each 0.1 ha sampling units, all trees with a diameter ≥ 10 cm
were identified and recorded, dbh and height were measured. All cacao trees were counted,
height was visually estimated and trunk perimeter was measured at 30 cm above ground. All
the above data was collected by undergraduate students working under PCC. Additional
measurements taken included: number of flowering and fruiting trees.
Using the central point of each resulting 10 × 10 m quadrant, we measured percentage canopy
and ground cover. Percentage canopy cover was measured using a spherical densitometer. A
total of 4 readings were taken in each sub-parcel, using the plots‟ cardinal points as references,
from these readings; we used an average as the measured canopy cover for the sampling unit.
We visually estimated ground cover. We achieved this by randomly placing a 1 × 1 m frame at
the “central” point of each of the 10 × 10 m quadrants, then proceeded to estimated percentage
herbaceous, bare ground and leaf-litter cover; an average value was reported for each 0.1 ha
sampling site.

17
Structural vertical heterogeneity was measured using Thiollay‟s (1992) methodology. A mean
value was used for each strata, while the total structural vegetation index was calculated as a
sum of all the mean strata values.
3.2.2 Cacao agroforestry types based on structural parameters
In order to identify different structure types of cacao agroforests, we developed a typology
through a cluster analysis using Wards method with Euclidean Distance calculated based on
habitat structural (leaf litter %, shade %, Thiollay‟s Vertical Structure Index) and compositional
(Weed Cover %, Musaceae abundance and basal area, cacao abundance and basal area, tree
abundance, richness and basal area) variables. We indentified these variables to be explaining
most of the variability among typologies through a Principal Components Analysis (PCA),
where the results were graphed in a biplot to visualize typologies‟ associations with habitat and
structural variables. We tested for statistical difference between habitat typologies by
conducting a Multivariate Variance Analysis (MANOVA).
3.3 Landscape characterization
We characterized the landscapes into two categories, forest and non-forest, by using 7 band
Landsat ETM+, with 30 m resolution, from 2001 and 2005 satellite images. A 2001 image was
used to compensate for the damages found in the 2005 image as a consequence of satellite
failures. We were limited to a bionomial classification because of the image‟s resolution.
Forested areas were those areas possessing forest cover (secondary forest, secondary growth,
dense agroforests), while non-forested areas included areas lacking tall-dense vegetation
(agricultural fields, open and slightly shaded pastures, human settlements). Segregation
between vegetated (forested) from non-vegetated (non Forested) areas was visually achieved
during the manual digitalization of the image.
We converted the Waslala vector map to raster format. We used the buffer extension from
ArcView GIS 3.3 to create nested plots of 500, 1000, 1500, 2000, 2500 and 3000 m radii.
These plots correspond to circular area plots of 78.5, 314.2, 706.5, 1256, 1962.5 and 2826 ha
respectively (Figure 2). We clipped each buffer using the GeoProcessing extension. Once the

18
buffer around each of the 42 plots was clipped, we characterized the landscape within nested
plot by calculating percent forest cover, forest patch density, distance to the nearest forest patch
and mean patch area using a 4 and 8 neighbour rule in Fragstats 3.3 (Table 1). To calculate the
landscape metrics, physical directories were created for each buffer, which were later utilized
to create a “batch file” also a “class property file” was created which had the codes and
description of the land cover types.
We calculated distance from the central point of the sampling units to the nearest forest edge
using a straight line, as this will be the minimum distance to be travelled by an organism
moving for one patch to the next.
Figure 2. Design of the spatial arrangement of concentric circles (buffers) around each
sampling unit (blue dot), where landscape metrics were calculated.
Table 1. Description of the landscape metrics calculated using the software Fragstat 3.3 for
each of the established buffers around each sampling unit.
Landscape variables Description
% forest cover % forest cover found in each buffer
Distance to the nearest forest patch
Distance to the nearest forest patch measured in
straight line from the center of the study plot to
the edge of forest.
Mean patch area Mean area of all forest patches in each buffer.
19
3.4 Characterization of avian and herpetofauna communities
3.4.1 Avian communities characterization
In each of the 42 sampling units, we established a 25 m fixed-radius point count in order to
measure avian diversity. We established the point counts at the center of the plantation for the
cacao agroforests, whereas in the secondary forest fragments these were placed as far from the
forest edge as possible (minimum distance was 70 m). The distance from the edge depended
on the size of the fragments as well as on the topographic conditions of the terrain (Figure 3).
The 25 m fixed-radius point counts are a standard technique for bird surveys in tropical habitats
allowing fast and efficient sampling of avian communities (Wunderle 1994; Ralph et al. 1996).
We visited each point count four times; two visits were conducted during the mornings and two
during the evenings. Point count surveys were conducted for 60 consecutive minutes, starting
five minutes after arrival to the site. To assure its efficiency, the sites were reached as quietly
as possible. The point counts surveys were conducted between 05:30 and 10:00 and for another
60 minutes between 14:30 and 18:30. The total observation time per point count was 120
minutes (60 minutes × 2 times/day × 2 days); giving a total of 240 minutes per site throughout
the study period. For each 60 minute point count the following data were collected: species,
number of individuals of the species, method of detection, location or strata of occurrence,
bird‟s activity and sex if possible. The bird surveys were conducted between the months of
February and June of 2010. Bird species seen or heard flying overhead or flying through the
point counts were recorded in a different data sheet and were not considered in the statistical
analysis of the data. We conducted statistical analysis on bird species richness and abundance
observed within the limits of the point counts.

20
Figure 3. Sampling plot design, doted circle represents the point counts; grid represents the
sampling parcels (20 m × 50 m) used for structural complexity and floristic composition
measures for each site; red star represents center point of study site; green polygon represents
cacao field; filled black dot represents the location of sampling parcel within the cacao field.
3.4.2 Characterization of herpetofauna communities
We used herpetofauna data provided by PCC in this study. Byron Molinares collected these
data. A set of 8 sub-parcels of 5 m × 5m each were located within the 50 m x 20 m grid used
for structure measures. Subplots were separated by a distance of 10 m from each other (Figure
4). He employed an active search in a zigzag pattern searching for reptiles and amphibians in
the leaf litter and on tree trunks up to 2 m height. The surveys were conducted during the
mornings between 9:00 AM to noon, and during the night from 20:00 to 24:00. Four surveys
were conducted, two during the rainy season (November to December, 2009) and two during
the dry season (April to May, 2010). The center of these herpetofauna survey plots were the
same as those used for the avian point counts.
Figure 4. Representation of herpetofauna sampling plot design; grid = vegetation sampling
plot; filled red squares = 5 m × 5m herpetofauna survey sub-parcels; filled red dot = central
point of sampling plot.
21
The sampling design and method was based on Whitfield et al (2007). Field identification of
species was based on morphological characteristics following the field identification guides of
Solórzano (2004) and Savage (2002). Detailed photographs were taken of the individuals that
were difficult to classify for cross reference, and identification in the laboratory.
3.4.3 Avian composition
We classified bird species into guilds (Table 2) according to Stiles (1985), Stotz et al. (1996),
Lee Jones (2003) and Stiles & Skutch (2003). The assignation of species to foraging strata was
based on Philpott et al. (2009). Species categorized as understory foragers are those primarily
reported as foraging on the forest floor and understory; canopy foragers are species that forage
primarily on the middle to upper canopy, while both-strata foragers were species considered to
be aerial foragers or that forage both in the understory and canopy layers. Additionally bird
species were classified into dietary guilds following Stiles and Skutch (2003) and Lee Jones
(2003) as follows: insectivores (species that feed almost exclusively on invertebrates),
frugivores (species that feed more than half of the time on fruits or on the seeds of fruits while
on trees), nectivores (birds that feed more than half the time on nectar), omnivores (birds that
feed on a mixed diet of arthropods, fruits, nectar, or seeds), granivores (birds that feed on
seeds) and carnivores (birds that feed on flesh, such as hawks and owls).
We further categorized birds according to degree of forest dependence based on Stiles (1985).
Species were separated into forest specialist (species exclusively found in forests or that need
of more than 50% forest cover for their survival), forest generalists (species that persist in
fragmented forests with less than 50% forest cover and occur in forest edges, provided that
some canopy trees remain in deforested areas) and generalists (bird species that require no
forest for survival but can persist in secondary growths, thickets, agricultural lands and favour
deforestation). To further investigate the role that cacao agroforest play in the conservation of
birds, we categorized birds into high, medium and low degree of sensitivity to human
disturbances based on Stotz et al. (1996).

22
Table 2. Guild classification schemes used to study avian composition supported by cacao
agroforests.
Strata of
occurrence Foraging Dietary
Forest
dependence
Sensitivity to
human
disturbances
Understory
Middle
canopy
Upper
canopy
Understory
Canopy
Both Strata
Insectivores
Frugivores
Nectivores
Omnivores
Granivores
Carnivores
Forest specialists
Forest generalists
Generalists
Low
Medium
high
3.4.4 Avian and herpetofauna composition and diversity within each habitat
We combined the data collected for birds during the two sampling dates to obtain species
richness and abundance per sampling unit. For each sampling unit species richness (S),
evenness (E), Shannon-Wiener Diversity Index (H), Simpson Index (D) and Margalef Index
(Dmg) were calculated utilizing the statistical program ESTIMATES 8.0 (Colwell 2010) and
InfoStat (Grupo Infostat 2010). The formulas and description of these indexes are explained in
Table 3. We did the same as above with the herpetofauna data.
We constructed rank-abundance curves for each habitat in order to evaluate species abundance
distributions in relation to dominant and rare species. We used rarefaction curves were to
account for differential sampling efforts individually for the avian and herpetofauna studies.
The rarefaction curves were constructed utilizing the Sobs (mao tau) results obtained from the
statistical program EstimateS 8.0 (Colwell 2010). The Clench‟s model (Clench 1979) was
employed in order to estimate the expected number of species in each habitat and to determine
sampling efficiency. To achieve this the Sobs obtained from EstimateS were utilized to do a
non-linear regression in InfoStat, utilizing the Clench‟s Model: S(n) = (a*n) / (1 + (b*n)),
where „S’ denotes species richness, „n’ is the number of samples pooled, a and b are constants;
from the results of this model the intercept of the curve on the „Y‟ axis (a) and slope of the
curve (b) were utilized to calculated expected richness. Estimated species richness by habitat
was obtained by employing the formula:

23
Where:
a = the intercept of the curve on the „Y‟ axis
b = slope of the curve
Table 3. Diversity indices measured and their respective formula and description.
Diversity Index Formula Explanation
Shannon-Wiener
(H’) H’ =
Accounts for the abundance and evenness of species
present. The proportional abundance of species i
divided by the total number of individuals in the
sample (pi) is calculated and multiplied by the natural
logarithm of the proportion (lnpi). The values of H‟
range between 0 and log S.
Simpson Index
(D) D = ∑pi
2
Shows the probability that two species randomly
selected in a sample are of the same species. It takes
into account the representativeness of species with a
higher importance value without evaluating its
contribution to the rest of the species. Where pi =
proportional abundance of specie i.
Evenness (E) E = H’/ln(S)
0 < E < 1
Shows the relationship between the abundance of
each species and how evenly these individuals were
distributed among species. When the value of E is
close to zero (0), means that one specie dominates the
community and when it approaches 1, all species
shared similar abundance.
Margalef Index
(DMg) DMg = (S – 1)/ln(N)
Shows the relationship between the number of
species and the number of individuals. The index
will vary with the number of individuals. Values
closer to zero mean that there are few species. Where
S = # of species and N = total # of individuals.
Source: adapted from Moreno (2001).
We conducted indicator species analysis with PCORD 5.1 (McCune and Mefford 1999) using
Dufrene and Legendre‟s method with 1000 permutations to identify the characteristic species in
each of the habitats studied.
3.4.5 Avian and herpetofauna richness, abundance and diversity comparison between
habitats
To compare mean avian and herpetofauna richness, abundance and diversity among habitats we
used simple ANOVA with LSD Fisher mean comparisons. Variables that did not met the
ANOVA assumptions (independence, normality and variance equity) were rank transformed.
Avian and herpetofauna species richness, abundance, diversity indices (H‟, D‟, DMg and E), in

24
addition the birds foraging and dietary guilds as well as degree of forest dependence and
sensitivity to human disturbances were regarded as dependent variables. We used ANCOVA to
determine if the co-variables (structural and compositional complexity of habitats) affect bird
and herpetofauna abundance, species richness and diversity across different habitats. InfoStat
(Grupo Infostat 2010) was used to conduct these analysis.
The sampling structure was according to a randomize design, whose ANOVA model was:
Ƴijkl = µ + Ti + Ɛijkl
where:
Ƴijkl = observed response of the variable of interest
µ = general mean
Ti = habitat typology effect
Ɛijkl = error term, which is independent, randomized and having a normal distribution
with a mean of zero and a constant variance.
We conducted an Analysis of Similarity (ANOSIM) to compare species composition between
habitat types. ANOSIM was performed using the statistical software R, using Bray-Curtis
similarity distance with 10,000 permutations (R Development Core Team 2008). To identify if
there were difference based on species composition among habitats, we conducted a global
ANOSIM. We followed this with a pair wise ANOSIM in order to identify the habitats that
differed from each other.
3.4.6 Avian and herpetofauna community relationship with habitat complexity
and landscape context.
To explain the relationship between avian communities with habitat complexity and landscape
structure, we utilized simple linear regressions. We first constructed a Classification-
Regression Tree; variables retained (variables explaining more variability in the data set) were
used as regressors. With the retained habitat variables from the Classification-Regression Tree,
we constructed a dendrogram using Pearson‟s similarity distance; this to exclude correlated
variables. Habitat variables included in the regression models were: bare ground (%), shade

25
(%), weed cover (%), tree density, tree richness, total basal area, Musaceae density, Musaceae
basal area, cacao density and basal area, cacao height and Thiollay‟s index of vertical
heterogeneity. We include slope and altitude for herpetofauna. Distance to water bodies,
distance to the nearest forest patch, percentage of forest cover, mean forest patch area and
forest patch density were the landscape metrics we used as regressors. The variables retained
in the model were based on their CP Mallow‟s index and Akaike‟s Information Criterion (AIC)
used to examine model‟s goodness of fit. Dependant variables were squared root transformed
if the model‟s mean quadratic error (ECMP in Infostat) was considered relatively high.
To explore the relationship between herpetofauna diversity and habitat and landscape metrics,
we used simple linear regressions using generalized linear models (GLM), utilizing Poisson
Distribution due to the many zeros found in the herpetofauna data. This analysis was
conducted using the statistical program R (R Development Core Team 2008).
We complete correlation analyses to explore the relationship between avian and herpetofauna
species composition and habitat structural and compositional variables. First we computed a
Principal Coordinate Analysis on species composition to reduce data dimensions, utilizing
Bray-Curtis distance. The total number of axis retained had to explain at least 80% of the
variance. Using the axes from the Principal Coordinate Analysis, we conducted a Spearman‟s
Correlation Analysis for avian composition and Pearson‟s Correlation for herpetofauna
composition data with habitat structural and compositional variables.
26
4 RESULTS
4.1 Landscape characterization
Of the 1333 km2, of territory that comprise Waslala, 263 km
2 (24%) were under some type of
forest cover (tall vegetation) while 1070 km2, were comprised of agricultural lands (agricultural
matrix dominated by basic grain crops and pastures). Mean forest patch area was 13.6 ha with
minimum and maximum areas of 0.3 and 715 ha respectively. Although there were relatively
large forest patches only 14% of all forest patches were >20 ha.
Even though mean forest patch area increased with increasing buffer size as a consequence of
reduced landscape truncation, the percent forest cover within each buffer remained constant at
all extensions used (ANOVA: F = 0.6, p = 0.66), varying between 13 to 15%. Euclidian mean
distance to the nearest forest patch was significantly different among the buffers (ANOVA: F =
3.10, p = 0.0098) (Table 4). Highest Euclidian distance was recorded for buffers 1500, 2500
and 3000, on the other hand lowest distance was registered for buffers 500 and 1000, while
buffer 2000 had an intermediate distance from the centre of the sampling units to the edge of
the nearest forest patch was 210 m (±112), while mean distance from sampling unit to the
nearest body of water was 98.89 m in straight line (Table 4).
4.1.1 Relationship between avian and herpetofauna communities with
landscape metrics
The simple and multiple linear regression conducted in order to identify relationships between
bird and herpetofauna richness, abundance and diversity with the landscape metrics calculated
utilizing the 4 and 8 neighbour rule, showed that none of the metrics calculated were good
predictors of the response variables. This result may be as a consequence of the high degree,
and even distribution of fragmentation within the landscape.

27
Table 4. Mean plus standard deviation, minimum, maximum and coefficient of variance (CV)
values by buffer for the landscape metrics calculated. Note: distance to water body was
calculated once
Variable Buffer
500 m 1000 m 1500 m 2000 m 2500 m 3000 m
Distance to Water source (m)
Mean ± SD 98 ± 154 --- --- --- --- ---
Minimum 50 --- --- --- --- ---
Maximum 800 --- --- --- --- ---
Forest cover (%)
Mean ± SD 14.98 ± 6.7 13.57 ± 3.75 13.46 ± 4.53 14.28 ± 4.61 14.59 ± 4.8 14.79 ± 4.24
CV 44.69 27.61 33.65 32.28 32.94 28.66
Minimum 5.4 7.2 4.7 3.5 4.1 5.1
Maximum 29.5 21.6 26.8 27 30.7 29.1
Forest patch mean area (ha)
Mean ± SD 2.27 ± 1.4 3.54 ± 1.36 4.73 ± 2.08 5.61 ± 2.23 6.36 ± 2.59 6.92 ± 2.56
CV 61.89 38.42 44.1 39.7 40.71 37.07
Minimum 0.7 1.8 2 2.5 3.5 2.8
Maximum 9.5 8.1 8.8 10.9 14.3 15.2
Distance to nearest forest patch (m)
Mean ± SD 1497 ± 89 143 ± 60 160 ± 52 154 ± 50 156 ± 40 158 ± 31
CV 59.6 41.7 32.5 32.2 25.7 31.3
Minimum 52 72 74 93 102 108
Maximum 400 372 311 372 321 286
4.2 General description of habitats studied
Out of the 42 sampling units (cacao agroforests: n = 36; secondary forest: n = 6), the cluster
analysis differentiated four habitat typologies (Figure 5). The typologies chosen based on the
degree of similarity among sampling units of the same cluster were Secondary Forest (n=6);
Diversified Cacao agroforests (n=13), Two-Strata Cacao agroforests (n=17) and Cacao-Banana
agroforests (n=6). The clusters were statistically different (MANOVA: F = 24.71, p = <0.0001).
The Secondary Forests were characterized by greatest tree richness (22 ± 1.01), abundance
(39.5 ± 3.03) and tree basal area (3.23 ± 0.24) along with high vertical structural heterogeneity

28
values (Table 5, Figure 6). These habitats also had low densities of weed cover (19.5 ± 4.17),
similar to both Cacao-Banana and Two-Strata Cacao agroforests, as a direct result of having
highest shade values (33.5 ± 4.21) (Table 5).
Cacao-Banana agroforests were the least botanically and structurally complex of the three
cacao agroforests. These habitats were characterized by having the greatest abundance (39.5 ±
3.47) and basal area (39.5 ± 3.39) of Musaceae, with lowest mean tree richness (3.83 ± 1.01)
and abundance (3.83 ± 1.01) (Table 5, Figure 6). Cacao-Banana agroforests were also
characterized by having high shade values (27 ± 4.21), this as a consequence of forming a
closed lower canopy layer between 2 and 9 m in height (2.6 ± 0.13), as a consequence of the
high abundance of Musaceaes (Table 5).
Figure 5. Dendrogram showing the four habitat types obtained through the cluster analysis of
habitat structural and compositional variables for the 42 sampling units in Waslala,
Nicaragua.
Two-Strata Cacao Agroforests were characterized by having high leaf litter cover (85.22 ±
3.23) and two well-defined vertical strata, these strata were found between 2-9 m and 10-20 m
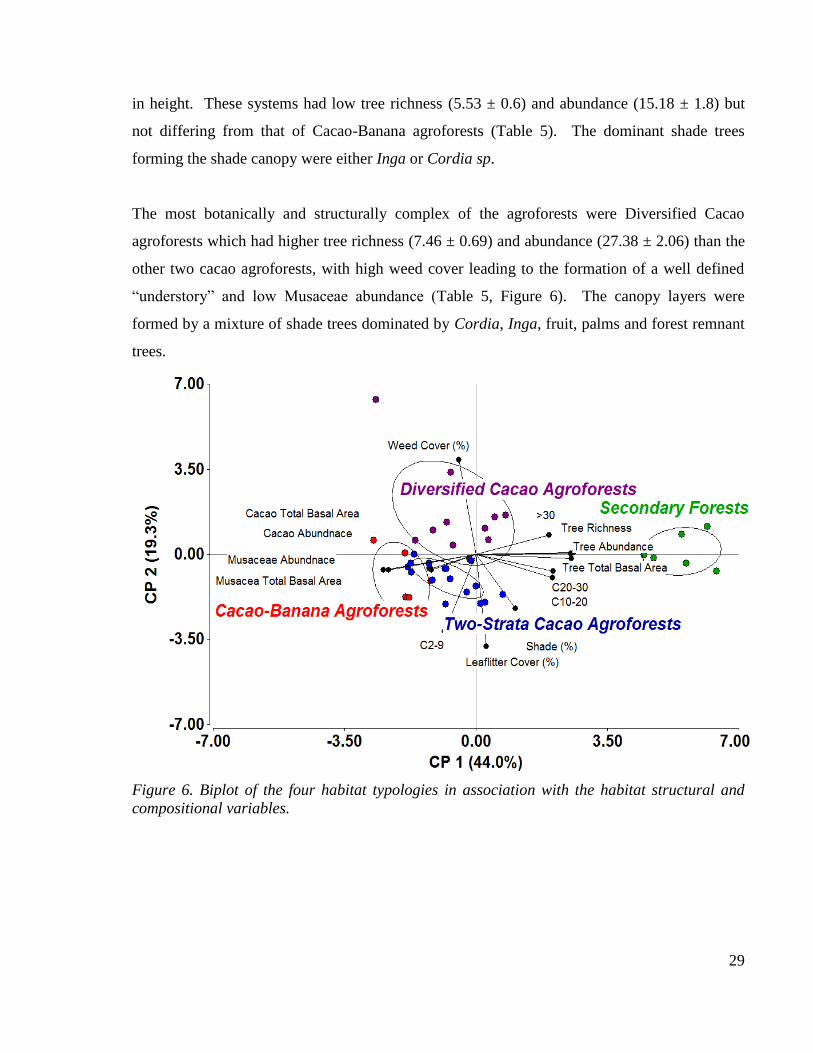
29
in height. These systems had low tree richness (5.53 ± 0.6) and abundance (15.18 ± 1.8) but
not differing from that of Cacao-Banana agroforests (Table 5). The dominant shade trees
forming the shade canopy were either Inga or Cordia sp.
The most botanically and structurally complex of the agroforests were Diversified Cacao
agroforests which had higher tree richness (7.46 ± 0.69) and abundance (27.38 ± 2.06) than the
other two cacao agroforests, with high weed cover leading to the formation of a well defined
“understory” and low Musaceae abundance (Table 5, Figure 6). The canopy layers were
formed by a mixture of shade trees dominated by Cordia, Inga, fruit, palms and forest remnant
trees.
Figure 6. Biplot of the four habitat typologies in association with the habitat structural and
compositional variables.

30
Table 5. Mean comparison of the environmental variables measured in the 42 sampling units
utilized to construct the dendrogram. (Cacao-Banana Agroforest (n = 6), Two-Strata Cacao
Agroforest (n = 17), Diversified Cacao Agroforest (n = 13), Secondary Forest (n = 6)).
Variable
Habitat
F-Value
P-Value Cacao-Banana Agroforest
Two-Strata Cacao
Agroforest
Diversified Cacao
Agroforest
Secondary Forest
Weed cover (%)* 18.08 ± 4.17 a 15.32 ± 2.48 a 32.08 ± 2.83 b 19.5 ± 4.17 a 7.01 0.0007
Leaf litter (%) 80.63 ± 5.44 b 85.22 ± 3.23 b 62.98 ± 3.7 a 78.95 ± 5.44 b 7.14 0.0006
Shade (%)* 27 ± 4.21 bc 22.29 ± 2.5 b 12.38 ± 2.86 a 33.5 ± 4.21 c 6.71 0.001
C0-2* 16.83 ± 4.37 ab 15.79 ± 2.6 a 26.04 ± 2.97 bc 32.5 ± 4.37 c 4.87 0.0058
C2-9 2.6 ± 0.13 b 2.81 ± 0.08 b 2.17 ± 0.09 a 2.15 ± 0.13 a 13.23 <0.0001
C10-20 0.85 ± 0.12 a 1.38 ± 0.12 b 0.98 ± 0.14 a 2.4 ± 0.21 c 12.84 <0.0001
C20-30 0.23 ± 0.12 a 0.44 ± 0.07 a 0.48 ± 0.08 a 1.5 ± 0.12 b 22.51 <0.0001
C>30* 18.33 ± 2.7 ab 16.5 ± 1.6 a 21.58 ± 1.84 b 38.67 ± 2.7 c 17.15 <0.0001
Musaceae abundance* 39.5 ± 3.47 b 18.35 ± 2.06 a 24.46 ± 2.36 a ----- 13.73 <0.0001
Musaceae basal area* 39.5 ± 3.39 c 17.85 ± 2.01 a 25.12 ± 2.3 b ----- 15.23 <0.0001
Cacao abundance 71.17 ± 5.51 a 67.88 ± 3.27 a 61.08 ± 3.74 a ----- 1.47 0.2444
Cacao basal area* 25.92 ± 4.09 a 27.97 ± 2.43 a 19.31 ± 2.79 a ----- 2.82 0.0738
Tree abundance* 8.67 ± 3.03 a 15.18 ± 1.8 a 27.38 ± 2.06 b 39.5 ± 3.03 c 24.64 <0.0001
Tree richness 3.83 ± 1.01 a 5.53 ± 0.6 a 7.46 ± 0.69 b 22 ± 1.01 c 74.89 <0.0001
Tree basal area 0.63 ± 0.24 a 0.8 ± 0.14 a 0.87 ± 0.16 a 3.23 ± 0.24 b 30.42 <0.0001
4.3 Bird, amphibian and reptile community composition
4.3.1 Bird, amphibian and reptile community composition description
We recorded a total of 2,914 birds from 174 species, 195 amphibians from 12 species and 258
reptiles from 19 species were recorded. The five most abundant bird species were Saltator
maximus (179), Amazilia tzacatle (143), Cyanocorax morio (141), Psarocolius Montezuma
(130) and Dendroica pensylvanica (128). The five most abundant amphibians were Diasporus
diastema (67), Craugastor bransfordii (54), Oophaga pumilio (32), Pristimatis ridens (19) and
Eleutherodactylus biporcatus (5). Norops limifrons (127), N. humilis (46), Ameiva festiva (21),
Ninia sebae (13) and N. lemurinus (13) were the dominant reptile species observed. Of the 34
bird families Tyrannidae was dominant (Figure 7) while Leptodactylidae and Colubridae where
the dominant amphibian and reptile families respectively (Figure 7). Bird mean richness and
abundance per plot was 30.45 (±6.89) and 69.38 (±18.11). Observed amphibians mean

31
richness and abundance per plot was 1.75 (±1.13) and 4.88 (±5.1), while for reptiles it was 2.64
(±1.29) and 6.28 (±3.71), respectively.
Figure 7. Composition of bird (n = 34), amphibian (n = 6) and reptile (n = 6) families based
on the number of species recorded for each, in Waslala, Nicaragua.
Rank-abundance curves for birds, amphibians and reptiles show that there were few dominant
species and many rare ones (Figure 8). For birds, the four habitats studied showed similar
behaviour in rank abundances except for Secondary Forest remnants that were dominated by
Habia fuscicauda (12%). The dominant species in Cacao-Banana Agroforests were
Cyanocorax morio and Saltator maximus with a recorded abundance of 26 and 24 individuals
respectively. In Two-Strata Cacao Agroforests, S. maximus dominanted with 74 individuals,
followed by Amazilia tzacatl with 68 individuals. In Diversified Cacao Agroforest the same
species were dominant but with abundances of 55 and 52 individuals respectively. All of the
dominant species in all habitats except for Secondary forests were habitat generalist.
For amphibians Diversified Cacao agroforests showed the most even abundance distribution by
species as compared to other habitats, while for reptiles it was Cacao-Banana agroforests

32
(Figure 8). The dominant amphibian species in Cacao-Banana agroforests were Diasporus
diastema and E. ridens with 19 and 6 individuals respectively, while the least abundant were
Bufo coccifer, B. marinus and E. fitzingeri, where each was represented by one individual. D.
diastema and E. bransfordii were dominant in Two-Strata Cacao agroforests, where each
species was represented by 40 individuals, while Gymnopis multiplicata was the least abundant.
In Diversified Cacao agroforests and Secondary Forest remnants Oophaga pumilio was
dominant (9 and 23 individuals respectively), followed by E. brandsfordii, where in each
habitat 5 individuals were recorded. Rana maculata was least abundant in Diversified Cacao
agroforests, while B. coccifer was least represented in Secondary Forests; both species were
represented by a single individual.
Norops limifrons and N. humilis were the dominate reptile species in Cacao-Banana
agroforests, each registered 16 and 15 individuals respectively, on the other hand the least
abundant species were Mabuya unimarginata and Micrurus nigrocinctus which were both
represented by a single individual. In both Diversified and Two-Strata Cacao agroforests N.
limifrons was dominant, registering an abundance of 64 and 42 individuals respectively. The
least abundant species in Two-strata Cacao agroforests were Bothrops asper, Coniophanes
fissidens, Drymobius margariferus, Hydromorphus concolor and Imantodes cenchoa, all
represented by a single individual. Ninia maculate and N. lionotus were recorded once in
Diversified Cacao agroforests, becoming the least abundant species in this habitat. N. humilis
was dominant (15 individuals) in Secondary Forests while Atropoides nummifer, I. cenchoa, N.
maculata and N. lionotus were the least abundant.

33
Figure 8. Bird, amphibian and reptile Rank-Abundance Curves for the four habitats studied in
Waslala, Nicaragua (C_B_AF = Cacao-Banana Agroforest (n = 6), S_C_AF = Two-Strata
Cacao Agroforest (n = 17), D_C_AF = Diversified Cacao Agroforest (n = 13), S _For (n = 4)).
**note for birds S-For, n = 6
Species rarefaction curves based on individual abundance for birds and reptiles indicate that the
sampling effort conducted for Diversified Cacao agroforests was reasonable as the curves show
signs of stabilizing (Figure 9 A and C, Table 6). For amphibians an asymptote was reached for
Two-Strata Cacao agroforests only, with a 100% sampling efficiency (Table 6). The behaviour
of the other curves indicates that recording new species, particularly rare and cryptic ones,
would increase with increased effort. Birds species richness recorded by sampling unit did not
differ among habitats (Figure 9A), while for amphibians, Two-Strata Cacao agroforests species
richness less that of Diversified and Cacao-Banana agroforests but similar to Secondary
Forests. Amphibian richness in Secondary Forest was less than that of Diversified Cacao
agroforests but not among the other habitats (Figure 9B). In regards to reptiles, species
richness recorded in Two-Strata Cacao agroforests did not differ significantly from that of the
other habitats, while both Cacao-Banana agroforests and Secondary Forest remnants differed

34
significantly from that of Diversified Cacao agroforests, which have the lowest species richness
(Figure 9C).
Figure 9. Birds’, amphibians’ and reptiles’ rarefaction curve and respective confidence
intervals for the four habitats studied in Waslala, Nicaragua (C_B_AF = Cacao-Banana
Agroforest (n = 6), S_C_AF = Two-strata Cacao Agroforest (n = 17), D_C_AF = Diversified
Cacao Agroforest (n = 13), S _For (n = 4)).** note for birds S-For, n = 6.
The Clench‟s Model results indicate that greatest estimated bird richness is predicted for Two-
Strata Cacao agroforests (173 species). In contrast, the lowest species richness is expected for
Cacao-Banana agroforests (133 species). For amphibians greatest estimated richness was
expected in both Cacao-Banana and Diversified Cacao agroforests (16 species respectively);
while the least was recorded in Two-Strata Cacao agroforests (4 species). For reptiles highest
estimated richness was reported for Two-Strata Cacao agroforests (18 species), while the least
was recorded for Diversified Cacao agroforests (9 species) (Table 6). Sampling efficiency was
reasonable for the three taxa in all habitats studied, as all had a sampling efficiency of more
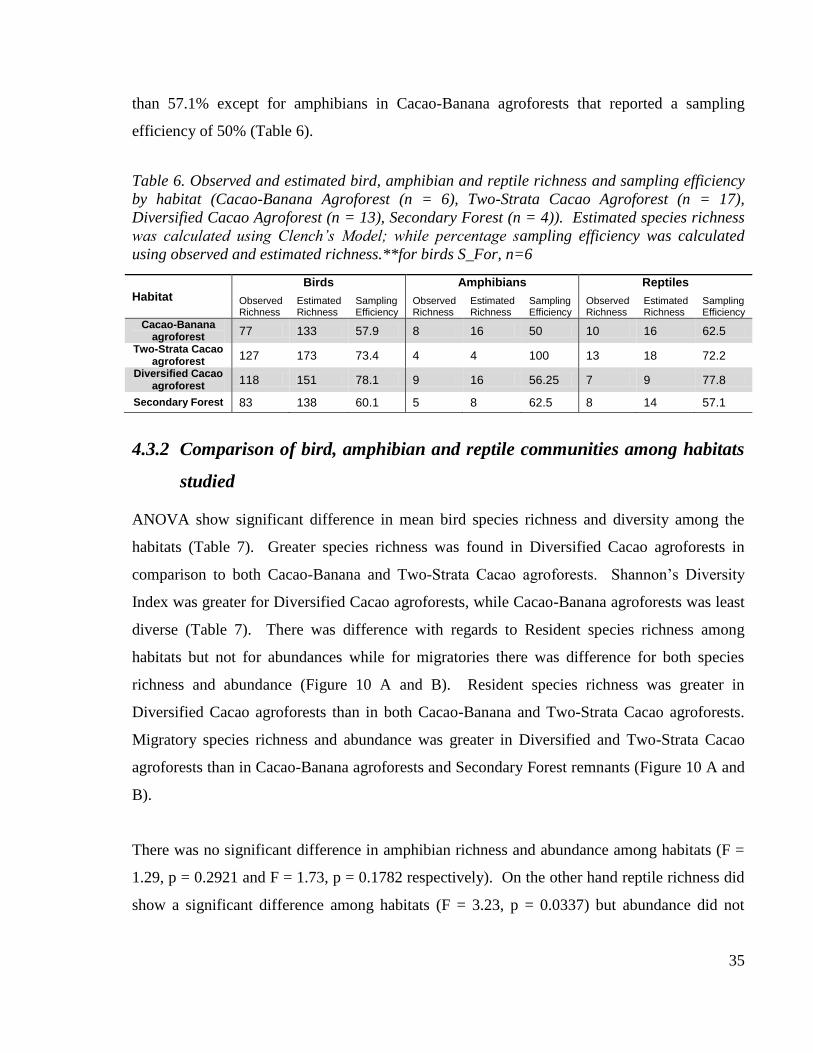
35
than 57.1% except for amphibians in Cacao-Banana agroforests that reported a sampling
efficiency of 50% (Table 6).
Table 6. Observed and estimated bird, amphibian and reptile richness and sampling efficiency
by habitat (Cacao-Banana Agroforest (n = 6), Two-Strata Cacao Agroforest (n = 17),
Diversified Cacao Agroforest (n = 13), Secondary Forest (n = 4)). Estimated species richness
was calculated using Clench’s Model; while percentage sampling efficiency was calculated
using observed and estimated richness.**for birds S_For, n=6
4.3.2 Comparison of bird, amphibian and reptile communities among habitats
studied
ANOVA show significant difference in mean bird species richness and diversity among the
habitats (Table 7). Greater species richness was found in Diversified Cacao agroforests in
comparison to both Cacao-Banana and Two-Strata Cacao agroforests. Shannon‟s Diversity
Index was greater for Diversified Cacao agroforests, while Cacao-Banana agroforests was least
diverse (Table 7). There was difference with regards to Resident species richness among
habitats but not for abundances while for migratories there was difference for both species
richness and abundance (Figure 10 A and B). Resident species richness was greater in
Diversified Cacao agroforests than in both Cacao-Banana and Two-Strata Cacao agroforests.
Migratory species richness and abundance was greater in Diversified and Two-Strata Cacao
agroforests than in Cacao-Banana agroforests and Secondary Forest remnants (Figure 10 A and
B).
There was no significant difference in amphibian richness and abundance among habitats (F =
1.29, p = 0.2921 and F = 1.73, p = 0.1782 respectively). On the other hand reptile richness did
show a significant difference among habitats (F = 3.23, p = 0.0337) but abundance did not
Habitat
Birds Amphibians Reptiles
Observed Richness
Estimated Richness
Sampling Efficiency
Observed Richness
Estimated Richness
Sampling Efficiency
Observed Richness
Estimated Richness
Sampling Efficiency
Cacao-Banana agroforest
77 133 57.9 8 16 50 10 16 62.5
Two-Strata Cacao agroforest
127 173 73.4 4 4 100 13 18 72.2
Diversified Cacao agroforest
118 151 78.1 9 16 56.25 7 9 77.8
Secondary Forest 83 138 60.1 5 8 62.5 8 14 57.1

36
differ. Greater reptile richness was found in Secondary forests and Cacao-Banana Agroforests,
while Diversified Cacao Agroforests had less richness (14.42 ± 2.9) (Table 7).
Table 7. Mean species richness, abundance and diversity index for the bird, amphibian and
reptile communities recorded in 42 sampling units in Waslala, Nicaragua. (Cacao-Banana
Agroforest (n = 6), Two-Strata Cacao Agroforest (n = 17), Diversified Cacao Agroforest (n =
13), Secondary forest (n = 6)). Different letters indicate significant difference (p < 0.05). * =
variable was rank transformed.
Cacao-Banana
agroforest
Two-Strata Cacao
agroforest
Diversified Cacao
agroforest
Secondary forest
F-value
p-value
Birds
Richness 25.5 ± 2.57 a 29.18 ± 1.53 a 34.92 ± 1.75 b 29.33 ± 2.57 ab 3.72 0.0194
Abundance 61 ± 7.3 66.88 ± 4.34 77 ± 4.96 68.33 ± 7.3 1.34 0.275
Shannon 2.97 ± 0.09 a 3.11 ± 0.06 ab 3.32 ± 0.06 b 3.1 ± 0.09 ab 3.96 0.015
Simpson* 28.5 ± 4.28 b 23 ± 2.54 b 12.88 ± 2.91 a 28.92 ± 4.28 b 4.93 0.0055
Amphibians
Richness 2 ± 0.46 1.78 ± 0.26 1.45 ± 0.30 2.2 ± 0.53 1.29 0.2921
Abundance* 20.22 ± 4.53 23.7 ± 2.55 15.59 ± 2.91 23.27 ± 5.22 1.73 0.1782
Shannon 1.03 ± 0.15 0.68 ± 0.09 0.77 ± 0.13 0.75 ± 0.18 1.25 0.3179
Simpson* 0.42 ± 0.15 0.53 ±0.10 0.43 ± 0.12 0.44 ± 0.20 0.22 0.8795
Reptiles
Richness 3.5 ± 0.49 b 2.65 ± 0.29 ab 1.92 ± 0.33 a 3.5 ± 0.6 b 3.29 0.0315
Abundance 9.5 ± 1.43 5.59 ± 0.85 5.23 ± 0.97 7.75 ± 1.76 2.52 0.0735
Shannon* 29.25 ± 4.42 b 20.29 ± 2.63 ab 14.81 ± 3 a 20.29 ± 5.42 ab 2.95 0.0458
Simpson* 11.42 ± 4.31 20.06 ± 2.64 22.41 ± 3.18 16.75 ± 5.28 1.53 0.2255

37
Figure 10. Status for species richness and abundance mean comparisons for bird communities
recorded in 42 sampling units in Waslala, Nicaragua. (C_B_AF = Cacao-Banana agroforest
(n = 6), S_C_AF = Two-Strata Cacao agroforest (n = 17), D_C_AF = Diversified Cacao
agroforest (n = 13), S _For (n = 6)). Different letters indicate significant difference (p < 0.05).
The recorded occurrence of bird abundance at the different habitat strata did not differ
significantly among habitats studied (ground: F = 1.87, p = 0.1512; Lower Canopy: F = 1.24, p
= 0.3101; Middle Canopy: F = 1.45, p = 0.2443; Upper Canopy: F = 1.04, p = 0.3855), except
for occurrence in the understory. Bird richness recorded on the understory differed
significantly among habitats (F = 9.3, p = 0.0001); Secondary Forests registered the greatest
occurrence of birds in the understory (37.67 ± 3.93), followed by Diversified Cacao agroforests
(24.81 ± 2.67), while Cacao-Banana and Two-Strata Cacao agroforests did not differ from each
other (13.92 ± 3.93 and 15.94 ± 2.33, respectively).
Foraging strata preference for birds showed significant difference among habitats for both
species richness and abundance, except for abundance of canopy foragers (F = 2.45, p =
0.0788). Richness and abundance for understory foragers was higher in Secondary Forests than
in the cacao agroforests, while canopy foragers‟ richness was greater in Diversified Cacao
agroforests as was the case for species richness and abundance of birds which forage in all
strata layers (Table 8).

38
Table 8. Mean comparison of preferred foraging strata for species richness and abundance of
bird recorded in 42 sampling units in Waslala, Nicaragua. (Cacao-Banana agroforest (n = 6),
Two-Strata Cacao agroforest (n = 17), Diversified Cacao agroforest (n = 13), Secondary
Forest (n = 6). Different letters indicate significant difference (p < 0.05).
Foraging Strata
Cacao-Banana agroforest
Two-Strata Cacao agroforest
Diversified Cacao
agroforest
Secondary forest
F-value
P-value
Richness
Understory Foragers
4.33 ± 0.83 a 4.76 ± 0.49 a 4.92 ± 0.56 a 10 ± 0.83 b 1.53 <0.0001
Canopy Foragers
12.5 ± 1.88 a 14.35 ± 1.12 a 17.85 ± 1.28 b 11.17 ± 1.88 a 3.69 0.02
Both Strata Foragers
8.67 ± 1.07 a 10.06 ± 0.64 a 12.15 ± 0.73 b 8.17 ± 1.07 a 4.31 0.0103
Abundance
Understory Foragers
8 ± 2.12 a 7.94 ± 1.26 a 7.54 ± 1.44 a 26.5 ± 2.12 b 22.26 <0.0001
Canopy Foragers
32.5 ± 4.62 36.06 ± 2.75 40 ± 3.14 25.33 ± 4.62 2.45 0.0788
Both Strata Foragers
20.5 ± 3.31 a 22.88 ± 1.97 a 29.46 ± 2.25 b 16.5 ± 3.31 a 4.13 0.0125
Amphibians occurrence on leaf-litter and branches of trees did not differ significantly among
habitats (F = 2.12, p = 0.1146 and F = 1.20, p = 0.3239) (Figure 11). Reptile abundance on leaf
litter and branches significantly differ among habitats (F = 3.33, p = 0.0303 and F = 3.07, p =
0.0402, respectively) but not for abundance recorded on the stems of trees (F= 0.42, p =
0.7427) (Figure 11). Greatest reptile abundance was observed on the leaf litter in Cacao-
Banana agroforests, while the least occurred in Diversified Cacao agroforests. However the
mean abundance did not differ from that of Two-Strata Cacao Agroforests. The greatest
abundance of reptiles observed on the branches of trees was reported for Diversified Cacao
agroforests, while the least abundance was observed in Two-Strata Cacao agroforests but this
difference was only significant compared to Diversified Cacao agroforests (Figure 11).
We found significant and important differences in dietary guild composition by habitat type.
Insectivore and gramnivore species richness and abundance differ significantly among habitats
(F= 3.39, p = 0.02; F = 4.32, p = 0.01, respectively). Diversified Cacao had greatest mean
species richness (12.54 ± 0.91) and abundance (21.92 ± 1.77), as was the case for gramnivores.
Nectarivore, frugivore and omnivore species richness and abundance did not differ among
habitats studies (Table 9).

39
Figure 11. Mean comparison of amphibian and reptile abundance on different habitat strata.
(C_B_AF = Cacao-Banana Agroforest (n = 6), S_C_AF = Two-Strata Cacao Agroforest (n =
17), D_C_AF = Diversified Cacao Agroforest (n = 13), S _For (n = 4)). Different letters
indicate significant difference (p < 0.05); * = variables were ranked transformed.
Table 9. Mean comparison of avian dietary guilds. (C_B_AF = Cacao-Banana Agroforest (n =
6), S_C_AF = Two-Strata Cacao Agroforest (n = 17), D_C_AF = Diversified Cacao
Agroforest (n = 13), S _For (n = 4).
cacao-Banana
agroforest
Two-Strata Cacao
agroforest
Diversified Cacao
agroforest
Secondary forest
F-value
p-value
Richness Insectivores 7.5 ± 1.32 a 11.47 ± 0.8 a 12.54 ± 0.91 b 10.33 ± 1.34 ab 3.39 0.02
Nectarivores 2.17 ± 0.42 2.06 ± 0.25 2.15 ± 0.29 2.33 ± 0.42 0.11 0.96
Frugivores 3.33 ± 0.81 2.94 ± 0.48 4.85 ± 0.55 3.33 ± 0.81 2.4 0.08
Gramnivores 1 ± 0.46 a 0.94 ± 0.27 a 2.15 ± 0.31 b 0.83 ± 0.46 a 3.61 0.02
Omnivores 10.83 ± 1.48 11.59 ± 0.88 13.15 ± 1 12 ± 1.48 0.72 0.54
Abundance
Insectivores 11.17 ± 2.6 a 19.82 ± 1.55 b 21.92 ± 1.77 b 16.5 ± 2.6 ab 4.32 0.01
Nectarivores 5.5 ± 1.07 5.88 ± 0.63 5.31 ± 0.72 3.67 ± 1.07 1.07 0.37
Frugivores 8.83 ± 2.19 6.65 ± 1.3 11.92 ± 1.49 10.67 ± 2.19 2.55 0.07
Gramnivores 1.67 ± 0.82 a 1.12 ± 0.49 a 4.08 ± 0.56 b 1.17 ± 0.82 a 6.09 0.002
Omnivores 33 ± 5.03 33.24 ± 2.99 33.69 ± 3.42 35.83 ± 5.03 0.07 0.97
Birds‟ rarefaction curve based on individual abundance for degree of forest dependence show
that Secondary Forests had the greatest richness of forest specialists; on the other hand Cacao-
Banana agroforests had the least richness, while Two-Strata and Diversified Cacao Agroforest

40
had an intermediate richness but did not differ from each other (Figure 12 A). For forest
generalist birds, Secondary Forests showed the least richness but only differ from Two-Strata
Cacao agroforests (Figure 12 B). With respect to generalist birds, all habitats have similar
species richness. Secondary Forests reported the highest estimated species richness for forest
specialists but the lowest for both forest generalists and generalist species (Table 10). Greatest
forest generalists and generalist estimated richness was reported for Two-Strata Cacao
agroforests. For all degree of birds‟ forest dependence highest sampling efficiency was
recorded for Two-Strata Cacao agroforests, while lowest sampling efficiency for forest
specialist and generalist species was achieved in Secondary Forests, while for forest generalists
it was in Cacao-Banana agroforests (Table 10).
Table 10. Observed and estimated richness and sampling efficiency for birds’ degree of forest
dependence (Cacao-Banana Agroforest (n = 6), Two-strata Cacao Agroforest (n = 17),
Diversified Cacao Agroforest (n = 13), Secondary forest (n = 6)). Estimated species richness
was calculated using Clench’s Model; while percentage sampling efficiency was calculated
using observed and estimated richness
Habitat Forest Specialists Richness Forest Generalists Richness Generalists Richness
Observed Estimated Sampling efficiency
Observed Estimated Sampling efficiency
Observed Estimated Sampling efficiency
Cacao-Banana
agroforest 3 ---- --- 23 52 43.91 51 78 65.07
Two-Strata Cacao
agroforest 9 14 66.32 37 53 69.91 81 103 78.36
Diversified Cacao
agroforest 7 12 56.25 34 44 77.41 77 95 80.97
Secondary forest 15 31 48.68 26 38 68.26 42 71 59.05
Mean richness and abundance for degree of forest dependence by birds showed significant
difference among habitats studied. Secondary Forests showed greatest occurrence of forest
specialist for both species richness and abundance. Forest generalist occurred highest in both
Diversified Cacao Agroforests and Secondary Forests in comparison to Cacao-Banana and
Two-Strata Cacao Agroforests. Greater species richness of generalist birds was registered in
Diversified Cacao Agroforests, while Secondary Forests and Cacao-Banana Agroforests had
the least species richness for generalist birds. With respect to generalist species abundance
Secondary Forests showed the least, while greater occurrence was registered in the cacao
agroforest but there was no significant difference among these (Table 11).
41
Table 11. Mean comparison for degree of forest dependence for species richness and
abundance of bird recorded in 42 sampling units in Waslala, Nicaragua. (Cacao-Banana
agroforest (n = 6), Two-Strata Cacao agroforest (n = 17), Diversified Cacao agroforest (n =
13), Secondary forest (n = 6)). Different letters indicate significant difference (p < 0.05).* =
variable values were rank transformed.
Forest Dependence
Cacao-Banana
agroforest
Two-Strata Cacao
agroforest
Diversified Cacao
agroforest
Secondary forest
F-value
P-value
Richness
Forest Specialists* 12.25 ± 4.04 a 22.91 ± 2.4 b 17.04 ± 2.74 ab 36.42 ± 4.04 c 7.3 0.0006
Forest Generalist 6.33 ± 1.12 a 6.88 ± 0.67 a 9.23 ± 0.76 b 10.33 ± 1.12 b 3.99 0.0146
Generalists 18.67 ± 1.89 ab 20.65 ± 1.12 b 24.62 ± 1.28 c 14.67 ± 1.89 a 6.89 0.0008
Abundance
Forest Specialists* 12.17 ± 4.07 a 22.26 ± 2.42 b 17.62 ± 2.76 ab 37.08 ± 4.07 c 7.34 0.0005
Forest Generalists 13.67 ± 2.99 a 12.24 ± 1.78 a 15.69 ± 2.03 a 29.17 ± 2.99 b 8.18 0.0003
Generalists 46.67 ± 6.04 ab 52.06 ± 3.59 b 59.54 ± 4.1 b 31.5 ± 6.04 a 5.12 0.0045
Figure 12. Rarefaction Curves with confidence intervals based on abundance for birds’ degree
of forest dependence (C_B_AF = Cacao-Banana Agroforest (n = 6), S_C_AF = Two-strata
Cacao Agroforest (n = 17), D_C_AF = Diversified Cacao Agroforest (n = 13), S _For =
secondary forest (n = 6)).

42
With the amount of individuals recorded in this study species rarefaction curve based on birds‟
degree of sensitivity to human disturbances, indicate that there is no significant difference
among the four habitats studied for birds with high, medium and low sensitivity to human
disturbances (Figure 13). Although there is no statistical difference for both bird richness with
high and medium sensitivity to human disturbances, the curve for Secondary Forests indicate
the greatest probability of supporting such birds as indicated by the slope of the curve (Figure
13A and B). This result complements our observation that the forest habitat also contained the
forest dependent species, which typically are the same species which are sensitive to
disturbance. Two-Strata Cacao agroforests, show evidence of stabilizing for high sensitivity
species only, while all other habitats indicate that more species can be recorded with an
increase in the sampling effort.
The sampling efficiency for all degrees of birds‟ sensitivity to anthropogenic disturbances
appear to be reasonable enough as all habitats had a sampling efficiency of more than 59%,
except for Cacao-Banana agroforests for birds with a medium sensitivity (Table 12).
Secondary Forests recorded the highest observed and estimated species richness for birds with
high and medium sensitivity to human disturbances; on the other hand greatest estimated low
sensitivity bird richness was recorded for Two-Strata Cacao agroforests (Table 12).
ANOVA results show that for degree of birds‟ sensitivity to human disturbances there were
significant differences among habitats studied both for species richness and abundance (Table
13). Bird richness and abundance with low sensitivity to human disturbances were higher in
Diversified Cacao agroforests than in Cacao-Banana and Two-Strata Cacao agroforests, while
Secondary Forests had the least abundance and richness for this category. Secondary Forests
reported the highest richness and abundance of birds with medium and high degree of
sensitivity to disturbances; on the contrary Cacao-Banana agroforests reported the least
occurrence of birds‟ richness with medium sensitivity to disturbances. Cacao-Banana,
Simplified and Diversified Cacao agroforests had no difference in richness and abundance for
birds with high degree of sensitivity to anthropogenic disturbances (Table 13).

43
Figure 13. Species rarefaction curve with confidence intervals for birds’ degree of sensitivity to
human disturbances (C_B_AF = Cacao-Banana Agroforest (n = 6), S_C_AF = Two-Strata
Cacao Agroforest (n = 17), D_C_AF = Diversified Cacao Agroforest (n = 13), S _For =
Secondary forest (n = 6)).
Table 12. Observed and estimated bird richness and sampling efficiency for degree of
sensitivity to human disturbances (Cacao-Banana agroforest (n = 6), Two-Strata Cacao
agroforest (n = 17), Diversified Cacao agroforest (n = 13), Secondary forest (n = 6)).
Estimated species richness was calculated using Clench’s Model; while percentage sampling
efficiency was calculated using observed and estimated richness
Habitat
Disturbance Sensitivity: High Disturbance Sensitivity: Medium Disturbance Sensitivity: Low
Observed Estimated Sampling Efficiency
Observed Estimated Sampling Efficiency
Observed Estimated Sampling Efficiency
Cacao-Banana
agroforest 3 5 59.75 25 53 47.41 49 80 61.64
Two-Strata Cacao
agroforest 3 4 79.29 46 67 69.05 78 102 76.68
Diversified Cacao
agroforest 2 3 76.32 43 57 75.44 73 90 81.38
Secondary forest
6 8 70.81 43 70 61.53 34 58 58.80

44
Table 13. Mean comparison of the degree of sensitivity to human disturbances for species
richness and abundance of bird recorded in 42 sampling units in Waslala, Nicaragua. (Cacao-
Banana agroforest (n = 6), Two-Strata Cacao agroforest (n = 17), Diversified Cacao
agroforest (n = 13), Secondary forest (n = 6)). Different letters indicate significant difference
(p < 0.05). * = variable was rank transformed.
Sensitivity to Disturbances
Cacao-Banana agroforest
Two-Strata Cacao
agroforest
Diversified Cacao
agroforest
Secondary forest
F-value
P-value
Richness
Low 17.5 ± 1.7 b 19.47 ± 1.01 b 23.38 ± 1.15 c 11 ± 1.7 a 2.49 <0.0001
Medium 7.17 ± 1.51 a 9.12 ± 0.89 ab 11.15 ± 1.02 b 15.83 ± 1.51 c 6.74 0.0009
High* 21.33 ± 3.83 a 19.03 ± 2.28 a 17.35 ± 2.6 a 37.67 ± 3.83 b 7.17 0.0006
Abundance
Low 41.17 ± 4.76 b 44.94 ± 2.83 b 55.62 ± 3.24 c 21 ± 4.76 a 2.21 <0.0001
Medium* 17.33 ± 4.33 a 18.68 ± 2.57 a 19.58 ± 2.94 a 37.83 ± 4.33 b 5.6 0.0028
High* 21.17 ± 3.83 a 19.18 ± 2.28 a 17.15 ± 2.6 a 37.83 ± 3.83 b 7.34 0.0005
Global ANOSIM results for species composition indicates that bird (r = 0.3111, p =
0.00009990), amphibian (r = 0.1147, p = 0.047395) and reptile (r= 0.157, p = 0.015998)
species composition differ among habitats studied. Based on pair wise ANOSIM, the three
cacao agroforests do not differ from each other in regards to birds species composition but
Secondary Forests did differ from these (Table 14). No habitat that differed from all others for
both amphibian and reptile species composition. Diversified and Two-Strata Cacao differed
significantly from each other (r = 0.2285, p = 0.000599) based on amphibian composition. For
reptile composition there was three pair of habitats that differed significantly, these being:
Cacao-Banana and Diversified Cacao agroforests (r = 0.2022, p = 0.059); Two-Strata Cacao
agroforests and Secondary Forest remnants (0.3779, p = 0.033) and Diversified and Two-Strata
Cacao agroforests (Table 14)
Table 14. Pair wise ANOSIM results for bird, amphibian and reptile species composition based
on 10,000 permutations utilizing Bray-Curtis distance.
Habitats Birds Amphibians Reptiles
R p R p R p
C_B_AF vs. S_C_AF 0.04311 0.356 0.112 0.199 0.2359 0.057
C_B_AF vs. S_For 0.4 0.004 -0.0139 0.447 -0.0814 0.609
C_B_AF vs. D_C_AF 0.1388 0.134 -0.0568 0.679 0.2022 0.059
S_C_AF vs. D_C_AF 0.07307 0.068 0.2285 <0.0001 0.06028 0.109
S_C_AF vs. S_For 0.73 <0.0001 0.0552 0.361 0.3779 0.033
D_C_AF vs. S_For 0.8113 <0.0001 -0.1417 0.852 0.1126 0.224

45
We conducted an Indicator Species Analysis to identify the most characteristic bird species of
the four habitat typologies. Species with the highest Importance Value (IV) and P ≤ 0.05 were
regarded as characteristic of each habitat. Phlogothraupis sanguinolenta (generalist) was the
indicator species for Cacao-Banana agroforests while Dendroica magnolia (forest generalist)
was characteristic of Two-Strata Cacao agroforests. Diversified Cacao agroforests had four
indicator species being Oryzoborus funereus, Cyanerpes cyaneus, Chlorophanes spiza and
Turdus grayi. Secondary Forests were represented by a total of 15 indicator species, where
Cyanocompsa cyanoides was the most characteristic (IV= 100; p 0.001), followed by Arremon
aurantiirostris (IV = 61.8, p = 0.001) (Table 15).
Table 15. Indicator species analysis based on bird abundance for the four different habitats.
Specie English Name Forest
Dependence IV Mean
p-value
Cacao-Banana Agroforest
Phlogothraupis sanguinolenta Crimson-collared Tanager Generalist 31.9 18.4 0.055
Two-Strata Cacao Agroforest
Dendroica magnolia Magnolia Warbler Forest generalist 33.3 16.9 0.039
Diversified Cacao Agroforest
Oryzoborus funereus Thick-billed Seedfinch Generalist 66.3 17.8 0.001
Cyanerpes cyaneus Red-legged Honeycreeper Forest generalist 43.7 18.1 0.011
Chlorophanes spiza Green Honeycreeper Forest generalist 38.5 13.3 0.015
Turdus grayi Clay-colored Thrush Generalist 35.4 29.1 0.054
Secondary Forest
Cyanocompsa cyanoides Blue-black Grosbeak Forest generalist 100 14.1 0.001
Arremon aurantiirostris Orange-billed Sparrow Forest specialist 61.8 13.4 0.001
Phaethornis superciliosus Long-tailed Hermit Forest generalist 61.2 21.8 0.001
Habia fuscicauda Red-throated Ant-tanager Forest generalist 61.4 27.9 0.003
Microcerculus philomela Nightingale Wren Forest specialist 50 11.8 0.005
Ramphastos sulfuratus Keel-bill Toucan Forest generalist 54.2 19.5 0.005
Terenotriccus erythrurus Ruddy-tailed Flycatcher Forest generalist 42.9 12.4 0.006
Mionectes oleagineus Ochre-bellied Flycatcher Forest generalist 50.7 25.5 0.009
Phaethornis longuemareus Little Hermit Forest generalist 46.9 18.7 0.009
Momotus momota Blue-crowned Motmot Generalist 43.9 22.4 0.018
Manacus candei White-collared Manakin Forest generalist 46.4 23.3 0.022
Gymnocichla nudiceps Bare-crowned Antbird Forest generalist 33.3 10.8 0.037
Myrmotherula schisticolor Slaty Antwren Forest specialist 33.3 10.9 0.037
Trogon rufus Black-throated Trogon Forest specialist 33.3 10.9 0.037
Eucometis penicillata Gray-headed Tanager Forest specialist 26.6 12.3 0.049

46
For amphibians, the indicator species analysis, shows that Diasporus diastema, was the only
characteristic species for Cacao-Banana agroforests (IV = 48.5, p = 0.0322), while there was no
significant indicator species for the other habitats (Table 16). For reptiles the analysis indicated
that there were three characteristic species (Table 17). Norops lemurinus and Dryadophis
melanolomus, resulted characteristic of Cacao-Banana agroforests, while N. humilis, was
characteristic of Secondary Forests (IV = 38.0, p = 0.0576.).
Table 16. Indicator species analysis based on amphibian abundance for the four different
habitats.
Habitat Species IV p-value
Cacao-Banana Agroforest
Diasporus diastema 48.5 0.0322
Bufo marinus 20 0.2583
Rana maculata 17.4 0.3337
Pristimatis ridens 21.9 0.4391
Two-Strata Cacao Agroforest
Craugastor bransfordii 44.7 0.0648
Gymnopis multiplicata 6.7 1
Diversified Cacao Agroforest
Leptodactylus pentadactylus 9.1 0.5701
Smilisca phaeota 9.1 0.5749
Craugastor fitzingeri 10.5 0.6793
Secondary Forest
Oophaga pumilio 21.9 0.1066
Eleutherodactylus biporcatus 11.4 0.7145
Bufo coccifer 9.9 0.7469
Table 17. Indicator species analysis based on reptile abundance for the four different habitats
Habitat Specie IV p-value
Cacao-Banana Agroforest
Norops lemurinus 45.5 0.0236
Dryadophis melanolomus 33.3 0.0266
Geophis hoffmanni 22.2 0.1256
Micrurus nigrocinctus 16.7 0.237
Ninia maculata 8.8 0.7618
47
Two-Strata Cacao Agroforest
Ninia sebae 23.3 0.2074
Mabuya unimarginata 15 0.3531
Norops limifrons 30.4 0.4419
Bothrops asper 5.9 1
Coniophanes fissidens 5.9 1
Drymobius margariferus 5.9 1
Hydromorphus concolor 5.9 1
Norops cupreus 5.9 1
Diversified Cacao Agroforest
Norops sp 15.4 0.2901
Secondary Forest
Norops humilis 38 0.0576
Atropoides nummifer 25 0.099
Imantodes cenchoa 20.2 0.1056
Norops lionotus 19.1 0.1738
Ameiva festiva 22 0.4399
4.3.3 Relationship between bird and herpetofauna communities with habitat
structural and floristic composition.
We conducted simple linear regressions to better understand the relationship between avian
communities and habitat structural and floristic composition. Of the many variables that we
measured, tree richness and abundance contributed significantly to bird richness, abundance
and Shannon‟s Diversity Index (Table 18); this response was explained by quadratic function.
Bird richness was positively affected by an increase in tree richness and abundance within all
cacao agroforests (R2 = 0.25, p = 0.001 and R
2 = 0.26, 0.0007 respectively) but in Secondary
Forest the opposite effect was observed. Bird diversity (H‟) was positively affected by
abundance of flowering trees, shade tree richness and abundance (Table 18).
Altitude had a significant positive effect on both amphibian species richness and abundance as
did for reptile abundance. Amphibian richness and abundance was negatively affected by
percentage of bare ground but most significantly for abundance. On the other hand percentage
weed cover and estimated vegetation cover in the upper canopy had a positive effect on
amphibian abundance. Temperature had a significant negative effect on reptile abundance (p =

48
0.002), while both Musaceae abundance and an increase in understory cover had a positive
effect (Table 19).
Table 18. Simple linear regressions for bird richness, abundance, diversity index and evenness
with habitat variables, regressor variables shown are those with statistical significance. * =
dependant variable was squared root transformed.
Dependent variable
regressor variable Slope R² R² Aj T -value p-valor
Bird Richness
Tree richness 0.2 0.25 0.21 3.54 0.001
Tree Richness^2 -0.01 --- --- -3.51 0.0012
Tree abundance 0.08 0.26 0.22 3.71 0.0007
Tree abundance^2 -0.0013 --- --- -3.59 0.0009
abundance
Tree richness 0.23 0.11 0.06 2.19 0.0347
Tree richness^2 -0.01 --- --- -2.05 0.0468
Tree abundance 0.1 0.12 0.07 2.28 0.0285
Tree abundacne^2 -0.002 --- --- -2.15 0.0382
Shannon
Flowering tree abundance 0.02 0.11 0.09 2.28 0.0283
Tree richness 0.02 0.23 0.19 3.41 0.0015
Tree richness^2 -0.001 --- --- -3.41 0.0015
Tree abundance 0.01 0.25 0.21 3.56 0.001
Tree abundacne^2 -0.0001 --- --- -3.47 0.0013
Forest specialist bird richness and abundance had a significant positive relationship with
Thiollay‟s Vegetation Index (R2 = 0.16, p = 0.0094), tree abundance (R
2 = 0.14, p = 0.0142),
tree species richness (R2 = 0.17, p = 0.0059) and tree total basal area (R
2 = 0.15, p = 0.0117)
(Table 20). Forest generalist bird richness was positively related with tree richness and
abundance, while forest generalist bird abundance was significantly related to Thiollay‟s
Vegetation Index, tree species richness and abundance, as did for tree total basal area. General
species richness and abundance was significantly related to tree richness and abundance, but
such relationship was best explained by a quadratic function (Table 20).
Birds‟ degree of sensitivity to human disturbances were highly correlated to birds‟ degree of
forest dependence (forest specialists and birds with high degree of sensitivity to human
disturbances: (R2 = 0.34, p = <0.0001)). For the above reason no regression results are shown
between habitat structural and compositional variables with degree of birds‟ sensitivity to

49
human disturbances as the results were similar to those of degree of forest dependence and
plot-scale variables.
Table 19. Habitat variables that had a significant relationship with herpetofauna richness and
abundance based on the results obtained from the generalized linear models.
Variable slope z-value p-value
Amphibian Richness
Altitude 0.001 2.083 0.0372
Bare ground (%) -0.058 -1.86 0.0629
Amphibian Abundance
Altitude 0.001 2.652 0.008
Slope 0.012 2.352 0.019
Weed Cover (%) 0.026 4.609 <0.0001
Bare ground (%) -0.089 -3.682 0.0002
Thiollay’s index (c >30m) 2.05 4.3 <0.0001
Reptile Richness
---------- ---------- ---------- ----------
Reptile Abundance
Temperature -0.16 -3.032 0.002
Altitude 0.0007 1.953 0.05
Thiollay’s index (c0-2) 0.32 2.242 0.03
Musaceae abundance 0.0008 2.936 0.003

50
Table 20. Habitat variables that had a significant relationship with degree of forest dependence for bird species richness and abundance
based on results obtained from simple linear regression models. * = dependent variable was square root transformed.
Forest Specialists* Forest Generalists* Generalists*
Variable Slope R² R² Aj T-value
p-value
Slope R² R² Aj T-value
p-value Slope R² R² Aj T-value
p-value
Richness
Thiollay's Vegetation Index 0.23 0.16 0.14 2.73 0.0094 -- -- -- -- -- -- -- -- -- --
Tree abundance 0.02 0.14 0.12 2.56 0.0142 0.01 0.17 0.15 2.85 0.0069 0.08 0.41 0.38 4.16 0.0002
Tree abundance^2 -- -- -- -- -- -- -- -- -- -- -0.002 -- -- --4.8 <0.0001
Tree richness 0.05 0.17 0.15 2.91 0.0059 0.04 0.19 0.17 3.06 0.004 0.15 0.34 0.31 2.94 0.006
Tree richness^2 -- -- -- -- -- -- -- -- -- -- -0.01 -- -- -3.72 0.001
Tree basal area 0.29 0.15 0.13 2.64 0.0117 -- -- -- -- -- -- -- -- -- --
Abundance
Thiollay's Vegetation Index 0.23 0.16 0.14 2.73 0.0094 0.33 0.15 0.13 2.68 0.0106 0.47 0.19 0.17 3.06 0.0039
Tree abundance 0.02 0.14 0.12 2.56 0.0142 0.04 0.34 0.32 4.52 0.0001 0.12 0.32 0.29 2.8 0.008
Tree abundance^2 -- -- -- -- -- -- -- -- -- -- -0.001 -- -- -3.51 0.0012
Tree richness 0.05 0.17 0.15 2.91 0.0059 0.12 0.41 0.4 5.29 <0.0001 0.19 0.26 0.23 1.77 0.0841
Tree richness^2 -- -- -- -- -- -- -- -- -- -- -0.01 -- -- -2.56 0.0145
Tree basal area 0.29 0.15 0.13 2.64 0.0117 0.52 0.22 0.2 3.36 0.0017 -- -- -- -- --

51
Musaceae abundance had a significant negative effect (R2 = 0.09, p= 0.079) on insectivore
bird. Frugivorous bird richness was positively affected by the abundance of fruiting trees (p =
0.0246), while an increase in vegetation between the height of 2-9 m (Thiollay‟s Index C2-9),
negatively affected frugivorous bird richness. The abundance of shade trees had a significant
effect on nectarivore richness, but such response by nectarivores was explained by a quadratic
function. Flowering tree abundance had a significant positive effect on seed eater richness (R2
= 0.14, p = 0.0137) (Table 21).
Table 21. Mulivariate regressions for bird food guilds based on bird richness with habitat
variables, regressor variables shown are those with statistical significance. * = dependant
variable was squared root transformed.
Dependent Variable
Regressor variable slope R² R² Aj T-value P-value
Insectivorous* Mucaseae abundance -0.01 0.09 0.07 -2.04 0.0479
Frugivorous* # of fruiting trees 0.11 0.21 0.17 2.34 0.0246
Thiollay’s Index (C2-9 ) -0.77 0.21 0.17 -2.41 0.0208
Nectarivorous*
Thiollay’s Index (C20-30) 0.62 0.27 0.21 2.08 0.0445
Tree abundance 0.04 0.27 0.21 2.6 0.0132
Tree abundance^2 0.0005 0.27 0.21 -2.53 0.0157
Gramnivorous* # of flowering trees 0.21 0.14 0.12 2.58 0.0137
Onmivorous* Thiollay’s Index (C2-9) -0.63 0.12 0.1 -2.35 0.024
To understand the relationship between avian community composition with habitat structural
and compositional variables, we conducted a Multi-dimension Scaling to reduce the dimension
of the data into three axes which explained more than 75 of the variance. Results indicate that
changes in species composition were mostly correlated to changes in tree richness, abundance
and tree total basal area. The formation of a closed canopy at the height of 10-20 m (Thiollay‟s
Index C10-20m) had a positive relationship with avian composition. Cacao abundance, Cacao
total basal area and Cacao height had a significant negative association with avian
composition, indicating that an increase in cacao density results in greatest degree of change in
bird species composition. An increase in Musaceae dbh, had a negative effect on bird
composition (Table 22).

52
Table 22. Spearman Correlation Analysis between bird composition and habitat structural
and compositional variables.
Habitat structural variable Axis 1 Axis 2 Axis 3
r p r p r p
Cacao abundance -0.38 0.01 -0.64 <0.0001 -0.34 0.03
Cacao Total Basal Area (m2) -0.43 0.004 -0.51 0.001 -- --
Cacao height (m) -0.4 0.01 -0.63 <0.0001 -0.44 0.003
Tree abundance 0.3 0.05 0.57 <0.0001 -- --
Tree richness 0.34 0.03 0.57 <0.0001 0.35 0.02
Tree Total Basal Area (m2) -- -- 0.53 0.0003 -- --
Musaceae DBH (M) -- -- -0.35 0.02 -0.38 0.01
Thiollay’s Index (C2-9) -- -- -0.34 0.03 -- --
Thiollay’s Index (C10-20) -- - 0.04 0.004 0.43 0.004
We conducted Pearson‟s Correlation analysis utilizing species coordinates obtained from the
Principal Coordinates Analysis to investigate the association between herpetofauna
composition and habitat structural and botanical variables. A total of nine axis were used as
these explained 82% of the variance for both amphibians and reptiles. Amphibian species
composition had a significant positive association with Musaceae abundance and total basal
area, cacao basal area, leaf litter thickness and percentage cover, tree DBH and habitat area.
On the other hand there was a significant negative relationship with tree richness and
abundance. Amphibian species found in Axis 1 had a negative association with Thiollay‟s
Vegetation Index and tree basal area but species in Axis 4 were positively associated (Table
23). Reptile species composition was positively associated with Musaceae abundance and
total basal area, altitude and distance to water sources but was negatively associated to habitat
patch area, temperature and cacao dbh (Table 24).

53
Table 23. Pearson’s Correlation Analysis between amphibian species composition and habitat structural and compositional variables.
Amphibian Composition Axis 1 Axis 2 Axis 3 Axis 4 Axis 5 Axis 6 Axis 7 Axis 8 Axis 9
Variable r p r p r p r p r p r p r p r p r p
Thiollay's Vegetation Index -0.39 0.01 --- --- --- --- 0.44 0 --- --- --- --- --- --- --- --- --- ---
Musaceae basal area 0.45 0 --- --- --- --- --- --- -- --- --- --- --- --- --- --- --- ---
Musaceae abundance 0.41 0.01 --- --- --- --- --- --- --- --- --- --- --- --- --- --- --- ---
Cacao dbh 0.34 0.03 --- --- --- --- --- --- --- --- --- --- --- --- --- --- --- ---
Cacao total basal area 0.35 0.03 --- --- --- --- --- --- --- --- --- --- --- --- --- --- --- ---
slope (%) --- --- --- --- 0.43 0.01 --- --- --- --- --- --- 0.37 0.02 --- --- --- ---
Leaf litter thickness (cm) 0.41 0.01 --- --- --- --- --- --- --- --- --- --- --- --- --- --- --- ---
Weed Cover (%) --- --- --- --- --- --- --- --- --- --- --- --- 0.32 0.04 --- --- --- ---
Tree richness -0.39 0.01 --- --- --- --- --- --- --- --- --- --- --- --- --- --- --- ---
Tree abundance -0.37 0.02 --- --- --- --- --- --- --- --- --- --- --- --- --- --- --- ---
Tree dbh 0.44 0.0001 --- --- --- --- --- --- 0.7 0.0001 --- --- --- --- --- --- --- ---
Tree total basal area -0.35 0.03 --- --- --- --- 0.36 0.02 --- --- --- --- --- --- --- --- --- ---
Area (ha) 0.36 0.02 --- --- --- --- --- --- --- --- --- --- --- --- --- --- --- ---
Table 24. Pearson’s Correlation Analysis between reptile species composition and habitat structural and compositional variables.
Reptile species composition Axis 1 Axis 2 Axis 3 Axis 4 Axis 5 Axis 6 Axis 7 Axis 8 Axis 9
variable r p r p r p r p r p r p r p r p r p
Cacao DBH --- --- -0.33 0.04 --- --- --- --- --- --- --- --- --- --- --- --- --- ---
Musaceae abundance 0.36 0.02 --- --- --- --- --- --- 0.36 0.02 --- --- 0.47 0.0001 --- --- --- ---
Musaceae total basal area 0.33 0.04 --- --- --- --- --- --- 0.34 0.03 --- --- 0.37 0.02 --- --- --- ---
Temperature -0.47 0.0001 -0.35 0.03 --- --- --- --- --- --- --- --- -0.45 0.0001 --- --- --- ---
Altitude (masl) 0.46 0.0001 --- --- --- --- --- --- 0.46 0 --- --- --- --- --- --- --- ---
Area (ha) --- --- -0.32 0.04 --- --- --- --- --- --- --- --- --- --- --- --- --- ---
.

54
5 DISCUSSION
Our study area was located within an agricultural matrix, dominated by pasture and basic grain
fields (corn and beans). Percentage forest cover ranged between 13.46 to 14.98% at all scales
(within the 500 m – 3000 m buffers) being classified as highly fragmented under McIntyre and
Hobbs (1999) terminology. In this context, cacao agroforests play an essential role in avian
and herpetofauna conservation. Of the total 174 bird species recorded, 154 were recorded
within cacao agroforests, while the 12 amphibian species and 18 out of the 19 reptile species
recorded were found within cacao agroforests. Although appearing to conserve great
diversity, most of the species, especially for birds, registered were more generalists in aspects
of habitat requirements; stressing the idea that structurally complex cacao agroforests are no
substitutes for natural forests (Faria et al. 2007; Harvey and Gonzalez Villalobos 2007;
Cassano et al. 2009) but may be acting as stepping stones favouring species dispersal within
an agricultural matrix. This assumption may not be viewed against cacao agroforest
biodiversity conservation value but as a consequence of landscape fragmentation.
5.1 The effect of the landscape context on avian and herpetofauna diversity
Contrary to our hypothesis, the continuous landscape variables measured (percentage of forest
cover, mean forest patch area, forest patch density) at different scales were not efficient in
explaining bird and herpetofauna communities within the habitats studied. This may be as a
consequence of the high degree of fragmentation which is distributed homogeneously
throughout the landscape. High degree of forest fragmentation, increased isolation between
forest patches and decrease forest patch area, additionally explaining why avian and
herpetofauna diversity observed was dominated by generalist species. These species are
capable of surviving in landscapes with limited natural vegetation cover. Even though forest
patches were of limited size, this study shows their capacity to provide food and habitat for
some forest specialist species, adding to their conservation value.
Other factors that may have played an important role in determining why landscape variable
were not able to explain biodiversity within the different habitats was the resolution and age of
the images. Factors that impeded us from doing a detailed and precise land cover
classification system. The image having a resolution of 30 m2 prevented the digitalization of

55
most riparian forest strips and live fences, known to be important factors in explaining
diversity (Milder et al. 2010) and have lead to an increase in connectivity between remnant
forest patches and cacao systems. Images utilized were from 2001 and 2005 and being a
dynamic landscape much have change in regards to land covers, which play a role in
determining biodiversity in an area. The above reasons, coupled with the fact that land cover
classification does not consider land management and level of anthropogenic disturbances
significantly affect conservation outcomes (Milder et al. 2010) and may have reduced the
probability of detecting relationships between forest cover and biodiversity within particular
habitats.
Although many authors suggest that habitat fragmentation is perceived differently by species
due to difference in dispersal ability, both birds (high dispersal ability) and herpetofauna (low
dispersal ability) may be responding to other factors other than the landscape metrics
considered. Even though we are not clear on what these factors are, it is possible to assume
that the landscape has surpassed its biodiversity conservation threshold. Biodiversity within
secondary forest remnants and cacao agroforests are becoming isolated populations with
limited exchange of species between source patches. Possible source forest parches were few
and more than 4 km in straight line distance from the closest forest patch or cacao system
studied.
Distance to remnant forest patches has been reported by many authors as critical in explaining
avian community composition (Reitsma et al. 2001; Florian 2005; Clough et al. 2009) but was
otherwise in this study. Species richness of forest specialist, tend to decrease rapidly as one
moves away from the forest edge; stressing the idea that forest specialists are unlikely to
subsist in cacao agroforests without the immediate proximity of natural forest. Although no
relationship was found between avian diversity and distance to forest remnants it suggests the
critical role that riparian strips may be playing in forest remnant and cacao agroforests
connectivity. It also leads to the assumption that if in Waslala secondary forest remnants were
of greater size and with heterogeneous fragmentation there have likely been significant
relationships with forest specialists‟ diversity.

56
Herpetofauna diversity was neither explained by landscape metrics considered. An important
factor to consider here is amphibian mobility capacity; the distance to the nearest forest patch
was 210 m, while to the closest water source was 98 m away. Habitats were gaped by cattle
pastures or agricultural field, highly affecting migration of species as these are regarded as
hostile habitats. This cannot be generalized as many studies indicate that amphibian response
to habitat fragmentations and distance to water bodies is species specific due to differences in
life history and behavioural characteristics (Cushman 2006), indicating the complexity of
analyzing amphibian communities as a whole in determining patterns associated with habitat
and landscape variables. Surprisingly distance to water bodies was not a good predictor for
neither amphibian species richness nor abundance contradictory to the findings of Russell et
al. (2002), Loehle et al. (2005) and Bell and Donnelly (2006) who suggest that amphibian
diversity is more dependent upon the availability of water bodies in the landscape than on
intrinsic habitat variables, as a direct response to amphibians‟ physiological and reproductive
requirements. This finding may be as a consequence of the natural history of the dominant
family Leptodactylidae (50% of total richness and 77% of total abundance). This amphibian
family is least impacted by the presence or absence of water bodies as most of the species
recorded were terrestrial who lay their eggs on the leaf litter (Savage 2002).
It is also important to highlight that habitat topographical variables such as altitude and relief
helped explain herpetofauna diversity. These results are similar to those of Soares and Brito
(2007). Further suggests that explaining species composition is complex as they respond to
different variables from habitat complexity, topographic to landscape metrics.
According to Barrett and Guyer (2008), conserving herpetofaunal diversity circles around the
conservation and adequate management of suitable habitat and maintaining connectivity
among habitat patches. This is highly achieved by conserving riparian forest strips but
riparian forest strips by themselves are not enough to conserve viable populations thus the
need to develop conservation measures from a landscape focal point of view.
Although secondary forest remnants and cacao agroforests appear to conserve great avian and
herpetofauna diversity within this landscape context, their conservation value is dependent on
several factors that include distance to primary forest remnants (Ricketts 2001; Tasser et al.
57
2009), percentage of surrounding forest cover (Castelletta et al. 2005; Florian 2005; Develey
and Metzger 2006), degree of connectivity between forest remnants (Fahrig 2003; Bennett
2004; Faria et al. 2006; Schroth and Harvey 2007) and low intensity of anthropogenic
disturbances. These factors, critical for biodiversity conservation were absent within the study
area, indicating that it has surpass it threshold necessary for biodiversity conservation.
5.2 Habitat comparison
Cacao agroforestry systems in Waslala were previously characterized by having a complex
structural and floristic diversity (PCC 2007) but in this study of 36 cacao agroforests, three
habitat typologies were identified: Cacao-Banana, Two-Strata and Diversified Cacao
agroforests systems. These differ from each other both in floristic and structural complexity
indicating a marked habitat gradient within cacao agroforests themselves. These differences
are due to changes in habitat structural complexity, moving from agroforestry systems
dominated by Musaceae shade, to rustic systems having Musaceae, palms, fruit, legumes and
forest remnant trees. These systems are comparable to the indigenous cacao systems identified
by Somarriba and Harvey (2003) and Deheuvel et al. (2010) in Talamanca, Costa Rica.
5.3 Avian and herpetofauna community comparison in cacao agroforests
and secondary forest remnants
Results obtained in this study indicated that agroecological landscapes are capable of
supporting great avian and herpetofauna diversity. Within this landscape context, cacao
agroforests are critical habitats for both avian and herpetofauna diversity but fall short in
providing the necessary resources to support high forest specialist species richness. This may
not be directly as a consequence of management practices as all studied systems are managed
as organic systems and cacao growers have been trained to employ the same management
strategies in their cacao farms but rather as a consequence of the high degree of natural forest
fragmentation and to the fact that even the most structurally complex cacao system are highly
altered habitats due to marked changes in understory composition and vertical strata
complexity as a consequence of shade control (Rice and Greenberg 2000). Remnant forest
patches are not of mature forest but classified as secondary forest, highly altered by forest
fires, and logging activities for both timber and firewood. These activities have modified the

58
natural habitat structural and floristic composition, directly affecting patch faunal diversity
dictating species composition within the landscape. Birds, amphibians and reptiles responded
differently within habitat types in respect to mean species richness, abundance and as for
species composition; indicating that different taxa and species within each taxa have different
habitat requirements and that each fill a specific niche in the ecosystem.
Observed avian assemblage represents 23.4% of the 743 bird species recorded in Nicaragua.
An increase in the sampling effort would most likely increase avian richness reported in all
habitats as indicated by the species rarefaction curves, increasing the probability of registering
rare and cryptic species that may be utilizing the different cacao agroforests. Even though
high species richness was reported (174 species, 2914 individuals), a closer look at species
composition reveals that of highly alter habitats as the majority were generalists species (100
species, 2125 individuals), while only 20 species were considered to be forest specialists,
representing 11.5% of the total bird richness and just 4% of the total recorded abundance (117
individuals) of which 11 species were registered within cacao agroforests (6.3% of the total
richness) while 9 species were exclusive to secondary forests. These results reveal that these
systems fall short in providing resources required by forest specialists. All but two species
were of least conservation concern. Passerina ciris and Vermivora chrysoptera are listed as
near threatened species by IUCN, thus are of great conservation value, as a consequence of
showing population declines throughout their range. P. ciris (2 individuals) was observed in
Diversified Cacao agroforests while V. chrysoptera was recorded in all habitats except Cacao-
Banana agroforests.
Although we failed to find significant difference in regards to frugivorous and nectarivores,
species highly dependent on forest, may indicate that cacao agroforest may offer food
resources for these bird guilds. This can further be assumed due to the availability of fruits
within the systems (especially ripe bananas), highly favoured by many bird species. Although
many shade trees produce fruits eaten by birds (Inga sp, Citrus spp.) the diversity of such trees
is limited compared to forest remnants (Steffan-Dewenter et al. 2007) and food source
production is available for part of the year, indicating the dependence of frugivores on
neighbouring forest fragments for their survival. On the other hand nectarivores richness was

59
highly associated to secondary forests indicating that the resources offered by cacao
agroforests do not appear to sustain nectar feeders.
Amphibian‟s mean species richness and abundance showed no statistical difference among
habitats studied but did showed difference in regards to species composition. Of the 12
amphibian species recorded in the study area all occurred within cacao agroforests and only
five species within secondary forests but none were specific to this habitat. This indicates the
importance of cacao agroforests in amphibian conservation however all but one species was of
least conservation concern. Eleutherodactylus biporcatus, is listed as a vulnerable specie by
IUCN, as a consequence of showing evident population declines in recent years, this specie
was recorded in Secondary Forest (2 individuals) and in Cacao-Banana agroforests (3
individuals).
Cacao-Banana agroforests and Secondary forests were favoured most by reptiles as both had
highest mean richness, but no difference among habitats was found for abundance, this may be
as a consequence of the available resources provided by these habitats on the leaf litter and by
the presence of lower branches, as both habitats reported greatest reptile abundance occurring
on the leaf litter and branches.
The almost mirror effect behaviour of the rarefaction curves between amphibians and reptiles
may be as a consequence of differences in abundance distribution patterns as a consequence of
changes in species dominance at different habitats. These results are similar to those obtained
by Urbina-Cardona et al. (2006), who state that this could be because of different abundance
distribution patterns and hierarchical position of species as a consequence of species affinity to
different habitat uses.
Bird, amphibian and reptile species composition responded differently to habitats, indicating
that species food and habitat requirements within these taxa are different. ANOSIM results
leads to say that secondary forest remnants provide different resources and niches for avian
species composition than do cacao agroforests, favouring forest specialist species, while cacao
agroforests support more forest generalists and generalist species. Although Secondary
Forests reported greatest forest specialist bird richness and abundance in comparison to the
60
cacao agroforests, out of the 83 species reported for this habitat 15 species were forest
specialists, this is only 18% of the total richness indicating that forest remnants have been
highly disturbed, such human disturbances were evident, creating niches that favor the
colonization by generalist species.
For both amphibian and reptiles, ANOSIM results indicate that there was no habitat different
for the rest in regards to species composition but there were differences among pair of
habitats. The difference between Two-Strata and Diversified Cacao agroforests species
composition may be as a consequence that Diversified Cacao had six species not found in
Two-Strata cacao agroforests these being Rana maculata, Smilisca phaeota, Leptodactylus
pentadactylus, Oophaga pumilio and Bufo coccifer, while one species found in Two-Strata
Cacao systems was not reported in Diversified Cacao agroforests, this being Gymnopis
multiplicata. These differences in species composition between habitats indicated that
different species have different habitat requirements, thus more heterogeneous habitats are
capable of providing food and habitat resources for greater diversity as there will be more
habitat, food resources and niches that can be exploited by different species. This finding also
supports the notion that what is regarded as habitat by one species may not be so for another
(Bennett 2004) as a consequence of difference in life history.
High biodiversity richness do not necessarily reflect high quality habitat, however, nor can it
be assume that cacao agroforests represent self-sustaining populations (Merola-Zwartjes and
DeLong 2005), especially in a highly fragmented landscape as it is the case with the study
area, were all cacao agroforests and most remnant forest patches are of limited size. Measures
of physiological and reproductive condition will offer an insight to this assumption which
were variables not considered in this study.
5.4 Effects of habitat structure and composition on avian and
herpetofauna diversity
Birds, amphibians and reptile species richness and abundance responded differently to habitat
structural and floristic complexity. The linear regression analysis suggests the importance of
shade tree richness and abundance and vertical structural stratification as most influential
predictors of avian richness, abundance and diversity in cacao agroforests. These results are
61
similar to other bird studies in agroforestry systems which stress the conservation value of
floristic and structurally complex agroforestry systems, which have the potential to offer more
food and habitat resources than homogenous and botanically and structurally simplified
habitats (Greenberg et al. 2000; Rice and Greenberg 2000; Faria et al. 2006; Harvey and
Gonzalez Villalobos 2007; Greenberg 2008). The relationship between tree richness and
abundance with over all bird richness and abundance was explained by a quadratic function
indicating that an initial increase in tree richness and abundance leads to an increase in bird
richness and abundance but then reaches an asymptote (threshold value), once passing this
threshold in tree richness and abundance avian diversity declines. This decline in avian
richness and abundance may have been as a consequence of the resources provided by such
habitats that favour forest specialist species thus displacing generalist. Bird richness and
abundance with respect to degree of forest dependence were greatly explained by botanical
and structural complexity. The positive linear relationship found between forest specialist
species stress the important role that shade tree richness and abundance play in avian
conservation. These findings indicated that an increase in habitat complexity both structurally
and floristically have a positive impact on forest specialist species and thus decreasing both
richness and abundance of generalist bird species, which are of less conservation concern.
These findings are best explained by the habitat heterogeneity hypothesis (MacArthur and
MacArthur 1961). This hypothesis suggests that there exists a positive linear relationship (as
was the case in this study) between habitat structural and floristic heterogeneity and species
richness and diversity due to an increase in the number of niches that can be filled, favouring
specialization and decreasing interspecies competition for available resources (MacArthur and
MacArthur 1961; Cramer and Willig 2005; Koh et al. 2006). Greenberg et al. (2008) suggests
that maintaining habitat heterogeneity can be a means of conserving species richness in
agricultural landscapes; allowing high species richness conserves both forest dependent and
generalist species (Laiolo 2002).
Amphibian richness showed a negative relationship with percentage of bare ground within the
habitats. This indicates that an increase in leaf-litter, weed cover and vertical structural
heterogeneity has a positive relationship with species richness, although such relationships
were not significant in this case but were with abundance. An increase on percentage bare

62
ground makes a habitat more hostile to amphibians due to their unique physiological
requirements, as they need a moist environment as a consequence of their moist and
permeable skins that may lead to dehydration if exposed to direct sunlight. An increase in leaf
litter, weed cover and vertical heterogeneity are likely to offer refuge from direct sunlight and
even possible from predators. An increase in vertical habitat complexity has a direct impact
on microclimatic conditions, allowing a cooler environment favoured by amphibians due to
their physiological requirements.
Reptile richness seems to respond indifferently to habitat floristic and structural heterogeneity,
as there was no variable explaining species richness, reflecting the wide range of eco-
physiological tolerances within species composition (Urbina-Cardona et al. 2006) while
abundance was significantly explained by the presence of an understory and by Musaceae
abundance. An explanation for this could be as a consequence of species composition and
dominance. The dominant species were of the genus Norops; comprising 74.8% (193 out of
258 individuals) of the total reptile abundance. Species of this genre tends to be very
territorial and strictly diurnal, showing characteristic territorial display, sit-and-wait and active
foraging mechanisms (Savage 2002) which may have lead to an increase in the chances of
being observed.
Results indicate that different taxa respond differently to habitat heterogeneity as a
consequence of the resources (food and habitat types) needed by different organisms, thus in
the arena of biological conservation the sustainable management and conservation of
heterogeneous landscapes will lead to greater biodiversity conservation.

63
6 CONCLUSIONS
It is evident that cacao agroforests and remaining secondary forest fragments play a critical
role in the conservation of avian and herpetofauna diversity within a highly fragmented
landscape; as is the case for the municipality of Waslala. Although these systems conserve
high diversity, a closer look at species composition reveals that of generalist species. This
may be as a direct consequence that the landscape has surpasses its threshold essential for the
conservation of forest specialist species, which are of greater conservation value.
Avian diversity was highest in secondary forest than in all cacao agroforests typologies except
for Diversified Cacao agroforests. Diversified Cacao agroforests, being the most floristically
and structurally complex of the cacao systems was able to support significantly more avian
diversity than did Two-Strata and Cacao-Banana agroforests as was the case for both forest
specialists and bird species. Amphibian species richness and abundance did not differ
significantly among secondary forests and cacao agroforests. Contrary to avian richness,
reptile richness was greater in Cacao-Banana systems than in Diversified and Two-Strata
Cacao agroforests.
Although the continuous landscape variables measured at different scales were weak in
explaining relationships with avian and herpetofauna diversity, these taxa responded more to
plot-scale variables; however additional research is needed to examine in greater detail the
effect of landscape structure and composition on avian and herpetofauna diversity. Avian
diversity was greatly explained by habitat floristic and structural complexity, indicating that
structurally heterogeneous habitat tends to support greater avian diversity, such findings are
conclusive with many other biological studies. Amphibian richness responded negatively to
percentage of bare ground, while there was a positive relationship with habitat vertical
structure heterogeneity. On the other hand, reptile richness did not show a significant
relationship with any habitat variable but did abundance.
It is evident that floristically and structurally diverse cacao agroforests have the potential of
conserving great avian and herpetofauna diversity within a highly fragmented landscape. And
that in this case biodiversity responded mainly to plot-scale variable but it must be emphasize

64
that the surrounding landscape may be playing an important role in determining species
composition just that I was unable to detect such relationships.
Predicting species richness requires the consideration of factors other than habitat
heterogeneity, even at plot-scales level that include a combination of temporal changes,
environmental variations and intra and interspecific competition between organisms(Goetz et
al. 2007). Both natural and anthropogenic disturbances alter the availability of resources
(food and habitat) causing species diversity patterns to vary even within a given habitat.
Even though cacao agroforests supported less forest specialist than did secondary forest
remnants, it is essential to acknowledge their conservation value as these agricultural systems
provide food and habitat resources for many other species, especially migratory birds, that
have been under the conservation lens. Cacao agroforests may be acting as stepping stones
within the agricultural matrix contributing to an increase in connectivity between forest
remnants thus improving species mobility in an otherwise hostile matrix, especially for
herpetofauna where most species posse low mobility rates. Cacao agroforests may be serving
as “biological gas stations” where species stop to feed and rest in their journey to find suitable
habitats.
Although cacao agroforests have the potential of conserving great avian and herpetofauna
diversity it is evident that even the most complex of these systems is not a substitute to natural
forests as they provide food and habitat resources for more generalized species assemblage but
are good alternatives for the conservation of biodiversity within agricultural dominated
landscapes and can be promoted as biodiversity friendly agricultural practices especially in or
around buffer zones of protected areas and biological corridors.

65
7 RECOMMENDATIONS FOR THE CONSERVATION
AND MANAGEMENT OF AVIAN AND HERPETOFAUNA
DIVERSITY
Structurally diverse cacao agroforests have great potential of conserving avian and
herpetofauna diversity, therefore it is essential to maintain shade tree richness and abundance
within cacao agroforests and to find means of incorporating additional tree species in
simplified systems. It is essential to incorporate tree species that not only serve as habitat and
food source for biodiversity but provide economic benefits to the farmers, such as the
production of fruits (Magnifera indica, Persea Americans, Citrus spp., Musa spp., Psidium
guava, Annona spp), timber (Cedrela odorata, Cordia alliodora) medicine and firewood.
Many understory species are forest dependent thus finding means of keeping an understory
within cacao agroforests will have positive impacts in biodiversity conservation. This can be
achieved by incorporating medicinal plants and non-timber species such as Chamaedorea
palms, which are of high economic value. This provides a win-win situation for farmers.
Forest cover and connectivity between remnants are known to play an important role in
determining species composition in agroforestry systems, thus conserving and sustainably
managing remaining forest remnants and increasing connectivity by incorporating life fences
and maintaining or allowing the natural regeneration of riparian forest stripes within the
agricultural matrix will favour forest affiliated species conservation in an otherwise hostile
environment.
Given that in rural landscapes, landscape change is as a consequence of landowners‟
development decisions, it is important to develop agricultural strategies that are beneficial to
both biodiversity conservation and productivity. This can be done by educating farmers on the
ecological services provided by conserving riparian strips (water supply), implementing the
use of life fences around developed plots to enhance connectivity and to incentivize landowner
not to develop marginal lands, like those with high relief or found in rocky soils. It is also
necessary to develop policies at the national level, which exempt landowners from land taxes
if they conserve a percentage of their property under forest cover.

66
It is also possible to explore the possibility of perusing a “biodiversity-friendly cacao
certification scheme” that coupled with the organic and fare-trade premiums already being
enjoyed will further incentivize farmers in biodiversity conservation by maintaining or
converting their cacao systems into complex agroforests.
It is highly recommended the diffusion and adequate communication of the study‟s results to
cacao growers and their families on the importance of their cacao agroforests in the
conservation of avian and herpetofauna diversity as a means of creating awareness on the
diversity of organisms present in their farms and how organism can increase or reduce cacao
production.
It is highly recommended to conduct avian and herpetofauna diversity studies in other land
uses that form part of the landscapes mosaic in order to develop management and conservation
strategies not only based on habitats‟ intrinsic features but at different landscape scales and
land uses, utilizing a more precise land use classification system than the one utilized in this
study. With this in mind it is necessary to develop management and conservation strategies at
a landscape level in order to prevent the remaining secondary forest remnants and cacao
agroforests to act as sinks but need larger forest patches and increase connectivity from these
source points in order to facilitate the movement of organisms between these patches.
Habitat disturbance and landscape modification have great implications on avian and
herpetofauna conservation but little research have been conducted in order to evaluate such
changes in species composition. It is recommended that further studies are carried in order to
investigate this relationship, especially in this highly human modified landscape.
Future research is necessary to gain a deeper understanding on the ecological value of land use
heterogeneity at the farm level, and of the relationship between land use heterogeneity and
avian and herpetofauna diversity at a farm scale.
The results suggest that an increase in tree richness and abundance has positive impact on
birds, amphibian and reptile diversity, indicating that if there is an increase in tree cover

67
within the landscape in the form of diverse agroforestry and silvopastoral systems will not
only favor biodiversity conservation but will provide wood resources to farmers lessening
their dependence upon forest fragments.
Lastly this study can serve as a baseline data to establish a biodiversity monitoring program to
evaluate the effect of habitat fragmentation and the impact of cacao agroforests in biodiversity
conservation.
8 REFERENCES
Abrahamczyk, S; Kessler, M; Putra, DD; Waltert, M; Tscharntke, T. 2008. The value of
differently managed cacao plantations for forest bird conservation in Sulawesi,
Indonesia. Bird Conservation International, BirdLife International 18:349-362.
Alcorn, J. 1990. Indigenous agroforestry systems in the Latin American tropics. In JA Altieri;
SB Hecht. Eds. 1990. Agroecology and Small Farm Development. CRC Press, Boca
Raton, Fl. p. 203-218.
Alderman, J; McCollin, D; Hinsley, SH; Bellamy, PE; Picton, P; Crockett, C. 2005. Modelling
the effects of dispersal and landscape configuration on population distribution and
viability in fragmented habitat. Landscape Ecology 20:857-870.
Andren, H. 1994. Effects of habitat fragmentation on birds and mammals in landscapes with
different proportions of suitable habitat: a review. Oikos 71:355-366.
Asare, R. 2006. A review on cocoa agroforestry as a means for biodiversity conservation.
Forest and Landscape. Denmark. 17 p.
Barrett, K; Guyer, C. 2008. Differential responses of amphibians and reptiles in riparian and
stream habitats to land use disturbances in western Georgia, USA. Biological
Conservation 141:2290-2300.
Bell, KE; Donnelly, MA. 2006. Influence of forest fragmentation on community structure of
frogs and lizards in Northeastern Costa Rica. Conservation Biology 20(6):1750-1760.
Bennett, AF. 2004. Enlazando el paisaje: El papel de los corredores y la conectividad en la
conservación de la vida Silvestre. IUCN. San José, Costa Rica. 278 p.
Berry, O; Tocher, MD; Gleeson, DM; Sarre, SD. 2005. Effect of vegetation matrix on animal
dispersal: genetic evidence from a study of endangered skinks. Conservation Biology
19:855-864.

68
Bos, MM; Steffan-Dewenter, I; Tscharntke, T. 2007. Shade tree management affects fruit
abortion, insect pests and pathogens of cacao. Agriculture Ecosystems & Environmnet
120:201 – 205.
Brouwers, NC; Newton, AC. 2009. The influence of habitat availability and landscape
structure on the distribution of wood cricket (Nemobius sylvestris) on the Isle of Wight,
UK. Landscape Ecology 24:199-212.
Butchart, SHM; Walpole, M; Collen, B; van Strien, A; Scharlemann, JPW; Almond, REA;
Baillie, JEM; Bomhard, B; Brown, C; Bruno, J; Carpenter, K; Carr, EGM; Chanson, J;
Chenery, AM; Csirke, J; Davidson, NC; Dentener, F; Foster, M; Galli, A; Galloway,
JN; Genovesi, P; Gregory, RD; Hockings, M; Kapos, V; Lamarque, JF; Leverington,
F; Loh, J; McGeoch, MA; McRae, L; Minasyan, A; Morcillo, MH; Oldfield, TEE;
Pauly, D; Quader, S; Revenga, C; Sauer, JR; Skolnik, B; Spear, D; Stanwell-Smith, D;
Stuart, SN; Symes, A; Tierney, M; Tyrrell, TD; Vie, JC; Watson, R. 2010. Global
biodiversity: Indicators of recent declines. Science 328(5982):1164-1168.
Cassano, CR; Schroth, G; Faria, D; Delabie, JHC; Bede, L. 2009. Landscape and farm scale
management to enhance biodiversity conservation in the cocoa producing region of
southern Bahia, Brazil. Biodiversity Conservation 18:577-603.
Castelletta, M; Thiollay, JM; Sodhi, NS. 2005. The effects of extreme forest fragmentation on
the bird community of Singapore Island Biological Conservation 121:135-155.
Castilla, G; Larkin, K; Linke, J; Hay, GJ. 2009. The impact of thematic resolution on the
patch-mosaic model of natural landscape. Landscape Ecology 24:15-23.
CATIE (Centro Agronomico Tropical de Investigacion y Ensenanza). 2009. Informe Final:
Linea Base. CATIE, Turrialba, Costa Rica. 140 p.
Chardon, JP; Adriaensen, F; Matthysen, E. 2003. Incorporating landscape elements into a
connectivity measure: a case study for the Speckled wood butterfly (Pararge aegeria
L.). Landscape Ecology 18:561-573.
Clough, Y; Putra, DD; Pitopang, R; Tscharntke, T. 2009. Local and landscape factors
determine functional bird diversity in Indonesian cacao agroforestry. Biological
Conservation 142:1032-1041.
Colwell, RK. 2010. Estimate S: estimation of species richness and shared species from
samples. Computer program. University of Connecticut, U.S.
Cox, MP; Dickman, CR; Hunter, J. 2004. Effects of rainforest fragmentation on non-flying
mammals of the Eastern Dorrigo Plateau, Australia. Biological Conservation:115-175.
Cramer, MJ; Willig, MR. 2005. Habitat heterogeneity, species diversity and null models.
Oikos 108:209-218.
69
Cushman, SA. 2006. Effects of habitat loss and fragmentation on amphibians: A review and
prospectus. Biological Conservation 128:231-240.
Dahlquist, RM; Whelan, MP; Winowiecki, L; Polidoro, B; Candela, S; Harvey, CA;
Wulfhorst, JD; McDaniel, PA; Bosque-Pérez, NA. 2007. Incorporating livelihoods in
biodiversity conservation: a case study of cacao agroforestry systems in Talamanca,
Costa Rica. Biodiversity and conservation 16:2311-2333.
Dauber, J; Purtauf, T; Allspach, A; Frisch, J; Voigtlander, K; Wolters, V. 2005. Local vs.
landscape controls on diversity: a test using surface-dwelling soil macroinvertebrates
of differing mobility. Global Ecology and Biogeography 14:213-221.
Deheuvels, O; Avelino, J; Somarriba, E; Malezieux, E. Submitted. Vegetation structure and
productivity in cocoa-based agroforestry systems in Talamanca, Costa Rica.
Agriculture, Ecosystems and Environment, accepted 16 nov.2010
Develey, PF; Metzger, JP. 2006. Emerging threats to birds in Brazilian Atlantic forests: the
roles of forest loss and configuration in a severely fragmented ecosystem. In WF
Laurance; CA Peres. Eds. 2006. Emerging threats to tropical forests. University of
Chicago Press, Chicago. p. 269-290.
Dixo, M; Martins, M. 2008. Are leaf-litter frogs and lizards affected by edge effects due to
forest fragmentation in Brazilian Atlantic forest? Journal of Tropical Ecology 24:551-
554.
Fahrig, L. 2003. Effects of habitat fragmentation on biodiversity. Annual Review of Ecology,
Evolution and Systematics 34:487-515.
Faria , D; Laps, RR; Baumgarten, J; Cetra, M. 2006. Bat and bird assemblages from forests
and shade cacao plantations in two contrasting landscapes in the Atlantic Forest of
southern Bahia, Brazil. Biodiversity and Conservation 15:587-612.
Faria, D; Paciencia, MLB; Dixo, M; Laps, RR; Baumgarten, J. 2007. Ferns, frogs, lizards,
birds and bats in forest fragments and shade cacao plantations in two contrasting
landscapes in the Atlantic forest, Brazil. Biodiversity and conservation 16:2335-2357.
Fitz-Gibbon, SI; Putland, DA; Goldizen, AW. 2007. The importance of functional
connectivity in the conservation of a ground-dwelling mammal in an urban Australian
landscape. Landscape Ecology 22:1513-1525.
Florian, EM. 2005. Tropical bird assemblages in coffee agroforestry systems: exploring the
relationship between landscape context, structural complexity and bird communities in
Turrialba-Jimenez Biological Corridor, Costa Rica. Thesis Mag. SC. Turrialba, C.R,
CATIE. 146 p.
Fraterrigo, JM; Pearson, SM; Turner, MG. 2009. Joint effects of habitat configuration and
temporal stochasticity on population dynamics. Landscape Ecology 24:863-877.

70
Gascon, C; Lovejoy, TE; Bierregaard, RO; Malcolm, JR; Stouffer, PC; Vasconcelos, HL;
Laurance, WF; Zimmerman, B; Tocher, M; Borges, S. 1999. Matrix habitat and
species richness in tropical forest remnants. Conservation Biology 91:223-229.
Goetz, S; Steinberg, D; Dubayah, R; Blair, B. 2007. Laser remote sensing of canopy habitat
heterogeneity as a predictor of bird species richness in an eastern temperate forest,
USA. Remote Sensing of Environment 108:254-263.
Greenberg, R; Bichier, P; Cruz Angón, A. 2000. The conservation value for birds of cacao
plantations with diverse planted shade in Tabasco, Mexico. Animal Conservation
3:105-112.
Greenberg, R. 2008. Biodiversity in the Cacao Agroecosystem: Shade Management and
Landscape Considerations. Smithsonian Migratory Bird Center. Washington, D.C. 18
p.
Grupo Infostat. 2010. InfoStat/Professional 2010p. Grupo InfoStat software. Argentina.
Harvey, CA; Gonzalez Villalobos, JA. 2007. Agroforestry systems conserve species-rich but
modified assemblages of tropical birds and bats. Biodiversity Conservation 16:2257-
2292.
Haynes, K; Diekotter, T; Crist, T. 2007a. Resource complementation and the response of an
insect herbivore to habitat area and fragmentation. Oecologia 153:511-520.
Haynes, KJ; Dillemuth, FP; Anderson, BJ; Hakes, AS; Jackson, HB; Jackson, SE; Cronin, JT.
2007b. Landscape context outweighs local habitat quality in its effects on herbivore
dispersal and distribution. Oecologia 151:431-441.
Hinsley, SA; Pakeman, RJ; Bellamy, PE; Newton, I. 1996. Influence of habitat fragmentation
on bird species distributions and regional population sizes. Proceedings of the Royal
Society of London 263:307-313.
Koh, CN; Lee, PF; Lin, RS. 2006. Bird species richness patterns of northern Taiwan: primary
productivity, human population density, and habitat heterogeneity. Biodiversity and
Distributions 12:546-554.
Kupfer, JA; Malanson, GP; Franklin, SB. 2006. Not seeing the ocean for the islands: the
mediating influence of matrix-based processes on forest fragmentation effects. Global
Ecology Biogeography 15:8-20.
Laiolo, P. 2002. Effects of habitat structure, floral composition and diversity on a forest bird
community in north-western Italy. Folia Zoology 51(2):121-128.
Lauga, J; Joachim, J. 1992. Modelling the effects of forest fragmentation on certain species of
forestbreeding birds. Landscape Ecology 6(3):183-193.
Lee Jones, H. 2003. Birds of Belize. University of Texas Press, Austin TX. USA. 317 p.

71
Lindell, CA; Chomentowski, WH; Zook, JR. 2004. Characteristics of bird species using forest
and agricultural land covers in southern Costa Rica. Biodiversity and conservation
13:2419-2441.
Loehle, C; Wigley, TB; Shipman, PA; Fox, SF; Rutzmoser, S; Thill, RE; Melchiors, MA.
2005. Herpetofaunal species richness responses toforest landscape structure in
Arkansas. Forest Ecology and Management 209:293-308.
Lozada, T; Koning, GHJ, de; Marche´, R; Kleina, AM; Tscharntke, T. 2007. Tree recovery
and seed dispersal by birds: Comparing forest, agroforestry and abandoned
agroforestry in coastal Ecuador. Perspectives in Plant Ecology, Evolution and
Systematics 8:131-140.
MacArthur, R. 1955. Fluctuations of animal populations and a measure of community
stability. Ecology 36(3):533-536.
MacArthur, RH; MacArthur, JP. 1961. On bird species diversity. Ecology 42:594-598.
MacArthur, RH; Wilson, EO. 1967. The theory of island biogeography. Princeton University
Press, Princeton, N.J. USA.
MacArthur, RH; Diamond, JM; Karr, JR. 1972. Density compensation in island faunas.
Ecology 53:330-342.
Mapelli, FJ; Kittlein, MJ. 2009. Influence of patch and landscape characteristics on the
distribution of the subterranean rodent Ctenomys poteousi. Landscape Ecology 24:723-
733.
McCune, B; Mefford, MJ. 1999. PC_ORD. Multivariate analysis of ecological data. Version
5. MjM Software Design, Gleneden Beach, Oregon, USA.
McGarigal, K; Cushman, SA. 2005. The gradient concept of landscape structure. In J Wiens;
M Moss. Eds. 2005. Issues and perspectives in landscape ecology. Cambridge
University Press, UK. p. 112-119.
McIntyre, S; Hobbs, RJ. 1999. A framework for conceptualizing human impacts on landscapes
and its relevance to management and research. Conservation Biology 13:1282-1292.
McNeely, JA; Scherr, SJ. 2008. Ecoagricultura: estrategias para alimentar al mundo y salvar la
biodiversidad Silvestre. Trad. ME Juárez. IICA. San José, Costa Rica. Island Press.
390 p.
MEA (Millenium Ecosystem Assessment). 2005. Ecosystems and human well-bieng:
Biodiversity synthesis. World Resource Institute, Washington, D.C. 100 p.
Merola-Zwartjes, M; DeLong, JP. 2005. Avian species assemblages on New Mexico golf
courses: surrogate riparian habitat for Birds? Wildlife Society Bulletin 33:966-969.

72
Metzger, JP; Decamps, H. 1997. The structural connectivity threshold: a hypothesis in
conservation biology at the landscape scale. Ecological Applications 18:1-12.
Milder, JC; DeClerck, F; Sanfiorenzo, A; Merlo Sanchez, D; Tobar, D; Zuckerberg, B. 2010.
Effects of farm and landscape management on bird and butterfly conservation in
western Honduras. Ecosphere 1(1):1-22.
Moreno, CE. 2001. Métodos para medir la biodiversidad. M&T-Manuales y Tesis SEA, v.1.
83 p.
Moser, B; Jaeger, JAG; Tappeiner, U; Tasser, E; Eiselt, B. 2007. Modification of the effective
mesh size for measuring landscape fragmentation to solve the boundary problem.
Landscape Ecology 22:447-459.
Murphy, HT; Lovett-Doust, J. 2004. Context and connectivity in plant metapopulations and
landscape mosaics: does the matrix matter? Oikos 105:3-14.
O'Neill, RV; Krummel, JR; Gardner, RH. 1988. Indices of landscape pattern. Landscape
Ecology 1:153-162.
PCC (Proyecto Cacao Centroamerica). 2007. Competitividad y ambiente en los territorios
cacaoteros de Centroamerica. CATIE, Turriabla, Costa Rica. 181 p.
Perfecto, I; Vandermeer, J; Lopez Bautista, G; Ibarra Nunez, G; Greenberg, R; Bichier, P;
Langridge, S. 2004. Greater predation in shaded coffee farms: The role of resident
neotropical birds. Ecology 85(10):2677-2681.
Perfecto, L; Rice, R; Greenberg, R; Van der Voort, M. 1996. Shade coffee: a disappearing
refuge for biodiversity. BioScience 46:598-608.
Philipp, D; Gamboa, W. 2003. Observaciones sobre el sistema Mucuna-Maiz en laderas de
Waslala, Region Atlantic de Nicaragua. Agronomia Mesoamericana 14(2):215-221.
Phillpott, SM; Soong, O; Lowenstein, JH; Pulido, AL; Tobar Lopez, D; Flynn, DFB;
DeClerck, F. 2009. Functional richness and ecosystem services: bird predation on
arthropods in tropical agroecosystems. Ecological Applications 19(7):1858-1867.
Philpott, SM; Greenberg, R; Bichier, P; Perfecto, I. 2004. Impacts of major predators on
tropical agroforest arthropods: comparisons within and across taxa. Oecologia
140:140-149.
Pimentel, D; Stachow, E; Takacs, DA; Brubaker, HW; Dumas, AR; Meaney , JJ; O‟Neil, JS;
Onsi, DE; Corzilius, DB. 1992. Conserving biological diversity in agricultural/forestry
systems. BioScience 42:354-362.
Ralph, CJ; Geupel, GR; Pyle, P; Martin, TE; SeSante, DF; Milá, B. 1996. Manual de métodos
de campo para el monitoreo de aves terrestres. Gen. Tech. Rep. PSW-GTR-159.

73
Albany, California. Pacific Southwest Research Station, Forest Service, U.S.
Department of Agriculture. 44 p.
Ranganathan, J; Chan, KMA; Daily, GC. 2007. Satellite derection of bird community in
tropical countryside. Ecological Applications 17(5):1499-1510.
Reitsma, R; Parrish, JD; McLarney, W. 2001. The role of cacao plantations in maintaining
forest avian diversity in southeastern Costa Rica. Agroforestry Systems 53:185-193.
Rice, RA; Greenberg, R. 2000. Cacao cultivation and the conservation of biological diversity.
Ambio 29(3):167-173.
Ricketts, TH. 2001. The matrix matters: effective isolation in fragmented landscapes.
American Naturalist 158:87-99.
Ritters, KJ; O‟Neil, JS; Jones, KB. 1997. Assessing habitat suitability at multiple scales: A
landscape-level approach. Biological Conservation 81:191-202.
Ritters, KJ; Wickham, R; O‟Neill; Jones, B; Smith, E. 2000. Global-scale patterns of forest
fragmentation. (on line). Conservation Ecology 4(2): 3. Consulted 28 Jun. 2009.
Available at:http://www.consecol.org/vol4/iss2/art3/.
Robbins, CS; Dowell, BA; Dawson, DK; Colon, JS; Estrada, E; Sutton, A; Sutton, R; Weyer,
D. 1992. Comparison of Neotropical migrant landbird populations wintering in tropical
forest, isolated forest fragments, and agricultural habitats. In Hagan, J. M. Ill &
Johnston, D. WE. Eds. Ecology and conservaton of Neotropical migrant landbirds:
Washington, DC: Smithsonian Institution Press. p.207-220.
Root, RB. 1973. Organization of a plant-arthropod association in simple and diverse habitats:
the fauna of collards. Ecological Monographs 45:95-120.
Russell, KR; Guynn Junior, DC; Hanling, HG. 2002. Importance of small isolated wetlands
for herpetofaunal diversity in managed, young growth forests in the costal plains of
South Carolina. Forest Ecology and Management 163:43-59.
Ryan, TJ; Philippi, T; Leiden, YA; Dorcas, ME; Wigley, TB; Whitfield Gibbons, J. 2002.
Monitoring herpetofauna in a managed forest landscape: Effect of habitat types and
census techniques. Forest Ecology and Management 167:83-90.
Savage, JM. 2002. Amphibians and reptiles of Costa Rica: a herpetofauna between two
continents, between two seas. The University of Chicago, US. 934 p.
Schroth, G; Araujo, M; Faria, D; Bede, L. 2007. Conservation of biodiversity and ecosystem
services in the cacao production landscape of southern Bahia, Brazil.
Schroth, G; Harvey, CA. 2007. Biodiversity conservation in cocoa production landscapes: an
overview. Biodiversity Conservation 16:2237-2244.
74
Soares, C; Brito, JC. 2007. Environmental correlates for species richness among amphibians
and reptiles in a climate transition area. Biodiversity Conservation 16:1087-1102.
Solórzano, A. 2004. Serpientes de Costa Rica. INBio, San José, CR. 792 p.
Somarriba, E; Harvey, CA. 2003. ¿Cómo integrar producción sostenible y conservación de
biodiversidad en cacaotales orgánicos indígenas? Agroforestería en las Américas
10(38-38):12-17.
Steffan-Dewenter, I; Kessler, M; Barkmann, J; Bos, MM; Buchori, D; Erasmi, S; Faust, H;
Gerold, G; Glenk, K; Gradstein, SR; Guhardja, E; Harteveld M; Hertel, D; Hohn, P;
Kappas, M; Kohler, S; Leuschner, C; Maertens, M; Marggraf, R; Migge-Kleian, S;
Mogea, J; Pitopang, R; Schaefer, M; Schwarze, S; Sporn, SG; Steingrebe, A;
Tjitrosoedirdjo, SS; Tjitrosoemito, S; Twele, A; Weber, R; Woltmann, L; Zeller, M;
Tscharntke, T. 2007. Tradeoffs between income, biodiversity, and ecosystem
functioning during tropical rainforest conversion and agroforestry intensification.
PNAS 104(12):4973-4978.
Stiles, FG. 1985. Conservation of forest birds in Costa Rica: problems and perspectives.
International Council of Bird Persercation. Technical Publication No 4:141-168.
Stiles, FG; Skutch, AF. 2003. Aves de Costa Rica. Instituto Nacional de Biodiversidad
(INBio). Costa Rica 571 p.
Stotz, DF; Fitzpatrick, JW; Parker, I, T.A,; Moskovits, DK. 1996. Neotropical birds: ecology
and conservation. University of Chicago Press, Chicago, Illinois, USA. 467 p.
Tasser, E; Ruffini, FV; Tappeiner, U. 2009. An integrative approach for analyzing landscape
dynamics in diverse cultivated and natural mountain areas. Landscape Ecology 24:611-
628.
Tews, J; Brose, U; Grimm, V; Tielborger, K; Wichmann, MC; Schwager, M; Jeltsch, F. 2004.
Animal species diversity driven by habitat heterogeneity/diversity: the importance of
keystone structures. Journal of Biogeography 31:79-92.
Thiollay, JM. 1992. Influence of selective logging on bird species diversity in a Guianan
Rainforest. Conservation Biology 6(1):47-63.
Turner, MG; Gardner, RH; O‟Neill, RV. 2001. Landscape ecology in theory and practice:
pattern and process. University Wisconsin, US. 400 p.
Uezu, A; Metzger, JP; Vielliard, JME. 2005. Effects of structural and functional connectivity
and patch size on the abundance of seven Atlantic Forest bird species. Biological
Conservation 123:507-519.
Umetsu, F; Pardini, R. 2007. Small mammals in a mosaic of forest remnants and
anthropogenic habitats – evaluating matrix quality in an Atlantic forest landscape.
Landscape Ecology 22:517-530.
75
Urbina-Cardona, JN; Olivares-Perez, M; Reynoso, VH. 2006. Herpetofauna diversity and
microenvironment correlates across a pasture–edge–interior ecotone in tropical
rainforest fragments in the Los Tuxtlas Biosphere Reserve of Veracruz, Mexico.
Biological Conservation 132:61-75.
Vallan, D. 2000. Influence of forest fragmentation on amphibian diversity in the nature reserve
of Ambohitantely, highland Madagascar. Biological Conservation 96:31-43.
Vandermeer, J; Carvajal, C. 2001. Metapopulation dynamics and the quality of the matrix.
American Naturalist 158:211-220.
Wanger, TC; Saro, A; Iskandar, DT; Brook, BW; Sodhi, NS; Clough, Y; Tscharntke, T. 2009.
Conservation value of cacao agroforestry for amphibians and reptiles in South-East
Asia: combining correlative models with follow-up field experiments. Journal of
Applied Ecology 46:823-832.
Whitfield, AM; Kristen, EB; Thomas, P; Sasa, M; Bolaños, F; Chaves, G; Savage, J;
Donnelly, MA. 2007. Amphibian and reptile declines over 35 years at La Selva, Costa
Rica. Procceding of the National Academy of The Science of United States of America
104(20):8352- 8356.
Wiens, JA; Stenseth, NC; Vanhome, B. 1993. Ecological mechanisms and landscape ecology.
Oikos 66:369-380.
Wunderle, JM. 1994. Métodos para contar aves terrestres del Caribe. General Technical
Report SO-100. United States Department of Agriculture, Southern Forest Experiment
Station, New Orleans, Lousiana, USA. 24 p.

76
ANNEXES

77

77
Annex 1: List of selected cacao agroforestry systems and secondary forests as sampling units:- proprietor, location, geographical
coordinates, altitude and habitat typology, within the Municipality of Waslala, Nicaragua.
Code Proprietor Community Latitude
(y axis)
Longitude
(x axis)
Altitude
(masl) Habitat Typology
N01 Efraín Gómez Gonzales Zinica 13.4673056 -85.39233333 657 Cacao-Banana Agroforest
N02 José Víctor Raudez Jarquin Zinica 13.4676389 -85.39397222 681 Diversified Cacao Agroforest
N03 Rosa Aura López Ciprés 13.2885278 -85.39341667 481 Two-Strata Cacao Agroforest
N04 Cándido Duarte Mercado Ciprés 13.2815556 -85.38830556 356 Diversified Cacao Agroforest
N05 Francisco Arostegui Castillo Ciprés 13.2891389 -85.38566667 413 Two-Strata Cacao Agroforest
N06 Virgilio Herrera Posolera 13.2940556 -85.41352778 693 Two-Strata Cacao Agroforest
N07 Migdalia Gerónima Rodríguez Lara Posolera 13.2893889 -85.41266667 689 Two-Strata Cacao Agroforest
N08 Ana Cointa Castro Zamora Ciprés 13.3090556 -85.39230556 577 Diversified Cacao Agroforest
N09 Oscar Espinoza Ortega El papayo 13.3078889 -85.34955556 638 Two-Strata Cacao Agroforest
N10 José Ernesto Ortega Orozco El papayo 13.3070556 -85.34863889 649 Cacao-Banana Agroforest
N11 Sotero Sevilla Castro Waslalita 13.3399444 -85.39422222 636 Cacao-Banana Agroforest
N12 Eulalio Martínez Ochoa Ciprés 13.3006667 -85.39294444 556 Diversified Cacao Agroforest
N13 Rosendo Sánchez Hernández Corozal 13.3563056 -85.36955556 403 Diversified Cacao Agroforest
N14 Isabel Centeno Rodríguez Caño los Martínez 13.3713056 -85.40138889 537 Two-Strata Cacao Agroforest
N15 Margarito Gómez López Caño los Martínez 13.3786111 -85.40911111 547 Cacao-Banana Agroforest
N16 Jorge Olivas Ocampo El papayo 13.3067778 -85.35233333 540 Cacao-Banana Agroforest
N17 Santos Blandón González Kusuli 13.3944167 -85.32141667 255 Diversified Cacao Agroforest
N18 Crescencio Hernández Páez Kusuli 13.3929444 -85.31755556 248 Two-Strata Cacao Agroforest
N19 Rogelio Pérez Zamora Puerto Viejo 13.5085833 -85.25605556 244 Two-Strata Cacao Agroforest
N20 Riman López Martínez Boca de Piedra 13.4416111 -85.27886111 219 Diversified Cacao Agroforest
NB21 Reynaldo Cantarero Ocote Tuma 13.2446944 -85.30911111 382 Secondary Forest
N22 Rafael Gómez Boca de Piedra 13.4455556 -85.27375 220 Two-Strata Cacao Agroforest
N23 José Ramón Orozco González Ocote Tuma 13.2388889 -85.29747222 256 Diversified Cacao Agroforest

78
Code Proprietor Community Latitude
(y axis)
Longitude
(x axis)
Altitude
(masl) Habitat Typology
N24 Orlando Orozco González Ocote Tuma 13.2379167 -85.2975 251 Diversified Cacao Agroforest
N25 Reynaldo Cantarero Ocote Tuma 13.2433056 -85.30888889 357 Two-Strata Cacao Agroforest
N26 Noel Suazo Calderón Caño los Martínez 13.3732222 -85.40013889 487 Diversified Cacao Agroforest
N27 Aurelio Mendoza Rodríguez San Pablo Kubali 13.4803333 -85.27633333 237 Two-Strata Cacao Agroforest
N28 Sixto Mendoza Hernández San Pablo Kubali 13.4817222 -85.27886111 233 Two-Strata Cacao Agroforest
N29 Matías Mendoza Hernández San Pablo Kubali 13.4829167 -85.27633333 217 Two-Strata Cacao Agroforest
N30 Lisandro Flores Luna Las Jaguas 13.4452778 -85.30769444 235 Two-Strata Cacao Agroforest
N31 Presentacion Hernández Kusuli 13.4007222 -85.31916667 246 Two-Strata Cacao Agroforest
N32 Benito Díaz Zeledón Las Jaguas 13.43775 -85.31511111 246 Two-Strata Cacao Agroforest
N33 Estanislao Blandón Montenegro Boca de Piedra 13.4355 -85.27511111 218 Diversified Cacao Agroforest
N34 Julio Figueroa Díaz Boca de Piedra 13.4334722 -85.26852778 257 Diversified Cacao Agroforest
NB35 Francisco Cordero Aserrillo 13.3208056 -85.39927778 595 Secondary Forest
N36 Natividad García Ochoa San Miguel Dudu 13.31 -85.29638889 242 Diversified Cacao Agroforest
N37 Isidro Granado Montoya San Miguel Dudu 13.3132778 -85.30041667 263 Two-Strata Cacao Agroforest
N38 María saba García Dávila San Miguel Dudu 13.3089167 -85.29916667 228 Cacao-Banana Agroforest
NB39 Thomasa Montoya Posolera 13.29261 -85.4097 350 Secondary Forest
NB40 Margarito Gómez Caño los Martínez 13.37631 -85.4124 447 Secondary Forest
NB41 Nelson Álvarez Murrillo Yerba Buena 13.31472 -85.3617 539 Secondary Forest
NB42 Marvin Benito Zeledón Pejibaye 13.51111 -85.2167 329 Secondary Forest

Annex 2. List of bird species recorded in Waslala, Nicaragua. C_B_AF = Cacao-Banana AFS, S_C_AF = Two-Strata Cacao AFS,
D_C_AF = Diversified Cacao AFS, S_For = Secondary Forest; Habitat = preferred habitat based on Stiles (1985): NF = non-
forest, FC = forest canopy, FE = forest edge, FI = forest interior; FD = degree of forest dependence based on Stiles (1986):- 1 =
generalist, 2 = forest generalist, 3 = forest specialist; sensitivity = degree of birds’ sensitivity to human disturbances based on Stotz
et al. (1996):- L = Low, M = Medium, H = High; and IUCN Status:- LC = specie of least conservation concern, NT = near
threatened species.
Scientific Name English Name C_B_AF S_C_AF D_C_AF S_For Habitat FD Sensitivity IUCN
status
Ardeidae
Bubulcus ibis Cattle Egret x NF 1 L LC
Accipitridae
Elanus caeruleus Black-shouldered Kite x NF L LC
Ictinia plumbea Plumbeous Kite x FC 2 M LC
Buteo magnirostris Roadside Hawk x x x FE, NF 1 L LC
Buteo brachyurus Short-tailed Hawk x FC 3 M LC
Falconidae
Herpetotheres
cachinnans
Laughing Falcon x FE, FC 2 L LC
Cracidae
Ortalis cinereiceps Gray-headed Chachalaca x x x FE, NF 1 L LC
Columbidae
Claravis pretiosa Blue Ground-Dove x x FE, NF 1 L LC
Leptotila cassinii Gray-breasted Dove x x x x FE, NF 1 M LC
Columba flavirostris Red-billed Pigeon x x x x NF, FE, FC 1 M C
Columbina talpacoti Ruddy Ground-Dove x NF 1 L LC
Geotrygon montana Ruddy Quail-Dove x FI, FE 3 M LC

79
Scientific Name English Name C_B_AF S_C_AF D_C_AF S_For Habitat FD Sensitivity IUCN
status
Psittacidae
Aratinga finschi Crimson-fronted Parakeet x x x x FE, NF 1 M LC
Amazona farinosa Mealy Parrot x FC 3 M LC
Aratinga nana Olive-throated Parakeet x x FC, FE, NF 2 L LC
Brotogeris jugularis Orange-chinned Parakeet x x x x FC, FE, NF 1 L LC
Amazona autumnalis Red-lored Parrot x FC, FE, NF 1 M LC
Pionus senilis White-crowned Parrot x x x FE, FC 2 M LC
Cuculidae
Crothophaga sulcirostris Groove-billed Ani x x x NF 1 L LC
Piaya cayana Squirrel Cukoo x x x FE, FC 1 L LC
Tytonidae
Tyto alba Barn Owl x FE, NF 1 L LC
Strigidae
Ciccaba virgata Mottled Owl x FI, FE, (FC) 2 M LC
Caprimulgidae
Nyctidromus albicollis Common Paraque x FE, NF 1 L LC
Trochilidae
Threnetes ruckeri Band-tailed Barbthroat x FI, FE 2 H LC
Hylocharis eliciae Blue-throated Goldentail x x x x FC, FE 2 M LC
Anthracothorax prevostii Green-breasted Mango x FE, NF 1 L LC
Phaethornis
longuemareus
Little Hermit x x x x FI, FE 1 M LC
Heliomaster longirostris Long-billed Starthroat x x FC, FE, NF 1 M LC

80
Scientific Name English Name C_B_AF S_C_AF D_C_AF S_For Habitat FD Sensitivity IUCN
status
Phaethornis
superciliosus
Long-tailed Hermit x x x x FI, FE 2 H LC
Archilochus colubris Ruby-throated Hummingbird x FE, NF 1 L LC
Amazilia tzacatl Rufous-tailed Hummingbird x x x x NF, FE 1 L LC
Phaeochroa cuvierii Scaly-breasted Hummingbird x x FE, FC, NF 1 L LC
Amazilia candida White-bellied Emerald x x x FE 2 M LC
Trogonidae
Trogon melanocephalus Black-headed Trogon x x x x FC, FE 2 L LC
Trogon rufus Black-throated Trogon x FI, FE 3 M LC
Trogon violaceus Violaceous Trogon x x FE 1 M LC
Alcedinidae
Chloroceryle americana Green Kingfisher x FI, FE 2 L LC
Momotidae
Momotus momota Blue-crowned Mot-Mot x x x x FE, NF, (FI) 1 M LC
Electron platyrhynchum Broad-billed Mot-mot x FC, FE 2 M LC
Eumomota superciliosa Torquiose-browed Motmot x FE, NF 1 L LC
Galbulidae
Galbula ruficauda Rufous-tailed Jacamar x x FE 2 L LC
Bucconidae
Malacoptila panamensis White-wiskered Puffbird x FI, FE 3 M LC
Ramphastidae
Pteroglossus torquatus Collared Aracari x x x x FC, FE, NF 2 M LC
Ramphastos sulfuratus Keel-billed Toucan x x x x FC, FE 2 M LC

81
Scientific Name English Name C_B_AF S_C_AF D_C_AF S_For Habitat FD Sensitivity IUCN
status
Picidae
Melanerpes pucherani Black-cheeked Woodpecker x x x FC, FE 2 M LC
Melanerpes aurifrons Golden-fronted Woodpecker x FE, NF 1 L LC
Piculus rubiginosus Golden-Olive Woodpecker x x x FC, FE 2 L LC
Dryocopus lineatus Lineated Woodpecker x x FE, NF 1 L LC
Picumnus olivaceus Olivaceous Piculet x FE, NF 1 L LC
Veniliornis fumigatus Smokey-brown Woodpecker x FC, FE 2 L LC
Sphyrapicus varius Yellow-bellied Sap-sucker x FE, NF 1 L LC
Furnariidae
Xenops minutus Plain Xenops x x FC, FE 2 M LC
Anabacerthia
variegaticeps
Spectacle-throated Foliage-
gleaner
x FC, FE, FI 3 H LC
Dendrocolaptidae
Xiphorhynchus
flavigaster
Ivory-billed Woodcreeper x FC, FE 2 M LC
Sittasomus griseicapillus Olivaceous Woodcreeper x FI, FE, FC 2 M LC
Dendrocincla
homochroa
Ruddy Woodcreeper x FI, FE 3 H LC
Lepidocolaptes souleyetii Streak-headed woodcreeper x x x FE, NF, FC 1 L LC
Dendrocincla anabatina Tawny-winged Woodcreeper x x x FI, FE 3 H LC
Glyphorhynchus spirurus Wedge-billed Woodcreeper x x x FC, FI, FE 2 M LC
Formicariidae
Gymnocichla nudiceps Bare-crowned Antbird x FE, NF, FI 2 M LC
Thamnophilus doliatus Barred Antshrike x x x FI, FE, NF 1 L LC
Myrmotherula
schisticolor
Slaty Antwren x FI, FE 3 M LC

82
Scientific Name English Name C_B_AF S_C_AF D_C_AF S_For Habitat FD Sensitivity IUCN
status
Tyrannidae
Megarhynchus pitangua Boat-billed flycatcher x x x x FC, FE, NF 1 L LC
Attila spadiceus Bright-rumped Attilia x x FC, FE 2 M LC
Todirostrum cinereum Common Tody-Flycatcher x x x x FE, NF, NF 1 L LC
Myiarchus tuberculifer Dusky-capped Flycatcher x x x x FC, FE, NF 1 L LC
Rhynchocyclus
brevirostris
Eye-ringed Flatbill x FI, FE 3 M LC
Myiarchus crinitus Great Crested Flycatcher x x FC, FE, 2 L LC
Pitangus sulphuratus Great Kiskadee x x FE, NF 1 L LC
Myiopagis viridicata Greenish Elaenia x x FE, FC 2 M LC
Epidonax minimus Least Flycatcher x x NF, (FE) 1 L LC
Zimmerius vilissimus Mistletoe Tyrannulet x x x x FC, FE, NF 2 M LC
Oncostoma cinereigulare Northern Bentbill x x x NF, FE, FI 1 L LC
Mionectes oleagineus Ochre-bellied Flycatcher x x x x FI, FE 2 M LC
Legatus leucophaius Piratic Flycatcher x FE, NF 1 L LC
Terenotriccus erythrurus Ruddy-tailed Flycatcher x x FE, FI 2 H LC
Todirostrum sylvia Slate-headed Tody Flycatcher x NF, (FI) 1 L LC
Myiozetetes similis Social Flycatcher x x x x FE, NF 1 L LC
Myiodynastes luteiventris Sulfer-bellied Flycatcher x x FC, FE 1 L LC
Tyrannus melancholicus Tropical Kingbird x x NF, FC 1 L LC
Contopus cinereus Tropical Pewee x x x NF 1 L LC
Elaenia flavogaster Yellow-bellied Elaenia x x x NF, FE 1 L LC
Empidonax flaviventris Yellow-bellied Flycatcher x x x x FI, FE 2 L LC
Ornithion semiflavum Yellow-bellied Tyrannulet x FE, FC 2 M LC
Empidonax flavescens Yellowish Flycatcher x FC, FE 2 L LC
Tolmomyias
sulphurescens
Yellow-olive Flycatcher x x x x FE, NF, FC 1 M LC

83
Scientific Name English Name C_B_AF S_C_AF D_C_AF S_For Habitat FD Sensitivity IUCN
status
Pipridae
Schiffornis turdinus Thrushlike Schissiforn x FI 3 H LC
Manacus candei White-collared Manakin x x x x FE, FI 2 M LC
Tityridae
Tityra inquisitor Black-crowned Tityra x x FC, FE 2 M LC
Tityra semifaciata Masked Tityra x x x x FC, FE 1 M LC
Pachyramphus
polychopterus
White-winged Becard x x FE 1 L LC
Vireonidae
Vireo solitarius Blue-headed Vireo x FE, FC 2 M LC
Hylophilus decurtatus Lesser Greenlet x x FE, FC 2 M LC
Vireo philadelphicus Philadelphia vireo x x x x FC, FE, NF 1 L LC
Vireo olivaceus Red-eyed Vireo x x FE, NF 1 L LC
Cyclarhis gujanensis Rufous-browed Peppershrike x x FC, FE, NF 1 L LC
Vireo gilvus Warbling Vireo x FE, NF 1 L LC
Vireo flavifrons Yellow-throated Vireo x x FC, FE 2 L LC
Corvidae
Cyanocorax morio Brown Jay x x x x FE, NF 1 L LC
Trogolodytidae
Troglodytes aedon Common House Wren x x x NF 1 L LC
Henicorhina leucophrys Gray-breasted Wood-wren x FI, FE 3 M LC
Microcerculus philomela Nightingale Wren x FI 3 H LC
Thryothorus rufalbus Rufous-and-white Wren x FI, FE 3 M LC
Thryothorus
maculipectus
Spotted-breasted Wren x x x x FE, NF 1 L LC

84
Scientific Name English Name C_B_AF S_C_AF D_C_AF S_For Habitat FD Sensitivity IUCN
status
Sylviidae
Ramphocaenus
melanurus
Long-billed Gnatwren x x FE, NF, FI 1 M LC
Polioptila plumbea Tropical Gnatcatcher x x FC, FE 2 L LC
Turdidae
Turdus grayi Clay-colored Thrush x x x x NF, FE 1 L LC
Hylocichla mustelina Wood thrush x x x x FI, FE 3 M LC
Thraupidae
Thraupis episcopus Blue-gray Tanager x x x FE, FC, NF 1 L LC
Phlogothraupis
sanguinolenta
Crimson-collared Tanager x x x x FE, NF 1 L LC
Tangara larvata Golden-hooded Tanager x x x x FE, NF, FC 1 L LC
Eucometis penicillata Gray-headed Tanager x x x FI, FE 3 M LC
Chlorophanes spiza Green Honeycreeper x FC, FE 2 M LC
Euphonia gouldi Olive-backed Euphonia x FC, FE 2 M LC
Cyanerpes cyaneus Red-legged Honeycreeper x x FC, FE 2 L LC
Habia fuscicauda Red-throated Ant-Tanager x x x x FI, FE 2 M LC
Tangara lavinia Rufous-winged Tanager x FC, FE, NF 2 M LC
Ramphocelus passerinii Scarlet-rumped Tanager x x x x NF 1 L LC
Euphonia affinis Scrub Euphonia x FC, FE 2 L LC
Piranga rubra Summer Tanager x x x x FC, FE, NF 1 L LC
Tachyphonus delattrii Tawny-crested Tanager x FC, FE 1 M LC
Euphonia laniirostris Thick-billed Euphonia x FC, FE, NF 1 L LC
Piranga ludoviciana Western Tanager x x x FE, FC, NF 1 M LC
Euphonia minuta White-vented Euphonia x FC, FE 2 M LC
Euphonia luteicapilla Yellow-crowned Euphonia x x x FE, NF 1 L LC
Euphonia hirundinacea Yellow-throated Euphonia x x x x FC, FE, NF 1 L LC
Thraupis abbas Yellow-winged Tanager x x x FE, FC, NF 1 L LC
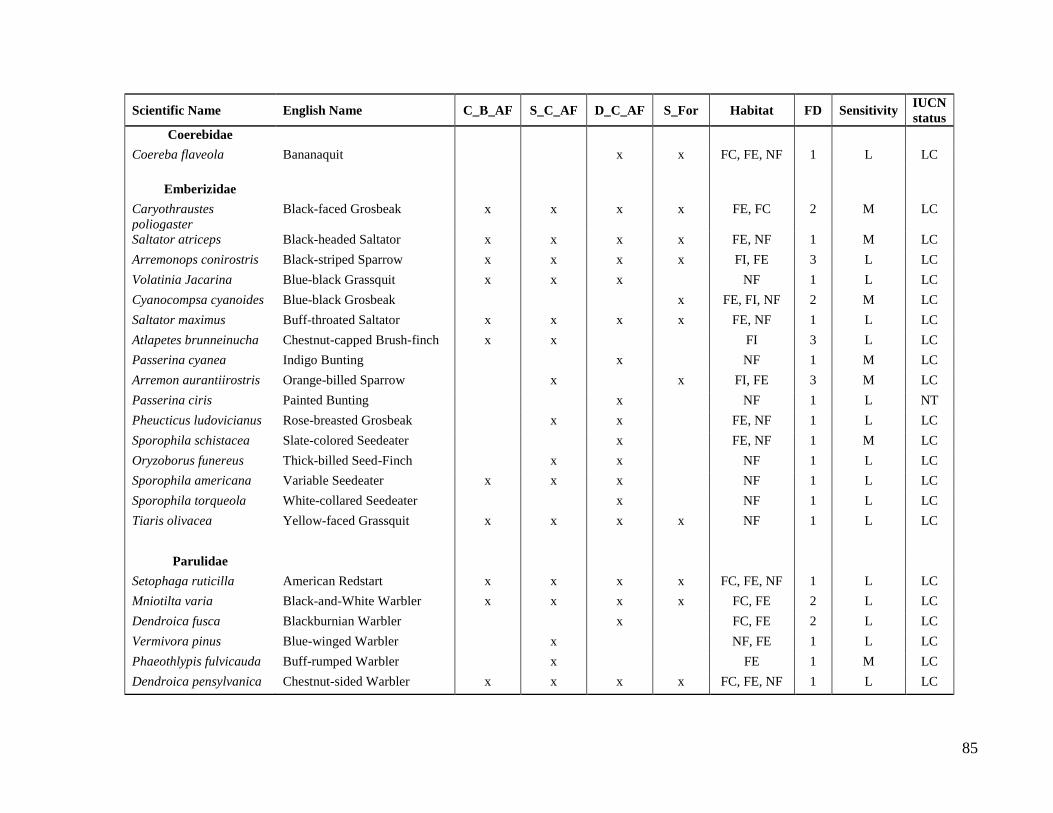
85
Scientific Name English Name C_B_AF S_C_AF D_C_AF S_For Habitat FD Sensitivity IUCN
status
Coerebidae
Coereba flaveola Bananaquit x x FC, FE, NF 1 L LC
Emberizidae
Caryothraustes
poliogaster
Black-faced Grosbeak x x x x FE, FC 2 M LC
Saltator atriceps Black-headed Saltator x x x x FE, NF 1 M LC
Arremonops conirostris Black-striped Sparrow x x x x FI, FE 3 L LC
Volatinia Jacarina Blue-black Grassquit x x x NF 1 L LC
Cyanocompsa cyanoides Blue-black Grosbeak x FE, FI, NF 2 M LC
Saltator maximus Buff-throated Saltator x x x x FE, NF 1 L LC
Atlapetes brunneinucha Chestnut-capped Brush-finch x x FI 3 L LC
Passerina cyanea Indigo Bunting x NF 1 M LC
Arremon aurantiirostris Orange-billed Sparrow x x FI, FE 3 M LC
Passerina ciris Painted Bunting x NF 1 L NT
Pheucticus ludovicianus Rose-breasted Grosbeak x x FE, NF 1 L LC
Sporophila schistacea Slate-colored Seedeater x FE, NF 1 M LC
Oryzoborus funereus Thick-billed Seed-Finch x x NF 1 L LC
Sporophila americana Variable Seedeater x x x NF 1 L LC
Sporophila torqueola White-collared Seedeater x NF 1 L LC
Tiaris olivacea Yellow-faced Grassquit x x x x NF 1 L LC
Parulidae
Setophaga ruticilla American Redstart x x x x FC, FE, NF 1 L LC
Mniotilta varia Black-and-White Warbler x x x x FC, FE 2 L LC
Dendroica fusca Blackburnian Warbler x FC, FE 2 L LC
Vermivora pinus Blue-winged Warbler x NF, FE 1 L LC
Phaeothlypis fulvicauda Buff-rumped Warbler x FE 1 M LC
Dendroica pensylvanica Chestnut-sided Warbler x x x x FC, FE, NF 1 L LC

86
Scientific Name English Name C_B_AF S_C_AF D_C_AF S_For Habitats FD Sensitivity IUCN
status
Geothlypis trichas Common Yellowthroat x NF 1 L LC
Basileuterus culicivorus Golden-crowned Warbler x x x FI, FE 3 M LC
Vermivora chrysoptera Golden-winged Warbler x x x FI, FE 2 L NT
Geothlypis poliocephala Gray-crowned Yellowthroat x NF 1 L LC
Dendroica occidentalis Hermit warbler x FE, FC, NF 1 M LC
Wilsonia citrina Hooded Warbler x x x x FI, FE 2 M LC
Seiurus motacilla Lousiana Waterthrush x x FE, NF 1 M LC
Dendroica magnolia Magnolia Warbler x x FE, FC, NF 1 L LC
Oporornis philadelphia Mouring Warbler x NF 1 L LC
Seiurus aurocapillus Oven Bird x FI, FE, (NF) 2 M LC
Vermivora peregrina Tennessee Warbler x x x FE, FC, NF 1 L LC
Parula pitiayumi Tropical Parula x x x x FC, FE 2 M LC
Wilsonia pusilla Wilson's Warbler x x x x FC, FE, NF 1 L LC
Helmitheros vermivorus Worm-eating Warbler x FI, FE 2 M LC
Dendroica petechia Yellow Warbler x x x NF, FE 1 L LC
Dendroica dominica Yellow-throated Warbler x x FE, NF 1 L LC
Icteridae
Icterus galbula Baltimore Oriole x x FC, FE, NF 1 M LC
Icterus dominicensis Black-cowled Oriole x x FE, NF 1 L LC
Quiscalus mexicanus Great-tailed Grackle x x x NF, FE 1 L LC
Dives dives Melodious blackbird x x x NF 1 L LC
Psarocolius montezuma Montezuma Oropendola x x x x FE, NF, FC 1 M LC
Icterus spurius Orchard Oriole x FE, NF 1 L LC
Amblycercus
holosericeus
Yellow-billed Cacique x x x x FE, NF 1 M LC
Icterus mesomelas Yellow-tailed Oriole x FE, NF 1 L LC

87
Annex 3: Amphibian species list recorded in Waslala, Nicaragua. C_B_AF = Cacao-Banana
AFS, S_C_AF = Two-Strata Cacao AFS, D_C_AF = Diversified Cacao AFS, S_For =
Secondary Forest.
Scientific Name C_B_AF S_C_AF D_C_AF S_For
Caeciliidae
Gymnopis multiplicata x
Bufonidae
Bufo coccifer x x x
Bufo marinus x
Dendrobatidae
Oophaga pumilio x x
Leptodactylidae
Eleutherodactylus biporcatus x x
Eleutherodactylus bransfordii x x x x
Diasporus diastema x x x x
Eleutherodactylus fitzingeri x x
Eleutherodactylus ridens x x x
Leptodactylus pentadactylus x
Hylidae
Smilisca phaeota x
Ranidae
Rana maculata x x

88
Annex 4: Reptile species recorded in Waslala, Nicaragua. C_B_AF = Cacao-Banana AFS,
S_C_AF = Two-Strata Cacao AFS, D_C_AF = Diversified Cacao AFS, S_For = Secondary
Forest.
Scientific Name C_B_AF S_C_AF D_C_AF S_For
Polychrotidae
Norops cupreus x
Norops humilis x x x x
Norops lemurinus x x x
Norops limifrons x x x x
Norops lionotus x x
Norops sp x
Scincidae
Mabuya unimarginata x x
Teiidae
Ameiva festiva x x x x
Viperidae
Atropoides nummifer x
Bothrops asper x
Elapidae
Micrurus nigrocinctus x
Colubridae
Coniophanes fissidens x
Dryadophis melanolomus x
Drymobius margariferus x
Geophis hoffmanni x x
Hydromorphus concolor x
Imantodes cenchoa x x
Ninia maculata x x x x
Ninia sebae x x

1