Embed Size (px)
Citation preview

C e n t r e Pi e c eThe Magazine of The Centre for Economic Performance Volume 22 Issue 3 Autumn 2017
Happiness at work Atlas of UK industryRefugee waves Pay and productivityGender gaps Brexit and food prices Stamp duty Scientific infrastructure
ISSN 1362-3761
DARK WEB: THE ECONOMICS OF
ONLINE DRUGS MARKETS

Cen treP ieceCentrePiece is the magazine of the
Centre for Economic Performance at the
London School of Economics. Articles in this
issue reflect the opinions of the authors, not
of the Centre. Requests for permission to
reproduce the articles should be sent to the
Editor at the address below.
Editorial and Subscriptions Office
Centre for Economic Performance
London School of Economics
Houghton Street
London WC2A 2AE
Annual subscriptions for one year (3 issues):
Individuals £13.00
Students £8.00
Organisations (UK and Europe) £30.00
Rest of world £39.00
Visa and Mastercard accepted
Cheques payable to London School
of Economics
CEP director, Stephen Machin
Editor, Romesh Vaitilingam
Design, DesignRaphael Ltd
Print, Westminster European/Lavenham Press Ltd
© Centre for Economic Performance 2017
Volume 22 Issue 3
(ISSN 1362-3761) All rights reserved.
EditorialThe UK’s financial services industry is not
nearly as London-centric as the creative
industries. Rather than the South East of
England being the country’s productivity
engine, it is a band stretching west from
the capital along the M4 corridor towards
Bristol. And in addition to longstanding
concerns about the North-South divide,
there are emerging disparities between
coastal and inland areas.
These are some of the ten key facts
about the UK’s business geography in a
new ‘atlas’ compiled by the Centre for
Economic Performance (CEP) research
team at the heart of the LSE Growth
Commission. With the government’s
professed interest in addressing the
country’s regionally uneven economic
performance, the findings, summarised in
this issue of CentrePiece magazine, shed
light on the scale of the task.
The proposed ‘Industrial Strategy’ will
also be informed by a related report on
the local economic effects of Brexit – the
latest in our series of policy briefings
on the likely impact of leaving the
European Union on living standards,
trade, immigration, foreign investment,
inequality, regulation and the labour
market. Here we present the first full
data on what has happened to inflation
in the wake of last year’s referendum
vote: these reveal a significant rise
in consumer prices, particularly food
prices. Coupled with limited increases in
nominal wages, this has led to the return
of falling real wages.
Elsewhere in this issue, we explore
some other prominent topics in current
public debate. One article explains how
stamp duty contributes to the UK’s
housing crisis by preventing households
from moving to more suitable homes.
Another considers evidence from a range
of countries showing that refugees
have modest or no harmful effects on
the wages and employment of native
workers. And a third describes an
emerging pattern of increasing inequality
of wages and productivity between
firms in the manufacturing and services
sectors of many OECD countries – the
‘Great Divergences’.
Finally, our cover story analyses data
from online platforms for buying and
selling drugs collected from the so-
called ‘dark web’ – the latest work on
the economics of crime by CEP’s director
Stephen Machin and colleagues. He will
also be delivering the high-profile annual
public lecture of the Royal Economic
Society towards the end of the year,
focusing on the importance of economic
incentives as a determinant of crime and
what can be done to discourage, detect
and apprehend criminals.
Romesh Vaitilingam, Editor

Contents
Page 2The growing inequality between firmsGiuseppe Berlingieri and colleagues analyse data on the dispersion
of wages and productivity in OECD countries
Page 8Industry in Britain: an atlas Sandra Bernick and colleagues map the geography of UK firms,
employment, productivity and innovation
Page 12Dark web: the economics of online drugs markets Stephen Machin and colleagues explore online platforms for buying
and selling drugs
Page 17Stamp duty, mobility and the UK housing crisisChristian Hilber and Teemu Lyytikäinen explain the value of
replacing stamp duty with better-designed local taxes
Page 21Happiness at workJan-Emmanuel De Neve and George Ward summarise evidence on
which elements of our working lives drive our wellbeing
Page 26The labour market impact of refugee wavesMichael Clemens and Jennifer Hunt confirm that immigration has
few harmful effects on the wages and employment of native workers
page 8Industry in Britain: an atlas
page 15Where top science gets done
in briefPage 6How the rise of the service economy narrowed the gender gapStructural transformation gives women
a comparative advantage, according to
Rachel Ngai and Barbara Petrongolo
Page 15Where top science gets doneChristian Helmers and Henry Overman
examine the impact of the Diamond Light
Source synchrotron on scientific output
Page 24Brexit: the impact on pricesJosh De Lyon and colleagues look
at UK price inflation before and after
the referendum
page 2The growing inequality between firms
CentrePiece Autumn 2017
1
The growing inequality between firms
Some firms pay well while others don’t; and some are highly productive while many aren’t. Giuseppe Berlingieri, Patrick Blanchenay and Chiara Criscuolo analyse new firm-level data on the increasing dispersion of wages and productivity in both the manufacturing and services sectors in 16 OECD countries – the ‘Great Divergences’.
CentrePiece Autumn 2017
2

Between-firm wage dispersion
2001 2003 2005 2007 2009 2011 2013
Year
■14%
12%
10%
8%
6%
4%
2%
0%
-2%
60
50
40
30
20
10
Labour productivity dispersionMulti-factor productivity dispersion
2001 2003 2005 2007 2009 2011 2013
Year
Perc
enta
ge
Perc
enta
ge
■
■
16%
14%
12%
10%
8%
6%
4%
2%
0%
60
50
40
30
20
10
Over the last three decades,
many economies have
experienced increasing
inequality in earnings. A
number of studies show that most of
this dispersion comes from increasing
differences in wages between the best-
and worst-paying firms, rather than from
a growing gap between top and bottom
earners within the same firm.
At the same time, recent evidence
suggests that there has been a significant
increase in the gap between the globally
most productive firms and the rest. This
suggests that there might be a positive
relationship between the two divergences
in wages and productivity. In recent
research, we provide evidence of these
‘Great Divergences’ using novel micro-
aggregated firm-level data.
Our study analyses firm-level data on
the increasing dispersion of wages and
productivity in both the manufacturing
and services sectors in 16 OECD countries:
Australia, Austria, Belgium, Canada, Chile,
Denmark, Finland, France, Hungary, Italy,
Japan, Luxembourg, the Netherlands,
Norway, New Zealand and Sweden.
We find that wage inequalities are
growing between firms, even those
operating in the same sector – and
these inequalities are linked to growing
differences between high and low
productivity firms. Both globalisation
and technological progress (notably
information and communications
technologies, ICT) influence these
outcomes – as do policies and institutions
such as minimum wages, employment
protection legislation, unions and
processes of wage-setting.
In Figure 1, the top panel represents
how the 90-10 wage ratio, which
compares wages in firms at the top 10%
of the wage distribution with wages in
firms at the bottom 10%, has changed
Figure 1:
‘Great Divergences’: wage and productivity dispersion over time within sectors and countries
Globalisation, technology,
policies and institutions are
all driving ‘Great Divergences’ in wages and productivity
CentrePiece Autumn 2017
3

in particular from the bottom of the
distribution.
The top panel of Figure 2 shows
how the ratio of wages between the top
decile and the median (upper tail wage
inequality, red line), and between the
median and bottom decile (lower tail
wage inequality, blue line) have evolved
between 2001 and 2012. The gap in
average wage between the bottom decile
and the median grew faster between
2001 and 2012 than the gap between
the median and the top decile – that
is, lower tail inequality grew faster
than upper tail inequality. The same
dispersion from the bottom occurred in
the distribution of productivity (bottom
panel). In other words, the dispersion of
both wages and productivity has been
faster at the bottom than at the top.
These parallel trends in dispersion
suggest that the distributions of wages
and productivity are linked. Our research
investigates the role of structural factors
as well as policies and institutional
features of the economy that might
have strengthened or weakened
the correlation between wage and
productivity dispersion.
First, we find that globalisation and
digitalisation are not only associated
with an increase in between-firm wage
inequality, but also that they strengthen
the link between wages and productivity
dispersion. In sectors where firms increase
the use of ICT over time, wage dispersion
grows faster, which suggests that ICT
affects firms heterogeneously.
We also look at sectors that become
more open to trade through either
imports or exports. In those sectors, not
only has wage dispersion increased but its
link with productivity dispersion has also
been strengthened.
Country-specific policies and
institutions also play a role in shaping
the evolution of wage and productivity
dispersions, and the link between
them. Our research focuses on the role
of wage-setting institutions and labour
market features:
n Minimum wages (in terms of both
the hourly real minimum wage and the
minimum relative to average wages of
full-time workers).
n Employment protection legislation
(strictness of employment protection for
both individual and collective dismissals).
Figure 2:
Wage and productivity dispersion at the top and bottom of the distribution, over time within sectors and countries
■
■
2001 2003 2005 2007 2009 2011 2013
Year
12%
10%
8%
6%
4%
2%
0%
-2%
Wage bottom dispersionWage top dispersion
■
■
Multi-factor productivity bottom dispersionMulti-factor productivity top dispersion
2001 2003 2005 2007 2009 2011 2013
Year
Perc
enta
ge
Perc
enta
ge
12%
10%
8%
6%
4%
2%
0%
-2%
Wage inequalities are growing between firms, even those operating in the same sector
since 2001. A higher ratio indicates more
differences between high-paying
and low-paying firms. Over that period,
wage differences between firms in the
same country and same sector increased
by 12%.
Over the same period, productivity
experienced a similar divergence.
Differences between the most productive
and least productive firms of the same
country and same sector increased by
12.8% for labour productivity (bottom
panel, blue line) and 14% for multi-factor
productivity (bottom panel, red line).
Much discussion of inequality has
focused on increasing differences
between the top 1% of earners and
the rest of the income distribution. Our
study shows that wage inequalities also
come from divergence between firms,
CentrePiece Autumn 2017
4
n Trade union density.
n And coordination in wage-setting.
Our results suggest that all of these
policies have the intended consequence
of reducing wage dispersion and, hence,
overall inequality. At the same time,
they affect the link between wage and
productivity dispersion.
For example, more centralised
bargaining is associated with a weaker
link between productivity and wage
dispersion, while this is not the case
for changes in employment protection
legislation and union density. More
centralised bargaining can therefore help
to limit wage dispersion, but at the same
time it weakens the link between wages
and productivity dispersion, which might
be detrimental to long-run growth.
Conversely, minimum wage
policies, while also reducing wage
dispersion, are associated with a stronger
link between wage and productivity
dispersion over time, which could benefit
long-run growth.
This article summarises ‘The Great
Divergence(s)’ by Giuseppe Berlingieri,
Patrick Blanchenay and Chiara Criscuolo,
CEP Discussion Paper No. 1488 (http://
cep.lse.ac.uk/pubs/download/dp1488.pdf).
Giuseppe Berlingieri is assistant professor
at ESSEC Business School, an economist
in the Directorate for Science, Technology
and Innovation at the OECD and a research
associate in CEP’s trade programme.
Patrick Blanchenay is assistant professor,
teaching stream, at the University of
Toronto. Chiara Criscuolo is the head of the
Productivity and Business Dynamics division
in the Directorate for Science, Technology
and Innovation at the OECD and a CEP
research associate.
Some firms pay well while others don’t; and some are highly productive while many aren’t
The dispersion of both wages and productivity has been faster at the bottom than at the top
But one ought to be careful. By
changing how easy it is for firms to hire
workers or dismiss them, these policies
affect how labour flows to the best firms.
This dampens the transmission channel
between productivity dispersion and
wage dispersion.
Thus, policies that might be beneficial
to workers in the short run by shielding
them from productivity fluctuations may
have a detrimental impact in the long
run. By hindering the reallocation of
resources away from poorly performing
to highly productive firms, they might
inadvertently trap workers in low-paying
firms, rather than giving them the
opportunity to earn higher wages in more
productive firms.
CentrePiece Autumn 2017
5

in brief...How the rise of the service economy narrowed the gender gap
One of the most remarkable changes in the labour markets of
rich countries since the Second World War has been the rise
of female participation in the workforce. In the United States,
for example, the employment rate of women has more than
doubled: from about 35% in 1945 to 77% at the end of the
twentieth century. Several European countries, including the
UK, have experienced very similar trends.
There has been a huge amount of research on the causes
and consequences of the rise in women’s involvement in
the labour market. Proposed explanations include medical
advances, growing investment in human capital, technological
progress in the household and wider availability of childcare.
Our research puts forward a new and complementary
explanation based on the secular expansion of the service
economy and its role in raising the relative demand for female
work. Our emphasis on the evolution of the industry structure
is motivated by a few observations.
First, the sustained rise in female work since the late 1960s
in the United States has been accompanied by a fall in male
work and a rise in women’s relative wages. In 1968, women’s
hours were about 37% of men’s hours and their wages were
about 62% of male wages. By 2008, these ratios had risen to
73% and 81%, respectively.
The historical growth in the service sector has created jobs for which women have a comparative advantage, according to analysis by Rachel Ngai and Barbara Petrongolo.
Second, the entire (net) rise in female hours has taken place
in the broad service sector, while the entire (net) fall in male
hours has taken place in goods-producing sectors, including
the primary sector, manufacturing, construction and utilities.
This pattern is closely linked to the process of ‘structural
transformation’, and specifically the reallocation of labour
from goods to service industries, with an expansion of the
service share from 56% in 1968 to 75% in 2008.
Finally, the rise in women’s hours in the service sector has been
accompanied by a strong decline in their working hours in the
household – from about 41 to 31 hours weekly – consistent
with substantial ‘marketisation’ of home production.
Men’s working hours mostly bore
the burden of deindustrialisation
CentrePiece Autumn 2017
6

One reason for the significance of services is that their
production is relatively less intensive in the use of ‘brawn’
skills than the production of goods – and relatively more
intensive in the use of ‘brain’ skills. As men are better
endowed with brawn skills than women, the historical
growth in the service sector has created jobs for which
women have a comparative advantage.
While the brawn versus brain distinction has become less
relevant with the introduction of what might be called ‘brawn-
saving technologies’, women may still retain a comparative
advantage in services, related to the more intensive use of
communication and interpersonal skills that cannot be easily
automated. The simultaneous presence of producers and
consumers in the provision of services makes these skills
relatively more valuable in services, and a few studies have
highlighted gender differences in the use of such traits.
Women’s comparative advantage in services is clearly reflected
in the allocation of their market hours. In 1968, the average
working woman in the United States was supplying three
quarters of her market time to the service sector, while the
average man was supplying only one half. As structural
transformation expands the sector in which women are over-
represented, it has potentially important consequences for the
evolution of women’s hours of market work.
A second reason for the significance of services relates to
women’s involvement in household work. In 1965, women
spent on average 41 hours a week in home production, nearly
four times as much as men. Household work typically includes
childcare, cleaning, food preparation and other activities
that have close substitutes in the market service sector. If the
expansion of the service sector makes it cheaper to outsource
these activities, there is going to be a reallocation of women’s
work from the household to the market.
The work allocation of men and women in the late 1960s is
thus key to understanding later developments. While women
were mostly working in home production and the service
sector, men were predominantly working in the goods sector.
This article summarises ‘Gender Gaps
and the Rise of the Service Economy’
by Rachel Ngai and Barbara Petrongolo,
published in the American Economic
Journal: Macroeconomics 9(4): 1-44 in
October 2017 (earlier version available
as CEP Discussion Paper No. 1204:
http://cep.lse.ac.uk/pubs/download/
dp1204.pdf).
Rachel Ngai is associate professor of
economics at LSE. Barbara Petrongolo
is professor of economics at Queen Mary
University of London and a research
associate in CEP’s labour markets
programme.
Women’s market hours were boosted by structural transformation and marketisation
From that point, while men’s working hours mostly bore the
burden of deindustrialisation, women’s market hours were
boosted by both structural transformation and marketisation.
We use US data to assess quantitatively the importance of
these mechanisms. The forces of marketisation and structural
transformation predict the entire rise in the service share
between 1970 and 2006, 20% of the gender convergence in
wages, one third of the rise in female market hours and 9%
of the fall in male market hours.
By predicting changes in the overall allocation of time across
market goods, market services, home services and leisure,
the evolution in the industry structure explains about 60% of
the evolution in the overall structure of time allocation across
manufacturing, services, leisure and home production for men
and women.
CentrePiece Autumn 2017
7

Industry in Britain: an atlas
Measures to promote a more even spread of industry across Britain are on the policy agenda. The maps and charts in a new report by Sandra Bernick, Richard Davies and Anna Valero provide a starting point, setting out the latest data on firm location, together with geographical measures of employment, productivity and innovation.
CentrePiece Autumn 2017
8

Industry in Britain: an atlas
Britain is a place where people
worry about the geographical
spread of industry. While
employment is at record levels,
British workers are far less productive
than their counterparts in countries
such as France, Germany and the United
States. Growth in real wages has been
poor since the financial crisis; insecure
working arrangements are on the rise;
and there are significant disparities in
economic activity and opportunity across
the country.
Concerns that some regions are
falling behind others – and that the
location of firms helps to explain this – are
longstanding, yet determination to adopt
policies that address regional disparities
has ebbed and flowed. There are signs
that the 2017 Parliament could see an
intensification of efforts to ‘drive growth
across the country’. This is likely to be
a key theme in the government’s new
‘Industrial Strategy’, set to be launched
over the coming months.
Despite the rising interest in
addressing Britain’s uneven economic
performance, to date no one has
published a comprehensive analysis setting
out the latest facts on business geography.
New CEP analysis begins to fill that gap,
using data on firms to create a mapping
of industry in Britain. Ten stylised facts
stand out, many of which challenge the
prevailing wisdom.
FACT 1: Three patterns of industryThe location of business activity in Britain
(measured using data on employment
patterns) varies considerably by industry, and
follows three broad patterns:
Uniform: Some industries are fairly
evenly spread around the country, with a
similar concentration of activity in most
locations. These industries often provide
products or services that must be sold
locally: retail services, for example, include
firms such as hairdressers and gyms. Outside
large cities, agriculture is spread relatively
evenly. More surprisingly, manufacturing is
relatively evenly spread outside London.
Scattered: In these industries, activity
is concentrated in a number of locations,
creating a scatter of strong dots across the
country. This group includes firms operating
in science and technology sectors and
mining and quarrying (see Figure 1). The fact
that finance is scattered across multiple hubs
is a challenge to the belief that banking only
occurs in the South East.
Single hub: In these industries, there
is one location where activity seems to
be concentrated. The creative sectors
(see Figure 2) and information and
communications technology are examples:
in both cases, activity is focused in London
and the South East, although there are
also pockets in cities such as Manchester
and Edinburgh. Given the expectation that
creative industries and ‘tech’ are potential
growth industries, this finding will concern
those seeking a more even spread of
opportunity.
FACT 2: Firm size distributionFirm size matters for industrial
performance: larger firms tend to invest
more and have higher productivity. But
industry is dominated by small firms with
around 99% of firms being classed as
‘small’ (0-49 employees). So-called ‘non-
employing’ businesses (firms where the
owner-manager is the only worker) are the
largest category, making up around three
quarters of firms in all regions.
Our maps show that mid-sized firms
(those with 50-249 employees) are
relatively evenly spread. Large firms are
very sparsely spread: currently, only 55%
of local authorities have ten or more large
firms. More encouragingly, maps showing
the increase in mid-sized firms indicate that
this growth is relatively evenly spread.
FACT 3: Business demographyThe rate at which firms start up and
go bankrupt is relatively evenly spread,
with maps showing that these ‘births’
and ‘deaths’ are equally likely across
regions. This suggests that the ease with
which a firm can be established and
wound up are unlikely to explain regional
productivity differences.
Britain’s financial services industry is not nearly as London-centric as the creative
industries
Figure 1:
Location quotient: ‘science and technology’
Figure 2:
Location quotient: ‘creative’
Notes: Location quotients compare a sector’s
employment share in a local area with that
sector’s share in national employment.
A value greater than one suggests an area
is relatively specialised in a sector.
Source: Sectoral employment at local
authority level from the 2015 Business
Register and Employment Survey of the
Office for National Statistics. ‘Science and
technology’ and ‘creative’ sectors allocated
at the four-digit level.
CentrePiece Autumn 2017
9

FACT 4: The spread of productivityThe output per hour of a British worker
varies considerably by location. At the
bottom of the productivity scale is mid-
Wales: the countryside around Brecon
is an area with little industry and where
agriculture is the main employer.
At the other end of the scale, there
are three high-productivity hubs: the
oil industry around Aberdeen; the area
around Greater Manchester; and a band
of productivity in the South. Contrary to
popular belief, the high productivity of
London does not spread into the South
East but rather spreads west along the M4
towards commuter towns like Reading
and Slough, which have their own high-
productivity firms.
FACT 5: Leader and laggard sectorsThe highest productivity sectors – real
estate, mining and utilities – are small
employers and so play little role in
aggregate performance. Of the high
employment sectors that drive national
productivity, the leading sectors are
finance, information and communications
technology, construction and
manufacturing. Professional, scientific and
technical services vary within and across
regions: this sector includes some very
high-productivity firms together with much
weaker ones.
But it is important to consider
high employment sectors with weak
productivity, such as retail and wholesale
trade, administrative services, and
accommodation and food services. Raising
average productivity in these sectors could
have a large aggregate effect due to their
high employment shares.
FACT 6: Innovation in the regionsData on research and development
(R&D) expenditure and patents allow a
comparison of innovation across regions. In
absolute terms, London and the South East
dominate, accounting for nearly a third of
business spending on R&D. But in terms of
R&D as a percentage of GDP, the East of
England stands out (see Figure 3).
At a more disaggregated level, Britain’s
most innovative NUTS2 regions (equivalent
to grouped counties, unitary authorities
or districts) are East Anglia, Cheshire and
Hertfordshire. Respectively, these reflect
the impact of Cambridge University,
chemicals firms along the River Mersey
and pharmaceuticals and life sciences
firms located in and around Hertfordshire.
FACT 7: Unbalanced exportingBritain has a sizeable current account
shortfall at 3.4% of GDP (in the first
quarter of 2017). Only 11% of firms export
and those that do export are most likely to
be based in London, the South East
or the East of England. The North East
has the lowest share of exporters at fewer
than 6%.
A poor and unbalanced export
performance has long been of concern,
but Britain’s exit from the European Union
will create new challenges in this area.
It is estimated that all local authorities
are likely to become worse off following
Brexit, but that the largest impacts are
expected to be in cities that specialise in
finance and business services.
Understanding the local impacts
of Brexit through changes to trade –
together with immigration, foreign direct
investment and innovation – will be crucial
for policy-makers developing an industrial
strategy with region-specific elements.
FACT 8: Britain’s coastal malaiseA number of maps outline concerns about
the economic performance of Britain’s
coastal towns. Maps of survival rates show
that firms located near the coast are more
likely to go out of business than those
further inland.
These areas also specialise in
accommodation and food services, which
tend to be low productivity industries
with a high churn of businesses. Other
research shows that skills are particularly
weak in these areas, perhaps reflecting
the demands of the local labour market.
Figure 3:
Business R&D as percentage of GDP
Britain’s productivity engine is a band stretching west from the capital along the M4 corridor towards Bristol
The East of England stands out in terms of the intensity of
local investment in R&D
Notes: Total intramural R&D expenditure
(GERD) by sectors of performance and NUTS2
regions for 2014.
Source: Eurostat.
CentrePiece Autumn 2017
10

■■■■■■■■■■
150-200130-150120-130110-120100-11090-10080-9070-8060-700-60
FACT 9: The power of a single firmSome of the patterns in the regional data
indicate local dominance by single firms.
For example, the high productivity in
north Lancashire, Derby and Brentwood
is influenced by the major plants of
BAE Systems, Rolls Royce and Ford,
respectively. Further examples are
Tata Steel in Port Talbot and Airbus in
Broughton (Flintshire), both in Wales.
The same can also be true for service
sector firms, for example, Sky in parts of
Scotland. The local impact of losing or
gaining a large firm can be large.
FACT 10: The German benchmarkIt is well known that Britain’s aggregate
productivity is far behind that of its key
comparator countries. We compare the
economic performance of British regions
with those in Germany. The resulting maps
are concerning, showing that Britain’s best
performing regions (with the exception
of Central London) are far behind the
German average (see Figure 4).
Germany stands out as a multi-hub
country, with around ten identifiable high-
productivity areas: by contrast, in Britain,
the South East dominates. While Germany
also faces regional challenges, with
longstanding poor performance in East
Germany, these poor performing regions
are catching up. In Britain, however,
similarly laggard regions appear to be
falling further behind.
Next stepsBritain has good quality firm-level
data, and it is crucial that this is put
to best use in guiding policy. The LSE
Growth Commission made a series of
recommendations to strengthen the
institutions governing industrial strategy.
A key component here would be
the publication of an annual Industrial Strategy Report on the state of British
business akin to other regular publications
(for example, the Bank of England’s
Inflation Report). Our work provides some
of the types of analysis that could be
usefully included and built on in such a
report.
While our analysis provides a snapshot
of the current state of play, it remains
unclear what is the optimal distribution
of industry, and therefore what the
ultimate goal of regional policy should be.
Industrial policy has to proceed cautiously,
in full knowledge of facts on the ground
and ensuring that government resources
are used effectively.
Broadly, the evidence suggests
that area-based initiatives can lead to
displacement rather than aggregate gains,
though it is possible to design policies that
deal with these issues. Moreover, there
are tensions between ‘jam-spreading’
(spreading resources across locations) and
the ability to build up successful hubs that
exploit network effects.
It is increasingly recognised that
greater local control is important: more
space for local authorities to experiment
with different types of policy. This,
together with improved data collection
and evaluation, should increase the
chances that policies can deliver both
improved aggregate performance and a
more balanced economy.
This article summarises ‘Industry in Britain –
An Atlas’ by Sandra Bernick, Richard Davies
and, Anna Valero CEP Special Paper No. 34
(http://cep.lse.ac.uk/pubs/download/special/
cepsp34.pdf).
Sandra Bernick is a research assistant in
CEP’s growth programme. Richard Davies is
chief of staff of the LSE Growth Commission.
Anna Valero is a research officer in CEP’s
growth programme.
Figure 4:
Productivity per hour in Britain versus the German average (=100)
■■■■■■■■■■
150-200130-150120-130110-120100-11090-10080-9070-8060-700-60
■■■■■■■■■■
>150130-150120-130110-120100-11090-10080-9070-8050-70<50
In addition to longstanding
concerns about the North-South
divide, there are emerging
disparities between coastal
and inland areas
Notes: GVA per hour at NUTS3 level in
2014, with Germany’s overall productivity
set to 100 (index).
Source: Data for Britain from the Office for
National Statistics Regional and Subregional
Productivity release (January 2017), German
data from the federal states’ national accounts.
CentrePiece Autumn 2017
11

Like many other consumer
transactions, the buying and
selling of drugs are increasingly
moving online. This is one very
visible dimension of cybercrime – and it
has been receiving growing attention from
researchers as the online drugs markets
have expanded rapidly.
A key feature of online drugs platforms
is that they are located on the so-called
‘dark web’, which is accessible via the
sophisticated technology of anonymisation
software and encryption programs,
and buying and selling transactions
are conducted using the anonymous
cryptocurrency, Bitcoin.
Our research so far has empirically
studied these online drugs platforms by
scraping large amounts of data from their
websites and by focusing specifically on
three economic questions:
n First, we have conducted an appraisal
and empirical analysis of the buyer
ratings of online drugs purchases that the
platforms collect.
n Second, we are looking at whether
these ratings act to generate a reputation
mechanism for sellers in the illegal online
market setting as happens in legal online
markets.
n Third, we are analysing the dynamics
of the market, as both seller turnover
and platform turnover are high in online
drugs markets.
While there is a small scale prior history
of drugs being bought and sold online,
the origins of today’s online drugs
markets date back to the establishment
of ‘Silk Road’, the best known platform,
in January 2011. Silk Road distinguished
itself from the black markets that had
been operating before by its highly
Dark web: the economics of online drugs markets
Data from online platforms for buying and selling drugs are accessible with the right know-how from the ‘dark web’. Stephen Machin and colleagues have collected and analysed information on around 1.5 million drugs transactions to understand the economic functioning of these markets.
professional website and its ability to
ensure anonymity. Figure 1 shows a
sample screenshot of the site.
Silk Road operated for just under three
years before being shut down following
the arrest of its founder, Ross Ulbricht,
the libertarian who set up and ran the site
(under the administrator name, ‘Dread
Pirate Roberts’) and who is currently
serving a life sentence for doing so. Trade
on the site grew massively over its time
of operation: in May 2011, it had around
340 listings; by the time of its closure in
Figure 1:
Sample screenshot of Silk Road, the pioneering online drugs platform
CentrePiece Autumn 2017
12

October 2013, there were around 13,000
drugs listings on the platform.
Since the demise of Silk Road, a large
number of online drugs platforms have
come and gone, some lasting only a few
days, but others running longer – and
making a lot of money. Figure 2 shows the
lifetimes of 83 dark web drugs platforms
and names some of the larger sites.
For our research, data were scraped
from four of the largest online drugs
platforms – Agora, Evolution, Nucleus
and Silk Road 2.0 – between 2013 and
2016 and then analysed to present
evidence on the economic functioning of
online drugs markets.
A key research question is how well
– or badly – these markets operate given
the high probability of problems of ‘moral
hazard’ arising because of their illegal
nature and because they are populated
by individuals engaged in criminal actions.
Some of the findings come from analysing
these data in ways similar to other research
on legal online markets, such as eBay
or Amazon, where there is a focus on
whether online activity alters the way in
which trust between market participants
operates and whether it affects the
efficiency of outcomes.
A particular emphasis has been placed
on whether online activity enhances
or diminishes seller reputations so that
problems of moral hazard either improve
or deteriorate in the context of online
commerce (see Cabral and Hortaçsu,
2010). Buyers might be concerned about
the quality of the products they are looking
to buy and therefore forgo purchasing
opportunities. At the same time, sellers
might worry whether they will be paid.
Some striking findings emerge.
Analysis of around 1.5 million drugs
transactions scraped from the four
platforms (plus data on Silk Road from
Christin, 2012) shows that, for the most
part, online drugs markets function
without the significant problems of moral
hazard that a priori one might think would
constrain their operation.
In fact, only a small minority of online
drugs deals receive bad ratings from
buyers, as Table 1 shows. This is lower
than the incidence of drugs rip-offs that
researchers have reported in analyses of
the quality of drugs available from street
transactions (Galenianos et al, 2012).
Moreover, as with legal online
markets, if sellers do receive bad ratings,
this typically leads to them experiencing
significant sales reductions and market
exit. Thus, perhaps contrary to what many
people’s first intuition might be, reputation
mechanisms appear to work relatively well
even in these illegal online marketplaces.
Our research also finds that drugs
platforms exit and get closed down for
different reasons. As the online drugs
markets have emerged and grown rapidly,
they have attracted attention from both
the media and law enforcement agencies.
100 200 300 400 500 600 700 800 900 1,0000
Number of days
Silk Road 2.0(365)
Nucleus(538)
Evolution(425)
Agora(643)
Silk Road(976)
14
12
10
8
6
4
2
0
Nu
mb
er o
f p
latf
orm
s
Figure 2:
Lifetimes of 83 online drugs platforms
Table 1:
Negative ratings of drugs transactions
All five platforms Silk Road Silk Road 2.0 Agora Evolution Nucleus
Number % Neg Number % Neg Number % Neg Number % Neg Number % Neg Number % Neg
All drugs 1,454,103 2.2% 145,485 1.2% 189,628 1.9% 550,627 2.6% 253,689 1.3% 314,674 2.9%
Cannabis 441,166 2.1% 42,373 1.0% 48,882 2.0% 167,193 2.7% 83,228 1.3% 99,490 2.5%
Dissociatives 39,381 3.2% 4,082 0.8% 5,548 1.6% 16,520 3.7% 5,393 4.3% 7,838 3.7%
Ecstasy 213,400 2.6% 26,656 1.3% 30,215 1.7% 79,815 2.8% 34,605 1.4% 42,109 4.6%
Opioids 120,008 2.5% 8,472 1.2% 7,071 3.0% 53,015 3.3% 22,889 0.9% 28,561 2.6%
Prescription 111,531 1.6% 11,828 1.0% 29,366 1.8% 32,846 1.8% 18,029 0.9% 19,462 2.2%
Psychedelics 171,884 1.4% 23,937 0.8% 28,435 1.2% 69,371 1.5% 25,703 1.1% 24,438 2.5%
Stimulants 338,414 2.3% 19,772 2.0% 35,939 2.3% 128,686 2.9% 62,537 1.3% 91,480 2.3%
Only a small minority of
online drugs deals receive
bad ratings from buyers
Notes: Silk Road data from Christin (2012). Silk Road 2.0, Agora, Evolution and Nucleus data from downloads of each dark web platform collected
in Bhaskar et al (2017).
CentrePiece Autumn 2017
13

This article summarises ‘The Economic
Functioning of Online Drugs Markets’
by V Bhaskar, Robin Linacre and Stephen
Machin, CEP Discussion Paper No. 1490
(http://cep.lse.ac.uk/pubs/download/
dp1490.pdf).
V Bhaskar is at the University of Texas at
Austin. Robin Linacre is at the UK Ministry of
Justice. Stephen Machin is director of CEP.
Robin Linacre contributed to this work in a
personal capacity and in his own time. The
opinions expressed are the authors’ own, and
the research is not linked to any of Robin
Linacre’s work for the Ministry of Justice.
Further reading
V Bhaskar, Robin Linacre and Stephen Machin
(2017) ‘The Economic Functioning of Online
Drugs Markets’, Journal of Economic Behaviour
and Organisation, forthcoming.
Luis Cabral and Ali Hortaçsu (2010) ‘The
Dynamics of Seller Reputation: Evidence
from eBay’, Journal of Industrial Economics 58:
54-78.
Nicolas Christin (2012) ‘Travelling the Silk
Road: A Measurement Analysis of a Large
Anonymous Online Marketplace’, Carnegie
Mellon INI/CyLab Working Paper.
Manolis Galenianos, Rosalie Liccardo Pacula
and Nicola Persico (2012) ‘A Search-Theoretic
Model of the Retail Market for Illicit Drugs’,
Review of Economic Studies 79: 1239-69.
As a result, some have been seized and
shut down. Others have undertaken exit
scams and run off with the money they
were holding (in Bitcoins often running
into millions of pounds). Thus, the market
has become characterised by platform (and
seller) entry and exit. It is interesting to
consider whether this has had a deterrent
effect on potential buyers and sellers.
An examination of what happens
to the online drugs market when large
platforms exit suggests no evidence of
deterrence. In fact, the markets seem to
bounce back rapidly and get bigger as
sellers migrate quickly to different sites and
continue to ply their trade online.
Our research has looked at three
specific cases: the well-known seizure
of the original Silk Road; the shutdown
of its successor Silk Road 2.0 by law
enforcement agencies; and the exit scam
by the then market leader, Evolution.
There is no evidence that these large
scale exits deterred buyers or sellers from
continuing to engage in online drugs sales
and purchases, with new platforms rapidly
arising to replace those taken down.
Very recently – in July 2017 – the
then market leader AlphaBay was taken
down, along with another relatively
large platform, Hansa. But again, despite
widespread media coverage, this also
seems not to have reduced sellers’
appetite for selling drugs online as new
sites rapidly expanded in terms of drugs
listings following the shutdown. Table 2
reproduces data showing this for four
out of five platforms in the week at the
end of July 2017 after AlphaBay and
Hansa were seized.
So despite high turnover of the
platforms that host the buyers and sellers
of drugs, the online drugs market seems
resilient. As with legal online markets,
illegal online markets are substituting for
offline economic activity (street transactions
in the case of drugs) as buyers and sellers
increasingly operate online: a trend that
seems unlikely to end any time soon. Thus,
it seems that the role of law enforcement in
the ‘war on drugs’ may need to be one of
devoting more resources and finding better
means to tackle drug buying and selling in
the cyber domain.
Table 2:
Numbers of drug listings before and after the shutdown of AlphaBay and Hansa
24 July 2017 31 July 2017
Dream Market 95,026 98,844
TradeRoute 14,914 17,816
Tochka 1,719 2,390
Wall Street Market 1,653 2,216
Rs Club Market 2,327 1,689
Notes: Numbers from Cyberint research, as reported on BBC website,
1 August 2017: http://www.bbc.co.uk/news/technology-40788266.
In the ‘war on drugs’, law enforcement needs more
resources and better means to tackle drug
buying and selling in the
cyber domain
Sellers that do receive bad ratings typically experience significant sales reductions
CentrePiece Autumn 2017
14

in brief...Where top science gets done
Big scientific research facilities like the UK’s Diamond
Light Source benefit scientists located nearby significantly
more than scientists located further away. According
to our research, the highly localised effects of scientific
infrastructure on research productivity extend even
to scientists that do not rely on the facilities directly for
their work.
Since scientific facilities often cannot be distributed across
multiple locations, our findings suggest that the decision
on where to locate a facility has important consequences.
Large-scale facilities have the power to create new and
highly concentrated geographical clusters of scientific
research as well as to reinforce existing clusters.
We examine the impact of the Diamond Light Source, a
third generation synchrotron (a circular particle accelerator),
which represents the largest single investment in basic
research infrastructure in the modern history of the UK.
The Diamond Light Source synchrotron in Oxfordshire is the largest single investment in basic research infrastructure in modern UK history. Christian Helmers and Henry Overman examine its impact on the geographical distribution of related scientific output.
Large-scale facilities have the power to
create concentrated geographical clusters of scientific research
CentrePiece Autumn 2017
15

Quantifying the impact of large-scale scientific
infrastructure is generally difficult because the location for
the investment is not chosen at random. Instead, policy-
makers, just like private companies, strategically place
investments in a way that maximises locational benefits – in
the case of Diamond, building the facility in an existing
scientific hub: the Harwell Science and Innovation Campus
at the Rutherford Appleton Laboratory near Oxford.
This then poses the research challenge of how to separate
effects from the existing cluster from any additional effects
created by the new facility. We overcome this difficulty by
capitalising on the controversy that existed in 1998 about
where the Diamond Light Source should be sited – and,
in particular, the existence of a ’runner-up’ location at the
Daresbury Science and Innovation Campus in Cheshire.
The government initially planned to build the new facility at
Daresbury, which was also home to Diamond’s predecessor,
the Synchrotron Radiation Source. Effective lobbying led to
a change of heart – and a final decision in 2000 to locate
the new facility at Harwell. This sparked fierce controversy
because of the longstanding debate on the North-South
divide in investment in scientific research in the UK.
We analyse how scientific research in the form of journal
publications was affected by Diamond’s opening in January
2007. Comparison of papers produced by researchers near
Diamond to those near Daresbury shows that output from
researchers in direct proximity to the synchrotron increased
more than it would have done if the facility had been
located elsewhere.
We find that scientists located within a 25 kilometre radius
of Diamond produced around 11% more scientific articles
over the 2000-2010 period as a result of their geographical
proximity to the facility. This is the combined result of two
effects, one direct and one indirect.
The direct effect results simply from ease of access for
nearby researchers who use the synchrotron. The indirect
effect is perhaps more surprising: there is also an increase
in scientific papers even when that research made no direct
use of Diamond. The explanation is that these indirect
affects arise as a result of the localised knowledge spillovers
that occur when researchers learn from each other, for
example, through personal contact.
Both the direct and indirect effects are mainly driven
by an increase in the number of scientists working in
geographical proximity to the facility. The results indicate
that the increase comes from new scientists rather than the
relocation of existing scientists.
In the case of the Diamond, locating the particle
accelerator close to Oxford reinforced the scientific strength
of the so-called ‘Golden Triangle’ of London, Oxford and
Cambridge.
Because clusters tend to create self-reinforcing feedback
loops that attract more private and public investment, the
results of our study are likely to underestimate the long-run
impact of the synchrotron on the geographical location of
scientific research in the UK.
This article summarises ‘My Precious! The Location and
Diffusion of Scientific Research: Evidence from the Synchrotron
Diamond Light Source’ by Christian Helmers and Henry
Overman, Economic Journal 127(604): 2006-40 (earlier version
available as SERC/Urban and Spatial Programme Discussion
Paper No. 131: http://www.spatialeconomics.ac.uk/textonly/
SERC/publications/download/sercdp0131.pdf).
Christian Helmers is at Santa Clara University.
Henry Overman is professor of economic geography
at LSE and director of the What Works Centre for Local
Economic Growth.
Proximity to Diamond had a positive impact on the output of related scientific research
CentrePiece Autumn 2017
16

Stamp duty jams the housing
market by preventing
households from moving to more suitable homes
Stamp duty, mobility and the UK housing crisisS
tamp duty – a tax to be paid
on the transfer of certain
legal documents – has a long
history in England. It was first
introduced in 1694 to help finance a
war against France. Although initially
conceived as a temporary solution,
the tax was so successful in raising
revenue that it eventually evolved into a
permanent form of UK taxation.
While in recent decades global
competition has reduced the scope of
stamp duty on trading of financial assets,
stamp duty on transactions of land and
property is today more significant than
ever. UK revenue from the stamp duty
land tax (SDLT) has almost tripled over
the last eight years: from £2.9 billion in
2008/09 to £8.6 billion in 2016/17.
The SDLT (commonly referred to as
‘stamp duty’) has long been criticised
by economists as being inefficient. The
central case against its use is that it
hampers household mobility. The 2011
Mirrlees Review neatly summarises the
key argument:
‘ By discouraging mutually beneficial transactions, stamp duty ensures that properties are not held by the people who value them most. It creates a disincentive for people to move house, thereby leading to potential
inflexibilities in the labour market and encouraging people to live […] in properties of a size and in a location that they may well not otherwise have chosen.’
There are some prior studies documenting
a negative effect of stamp duty on
housing transactions and mobility, but to
date we know little about the nature of
affected moves. Specifically, there is no
evidence of the relative importance of
the SDLT for the functioning of housing
and labour markets. In our research, we
provide some answers by exploring the
impact of the SDLT on different types of
mobility.
Before 2014, stamp duty bore the
The UK’s stamp duty land tax raises substantial revenues for the government, but as research by Christian Hilber and Teemu Lyytikäinen shows, it exerts powerful constraints on household mobility. They explain how replacing stamp duty with better-designed local taxes could help to alleviate the country’s crisis of housing affordability.
CentrePiece Autumn 2017
17

replaced with a more progressive ‘slice’
schedule in 2014. Our data is from a
period before the reform and we use
the discontinuities of the old system
to identify the impact of the SDLT.
But the results are also informative of
the effects of the SDLT on mobility in
the current system.
The reform removed the
discontinuities in the tax liability and the
bunching of transactions just below the
old thresholds. But it did not substantially
alter the overall tax burdens, somewhat
odd feature that the tax rate for the
whole purchase price jumped at certain
thresholds. For example, at £250,000,
the rate jumped from 1% to 3% of
the value: a £5,000 increase in the tax
liability. We make use of this discontinuity
to isolate the impact of stamp duty
from other determinants of mobility.
Essentially, we compare mobility rates
of otherwise similar homeowners with
self-assessed house values below and
above the threshold of £250,000.
The ‘slab’ structure of the SDLT was
lowering them at the bottom end and
increasing them at the top end of the
price distribution. Thus, the tax-induced
disincentive to move remained.
Figure 1 illustrates our research
design and key results. We use data from
the British Household Panel Survey (BHPS)
to analyse how the two percentage
points increase in the SDLT affects the
mobility of homeowners. The BHPS
includes homeowners’ own estimates of
the value of their home. When we plot
mobility rates in house value bins around
£250,000 in Panel A of Figure 1, we find
a clearly visible reduction in the rate of
mobility when the self-assessed house
value exceeds £250,000 and the tax rate
rises from 1% to 3%.
The BHPS also contains information
on the distance of moves and the main
reasons for moving. When we split moves
by distance of move (shorter versus
longer than 10 kilometres – Panels B and
C of Figure 1), we find a large effect on
short moves but no effect on long moves.
The SDLT appears to prevent moves to
a more suitable dwelling locally but has
little impact on long-distance relocation.
A similar picture emerges when we
divide moves into three groups based
on survey responses regarding the main
reasons for moving (Panels D, E and F
of Figure 1). The SDLT affects housing
and area-related moves but has little
effect on job-related or major life event-
related mobility.
We should note that job-motivated
mobility is overall very rare among owner-
occupiers. Nevertheless, all in all, our
findings strongly suggest that stamp duty
jams the housing market by preventing
households from moving to more suitable
Stamp duty prevents moves
to a more suitable dwelling
locally but has little impact on
long-distance relocation
CentrePiece Autumn 2017
18

Figure 1:
What happens to mobility when stamp duty increases from 1% to 3%?
150 250200 300 350House value (£1,000)
0.1
0.05
0
Mo
bili
ty r
ate
Panel A: All moves
150 250200 300 350House value (£1,000)
0.1
0.05
0
Mo
bili
ty r
ate
Panel B: Short moves
150 250200 300 350House value (£1,000)
0.1
0.05
0
Mo
bili
ty r
ate
Panel C: Long moves
150 250200 300 350House value (£1,000)
0.1
0.05
0
Mo
bili
ty r
ate
Panel D: Housing and area-related moves
150 250200 300 350House value (£1,000)
0.1
0.05
0
Mo
bili
ty r
ate
Panel E: Employment-related moves
150 250200 300 350House value (£1,000)
0.1
0.05
0
Mo
bili
ty r
ate
Panel F: Major life event-related moves
150 250200 300 350House value (£1,000)
0.1
0.05
0
Mo
bili
ty r
ate
Panel A: All moves
150 250200 300 350House value (£1,000)
0.1
0.05
0
Mo
bili
ty r
ate
Panel B: Short moves
150 250200 300 350House value (£1,000)
0.1
0.05
0
Mo
bili
ty r
ate
Panel C: Long moves
150 250200 300 350House value (£1,000)
0.1
0.05
0
Mo
bili
ty r
ate
Panel D: Housing and area-related moves
150 250200 300 350House value (£1,000)
0.1
0.05
0
Mo
bili
ty r
ate
Panel E: Employment-related moves
150 250200 300 350House value (£1,000)
0.1
0.05
0
Mo
bili
ty r
ate
Panel F: Major life event-related moves
CentrePiece Autumn 2017
19

homes, but its effect on relocation of the
labour force appears to be quite limited.
A potential explanation for the
differential effects is that when moving to
a more suitable house locally – say, one
bedroom more or less – the benefits of
moving often exceed the costs only by a
narrow margin. Therefore even a small
increase in the tax wedge can prevent
a large fraction of moves. Longer, often
job-related, moves – say, a great job
opportunity in another city – imply that
there are large benefits from moving and
in turn that the SDLT burden may not be
pivotal in most cases.
Our analysis suggests that abolishing
the SDLT (or replacing it with an annual
tax on the value of land or property) may
do little to improve the spatial mismatch
of job opportunities and workers. But
it could greatly reduce the allocative
mismatch in the housing market via
increasing the likelihood of a match
between elderly households willing to
downsize and young families seeking to
expand their housing consumption.
We do not claim that abolishing the
SDLT could solve the housing affordability
crisis. The latter is caused largely by
a flawed planning system: see, for
example, Cheshire (2014) for the central
argument, and Hilber and Vermeulen
(2016) for estimates of the effects of
regulatory constraints on house prices.
But abolishing the SDLT could help to
alleviate the crisis by putting existing
housing stock into more efficient use.
The potential caveat of our research
design is that people with a higher
underlying propensity to move could
select into the lower tax group. This
could bias our results. It is comforting
that we do not find discontinuities in
household characteristics linked to the
propensity to move. Our results are also
robust to dropping data very close to the
£250,000 threshold where sorting could
be likely to occur. These checks suggest
that our research design is valid.
The main scholarly contribution of
our study is the analysis of the differential
impacts of the SDLT on different types of
mobility. Yet from a policy perspective,
the sheer magnitude of the impact of
the SDLT on mobility is also of great
importance. Our estimates come with
uncertainty. But taken at face value
they imply that the overall effect is very
substantial: our central estimate suggests
that a two percentage points increase
in stamp duty from 1% to 3% reduces
household mobility by almost 40%.
Considering the entire distribution of
self-assessed house values in our sample
in 2007, our central estimate implies
that abolishing (or replacing) stamp
duty could have increased mobility of
homeowners by around 27% (from 5.1
to 6.5 percentage points per annum).
Since 2007, house prices have risen
substantially in the UK and the system
was reformed in 2014. While the former
increased the stamp duty burden, the
latter reduced it for the majority of
homeowners. Overall, the adverse impact
of the SLDT on mobility may be of a
similar magnitude.
Our empirical findings suggest
that stamp duty induces substantial
misallocation of dwellings. This imposes a
hefty welfare loss on society as a whole.
We can quantify the welfare loss relative
to the additional tax revenue generated
by stamp duty with the help of some
simple calculations. These are based on
the observation that for a transaction to
take place, the valuation of the buyer has
to exceed the valuation of the seller at
least by the amount of the tax liability.
Therefore, we can assume that each
transaction prevented by the tax rate
hike from 1% to 3% destroys the welfare
of the trading partners by somewhere
between a similar 1% and 3% of the
price of the dwelling. At the same time,
each prevented transaction depresses
tax revenue. Our calculations suggest
that the welfare loss associated with the
tax rate hike from 1% to 3% is massive,
possibly above 80% of the revenue
increase.
The same amount of revenue could
be collected with little or no welfare
losses through an annual tax on the value
of property, or even better, an annual
tax on the value of land. In contrast to
the SDLT, these taxes do not discourage
mutually beneficial transactions.
In fact, if designed as local taxes,
they would have the additional benefit
of providing genuine fiscal incentives
to local authorities (and their residents)
to release more land for residential
development. This would help gradually
to solve the housing affordability crisis
that cripples the prospects of the younger
generations, particularly in the most
productive parts of the country.
Further reading
Paul Cheshire (2014) ‘Turning Houses
into Gold: The Failure of British Planning’,
CentrePiece 19(1): 14-18 (http://cep.lse.ac.uk/
pubs/download/cp421.pdf).
Christian Hilber and Wouter Vermeulen (2016)
‘The Impact of Supply Constraints on House
Prices in England’, Economic Journal 126(591):
358-405.
James Mirrlees and colleagues (2011)
Tax by Design: The Mirrlees Review, Oxford
University Press.
This article summarises ‘Transfer Taxes
and Household Mobility: Distortion on the
Housing or Labor Market?’ by Christian
Hilber and Teemu Lyytikäinen, Journal of
Urban Economics 101: 57-73 (earlier version
available as SERC/Urban and Spatial
Programme Discussion Paper No. 216: http://
www.spatialeconomics.ac.uk/textonly/SERC/
publications/download/sercdp0216.pdf).
Christian Hilber is professor of economic
geography at LSE and a research associate
in CEP’s urban and spatial programme.
Teemu Lyytikäinen is at VATT Finland.
Abolishing stamp duty
could increase the mobility of
homeowners substantially
CentrePiece Autumn 2017
20

Happiness at work
What roles do work, employment and joblessness play in shaping our happiness? Jan-Emmanuel De Neve and George Ward summarise global evidence from the World Happiness Report on which elements of people’s working lives drive their reported job satisfaction, engagement at work and overall wellbeing.
Since most of us spend much of
our lives working, it is inevitable
that work plays a key role in
shaping our levels of happiness.
In a chapter of the World Happiness Report 2017 – which is published annually
to coincide with the United Nations’
International Day of Happiness – we look
more closely at the relationship between
work and happiness.
We draw largely on the Gallup World
Poll, which has been surveying people in
over 150 countries around the world since
2006. These efforts allow us to analyse
data from hundreds of thousands of
individuals across the globe and investigate
the ways in which elements of people’s
working lives drive their wellbeing.
Subjective wellbeing – often loosely
referred to as happiness – can be measured
along multiple dimensions. We look
primarily at how people evaluate the
quality of their lives overall, something
Gallup measures according to the Cantril
Ladder, an 11-point scale where the top
step is your best possible life and the
bottom step is your worst possible life.
Gallup then asks respondents to indicate
which step they’re currently on.
We look at this rating, and also
investigate the extent to which people
experience positive and negative affective
states, such as enjoyment, stress and
worry, in their day-to-day lives, as well as
analysing responses to more workplace-
specific measures, such as job satisfaction
and employee engagement.
Which jobs are happiest?Eleven broad job types are recorded in the
Gallup World Poll. The categories cover
many kinds of jobs, including being a
business owner, office worker or manager,
and working in farming, construction,
mining or transport. Which groups of
workers are generally happier?
The first thing we notice is that people
working in blue-collar jobs report lower
levels of overall happiness in every region
around the world. This is the case across a
variety of labour-intensive industries, such
as construction, mining, manufacturing,
transport, farming, fishing and forestry.
People around the world who categorise
themselves as a manager, an executive, an
official or a professional worker evaluate
the quality of their lives at a little over 6 out
of 10, whereas people working in farming,
fishing or forestry evaluate their lives
around 4.5 out of 10 on average.
This picture is true not only for overall
life evaluation but also for the specific, day-
to-day emotional experiences of workers.
White-collar workers generally report
experiencing more positive emotional
states, such as smiling, laughing and
enjoyment, and fewer negative feelings,
such as worry, stress, sadness and anger.
These descriptive statistics represent
the raw differences in happiness across
job types. Of course, there are likely to
be many things that differ across people
working in these diverse fields that could
potentially be driving these happiness
differentials. Perhaps surprisingly, much of
the picture remains similar even once we
adjust our estimates to take account of
differences in income and education,
as well as a number of other demographic
variables, such as age, gender and
marital status.
It is more difficult to generalise about
happiness associated with self-employment
since this appears to have a multi-faceted
relationship with wellbeing. When we look
at global averages, we see that being self-
employed is generally associated with lower
levels of happiness compared with being a
full-time employee. But follow-up analysis
indicates that this very much depends on
the region of the world and the measure of
subjective wellbeing used.
Work-life balance is a particularly
strong predictor of people’s happiness
CentrePiece Autumn 2017
21

In most developed countries, being
self-employed is associated both with
higher overall life evaluation and with more
negative daily emotions, such as stress and
worry. For anyone who owns a business, it
will be no surprise that being self-employed
can be both rewarding and stressful.
Being unemployed is miserableOne of the most robust findings in
the economics of happiness is that
unemployment is highly damaging for
people’s wellbeing. We find that this is
true around the world. The employed
evaluate the quality of their lives much
more highly on average compared with
the unemployed. Individuals who are
unemployed also report around 30% more
negative emotional experiences in their
day-to-day lives.
The importance of having a job entails
more than just salary. A large body of
research shows that the non-monetary
aspects of employment are also key drivers
of people’s wellbeing. Social status, social
relations, daily structure and goals all exert
a strong influence on people’s happiness.
Not only are the unemployed generally
unhappier than those in work, but we
also find that people generally do not
adapt over time to becoming unemployed
unlike their responses to many other
negative shocks. What’s more, spells
of unemployment also seem to have a
‘scarring’ effect on people’s wellbeing, even
after regaining employment.
The experience of joblessness can be
devastating to the individual in question,
but it also affects those around them.
Family and friends of the unemployed
are typically affected, of course, but the
spillover effects go even further. High levels
of unemployment typically heighten people’s
sense of job insecurity, and negatively affect
the happiness even of those who are still
in employment.
High degrees of job satisfaction
can hide low levels of engagement
at work
CentrePiece Autumn 2017
22

Job satisfaction around the world What about wellbeing measures specific
to the workplace, such as job satisfaction?
The Gallup World Poll asks respondents
a yes/no question as to whether they are
satisfied with their jobs. The percentage of
respondents who report being ‘satisfied’
(as opposed to ‘dissatisfied’) is higher in
countries across North and South America,
Europe, Australia and New Zealand.
Specifically, Austria takes the top
spot with 95% of respondents reporting
being satisfied with their jobs. Austria is
followed closely by Norway and Iceland.
We see a moderate correlation between job
satisfaction responses and life evaluation for
individuals in the Gallup World Poll.
To find out why some societies seem
to generate greater job satisfaction than
others, we turn to more fine-grained data
from the European Social Survey. This
provides more information on job quality by
revealing particular workplace characteristics
related to employee happiness. As might
be expected, people in well-paying jobs
are happier and more satisfied with their
lives and their jobs, but a number of other
aspects of people’s jobs are also strongly
predictive of varied measures of happiness.
Work-life balance emerges as a
particularly strong predictor. Other factors
include job variety and the need to learn
new things, as well as the level of individual
autonomy that employees enjoy.
Moreover, job security and social capital
(as measured through the support received
from fellow workers) are also positively
correlated with happiness, while jobs
that involve risks to health and safety are
generally associated with lower levels of
wellbeing. We suspect that countries that
rank high in terms of job satisfaction provide
better quality jobs by catering to these non-
pecuniary job characteristics.
Engagement at workThe Gallup World Poll also asks whether
individuals feel ‘actively engaged’, ‘not
engaged’ or ‘actively disengaged’ in their
This article summarises ‘Happiness at Work’
by Jan-Emmanuel De Neve and George
Ward, CEP Discussion Paper No. 1474
(http://cep.lse.ac.uk/pubs/download/
dp1474.pdf) and published as a chapter
in the World Happiness Report 2017
(http://worldhappiness.report/ed/2017/).
Jan-Emmanuel De Neve, associate professor
of economics and strategy at the Saïd Business
School, University of Oxford, is an associate
editor of the World Happiness Report.
George Ward is a PhD student at the
Institute for Work and Employment Research,
MIT Sloan School of Management.
Both are research associates in CEP’s
wellbeing programme.
jobs. In contrast to the relatively high job
satisfaction numbers, these data paint a
much bleaker picture. The number of people
saying they are actively engaged is typically
under 20%, and around 10% in Western
Europe and much lower again in East Asia.
The difference in the global results
between job satisfaction and employee
engagement may partially be attributable
to measurement issues. But it also has to do
with the fact that both concepts measure
different aspects of happiness at work.
Job satisfaction can perhaps be reduced
to feeling content with one’s job, but the
notion of active employee engagement
requires individuals to be positively absorbed
by their work and committed to advancing
their employer’s interests. Increased
employee engagement thus represents a
more difficult hurdle to clear.
Although we focus here on the role
of work and employment in shaping
people’s happiness, it is worth noting that
the relationship between happiness and
employment is a complex and dynamic
interaction that runs in both directions.
Indeed, a growing body of research shows
that work and employment are not only
drivers of people’s happiness, but that
happiness can itself help to shape job
market outcomes, productivity and even
firm performance.
Happiness helps to shape job market outcomes, productivity and firm performance
People in blue-collar jobs report lower happiness
everywhere in the world
CentrePiece Autumn 2017
23
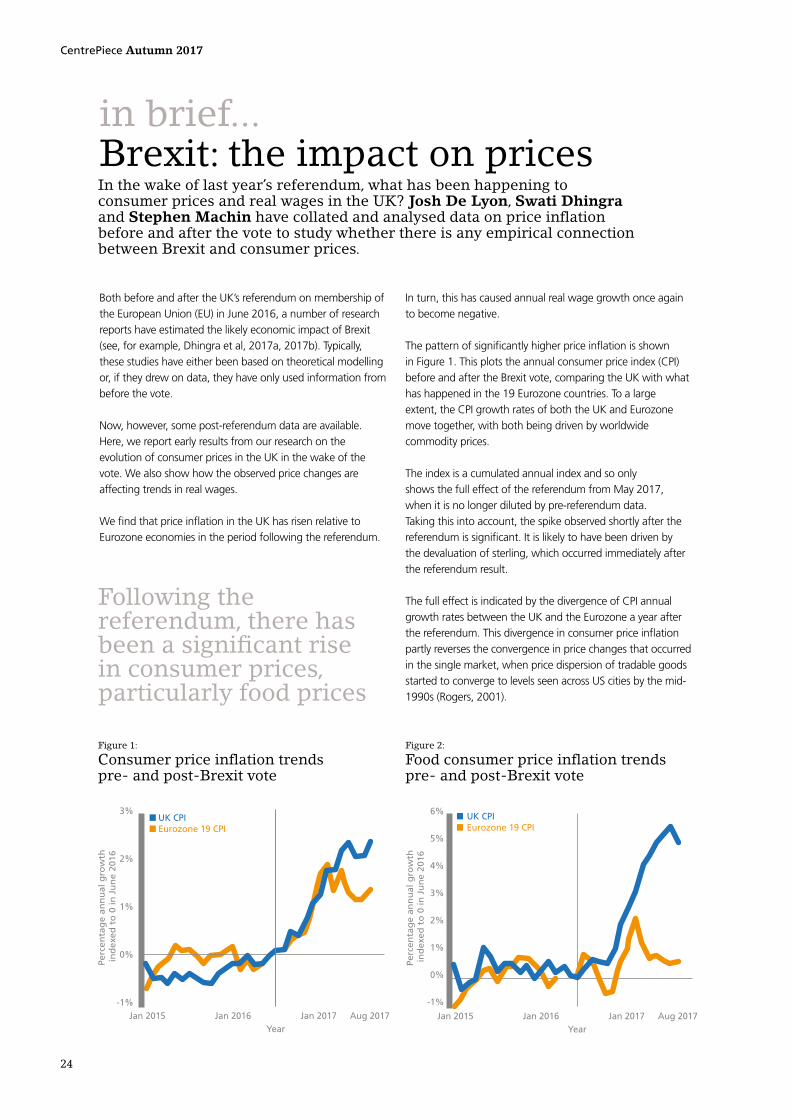
in brief...Brexit: the impact on prices
Both before and after the UK’s referendum on membership of
the European Union (EU) in June 2016, a number of research
reports have estimated the likely economic impact of Brexit
(see, for example, Dhingra et al, 2017a, 2017b). Typically,
these studies have either been based on theoretical modelling
or, if they drew on data, they have only used information from
before the vote.
Now, however, some post-referendum data are available.
Here, we report early results from our research on the
evolution of consumer prices in the UK in the wake of the
vote. We also show how the observed price changes are
affecting trends in real wages.
We find that price inflation in the UK has risen relative to
Eurozone economies in the period following the referendum.
In the wake of last year’s referendum, what has been happening to consumer prices and real wages in the UK? Josh De Lyon, Swati Dhingra and Stephen Machin have collated and analysed data on price inflation before and after the vote to study whether there is any empirical connection between Brexit and consumer prices.
In turn, this has caused annual real wage growth once again
to become negative.
The pattern of significantly higher price inflation is shown
in Figure 1. This plots the annual consumer price index (CPI)
before and after the Brexit vote, comparing the UK with what
has happened in the 19 Eurozone countries. To a large
extent, the CPI growth rates of both the UK and Eurozone
move together, with both being driven by worldwide
commodity prices.
The index is a cumulated annual index and so only
shows the full effect of the referendum from May 2017,
when it is no longer diluted by pre-referendum data.
Taking this into account, the spike observed shortly after the
referendum is significant. It is likely to have been driven by
the devaluation of sterling, which occurred immediately after
the referendum result.
The full effect is indicated by the divergence of CPI annual
growth rates between the UK and the Eurozone a year after
the referendum. This divergence in consumer price inflation
partly reverses the convergence in price changes that occurred
in the single market, when price dispersion of tradable goods
started to converge to levels seen across US cities by the mid-
1990s (Rogers, 2001).
Following the referendum, there has been a significant rise in consumer prices, particularly food prices
Figure 1:
Consumer price inflation trends pre- and post-Brexit vote
Figure 2:
Food consumer price inflation trends pre- and post-Brexit vote
Jan 2015 Jan 2016 Jan 2017 Aug 2017Year
3%
2%
1%
0%
-1%
Perc
en
tag
e a
nn
ual g
row
th
ind
exe
d t
o 0
in
Ju
ne 2
016
■
■
UK CPIEurozone 19 CPI
■
■
Jan 2015 Jan 2016 Jan 2017 Aug 2017Year
6%
5%
4%
3%
2%
1%
0%
-1%
UK CPIEurozone 19 CPI
Perc
en
tag
e a
nn
ual g
row
th
ind
exe
d t
o 0
in
Ju
ne 2
016
CentrePiece Autumn 2017
24

For certain commodity groups, the increase in the CPI growth
rate has been more pronounced. Figure 2 presents the annual
growth rate of CPI where the sample of goods and services is
restricted to food. There is a distinct and substantial rise in the
rate of CPI food inflation for the UK relative to the Eurozone.
The divergence that immediately followed the referendum
is quite a bit larger than that observed for all goods in
Figure 1, and becomes larger when amplified over time. This
has important implications for how the vote has affected the
purchasing power of different income groups. Low-income
households spend a higher proportion of their income on
food than rich households.
The UK experienced several years of real wage falls following
the financial crisis of 2007/08, but in the period before the
referendum, real wage growth in the UK had become positive
(see Blanchflower and Machin, 2016; Blanchflower et al,
2017). This arose because of very low inflation, not because
of any strength in nominal wage growth (which seems to
have become stuck at a norm of 2% per year since the start
of the decade).
But the increase in prices following the Brexit vote coupled
with no significant rise in nominal wages has again caused
real wage growth to become negative. This is shown in
Figure 3, which indicates that the real wages squeeze is back
because of the post-referendum price increases.
By the end of our data period, the price increases following
the referendum have now fully appeared in the annual index.
It seems that the Brexit vote has caused a one-off rise in prices,
and that the annual growth rate of prices will begin to fall
out of the index once it no longer includes the months that
immediately followed the referendum.
Overall, this research points to a significant rise in prices
occurring after the EU referendum. Future work that builds on
these initial findings will quantify the role of the devaluation
of sterling by focusing closely on price changes for imported
goods and services.
Josh De Lyon is a research assistant in CEP’s trade
programme. Swati Dhingra is assistant professor of economics
at LSE and a research associate in CEP’s trade programme.
Stephen Machin is director of CEP.
Further reading
David Blanchflower and Stephen Machin (2016) ‘The Current
2% UK Wage Growth Norm’, CEP Real Wages Update
(http://cep.lse.ac.uk/pubs/download/rwu005.pdf).
David Blanchflower, Rui Costa and Stephen Machin (2017)
‘The Return of Falling Real Wages’, CEP Real Wages Update
(http://cep.lse.ac.uk/pubs/download/rwu006.pdf).
Swati Dhingra, Hanwei Huang, Gianmarco Ottaviano, Joao Paulo
Pessoa, Thomas Sampson and John Van Reenen (2017a)
‘The Costs and Benefits of Leaving the EU: Trade Effects’,
CEP Discussion Paper No. 1478 (http://cep.lse.ac.uk/pubs/
download/dp1478.pdf).
Swati Dhingra, Stephen Machin and Henry Overman (2017b)
‘The Local Economic Effects of Brexit’, CEP Brexit Analysis
No. 10 (http://cep.lse.ac.uk/pubs/download/brexit10.pdf).
John Rogers (2001) ‘Price Level Convergence, Relative Prices,
and Inflation in Europe’, FRB International Finance Discussion
Paper No. 699.Jan 2015 Jan 2016 Jan 2017 Jul 2017
Year
3
2
1
0
-1
% A
nn
ual G
row
th
■
Jan 2015 Jan 2016 Jan 2017 Jul 2017Year
3%
2%
1%
0%
-1%
Annual real wage growth (AWE-CPI)
An
nu
al g
row
th r
ate
Figure 3:
Real wage trends pre- and post-Brexit vote
CentrePiece Autumn 2017
25

Recent research has challenged the consensus that sudden inflows of refugees have little or no impact on natives’ wages and employment, claiming instead that there are uniformly large detrimental effects on natives without school qualifications. Michael Clemens and Jennifer Hunt demonstrate the flaws in this analysis: the labour market impact of immigration is small even on natives with low skill levels.
The labour market impact of refugee waves
QUEUEHERE
LABOURMARKET
CentrePiece Autumn 2017
26

The recent surge in migration to
Europe has brought renewed
attention to research on the
labour market effects of
sudden major inflows of refugees and
a reassessment of the findings of four
particularly influential studies:
n Card (1990), who finds that a large
inflow of Cubans to Miami in 1980 did not
affect natives’ wages or unemployment.
n Hunt (1992), who finds that a large
flow of refugees from post-independence
Algeria to France caused a small increase in
native unemployment.
n Friedberg (2001), who finds that a large
inflow of post-Soviet Jews to Israel 1990-94
did not reduce natives’ wages.
n And Angrist and Kugler (2003), who
find that a surge of Balkan refugees during
the 1990s was associated with higher
native unemployment across 18 European
countries, but who do not interpret the
association as causal because it is unstable
and statistically insignificant.
Two recent studies have challenged these
results by re-analysing all four of the refugee
waves. The researchers claim that earlier
work obscured uniformly large detrimental
effects from all four waves, either by
aggregating the affected workers with
unaffected workers (Borjas, 2017), through
inadequate identification of causality (Borjas
and Monras, 2017) or both.
Our latest study reconsiders the
published research on refugee inflows to
reconcile the new results with the old ones.
We show that for all four refugee waves,
the methods used in the recent re-analyses
are subject to substantial bias.
Correcting these biases largely
eliminates disagreement between the new
and old findings. Corrected methods offer
strong evidence of small detrimental effects
in France in 1962 and no clear evidence of
detrimental effects in 1980s Miami, 1990s
Israel or 1990s Europe.
Blunt instrumentsThe new research on these refugee
waves uses ‘instrumental variables’ to
separate correlation from causation – and
this is its biggest problem. The simple
association between natives’ labour market
outcomes and migrant inflows across
regions or occupations could arise not from
migrants’ effects but from their choice of
where to go. Migrants are likely to choose
high-wage areas or occupations, which
could mask any negative causal effect they
have on native wages. The new research
tries to account for this by using prior
migration flows as an instrumental variable.
This tests the effects of migration that was
determined by prior immigration patterns
– the instrumental variable – rather than
recent economic changes.
But there is a problem when the
instrumental variable (in this case, past
migration per population) and the
variable affected by migrants’ choice
of location or occupation (current
migration per population) have the same
denominator (Bazzi and Clemens, 2013).
The instrumental variable strategy only
works when the two variables are strongly
correlated, but any two variables will
be strongly correlated if they share the
same divisor.
Indeed, even random noise will be
correlated with a variable of economic
interest if both are divided by the same
quantity. If such a random ‘placebo’
instrument gives similar results in any
instrumental variables study, it implies
that the original instrument was doing
little work to separate correlation from
causation.
We show that repeating the Borjas
and Monras (2017) re-analysis of refugee
waves with a placebo instrument – random
noise divided by population – gives similar
results to the original studies. In most
cases, the results are actually stronger using
this meaningless placebo: the estimates
of detrimental effects on natives are a bit
larger and more statistically significant.
Kronmal (1993) suggests a simple
correction to address this problem: rather
There is no clear evidence of detrimental effects of large refugee waves
into 1980s Miami, 1990s Israel or 1990s Europe
The impact of immigration on average native-born workers is small
QUEUEHERE
LABOURMARKET
CentrePiece Autumn 2017
27

than divide past migrant flows and current
migration flows by population, use past
migrant flows by itself as an instrument
for current migrant flows by itself, while
controlling for population. When we
make this correction, none of the results
in Borjas and Monras differs substantially
from the original studies of Miami, France,
Israel and Europe.
The impact of the Mariel boatliftIn re-analysis of one of the four episodes,
the 1980 wave of Cubans into Miami
known as the ‘Mariel boatlift’, a special
problem arises. Although Borjas and
Monras (2017) agree with Card (1990)
that the boatlift did not affect native
workers’ unemployment, Borjas (2017)
argues that Card’s analysis missed large
detrimental effects on wages.
Card’s analysis aggregated all workers
with high school education or less, finding
no wage effects. Borjas separates out male
non-Hispanic workers with less than high
school education, and finds a very large
and robust fall in average wages for that
group in Miami relative to the same group
in comparison cities after 1980.
Our study points out a previously
unreported problem with the method
used by Borjas (2017). His result is
highly sensitive to selecting different
subsets of workers to study (Peri and
Yasenov, 2017), but the mechanism for
this has been unclear.
Among the sub-samples of non-
Hispanic men with less than high school
education that Borjas studies, the fraction
that were black is sharply higher after
the boatlift than before it in Miami, but
not in the comparison cities. This could
not have been caused by the arrival in
Miami of the Cubans themselves, since the
sample excludes Hispanics. It is likely to
reflect the large and simultaneous arrival
of low-income Haitians with less than
high school education (who cannot be
separated from US workers in the data),
and contemporaneous efforts by the
Census Bureau to improve its coverage of
low-income black men.
Because Haitian blacks earned much
less than US blacks, and US black men
earned much less than non-black men at
this education level, this compositional
change would mechanically cause a large,
spurious fall in the average wage in the
sample. It is enough to explain the entire
post-boatlift fall in wages observed by
Borjas (2017).
When estimates of the impact of the
boatlift are adjusted to account for the
change in the racial composition of the
sample, and when the effect of race on
wages is allowed to differ by city, the
effect that Borjas finds is attenuated
by more than 50%, and its statistical
significance becomes fragile to the choice
of dataset and choice of control cities.
A further adjustment recognising that
the effect of race on wages differs by
education level reduces the effect further
to statistical insignificance. The corrected
analysis cannot rule out a wage effect of
minus 2% to minus 8% relative to the
Borjas control cities – much smaller than
the minus 45% effect measured by Borjas
in the corresponding regressions – but
they cannot rule out a zero effect either.
ConclusionThe evidence from refugee waves
shows detrimental short-term effects
on native workers’ labour market
outcomes in some times and places but
no effect in others. It supports the existing
consensus that the impact of immigration
on average native-born workers is small
and does not support claims of large
detrimental impacts on workers with less
than high school education.
This article summarises ‘The Labor Market
Effects of Refugee Waves: Reconciling
Conflicting Results’ by Michael Clemens
and Jennifer Hunt, CEP Discussion Paper
No. 1491 (http://cep.lse.ac.uk/pubs/download/
dp1491.pdf).
Michael Clemens is at the Center for Global
Development. Jennifer Hunt of Rutgers
University has been a visiting academic at
CEP in 2017.
Further reading
Joshua Angrist and Adriana Kugler (2003)
‘Protective or Counter-productive?
Labour Market Institutions and the Effect of
Immigration on EU Natives’, Economic Journal
113(488): F302-31.
Samuel Bazzi and Michael Clemens (2013)
‘Blunt Instruments: Avoiding Common Pitfalls
in Identifying the Causes of Economic Growth’,
American Economic Journal: Macroeconomics 5(2):
152-86.
George Borjas (2017) ‘The Wage Impact of the
Marielitos: A Reappraisal’, Industrial and Labor
Relations Review 70(5): 1077-1110.
George Borjas and Joan Monras (2017)
‘The Labor Market Consequences of Refugee
Supply Shocks’, Economic Policy 32(91):
361-413.
David Card (1990) ‘The Impact of the Mariel
Boatlift on the Miami Labor Market’, Industrial
and Labor Relations Review 43(2): 245-57.
Rachel Friedberg (2001) ‘The Impact
of Mass Migration on the Israeli Labor Market’,
Quarterly Journal of Economics 116(4): 1373-1408.
Jennifer Hunt (1992) ‘The Impact of the 1962
Repatriates from Algeria on the French Labor
Market’, Industrial and Labor Relations Review
45(3): 556-72.
Richard Kronmal (1993) ‘Spurious Correlation
and the Fallacy of the Ratio Standard Revisited’,
Journal of the Royal Statistical Society Series A
156(3): 379-92.
Giovanni Peri and Vasil Yasenov (2017)
‘The Labor Market Effects of a Refugee
Wave: Applying the Synthetic Control
Method to the Mariel Boatlift’, NBER Working
Paper No. 21801.
Refugees have modest or no harmful effects on the wages and employment of native workers
CentrePiece Autumn 2017
28

CEP PUBLICATIONSCEP publications are available as electronic copies free to download from the Centre’s website:http://cep.lse.ac.uk/_new/publications/default.asp
ROBOT ARITHMETIC: CAN NEW
TECHNOLOGY HARM ALL WORKERS
OR THE AVERAGE WORKER?
Francesco Caselli and Alan ManningCEP Discussion Paper No. 1497
September 2017
ARE IDEAS GETTING HARDER TO FIND?
Nicholas Bloom, Charles Jones, John Van Reenen and Michael WebbCEP Discussion Paper No. 1496
September 2017
CAN RAISING INSTRUCTIONAL
TIME CROWD OUT STUDENT
PRO-SOCIAL BEHAVIOUR? UNINTENDED
CONSEQUENCES OF A GERMAN HIGH
SCHOOL REFORM
Christian KrekelCEP Discussion Paper No. 1495
August 2017
GOODS AND FACTOR MARKET
INTEGRATION: A QUANTITATIVE
ASSESSMENT OF THE EU ENLARGEMENT
Lorenzo Caliendo, Luca David Opromolla, Fernando Parro and Alessandro SforzaCEP Discussion Paper No. 1494
August 2017
THE LONG-LASTING EFFECTS OF FAMILY
AND CHILDHOOD ON ADULT WELLBEING:
EVIDENCE FROM BRITISH COHORT DATA
Andrew Clark, Sarah Flèche and Warn LekfuangfuCEP Discussion Paper No. 1493
July 2017
CEP BLOGS
CEP REAL WAGES UPDATES blog posts:
http://cep.lse.ac.uk/_new/publications/series.asp?prog=CEPRWU
CEP BREXIT blog posts:
http://cep.lse.ac.uk/BREXIT/blogs.asp
THE STATE OF WORKING BRITAIN
http://stateofworkingbritain.blogspot.co.uk
Follow CEP on Twitter
@CEP_LSECEP’s director Professor Steve Machin
@s_machin_CentrePiece editor Romesh Vaitilingam
@econromesh
Follow CEP on Facebook
www.facebook.com/Centre4EconomicPerformance
DO SPEED CAMERAS SAVE LIVES?
Cheng Keat TangSERC Discussion Paper No. 221
September 2017
HOUSING ALLOWANCE AND RENTS:
EVIDENCE FROM A STEPWISE
SUBSIDY SCHEME
Essi Eerola and Teemu LyytikäinenSERC Discussion Paper No. 220
August 2017
SERC/URBAN AND SPATIAL PROGRAMME DISCUSSION PAPERS
DECOMPOSING THE IMPACT OF
IMMIGRATION ON HOUSE PRICES
Rosa Sanchis-GuarnerSERC Discussion Paper No. 223
September 2017
PLANNING AHEAD FOR BETTER
NEIGHBORHOODS: LONG RUN
EVIDENCE FROM TANZANIA
Neeraj Baruah, Amanda Dahlstrand-Rudin, Guy Michaels, Dzhamilya Nigmatulina, Ferdinand Rauch and Tanner ReganSERC Discussion Paper No. 222
September 2017
CEP DISCUSSION PAPERS
HEALTHY BUSINESS? MANAGERIAL
EDUCATION AND MANAGEMENT
IN HEALTHCARE
Nicholas Bloom, Renata Lemos, Raffaella Sadun and John Van ReenenCEP Discussion Paper No. 1500
September 2017
BREXIT: THE ECONOMICS OF
INTERNATIONAL DISINTEGRATION
Thomas SampsonCEP Discussion Paper No. 1499
September 2017
EQUITY CROWDFUNDING AND EARLY
STAGE ENTREPRENEURIAL FINANCE:
DAMAGING OR DISRUPTIVE?
Saul Estrin, Daniel Gozman and Susanna KhavulCEP Discussion Paper No. 1498
September 2017
CEP BREXIT ANALYSIS SERIES
THE LOCAL ECONOMIC
EFFECTS OF BREXIT
Swati Dhingra, Stephen Machin and Henry OvermanCEP Brexit Analysis Paper No. 10
July 2017July 2017
CEP SPECIAL REPORTS
BREXIT AND THE FUTURE
OF GLOBALIZATION?
John Van ReenenCEP Special Paper No. 35
September 2017
INDUSTRY IN BRITAIN – AN ATLAS
Sandra Bernick, Richard Davies and Anna ValeroCEP Special Paper No. 34
September 2017

Cen treP iece
ISSN 1362-3761
C e n t r e Pi e c eThe Magazine of The Centre for Economic Performance Volume 21 Issue 3 Winter 2016
Trade negotiations FrackingAcademy schools Social mobilityStudying science Spain and Brexit
UNIVERSITIESAND ECONOMIC GROWTH
£
C e n t r e Pi e c eThe Magazine of The Centre for Economic Performance Volume 22 Issue 1 Spring 2017
Technology, jobs and politicsSuperstar US housesTeacher turnoverYouth crime
Origins of happiness
ISSN 1362-3761
ISSN 1362-3761
C e n t r e Pi e c eThe Magazine of The Centre for Economic Performance Volume 20 Issue 3 Winter 2015/16
Crime and violence Rapid response policingHigher education Telecoms tariffsOnline markets Mental health
FLOODECONOMICS
20-29
Home ownership & social mobility
C e n t r e Pi e c eThe Magazine of The Centre for Economic Performance Volume 22 Issue 2 Summer 2017
Entertainment TV Industrial strategyTuition fees Sleep economicsManagement practices Transport infrastructure
ISSN 1362-3761
CentrePiece is the magazine of the Centre for
Economic Performance at the London School of
Economics. Articles in this issue reflect the opinions
of the authors, not of the Centre. Requests for
permission to reproduce the articles should be sent
to the Editor at the address below.
Editorial and Subscriptions Office
Centre for Economic Performance
London School of Economics
Houghton Street
London WC2A 2AE
© Centre for Economic Performance 2017
Volume 22 Issue 3
(ISSN 1362-3761) All rights reserved.
Follow CEP on Twitter @CEP_LSE
CEP’s director @s_machin_
CentrePiece editor Romesh Vaitilingam @econromesh
Follow CEP on Facebook www.facebook.com/Centre4EconomicPerformance