Embed Size (px)
Citation preview

Corporate Governance and Performance in Socially Responsible Corporations: New Empirical
Insights from a Neo-Institutional Framework
Collins G. Ntim and Teerooven Soobaroyen
Centre for Research in Accounting, Accountability and Governance
Faculty of Business and Law, School of Management University of Southampton
Southampton, UK
Corresponding author. Address for correspondence: Centre for Research in Accounting, Accountability and
Governance, Building 2, School of Management, University of Southampton, University Road, Highfield, Southampton, SO17 1BJ, UK. Tel: +44 (0) 238 059 8612. Fax: +44 (0) 238 059 3844. E-mail: [email protected].
Corporate Governance and Performance in Socially Responsible Corporations: New Empirical Insights from a Neo-Institutional Framework
Abstract
Manuscript Type: Empirical
Research Question/Issue: This paper investigates the relationship between corporate governance (CG)
and corporate social responsibility (CSR), and consequently, examines whether CG can positively
moderate the association between corporate financial performance (CFP) and CSR.
Research Findings/Insights: Using a sample of large listed corporations from 2002 to 2009, we find that,
on average, better-governed corporations tend to pursue a more socially responsible agenda through
increased CSR practices. We also find that a combination of CSR and CG practices has a stronger positive
effect on CFP than CSR alone, implying that CG positively influences the CFP-CSR relationship. Our
results are robust to controlling for different types of endogeneities, as well as alternative CFP, CG and
CSR proxies.
Theoretical/Academic Implications: The paper generally contributes to the literature on CG, CSR and
CFP. Specifically, we make two main new contributions to the extant literature by drawing on new
insights from an overarching neo-institutional framework. First, we show why and how better-governed
corporations are more likely to pursue a more socially responsible agenda. Second, we provide evidence
on why and how CG might strengthen the link between CFP and CSR.
Practical/Policy Implications: Our findings have important implications for corporate regulators and
policy-makers. Since our evidence suggests that better-governed corporations are more likely to be more
socially responsible with a consequential positive effect on CFP, it provides corporate regulators,
managers and policy-makers with a new impetus to develop a more explicit agenda of jointly pursuing CG
and CSR reforms, instead of merely considering CSR as a peripheral component of CG or as an
independent corporate activity.
Keywords: Corporate Governance, Corporate Social Responsibility, Corporate Financial
Performance, Neo-Institutional Theory

1
INTRODUCTION
This study focuses on the relationship between corporate governance (CG) and corporate social
responsibility (CSR). As such, it is at the intersection of two topical and closely-related research strands,
namely: (i) the effects of CG on corporate financial performance (CFP) (Gompers, Ishii, & Metrick, 2003;
Henry, 2008; Bozec & Bozec, 2012); and (ii) the determinants/consequences of a company’s CSR
practices (McGuire, Sundgren, & Schneeweis, 1988; Fifka, 2013). However, studies investigating the link
between a company’s CG and its CSR strategy (Haniffa & Cooke, 2005; Michelon & Parbonetti, 2012)
and/or how a company’s CG might potentially influence the CFP-CSR nexus (Arora & Dharwadkar, 2011;
Ntim, Opong, & Danbolt, 2012a) are very rare. This study, therefore, investigates why and how a
company’s internal CG mechanisms may drive its CSR practices. We also examine why and how the
CSR and CFP association might be intensified by CG.
The past decades have witnessed a significant interest in the extent of CSR practices (Mackenzie,
2007; Jo & Harjoto, 2012). Whilst a large number of reasons have been offered to explain why
corporations may engage in CSR activities (Prior, Surroca, & Tribo, 2008; Young & Marais, 2012),
recent theoretical developments suggest that the substantial growth in CSR activities can also be
explained by institutional context and theory (Aguilera et al., 2007). In particular, neo-institutional theory
suggests that institutional forces, such as economic, political and social institutions can interact to shape,
limit and/or facilitate the diffusion and/or imposition of business practices and innovations in corporations
(DiMaggio & Powell, 1983, 1991; Scott, 1987, 2001). In general such institutional antecedents have been
demonstrated to be driven by two main motives: legitimation (moral/relational) and efficiency
(instrumental) (Aguilera & Cuervo-Cazurra, 2004; Aguilera et al., 2007; Zattoni & Cuomo, 2008).
However, whilst neo-institutional theory has been successfully used in explaining the diffusion and/or
imposition of a number of corporate practices, such as differences in the adoption of international
accounting and CG standards (Aguilera & Jackson, 2003; Yoshikawa et al., 2007; Zattoni & Cuomo,
2008; Judge et al., 2008, 2010), little is known about institutional antecedents and explanations for the

2
rapid proliferation of CSR practices among corporations. This limits current understanding of the main
institutional antecedents of the global diffusion of CSR practices at the organisational level.
Consequently, the current study seeks to extend and apply an overarching1 neo-institutional
theory to explain differences in CSR practices at the organisational level - with an emphasis on the
theoretical implications of legitimation and efficiency. From a legitimation/moral perspective (Ashforth &
Gibbs, 1990; Suchman, 1995), neo-institutional theory suggests that regulative institutional pressures can
compel economic units to conform to expected social behaviour and international standards. This is
because conforming to such expected social behaviour can enhance legitimacy and social acceptance.
Thus, compliance with good CSR practices in the form of increased CSR disclosures can facilitate
congruence of corporate goals and norms with those of the larger society, and thereby improving
organisational legitimacy. Similarly, the need to maintain good relationships with various corporate
stakeholders (Aguilera et al., 2007), and therefore improving corporate legitimacy can influence
economic actors to engage in or mimic accepted social behaviour (Mizruchi & Fein, 1999). Hence,
corporate engagement in CSR activities can strategically enhance organisational legitimacy by winning
the support of powerful corporate stakeholders, such as governments, politicians, shareholders and trade
unions (Freeman & Reed, 1983; Freeman, 1984).
In parallel, the efficiency/instrumental view of neo-institutional theory predicts that regulative,
cognitive and normative institutional pressures can also compel economic entities to compete for critical
resources in order to protect shareholder interests and maximise corporate performance (Aguilera et al.,
2007; Chen & Roberts, 2010). Thus, corporate investments in socially responsible activities can enhance
efficiency by reducing economic, social, environmental and political costs, but also can increase access to
critical resources, such as finance, business contracts, skilled management, and labour (Pfeffer & Salancik,
1978; Branco & Rodrigues, 2006). Furthermore, greater commitment to CSR can improve corporate
efficiency and maximise CFP by minimising agency conflicts through a reduction in information
asymmetry between managers and corporate stakeholders (Jensen & Meckling, 1976; Rhodes &
Soobaroyen, 2010). Therefore, in consideration of the apparent multi-faceted nature and consequences of

3
CSR and CG practices (Parker, 2005; Devinney, 2009), there is an increasing consensus that these
practices have to be examined from a theoretical perspective, which encompasses both legitimation and
efficiency motives (Zattoni & Cuomo, 2008; Judge et al., 2008, 2010).
Thus, this study makes two main new contributions to the extant literature by examining the links
among CFP, CG, and CSR. First, by relying on a generalised neo-institutional theory, which emphasises
the legitimation and efficiency effects of CSR, we seek to investigate the extent to which a firm's internal
CG structures may influence its CSR practices. Specifically, using an integrated CG index, as well as
alternative CG mechanisms, we investigate the relationship between CG and CSR mechanisms. Our
results contribute to the literature by showing that, on average, better-governed corporations are also more
likely to pursue a more socially responsible agenda. In this case, our organisational-level findings
complement existing studies that have employed neo-institutional theory to primarily predict institutional
factors that drive the diffusion of business practices at the country level (Aguilera & Cuervo-Cazurra,
2004; Yoshikawa et al., 2007; Zattoni & Cuomo, 2008; Judge et al., 2008, 2010).
Second, the considerable numbers of studies that have examined the effect of CSR on CFP report
conflicting evidence (McGuire et al., 1988; Mahoney & Roberts, 2007; Becchetti & Ciciretti, 2009).
Whilst this has been attributed primarily to potential methodological weaknesses and endogeneities
(McWilliams & Siegel, 2000; Jo & Harjoto, 2011), recent studies that adequately control for such
problems still generally report similar mixed results (Scholtens, 2007, 2008; Cai et al., 2012). However,
given that the decision to engage in CSR activities emanates from corporate boards and top management
(Haniffa & Cooke, 2005; Michelon & Parbonetti, 2012), we conjecture that CG is likely to have a
positive effect on the CFP-CSR link. Our results contribute to the extant literature by demonstrating that a
combination of CSR and CG has a stronger positive effect on CFP compared to the effect of CSR alone.
The rest of the paper is structured as follows. The next section discusses the theoretical
framework. The following sections discuss the related literature, outline the research context and design,
and present the empirical analyses, with the concluding remarks containing a summary and a brief
discussion of policy implications.

4
A NEO-INSTITUTIONAL FRAMEWORK FOR CSR PRACTICES
While the concept of ‘institution’ has been defined in different ways (DiMaggio & Powell, 1983, 1991;
Scott, 1987, 2001), it generally refers to accepted socio-economic beliefs, norms and practices associated
with different aspects of society, such as education, law, politics, religion, and work (Judge et al., 2008,
2010). Economic institutions focus on determining the motives for members of society (e.g., individuals,
corporations, and nations) in engaging in economic activities, such as growth maximisation (North, 1990;
Judge et al., 2008). Such institutions can be formal (e.g., laws and regulations) and/or informal (e.g.,
norms and conventions). Thus, institutional theory from an economic standpoint can be directly linked to
the concept of ‘economic efficiency’ (Aguilera & Cuervo-Cazurra, 2004; Zattoni & Cuomo, 2008) or
‘instrumentality’ (Aguilera et al., 2007) in that it suggests that societal members primarily tend to seek to
maximise their self-interests by competing for resources. In contrast, sociologists consider institutions as
being more than just efficient means of producing goods and services, but also as social and cultural
systems with some symbolic value (Meyer & Rowan, 1977). Hence, the sociological approach to
institutional theory suggests that individuals, groups and corporations not only compete for economic
resources (‘economic efficiency’), but also seek social approval for the right to exist (‘social legitimacy’)
(Zattoni & Cuomo, 2008). In this respect, legitimation is seen as a relational motive because it
encompasses a concern for how a firm’s actions are perceived by others (Aguilera et al., 2007). In
addition, it is argued that this concern is driven by the individual values and ethics of organisational actors,
which might steer the firm to adopt practices that have no immediate or obvious benefit (i.e., infusing
organisations with a moral motive).
In particular, the neo-institutional theory proposed by Scott (2001) places great emphasis on three
levels of analysis: societal (global) institutions; governance structures; and actors. Briefly, and at the top
of Scott’s model are societal and global institutions, which provide a platform, where what is considered
to be possible, acceptable and legitimate models and menus of social behaviour are officially proposed
and informally passed (Judge et al., 2008, 2010). These higher level institutions can shape, impede and/or
spur structures and actions at lower levels. Governance structures occupy the middle level of Scott’s

5
model, consisting of organisational fields (e.g., corporations that operate in similar industries, as reflected
in the similarity of goods and services offered) and organisations themselves. As corporations differ in
complexity, culture, function, and structure, the organisational level of analysis is equally important as it
has the capacity to affect, and be affected by the organisational fields and the general institutional context.
At the bottom of Scott’s institutional model are actors, consisting of individuals and groups. Drawing
from DiMaggio and Powell’s (1983, 1991) ‘coercive/regulative’ (i.e., the presence of institutions that can
force actors to conform to accepted standards), ‘cognitive/mimetic’ (i.e., the capacity to copy the
behaviour of other social actors), and ‘normative’ (i.e., expected and accepted social behaviour) concepts
of institutions, Scott (2001) suggests that these institutional pressures can affect (and are affected by) the
forces of diffusion and/or imposition of institutional norms and practices, whilst inventing new ways of
operating and/or negotiating the development of new institutional norms and practices (North, 1990;
Judge et al., 2010). Therefore, a major underlying assumption within an ‘overarching’ neo-institutional
perspective is that the actors are not only competing for resources (‘efficiency’), but they are also seeking
ultimate legitimacy and social acceptance (‘legitimation’). Finally the actors at the three levels interplay
to create similarities in structure, thought, and action (i.e., ‘institutional isomorphism’) within institutional
contexts.
Neo-institutional theory has been successfully employed in predicting the diffusion and/or
imposition of a number of corporate practices at the national level, such as the adoption of good CG
practices (Aguilera & Cuervo-Cazurra, 2004; Yoshikawa et al., 2007; Zattoni & Cuomo, 2008),
international accounting standards (Judge et al., 2010), and CG legitimacy (Aguilera & Jackson, 2003;
Judge et al., 2008). However, neo-institutional theory has been rarely applied at the organisational level of
analysis relating to CG/CSR, and this is particularly relevant with respect to the rapid global diffusion
and/or imposition of CSR practices over the past decades. Arguably, there is scope to extend our
understanding of the institutional antecedents and explanations for the rapid proliferation of CSR
practices among corporations (Aguilera et al., 2007). The current study, therefore, seeks to extend and
apply neo-institutional theory to explain differences in CSR practices at the firm level with particular

6
emphasis on its legitimation and efficiency implications. Our study is also informed by Aguilera et al.’s
(2007) multilevel theory, which models corporate CSR activities as having both legitimation
(moral/relational) and efficiency (instrumental) motives.
In this respect, a primary resource of all economic organisations is to retain or gain the basic right
to exist and legitimacy for their operations (Ashforth & Gibbs, 1990; Suchman, 1995). Suchman (1995)
indicates that a corporation’s right to exist is legitimised if its value system is in congruence with that of
the larger social system of which it is part of, but threatened when there is a potential/actual mismatch
between the two value systems (Ashforth & Gibbs, 1990; Suchman, 1995). Thus, the capacity of a
corporation to achieve social acceptance will depend on its ability to demonstrate (i) ‘moral, and/or (ii)
relational’ responsibility, respectively, towards (i) higher-order values and stewardship interests, and (ii)
stakeholder interests and societal expectations (Aguilera et al., 2007: 837). Neo-institutional theory
suggests that a major way of achieving legitimacy is to incorporate accepted institutional norms, rules,
conventions and practices into corporate operations (DiMaggio & Powell, 1983, 1991; Scott, 1987, 2001).
Hence, complying with CSR practices through increased CSR disclosures can enhance corporate
legitimacy. Similarly, voluntarily engaging in good CSR practices can help corporations to gain moral
and relational legitimacy by fairly balancing the diverse and often conflicting demands of their various
powerful stakeholders, such as shareholders, governments, politicians, and employee unions (Freeman &
Reed, 1983; Freeman, 1984).
In addition to seeking legitimacy for their operations, economic organisations, especially Anglo-
American corporations have a major objective of enhancing efficiency in order to maximise CFP
(Aguilera & Cuervo-Cazurra, 2004; Devinney, 2009). From an efficiency perspective, neo-institutional
theory suggests that conformance to ‘regulative/coercive’, ‘cognitive/mimetic’, and ‘normative’
institutional forces can be a strategic/instrumental attempt at competing for critical resources, which can
enhance CFP. In this case, engaging in CSR activities, such as investing in employees and
environmentally friendly technology can improve CFP by gaining competitive advantages (Pfeffer &
Salancik, 1978; Branco & Rodrigues, 2006, 2008). Further, increased commitment to CSR can improve

7
efficiency and enhance CFP by minimising agency costs via a reduction in information asymmetry among
financial stakeholders (Jensen & Meckling, 1976; Rhodes & Soobaroyen, 2010).
CG, CSR, AND CFP LITERATURE AND HYPOTHESES DEVELOPMENT
Prior Studies on the Association between CG and CSR, and Hypotheses Development Past studies have investigated how CG influences voluntary disclosures (Eng & Mak, 2003; Barako et. al.,
2006; Collett & Hrasky, 2005; Beekes & Brown, 2006) and CFP (Gompers et al., 2003; Renders et al.,
2010; Bozec & Bozec, 2012). Others have examined how general firm-level features, such as size affect
CSR practices (Adams, 2002; Reverte, 2009; Mahadeo et al., 2011; Fifka, 2013), whilst a limited number
of studies have explored how ownership and board characteristics influence CSR disclosures (Hillman et
al., 2001; Lattemann et al., 2009; Judge, 2012). We draw from these strands of the literature to identify
potential CG variables that might influence CSR disclosures and develop a hypothesis for each of the
variables. Specifically, we investigate how: (i) the quality of a firm’s internal governance mechanisms, as
measured by a CG disclosure index; (ii) ownership variables (government ownership, block ownership,
and institutional ownership); and (iii) board characteristics (board size, independent directors, and board
diversity) affect CSR practices.
Corporate Governance Disclosure Index. The past decades have witnessed a rapid global diffusion of
codes of good CG (Aguilera & Cuervo-Cazurra, 2009). Whilst most of these codes have focused on good
practices for the benefits of shareholders, a few emphasise the firm’s responsibility towards a broader
constituency of stakeholders, including recommendations for good CSR practices (Mallin, 2006, 2007).
Empirically, a considerable number of studies suggest that good CG enhances CFP (see Bozec & Bozec,
2012). By contrast, evidence on whether good CG improves CSR practices is rare (Jamali et al., 2008;
Michelon & Parbonetti, 2012). However, and to the extent that good CG is associated with better
monitoring, it can be expected to positively influence CSR (Starks, 2009; Arora & Dharwadkar, 2011).
Similarly, from a neo-institutional perspective, complying with good CG rules (i.e., coercive/regulative
pressures) in the form of increased CSR practices can improve the legitimacy of corporate structures and

8
operations by enhancing corporate reputation (Scott, 1987; Suchman, 1995). Similarly, greater
commitment to replicate (i.e., cognitive/mimetic pressures) and/or adopt (i.e., normative pressures) good
CSR practices can improve efficiency and CFP by gaining access to critical resources, such as finance,
government contracts, skilled employees, and management by winning the support of powerful
stakeholders (Pfeffer & Salancik, 1978).
CG has been broadly theorised as either a pillar/dimension of or complement to CSR (Jamali et
al., 2008). This suggests that CG is inextricably linked to CSR (Elkington, 2006); with better-governed
firms more likely to engage in CSR as a credible way of signalling their CG quality (Beekes & Brown,
2006). Further, the CG-CSR nexus becomes more visible when the broader conception of CG is
considered, which does not only require honesty, transparency and accountability to shareholders, but also
responsibility to all stakeholders (Jamali et al., 2008).
Although a limited number of studies have empirically examined how ownership and board
structures influence CSR practices (Aguilera et al., 2006; Barako & Brown, 2008; Dam & Scholtens,
2012), studies using CG indices are generally scarce. Consistent with past evidence (Gibson &
O’Donovan, 2007; Jamali et al., 2008; Lattermann et al., 2009), using Gompers et al.’s (2003) CG index
(GIM), Arora and Dharwadkar (2011) find a positive effect of CG quality on good CSR practices.
Similarly, using GIM’s index, Harjoto and Jo (2011) report that CG impacts positively on CSR. Further,
the findings of recent US studies by Jo and Harjoto (2011, 2012) and Cai et al. (2012) support past
evidence that better-governed corporations tend to engage in CSR practices than their poorly-governed
counterparts. This suggests that good CG may impact positively on CSR practices and therefore, our first
hypothesis is that:
Hypothesis 1: There is a positive association between internal CG quality, as measured by a CG disclosure index and the extent of CSR practices. Government Ownership. From a neo-institutional perspective (DiMaggio & Powell, 1983, 1991; Scott,
1987, 2001), governments, as societal institutions, possess the coercive power of the State (e.g., laws and
enforcement) to regulate the behaviour of lower societal actors, including those at the organisational level.
Meanwhile codes of good CG and prescriptions for CSR practices (e.g., Global Reporting Initiative)

9
issued around the world have been supported by global institutions, such as the EU, OECD and World
Bank, with a resultant influence on national governments (Aguilera & Cuervo-Cazzura, 2004; Zattoni &
Cuomo, 2008). Therefore, our expectation is that corporations with higher government ownership will
actively lobby for government support by engaging in increased CSR disclosures. This is because
winning the support of government as an influential stakeholder may not only help in legitimising
corporate operations (moral and/or relational legitimation) (Aguilera et al., 2007), but also facilitate
access to extra resources (economic efficiency), such as subsidies/tax holidays, which can enhance CFP
(Pfeffer & Salancik, 1978). Additionally, neo-institutional theory suggests that voluntarily adopting
and/or copying good CSR practices can enhance efficiency and CFP by minimising agency conflicts
between executives and government (as a powerful shareholder).
However, prior evidence suggests that the effectiveness of government ownership in facilitating
good CSR practices depends on the size and type of government ownership (Cressy et al., 2010; Hou &
Moore, 2010; Johan & Najar, 2010). The evidence suggests that in countries with poor governance in the
form of high levels of corruption and fraud, high government ownership can lead to poor CSR practices
and vice-versa. For example, Jia et al. (2009), and Hou and Moore (2010) provide evidence that suggests
that dominant Chinese government ownership is associated with poor monitoring and high levels of fraud.
This implies that strong support through tight political connection in state-owned companies effectively
minimises enforcement action by weak regulatory authorities and corrupt officials. Cumming et al. (2010)
also find that private equity returns in Asia are higher in countries with higher levels of corruption. This
suggests that the economic costs of corruption or cronyism can be mitigated by greater monitoring by
activist fund managers, leading to higher efficiency and returns in the investee companies.
Empirically, there is an acute lack of studies that examine the link between government
ownership and CSR activities. However, Eng and Mak (2003), Tagesson et al. (2009), and Khan et al.
(2012) find that government ownership is positively related to CSR practices, whilst Dam and Scholtens
(2012) report that government ownership has a negative effect on CSR practices. Despite the mixed
limited evidence, and following past suggestions and evidence (Jia et al., 2009; Hou & Moore, 2010), we

10
expect a positive link between government ownership and CSR practices in countries, where government
has low, but strategic ownership interests in most large corporations with great interest in CSR practices
(Ntim et al., 2012b). Therefore, our second hypothesis is that:
Hypothesis 2: There is a positive association between government ownership and the extent of CSR practices.
Block Ownership. From an efficiency-led perspective, higher managerial monitoring that is often
associated with block ownership can be expected to reduce agency conflicts and thus, there is less
demand for CSR disclosures from powerful stakeholders. From a legitimation perspective, the need for
public accountability may be less of an issue in firms with concentrated ownership structures because of
limited and less powerful outsider interests. In other words, closely held firms tend to be better at
avoiding coercive, mimetic and normative institutional pressures to adopt new business practices,
including CSR ones than their widely held counterparts. Consequently, managers of closely held firms
tend to invest less in CSR because the costs of investing in such activities may outweigh their benefits
(Khan et al., 2012). By contrast, managerial opportunism and conflict of interests are rife in firms with
dispersed ownership structure (Oh et al., 2011). Thus, CSR disclosure can enhance efficiency and CFP for
shareholders by acting as a bonding and monitoring mechanism to reduce agency conflicts between
managers and diffused shareholders (Reverte, 2009).
Empirically, the literature is largely consistent with the view that concentrated ownership is
associated with low CSR disclosures. For example, and in line with the findings of past studies (Haniffa
& Cooke, 2005; Brammer & Pavelin, 2008; Reverte, 2009), Barnea and Rubin (2010) report that block
ownership is negatively associated with CSR disclosures. Similarly, evidence by Arora and Dharwadkar
(2011) suggests that managers of closely held firms engage in less CSR practices. The findings of more
recent evidence (Harjoto & Jo, 2011; Jo & Harjoto, 2011, 2012; Oh et al., 2011; Khan et al., 2012)
provide support for the view that ownership concentration leads to less CSR practices. Therefore, block
ownership can be expected to impact negatively on CSR practices, and thus, our third hypothesis is that:
Hypothesis 3: There is a negative association between block ownership and the extent of CSR practices.

11
Institutional Ownership. Institutional shareholders have long been at the fore front of promoting the
rapid proliferation of codes of good CG/CSR practices (Aguilera et al., 2006). From a legitimation
perspective, institutional owners have financial, knowledge and information advantages over small
shareholders. Institutional owners are, therefore, influential in corporate decision-making, including
decisions on investment, executive appointment and disclosure (Oh et al., 2011). In particular, and
because of their substantial ownership stakes, which they cannot easily sell, institutional shareholders
have extra incentive to monitor corporate disclosures. Thus, large institutional shareholders can lobby
corporate executives to engage in increased disclosures, including CSR ones. Furthermore, the relevance
of CSR disclosures is heightened in the case of ethical investment funds, which explicitly rely on
corporate social and environmental information to make investment decisions. This increased
commitment to good CSR practices can enhance corporate legitimacy by winning the support of other
powerful stakehoders, such as employees and governments, and also improve efficiency and CFP for
shareholders by gaining access to critical resources.
However, the empirical evidence on the link between institutional shareholding and CSR
practices is mixed. For instance, whilst Aguilera et al. (2006) report that differences in CG, including
institutional shareholdings between the UK and US explain the differences in the extent of CSR activities,
Dam and Scholtens (2012) find that institutional ownership has an insignificant effect on CSR disclosures.
Similarly, whereas the findings of Barnea and Rubin (2010) suggest a negative connection between
institutional ownership and CSR practices, recent evidence (see Harjoto & Jo, 2011; Jo & Harjoto, 2011,
2012; Oh et al., 2011) suggests a positive association between the two variables. However, institutional
owners tend to have larger ownership stakes in incorporations with a motive of making profit. Therefore,
our expectation is that institutional owners are likely to actively seek to win the support of other powerful
stakeholders, such as governments and employees by lobbying managers to project a more socially
responsible image. Therefore, our fourth hypothesis is that:
Hypothesis 4: There is a positive association between institutional ownership and the extent of CSR practices.
12
Board Size. Corporate boards perform two main strategic functions: conformance (e.g., monitoring
compliance with rules and disciplining managers) and performance (e.g., providing advice and access to
resources) (Jensen & Meckling, 1976; Jensen, 1993). From a neo-institutional perspective, larger boards
are associated with higher managerial monitoring, which can improve efficiency and CFP for
shareholders by ensuring conformance to corporate regulations and norms. This is because it is more
difficult for a dominant CEO to control a larger board than a smaller one, and as such, executive decisions,
including disclosure/CSR ones can effectively be scrutinised by larger boards. For example, Jia et al.
(2009), and Hou and Moore (2010) report that larger Chinese supervisory boards are more likely to be
punished for fraudulent behaviour, suggesting that greater monitoring is expected of larger boards. Thus,
since CSR information is increasingly an important element of voluntary disclosures, we expect firms
with larger boards to engage in good CSR practices than their smaller counterparts. Similarly, and from a
legitimation perspective, larger boards are associated with greater diversity in terms of expertise,
experience and stakeholder representation, which can enhance corporate reputation and image. The
presence of diverse stakeholders on larger boards can lead to greater demand for different CSR activities,
and therefore larger boards can be expected to engage in good CSR practices.
By contrast, others contend that larger boards are ineffective because of greater co-ordination and
communication problems (Jensen, 1993). That is, as the size of the board increases, the tendency for
directors to engage in free-riding and shirking of responsibilities also increases, leading to lower
managerial monitoring. Hence, there is a greater risk of larger boards being dominated by powerful
managers, which can impact negatively on corporate disclosures, including CSR practices.
Empirical evidence on the relationship between board size and CSR practices is generally rare,
but Mackenzie (2007) reports that corporate boards have a positive impact on CSR disclosures, whereas
Lindgreen et al. (2010) find that corporate boards have insignificant impact on CSR disclosures. Given
the conflicting literature, however, our fifth hypothesis is that:
Hypothesis 5: There is an association between board size and the extent of CSR practices.
13
Independent Directors. From a neo-institutional perspective, it can be observed that a legitimacy gap
inherently exists in modern companies, whereby ownership is separate from control. Indeed, at the core of
the agency ‘problem’ is a lack of trust between managers and shareholders, which translates into a threat
to, or concern about, the legitimacy of management’s decisions supposedly taken in the best interests of
shareholders. This legitimacy threat could be miminised by electing independent directors to represent
outside stakeholders. Hence, the appointment of independent directors constitutes a way of addressing the
legitimacy gap by serving as a sign of congruence between corporate practices and societal or stakeholder
expectations (Deegan, 2002). Therefore, the presence of independent directors can assist in improving
efficiency and CFP for shareholders by reducing agency problems between executives and owners, and in
advancing the interests of other stakeholders. Additionally, independent directors are perceived to be
better at honouring the obligations of the firm, including CSR ones, as doing so may enhance their current
and future reputation. Hence, independent directors may be more motivated to put pressure on managers
to engage in good CSR practices.
Existing empirical evidence largely suggests that the presence of independent directors impacts
positively on CSR practices. For example, and consistent with past evidence (Eng & Mak, 2003; Hillman
et al., 2001; Haniffa & Cooke, 2005; Barako & Brown, 2008; Brammer & Pavelin, 2008), Lattermann et
al. (2009) report a positive effect of independent directors on CSR disclosures. Further, recent evidence
by Harjoto and Jo (2011), Jo and Harjoto (2011, 2012), and Michelon and Parbonetti (2012) suggests that
firms with higher proportion of independent directors tend to be more socially responsible. However, the
effectiveness of independent directors in improving CSR practices depends on the context, including the
legal environment, their expertise/experience, and independence. Therefore, our sixth hypothesis is that:
Hypothesis 6: There is a positive association between independent directors and the extent of CSR practices.
Board Diversity. Board diversity broadly refers to the various characteristics that may be present among
directors that can influence decision-making (Van der Walt & Ingley, 2003). These attributes include
those that are directly observable (age, gender, ethnicity, and nationality) and those that are less visible
(religion, education, and occupation) (Mahadeo et al., 2012). In particular, ethnicity and gender are
14
topical issues of concern worldwide and have attracted the attention of national (e.g., Australia, Canada,
Malaysia, Norway, South Africa, and US) and/or global institutions (e.g., the World Bank, EU, and
OECD), leading, for instance, to prescriptions on how to improve gender/ethnic minority representation
on corporate boards. Neo-institutional theory suggests that boards of diverse gender and ethnic
backgrounds can help enhance efficiency and CFP for shareholders by linking a firm to its external
environment and attract resources, as well as enhance corporate legitimacy. Similarly, boards of diverse
ethnic and gender origins can increase board independence, which can enhance efficiency by improving
managerial monitoring and performance. Specifically, recruiting female directors and directors from
ethnic minorities can bring about diversity in ideas and opinions to board discussions. In line with this
view, Carter et al. (2003) report that more diverse (i.e., on the basis of ethnicity and gender) US boards
perform better than their less diverse counterparts. Additionally, corporate boards of diverse backgrounds
can help provide a better link with stakeholders. This can further enhance growth opportunities, as well as
generate stronger orientation towards CSR practices (Barako & Brown, 2008). Therefore, and given that
the extent of CSR involvement is primarily an executive decision, we expect more diverse boards to put
more pressure (especially by ethnic minorities and female members) on corporate managers to engage in
increased CSR practices.
Empirical evidence on the effect of board diversity on CSR is generally scarce, although Haniffa
and Cooke (2005), and Barako and Brown (2008) report that boards of diverse ethnic and gender
backgrounds impact positively on CSR disclosures. Therefore, our seventh hypothesis is that:
Hypothesis 7: There is a positive association between board diversity on the basis of ethnicity & gender, and the extent of CSR practices.
The Link between CFP and CSR: The Moderating Effect of CG Informed by the neo-institutional perspective, we contend that CSR investments may be made for two
main purposes: legitimation (social/moral/relational) and efficiency (instrumental) (Aguilera et al., 2007).
Therefore, the expectation is that CSR may not necessarily have a strong link with CFP if corporations
merely engage in CSR practices in response to regulative, cognitive and normative institutional forces in
order to gain and improve corporate legitimacy. In contrast, if corporations show greater commitment to

15
good CSR practices in order to strategically enhance corporate efficiency, then CSR can be expected to
have direct impact on CFP. In fact, there are two main contrasting theoretical views regarding the effect
of CSR on CFP. One view is that socially responsible corporations incur costs that place them at an
economic disadvantage compared with less responsible firms (Friedman, 1970; McGuire et al., 1988;
Devinney, 2009), and thus leading to a negative CFP-CSR nexus. These costs include managerial
opportunism (agency problems), socio-communal and environmental investments (financial), and
ethically forgoing competitive investments/products, services and locations (strategic).
The alternative view is that being socially responsible can impact positively on CFP in a number
of ways. First, engaging in CSR can enhance efficiency and CFP by reducing information asymmetry and
agency costs (Jensen & Meckling, 1976; Reverte, 2009). Second, greater commitment to CSR can
improve CFP by facilitating conformance to social norms in order to legitimise corporate operations that
may not only enhance corporate reputation and image, but also provide access to critical resources
(Pfeffer & Salancik, 1978; DiMaggio & Powell, 1983; Suchman, 1995). Third, addressing the needs of
powerful stakeholders, such as customers, governments, and employees, can enhance CFP by reducing
political costs (litigation, regulation, taxation, and nationalisation), labour frictions, and customer
boycotts (Freeman, 1984; Donaldson & Preston, 1995).
Consistent with this conflicting set of theoretical perspectives, the considerable numbers of
studies that have examined the CFP-CSR association report mixed evidence (McGuire et al., 1988;
Nelling & Webb, 2009; Callado-Munoz & Ultrero-Gonzalez, 2011), although they are observably
concentrated in a few developed countries with largely similar institutional contexts (Becchetti & Ciciretti,
2009; Fifka, 2012). Whilst the mixed evidence has been widely attributed to methodological weaknesses
arising from endogeneities and omitted variables (McWilliams & Siegel, 2000; Orlitzky et al., 2003), the
findings of recent studies that sufficiently address such problems are still mixed (Bird et al., 2007; Lo &
Sheu, 2007; Scholtens, 2007, 2008; Harjoto & Jo, 2011; Cai et al., 2012; Jo & Harjoto, 2011, 2012).
In contrast, there is significant evidence to suggest that CG impacts positively on CFP (see Bozec
& Bozec, 2012). Therefore, and given that the decision to engage in good CSR activities emanates from

16
corporate boards, we propose that CG is likely to have an enhancing effect on the CFP-CSR nexus. We
base this conjecture on a new emerging theoretical and empirical evidence that suggests that although
both CG and CSR disclosures are priced by the stock markets, CG disclosures have higher valuation than
CSR ones (Jamali et al., 2008; Starks, 2009; Arora & Dharwadkar, 2011; Ntim et al., 2012a). That is, the
potential positive effect of CSR practices on CFP is mainly through the likely positive impact of CG
structures on CFP, and hence the profit creation is predominantly through CG rather than CSR practices.
More specifically, prior literature suggests a number of ways by which CG may heighten the link
between CSR and CFP. First, Jamali et al. (2008) suggests that CG can be considered as a pillar,
dimension of, and/or complement to CSR. CSR is, thus, conceptualised as an extension of good
governance. This implies that in better-governed firms (i.e., firms depicting high levels of accountability,
responsibility, and transparency), managers are more likely to engage in CSR practices as an important
way of resolving genuine conflicts with stakeholders (Jo & Harjoto, 2011, 2012). In this case, CSR can
have a positive effect on CFP due to the reduction of conflicts of interests with the various stakeholders
through effective or good CG. By contrast, in poorly-governed firms (i.e., firms depicting high levels of
corruption, fraud, and managerial entrenchment), negative/poor CSR practices are more likely to be
adopted, which can exacerbate conflicts among the various stakeholders (Harjoto & Jo, 2011). This may
be evident in the form of rampant labour strikes, consumer boycotts, and increased government
intervention. Thus, CSR can have a negative effect on CFP through increased conflict of interests,
resulting from ineffective or poor CG.
Second, good governance arising from corporate board structures, such as the presence of
independent directors, board size, and board diversity can have a positive effect on CSR, and
consequently CFP (Haniffa & Cooke, 2005; Jia et al., 2009). For example, strong managerial monitoring
associated with the presence of independent directors can motivate managers to engage in sustainable
CSR practices with potential favourable implications for CFP. Cumming et al. (2010), for instance, report
that the returns of private equity funds are significantly higher in countries with higher levels of
corruption. This suggests that even in corrupt countries, good governance can help activists fund

17
managers to mitigate the economic costs of corruption by enhancing efficiency in investee firms. Third,
ownership structures (i.e., by block, government, and institutions) can mitigate or exacerbate agency
problems (Eng & Mak, 2003; Barnea & Rubin, 2010; Hou & Moore, 2010). For instance, Hou and Moore
(2010) show that increased monitoring associated with low government ownership in Chinese non-state
owned enterprises impacts negatively on the incidence of corruption and fraud. Similarly, good
governance in the form of greater activism by institutional shareholders can impact positively on CSR and
CFP (Jo & Harjoto, 2011, 2012). A major problem, however, is that existing studies have predominantly
investigated direct links between CSR and CFP without taking into consideration the potential interacting
role of CG on the CSR-CFP link. Consequently, we seek to extend the literature by uniquely examining
whether CG positively moderates the association between CFP and CSR, and therefore, our final
hypothesis is that:
Hypothesis 8: The higher (lower) the CG quality, the more (less) positive is the relationship between CSR and CFP. RESEARCH CONTEXT AND DESIGN
CG and CSR Policy Reforms and the South African Research Context
Empirical studies of organisational behaviour informed by neo-institutional theory generally require a
contextual grounding to situate the specific impact of cultural, economic, political, and social factors on
the selected corporate practices (i.e., CG and CSR). In this respect, the current study focuses on reforms
pursued in South Africa and the choice of the context is underpinned by a number of reasons. Major
corporate collapses, especially in the developed economies, such as UK and US in the 1990s/2000s
highlighted the importance of good CG, corporate accountability, social responsibility, transparency and
disclosure practices (King Committee, 1994, 2002; Mallin, 2002; Judge, 2012). Gradually, and largely
through global and/or national institutional impositions, CG codes and policy reforms have been
disseminated to a large number of countries (Aguilera & Jackson, 2003; Aguilera & Cuervo-Cazurra,
2009; Cicon et al., 2012). Our general contention is that South Africa has been at the forefront of leading
(‘cutting-edge’) CG/CSR reforms, with particular focus on addressing the governance challenges of
corporations operating in developing countries (Mallin, 2006, 2007).2 Arguably, the pioneering nature of

18
the South Africa reforms implies that significant insights from the current study may be learnt by
academics, regulators, managers, and policy-makers; especially those from emerging or transitional
economies in Africa, America, Asia, Europe, and the Middle East, experiencing similar cultural,
economic, political, and social challenges.
More specifically, due to the need to address socio-economic problems, such as widespread
poverty, high crime rate, and the legacy of inequality emanating from a long history of apartheid, CG
reforms carried out in South Africa since the beginning of the 1990s have placed special emphasis on
improving CG practices broadly for both shareholders and stakeholders (Ntim et al., 2012b). In contrast,
CG reforms that have been pursued in most Anglo-American countries have primarily focused narrowly
on enhancing shareholder-related protections (Cicon et al., 2012; Ntim et al., 2012a) and the emergence
of a stakeholder-oriented model of CG practice only arose about a decade after the South African
experience (e.g., the first OECD model was published in 1999, whilst the Global Reporting Initiative’s
popular triple bottom line reporting framework was first issued in 2000). Hence, this created a natural and
distinct setting, whereby the links among CSR, CG and CFP can be explored. Furthermore, with respect
to reforms pursued in South Africa, the 1994 Report (King I) adopted the ‘integrated’ CG approach
(Mallin, 2006; Ntim et al., 2012a, b). The ‘integrated’ CG approach encourages corporations to go beyond
the usual narrow financial aspects of CG and take into consideration a number of broader stakeholder
(CSR) concerns, such as those regarding the environment, health, safety, and affirmative action (King
Committee, 2002; Mallin, 2007; Ntim & Soobaroyen, 2013).
This trend persisted in the later report (King II)3, which further distinguished the South African
CG model from other Anglo-American ones by formally adopting the ‘inclusive” CG approach (Ntim et
al., 2012a, b; Soobaroyen & Ntim, 2013). The “inclusive” CG approach builds on and expands the Anglo-
American (‘shareholding’) features of King I, as well as encourages corporations to comply with a broad
range of affirmative action and stakeholder (‘stakeholding – CSR’) issues meant to address the resulting
historical socio-economic inequalities between white and non-white South Africans. These include

19
provisions on black economic empowerment (BEE)4, environment, ethics, health and safety, HIV/Aids,
and social investments (see Appendix; King Committee, 2002; Ntim & Soobaroyen, 2013).
In addition, corporate ownership in South Africa has been and remains highly concentrated,
reflecting the traditional inter-relations and inter-dependencies between a small/white-dominated business
elite and more contemporarily, the opening up of corporate ownership to government-backed entities or
individuals (Ntim et al., 2012a). This concentration is apparent from the existence of complex cross
shareholdings and tall pyramid-shaped ownership structures by a small number of very large corporations
(King Committee, 2002; Ntim & Soobaroyen, 2013).5 In particular, through the Public Investment
Commission, the South African government maintains strategic, but low ownership stakes in a number of
large corporations with keen interests in CG and CSR practices (Ntim et al., 2012a, b; Soobaroyen &
Ntim, 2013). Apart from the concentrated and government ownership features, shareholder activism is
observably weak along with a noticeable poor record of implementing and enforcing corporate
regulations (King Committee, 2002; Ntim & Soobaroyen, 2013). These contextual developments appear
to have substantially impaired the effectiveness of the market for corporate and managerial control in
South Africa (Henry, 2008). Consequently, managerial entrenchment and expropriation of minority
wealth is widespread (Ntim et al., 2012a, b), with potentially adverse implications for CFP and CSR.
Thus, in summary, although South Africa has arguably pursued a combination of CG and CSR
reforms compared with other Anglo-American countries, critical concerns have been raised as to whether
a voluntary compliance regime like King II, can effectively improve CG and CSR standards. Therefore,
we seek to investigate the relationship between CG and CSR practices, and consequently, examine
whether CG has any influence on the link between CFP and CSR.
Data Sources and Sample Selection We focus on an initial sample of 291 non-financial firms listed on the Johannesburg Stock Exchange over
the 2002-2009 period from 5 main industries: basic materials; consumer goods; consumer services;
industrials; and technology/telecoms. Since financials/utilities are subject to different regulatory oversight
and capital structure restrictions that can impact differently on CG, CFP and CSR, companies in these

20
industries are not included in the sample, as is the case in previous studies (Henry, 2008; Reverte, 2009).
To be included in our final sample, a firm’s CFP, CG and CSR data must be available for each of the 8
years. The criterion was set for a number of reasons. First, in line with previous studies (Scholtens, 2008;
Oh et al., 2011), it ensured that the conditions for a balanced panel analysis would be met. Some of the
advantages for using panel data include having both time-series and cross-sectional observations, and less
multicollinearity among the variables (Gujarati, 2003; Wooldridge, 2010). Second, examination of eight-
year data with both cross-sectional and time series properties may be useful in detecting whether the
observed cross-sectional links among CFP, CG and CSR holds over time. Third, as King II became
operational in 2002 and ended in 2009, our sample period covers this period.
Twenty-eight and 94 firms, had no and incomplete data, respectively, leaving us with a total of
169 firms. However, given the extensiveness of the CG and CSR data, coupled with the labour-intensive
nature of manual data collection, an additional sample limitation exercise became necessary. As past
evidence indicates that company size and industry affect CG and CSR practices (Collett & Hrasky, 2005;
Campbell et al., 2003, 2006), we selected the largest 15 corporations from each of the five industries
based on their market capitalisation in order to control for size and industry. Thus, our final sample
consisted of 75 corporations over eight firm-years, giving a total of 600 firm-year observations from five
main industries for our regression analyses. The CG and CSR variables were extracted from both the
sampled companies’ annual (600) and sustainability (62) reports collected from the Perfect Information
Database, while the financial variables were obtained from DataStream.
A potential limitation of our sample selection criteria is that it may introduce survivorship bias
into the sample selection process. However, the criteria generated a reasonable number of observations
and therefore, generalisability of the findings of our study should arguably not be affected by our sample
selection criteria. To be certain, however, we further explored this potential problem by following
Graham and Harvey (2001) and Beiner et al. (2006) and compare the characteristics of our final 75
sampled firms to those of the 263 out of the initial 291 with at least one year’s financial data available
rather than the complete eight years. Specifically, we test for equality in means and medians of all our

21
financial variables, including Capital expenditure, Firm size, Leverage, Return on assets, Sales growth,
Tobin’s Q, and Total share returns, between our final balanced sample of 75 and the unbalanced sample
of 263. If the two groups depict similar characteristics, then we can conclude that our final sample is
representative of the underlying population. The results (which for brevity are not reported, but available
upon request) indicate that there are no statistically significant differences in the mean or median values
for all the variables. We interpret this observation as indicating that the characteristics of our final 75
sample are largely similar to the underlying population and that our findings are not likely to be seriously
impaired by survivorship bias.
Measures and Variables
We classify our variables into six main types and Table 1 contains full definitions of all of them. First,
and to test Hypotheses 1 to 7, our main dependent variables are the summary CSR practice scores based
on the CSR word count (CSR index), which seeks to measure6 the quantity (quality) of CSR disclosures in
six broad areas as set out by King II, consisting of both South African context-specific [(i) (BEE word
count or sub-index); and (ii) HIV/Aids (HIV word count or sub-index)] and general/conventional [(iii)
environment (Environment word count or sub-index); (iv) ethics (Ethics word count or sub-index); (v)
health and safety (Health and safety word count or sub-index); and (vi) social investment (Social
investment word count or sub-index)] CSR. This constitutes one of the most extensive CSR data to be
used to-date and we used the content analysis method of codifying written texts into various categories to
collect all our CSR data (Hackston & Milne, 1996; Unerman, 2000).
Insert Table 1 about here
Second, and to test Hypothesis 1, our main independent variable is a binary CG disclosure index,
containing 41 CG provisions based on King II covering four broad sections: (i) boards, directors and
ownership; (ii) accounting and auditing; (iii) risk management, internal audit and control; and (iv)
compliance and enforcement. For brevity, the detailed discussions of the 41 CG provisions are presented
in the Appendix of Ntim et al. (2012a). Third, and to test Hypotheses 2 to 7, we collect data on ownership,
including Block ownership, Government ownership, and Institutional ownership, and on board

22
characteristics, including Board size, Independent directors, and Board diversity on the basis of ethnicity
and gender. Fourth, and to test for the moderating effect of CG on the CSR-CFP link (Hypothesis 8), we
create an interaction variable between our CG index and CSR disclosures. Also, and in testing Hypothesis
8, we employ Tobin’s Q as our main measure for CFP, but as a sensitivity check, we use Total share
returns and Return on assets as alternative market and accounting-based CFP measures, respectively.
Finally, and to control for potential omitted variables bias (Gujarati, 2003; Wooldridge, 2010), we include
an extensive number of control variables. These include Audit firm size, Capital expenditure, Cross-
listing, The presence of a CG committee, The presence of a CSR committee, Leverage, Firm size, Risk,
Sales growth, Industry dummies, and Year dummies. For brevity, we do not develop direct theoretical
links between these control variables and CSR or CFP, but there is extensive theoretical and empirical
literature that suggests they can potentially affect either CSR or CFP (McGuire et al., 1988; Beiner et al.,
2006; Henry, 2008; Reverte, 2009; Ntim et al., 2012a; Fifka, 2013).
We present the empirical analyses, including the descriptive statistics, bivariate and multivariate
regression analyses, and robustness analyses in the following sections.
EMPIRICAL ANALYSES
Summary Descriptive Statistics and Bivariate Regression Analyses
Table 2 contains summary descriptive statistics of the variables. For brevity, we do not conduct detailed
discussions, but it generally suggests that both our quantity (CSR word count) and quality (CSR index)
CSR measures display wide variations. For example, CSR word count (CSR index) ranges from a
minimum of 186 (6.19%) to a maximum of 23,371 (77.32%) with an average of 4,081 (56.42%) words.
This suggests that there is a great degree of heterogeneity in terms of the importance that South African
corporations attach to CSR disclosures. The six sub CSR disclosure variables, namely BEE word count
(BEE sub-index), Environment word count (Environment sub-index), Ethics word count (Ethics sub-
index), HIV word count (HIV sub-index), Health and safety word count (Health and safety sub-index),
and Social investment word count (Social investment sub-index) depict similar wide variations.
Observably, and consistent with its six broad dimensions, BEE word count has the largest number of

23
word count disclosures, ranging from a minimum (maximum) of 50 (8,347) with a mean of 1,334 words.
By contrast, Ethics word count has the least level of disclosures, ranging from a minimum (maximum) of
10 (222) with a median of 150 words.
The CG (CG index, Board diversity, Board size, Block ownership, Government ownership,
Independent directors, and Institutional ownership), CFP (Tobin’s Q, Total share return, and Return on
assets), and control (Audit firm size, Capital expenditure, The presence of a CG committee, Cross-listing,
The presence of a CSR committee, Leverage, Firm size, Risk, and Sales growth) all display similar wide
spreads. For instance, the CG index ranges from a minimum of 4.88% to a maximum of 100% with the
median corporation complying with 73.17% of the 41 CG provisions, whereas the average Board size is
11 with a minimum (maximum) of 4 (21) directors. This seems to suggest that the sampled corporations
have been adequately selected, and thus minimises the possibilities of sample selection bias that have
arguably characterised most past studies.
Further, and to inform our analyses, we split our sample into two sub-samples – firms with high
(i.e., firms with CSR index score above the overall mean/median mark) and low (i.e., firms with CSR
score below the overall mean/median mark) CSR scores. Columns 8 and 9 of Table 2 contain the results
of the test (t-test) of comparison of differences in means and medians for our main independent variables.
The results generally show that there are significant differences in means and medians between the two
sub-samples. For example, the mean between the two groups is significantly different as follows: CG
index (8.75, p<0.001); Board diversity (6.48, p<0.001); Board size (1.85, p<0.100); Block ownership (-
4.76, p<0.001); Government ownership (2.39, p<0.010); Independent directors (2.30, p<0.050); and
Institutional ownership (-4.96, p<0.001). Briefly, the results imply that firms with better CG scores, more
diverse boards, larger boards, high government ownership, and more independent directors show greater
commitment to CSR practices. By contrast, firms with high block ownership and institutional ownership
engage in low CSR disclosures. With the exception of Institutional ownership, all the results (which will
be discussed in detail in the next subsection) are consistent with our hypotheses. The results of differences

24
in medians presented in Column 9 of Table 2 for the two sub-samples are largely similar to those reported
for the means.
Insert Table 2 about here
Table 3 reports the correlation matrix for the variables to test for multicollinearity. For robust
findings, we present both the Pearson’s parametric and Spearman’s non-parametric coefficients and,
noticeably, the magnitude and direction of both coefficients are largely similar, and this indicates the
absence of any serious non-normality problems. Observably, the correlations among the variables are also
fairly low and thus, suggest that no major multicollinearities are present. Additionally, we calculate
variance inflation factors for these variables, with their values (see Column 7 of Table 2), ranging from
1.06 to 3.97. This provides further support for the correlation analysis that our regression models do not
suffer from any serious multicollinearities. Of interest and as hypothesised (i.e., focusing on Pearson’s
parametric correlation coefficients only), the CG index (0.480, p<0.001), Board diversity (0.118,
p<0.010), Board size (0.122, p<0.001), Government ownership (0.165, p<0.001), and Independent
directors (0.187, p<0.001) are positively associated with the CSR index, whilst Block ownership (-0.130,
p<0.010) is negatively related to the CSR index. The negative link between Institutional ownership (-
0.162, p<0.001) and CSR index is again inconsistent with our hypothesis. Additionally, there are
significant links among the CSR, CG, CFP and the control variables. For instance, Audit firm size (0.336,
p<0.001), The presence of a CG committee (0.384, p<0.001), Cross-listing (0.469, p<0.001), The
presence of a CSR committee (0.391, p<0.001), and Firm size (0.212, p<0.001) are positively connected
to the CSR index, whereas Capital expenditure (-0.010, p>0.100) and Leverage (-0.038, p>0.100) are
negative, but insignificantly related to the CSR index.
Insert Table 3 about here
Multivariate Regression Analyses
Corporations usually vary in terms of the difficulties and prospects that they face over time (Larcker &
Rusticus, 2010). This can lead to a scenario whereby CSR and CG practices are jointly and dynamically
influenced by unobserved firm-specific hetereogeneities, such as executive talent, corporate culture, and

25
complexity (Henry, 2008; Guest, 2009), which simple OLS regressions may fail to identify (Gujarati,
2003; Wooldridge, 2010). Hence, given the panel nature of our data and following past studies (Henry,
2008; Guest, 2009; Ntim et al., 2012a), we conduct our analyses by using panel data regression
techniques so as to control for potential endogeneities that may emerge from unobserved company-
specific heterogeneities. Therefore, we start our analyses with a basic fixed-effects regression model
specified as follows:
n
iitiitiitit CONTROLSCGICSRD
110 (1)
where the CSRD is either our quality (CSR index) or quantity (CSR word count) proxy for CSR
disclosures, CGI is the CG disclosure index and CONTROLS refers to the control variables, including
Audit firm size, Capital expenditure, The presence of a CG committee, Cross-listing, The presence of a
CSR committee, Leverage, Firm size, Risk, Sales growth, Independent directors, Industry dummies, and
Year dummies, with γ referring to the company-specific fixed-effects, consisting of a vector of the mean-
differences of all time variant variables.7
Table 4 contains fixed-effects regression results of the effects of CG on CSR based on our quality
CSR measure (CSR index). First, we investigate whether our CG index influences the CSR index. The
coefficient of the CSR index on the CG index in Model 1 of Table 4 is positive (0.203, t = 3.968,
p<0.001), thereby providing support for Hypothesis 1. The policy implication is that, on average, better-
governed corporations are more likely to pursue a more socially responsible agenda. The economic
significance of this evidence is that a one-standard deviation change (i.e., increase) in the CG index can be
expected to be associated with about a 3.3% (16.30 x 0.203) change (i.e., increase) in the CSR index.
Theoretically, the evidence appears to be consistent with the predictions of our generalised neo-
institutional framework, which places special emphasis on legtimation and efficiency motives for
corporate engagement in CSR activities. For example, compliance with good CG rules (due to
coercive/regulative institutional pressures) in the form of increased CSR practices can enhance the
legitimacy of corporate structures and operations by improving corporate reputation (Scott, 1987;

26
Suchman, 1995). Similarly, and even in the absence of regulative institutional forces, better-governed
corporations may voluntarily mimic and/or adopt good CSR practices in order to improve efficiency and
CFP by obtaining access to critical resources, such as finance, contracts, and skilled labour by gaining the
approval of influential stakeholders (Pfeffer & Salancik, 1978; Freeman, 1984). Empirically, the evidence
provides support for both the recommendations of King II and the similar results of the few past studies
(Jamali et al., 2008; Arora & Dharwadkar, 2011; Harjoto & Jo, 2011; Jo & Harjoto, 2011, 2012).
Insert Table 4 about here
Second, and to ascertain whether the ownership and board characteristics affect CSR, we re-estimate
equation (1) by replacing the CG index with the six alternative CG mechanisms. Generally, we find in
Model 2 of Table 4 that all our six alternative CG mechanisms are predictive of CSR practices.
Specifically, Government ownership is positively associated with the CSR index (0.183, t = 3.859,
p<0.001), strongly providing empirical support for Hypothesis 2. Economically, our evidence is
significant because it suggests that a one-standard deviation increase (decrease) in Government ownership
will be associated with about a 1.8% (9.65 x 0.183) increase (decrease) in the CSR index. Theoretically,
and at the societal level, governments can pass laws to regulate (i.e., the coercive power of the State) the
behaviour of the lower members of society. Therefore, demonstrating greater commitment to CSR can
win the support of government as an influential stakeholder, which may not only help in legitimising
corporate operations (Aguilera et al., 2007), but also in enhancing efficiency by facilitating access to extra
resources, such as subsidies/tax holidays (Pfeffer & Salancik, 1978). Further, and even without the
regulative power of the State, neo-institutional theory indicates that voluntarily adopting and/or
mimicking good CSR practices can enhance efficiency and CFP by reducing agency problems between
managers and government (as a powerful shareholder). Empirically, the positive Government ownership-
CSR index link contradicts the evidence of negative effect by Dam and Scholtens (2012), but provides
support for similar findings by Eng and Mak (2003), Tagesson et al. (2009), and Khan et al. (2012).
Block ownership exerts a strong negative pressure on the CSR index (-0.170, t = 3.783, p<0.001);
thus Hypothesis 3 is empirically supported. The economic implication of this evidence is that a one-

27
standard deviation increase (decrease) in Block ownership will be associated with about a 3.7% (21.50 x
0.170) decrease (increase) in the CSR index. Theoretically, the need for public accountability and
legitimacy is less of a concern in firms with concentrated ownership structures because of limited outsider
interests. Therefore, firms with concentrated ownership have greater capacity to avoid regulative,
cognitive and normative institutional demands to adopt new CSR practices than their counterparts with
disperse ownership structure. Also, block ownership is associated with greater managerial monitoring,
which can minimise agency costs, and hence, less demand for CSR disclosures from powerful
stakeholders. As such, it seems economically efficient for managers of closely held firms to invest less in
CSR activities because the costs of investing in such activities may be higher than their benefits (Khan et
al., 2012). Empirically, our evidence is in line with the results of past studies that suggest that ownership
concentration leads to less CSR disclosures (Brammer & Pavelin, 2008; Reverte, 2009; Jo & Harjoto,
2011, 2012).
Institutional ownership shows a weak negative association with the CSR index (-0.115, t = 1.920,
p<0.100), and therefore Hypothesis 4 is rejected. Empirically, the negative link between the CSR index
and Institutional ownership supports the findings of Barnea and Rubin (2010), but is inconsistent with
past evidence as to the absence of a relationship (Dam & Scholtens, 2012) or a positive one (Aguilera et
al., 2006; Harjoto & Jo, 2011; Jo & Harjoto, 2011, 2012; Oh et al., 2011). These results might be
explained by the peculiarities of institutional ownership in South Africa. Given the pervasiveness of
pyramidal structures/cross-shareholdings within the South African corporate context (Ntim et al., 2012b),
this finding appears to indicate that institutional shareholders are more likely to be block-owners, who can
directly monitor managers instead of relying on CSR disclosures. The significant positive connection
between Block ownership and Institutional ownership in Table 3 seems to support this interpretation.
Theoretically, the negative effect of Institutional ownership on the CSR index also means that our neo-
institutional theoretical prediction that due to their substantial ownership stakes, large institutional
shareholders can be expected to put coercive, cognitive and normative pressures on corporate executives
to engage in increased CSR disclosures, which can legitimise corporate operations and enhance efficiency,

28
may not be applicable within corporate contexts, such as South Africa, where institutional shareholders
are also more likely to be block-owners.
With respect to our board variables, Board size is discernibly positive, but weakly associated with
the CSR index (0.108, t = 1.908, p<0.100), and thereby providing empirical support for Hypothesis 5. The
positive effect of Board size on the CSR index provides support for similar findings by Mackenzie (2007),
but contradicts the results of Lindgreen et al. (2010). The evidence is also consistent with predictions of
our overarching neo-institutional theoretical framework. From a legitimation view, larger boards are
associated with greater diversity in terms of stakeholder representation, which can enhance corporate
reputation and image. The presence of diverse stakeholders on larger boards can, therefore, lead to greater
demand for different CSR activities. Additionally, larger boards are associated with higher managerial
monitoring, which can improve efficiency and CFP for shareholders by ensuring conformance to
corporate regulations and norms, including international CSR practices.
Observably, Independent directors is positively related to the CSR index (0.126, t = 2.046,
p<0.050); thus Hypothesis 6 is empirically supported. Economically, our evidence implies that a one-
standard deviation increase (decrease) in the percentage of Independent directors will be associated with
about a 2.2% (17.85 x 0.126) increase (decrease) in the CSR index. Theoretically, the appointment of
independent directors constitutes a way of enhancing legitimacy by serving as a sign of congruence
between corporate practices and societal expectations. Similarly, the presence of independent directors
can help to improve efficiency and CFP for shareholders by reducing agency problems between
executives and owners, as well as advance the interests of other stakeholders. Thus, independent directors
may be more motivated to put pressure on managers to engage in good CSR practices. Empirically, our
evidence provides support for the findings of past studies that suggest that the presence of independent
directors impacts positively on CSR practices (Hillman et al., 2001; Haniffa & Cooke, 2005; Lattermann
et al., 2009; Harjoto & Jo, 2011; Jo & Harjoto, 2011, 2012; Michelon & Parbonetti, 2012).
Finally, Board diversity displays a strong positive relationship with the CSR index (0.156, t =
3.539, p<0.001); thus implying that Hypothesis 6 is supported by our data. Our finding means that a one-
29
standard deviation increase (decrease) in Board diversity will be associated with about a 2.7% (17.35 x
1.56) increase (decrease) in the CSR index – implying that our evidence is economically significant.
Empirically, our finding is consistent with that of Haniffa and Cooke (2005), and Barako and Brown
(2008) who report that diverse boards make more CSR disclosures. The evidence is also in line with our
theoretical framework, which suggests that boards of diverse gender and ethnic backgrounds can help
improve efficiency by connecting a firm to its external environment and attracting resources, as well as
enhancing corporate legitimacy. Similarly, boards of diverse ethnic and gender origins can increase board
independence and decision-making, which can improve efficiency by enhancing managerial monitoring
and performance. Additionally, we include the CG index together with the six alternative CG mechanisms
in Model 3 of Table 4, but the central tenor of our findings for all six hypotheses remains largely
unchanged. In sum, all our CG variables are able to predict a firm’s CSR practices, with the findings
providing empirical support for an overarching neo-institutional framework that puts greater emphasis on
legitimation and efficiency motives to explain corporate engagement in CSR activities – whether such a
commitment is driven by coercive/regulative, cognitive/mimetic and normative pressures.
Third, our findings suggest that differences in the CSR index can largely be explained by the CG
mechanisms, but since it consists of CSR disclosures from six different themes, it is possible for the effect
of CG on each category to differ, with some potentially having strong connections with the CG variables
and others having weak associations. Thus, to examine the association between each CSR theme and the
CG variables, we again re-estimate equation (1) by replacing the CSR index with the BEE sub-index,
Environment sub-index, Ethics sub-index, HIV sub-index, Health and safety sub-index, or Social
investment sub-index at a time, and the findings are, respectively, presented in Models 4 to 9 of Table 4.
With limited exceptions (such as the insignificant CG index-Health and safety sub-index, Board size-
Ethics sub-index, Board diversity-Environment sub-index, Block ownership-Ethics sub-index, Block
ownership-Health and safety sub-index, Government ownership-Ethics sub-index, and Institutional
ownership-Ethics sub-index links), the findings are largely consistent with our previous evidence that
corporations with good governance, high government ownership, larger boards, diverse boards, and

30
independent boards are more predisposed to be socially responsible than those with high block
shareholding, and high institutional shareholding. The apparent sensitivity of our findings presented in
Table 4 also suggests that the CG-CSR nexus may vary depending on the type of CSR practices. For
example, the link between BEE sub-index and the CG mechanisms is generally strong, whilst the Ethics
sub-index-CG nexus is relatively weak.
Additionally, the coefficients on the control variables in Models 1 to 9 of Table 4 generally show
the predicted signs. For instance, Audit firm size, The presence of a CG committee, Cross-listing, The
presence of a CSR committee, and Firm size are positively associated with the CSR index, as well as with
all its six sub-categories, as expected. Consistent with the results of prior studies (Gray et al., 1995a;
Hackston & Milne, 1996; Branco & Rodrigues, 2008; Young & Marais, 2012), CSR disclosure
significantly varies across different industries and years (for brevity, we do not report these in Table 4,
but available on request). Noticeably, our results suggest that CSR disclosure is significantly less in 2002
and in the technology industry, but significantly more in 2009 and in the basic materials industry (highest
significant coefficient) compared with the other years and industries, respectively.
Finally, and to investigate whether CSR influences CFP, we estimate a basic fixed-effects
regression model specified as follows:
n
iitiitiitit CONTROLSCSRDCFP
110 (2)
whereby CFP refers to our financial performance proxies (Tobin’s Q, Return on assets, and Total share
return), and CSRD is either our quality (CSR index) or quantity (CSR word count) proxy for CSR
disclosures, whilst the rest remain the same as defined in equation (1).
Table 5 reports fixed-effects regression results of the effects of CSR on CFP. Since existing
studies have predominantly simply regressed CSR on CFP, we begin our analysis by similarly regressing
the CSR index with the control variables on Tobin’s Q. Positive, but insignificant coefficient on the CSR
index (0.033, t = 1.360, p>0.100) is discernible in Model 1 of Table 5. To ascertain whether this evidence
may be due to the use of the quality CSR measure, we replace the CSR index with its quantity alternative
(CSR word count) in equation (2). Noticeably, the result in Model 2 of Table 5 depicts a positive

31
coefficient on the CSR word count (0.028, t = 1.325, p>0.100), but equally insignificant and thereby
providing support for the findings of a large number of studies that suggest that there is a positive, but
weak direct link between CFP and CSR (McGuire et al., 1988; Orlitzky et al., 2003; Bird et al., 2007; Lo
& Sheu, 2007; Cai et al., 2012).
Whilst our evidence is largely consistent with the findings of prior studies that similarly include
extensive number of controls, such as risk (McWilliams & Siegel, 2000; Nelling & Webb, 2009), we
contend that the CFP-CSR connection can possibly be enhanced by CG. Our conjecture is based on the
extensive evidence, which suggests that CG influences CFP (Gompers et al., 2003; Renders et al., 2010,
Bozec & Bozec, 2012), as well as emerging theoretical and empirical evidence (Jamali et al., 2008; Stark,
2009; Arora & Dharwadkar, 2011; Ntim et al., 2012a), which indicates that the positive effect of CG on
CFP is stronger than that of CSR. Therefore, to ascertain whether CG positively moderates the CFP-CSR
link, we re-estimate equation (2) by including the CSR*CG index, which is a variable created by
interacting the CSR index (CSR word count) and CG index. We also include the CG index on its own to
control for potential upward bias (over-estimating) in the coefficients. Observably, the respective
coefficient of Tobin’s Q on the CSR index (0.136, t = 3.420, p<0.001) and CSR word count (0.122, t =
2.960, p<0.050) in Models 3 and 4 of Table 5 is positive, and thereby providing new evidence, which
supports Hypothesis 8 that the CFP-CSR connection is significantly and positively enhanced by CG. The
economic significance of our evidence is that a one-standard deviation increase (decrease) in the CSR
index, for example, will be associated with about a 2.2% (16.19 x 0.136) increase (decrease) in the
Tobin’s Q. Theoretically, our evidence is consistent with the predictions of our overarching neo-
institutional framework that places special emphasis on the efficiency and legitimation effects of CSR
engagement. Our evidence implies that in better-governed firms (i.e., firms depicting high levels of
accountability, responsibility, and transparency), managers are more likely to undertake positive CSR
practices that can help legitimise corporate operations by ensuring congruence with stewardship interests
and higher-order values (i.e., moral imperative) (Aguilera et al., 2007). From an efficiency perspective,
our evidence implies better-governed firms have greater propensity to engage in good CSR practices,
32
which can enhance corporate efficiency, and meet instrumental and relational imperatives. Thus, good CG
can act as a positive catalyst on the CFP-CSR nexus by helping to reduce conflict of interests among the
various stakeholders (Harjoto & Jo, 2011; Jo & Harjoto, 2011, 2012).
Further, to ascertain whether the board and ownership characteristics can positively heighten the
CFP-CSR nexus, we include interaction variables for the six alternative CG variables using both the
quality (CSR index) and quantity (CSR word count) CSR proxies in Models 5 and 6 of Table 5,
respectively, with the coefficient on the CSR index (0.138, t = 3.459, p<0.001) and CSR word count
(0.133, t = 3.442, p<0.001) remaining positive. The positive coefficient on CSR*Government ownership
(Model 5: 0.186, t = 3.863, p<0.001)(Model 6: 0.172, t = 3.789, p<0.001), CSR*Board diversity (Model 5:
0.182, t = 3.865, p<0.001)(Model 6: 0.178, t = 3.795, p<0.001) and CSR*Independent directors (Model 5:
0.121, t = 3.527, p<0.001)(Model 6: 0.113, t = 2.784, p<0.050) also provides new evidence, which
suggests that the CFP-CSR nexus is further significantly and positively strengthened by the presence of
government ownership, diverse boards, and independent boards. To check whether the ability of the CG
index to positively intensify the CFP-CSR nexus will be affected by the presence of the alternative CG
structures, we include interaction variables for the six alternative CG variables, as well as all seven CG
mechanisms in Models 7 to 9 of Table 5, with the results remaining qualitatively the same as those
reported in Models 3 and 4 of Table 5.
Insert Table 5 about here
Additional Analyses
We conduct a number of additional analyses to ascertain the robustness of our evidence. First, as a
robustness check, we replicate our results in Table 4 by replacing our quality CSR measure (CSR index)
with its quantity alternative (CSR word count), and the results are reported in Table 6. Apart from a few
sensitivities (such as the insignificant CG index-Ethics word count, Block ownership-Ethics word count,
and Block ownership-Health and safety word count links), the results in Models 1 to 9 of Table 6 are
essentially similar to those reported in Table 4, implying that our evidence is fairly robust to the use of a
quantitative (word counts) or qualitative (disclosure indices) measure of CSR practices.
33
Insert Table 6 about here
Second, several studies suggest that the effect of some CG mechanisms, such as Block ownership, Board
size, and Institutional ownership on CFP is non-linear (McConnell & Servaes, 1990; Chen et al., 2008).
For example, Block ownership, Board size, and Institutional ownership have been found to be non-
monotonically related to CFP by Morck et al. (1988), Andre (2008), and Coles et al. (2008), respectively.
To ascertain the presence of non-linear links among these three CG structures, CFP, and CSR, we re-
estimate equations 1 and 2 by including squared transformations of Block ownership, Board size, and
Institutional ownership. Models 1 and 2 of Table 7 contain the findings for the CG-CSR nexus and CFP-
CSR link, respectively. Observably, the coefficients on Block ownership2 (Model 1: -0.023, t = 0.345,
p>0.100)(Model 2: -0.013, t = 0.320, p>0.100), Board size2 (Model 1: 0.032, t = 0.526, p>0.100)(Model
2: 0.036, t = 0.552, p>0.100)and Institutional ownership2 (Model 1: -0.034, t = 0.545, p<0.100)(Model 2:
-0.029, t = 0.353, p>0.100) in Models 1 and 2 of Table 7 are insignificant, with the rest of the results
remaining largely the same as our previous findings contained in Tables 4 and 5, respectively. Thus, our
evidence does not provide support for the existence of curvilinear (including other transformation, such as
cubic) links among CFP, CG, and CSR.
Insert Table 7 about here
Third, a number of studies suggest that investments in advertising, and research & development (R&D)
impact positively on CFP (McWilliams & Siegel, 2000; Jo & Harjoto, 2011, 2012). Thus, failing to
control for advertising and R&D expenditure could result in misspecified equation with the coefficient on
the CSR index being biased upwards. To account for such potential equation misspecification, we include
Advertising expenditure and R&D expenditure, as additional control variables in Model 3 of Table 7. The
coefficient on Advertising expenditure is positive (0.165, t = 3.647, p<0.001), whilst the coefficient on
R&D expenditure is negative (-0.048, t = 0.780, p>0.100), but insignificant. The coefficient on the CSR
index remains positive (0.135, = 3.463, p<0.001), but slightly sensitive – decreasing from 0.140 in Model
7 of Table 5 to 0.135 in Model 3 of Table 7.

34
Fourth, following Larcker and Rusticus (2010), we additionally address potential endogeneities
by estimating: a lagged CSR-CFP structure and two-stage least squares (2SLS). To address simultaneity
problems that may arise due to the presence of a lagged CSR-CFP connection, we follow past research
(McGuire et al., 1988) to re-estimate equation (2) as a lagged structure specified as:
n
iitiitiitit CONTROLSCSRDCFP
111110 (3)
where everything remains the same as defined in equation (2) except that we include a one year lag
between CFP and CSR in which current year’s CFP depends on previous year’s CSR. The positive
coefficient of Tobin’s Q on the CSR index (0.130, t = 3.406, p<0.001) is noticeable in Model 4 of Table 7,
with the results being generally similar to those presented in Models 3 to 9 of Table 5. This suggests that
our evidence is largely robust to estimating a lagged CFP-CSR structure.8
To account for potential endogeneities that may be caused by omitted variable bias, we rely on
the widely used two-stage least squares (2SLS) methodology (Beiner et al., 2006; Henry, 2008). However,
to ensure that the 2SLS methodology is ideal, and following Beiner et al. (2006), we first implement
Durbin-Wu-Hausman exogeneity test (Beiner et al., 2006: 267) to test for the existence of an endogenous
connection between Tobin’s Q and the CSR index. Applied to equation (2), the test rejects the null
hypothesis of no endogeneity, and hence, we conclude that the 2SLS methodology may be appropriate and
that our fixed-effects results may be misleading. This implies that we need to replace the CSR index with
an instrument, which is highly correlated with the CSR index (relevant), but lowly or uncorrelated with
the regression structural errors (valid). Obtaining a ‘relevant’ and ‘valid’ instrument is generally difficult
(Gujarati, 2003; Wooldridge, 2010). As a result, we follow the widely used two-stage procedure (Beiner
et al., 2006; Larcker & Rusticus, 2010; Jo & Harjoto, 2011, 2012). In the first stage, based on extensive
theoretical and empirical literature (Gray et al., 1995; Adams, 2002; Deegan, 2002; Fifka, 2013), we
conjecture that the CSR index will be influenced by all our CG and control variables, including
Advertising expenditure and R&D expenditure. In the second stage, we employ the predicted part of the
CSR index (Predicted CSR index) as an instrument9 for the CSR index and re-run equation (2) as follows:

35
n
iitiitiitit CONTROLSCSRDCFP
110
ˆ (4)
where everything remains unchanged as specified in equation (2) except that we use the predicted CSR
index (Predicted CSR index) from the first-stage estimation as an instrument for the CSR index. The
coefficients on the Predicted CSR index (0.175, t = 3.790, p<0.001) and CSR*CG index (0.190, t = 3.863,
p<0.001) in Model 6 of Table 7 are positive, and thereby implying that our evidence of a positive impact
of the CSR index on Q is significantly heightened by CG is robust to potential endogeneities that may
arise from omitted variables.
Fifth, we examine the robustness of our findings to two alternative CFP measures: return on
assets (Return on assets – an accounting based proxy) and total share returns (Total share return – a
market based measure). Models 7 and 8 of Table 7 report results based on applying Return on assets and
Total share return, respectively, instead of Tobin’s Q. The positive impact of the CSR index on the Return
on assets (0.158, t = 3.620, p<0.001) and Total share return (0.125, t = 3.453, p<0.001) in models 7 and
8 of Table 7, respectively, is observable, and thereby indicating that our results remain unchanged when
an accounting (Return on assets) or a market (Total share return) based measure of CFP is employed
instead of Q. Overall, the additional analyses indicate that our results are fairly robust to different types of
endogeneities and CFP measures.
Finally, several studies report that CG has a positive effect on CFP (Gompers et al., 2003;
Renders et al., 2010; Bozec & Bozec, 2012; Ntim et al., 2012a). Therefore, we examine the effect of the
CG variables alone on CFP in Models 9 and 10 of Table 7. The positive effect of the CG index on the
Tobin’s Q in Models 9 (0.128, t = 3.465, p<0.001) and 10 (0.125, = 3.453, p<0.001) of Table 7 is
discernible, and thereby providing further support for the findings of past studies (Gompers et al., 2003;
Bozec & Bozec, 2012; Ntim et al., 2012a). However, the relatively smaller coefficient on the CG index
compared with when it is interacted with the CSR index (see for example Models 3 and 4 of Table 5),
suggests that the interaction also enhances the positive effect of the CG index on Tobin’s Q. Thus, the
36
main implication is that whereas CG on its own can have a significant positive effect on CFP, CSR alone
has a positive, but weak effect on CFP, which can be strengthened by interacting it with CG.
SUMMARY AND CONCLUSIONS
Although a considerable number of studies have investigated the determinants, motivations and
consequences of corporate social responsibility (CSR) and corporate governance (CG) practices
separately, studies examining how and why a firm’s internal CG might influence its CSR strategies are
rare. Therefore, this paper examines the link between corporate governance (CG) and corporate social
responsibility (CSR), and consequently, investigates whether CG can positively moderate the association
between corporate financial performance (CFP) and CSR. The empirical findings are based on a sample
of large South African listed corporations from 2002 to 2009. This period coincided with a period during
which the South African authorities pursued a joint CG and CSR policy reforms that explicitly required
corporations to engage in good CG and CSR practices for the benefit of a broader constituency of
corporate stakeholders.
More specifically, we articulate an overarching neo-institutional framework to study the
antecedents and consequences of CSR practices at the organisational level of analysis for the first time, by
relying on insights gained from a neo-institutional model put forward by DiMaggio and Powell (1983,
1991), and Scott (2001), as well as Aguilera et al.’s (2007) multilevel theory for interpreting CSR
practices. This framework was also informed by empirical insights obtained from the extant institutional
theory-led studies grounded in the CSR/CG literature by Aguilera and Cuervo-Cazurra (2004), Zattani
and Cuomo (2008), and Judge et al. (2008, 2010). Our findings make a number of new contributions to
the literature. First, using one of the most extensive CSR and CG data to-date, we provide new evidence
that suggests that, on average, better-governed corporations are more predisposed to pursue a more
socially responsible agenda than their poorly-governed counterparts.
Second, our results indicate that CSR practices are low in corporations with high block ownership
and institutional ownership, but high in corporations with high government ownership, larger boards,
diverse boards, and more independent boards. These findings are largely consistent with the predictions of

37
our generalised neo-institutional framework, which emphasises the efficiency and legitimation effects of
CSR practices. This dualism of efficiency/legitimation characterisation is also reflected in Aguilera et
al.’s (2007) conceptualisation of organisational level motives (i.e., instrumental, moral and relational) for
CSR practices, albeit with the relational motive providing the ‘middle ground’, where efficiency and
legitimation might be seen to co-exist or be reflective of the multi-faceted relationships between the firm
and its stakeholders. In our view, therefore, an overarching institutional framework allows for an
examination of CG and CSR by recognising not only the different economic-led incentives underpinning
the relationship between CSR and CG, but also the social and political realities, which can then shape
how governance arrangements operate and how social responsibility is practiced.
Third, and whilst the findings of a considerable number of studies that have investigated direct
links between CFP and CSR are conflicting, there are limited attempts at explaining how and why this
might be so. Thus, our findings distinctively contribute to the literature by providing new evidence that
indicates that a combination of CSR and CG practices has a strong positive effect on CFP, implying that
CG positively moderates the CSR-CFP connection. This sheds new crucial insights on and extends our
understanding of the mixed findings of past studies that have examined direct associations between CFP
and CSR. Our findings are generally robust across a number of econometric models that sufficiently
address different types of endogeneities, as well as alternative CFP, CG and CSR proxies.
Fourth, the theoretical implication of this study is that we explicitly bring to the fore the role of
CG-related structures, actors and policies at the organisational level of analysis of the antecedents of CSR
practices developed by Aguilera et al. (2007). The scholars (2007: 845) refer to the pressures of insider
groups (mainly shareholders and managers) and outsider groups (primarily consumers), as well as the role
of top management teams in influencing firms to engage in CSR actions. However, Aguilera et al. (2007)
do not consider more specifically the role of the board and the firm’s ownership characteristics, which to
a large extent reflects a combination of insider and outsider groups and a blend of relational/moral
(legitimation) and instrumental (efficiency) motives. Our study, therefore, fills this gap within the existing
literature by showing that CG-related actors (e.g., boards and independent directors) and ownership

38
structures (e.g., ownership by institutions and governments) may well pressure the firm to engage in CSR
practices for both legitimation (relational/moral) and efficiency (instrumental) reasons. Furthermore, our
analysis of the relationship among CG, CSR and CFP suggests that corporations do not necessarily pursue
legitimation and efficiency motives in isolation; instead there are significant interaction effects among
them, which can help strengthen their relationships, including the association between CSR and CFP.
Finally, our findings have crucial practical implications for regulators, policy-makers,
practitioners, companies, and governments in other countries that are currently pursuing CG and CSR
policy reforms. With respect to governments and regulatory authorities, since our evidence suggests that
better-governed corporations are more likely to be more socially responsible, it provides them with a
strong motivation to pursue CG reforms formally and jointly with CSR ones. Specifically, efforts at
enhancing boardroom practices, accounting transparency, and disclosure for shareholders should be
pursued alongside attempts at addressing the concerns of stakeholders, such as employees, customers and
communities regarding the environment, ethics, and health and safety, amongst others. With regard to
corporations, since our evidence suggests that CG and CSR practices jointly impacts positively on CFP, it
empowers corporate managers to incorporate CSR as a strategic component of the firm’s broader CG
strategy by paying serious attention to stakeholder and sustainability concerns. Further, and as our South
African data may or may not be relevant to other countries, future studies can adopt our overarching neo-
institutional theoretical framework within a cross-country context, which may arguably enhance
generalisability of their findings. Similarly, it should be noted that our structural proxies may or may not
reflect the actual behaviour of corporate boards and owners.
ACKNOWLEDGEMENTS
The authors gratefully acknowledge the insightful and timely suggestions by the previous Editor-in-Chief, Dr William Judge, the current Editor-in-Chief, Professor Praveen Kumar, the three Guest Editors (namely Professor Timothy Devinney, Professor Joachim Schwalbach, and Professor Cynthia Williams), and two anonymous reviewers. We also acknowledge useful comments received at presentations at the Accounting, Finance and Economics Workshop (University of Glasgow, Glasgow, 2012), and INTERREG International Conference on Socially Responsible Investment (University of Southampton, Southampton, 2012), as well as useful suggestions by the participants of the Corporate Governance International Review Special Issue Workshop (Humboldt University, Berlin, 2012). We would also like to thank Malgorzata Kordek for her assistance in the data collection. Finally, Collins Ntim acknowledges

39
financial support from the School of Management and Business, and Aberystwyth University research funds.
NOTES 1. It is a ‘generalised and/or an ‘overarching’ neo-institutional theory because it draws from the neo-institutional framework proposed by
DiMaggio and Powell (1983, 1991), and Scott (2001), as well as Aguilera et al.’s (2007) multilevel theory for explaining CSR practices. It is also informed by insights from neo-institutional theory-led empirical studies by Aguilera and Cuervo-Cazurra (2004), Zattoni and Cuomo (2008), and Judge et al. (2008, 2010) that explicitly acknowledge and incorporate both ‘efficiency’ and ‘legitimation’ motives of economic actors operating within an institutional environment instead of directly testing for the presence of specific institutional isomorphism (e.g., coercive, mimetic, and/or normative institutional forces).
2. One new insight that may be gained (‘takeaway’) from focusing on the South African context is that since 1994, listed companies have been formally required (as part of the listing rules) to report on a number of clearly defined CSR areas. By contrast, CSR reporting remains largely voluntary and undefined in most Anglo-American countries. For example, the London Stock Exchange (LSE) has resisted making CSR reporting a formal requirement for its listed firms. The LSE has argued that what constitutes CSR is not only vague, but also such a requirement will place ‘excessive cost burden’ on listed firms (LSE, 2007: 99). Thus, this differentiates CG reforms pursued in South Africa from its counterparts. In fact, the King Reports have gained international recognition and received several endorsements from leading academics and policy-makers as an example of a good CG model in the world. Mallin (2007: 248), for example, states that “South Africa has a well-developed corporate governance code. In fact, its revised Code published in 2002 is the most comprehensive in the world, and leading edge in terms of its outlook and recommendations”. Indeed, the relative success of the CG/CSR reforms in South Africa led to its main champion, a retired Supreme Court judge, Professor Mervyn King, being appointed as the chair of the United Nations committee on CG to lead global reforms on CG with particular focus on enhancing CG standards in developing countries.
3. Although not the focus of our study, it should be noted that King II has been revised and replaced with a third King report (King III) in March 2010. This was mainly necessitated by general developments and changes within the international governance environment, including the 2007 to 2009 global financial crisis (the so-called 'credit crunch') since King II was released. King III is largely similar to King II. A major difference is that King III requires corporations to formally prepare an annual ‘integrated report’ consisting of statutory financial and sustainability (CSR) information, implying that CSR reporting is mandatory as with financial reporting. Further King III is in its infancy in terms of implementation, compliance and enforcement, which will require time for adequate data to be available regarding its impact on CG and CSR practices to be assessed. Hence, the current study focuses on King II instead of King III.
4. BEE is a form of socio-economic affirmative action championed by the African National Congress led government to address historical imbalances in business participation and ownership in South Africa. Specifically, the BEE policy encourages South African corporations to account on an annual basis their contributions in a number of clearly defined CSR areas: corporate social investment; equity ownership; employment equity; enterprise development; management control; preferential procurement; and skills development.
5. For example, the six largest pyramidal groups (namely, the Anglo American-De Beers, Rembrandt, Sanlam, Old Mutual, Liberty Life Insurance and Anglovaal Groups) control over 70% of the value of all shares listed on the Johannesburg Stock Exchange, with the Anglo American-De Beers Group controlling 17 of the 20 largest quoted firms (Ntim et al., 2012a, b).
6. Given the well articulated limitations of quantity measures, such as word counts (Unerman, 2000; Deegan, 2002; Branco & Rodrigues, 2008; Hooks & Van Staden, 2011) and qualitative proxies, such as disclosure indices (Gray et al., 1995; Parker, 2005; Hackston & Milne, 1996; Gompers et al., 2003), we use both in order to enhance the robustness of our findings.
7. We note that our choice is between fixed- and random-effects, but Hausman specification test conducted rejected random-effects in favour of fixed-effects. Intuitively, this is consistent with the use of non-random/stratified instead of random sampling procedure. We also follow Guest (2009) and Ntim et al. (2012a) in implementing the mean-difference technique, which is more robust in the presence of hetereoscedasticity (Gujarati, 2003; Wooldridge, 2010). However, we get essentially similar results if we run our fixed-effects models by employing the year dummy alternative instead of the mean-difference method.
8. According to the theory of the firm (McGuire et al., 1988; McWilliams & Siegel, 2001), CG can be considered as part of a firm‘s CSR strategy, implying that higher CFP may also lead to higher CSR and CG quality, and not only vice versa. Therefore, we re-estimate equation (2) by interchanging the positions of the CSR index and CFP (i.e., by making CSR index the main dependent variable and the CFP the main independent variable in addition to the control variables). We find that the coefficient on CFP is positive (0.024, t = 0.376, p>0.100), but insignificant. Further, and to ascertain whether there is a lagged structure between CSR and CFP such that better performing firms are also more likely to maintain higher CSR and CG standards in the future, we introduce a one year lag between CSR and CFP such that the current year’s CSR (CSRt) depends on the previous year’s CFP (CFPt-1). We find that the coefficient on the lagged CFP (CFPt-1) is positive (0.028, t = 0.394, p>0.100), but similarly insignificant. Thus, the evidence suggests that our finding is not sensitive to this specification, and that the direction of causality appears to be from the CSR index to the CFP rather than the other way round.
9. To be reliable, the predicted CSR index has to be highly correlated with the actual CSR index (relevant), but lowly or uncorrelated with the regression residuals. The correlation between the predicted CSR index and the actual CSR index contained in Table 3 appears to be relatively high (i.e., 0.816 and 0.834, respectively, for the Pearson parametric and the Spearman non-parametric coefficients), whilst the correlation between the predicted CSR index and regression residuals seems to be comparatively low (i.e., 0.116 and 0.134, respectively, for the Pearson parametric and the Spearman non-parametric coefficients). By contrast, the correlation between the actual CSR index and regression residuals is relatively high (i.e., 0.574 and 0.610 for the Pearson parametric and the Spearman non-parametric coefficients). Thus, the evidence appears to suggest that the predicted CSR index is largely a good and appropriate instrument for the actual CSR index. This is also supported by the relatively good regression diagnostics (i.e., relatively high R2 of 0.479 and F-value of 8.895) from the first stage regression results presented in Model 5 of Table 7. To be more certain, however, we additionally conducted the Hausman exogeneity test, but we could not reject the null hypothesis that the predicted CSR index is exogenous at any reasonable statistical significance level. Overall, our analyses make us reasonable confident that the predicted CSR index is relevant and valid instrument for the actual CSR index.
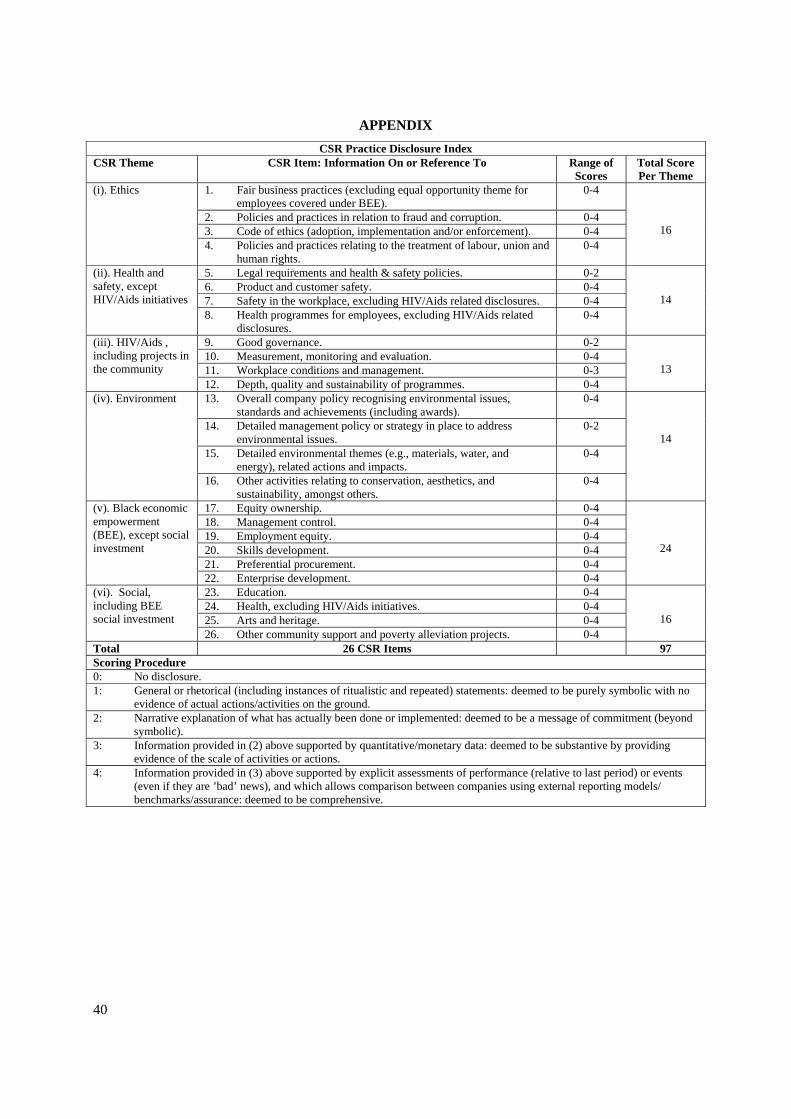
40
APPENDIX
CSR Practice Disclosure IndexCSR Theme CSR Item: Information On or Reference To Range of
Scores Total Score Per Theme
(i). Ethics 1. Fair business practices (excluding equal opportunity theme for employees covered under BEE).
0-4
16 2. Policies and practices in relation to fraud and corruption. 0-4 3. Code of ethics (adoption, implementation and/or enforcement). 0-4 4. Policies and practices relating to the treatment of labour, union and human rights.
0-4
(ii). Health and safety, except HIV/Aids initiatives
5. Legal requirements and health & safety policies. 0-2
14 6. Product and customer safety. 0-4 7. Safety in the workplace, excluding HIV/Aids related disclosures. 0-4 8. Health programmes for employees, excluding HIV/Aids related disclosures.
0-4
(iii). HIV/Aids , including projects in the community
9. Good governance. 0-2
13 10. Measurement, monitoring and evaluation. 0-4 11. Workplace conditions and management. 0-3 12. Depth, quality and sustainability of programmes. 0-4
(iv). Environment 13. Overall company policy recognising environmental issues, standards and achievements (including awards).
0-4
14 14. Detailed management policy or strategy in place to address environmental issues.
0-2
15. Detailed environmental themes (e.g., materials, water, and energy), related actions and impacts.
0-4
16. Other activities relating to conservation, aesthetics, and sustainability, amongst others.
0-4
(v). Black economic empowerment (BEE), except social investment
17. Equity ownership. 0-4
24
18. Management control. 0-4 19. Employment equity. 0-4 20. Skills development. 0-4 21. Preferential procurement. 0-4 22. Enterprise development. 0-4
(vi). Social, including BEE social investment
23. Education. 0-4
16 24. Health, excluding HIV/Aids initiatives. 0-4 25. Arts and heritage. 0-4 26. Other community support and poverty alleviation projects. 0-4
Total 26 CSR Items 97 Scoring Procedure 0: No disclosure. 1: General or rhetorical (including instances of ritualistic and repeated) statements: deemed to be purely symbolic with no evidence of actual actions/activities on the ground. 2: Narrative explanation of what has actually been done or implemented: deemed to be a message of commitment (beyond symbolic). 3: Information provided in (2) above supported by quantitative/monetary data: deemed to be substantive by providing evidence of the scale of activities or actions. 4: Information provided in (3) above supported by explicit assessments of performance (relative to last period) or events (even if they are ’bad’ news), and which allows comparison between companies using external reporting models/ benchmarks/assurance: deemed to be comprehensive.

41
REFERENCES
Adams, C.A. 2002. Internal organizational factors influencing corporate social and ethical reporting: Beyond current theorizing. Accounting, Auditing & Accountability Journal, 15: 223-250.
Aguilera, R.V. & Jackson, G. 2003. The cross-national diversity of corporate governance: Dimensions and determinants. Academy of Management, 28: 447-462.
Aguilera, R.V. & Cuervo-Cazurra, A. 2004. Codes of good governance worldwide: What is the trigger? Organization Studies, 25: 415-443.
Aguilera, R.V. & Cuervo-Cazurra, A. 2009. Codes of good governance. Corporate Governance: An International Review, 17: 376-387.
Aguilera, R.V., Rupp, D.E., Williams, C., & Granapathi, J. 2007. Putting the s back in corporate social responsibility: A multilevel theory of social change in organizations. Academy of Management Review, 32: 836-863.
Aguilera, R.V., Williams, C.A., Conley, J.M., & Rupp, D.E. 2006. Corporate governance and social responsibility: A comparative analysis of the UK and the US. Corporate Governance: An International Review, 14: 147-158.
Andres, C. 2008. Large shareholders and firm performance – An empirical examination of founding-family ownership. Journal of Corporate Finance, 14: 431-445.
Arora, P. & Dharwadkar, R. 2011. Corporate governance and corporate social responsibility (CSR): The moderating roles of attainment discrepancy and organization slack. Corporate Governance: An International Review, 19: 136-152.
Ashforth, B.E. & Gibbs, B.W. 1990. The double-edge of organizational legitimation. Organization Science, 1: 177-193.
Barako, D.G., Hancock, P., & Izan, H.Y. 2006. Factors influencing voluntary corporate disclosure by Kenyan companies. Corporate Governance: An International Review, 14: 107-125.
Barako, D.G. & Brown, A.M. 2008. Corporate social reporting and board representation: Evidence from the Kenyan banking sector. Journal of Management and Governance, 12: 309-324.
Barnea, A. & Rubin, A. 2010. Corporate social responsibility as a conflict between shareholders. Journal of Business Ethics, 97: 71-86.
Becchetti, L. & Ciciretti, R. 2009. Corporate social responsibility and stock market performance. Applied Financial Economics, 19: 1283-1293.
Beekes, W. & Brown, P. 2006. Do better-governed Australian firms make more informative disclosures? Journal of Business Finance & Accounting, 33: 424-450.
Beiner, S., Drobetz, W., Schmid, M.M., & Zimmermann, H. 2006. An integrated framework of corporate governance and firm valuation. European Financial Management, 12: 249-283.
Bird, R., Hall, A.D., Momente, F., & Reggiani, F. 2007. What corporate social responsibility activities are valued by the market? Journal of Business Ethics, 76: 189-206.
Bozec, R. & Bozec, Y. 2012. The use of governance indexes in the governance-performance relationship literature: International evidence. Canadian Journal of Administrative Sciences, 29: 79-98.
Brammer, S. & Pavelin, S. 2008. Factors influencing the quality of corporate environmental disclosure. Business Strategy & the Environment, 17: 120-136.
Branco, M.C. & Rodrigues, L.L. 2006. Corporate social responsibility and resource-based perspectives. Journal of Business Ethics, 69: 111-132.
Branco, M.C. & Rodrigues, L.L. 2008. Factors influencing social responsibility disclosures by Portuguese companies. Journal of Business Ethics, 83: 685-701.
Cai, Y., Jo, H., & Pan, C. 2012. Doing well while doing bad? CSR in controversial industry sectors. Journal of Business Ethics, 108: 53-72.
Callado-Munoz, J. & Ultrero-Gonzalez, N. 2011. Does it pay to be socially responsible? Evidence from Spain’s retail banking sector. Corporate Governance: An International Review, 17: 755-787.
Campbell, D., Craven, B., & Shrives, P. 2003. Voluntary social reporting in three FTSE sectors: A comment on perception and legitimacy. Accounting, Auditing & Accountability Journal, 16: 558-581.
Campbell, D., Moore, G., & Shrives, P. 2006. Cross-sectional effects in community disclosure. Accounting, Auditing & Accountability Journal, 19: 96-114.
42
Carter, D.A., Simkins, B.J., & Simpson, W.G. 2003. Corporate governance, board diversity, and firm value. Financial Review, 38: 33-53.
Cheng, S., Evans, J.H., & Nagarajan, N. J. 2008. Board size and firm performance: moderating effects of the market for corporate control. Review of Quantitative Finance & Accounting, 31: 121-145.
Chen, J.C. & Roberts, R.W. 2010. Toward a more coherent understanding of the organization-society relationship: A theoretical consideration for social and environmental accounting research. Journal of Business Ethics, 97: 651-665.
Cicon, J.E., Ferris, S.P., Kammel, A. J., & Noronha, G. 2012. European corporate governance: A thematic analysis of national codes of governance. European Financial Management, 18: 620-648.
Coles, J.L., Daniel, N.D., & Naveen, L. 2008. Boards: does one size fit all? Journal of Financial Economics, 87: 329-356.
Collett, P. & Hrasky, S. 2005. Voluntary disclosure of corporate governance practices by listed Australian companies. Corporate Governance: An International Review, 13: 188-196.
Cressy, R., Cumming, D., & Mallin, C. 2010. Entrepreneurship, governance and ethics. Journal of Business Ethics, 95: 117-120.
Cumming, D., Fleming, G., Johan, S., & Takeuchi, M. 2010. Legal protection, corruption and private equity returns in Asia. Journal of Business Ethics, 95: 173-193.
Dam, L. & Scholtens, B. 2012. Does ownership type matter for corporate social responsibility? Corporate Governance: An International Review, 20: 233-252.
Deegan, C. 2002. The legitimising effect of social and environmental disclosures - A theoretical foundation. Accounting, Auditing and Accountability Journal, 15: 282-311.
Devinney, T.M. 2009. Is the socially responsible corporation a myth? The good, the bad, and the ugly of corporate social responsibility. Academy of Management Perspectives, 23: 44-56.
DiMaggio, P.J. & Powell, W.W. 1983. The iron cage revisited: Institutional isomorphism and collective rationality in organizational fields. American Sociological Review, 48: 147-160.
DiMaggio, P.J. & Powell, W.W. 1991. The new institutionalism in organizational analysis. Chicago: University of Chicago Press.
Donaldson, T. & Preston, L.E. 1995. The stakeholder theory of the corporation: Concepts, evidence and implications. Academy of Management Review, 20: 65-91.
Elkington, J. 2006. Governance for sustainability. Corporate Governance: An International Review, 14: 522-529.
Eng, L.L. & Mak, Y.T. 2003. Corporate governance and voluntary disclosure. Journal of Accounting and Public Policy, 22: 325-345.
Fifka, M.S. 2013. Corporate responsibility reporting and its determinants in comparative perspective – A review of the empirical literature and a meta-analysis. Business Strategy and the Environment, 22: 1-35.
Freeman, R.E. & Reed, D.L. 1983. Stockholders and stakeholders: A new perspective on corporate governance. California Management Review, 25: 88-106.
Freeman, R.E. 1984. Strategic management: A stakeholder approach. Boston: Pitman. Friedman, M. 1970. The social responsibility of business is to increase its profits. New York Times
Magazine, 13: 32-33. Frye, M.B., Nelling, E., & Webb, E. 2006. Executive compensation in socially responsible firms.
Corporate Governance: An International Review, 14: 446-455. Gibson, K. & O’Donovan, G. 2007. Corporate governance and environmental reporting: An Australian
study. Corporate Governance: An International Review, 15: 944-956. Gompers, P., Ishii, J., & Metrick, A. 2003. Corporate governance and equity prices. Quarterly Journal of
Economics, 118: 107-155. Gray, R., Kouhy, R., & Lavers, S. 1995. Corporate social and environmental reporting: A review of the
literature and a longitudinal study of UK disclosure. Accounting, Auditing & Accountability Journal, 8: 47-77.
Guest, P.M. 2009. The impact of board size on firm performance: Evidence from the UK. European Journal of Finance, 15: 385-404.

43
Gujarati, D.N. 2003. Basic econometrics. New York: McGraw-Hill. Hackston, D. & Milne, M.J. 1996. Some determinants of social and environmental disclosures in New
Zealand companies. Accounting, Auditing & Accountability Journal, 9: 77-108. Haniffa, R.M. & Cooke, T.E. 2005. The impact of culture and governance on corporate social reporting.
Journal of Accounting and Public Policy, 24: 391-430. Harjoto, M.A. & Jo, H. 2011. Corporate governance and CSR Nexus. Journal of Business Ethics, 100:
45-67. Henry, D. 2008. Corporate governance structure and the valuation of Australian firms: Is there value in
ticking the boxes. Journal of Business Finance & Accounting, 35: 912-942. Hillman, A.J., Keim, G.D., & Luce, R.A. 2001. Board composition and stakeholder performance: Do
stakeholder directors make a difference? Business & Society, 40: 295-314. Hooks, J. & Van Staden, C.J. 2011. Evaluating environmental disclosures: The relationship between
quality and extent measures. British Accounting Review, 43: 200-213. Hou, W. & Moore, G. 2010. Player and referee roles held jointly: The effect of state ownership on
China’s regulatory enforcement against fraud. Journal of Business Ethics, 95: 317-335. Jamali, D., Safieddine, A.M., & Rabbath, M. 2008. Corporate governance and corporate social
responsibility synergies and interrelationships. Corporate Governance: An International Review, 16: 443-459.
Jensen, M.C. & Meckling, W.H. 1976. Theory of the firm: Managerial behaviour, agency costs and ownership structure. Journal of Financial Economics, 3: 305-360.
Jensen, M.C. 1993. The modern industrial revolution, exit and the failure of internal control systems. Journal of Finance, 48: 831-880.
Jensen, M.C. 2002. Value maximisation, stakeholder theory, and the corporate objective function. Business Ethics Quarterly, 12: 235-247.
Jia, C., Ding, S., Li, Y., & Wu, Z. 2009. Fraud, enforcement action, and the role of corporate governance: Evidence from China. Journal of Business Ethics, 90: 561-576.
Jo, H. & Harjoto, M.A. 2012. The causal effect of corporate governance on corporate social responsibility. Journal of Business Ethics, 106: 53-72.
Jo, H. & Harjoto, M.A. 2011. Corporate governance and firm value: The impact of corporate social responsibility. Journal of Business Ethics, 103: 351-383.
Johan, S.A. & Najar, D. 2010. The role of corruption, culture, and law in investment fund manager fees. Journal of Business Ethics, 95: 147-172.
Judge, W. 2012. Editorial – Pioneering research in comparative corporate governance: The role of special issues. Corporate Governance: An International Review, 20: 1-2.
Judge, W., Li, S., & Pinsker, R. 2010. National adoption of international accounting standards: An institutional perspective. Corporate Governance: An International Review, 18: 161-174.
Judge, W.Q., Douglas, T.J., & Kutan, A.M. 2008. Institutional antecedents of corporate governance legitimacy. Journal of Management, 34: 765-785.
Khan, A., Muttakin, M.B., & Siddiqui, J. 2012. Corporate governance and corporate social responsibility disclosures: Evidence from an emerging economy. Journal of Business Ethics, Forthcoming.
King Committee. 1994, 2002 & 2010. King reports on corporate governance for South Africa. Johannesburg: Institute of Directors.
Larcker, D.F. & Rusticus, T.O. 2010. On the use of instrumental variables in accounting research. Journal of Accounting & Economics, 49: 186-205.
Lattermann, C., Fetscherin, M., Alon, I., Li, S., & Schneider, A.M. 2009. CSR communication intensity in Chinese and Indian multinational companies. Corporate Governance: An International Review, 17: 426-442.
Lindgreen, A., Swaen, V., & Campbell, T.T. 2010. Corporate social responsibility practices in developing and transitional countries: Botswana and Malawi. Journal of Business Ethics, 90:429-440.
Lo, S.F. & Sheu, H.J. 2007. Is corporate sustainability a value-increasing strategy for business? Corporate Governance: An International Review, 15: 345-358.

44
London Stock Exchange (LSE) 2007. Corporate governance update – CSR reporting is “excessive burden”. Corporate Governance: An International Review, 15: 96-100.
Mackenzie, C. 2007. Boards, incentives and corporate responsibility: The case for a change of emphasis. Corporate Governance: An International Review, 15: 935-943.
Mahadeo, J.D., Oogarah-Hanuman, V., & Soobaroyen, T. 2011. A longitudinal study of corporate social disclosures in a developing economy. Journal of Business Ethics, 104: 545-558.
Mahadeo, J.D., Soobaroyen, T., & Oogarah-Hanuman, V. 2012. Board composition and financial performance: Uncovering the effects of diversity in an emerging economy. Journal of Business Ethics 105: 375-388.
Mahoney, L. & Roberts, R.W. 2007. Corporate social performance, financial performance and institutional ownership in Canadian firms. Accounting Forum, 31: 233-253.
Mallin, C. 2002. The relationship between corporate governance, transparency and financial disclosure. Corporate Governance: An International Review, 10: 253-255.
Mallin, C.A. 2006. Handbook on International Corporate Governance. Edward Elgar Publishing: Cheltenham.
Mallin, C.A. 2007. Corporate Governance. Oxford University Press: Oxford. McConnell, J. & Servaes, H. 1990. Additional evidence on equity ownership and corporate value.
Journal of Financial Economics, 27: 595-612. McGuire, J.B., Sundregen, A., & Schneeweis, T. 1988. Corporate social responsibility and firm financial
performance. Academy of Management Journal, 31: 854-872. McWilliams, A. & Siegel, D. 2000. Corporate social responsibility and financial performance:
Correlation or misspecification? Strategic Management Journal, 21: 603-609. McWilliams, A. & Siegel, D. 2001. Corporate social responsibility: A theory of the firm perspective.
Academy of Management Review, 26: 117-127. McWilliams, A., Siegel, D.S, & Wright, P.M. 2006. Corporate social responsibility: Strategic
implications. Journal of Management Studies, 43: 1-18. Meyer, J. & Rowan, B. 1977. Institutionalized organizations: Formal structure as myth and ceremony.
American Journal of Sociology, 83: 340-363. Michelon, G. & Parbonetti, A. 2012. The effect of corporate governance on sustainability disclosure.
Journal of Management & Governance, 16: 477-509. Mizruchi, M. & Fein, L. 1999. The construction of organizational knowledge: A study of the uses of
coercive, mimethic, and normative isomorphism. Administrative Science Quarterly, 44: 653-683. Morck, R., Shleifer, A. & Vishny, R.W. 1988. Management ownership and market valuation: An
empirical analysis. Journal of Financial Economics, 20: 293-315. Nelling, E. & Webb, E. 2009. Corporate social responsibility and financial performance: The “virtuous
circle” revisited. Review of Quantitative Finance & Accounting, 32: 197-209. North, D. 1990. Institutions, institutional change, and economic performance. New York: Norton. Ntim, C.G., Opong, K.K., & Danbolt, J. 2012a. The relative value relevance of shareholder versus
stakeholder corporate governance disclosure policy reforms in South Africa. Corporate Governance: An International Review, 20: 84-105.
Ntim, C.G., Opong, K.K., Danbolt, J., & Thomas, D.A. 2012b. Voluntary corporate governance disclosures by post-apartheid South African listed corporations. Journal of Applied Accounting Research, 13: 122-144.
Ntim, C.G. & Soobaroyen, T. 2013. Black economic empowerment disclosures by South African listed Corporations: The Influence of ownership and board characteristics. Journal of Business Ethics, Forthcoming.
Oh, W.Y., Chang, Y.K., & Martynov, A. 2011. The effect of ownership structure on corporate social responsibility: Empirical evidence from Korea. Journal of Business Ethics, 104: 283-297.
Orlitzky, M., Schmidt, F.L., & Rynes, S.L. 2003. Corporate social and financial performance: A meta-analysis. Organization Studies, 24: 403-441.
Orlitzky, M., Siegel, D.S., & Waldman, D.A. 2011. Strategic corporate social responsibility and environmental sustainability. Business & Society, 50: 6-27.

45
Parker, L.D. 2005. Social and environmental accountability research: A view from the commentary box. Accounting, Auditing & Accountability Journal, 18: 842-60.
Petersen, M.A. 2009. Estimating standard errors in finance panel data sets: Comparing approaches. Review of Financial Studies, 22: 435-480.
Pfeffer, J. & Salancik, G.R. 1978. The external control of organizations: A resource dependence perspective. New York: Harper and Row.
Prior, D., Surroca, J., & Tribó, J.A. 2008. Are socially responsible managers really ethical? Exploring the relationship between earnings management and corporate social responsibility. Corporate Governance: An International Review, 16: 160-177.
Reverte, C. 2009. Determinants of corporate social responsibility disclosure ratings by Spanish listed firms. Journal of Business Ethics, 88: 351-366.
Rhodes, M.J. & Soobaroyen, T. 2010. Information asymmetry and socially responsible investment. Journal of Business Ethics, 95: 145-150.
Roberts, R.W. 1992. Determinants of corporate social responsibility disclosure: An application of stakeholder theory. Accounting, Organization, & Society, 17: 595-612.
Scholtens, B. 2007. Financial and social performance of socially responsible investments in the Netherlands. Corporate Governance: An International Review, 15: 1090-1105.
Scholtens, B. 2008. A note on the interaction between corporate social responsibility and financial performance. Ecological Economics, 68: 46-55.
Scott, W.R. 1987. The adolescence of institutional theory. Administrative Science Quarterly, 32: 493-511.
Scott, W.R. 2001. Institutions and organizations. 2nd eds. Thousand Oaks, CA: Sage. Soobaroyen, T. & Ntim, C.G. 2013. Social and environmental accounting as symbolic and substantive
means of legitimation: The case of HIV/AIDS reporting in South Africa. Accounting Forum, Forthcoming.
Starks, L.T. 2009. Corporate governance and corporate social responsibility: What do investors care about? What should investors care about? Financial Review, 44: 461-468.
Suchman, M.C. 1995. Managing legitimacy: Strategic and institutional approaches. Academy of Management Review, 20: 571-606.
Tagesson, T., Blank, V., Broberg, P., & Collin, S.O. 2009. What explains the extent and content of social and environmental disclosures on corporate websites: A study of social and environmental reporting in Swedish listed corporations. Corporate Social Responsibility & Environmental Management, 16: 352-364.
Unerman, J. 2000. Methodological issues: Reflections on quantification in corporate social reporting content analysis. Accounting, Auditing & Accountability Journal, 13: 667–681.
Van der Walt, N. & Ingley, C. 2003. Board dynamics and the influence of professional background, gender and ethnic diversity of directors. Corporate Governance: An International Review, 11: 218-234.
Wooldridge, J.M. 2010. Econometric analysis of cross section and panel data. MIT Press. Yoshikawa, T., Tsui-Auch, L.S., & McGuire, J. 2007. Corporate governance reform as institutional
innovation: The Case of Japan. Organization Science, 18: 973-988. Young, Z. & Marais, M. 2012. A multi-level perspective of CSR reporting: The implications of national
institutions and industry risk characteristics. Corporate Governance: An International Review, 20: 432-450.
Zattoni, A. & Cuomo, F. 2008. Why adopt codes of good governance? A comparison of institutional and efficiency perspectives. Corporate Governance: An International Review, 16: 1-15.

46
Collins Ntim is a Senior Lecturer in accounting at the School of Management, University of Southampton. He holds a PhD from the University of Glasgow. His main research focuses on corporate governance, corporate social responsibility, and corporate finance. He has published in a number of internationally recognised journals, including the Accounting Forum, Corporate Governance: An International Review, and Journal of Business Ethics, amongst others. Teerooven Soobaroyen is a Reader in Accounting at the School of Management, University of Southampton. He obtained his PhD from the University of Wales, Aberystwyth. His research interests are in the areas of accounting, accountability (including corporate governance and corporate social responsibility), and management accounting. He has published in a number of journals, such as Accounting, Auditing and Accountability Journal, Accounting Forum, and Journal of Business Ethics.
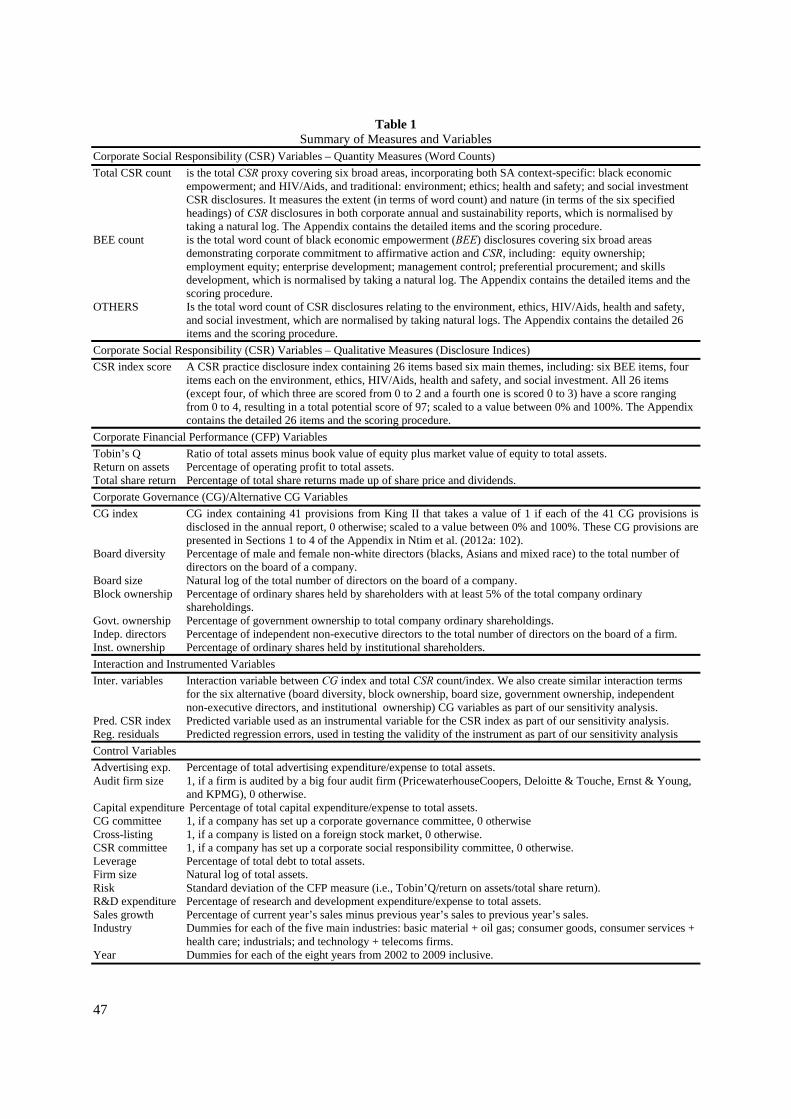
47
Table 1 Summary of Measures and Variables
Corporate Social Responsibility (CSR) Variables – Quantity Measures (Word Counts)
Total CSR count is the total CSR proxy covering six broad areas, incorporating both SA context-specific: black economic empowerment; and HIV/Aids, and traditional: environment; ethics; health and safety; and social investment CSR disclosures. It measures the extent (in terms of word count) and nature (in terms of the six specified headings) of CSR disclosures in both corporate annual and sustainability reports, which is normalised by taking a natural log. The Appendix contains the detailed items and the scoring procedure. BEE count is the total word count of black economic empowerment (BEE) disclosures covering six broad areas demonstrating corporate commitment to affirmative action and CSR, including: equity ownership; employment equity; enterprise development; management control; preferential procurement; and skills development, which is normalised by taking a natural log. The Appendix contains the detailed items and the scoring procedure. OTHERS Is the total word count of CSR disclosures relating to the environment, ethics, HIV/Aids, health and safety, and social investment, which are normalised by taking natural logs. The Appendix contains the detailed 26 items and the scoring procedure.
Corporate Social Responsibility (CSR) Variables – Qualitative Measures (Disclosure Indices)
CSR index score A CSR practice disclosure index containing 26 items based six main themes, including: six BEE items, four items each on the environment, ethics, HIV/Aids, health and safety, and social investment. All 26 items (except four, of which three are scored from 0 to 2 and a fourth one is scored 0 to 3) have a score ranging from 0 to 4, resulting in a total potential score of 97; scaled to a value between 0% and 100%. The Appendix contains the detailed 26 items and the scoring procedure.
Corporate Financial Performance (CFP) Variables
Tobin’s Q Ratio of total assets minus book value of equity plus market value of equity to total assets. Return on assets Percentage of operating profit to total assets. Total share return Percentage of total share returns made up of share price and dividends.
Corporate Governance (CG)/Alternative CG Variables
CG index CG index containing 41 provisions from King II that takes a value of 1 if each of the 41 CG provisions is disclosed in the annual report, 0 otherwise; scaled to a value between 0% and 100%. These CG provisions are presented in Sections 1 to 4 of the Appendix in Ntim et al. (2012a: 102).
Board diversity Percentage of male and female non-white directors (blacks, Asians and mixed race) to the total number of directors on the board of a company.
Board size Natural log of the total number of directors on the board of a company. Block ownership Percentage of ordinary shares held by shareholders with at least 5% of the total company ordinary shareholdings. Govt. ownership Percentage of government ownership to total company ordinary shareholdings. Indep. directors Percentage of independent non-executive directors to the total number of directors on the board of a firm. Inst. ownership Percentage of ordinary shares held by institutional shareholders.
Interaction and Instrumented Variables
Inter. variables Interaction variable between CG index and total CSR count/index. We also create similar interaction terms for the six alternative (board diversity, block ownership, board size, government ownership, independent non-executive directors, and institutional ownership) CG variables as part of our sensitivity analysis. Pred. CSR index Predicted variable used as an instrumental variable for the CSR index as part of our sensitivity analysis. Reg. residuals Predicted regression errors, used in testing the validity of the instrument as part of our sensitivity analysis
Control Variables
Advertising exp. Percentage of total advertising expenditure/expense to total assets. Audit firm size 1, if a firm is audited by a big four audit firm (PricewaterhouseCoopers, Deloitte & Touche, Ernst & Young, and KPMG), 0 otherwise. Capital expenditure Percentage of total capital expenditure/expense to total assets. CG committee 1, if a company has set up a corporate governance committee, 0 otherwise Cross-listing 1, if a company is listed on a foreign stock market, 0 otherwise. CSR committee 1, if a company has set up a corporate social responsibility committee, 0 otherwise. Leverage Percentage of total debt to total assets. Firm size Natural log of total assets. Risk Standard deviation of the CFP measure (i.e., Tobin’Q/return on assets/total share return). R&D expenditure Percentage of research and development expenditure/expense to total assets. Sales growth Percentage of current year’s sales minus previous year’s sales to previous year’s sales. Industry Dummies for each of the five main industries: basic material + oil gas; consumer goods, consumer services + health care; industrials; and technology + telecoms firms. Year Dummies for each of the eight years from 2002 to 2009 inclusive.

48
Table 2 Summary Descriptive Statistics of all Variables for all 600 Firm Years
High CSR index – Low CSR index ----------------------------------------- Variable Mean Median STD Maxi Mini VIF Mean Diff. Median Diff.
Panel A: Corporate Social Responsibility (CSR) Variables – Quantity Measures (Word Counts)
Total CSR count 4,080.85 2,734.00 4,019.19 23,371.00 186.00 - - - BEE count 1,334.43 918.00 1,332.78 8,347.00 50.00 - - - Env. count 936.94 403.50 1,336.88 8,225.00 9.00 - - - Ethics count 222.41 150.00 209.80 1,722.00 10.00 - - - HIV count 358.17 200.00 593.06 8,211.00 10.00 - - - Hea. & saf. 524.43 200.00 838.15 5,827.00 10.00 - - - Social invest. 704.46 426.50 731.03 4,482.00 11.00 - - -
Panel B: Corporate Social Responsibility (CSR) Variables – Quality Measures (Disclosure Indices)
CSR index (%) 56.42 54.64 16.19 77.32 6.19 - - - BEE index (%) 63.25 58.33 17.38 83.33 4.17 - - - Env. index (%) 59.68 57.14 16.71 78.57 7.14 - - - Ethics index (%) 44.69 43.75 15.88 75.00 6.25 - - - HIV index (%) 53.65 53.84 14.97 76.92 7.69 - - - Hea. & Saf. (%) 55.13 50.00 15.60 71.43 7.14 - - - Social invest. (%) 57.86 56.25 19.78 87.50 6.25 - - -
Panel C: Corporate Governance (CG)/Alternative CG Variables
CG index (%) 71.33 73.17 16.30 100.00 4.88 2.30 8.75*** 9.34*** Board diversity (%) 30.48 25.00 17.35 85.71 6.67 3.25 6.48*** 5.20*** Board size 11.35 11.00 3.46 21.00 4.00 1.68 1.85† 1.93† Block ownership (%) 53.14 52.06 21.50 97.86 5.94 3.79 -4.76*** -3.80** Govt. ownership (%) 7.94 6.59 9.65 71.94 0.00 3.85 2.39** 2.46** Indep. directors (%) 45.28 43.81 17.85 92.31 5.88 2.97 2.30* 1.98† Inst. ownership (%) 77.96 89.70 24.12 98.69 5.94 3.76 -4.96*** -3.74**
Panel D: Corporate Financial Performance (CFP)/Alternative CFP Variables
Tobin’s Q 1.75 1.56 0.79 6.56 0.70 - - - Return on assets (%) 13.82 12.82 11.49 71.12 -19.96 - - - Total share return (%) 37.18 32.66 47.77 268.57 -75.58 - - -
Panel E: Control Variables
Advertising exp. (%) 1.05 0.96 2.80 19.42 0.00 2.40 1.88† 1.90† Audit firm size (%) 85.50 100.00 35.24 100.00 0.00 3.52 6.50*** 5.85*** Capital exp. (%) 7.20 5.90 5.59 60.86 0.00 2.60 -0.96 -0.84 CG committee (%) 50.00 50.00 50.00 100.00 0.00 3.75 5.32*** 6.37*** Cross-listing (%) 38.33 0.00 48.66 100.00 0.00 3.88 7.85*** 8.14*** CSR committee (%) 36.67 0.00 53.79 100.00 0.00 2.73 8.39*** 7.83*** Leverage (%) 48.99 50.17 18.83 93.61 1.14 2.40 -1.08 -0.90 Firm size 3.74 3.79 0.85 5.93 0.70 1.06 2.59* 2.63* Risk (%) 33.98 19.87 44.87 400.10 1.78 3.82 0.47 0.38 R&D exp. (%) 3.56 3.24 3.93 36.48 0.00 2.65 -1.65 -1.52 Sales growth (%) 3.28 9.42 27.82 93.51 -99.96 3.97 0.38 0.33 Notes: The table reports summary descriptive statistics, variance inflation factor (VIF) values, and mean/median differences for sub-samples of firms with high and low corporate social responsibility (CSR) scores, respectively. ***, **, *, and † denote mean/median difference between firms with high CSR index score (i.e., firms with CSR index score above the overall mean/median mark) and firms with low CSR index score (i.e., firms with CSR index score below the overall mean/median marks, respectively) is significant at the .1%, 1%, 5%, and 10% level, respectively. Table 1 fully defines all the variables used.

49
Table 3 Pearson’s and Spearman’s Correlation Matrices of the Variables for all 600 Firm Years
Variable 1. 2. 3. 4. 5. 6. 7. 8. 9. 10. 11. 12. 13. 14. 15. 16. 17. 18.
1. CSR index .441*** .123** -.186*** .120** .193*** .196*** -.114** .079† .315*** -.040 .390*** .478*** .416*** -.035 .238*** .834*** .610*** 2. CG index .480*** .122** -.187*** .141*** .145*** .093* -.034 .259*** .323*** -.033 .589*** .190*** .210*** -.040 .166*** .453*** .094* 3. Board diversity .118** .109* -.049 .425*** .124** .133** .049 -.104** .103** .079† .008 -.045 -.046 .014 .363*** .116** .123** 4. Block ownership -.130** -.156*** -.031 -.021 -.257*** -.163*** .238*** -.049 .034 .109** .010 -.061 -.071† .088* -.042 -.125** -.095* 5. Board size .122** .131** .344*** -.002 .315*** .033 .139** -.067† .048 .125** -.094* .098* .001 -.152*** .644*** .132** .038 6. Government ownership .165*** .185*** .071† -.200*** .204*** .239*** .264*** .009 .005 .074† .106** .186*** .199*** -.300*** .521*** .206*** .060 7. Indep. directors .187*** .187*** .130** -.145*** .004 .109** .056 .048 -.066 -.023 .098* .099* .027 -.203*** .214*** .187*** .076† 8. Inst. ownership -.162*** -.044 .009 .367*** .129** .198*** .061 -.190*** -.055 .128** -.021 -.042 -.061 .011 .193*** -.120** -.053 9. Tobin’s Q .080† .224*** -.074† -.101** -.068† .010 .073†
.282*** .051 -.075† .220*** .138** .221*** -.016 .026 .088* .025
10. Audit firm size .336*** .353*** .106** .047 .070† .046 -.062 -.008 .093* .070† .251*** .227*** .054 -.079† .008 .362*** .148*** 11. Capital expenditure -.010 -.040 .095* .099* .103* .098* -.043 .111** -.058 .090* .036 -.008 .025 -.124** .299*** -.043 .037
12. CG commitee .384*** .557*** .018 .015 -.059 .069† .098* -.027 .197*** .251*** .047 .267*** .161*** -.195*** .041 .424*** .115** 13. Cross-listing .469*** .214*** -.053 -.048 .079† .157*** .100* .008 .114** .227*** .009 .267*** .315*** -.042 .201*** .482*** .052 14. CSR committee .391*** .216*** -.067† -.063 .008 .131** .036 -.085* .216*** .052 .071† .161*** .310*** .002 .187*** .421*** .041 15. Leverage -.038 -.033 .021 .077† -.090* -.131** -.212*** -.011 -.009 -.063 -.145*** -.206*** .027 .015 -.236*** -.044 -.028 16. Firm size .212*** .171*** .248** -.069† .602*** .407*** .230*** .164*** .008 .022 -.265*** .070† .184*** .254*** -.219*** .239*** .170*** 17. Predicted CSR index .816*** .448** .113** -.120** .126** .194*** .169*** -.116** .104** .358*** -.049 .435*** .468*** .410*** -.037 -.235*** .134*** 18. Regression residuals .574*** .087* .120** -.089* .034 .058 .070† -.044 .020 .133** .030 .112*** .043 .036 -.023 .168*** .116**
Notes: The bottom left half of the table contains Pearson’s parametric correlation coefficients, whereas the upper right half of the table shows Spearman’s non-parametric correlation coefficients. ***, **, *, and † denote correlation is significant at the .1%, 1%, 5%, and 10% level, respectively (two-tailed tests). Table 1 fully defines all the variables used.

50
Table 4 Effects of Corporate Governance on Corporate Social Responsibility Disclosures Based on Disclosure Indices
Dependent Variables ____________________________________________________________________________________ Indep. Variables CSR index CSR ind. CSR ind. BEE ind. Env. ind. Ethics ind. HIV ind. H&S ind. Social ind. (Model) (1) (2) (3) (4) (5) (6) (7) (8) (9)
Governance Index: CG index 0.203*** - 0.180*** 0.173*** 0.154*** 0.148*** 0.139*** 0.065 0.120*
(0.000) - (0.000) (0.000) (0.000) (0.000) (0.000) (0.240) (0.019) Ownership Variables: Block ownership - -0.170*** -0.162*** -0.151*** -0.146*** -0.064 -0.158*** -0.073 -0.142*** - (0.000) (0.000) (0.000) (0.000) (0.357) (0.000) (0.235) (0.000) Govt. ownership - 0.183*** 0.175*** 0.150*** 0.160*** 0.064 0.166*** 0.138*** 0.145*** - (0.000) (0.000) (0.000) (0.000) (0.203) (0.000) (0.000) (0.000) Inst. ownership - -0.115† -0.110† -0.174*** -0.120* -0.059 -0.125* -0.136** -0.169*** - (0.057) (0.064) (0.000) (0.028) (0.210) (0.033) (0.007) (0.000) Board Variables: Board diversity - 0.156*** 0.140*** 0.151*** 0.064 0.159*** 0.162*** 0.148*** 0.150*** - (0.000) (0.000) (0.000) (0.219) (0.000) (0.000) (0.000) (0.000) Board size - 0.108† 0.103† 0.137*** 0.158*** 0.045 0.132*** 0.161*** 0.129** - (0.059) (0.065) (0.000) (0.000) (0.360) (0.006) (0.000) (0.006) Indep. directors - 0.126* 0.098† 0.094† 0.129* 0.110† 0.122* 0.105† 0.120* - (0.040) (0.069) (0.072) (0.038) (0.054) (0.045) (0.060) (0.049) Control Variables: Audit fir. size 0.260*** 0.302*** 0.198*** 0.137*** 0.118* 0.215*** 0.196*** 0.298*** 0.269*** (0.000) (0.000) (0.000) (0.000) (0.040) (0.000) (0.000) (0.000) (0.000) Cap. exp. -0.042 -0.050 -0.029 -0.036 -0.040 -0.033 -0.025 -0.050 -0.039 (0.308) (0.285) (0.458) (0.447) (0.281) (0.492) (0.640) (0.174) (0.427) CG comtte. 0.171*** 0.310*** 0.196*** 0.219*** 0.460*** 0.116* 0.265*** 0.320*** 0.149* (0.000) (0.000) (0.000) (0.000) (0.000) (0.048) (0.000) (0.000) (0.036) Cross-listing 0.432*** 0.426*** 0.430*** 0.568*** 0.240*** 0.190*** 0.347*** 0.158* 0.489*** (0.000) (0.000) (0.000) (0.000) (0.000) (0.000) (0.000) (0.041) (0.000) CSR comtte. 0.285*** 0.349*** 0.310*** 0.573*** 0.218*** 0.286*** 0.219*** 0.480*** 0.394*** (0.000) (0.000) (0.000) (0.002) (0.000) (0.000) (0.000) (0.000) (0.000) Leverage -0.030 -0.041 -0.032 -0.056 -0.063 -0.018 -0.047 -0.069 -0.070
(0.659) (0.387) (0.475) (0.181) (0.139) (0.795) (0.296) (0.192) (0.164) Firm size 0.210*** 0.243*** 0.239*** 0.150* 0.237*** 0.244*** 0.218*** 0.275*** 0.263*** (0.000) (0.000) (0.000) (0.026) (0.000) (0.000) (0.000) (0.000) (0.000) Risk 0.038 0.050 0.042 0.029 0.065 0.027 0.020 0.067 0.046
(0.470) (0.354) (0.376) (0.503) (0.178) (0.529) (0.692) (0.174) (0.380) Sales growth 0.018 0.037 0.025 0.023 0.031 0.050 0.049 0.057 0.045 (0.740) (0.459) (0.510) (0.520) (0.462) (0.241) (0.363) (0.219) (0.296) Industry Included Included Included Included Included Included Included Included Included Year Included Included Included Included Included Included Included Included Included Constant 2.975*** 3.984*** 3.913*** 2.750*** 2.368*** 2.637*** 2.526*** 2.402*** 2.619*** (0.000) (0.000) (0.000) (0.000) (0.000) (0.000) (0.000) (0.000) (0.000) Durbin-W. 2.072 2.191 2.206 2.183 1. 895 1.827 1.960 2.054 1.998 F-value 8.316*** 9.780*** 9.998*** 9.640*** 6.670*** 5.509*** 7.473*** 8.140*** 7.871*** Adj. R2 0.475 0.490 0.496 0.482 0.357 0.249 0.378 0.433 0.384 N 600 600 600 600 600 600 600 600 600 Notes: P-values are in parentheses. Following Peterson (2009), the coefficients are estimated by using the robust double clustered standard errors technique along both industry and year dimensions. ***, **, *, and † denote correlation is significant at the .1%, 1%, 5%, and 10% level, respectively. Table 1 fully defines all the variables used.

51
Table 5 Regression Analyses of the Effects of Corporate Social Responsibility Disclosures on Corporate Financial Performance
Dependent Variables ____________________________________________________________________________________ Indep. Variables Tobin’s Q Tobin’s Q Tobin’s Q Tobin’s Q Tobin’s Q Tobin’s Q Tobin’s Q Tobin’s Q Tobin’s Q (Model) (1) (2) (3) (4) (5) (6) (7) (8) (9)
CSR Variables: CSR index 0.033 - 0.136*** - 0.138*** - 0.140*** - 0.134***
(0.180) - (0.000) - (0.000) - (0.000) - (0.000) CSR count - 0.028 - 0.122* - 0.133*** - 0.137*** - - (0.195) - (0.013) - (0.000) - (0.000) - Interaction Variables: Governance Index: CSR*CG indices - - 0.190*** 0.184*** - - 0.195*** 0.191*** 0.186***
- - (0.000) (0.000) - - (0.000) (0.000) (0.000) Ownership Variables: CSR*Block own. - - - - -0.036 -0.020 -0.038 -0.029 -0.032 - - - - (0.374) (0.463) (0.367) (0.408) (0.380) CSR*Govt. own. - - - - 0.186*** 0.172*** 0.188*** 0.176*** 0.179*** - - - - (0.000) (0.000) (0.000) (0.000) (0.000) CSR*Inst. own. - - - - -0.035 -0.030 -0.040 -0.034 -0.037 - - - - (0.363) (0.454) (0.352) (0.436) (0.351) Board Variables: CSR*Board div. - - - - 0.182*** 0.178*** 0.185*** 0.182*** - - - - - (0.000) (0.000) (0.000) (0.000) - CSR*Board size - - - - 0.045 0.036 0.050 0.045 - - - - - (0.252) (0.335) (0.239) (0.314) - CSR*Ind. dtors. - - - - 0.121*** 0.113* 0.125*** 0.120*** - - - - - (0.000) (0.014) (0.000) (0.000) - Control Variables: Audit fir. size 0.182*** 0.176*** 0.173*** 0.160*** 0.175*** 0.164*** 0.180*** 0.171*** 0.168*** (0.000) (0.000) (0.000) (0.000) (0.000) (0.000) (0.000) (0.000) (0.000) Cap. exp. -0.036 -0.030 -0.044 -0.040 -0.045 -0.042 -0.050 -0.044 -0.042 (0.200) (0.258) (0.195) (0.223) (0.192) (0.220) (0.186) (0.213) (0.198) CG comtte. 0.040 0.037 0.046 0.040 0.050 0.043 0.054 0.047 0.050 (0.234) (0.253) (0.225) (0.242) (0.210) (0.220) (0.198) (0.216) (0.203) Cross-listing 0.150*** 0.144*** 0.156*** 0.149*** 0.163*** 0.155*** 0.167*** 0.160*** 0.162*** (0.000) (0.000) (0.000) (0.000) (0.000) (0.000) (0.000) (0.295) (0.000) Leverage -0.035 -0.030 -0.038 -0.032 -0.041 -0.036 -0.049 -0.040 -0.043
(0.324) (0.336) (0.316) (0.330) (0.310) (0.325) (0.298) (0.319) (0.305) Firm size -0.165*** -0.160*** -0.171*** -0.166*** -0.175*** -0.169*** -0.178*** -0.173*** -0.170*** (0.000) (0.000) (0.000) (0.000) (0.000) (0.000) (0.000) (0.000) (0.000) Risk 0.154*** 0.146*** 0.160*** 0.152*** 0.164*** 0.156*** 0.168*** 0.160*** 0.163*** (0.000) (0.000) (0.000) (0.000) (0.000) (0.000) (0.000) (0.000) (0.000) Sales growth 0.220*** 0.214*** 0.226*** 0.218*** 0.229*** 0.224*** 0.233*** 0.220*** 0.216*** (0.000) (0.000) (0.000) (0.000) (0.000) (0.000) (0.000) (0.000) (0.000) Industry Included Included Included Included Included Included Included Included Included Year Included Included Included Included Included Included Included Included Included Governance Index, Ownership and Board Variables: CG Variables - - CGI CGI Board/Own. Board/Own. Included Included CGI/Own. Constant 0.785*** 0.780*** 0.794*** 0.786** 0.803*** 0.790*** 0.814*** 0.802*** 0.789*** (0.000) (0.000) (0.000) (0.002) (0.000) (0.000) (0.000) (0.000) (0.000) Durbin-W. 2.084 2.036 2.110 2.105 2.185 2.193 2.246 2.216 2.205 F-value 8.546*** 8.496*** 8.787*** 8.669*** 9.510*** 9.498*** 9.986*** 9.884*** 9.730*** Adj. R2 0.467 0.463 0.475 0.470 0.490 0.486 0.543 0.539 5.280 N 600 600 600 600 600 600 600 600 600 Notes: P-values are in parentheses. Following Peterson (2009), the coefficients are estimated by using the robust double clustered standard errors technique along both industry and year dimensions. ***, **, *, and † denote correlation is significant at the .1%, 1%, 5%, and 10% level, respectively. Table 1 fully defines all the variables used.
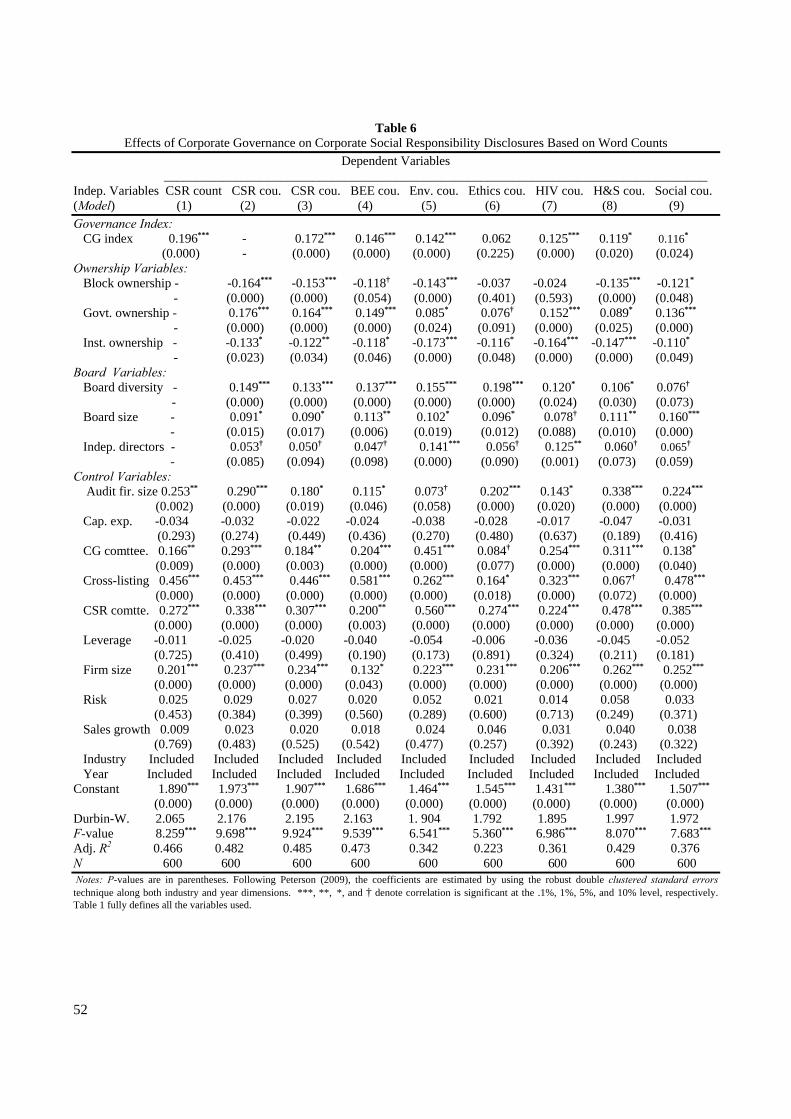
52
Table 6
Effects of Corporate Governance on Corporate Social Responsibility Disclosures Based on Word Counts
Dependent Variables ____________________________________________________________________________________ Indep. Variables CSR count CSR cou. CSR cou. BEE cou. Env. cou. Ethics cou. HIV cou. H&S cou. Social cou. (Model) (1) (2) (3) (4) (5) (6) (7) (8) (9)
Governance Index: CG index 0.196*** - 0.172*** 0.146*** 0.142*** 0.062 0.125*** 0.119* 0.116*
(0.000) - (0.000) (0.000) (0.000) (0.225) (0.000) (0.020) (0.024) Ownership Variables: Block ownership - -0.164*** -0.153*** -0.118† -0.143*** -0.037 -0.024 -0.135*** -0.121* - (0.000) (0.000) (0.054) (0.000) (0.401) (0.593) (0.000) (0.048) Govt. ownership - 0.176*** 0.164*** 0.149*** 0.085* 0.076† 0.152*** 0.089* 0.136*** - (0.000) (0.000) (0.000) (0.024) (0.091) (0.000) (0.025) (0.000) Inst. ownership - -0.133* -0.122** -0.118* -0.173*** -0.116* -0.164*** -0.147*** -0.110* - (0.023) (0.034) (0.046) (0.000) (0.048) (0.000) (0.000) (0.049) Board Variables: Board diversity - 0.149*** 0.133*** 0.137*** 0.155*** 0.198*** 0.120* 0.106* 0.076† - (0.000) (0.000) (0.000) (0.000) (0.000) (0.024) (0.030) (0.073) Board size - 0.091* 0.090* 0.113** 0.102* 0.096* 0.078† 0.111** 0.160*** - (0.015) (0.017) (0.006) (0.019) (0.012) (0.088) (0.010) (0.000) Indep. directors - 0.053† 0.050† 0.047† 0.141*** 0.056† 0.125** 0.060† 0.065† - (0.085) (0.094) (0.098) (0.000) (0.090) (0.001) (0.073) (0.059) Control Variables: Audit fir. size 0.253** 0.290*** 0.180* 0.115* 0.073† 0.202*** 0.143* 0.338*** 0.224*** (0.002) (0.000) (0.019) (0.046) (0.058) (0.000) (0.020) (0.000) (0.000) Cap. exp. -0.034 -0.032 -0.022 -0.024 -0.038 -0.028 -0.017 -0.047 -0.031 (0.293) (0.274) (0.449) (0.436) (0.270) (0.480) (0.637) (0.189) (0.416) CG comttee. 0.166** 0.293*** 0.184** 0.204*** 0.451*** 0.084† 0.254*** 0.311*** 0.138* (0.009) (0.000) (0.003) (0.000) (0.000) (0.077) (0.000) (0.000) (0.040) Cross-listing 0.456*** 0.453*** 0.446*** 0.581*** 0.262*** 0.164* 0.323*** 0.067† 0.478*** (0.000) (0.000) (0.000) (0.000) (0.000) (0.018) (0.000) (0.072) (0.000) CSR comtte. 0.272*** 0.338*** 0.307*** 0.200** 0.560*** 0.274*** 0.224*** 0.478*** 0.385*** (0.000) (0.000) (0.000) (0.003) (0.000) (0.000) (0.000) (0.000) (0.000) Leverage -0.011 -0.025 -0.020 -0.040 -0.054 -0.006 -0.036 -0.045 -0.052
(0.725) (0.410) (0.499) (0.190) (0.173) (0.891) (0.324) (0.211) (0.181) Firm size 0.201*** 0.237*** 0.234*** 0.132* 0.223*** 0.231*** 0.206*** 0.262*** 0.252*** (0.000) (0.000) (0.000) (0.043) (0.000) (0.000) (0.000) (0.000) (0.000) Risk 0.025 0.029 0.027 0.020 0.052 0.021 0.014 0.058 0.033
(0.453) (0.384) (0.399) (0.560) (0.289) (0.600) (0.713) (0.249) (0.371) Sales growth 0.009 0.023 0.020 0.018 0.024 0.046 0.031 0.040 0.038 (0.769) (0.483) (0.525) (0.542) (0.477) (0.257) (0.392) (0.243) (0.322) Industry Included Included Included Included Included Included Included Included Included Year Included Included Included Included Included Included Included Included Included Constant 1.890*** 1.973*** 1.907*** 1.686*** 1.464*** 1.545*** 1.431*** 1.380*** 1.507*** (0.000) (0.000) (0.000) (0.000) (0.000) (0.000) (0.000) (0.000) (0.000) Durbin-W. 2.065 2.176 2.195 2.163 1. 904 1.792 1.895 1.997 1.972 F-value 8.259*** 9.698*** 9.924*** 9.539*** 6.541*** 5.360*** 6.986*** 8.070*** 7.683*** Adj. R2 0.466 0.482 0.485 0.473 0.342 0.223 0.361 0.429 0.376 N 600 600 600 600 600 600 600 600 600 Notes: P-values are in parentheses. Following Peterson (2009), the coefficients are estimated by using the robust double clustered standard errors technique along both industry and year dimensions. ***, **, *, and † denote correlation is significant at the .1%, 1%, 5%, and 10% level, respectively. Table 1 fully defines all the variables used.

53
Table 7 Sensitivity Analyses of the Relationships among Corporate Financial Performance, Governance and Social Responsibility
Dependent Variables ____________________________________________________________________________________ Indep. Variables CSR index Q Q Lagged(Q) Stage 1(CSR) Stage 2(Q) ROA TSR Q Q (Model) (1) (2) (3) (4) (5) (6) (7) (8) (9) (10)
CSR Variables: CSR index - 0.138*** 0.135*** 0.130*** - - 0.158*** 0.125*** - - - (0.000) (0.000) (0.000) - - (0.000) (0.000) - - Pred. CSR index - - - - - 0.175*** - - - - - - - - - (0.000) - - - - Governance Index CG index 0.178*** 0.185*** 0.180*** 0.176*** 0.182*** 0.190*** 0.189*** 0.130*** 0.128*** 0.125*** (0.000) (0.000) (0.000) (0.000) (0.000) (0.000) (0.000) (0.000) (0.000) (0.000) Ownership Variables: Block ownership -0.169*** -0.030 -0.026 -0.034 -0.168*** - -0.060 -0.024 - -0.016 (0.000) (0.390) (0.397) (0.382) (0.000) - (0.125) (0.385) - (0.539) Block ownership2 -0.023 -0.013 - - - - - - - - (0.465) (0.596) - - - - - - - - Govt. ownership 0.171*** 0.173*** 0.182*** 0.178*** 0.182*** - 0.127*** 0.116** - 0.095† (0.000) (0.000) (0.000) (0.000) (0.000) - (0.000) (0.008) - (0.064) Inst. ownership -0.119* -0.035 -0.032 -0.030 -0.114* - -0.046 -0.025 - -0.030 (0.050) (0.378) (0.383) (0.389) (0.020) - (0.229) (0.390) - (0.385) Iinst. ownership2 -0.034 -0.029 - - - - - - - - (0.376) (0.394) - - - - - - - - Board Variables: Board diversity 0.143*** 0.170*** 0.165*** 0.162*** 0.195*** - 0.173*** 0.140*** - 0.132*** (0.000) (0.000) (0.000) (0.000) (0.000) - (0.000) (0.000) - (0.000) Board size 0.110* 0.043 0.040 0.036 0.108† - 0.050 0.023 - 0.029 (0.048) (0.247) (0.253) (0.264) (0.056) - (0.216) (0.410) - (0.423) Board size2 0.032 0.036 - - - - - - - - (0.474) (0.260) - - - - - - - - Indep. directors 0.109† 0.115* 0.110† 0.103† 0.103† - 0.159*** 0.145*** - 0.116* (0.054) (0.049) (0.054) (0.061) (0.060) - (0.000) (0.000) - (0.044) Additional Control Variables: Advertising exp. - - 0.165*** - -0.040 - 0.128*** 0.163*** - - - - (0.000) - (0.396) - (0.000) (0.000) - - R&D exp. - - -0.048 - 0.190*** - -0.146*** -0.040 - - - - (0.249) - (0.000) - (0.000) (0.256) - - Interactions - Included Included Included - CSR*CGI Included Included - - Controls Included Included Included Included Included Included Included Included Included Included Constant 3.643*** 0.820*** 0.835*** 0.746*** 3.753*** 0.745*** 4.620*** -0.095 0.489*** 0.495*** (0.000) (0.000) (0.000) (0.000) (0.000) (0.000) (0.000) (0.947) (0.000) (0.000) Durbin-W. 2.135 2.254 2.267 2.183 2.148 2.029 2.269 2.010 1.853 1.936 F-value 9.584*** 9.975*** 9.997*** 9.624*** 8.895*** 8.786*** 9.968*** 8.687*** 4.950*** 5.359*** Adj. R2 0.469 0.539 0.546 0.520 0.479 0.475 0.553 0.460 0.296 0.378 N 600 600 600 525 600 600 600 600 600 600 Notes: P-values are in parentheses. Following Peterson (2009), the coefficients are estimated by using the robust double clustered standard errors technique along both industry and year dimensions. ***, **, *, and † denote correlation is significant at the .1%, 1%, 5%, and 10% level, respectively. Table 1 fully defines all the variables used.