Embed Size (px)
Citation preview

USER MANUAL
CENTRALIZED COA MIS SYSTEM (CCMIS)
Ver.: Beta
An Organization of the Ministry of Railways
(Govt. Of India)
Chanakyapuri, New Delhi -110021
Phone:-24104525, 24106717
Fax:-26877893
CENTRE FOR RAILWAY
INFORMATION SYSTEMS

Preface
___________________________________________________________
The User Manual contains all the essential information for the user to make full use of the Centralized MIS system for COA. It is very important document as it provides guidance to all
the users of the application. This manual includes a description of the application
functionalities and capabilities and alternate modes of operation, and step-by-step procedures
for application access and use. This document is separated menu wise. The manual includes screen shots, illustrations and description of all the modules of Centralized MIS system.
Centralized MIS System for COA (Control Office Application) is completely centralized
repository of divisions COA data which enable the user to view real time charts and various reports of any zone/division which is available in intranet network.The application is
facilitated with various reports and visual data in the form of pie chart and other interactive
forms which shall be used for various analysis purpose
This document has been made with true efforts of the COA team in representing accurate
features of the CCMIS System. However, users are requested to indicate errors and send
suggestions, if any to CRIS on mail id [email protected] for necessary corrective
action. Amendments to this document due to any enhancement in the application or on account of addition of new features as per Railways' requirements will be updated from time
to time and made available to the users.
I hope this document prepared by the COA team of CRIS with lot of efforts, dedication and sincerity to provide the best guidance to CCMIS users will be quite helpful and informative
to all the officers, decision makers and staff as users of COA and allied systems.
Rajiv Gupta
IRTS
GM/COA, CRIS
April 2021.

CCMIS SYSTEM ARCHITECTURE DIAGRAM
Central MIS stores COA data received on a real-time basis from all 69 divisions at central
repository through ESB pertaining to train movements and other important modules
like Maintenance block, Caution order and Unusual. It facilitates users to view the current chart and backdated chart of any Board of any division and also various reports as detailed in
below sections.
(Centralized MIS Chart)
An architecture view of Centralized charting system as below
Currently centralized application is an intranet application which is developed using web
based Technology - HTML5, JQuery, D3.js and deployed in IIS server and database as
PostgreSQL which is in cloud platform. The whole development is done using Visual Studio
2015 as Integrated Development Environment (IDE).Since the technology used as client side the overall server load is reduced for concurrent users accessing the data.

Table of Contents
1. INTRODUCTION 1.1 Introduction of CCMIS
1.2 Intended Audience
1.4 Benefits
2. USER LOGIN
3.DASH BOARD VIEW
1.1 Home View
4. CURRENT CHART
5. REPORTS
5.1 TRAIN MOVEMENT REPORTS
5.1.1 M1- Train Running Report
5.1.2 M2 - Running of Passenger Trains
5.1.3 M3 - Train Movement Summary
5.1.4 M4 - Data Logger Station Summary
5.1.5 M5 - Hours of Run
5.1.6 M6 - LE Originating from Division
5.1.7 M7 - Train Details Type wise
5.1.8 M8 - Owning Division IC Station.
5.2 CAUTION ORDER
5.2.1 C1 - All Caution Order
5.3 BLOCK
5.3.1 B1 - All Block
5.4 UNUSUAL
5.4.1 U1 - All Unusual
5.5 MISCELLANEOUS
5.5.1 MS1 – User Login Summary
5.6 IR REPORTS
5.6.1 IR1 – TSR Summary
5.6.2 IR2 – Trains between two stations
5.6.3 IR2 – Data Logger Data not received
6. MANAGE PROFILE.
7. CONTACT US
8. LOGOUT

1 INTRODUCTION – CCMIS
1.1 Introduction to Centralized MIS system for COA.
COA application is a division based distributed window application so it is available
over the LAN to the divisional user only. Other Divisional users, Zonal users and Board
users outside the LAN don't have facility to access the COA application. To do away the problem of window application a Centralized web application i.e. Central MIS has been
designed and developed which is available to all users over the intranet. This application
shall be accessed through the link http://10.60.200.172/CCM in FOIS intranet.
1.2 Intended Audience
Operations Managers
Train Controllers
Key functionaries of sister departments.
1.3 Benefits:
Any authorized officials can view reports and real time chart of any
zone/divisions.
Central repository of all division train movement.
Various analytical data can be derived in due course of time.
2 USER LOGIN
This form is the take off point to Centralized MIS system. Once the user is authenticated, has
the privileges to view dashboard of CCMIS system and can access various reports.
Action Flow:
User Id: User can enter a valid User ID in the field provided
Password: User can enter a valid password.
Captcha Code: User has to enter captcha code. Once the User enters User name, Password and Captcha code he can press login button
which will validate the user and provide the access to view the dashboard and other reports

(Login Screen)
3 DASH BOARD VIEW
1.1 Home View After user authentication the user is taken to the dashboard page consisting of the details of the selected Zone and Division.
COA CENTRALISED MIS
DIVISION SELECTED for eg. (MAS)
Percentage summary of trains updated through
RTIS and REMLOT is shown at the left upper
of the screen (in RED colour).
The active number of caution orders in force
in the division (displayed in turquoise
green).On clicking the active caution order
button which will lead to caution order details display report C1.
The active number of blocks in force is
displayed in upper central part of the web page
(displayed in greenish blue). On clicking the
active blocks button which leads to blocks details display report B1.
The number of unusual if any in the division
are displayed at the right top of the screen
(displayed in orange).

Train Details (Today)
A horizontal bar graphs depicts the trains running details (today) under the caption of
Goods,Others and Pass.
o Under All (radio button): All the trains run on date with types viz. Goods,
others and Passengers are displayed with their total. On clicking the trains type
it takes to TRAIN DETAILS TYPEWISE REPORT (M7)
Under all trains radio button other combinations of train Run, Right
time, Late and Cancel can also fetch different result based on the
selection.
o Under PASS (Radio button): All the passenger trains run on today’s account is
displayed under various type of passenger segment viz, Supr, Exp, HSP,
Memu, SHAD,RAJD etc.
Under PASS radio button other combinations of train Run, Right time,
Late and Cancelled can also fetch different result based on the
selection.

o Under Goods (radio button): All the Goods trains run on today’s account is
displayed under various type of goods trains viz,LBCN, EBCN,
EBTPN,LBTPN, LBOBR etc.
Under Goods radio button other combinations of train Run, Right time,
Late and Canceled can also fetch different result based on the
selection.

o Under OTHRS (radio button): All the trains other than Passenger and goods
trains run on today’s account is displayed under various type of others trains
viz, TW,TRMC,Othr, LE, MATL,EYRA etc.
Under OTHRS radio button other combinations of train Run, Right
time, Late and Canceled can also fetch different result based on the
selection.
Movement from Different Sources (Today) The total reporting percentage of trains from different sources is depicted by doughnut pie
chart.
Total Percentage: 90.84 %
1. Controller (65.7 %)
2. Data logger (1%)
3. RTIS REMLOT (22.8 %)
4. TSR (0.1%)
5. Not Reported (9.2 %)

Total Caution Order (Department Wise) The total active caution order department wise in the division is depicted as doughnut pie
chart broadly categorized as
1. Imposed
2. Cancelled
3. Active

Total Blocks (Department Wise) Total blocks in the division Imposed, Cancelled and Active blocks is depicted as pie chart.
Block Cancelled
Block
Imposed
today
Block Active


4 CURRENT CHART
Charts are broadly categorized under current and previous chart. Displayed chart is current chart of MAS division. The option of viewing charts is summarized below.
1.
Radio button helps in selection of current and previous charts (archived)
2.
After the initial selection of Railways after the login process the selection of division
to be done by clicking the division and board respectively.
3.
The system date is by default is selected and from time to be selected as the -To time- is the current system time
4.
The application has the facility to zoom in for cluttered trains or for better clarity
5.

Trains displayed in the chart can be searched for train run details in the chart.
6.
(i) Running Train on Chart and
(ii)Unattached GPS Loco Details

7.
The line thickness is configurable through the above tool.
8.
The background color can be selected through the above menu.
9.
To show the chart may click the show button.
10. For displaying the direction of trains Both, UP and DOWN parameter may be
selection in the given section.
11. For displaying a particular type of trains the following selection may be done.
12.
For displaying the speed of Train, Gain/Loss or Unusual or saving the chart the above tools may be used.

5 REPORTS – CCMIS
5.1 TRAIN MOVEMENT REPORTS
Various details of a Train’s movement in a division is captured in the following reports.
5.1.1 M1 - Train Running Report
This report shows the details of selected train’s run in the selected division.
Action Flow:
Report can be viewed for Passenger Trains, Goods Trains and other trains The user has to input the date for which the report is required.
The user has to select a Train from the list of Trains shown in the dropdown list to
view the details of the particular train click show to display the details.
Based on the filters selected the details will be displayed.
(When no filter is selected – All details of the train will be displayed)

Less than_ Schedule Halt: The user can select to view the details of the train selected
where the train stopped at a station less than the actual halt time provided in the Train schedule.
Greater than_ Schedule Halt: The user can select to view the details of the train
selected where the train stopped at a station more than the actual halt time provided in the Train schedule.
Run in Block section: All Details of the trains without any filters by selecting the
Blank

Less Than Bare Runtime: The User can select to view the details of the train selected where the train took less than the required BRT in a block section.
Greater Than Bare Runtime: The User can select to view the details of the train
selected where the train took more than the required BRT in a block section.
Note: The above filters can be selected by clicking on available on the left top
corner of the menu.
User can select the required columns to display by clicking on symbol available on the left top corner of the menu.

5.1.2 M2 - Running of Passenger Trains
This Report shows the details of Running of Passenger carrying trains based on the
type of the train.
Action Flow
The user has to select a date range for which the report is required.
Train Type for which details are required, has to be selected from the dropdown list. The user has to click Show button to get the details
The required fields for view can be selected by clicking

The user can view the pie chart by clicking on
User can view linear chart by clicking

5.1.3 M3 – Train Movement Summary
This report shows the Summary of source of entries received
Action Flow:
User has to select the date range for which the report is required.
User can view pie chart by clicking on

User can view box chart by clicking on and by selecting the source of the
entry
User can view the required columns by clicking on
5.1.4 M4 - Data Logger Station Summary

This report displays station wise summary of data received from all the sources viz., Controller, Data logger, GPS, TSR and not reported.
Action Flow:
Date range for which report is required has to be selected by the user. On clicking the show button report is displayed.
User can view details for all the stations in which Data logger is installed in a
particular Division without selecting any station.
Data pertaining to a particular station can be viewed by selecting the station from the
dropdown.

User can view details of data received from all the sources for stations in which Data
logger is installed in a particular Division without selecting any source
Data received from a particular source can be viewed by selecting the source from the
dropdown.
User can view box chart by clicking . It can be viewed for by selecting the
source of data

User can select the columns to be displayed by clicking on
5.1.5 M5 - Hours of Run
This report displays details about all the trains run in a Board or section including
Loco details, Hours of run in the particular board or section. Action Flow:
The user needs to select the option between Board wise and Station wise.
Date for which the details are required is to be selected. On clicking show button details will be displayed.
Board wise Details: While filtering, if blank is selected, details of all trains run on the
division will be displayed.

To display details for a particular board, the user has to select the Board from the
dropdown list.
Section wise Details: While filtering, if blank is selected, details of all trains run on
the division will be displayed
To display details for a particular Section, the user has to select the section from the dropdown list.

Total hours of train run on a particular date over the division can be viewed by
clicking in the form of box chart.
User can select the columns to be displayed by clicking on

User can view Train Type wise Average speed of the trains on a section by clicking
5.1.6 M6 - LE Originating from Division
The report shows the details of Light Engine movement originated from the division concerned.
Action Flow:
User needs to select the date range for which report is required
The Report can be seen originating station wise or destination station wise Report can also be viewed for LE trains run between two stations.

User can view LEs originated from a particular station
User can view LEs by choosing the Destination station

User can view No of trains originating station wise or destination station wise by
clicking
User can select to view only required fields by clicking on
User can view day wise LEs run by clicking

5.1.7 M7 - Train Details Type wise
This Report shows the details of the trains run in a particular division Type wise.
Action Flow: User needs to select Type of the train Viz., Passenger, Goods or Others, for which
details are required.
User can view the report for all train Run on the division; Right Time arrived Trains,
Late arrived Trains and cancelled Trains. Date of Train in the division should be selected.
On pressing Show button report will be displayed.
The Report can be viewed Train Sub Type wise by selecting the type from the Drop
Down list.
Type of train and Status of the train need to be selected.

User can view only the required fields by clicking
User can select blank from the drop down list to view all the trains
User can select a subtype to view the details of trains pertaining to the type
5.1.8 M8 – Owning Division IC Station
This Report shows the details of trains owned by division at IC Station.
Action Flow:
User needs to select Station from the list of IC Station of Division shown in the dropdown list, for which details are required.
Schedule Date for which the details are required is to be selected.
On pressing Show button report will be displayed.
The Report can be seen Train category wise or Reporting Status wise
Train category and Reporting status needs to be selected.

User can view only the required fields by clicking
“Clear Filter” button is provided to clear the filter.

There are various options to take the output in the required format by the choosing the options as shown below:-
Copy to clip board.
Data export to Excel.
Data export to CSV.
Data export to PDF.
Print.

5.2 CAUTION ORDER Caution Order is an order advising special conditions and restrictions in effect on the
section of track that the train is about to enter.
5.2.1 C1 - All Caution Order
This report shows all the active/completed cautions on a particular section.
Action Flow.
For generating report of caution for a particular duration User shall select option for “Duration” and input “From date” and “To date” for which the details of the cautions
are required.
For generating report of caution which are active, User shall select “Active” option.
Once the desired options and parameters are entered, press “Show” button to display
the data.
Based on the inputs reports with relevant details will be displayed as shown below:-
(Based on “Duration” Option)
(Based on “Active” Option)

Once the data displayed, various filter options are available. The user has to select the
required option from the drop down menu to get required output.
The report for various filter options are shown below :-
(Filter for “Board”)
(Filter for “Block section”)

(Filter for “Department wise”)
(Filter for “Direction”)
(Filter for “Duration month wise”)

(Filter for “Status (open/close)”)
On selecting the option shown in the screen, user can view the total caution status.
User can view the caution count with mouse roll-over. Further filter is available to select imposed/cancelled/active cautions as shown below:-

On selecting the option shown in the screen, user can further customise the report as
per the required fields by selecting/deselecting the required column as shown below:-

On selecting the option shown in the screen, user can view the total caution status.
Further filter is available to select cautions on a particular station/block section as shown below:-
On selecting the option shown in the screen, user can view the longest caution imposed .Caution imposed for more than 365 days will reflects in red colour as shown below:-

On selecting the option shown in the screen, user can view the pie chart summary for
all cautions section wise in a division as shown below:-
On selecting the option shown in the screen, user can view the all cautions speed wise
in a division and can be filter based on board wise and section wise. Options are also
available to filter direction (both/up/down) and passenger/goods as shown below:-

“Clear Filter” button is provided to clear the filter.
There are various options to take the output in the required format by the choosing the
options as shown below:-
Copy to clip board.
Data export to Excel.
Data export to CSV.
Data export to PDF.
Print.
5.3 BLOCK Blocks are taken on a particular section/block section/station for performing temporary Engineering/OHE work. This menu gives the detail of reports regarding line blocks/power
blocks.

5.3.1 B1 - All Block
This report shows all the active/completed blocks on a particular section. Action Flow.
For selection of blocks for a particular duration User shall select option for
“Duration” and input “From date” and “To date” for which the details of the blocks
are required.
For selection of blocks which are active, User shall select “Active” option.
Once the desired options and parameters are entered, press “Show” button to display the data.
Based on the inputs reports with relevant details will be displayed as shown below:-
(Based on “Active” Option)
(Based on “Duration” Option)
Once the data displayed, various filter options are available. The user has to select the required option from the drop down menuto get required output.
The report for various filter options are shown below :-

(Filter for “Board”)
(Filter for “Station”)
(Filter for “Block section”)

(Filter for “Direction”)
(Filter for “Type of Blocks”)

On selecting the option shown in the screen, user can furthercustomise the report as per
the required fields by selecting/deselecting the required column as shown below:-

On selecting the option shown in the screen, user can view the top ten blocks availed.
Blocks which are more than 72 hours will be in red colour as shown below:-
On selecting the option shown in the screen, user can view the pie chart summary for
all blocks type wise in a division. Further filter is available to select blocks on a particular
board as shown below:-

On selecting the option shown in the screen, user can view the total blocks availed.
Further filter is available to select blocks on a particular station/block section as shown below:-
There are various options to take the output in the required format by the choosing the
options as shown below:-
Copy to clip board.
Data export to Excel.
Data export to CSV.
Data export to PDF.
Print.

5.4 UNUSUAL Unusual incident is failure or a special occurrence which is obstructing the movement of
traffic.
5.4.1 U1 - All Unusual This report shows all the unusual details on a particular section.
Action Flow.
For displaying the report of unusual for a particular duration User shall select option
for “Duration” and input “From date” and “To date” for which the details of the unusual are required.
Once the desired options and parameters are entered, press “Show” button to display
the data.
Based on the inputs reports with relevant details will be displayed as shown below:-
Once the data displayed, various filter options are available. The user has to select the
required option from the drop down menu to get required output.

The report for various filter options are shown below:-
(Filter for “Board”)
(Filter for “Station”)
(Filter for “Block section”)

(Filter for “Failure Type”)
(Filter for “Reason of Failure”)

On selecting the option shown in the screen, user can further customise the report as per the required fields by selecting/deselecting the required column as shown below:-
On selecting the option shown in the screen, user can view the top reason of unusual as shown below:-

On selecting the option shown in the screen, user can view the total unusual status.
Further filter is available to select unusual on a particular station/block section as shown below:-
On selecting the option shown in the screen, user can view all unusual type wise. User can view the unusual count with mouse roll-over. Further filter is available to select board
wise unusual as shown below:-

On selecting the option shown in the screen, user can view human/cattle run over. Filter
is available to select options for Human/Cattle run over unusual as shown below:-
On selecting the option shown in the screen, user can view most reason for unusual on
day wise. Filter is available to select options for failure type as shown below:-

“Clear Filter” button is provided to clear the filter.
There are various options to take the output in the required format by the choosing the
options as shown below:-
Copy to clip board.
Data export to Excel.
Data export to CSV.
Data export to PDF.
Print.
5.5 MISCELLANEOUS 5.5.1 MS1 – User Login Summary
This report will show the summary of user login details for a particular day.
Action Flow.
For displaying the user summary, User shall select input “date” for which the details are required.
Once the desired date is entered, press “Show” button to display the data.
Based on the inputs reports with relevant details will be displayed as shown below:-

On selecting the option shown in the screen, user can further customise the report as
per the required fields by selecting/deselecting the required column as shown below:-
There are various options to take the output in the required format by the choosing the options as shown below:-
Copy to clip board.
Data export to Excel.
Data export to CSV.
Data export to PDF.
Print.

5.6 IR Reports This section contains different types miscellaneous reports of IR.
5.6.1 IR1 – TSR Summary, This report shows status summary of TSR locations with
respect to Train Movement from all sources.
Action Flow.
For generating report of TSR Summary for a particular duration User shall select
option for input “From date” and “To date” for which the details of the TSR summary
are required.
Based on the inputs reports with relevant details will be displayed as shown below:-
(Based on “From date” and “To date” Option)
On selecting the option shown in the screen, user can further customise the report as
per the required fields by selecting/deselecting the required column as shown below:-

On selecting the option shown in the screen, user can view the TSR Summary. Further
filter is available to select Zone wise as shown below:-
5.6.2 IR2 – Trains between two stations, this report shows train details between two Origin and Destination stations along with date.
Action Flow.
For generating report of Train between two stations User shall select “Origin Station and Destination Station”
Based on the inputs reports with relevant details will be displayed as shown below:-
(Based on “Origin Station” and “To Destination” Option)

(Based on filter of “Train Type” Option)
On selecting the option shown in the screen, user can further customise the report as
per the required fields by selecting/deselecting the required column as shown below:-

There are various options to take the output in the required format by the choosing the
options as shown below:-
Copy to clip board.
Data export to Excel.
Data export to CSV.
Data export to PDF.
Print.
5.6.3 IR3 – Data Logger-Data not received from more than three days, this report shows data
logger locations for which data has not been received for more than three days.

Data pertaining to a particular Zone can be viewed by selecting the Zone from the
dropdown.
Data pertaining to a particular Division can be viewed by selecting the Division from
the dropdown.
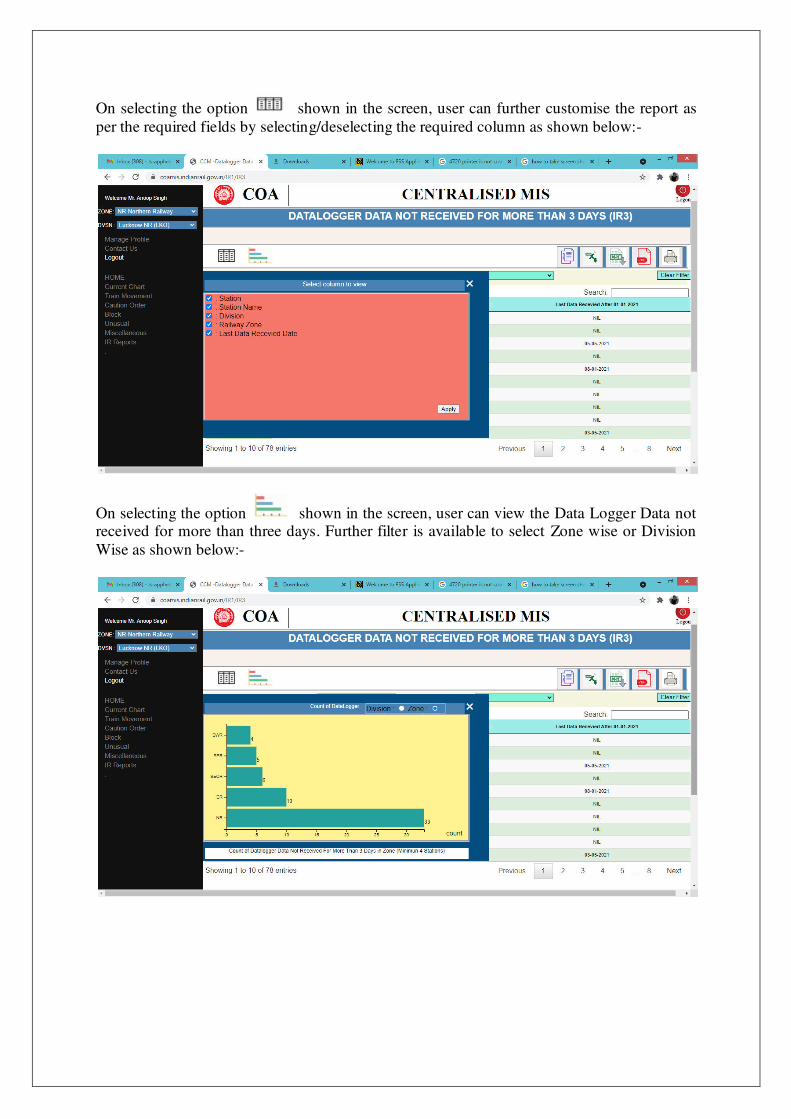
On selecting the option shown in the screen, user can further customise the report as
per the required fields by selecting/deselecting the required column as shown below:-
On selecting the option shown in the screen, user can view the Data Logger Data not received for more than three days. Further filter is available to select Zone wise or Division
Wise as shown below:-

6. MANAGE PROFILE.
This menu is used to change password for existing user
Action Flow.
User shall enter current password, new password and confirm password.
After entering the data press save button to validate the data. Once validate, the new password will activate.

7. CONTACT US
This menu will provide Contact details with phone number for guidance and issue rectification for CCMIS .Respective division in the list can contact the regional office staff
for assistance.
8. LOGOUT
This option menu is used for proper logout from the CCMIS system. Once user click this
option, a message will be prompted showing successfully logout as shown below.
---------------------------------------End of Document ---------------------------------------------------