Embed Size (px)
Citation preview
1
Centre for Finance Working Paper Series
Working paper 2009 008
Industry Effects of Recent Terrorist Attacks: Evidence From Singapore
Vikash Ramiah, Clara Wong Chia Hui and Sinclair Davidson
Abstract
In this paper, the impact of five recent terrorist attacks on equities listed on the
Singapore Stock Exchange is examined. We analyse how these events affect the
different sectors in Singapore, using the Global Industry Classification Standard.
Employing a variety of parametric and non-parametric tests, the relationship between
stock returns for equities listed in these sectors and terrorist attacks are analysed.
The empirical evidence shows significant short-term negative abnormal returns
around the September 11 attacks and, to a lesser extent, the Bali, London and
Mumbai bombings. Furthermore, some weak positive equity responses in the long
run were found in the Bali, London and Mumbai bombings, while no effect was found
from the Madrid attack on the Singaporean market. The results show that there is
evidence of a varied impact on the systematic risk of some of the sectors, for each of
the attacks.

2
I. Introduction
In a recent study by Ramiah, Maher, Ghafouri and Cam (2007), they find that the
terrorist attacks of September 11 had the most influence on the Australian equity
market, with the Pharmaceutical, Materials, Capital Goods, Real Estate and Group
Retailing Industries recording significantly negative abnormal returns. Conversely,
only the Water and Insurance sectors exhibit positive abnormal returns. In our paper,
we adopt a similar approach used by Ramiah, Maher, Ghafouri and Cam (2007), but
examine the impact of five recent terrorist attacks on the Singaporean equity market.
In an alternative study, Cam (2006), suggests that investors do not necessarily react
negatively to terrorist attacks. This is because equity holders tend to respond
negatively to such events, only if they perceive an increase in the expected costs of
terrorist activities. In this study, we argue that market participants may not react at
all if they do not perceive that the attack has an impact on expected returns. It is
possible that stock markets do not react negatively on days surrounding a major
terrorist attack. Through substitution effects, investors may move their investments
to neighbouring countries, and this can result in a positive externality for other
financial markets. As a result, investment paradise does not have to be
geographically remote from the country under attack, as neighbouring countries can
face different levels of terrorist risk. We believe that markets can respond differently
to the different attacks, and that the variability in risk and returns differs significantly
across different sectors within an economy.
The Singaporean Stock Exchange provides an ideal testing ground for several
reasons. First, Singapore has a dense urban setting with a high population density
(Singh, D., 2002). Such a populous nation with limited land suggests an eminent

3
likelihood for the presence of a high concentration of people within a specific location
at a point in time. With such a setting in place, it is very easy for terrorist groups to
achieve a significant number of casualties in the execution of a single operation.
Therefore, terrorist attacks can readily inflict death by the dozens, inflicting much fear
and instability in the hearts of people.
Second, Singh (2002) notes that Singapore has a relatively large Muslim community,
being in close proximity to other Islamic nations. The internal concentration of
Muslims, bolstered by the familiarity of similar counterparts in neighbouring countries,
suggests greater ease of coordinating and facilitating information between attacks.
Singh (2002) asserts that these terrorist groups are often made up of individuals with
strong Muslim influences, as indicated by the Jemmah Islamiah operations, which is
almost exclusively comprised of Muslims.
Finally, Singh (2002) shows that Singapore has many western establishments. This
is borne through Singapore’s historical ties with the British colony, and its current
western influences. This leaves Singapore vulnerable to attacks by terrorists that
have an agenda, set primarily to instigate mass destruction of infrastructures, largely
owned by these foreign counterparts.
In Singapore’s bid to express its strong support of the US anti-terror campaign, Singh
(2002) has identified the proactive steps which Singapore has adopted, the first of
which was the firm action taken against domestic extremists. Another involved
Singapore being one of the first country outside of North America to sign up for a US
Customs Container Security Initiative (CSI), which promises to safeguard US bound
containers issued from Singapore’s port. Therefore, it would be apparent from these

4
actions that Singapore has an ongoing strategic alignment with the US, which
inadvertently exposes Singapore as a prominent terrorist target, by virtue of its
alliance with the US. Tan (2003) reports that threats have been issued previously
towards Singapore, but were fortunately aborted, either because they were foiled by
security agencies or were not pursued for other reasons. Based on these findings, it is
evident that terrorist networks are indeed prevalent within Singapore, and could
possibly be currently sowing the seeds of terrorism, waiting to spring an attack.
Clearly, despite its close brush with terrorism, Singapore will continue to be
susceptible to future terrorist attacks.
Many global capital markets across the globe remained in operation on and after
September 11, with the information process realising statistically negative market
reactions. This result is supported by the findings of Chen and Siems (2004) and
Richman, Santos, and Barkoulas (2005), who showed that the Singaporean equity
market reacted negatively to the September 11 terrorist attacks. The evidence
provided by Cam (2006), Ramiah, Calabro, Maher, Ghafouri, and Cam (2007) and
Ramiah, Naughton, Hallahan and Anderson (2007a, 2007b) on industry effects of
terrorism in the United States, Australia, Japan and Malaysia respectively points
towards different countries react differently to terrorist activities. Furthermore the
existing literature argues that a market’s reaction also depends on where the terrorist
activities occurred.
To the best of our knowledge, there is no current study that looks specifically at the
short term impact of the September 11 attacks on the sectors within the Singaporean
equity market. The objective of this paper, therefore, is to fill this gap. Our
5
contributions are as follows. First, we identify which industries in Singapore were
affected. Second, we look at how subsequent attacks impacted on these industries.
Similar to the early literature on terrorism event studies, we have included firm specific
information, and thus report results which contain both the collective impact of terrorist
attacks, and other non terrorist components. Much of the extant literature may lead
one to conclude that terrorist attacks lead to an increase in terrorist risk, and therefore
reflect a negative sentiment. We argue that such generalizations and conclusions
should not be drawn until one considers the industry effects of terrorist attacks post
September 11. To support our hypothesis, we have adopted the approach used by
Ramiah, Maher, Ghafouri and Cam (2007) in exploring the impact of four subsequent
terrorist attacks that occurred in Bali, Madrid, London and Mumbai on the
Singaporean Stock Exchange. By observing the industry effects in Singapore, we
can determine how Singaporean investors’ reacted to the recent major terrorist
attacks. As such, this study is considered to be unique, in the sense that it is the first
study that looks at the short term effects of the five recent attacks on the different
Singaporean industries. The value that our research has created for investors is the
provision of a seemingly relevant guide to making an investment decision in
Singapore, in the event of another terrorist attack. Such analysis will be especially
beneficial to portfolio managers that use the top-down investment process. The
second stage of this process deals with the factors influencing the industry and we
contribute to this debate by adding the terrorist impact on the different industries. We
observe that more than one sector within the Singaporean equity market is sensitive
to international terrorist attacks, which manifests vital implications for Singapore’s
financial and economic security.

6
Our results are consistent with the prior literature, supporting the findings that the
events of September 11 indeed had a negative impact on the Singaporean equity
market. Furthermore, it is revealed that the market as a whole is fairly less sensitive
to the major terrorist attacks post September 11. Our contribution to this debate is
that while we show that the major terrorist attacks following September 11 did not
radically affect the Singaporean equity market as a whole, certain industries were
more severely affected. In Section II, we present the data and methods used in this
paper. Section III presents the empirical findings and Section IV provides some
concluding remarks.
II. Data and Methods
Data
We use daily stock return indexes, returns calculated from the Straits Times share
price index, and the 10-year bond rate, for the period August 1999 to February 2007,
obtained from Datastream. We have a total of 673 stocks in our sample. We construct
industry portfolios based on the Global Industry Classification Standards (GICS). One
of the practical issues that we face in this process is the small number of firms within
some industry sectors. To overcome this issue, we amalgamated some of the
industries described by GICS, and also introduce an extra sector known as ‘Others’,
which consists of industries that have a low firm count. Note that the 18 industries
include ‘Others’ which constitute 4 additional sectors, these being the
Pharmaceuticals, Utilities, Defence and Telecommunications sectors.
Table 1 reports the descriptive statistics for each of the different industries. The
average daily return for the Capital Goods, Consumer Durables and Apparels, Media,

7
Software and Services, Technology, Hardware and Equipment, and Healthcare
sectors are negative. The remaining sectors exhibit close to zero returns for the
period, with the exception of the Energy and Real Estate sectors which reveal
substantially positive returns. Furthermore, we fail to reject the null hypothesis that the
returns for the Healthcare, Consumer Durables and Apparels, Automobiles, Food and
Beverages, Transportation and Media sectors are normally distributed. Table 1 also
includes the standard deviation, skewness, excess kurtosis, range of returns, and the
number of firms in each of the industry sectors. Details of the five terrorist attacks that
occurred in the United States, Bali, Madrid, London and Mumbai, including the official
trading date after the event, are summarised in Table 2.
Methodology
We define daily return as:
=
−1
lnit
it
itSRI
SRIDR (1)
where DRit is the daily return for stock i, SRIit is the stock return index for stock i at
time t, and SRIit-1 is the stock return index for stock i at time t-1.
The ex-post abnormal returns (ARit) are calculated following Cam (2006), Ramiah,
Calabro, Maher, Ghafouri, and Cam (2007), Ramiah, Naughton, Hallahan and
Anderson (2007a, 2007b) and Brown and Warner (1985). These are calculated as the
difference between observed returns of firm i at event day t, and the expected return,
E(Rit):
( )ititit RERAR −= (2)
The daily expected return, E(Rit), is calculated as the average of the last 260 observed
daily returns:

8
( ) mtit RRE10
ββ += (3)
The abnormal return for industry i at time t, ARit, is obained by averaging the abnormal
return of each form within the industry:
∑=
=N
i
itit ARN
AR1
1 (4)
Parametric Tests
The parametric tests used in this study rely on the important assumption that the
industry abnormal returns and cumulative abnormal returns are normally distributed.
The standard t-statistic for the abnormal return is given by:
( )it
it
ARARSD
ARt
it= (5)
where SD(ARit) is an estimate of the standard deviation of the abnormal returns. By
cumulating the periodic abnormal return for each industry over five days, we obtain
the five day cumulative abnormal return, CARit:
∑=
=5
1
5t
itit ARCAR (6)
The t-statistic for the five day cumulative abnormal return is obtained by dividing
CAR5it by the standard deviation of the five day cumulative abnormal return,
SD(CAR5it):
( )it
it
CARCARSD
CARt
it 5
55
= (7)
Non-Parametric Tests
The literature dealing with abnormal returns shows that they are not normally
distributed. More specifically, the distribution of the abnormal returns tends to exhibit

9
fat tails and positive skewness. Under these circumstances, parametric tests tend to
reject the null too often when testing for positive abnormal performance and too
seldom when testing for negative abnormal returns. As a robustness test, we turn to
an alternative test developed by Corrado (1989). This non-parametric test is more
powerful at detecting the false null hypothesis of no abnormal returns.
We transform each firm’s abnormal returns, ARit into ranks, Ki, over the combined
period, Ti, of 260 days. This is denoted as:
( )iti ARrankK = (8)
Following Cam (2006), the period is broken up into the 244 days prior to the event, the
event day and 15 days after the event. The ranks in the event period for each firm are
then compared with the expected average rank,−
iK , under the null hypothesis of no
abnormal returns. This is given by:
25.0 i
i
TK +=
−
(9)
The non-parametric t-statistic, tnp, for the null hypothesis of no abnormal returns for
each industry is given by:
−
=∑
=
−
_
1
1
KSD
KKN
t
N
i
ii
np (10)
where
−
KSD is the standard deviation of the average rank, and is denoted by:
∑ ∑=
−−
−=
T
t
iit KKNT
KSD1
2
2
11 (11)

10
Regression Analysis
Using the CAPM, we then test if terrorist attacks have had an impact on the
systematic risk of Singaporean industries on the days of the attack. We include a
multiplicative dummy variable in the standard CAPM to test this possibility. The model
we estimate is therefore:
itftmtIftmtIIftIt Drrrrrr εββφ ~*]~~[]~~[~~ 21 +−+−+=− (12)
where Itr~ is industry I’s return at time t, ftr~ is risk free return at time t, mtr~ is return
on the market at time t and D is a dummy variable that takes the value of 1 on the day
of the event, and 0 otherwise. This variable is meant to capture the effect of terrorist
attacks on the systematic risk. The inclusion of an additive dummy variable in
equation (12), results in a near singular variance-covariance matrix. As a result, we
estimate a separate equation to test if the intercept was affected by the attacks:
itIftmtIIftIt Drrrr εααϕ ~]~~[~~ 21 ++−+=− (13)
We gathered the returns for each industry 244 days prior to the event, and 15 days
after the event. Standard tests and residual diagnostics revealed no major concerns
with the above two econometric models. We also test if these dummy variables were
redundant in the above equations using a Wald test for restrictions.
Further, we considered the long term impact of the terrorist events on the market. The
test determines whether the level of risk; specifically captured by structural changes,
was altered after the event day:
itIftmtIftmtIIit SDSDrrrrr εδδδϕ ~*]~~[]~~[~ 321 ++−+−+= (14)

11
where SD is a dummy variable that takes the value of 0 prior to the event, and 1 after
the day of the event. This variable is meant to capture the structural changes and
influence of terrorist attacks on the systematic risk, over a long term horizon.
III. Empirical Findings
This section reports the results of five different terrorist attacks on the Singapore
Stock Exchange. Using a variety of tests, we assess whether the returns and
systematic risk of 18 Singapore based industries were affected by these five events.
We confirm that there is a strong negative impact on returns for most of the industries,
and no change to the systematic risk in any of the sectors during the US attack.
Interestingly, we do not find similar significant evidence for the subsequent attacks.
Surprisingly, some of the subsequent attacks after September 11 recorded positive
long term effects in a number of the sectors. However, such an upside has been
outweighed by the occurrence of a greater number of negative effects, although
neither of the impacts claimed particularly staggering statistics.
United States- September 11
Table 3 and Table 4 summarise the parametric empirical results for September 11 for
the different sectors. Following Ramiah et al. (2007, 2007a, 2007b), we report the
abnormal return on the official trading day preceding the occurrence of each event,
the five day cumulative abnormal return, as well as their respective t-statistics for the
18 different industries. It should be noted that the Singaporean market was similar to
the Australian market, as both opened the day after the attack. In other words, we are
assessing the performance of the Singaporean stock market on the 12th of
September, 2001. The results reported in Table 3 and Table 4 show a relatively

12
consistent negative effect on equities listed in the Singaporean Stock Exchange
following the September 11 attack. Figure 1 supports this hypothesis, where all the
industries illustrate both a negative abnormal return and a negative five day
cumulative abnormal return, except for the Materials, Energy, Retail, Consumer
Durables and Apparels, Automobiles and ‘Others’ sectors. None of the sectors
obtained a statistically significant positive effect immediately after, or five days
preceding the occurrence of September 11.
Columns 2 and 3 of Table 3 report the abnormal returns and the parametric t-statistics
for the various sectors. Table 3 shows that the returns in the Transportation sector fell
by 7.85% after the September 11 attack, and the t-statistic shows that this value is
significantly statistically different from zero. In twelve out of the eighteen sectors were
notably affected by the event. The sector that was affected the most was the Software
and Services sector, which fell by a staggering 8.67%. Such a significant fall is not
unusual, given that Ramiah et al. (2007) reported a 39% fall in the returns of the
Utilities industry within the Australian equity market, after the September 11 attack in
the US. While the Australian industry classification used by Ramiah et al. (2007)
moderately differs from the GICS classification that we have used, some similarities
can be observed in the Real Estate, Capital Goods, Healthcare and Software and
Service industries. These four industries suffered considerably as a result of
September 11, in both Australia and Singapore, although the magnitude of the impact
is moderately higher in Singapore. We do not observe positive returns in any of the
sectors in Singapore. This result is consistent with Ramiah et al. (2007), which
showed only negative returns for all the sectors in the Australian equity market. A
direct comparison to the study of Ramiah et al. (2007) however, is not totally
appropriate because they have excluded firms with firm specific information

13
surrounding the events, which may account for the unexpected results in the returns
on the sectors. Conversely, we have not adopted this exclusion approach, due to the
existing limitations on the research data.
Although Cam (2006) US industry classification differs from that used by Ramiah et al.
(2007), and the GICS classification, the striking similarity of all three analyses is
epitomised within the Real Estate industry, which showed evidence of a statistical fall
in the United States, Australian and Singaporean equity markets. Thus, our findings
are consistent with both Cam (2006) and Ramiah et al. (2007) in this particular aspect.
Chen and Siems (2004) assess the short term effect of September 11 on the global
capital market. Using a major market index, they showed that the Singaporean equity
market fell by 4.96%. Using an international capital asset pricing model, Richman,
Santos, Barkoulas, (2005) reported a negative impact of about 5.78% on the Straits
Times Index. Our findings are thus consistent with Chen and Siems (2004) and
Richman et al. (2005), as we show a clear and consistent fall in the Singaporean
equity market of 5.38%. Figure 1 shows the ranking of the abnormal returns. From
Figure 1, we can observe that the Materials, Energy, Retail, Consumer Durables and
Apparels, Automobiles and ‘Others’ sectors, are the least adversely affected by the
September 11 terrorist attack.
However, the Materials, Retail and ‘Others’ sectors all exhibit a negative cumulative
abnormal return over the following five days. Note that our approach is consistent with
most studies, as this methodology supports the hypothesis of negative sentiment after
the September 11 attack. The second column of Table 4 shows that the Media sector
was the worst performing sector with an astounding -29.5% reported as the CAR over
14
the next five days (see Figure 1), supported by the t-statistic which implied that this is
very much statistically different from zero. All the other sectors within the Singapore
equity market also recorded statistically significant decline within the range of 11% to
30%, with exception of the Energy, Consumer Durables and Apparels, and
Automobiles sectors. Note that except for the Materials, Retail and the ‘Others’ sector,
all these other sectors also exhibited a statistically significant negative abnormal
return on the day following the attack which persisted into the following 5 days. It is
apparent from Figure 1 that the CAR5 is marginally higher than the event day AR for
most industries, implying that the market continued to plummet over the following five
days. Our findings are consistent with Chen and Siems (2004), who showed a
cumulative abnormal return of around -12.07%, six days after the event, and -16.00%
eleven days after the attack. However, this result is inconsistent with Cam (2006),
who found that the CAR over the following six days is lower than the abnormal return
for US firms.
As a robustness test, we consider the results of applying non-parametric tests, which
are reported in Table 5. The negative impact of the events of September 11 on
Singaporean based industries was also detected by the non-parametric tests. The
results in Table 5 show that except for the Energy, Automobiles and ‘Others’ sector,
all the other sectors have a significantly negative non-parametric t-statistic. For
instance, column 2 of Table 5 shows that the non-parametric t-statistic is -3.48902 for
the Diversified Financials sector. This reflects the negative abnormal returns identified
earlier in the parametric tests. Therefore, it is prudent to conclude that the general
results of the non-parametric tests support the results observed in the parametric
analysis.

15
Based on the above discussion, we can conclude that all the sectors except for the
Materials, Energy, Retail, Consumer Durables and Apparels, Automobiles and the
‘Others’ sectors were strongly negatively affected on the day following the September
11 attack. It is generally assumed that following a terrorist attack, returns of equities
fall as a result of an increase in systematic risk.
Our next objective will be to test if the industries negatively affected by the events of
September 11 experienced a general increase in their systematic risk. The
multiplicative regression analysis (see Equation 12) attempts to test this hypothesis.
Columns 2 to 4 of Table 6(a) report the results of the multiplicative dummy variable
model (equation 12). A positive (negative) coefficient of the multiplicative dummy
variable ( 2
Iβ ) reflects an increase (decrease) in systematic risk. The sign of the
coefficient ( 2
Iβ ) did not appear to be significantly positive or negative in any of the
industries identified, to be deemed as having been strongly affected on the day
following the September 11 attack. When the coefficient of the multiplicative dummy
variable is statistically different from zero, it implies a significant statistical change in
the systematic risk of the industry. The t-statistics results from column 4 of Table 6(a)
show that systematic risk had not statistically reduced or increased in any of the
sectors following the September 11 attack. A Wald test was conducted to test the
hypothesis that the dummy variable was a redundant variable. The results show that
the dummy variable is not a redundant variable for this sector. While the results of
this test are not reported, they are available from the author upon request
On the other hand, there is no statistical evidence of a change in systematic risk in the
twelve industries which were identified to have been strongly negatively affected on
the day following the September 11 attack. As such this indicates that terrorist attacks

16
do not necessarily lead to an increase in systematic risk, and that the risk of terrorist
attacks varies significantly across industries. However, this finding is not entirely
substantiated as none of the sectors was identified with this outcome. Therefore, this
result is not consistent with that obtained by Richman et al. (2005), who showed that
the Singaporean equity market experienced a general increase of -5.78% in the level
of short term systematic risk, on the first trading day (i.e. September 12).
Equation (13) shows the impact of September 11 on the intercept of the CAPM.
Columns 5 to 7 of Table 6(a) present the findings of the regression. As from Column
7, we can observe that the intercept had not been statistically significant in any of the
sectors.
Our final objective will be to test if the industries negatively affected by September 11
events experienced a general increase in their systematic risk in the long term. The
multiplicative regression analysis (see Equation 14) attempts to test this hypothesis.
Columns 1 to 4 of Table 7(a) report the results of the multiplicative dummy variable
model (equation 14). A positive (negative) coefficient of the multiplicative dummy
variable ( 2
Iδ ), which is the coefficient of the dummy variable SD, reflects an increase
(decrease) in systematic risk in the long term. The sign of the coefficient ( 2
Iδ )
appeared to be significantly positive in the Capital Goods, Energy, Media and
Transportation sectors. When the coefficient of the multiplicative dummy variable is
statistically different from zero, it implies a significant statistical change in the long
term systematic risk of the industry. Furthermore, a positive (negative) coefficient of
the multiplicative dummy variable ( 3
Iδ ), which the other coefficient of the dummy
variable SD, reflects an increase (decrease) in the intercept ( Iϕ ) of the regression
equation (E( Iϕ ) = 0), after the occurrence of the event. The t-statistics results from

17
column 4 of Table 7(a) show that this is not statistically significant in any of the sectors
following the September 11 attack. Therefore, there is no statistical evidence of a
change in the intercept ( Iϕ ) of the of the regression equation (E( Iϕ ) = 0), in any of the
twelve industries which were identified to have been strongly negatively affected on
the day following the September 11 events.
Bali
Among all the terrorist attacks studied in this paper, the Bali bombing is
geographically the closest to Singapore. The event occurred on Saturday, 12th of
October 2002, and the first day that the Singaporean market traded after the attack,
was on Monday, 14th of October, 2002. The results of the parametric test on sector
returns for this day are shown in Table 3 (Columns 4 and 5). Only the Automobiles
sector was significantly negatively affected on the first day that the market traded. The
robustness test also support the claim of a negative effect in the Automobiles sector
on the first day of trading. The third column of Table 5 shows the results on the
non-parametric test on the various Singapore industries. The non-parametric t-
statistic is negative and significant for the Automobiles industry. However,
interestingly, over the 5 day trading period, there was significant positive cumulative
returns recorded for the Banks and Insurance sector, as well as the Technology,
Hardware and Equipments sector of the market (see Table 4) for Bali bombing. These
positive effects appear to have occurred only after the first trading day following the
attack. This is because the negative effects which were present for these two sectors
on the first trading day disappeared after five days, where the CAR5 for the two
sectors became a significantly positive value. Interestingly, almost all of the sectors
appeared to have recovered over the 5 day period, generally recording positive values

18
for the CAR5, albeit not statistically significant. Therefore, although it is statistically
conclusive that only one of the sector, Automobiles was negatively affected
immediately after the Bali attack, the downturn was not enduring thereafter, as the
CAR5 reflected somewhat an improvement. From the results, it would deem apparent
that although the Banks and Insurance sector, as well as the Technology, Hardware
and Equipments sector had not reacted positively to the aftermath of the event, the
recovery was robustly evidenced over the 5 day trading period, where and a
statistically significant positive CAR5 was recorded. Unlike the five day CAR analysis,
the regression analysis shows no significant results. A Wald test was conducted to
test the hypothesis that the dummy variable was a redundant variable. The results
show that the dummy variable is not a redundant variable for this sector. While the
results of this test are not reported, they are available from the author upon request.
Based on the empirical results, we can further conclude that the Bali bombings did
have both a negative and positive effect on the Singaporean market, in both the short
run and long term. We may interpret the positive result as a substitution effect of
terrorist attacks. Our hypothesis is that investors move their investments from
countries directly under attack to the neighbouring country, in search of an investment
paradise. Unfortunately, our findings do not show a substantial evidence of
substitution effect, as only Banks and Insurance sector, and the Technology,
Hardware and Equipments sector noted statistically significant recovery over the 5
day period, both recording positive values for the CAR5.
It is generally assumed that following a terrorist attack, returns of equities fall as a
result of an increase in systematic risk. Our next objective will be to test if the
industries negatively affected by the Bali Bombings experienced a general increase in

19
their systematic risk. The multiplicative regression analysis (see Equation 12)
attempts to test this hypothesis. Columns 2 to 4 of Table 6(b) report the results of the
multiplicative dummy variable model (equation 12). A positive (negative) coefficient of
the multiplicative dummy variable ( 2
Iβ ) reflects an increase (decrease) in systematic
risk. The sign of the coefficient ( 2
Iβ ) did not appear to be significantly positive or
negative in any of the industries identified, to be deemed as having been strongly
affected on the day following the attacks in Bali. When the coefficient of the
multiplicative dummy variable is statistically different from zero, it implies a significant
statistical change in the systematic risk of the industry. The t-statistics results from
column 4 of Table 6(b) show that systematic risk had statistically reduced in the
Consumer Services and Technology, Hardware and Equipment sectors following the
Bali Bombings. A Wald test was conducted to test the hypothesis that the dummy
variable was a redundant variable. The results show that the dummy variable is not
a redundant variable for this sector. While the results of this test are not reported,
they are available from the author upon request. On the other hand, there is no
statistical evidence of a change in systematic risk in the Automobile sector, which was
identified to have been strongly negatively affected on the day following the Bali
Bombings. Therefore, it is difficult to conclude that terrorist attacks lead to a reduction
in systematic risk, and that the level of terrorist risk varies significantly across
industries.
On the other hand, equation (13) shows the impact of the Bali Bombings on the
intercept of the CAPM. Columns 5 to 7 of Table 6(b) present the findings of the
regression. As from Column 7, we can observe that the intercept had been statistically
significant in the Consumer Services and Technology, Hardware and Equipment
sectors.
20
Our final objective is to analyse if the industries negatively affected by the Bali
Bombings experienced a general increase in their systematic risk in the long term.
The multiplicative regression analysis (see Equation 14) attempts to test this
hypothesis. Columns 1 to 4 of Table 7(b) report the results of the multiplicative dummy
variable model (equation 14). A positive (negative) coefficient of the multiplicative
dummy variable ( 2
Iδ ), which is the coefficient of the dummy variable SD, reflects an
increase (decrease) in systematic risk in the long term. The sign of the coefficient
( 2
Iδ ) appeared to be significantly positive in only the Media sector. When the
coefficient of the multiplicative dummy variable is statistically different from zero, it
implies a significant statistical change in the long term systematic risk of the industry.
Furthermore, a positive (negative) coefficient of the multiplicative dummy variable
( 3
Iδ ), which the other coefficient of the dummy variable SD, reflects an increase
(decrease) in the intercept ( Iϕ ) of the regression equation (E( Iϕ ) = 0), after the
occurrence of the event. The t-statistics results from column 4 of Table 7(a) show that
this is only statistically significant in the Transportation sector following the Bali
Bombings. Therefore, there is only statistical evidence of a change in the intercept
( Iϕ ) of the of the regression equation (E( Iϕ ) = 0), in the Transportation sector, which
had not been identified to have been strongly negatively affected on the day following
the Bali Bombings.
Madrid
The bombings in Madrid occurred on Thursday, 11th of March 2004. We examine the
Singapore industry reactions both immediately, and five days following the event. The
results of the parametric test immediately after the attacks and five day after the
attacks are shown in columns 6 and 7 of Table 3 and Table 4 respectively. Based on

21
these two parametric tests, none of the sectors were significantly negatively affected.
The non-parametric test also failed to detect a statistical significant impact on the
event day on any of the sectors. Therefore, it is conclusive that all of the sectors were
immunized from the Madrid bombings. Of the five terrorist attacks analysed, Madrid
suffered the second highest injury and fatality rate. In spite of this, the results suggest
that this event had no negative impact on any of the sectors within the Singaporean
equity market.
As such, the Madrid evidence suggests that it is wrong to assume that terrorist attacks
will impact negatively on stock markets, implying that investment havens do exist
even under terrorist attacks.
It is generally assumed that following a terrorist attack, returns of equities fall as a
result of an increase in systematic risk. Our next objective will be to test if the
industries negatively affected by the Madrid Bombings experienced a general
increase in their systematic risk. The multiplicative regression analysis (see Equation
12) attempts to test this hypothesis. Columns 2 to 4 of Table 6(c) report the results of
the multiplicative dummy variable model (equation 12). The sign of the coefficient
( 2
Iβ ) did not appear to be significantly positive or negative in any of the industries
identified, to be deemed as having been strongly affected on the day following the
attacks in Madrid. When the coefficient of the multiplicative dummy variable is
statistically different from zero, it implies a significant statistical change in the
systematic risk of the industry. The t-statistics results from column 4 of Table 6(c)
show that systematic risk had statistically reduced in the Food and Beverages, Energy
and Media sectors following the Madrid Bombings. A Wald test was conducted to test
the hypothesis that the dummy variable was a redundant variable. The results show
22
that the dummy variable is not a redundant variable for this sector. While the results
of this test are not reported, they are available from the author upon request. On the
other hand, since none of the sectors had been identified to have been strongly
negatively affected on the day following the Madrid Bombings, there is therefore no
statistical evidence of a change in systematic risk.
On the other hand, the results of estimating equation (13) shows the impact of the
Madrid Bombings on the intercept of the CAPM. Once more we focus the industries
stated in the previous paragraph. Columns 5 to 7 of Table 6(c) present the findings of
the regression. As from Column 7, we can observe that the intercept had been
statistically significant in the Food and Beverages and Energy sectors.
Our final objective is to analyse if the industries negatively affected by the Madrid
Bombings experienced a general increase in their systematic risk in the long term.
The multiplicative regression analysis (see Equation 14) attempts to test this
hypothesis. Columns 1 to 4 of Table 7(c) report the results of the multiplicative dummy
variable model (equation 14). The sign of the coefficient ( 2
Iδ ) is not significantly
positive in any of the sectors. The t-statistics results from column 4 of Table 7(c) again
show that this is not statistically significant in any of the sectors following the Madrid
Bombings. Therefore, there is no statistical evidence of a change in the intercept ( Iϕ )
of the of the regression equation (E( Iϕ ) = 0), in any of the sectors, and this is
consistent with earlier findings of an immunised effect arising from the Madrid
Bombings.

23
London
On Thursday, 7th of July 2005, London came under the wrath of terrorists. Intuitively,
because of Singapore’s close ties with the western world, one may envisage that a
substantial impact on the Singaporean equity market will materialise. True to this
belief, the Singaporean equity market’s response to the attack was noteworthy. The
trading day immediately after the attack saw both the Healthcare sector and the Food
and Beverage sector produce abnormal returns of -3.10% and -1.63% respectively
(see Table 3, Column 8). The non-parametric t-statistic however only supports the
statistically significant negative movement in the Healthcare sector, with an absence
of a similar support for the Food and Beverage sector. Instead, the non-parametric
t-statistic revealed that the Banks and Insurance sector experienced a significant
negative impact. However, the Household and Personal Products sector and ‘Others’
sector showed unusual positive cumulative abnormal returns of 4.83% and 4.93%
respectively over five days. Therefore, considering the London terrorist attack to be a
considerably major global event, it has affected more than one industry in the
Singaporean equity market on the day of the impact, and subsequently, more
industries in the days preceding the impact, although there is little consistency in the
extent the impact, and the sectors involved. Conclusively, it would deem that the
Healthcare and Food and Beverages sectors were negatively affect on the day of the
impact, but managed to gain recover thereafter in the following 5 days. In contrast, the
Household and Personal Products sector and ‘Others’ sectors also affirmed much
recovery after 5 days following the event, as significantly positive returns were noted
in these sectors.
Out of the five attacks studied in this analysis, a range of sectors have been
significantly affected by three of these events. Some of the sectors displayed
24
recurrent impacts in each of the events; one apparent sector being the Healthcare
sector which manifested negative impact in both the September 11 and the London
Bombings. In addition, there exist other sectors pertaining to each event which also
exhibited statistically significant returns, although the impact was not repeated in
subsequent attacks. These findings therefore conclusively demonstrate the
prevalence of extreme sensitivity around terrorist attacks.
It is generally assumed that following a terrorist attack, returns of equities fall as a
result of an increase in systematic risk. Our next objective will be to test if the
industries negatively affected by the London Bombings experienced a general
increase in their systematic risk. The multiplicative regression analysis (see Equation
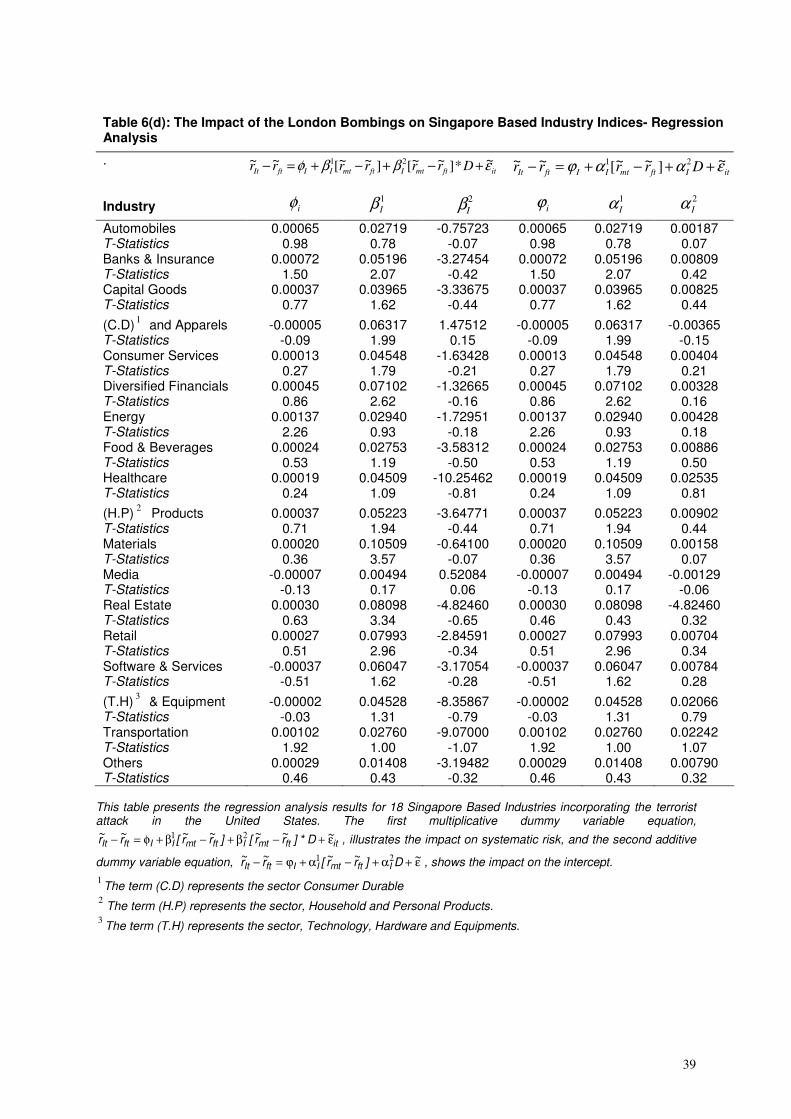
12) attempts to test this hypothesis. Columns 2 to 4 of Table 6(d) report the results of
the multiplicative dummy variable model (equation 12). The sign of the coefficient
( 2
Iβ ) did not appear to be significantly positive or negative in any of the industries
identified, to be deemed as having been strongly affected on the day following the
attacks in London. The t-statistics results from column 4 of Table 6(d) show that
systematic risk had not statistically reduced or increased in any of the sectors
following the London Bombings. A Wald test was conducted to test the hypothesis
that the dummy variable was a redundant variable. The results show that the
dummy variable is not a redundant variable for this sector. While the results of this
test are not reported, they are available from the author upon request. On the other
hand, there is no statistical evidence of a change in systematic risk in the Healthcare,
and the Food and Beverage sectors, which were identified to have been strongly
negatively affected on the day following the September 11 attack. These results
suggest that major terrorist attacks do not necessary lead to an increase in systematic
risk, and that the level of terrorist risk varies significantly across industries.
25
The results obtained from estimating equation (13) shows the impact of the London
Bombings on the intercept of the CAPM. Columns 5 to 7 of Table 6(d) present the
findings of the regression. As can be seen from Column 7, the intercept was not
statistically significant in any of the sectors.
Our final objective is to analyse if the industries negatively affected by the London
Bombings experienced a general increase in their systematic risk in the long term.
The multiplicative regression analysis (see Equation 14) attempts to test this
hypothesis. Columns 1 to 4 of Table 7(d) report the results of the multiplicative dummy
variable model (equation 14). The sign of the coefficient ( 2
Iδ ) appeared to be
significantly positive in none of the sectors. The t-statistics results from column 4 of
Table 7(d) again show that this is not statistically significant in any of the sectors
following the London Bombings. Therefore, there is no statistical evidence of a
change in the intercept ( Iϕ ) of the of the regression equation (E( Iϕ ) = 0), in any of the
sectors, which following the London Bombings.
Mumbai
Although Mumbai’s terrorist attacks claimed 207 lives and injured 714 people, the
response on the Singaporean equity market was marginal. The impact of this attack
resulted in an abnormal performance for only the Media sector. The negative
abnormal return following the event was statistically significant. The effect was further
magnified 5 days after the occurrence of the event where the CAR5 had plunged by a
greater extend. The non-parametric t-statistic however does not support the
statistically significant negative movement.

26
It is generally assumed that following a terrorist attack, returns of equities fall as a
result of an increase in systematic risk. Our next objective will be to test if the
industries negatively affected by the Mumbai Bombings experienced a general
increase in their systematic risk. The multiplicative regression analysis (see Equation
12) attempts to test this hypothesis. Columns 2 to 4 of Table 6(e) report the results of
the multiplicative dummy variable model (equation 12). The sign of the coefficient
( 2
Iβ ) did not appear to be significantly positive or negative in any of the industries
identified, to be deemed as having been strongly affected on the day following the
attacks in Mumbai. The t-statistics results from column 4 of Table 6(e) show that
systematic risk had not statistically reduced or increased in any of the sectors
following the Mumbai Bombings. A Wald test was conducted to test the hypothesis
that the dummy variable was a redundant variable. The results show that the dummy
variable is not a redundant variable for this sector. While the results of this test are not
reported, they are available from the author upon request. On the other hand, there is
no statistical evidence of a change in systematic risk in the Media sector, which was
the only sector which was identified to have been strongly negatively affected on the
day following the September 11 attack.
Furthermore, the results of estimating equation (13) shows the impact of the Mumbai
Bombings on the intercept of the CAPM. Columns 5 to 7 of Table 6(e) present the
findings of the regression. As from Column 7, we can observe that the intercept had
not been statistically significant in any of the sectors.
Our final objective is to analyse if the industries negatively affected by the Mumbai
Bombings experienced a general increase in their systematic risk in the long term.
The multiplicative regression analysis (see Equation 14) attempts to test this

27
hypothesis. Columns 1 to 4 of Table 7(e) report the results of the multiplicative dummy
variable model (equation 14). The sign of the coefficient ( 2
Iδ ) appeared to be
significantly negative in the Household and Personal Products and Materials sectors.
The t-statistics results from column 4 of Table 7(e), again, show that this is not
statistically significant in any of the sectors, following the Mumbai Bombings.
Therefore, there is no statistical evidence of a change in the intercept ( Iϕ ) of the of
the regression equation (E( Iϕ ) = 0), in any of the sectors, following the Mumbai
Bombings.
IV. Conclusion
Studying the impact of the recent terrorist attacks on the Singaporean industries, we
are able to identify the various market effects. The events of September 11 had the
greatest effect on the Singaporean equity market. The majority of the industries were
down on the day of the event, and just over 60% of the industries remained negatively
affected 5 days after the event. None of the sectors showed a statistically significant
change in the level of systematic risk following the September 11 attacks. The London
bombings were next, revealing a negative impact on the Singaporean equity market,
and a positive effect five days after the event. Interestingly, the results obtained from
the Bali attacks were generally positive for Singapore. However, with only two sectors
demonstrating statistically significant effects 5 days after the event, there seems to be
only weak evidence for the occurrence of the substitution effect. Nevertheless, the
Bali Bombings show that terrorist attacks do not always nurture negative sentiment.
This poses advantages for the neighbouring country out of a substitution effect.
Another interesting finding was that the Madrid bombings had no major impact on the
Singaporean equity market. The evidence from the Madrid bombings suggest that
some capital markets may be insulated from certain terrorist attacks, and thus

28
investment havens may exist under such circumstances, even immediately after an
attack. Finally, it appears that more than one industry is sensitive to the terrorist
attacks. However, Singapore has not been radically affected by terrorist attacks post
September 11, indicating that investment havens do exist after those events.
Acknowledgements
We would like to acknowledge the invaluable research assistance of Liew Khar Wai,
Choo Wen Hoe, Wee Kuan Jin, Poh Chia Huei, Amrish Buroty, Neha Sandher and
Alias Adil in gathering the data and completing some of the empirical analysis. We
would also like to thank George tawadros, Mugwagwa Tafadzwa and Ashwin Madhou
for their ongoing assistance that contributed to the successful completion of this
paper. Any remaining errors, however, are our own.

29
References
Brown, S. J., and Warner, J.B., (1985), ‘Using daily stock returns: The case of event studies’,
Journal of Financial Economics, vol. 14, no. 1, 3-31.
Cam, M., (2006), ‘The impact of terrorism on United States Industry indexes’, School of
Economics, Finance and Marketing, Royal Melbourne Institute of Technology,
Melbourne.
Chen, A. H., and Siems, T. F., (2004), ‘The effects of terrorism on global capital markets’,
European Journal of Political Economy, vol. 20, 349-366.
Corrado, C. J., (1989), ‘A non parametric test for abnormal security price performance in
event studies’, Journal of Financial Economics, vol. 23, 385-395.
Hoa, T. V., (2004), ‘Economic and Financial Crisis Management in Asia: A Critical Analysis’,
University of Wollongong Economics Working Paper Series 2004.
Hon, M. T., , S. K., (2004), ‘Contagion in Financial Markets After September 11: Myth or
Reality?’, The Journal of Financial Research, vol. 27, no. 1, 95-114.
Ramiah, C., Maher, D., Ghafouri S., and Cam M. (2007). The Short Term Impact of the
Recent Terrorist Attacks on the Australian Equity Market. Economics, Finance and
Marketing. Melbourne, RMIT.
Ramiah, V., Naughton T., Hallahan T. and Anderson J. A. (2007a). ‘An Empirical
Investigation of the Short Term and Long Term Impact of the Recent International
Terrorist Attacks on the Japanese Equity Market.’, School of Economics, Finance and
Marketing, Royal Melbourne Institute if Technology, Melbourne.
Ramiah, V., Naughton T., Hallahan T. and Anderson J. A. (2007b). ‘An Empirical
Investigation of the Short Term and Long Term Impact of the Recent International

30
Terrorist Attacks on the Malaysian Equity Market.’, School of Economics, Finance and
Marketing, Royal Melbourne Institute if Technology, Melbourne.
Richman, V., Santos, M. R., and Barkoulas, J. T., (2005), ‘Short- and Long-Term effects of
the September 11 Event: The International Evidence’, International Journal of
Theoretical and Applied Finance, vol. 8, no. 7, 947-958.
Singh, D., (2002), ‘The Post-September 11 Geostrategic Landscape and Southeast Asian
Response to the Threat of Terrorism’, Institute of Southeast Asian Studies,
Singapore.
Tan, S. L., (2003), ‘The Threat of Terrorism and Singapore’s Legislative Response to
Terrorism Financing’, Journal of Money Laundering Control, vol. 7, no. 2, 139-144.

31
Table 1: Descriptive Statistics of daily Returns, for sectors in Singapore from August 1999 to February 2007.
MEAN STD DEV SKEWNESS KURTOSIS RANGE COUNT T-TEST STATS JB-STATS
Materials 0.044% 0.0358 -0.06 15.29 1.27 37 0.0123 360.58
Diversified Financials 0.039% 0.0288 0.14 45.67 9.19 28 0.0134 2433.49
Energy 0.144% 0.0337 -3.90 138.33 1.73 8 0.0427 6399.08
Real Estate 0.127% 0.0277 -0.20 36.91 3.77 48 0.0458 2725.31
Capital Goods -0.012% 0.0453 0.10 23.03 3.42 137 -0.0027 3027.18
Healthcare -0.005% 0.0330 0.55 9.27 1.58 15 -0.0016 54.44
Banks and Insurance 0.050% 0.0174 1.34 71.95 0.75 6 0.0286 1296.18
Retail 0.051% 0.0399 -0.28 33.46 1.63 26 0.0128 1213.16
Consumer Durables and Apparels -0.074% 0.0352 0.34 13.45 0.67 7 -0.0211 52.92
Automobiles 0.018% 0.0380 0.59 8.16 1.05 7 0.0047 19.81
Food and Beverages 0.053% 0.0364 0.42 13.75 1.71 52 0.0146 411.49
Transportation 0.056% 0.0293 0.23 11.72 1.36 26 0.0192 148.96
Media -0.020% 0.0396 0.26 9.38 1.15 9 -0.0051 33.10
Software and Services -0.001% 0.0503 -0.31 27.48 2.96 60 -0.0003 1888.58
Consumer Services 0.033% 0.0304 0.38 26.83 1.38 27 0.0109 810.59
Household and Personal Products 0.011% 0.0424 -0.34 30.14 1.68 45 0.0026 1704.10
Technology, Hardware and Equipment -0.047% 0.0435 -0.12 21.15 3.95 120 -0.0109 2235.84
Others1 0.024% 0.0305 1.78 46.36 1.46 15 0.0078 1351.19
The Market 0.051% 0.1174 0.06 79.88 9.19 673 0.0043 178924.33
1This category is comprised of the Pharmaceuticals, Utilities, Defence, and Telecommunications sectors.

32
Table 2: The Five Major Terrorist Attacks and Their Consequences.
Terrorist Attack Date Event Injuries Fatalities Official Trading (on
SGX) date after event
September 11, US 11/09/2001 Four commercial aircraft were hijacked. Two were deliberately crashed into the World Trade Centre, and another into the Pentagon. Passengers forced the crash of the other plane into Pennsylvania.
5,000 3,025 12/09/2001
Bali, Indonesia 12/10/2002 A car bomb exploded outside the crowded Sari Club and inside Padi’s Bar.
300 202 14/10/2002
Madrid, Spain 11/03/2004 Planted bombs detonated on commuter trains 1,800 191 11/03/2004
London, UK 7/07/2005 Suicide bombing of the London subway and bus system. 700 55 7/07/2005
Mumbai, India 11/07/2006 Explosive devices tore through several commuter trains. 714 207 12/07/2006
Source: Adapted From Ramiah et al. (2007).

33
Table 3: Abnormal Returns on Singapore Based Industry Indices Following Five Terrorist Attacks
September 11 Bali Madrid London Mumbai Industry
AR T-stats AR T-stats AR T-stats AR T-stats AR T-stats
Materials -0.03681 -1.94974 -0.01704 -1.21665 -0.00999 -0.77420 0.00187 0.22597 -0.00661 -0.58761
Diversified Financials -0.05331 -4.22608 -0.00115 -0.04937 -0.00883 -0.96650 0.00101 0.18629 -0.00068 -0.06114
Energy 0.01388 0.63588 0.01856 1.66880 -0.01039 -0.36228 -0.00087 -0.06671 -0.00840 -0.40017
Real Estate -0.03608 -3.05931 -0.00059 -0.05641 -0.00535 -0.47282 -0.00912 -1.24748 -0.00392 -0.38230
Capital Goods -0.05225 -3.96532 -0.01355 -1.48241 -0.01110 -0.79011 -0.00666 -0.93811 -0.00262 -0.27704
Healthcare -0.08450 -3.28418 -0.00120 -0.06580 -0.01010 -0.52314 -0.03096 -2.11739 -0.01338 -0.79694
Banks and Insurance -0.05259 -3.89846 -0.00018 -0.01643 -0.00492 -0.55556 -0.00924 -1.91051 -0.00246 -0.40217
Retail -0.02458 -1.94175 0.00444 0.39137 -0.01598 -1.49491 -0.00089 -0.10980 -0.00733 -0.68278
Consumer Durables and Apparels -0.04005 -1.84638 0.00697 0.44463 -0.00522 -0.42470 -0.00532 -0.44796 -0.01641 -0.92566
Automobiles 0.03443 1.57590 -0.05904 -2.15739 -0.03292 -1.27384 -0.00161 -0.09270 0.00910 0.41399
Food and Beverages -0.04598 -3.74802 0.00473 0.36926 -0.00541 -0.47862 -0.01631 -2.22531 -0.00205 -0.20314
Transportation -0.07850 -4.71659 -0.00560 -0.42688 -0.00654 -0.42155 0.00033 0.03885 0.01752 1.74297
Media -0.06682 -2.07278 0.00165 0.06946 0.00589 0.25039 -0.02847 -1.56176 -0.03706 -2.25961
Software and Services -0.08668 -5.17002 -0.00634 -0.36569 -0.00540 -0.27391 -0.01036 -1.02742 -0.00547 -0.43659
Consumer Services -0.03220 -2.56568 -0.00864 -0.76896 0.00462 0.39004 0.00888 1.05448 0.00479 0.51273
Household and Personal Products -0.05821 -3.37879 0.00862 0.61288 -0.00844 -0.57934 0.00070 0.05521 0.01152 0.83304
Technology, Hardware and Equipments
-0.07307 -3.96472 -0.00340 -0.19290 -0.01724 -0.95855 0.00464 0.49113 0.00517 0.48358
Others 1 -0.02318 -1.05926 -0.01448 -0.90689 0.00063 0.04439 -0.00237 -0.27495 -0.00071 -0.06422
This table presents abnormal returns and the parametric t-test results for 18 Singapore Based Industries after September 11, Bali, Madrid, London and Mumbai terrorist attacks 1 This category is comprised of the Pharmaceuticals, Utilities, Defence, and Telecommunications sectors.

34
Table 4: Cumulative Abnormal Returns on Singapore based Industry Indices Following Five Terrorist Attacks
September 11 Bali Madrid London Mumbai Industry
CAR5 T-stats CAR5 T-stats CAR5 T-stats CAR5 T-stats CAR5 T-stats
Materials -0.19970 -4.56914 0.02926 0.95281 -0.01273 -0.38489 0.01442 0.76612 -0.03748 -1.28408
Diversified Financials -0.18753 -5.43974 0.05468 1.00306 -0.03304 -1.48661 0.00429 0.42199 -0.04160 -1.89894
Energy -0.04057 -1.06937 0.05996 1.96380 0.06848 1.27111 0.03553 1.14945 -0.08811 -1.81030
Real Estate -0.11553 -3.80963 0.03910 1.62400 -0.01452 -0.48748 0.00201 0.13552 -0.03307 -1.22154
Capital Goods -0.20900 -5.67506 0.03572 1.43761 -0.01173 -0.30636 0.01852 1.07568 -0.04505 -1.87513
Healthcare -0.14890 -2.66696 0.04233 1.03083 -0.01566 -0.40563 0.04782 1.78915 -0.03922 -1.21624
Banks and Insurance -0.16593 -5.21018 0.05702 2.12593 -0.02116 -1.05271 0.00199 0.20715 -0.02382 -1.81194
Retail -0.14567 -4.56166 0.00069 0.02533 -0.02043 -0.72206 0.00888 0.55912 -0.02619 -1.17877
Consumer Durables and Apparels -0.09285 -1.92378 0.04232 1.22365 -0.01232 -0.50726 -0.02693 -1.19377 0.00167 0.04884
Automobiles -0.05066 -1.18793 -0.03485 -0.64075 -0.00664 -0.11188 0.04738 1.55731 -0.00565 -0.14284
Food and Beverages -0.16427 -5.19105 0.05629 1.91713 -0.00988 -0.35158 -0.00903 -0.67546 -0.03864 -1.79557
Transportation -0.20983 -5.51371 0.03606 1.15581 -0.00500 -0.12004 0.01040 0.56569 -0.02850 -1.17566
Media -0.29532 -3.97649 0.04196 0.88743 0.02007 0.43453 -0.02456 -0.86283 -0.10699 -3.10033
Software and Services -0.24668 -5.90360 0.07528 1.88274 0.00031 0.00633 0.00292 0.13107 -0.02590 -0.98494
Consumer Services -0.17676 -5.52968 0.02662 0.96575 0.00786 0.26637 -0.00193 -0.12415 -0.01276 -0.67704
Household and Personal Products -0.14797 -3.73544 0.03103 0.92024 -0.00413 -0.11662 0.04825 2.37551 -0.00411 -0.16671
Technology, Hardware and Equipments -0.27113 -5.38620 0.10512 2.21834 -0.01330 -0.28677 0.03219 1.31396 -0.03430 -1.20461
Others 1 -0.14936 -3.00760 0.03957 1.22012 -0.01299 -0.50496 0.04927 2.56357 -0.04747 -1.80204
This table presents five day cumulative abnormal returns and the parametric t-test results for 18 Singapore Based Industries after September 11, Bali, Madrid, London and Mumbai terrorist attacks 1 This category is comprised of the Pharmaceuticals, Utilities, Defence, and Telecommunications sectors.

35
Industry September 11 Bali Madrid London Mumbai
Materials -2.82882 -1.79039 -1.15519 -1.16119 -0.56059
Diversified Financials -3.48902 -0.39406 -1.54817 -0.78837 0.28511
Energy -0.41983 0.51110 -1.10190 0.26284 -0.61587
Real Estate -3.02680 -0.36181 -1.29868 -1.43775 -0.54371
Capital Goods -3.16321 -1.27246 -1.24354 -0.85178 -0.63549
Healthcare -2.47746 -0.61450 -1.71699 -2.01294 -1.46816
Banks and Insurance -2.59744 -0.27931 -1.13176 -2.02448 -0.09816
Retail -2.73689 -0.11871 -1.39821 -0.10146 -1.85337
Consumer Durables and Apparels -2.07927 0.61467 -0.89679 -0.43861 -0.65203
Automobiles 0.28541 -2.00035 -1.35813 -0.46765 -0.46629
Food and Beverages -3.36075 -0.34519 -1.42951 -0.90786 -0.77456
Transportation -3.38066 -0.37319 -0.80855 -0.76265 1.63282
Media -2.37199 -0.15372 -1.12748 -0.47646 -1.94055
Software and Services -3.04888 -0.76684 -1.19820 -1.45096 -0.95420
Consumer Services -3.26571 -1.05223 -1.09538 -0.92370 0.79061
Household and Personal Products -2.47512 0.23920 -1.68076 -0.15240 -0.55000
Technology, Hardware and Equipments -2.99985 -0.64480 -1.14041 -1.08230 -0.70051
Others 1 -1.42818 -0.70132 -0.74907 -0.67671 -0.98376
This table presents the non-parametric t-test results for 18 Singapore Based Industries after September 11, Bali, Madrid, London and Mumbai terrorist attacks.
1 This category is comprised of the Pharmaceuticals, Utilities, Defence, and Telecommunications sectors.
Table 5: The Impact of Five Terrorist Attacks on Singapore Based Industry Indices- Non-Parametric Results

36
Table 6(a): The Impact of September 11 Attack on Singapore Based Industry Indices- Regression Analysis
Industry
Automobiles -0.00071 0.00277 -0.06750 -0.00071 0.00277 0.00331 T-Statistics -0.68 0.05 -0.13 -0.68 0.05 0.13 Banks and Insurance 0.00080 0.03496 0.10433 0.00080 0.03496 -0.00512 T-Statistics 1.00 0.86 0.27 1.00 0.86 -0.27 Capital Goods -0.00078 -0.02441 -0.10363 -0.00078 -0.02441 0.00509 T-Statistics -1.06 -0.65 -0.29 -1.06 -0.65 0.29
(C.D)1 and Apparels -0.00081 0.07994 -0.40955 -0.00081 0.07994 0.02010
T-Statistics -0.76 1.47 -0.79 -0.76 1.47 0.79 Consumer Services -0.00076 0.01073 -0.03261 -0.00076 0.01073 0.00160 T-Statistics -1.01 0.28 -0.09 -1.01 0.28 0.09 Diversified Financials 0.00007 0.04387 0.04477 0.00007 0.04387 -0.00220 T-Statistics 0.07 0.88 0.09 0.07 0.88 -0.09 Energy 0.00100 0.03113 -0.54790 -0.00007 -0.06450 -0.01648 T-Statistics 1.91 1.27 -1.15 -0.07 -1.18 -0.64 Food and Beverages -0.00036 -0.01953 -0.09733 -0.00036 -0.01953 0.00478 T-Statistics -0.60 -0.63 -0.33 -0.60 -0.63 0.33 Healthcare -0.00055 -0.01926 0.40490 -0.00055 -0.01926 -0.01987 T-Statistics -0.31 -0.21 0.47 -0.31 -0.21 -0.47
(H.P)2
Products -0.00045 -0.01505 -0.25534 -0.00045 -0.01505 0.01253
T-Statistics -0.50 -0.33 -0.59 -0.50 -0.33 0.59 Materials -0.00068 0.11593 0.18935 -0.00068 0.11593 -0.00929 T-Statistics -0.70 2.34 0.40 -0.70 2.34 -0.40 Media -0.00097 -0.11943 0.29486 -0.00097 -0.11943 -0.01447 T-Statistics -0.98 -2.37 0.61 -0.98 -2.37 -0.61 Real Estate -0.00044 0.02476 -0.08396 -0.00044 0.02476 0.00412 T-Statistics -0.63 0.70 -0.25 -0.63 0.70 0.25 Retail -0.00116 0.07371 -0.56123 -0.00116 0.07371 0.02755 T-Statistics -1.38 1.73 -1.37 -1.38 1.73 1.37 Software and Services -0.00093 0.03715 0.32702 -0.00093 0.03715 -0.01605 T-Statistics -0.62 0.49 0.45 -0.62 0.49 -0.45
(T.H) 3and Equipment -0.00067 -0.01196 0.92011 -0.00067 -0.01196 -0.04516
T-Statistics -0.50 -0.18 1.43 -0.50 -0.18 -1.43 Transportation -0.00020 -0.01510 0.01293 -0.00020 -0.01510 -0.00064 T-Statistics -0.25 -0.37 0.03 -0.25 -0.37 -0.03 Others 0.00006 -0.05089 0.05199 0.00006 -0.05089 -0.00255 T-Statistics 0.05 -0.81 0.09 0.05 -0.81 -0.09
This table presents the regression analysis results for 18 Singapore Based Industries incorporating the terrorist attack in the United States. The first multiplicative dummy variable equation
itftmtIftmtIIftIt~D*]r~r~[]r~r~[r~r~ ε+−β+−β+φ=− 21 , illustrates the impact on systematic risk, and the second additive
dummy variable equation, ε+α+−α+ϕ=− 21 ~D]r~r~[r~r~ IftmtIIftIt , shows the impact on the intercept.
1The term (C.D) represents the sector, Consumer Durables.
2The term (H.P) represents the sector, Household and Personal Products.
3The term (T.H) represents the sector, Technology, Hardware and Equipment.
itftmtIftmtIIftIt~D*]r~r~[]r~r~[r~r~ ε+−β+−β+φ=− 21
itIftmtIIftIt~D]r~r~[r~r~ ε+α+−α+ϕ=− 21
1
Iβ 2
Iβ iϕ 1
Iα 2
Iαiφ

37
Table 6(b): The Impact of the Bali Bombings on Singapore Based Industry Indices- Regression Analysis
.
This table presents the regression analysis results for 18 Singapore Based Industries incorporating the terrorist attack in the United States. The first multiplicative dummy variable equation,
itftmtIftmtIIftIt~D*]r~r~[]r~r~[r~r~ ε+−β+−β+φ=− 21 , illustrates the impact on systematic risk, and the second additive
dummy variable equation, ε+α+−α+ϕ=− 21 ~D]r~r~[r~r~ IftmtIIftIt , shows the impact on the intercept.
1The term (C.D) represents the sector, Consumer Durables.
2The term (H. P) represents the sector, Household and Personal Products.
3The term (T.H) represents the sector, Technology, Hardware and Equipments.
Industry
Automobiles 0.00000 0.03154 -2.85004 0.00000 0.03154 0.04523 T-Statistics 0.01 0.64 -1.68 0.01 0.64 1.68 Banks & Insurance 0.00082 0.04275 -1.43561 0.00082 0.04275 0.02278 T-Statistics 1.29 1.27 -1.23 1.29 1.27 1.23 Capital Goods -0.00017 0.01348 -1.61568 -0.00017 0.01348 0.02564 T-Statistics -0.29 0.42 -1.46 -0.29 0.42 1.46
(C.D)1 and Apparels 0.00013 0.05734 0.34694 0.00013 0.05734 -0.00551
T-Statistics 0.15 1.29 0.22 0.15 1.29 -0.22 Consumer Services -0.00024 0.01444 -2.62257 -0.00024 0.01444 0.04162 T-Statistics -0.38 0.43 -2.27 -0.38 0.43 2.27 Diversified Financials 0.00023 0.05755 -1.06768 0.00023 0.05755 0.01694 T-Statistics 0.31 1.47 -0.79 0.31 1.47 0.79 Energy 0.00073 -0.01061 -1.25375 0.00073 -0.01061 0.01990 T-Statistics 0.88 -0.24 -0.82 0.88 -0.24 0.82 Food & Beverages 0.00002 -0.00034 -0.96021 0.00002 -0.00034 0.01524 T-Statistics 0.04 -0.01 -0.99 0.04 -0.01 0.99 Healthcare -0.00005 0.02858 -0.67677 -0.00005 0.02858 0.01074 T-Statistics -0.04 0.42 -0.29 -0.04 0.42 0.29
(H.P)2
Products 0.00029 0.01842 -1.07015 0.00029 0.01842 0.01698 T-Statistics 0.41 0.49 -0.83 0.41 0.49 0.83 Materials 0.00032 0.10641 0.07381 0.00032 0.10641 -0.00117 T-Statistics 0.42 2.64 0.05 0.42 2.64 -0.05 Media -0.31524 -1.19610 0.09371 -0.00025 -0.04942 -0.00213 T-Statistics 0.00 -0.05 0.13 -0.32 -1.20 -0.09 Real Estate -0.00023 0.05254 -0.86130 -0.00023 0.05254 0.01367 T-Statistics -0.39 1.72 -0.81 -0.39 1.72 0.81 Retail -0.00032 0.07670 -0.01802 -0.00032 0.07670 0.00029 T-Statistics -0.47 2.14 -0.01 -0.47 2.14 0.01 Software & Services -0.00108 0.02588 -2.94947 -0.00108 0.02588 0.04681 T-Statistics -0.96 0.44 -1.43 -0.96 0.44 1.43
(T.H)3 & Equipment -0.00015 0.02507 -4.16630 -0.00015 0.02507 0.06611
T-Statistics -0.15 0.46 -2.21 -0.15 0.46 2.21 Transportation -0.00011 0.01379 -1.51821 -0.00011 0.01379 0.02409 T-Statistics -0.17 0.39 -1.23 -0.17 0.39 1.23 Others 0.00046 -0.01683 -1.62630 0.00046 -0.01683 0.02581 T-Statistics 0.49 -0.34 -0.95 0.49 -0.34 0.95
1
Iβiφ 2
Iβ iϕ 1
Iα 2
Iα
itftmtIftmtIIftIt~D*]r~r~[]r~r~[r~r~ ε+−β+−β+φ=− 21
itIftmtIIftIt~D]r~r~[r~r~ ε+α+−α+ϕ=− 21

38
Table 6(c): The Impact of the Madrid Bombings on Singapore Based Industry Indices- Regression Analysis
Industry
Automobiles 0.00095 0.01321 -5.09932 0.00095 0.01321 0.05569 T-Statistics 1.17 0.33 -1.96 1.17 0.33 1.96 Banks & Insurance 0.00061 0.04468 -1.93898 0.00061 0.04468 0.02117 T-Statistics 1.06 1.56 -1.05 1.06 1.56 1.05 Capital Goods 0.00014 0.03102 -3.38903 0.00014 0.03102 0.03701 T-Statistics 0.24 1.12 -1.90 0.24 1.12 1.90
(C.D)1 and Apparels -0.00017 0.05698 -3.58233 -0.00017 0.05698 0.03912
T-Statistics -0.23 1.56 -1.52 -0.23 1.56 1.52 Consumer Services -0.00017 0.03688 -3.18672 -0.00017 0.03688 0.03480 T-Statistics -0.30 1.29 -1.72 -0.30 1.29 1.72 Diversified Financials 0.00029 0.06360 -3.41402 0.00029 0.06360 0.03728 T-Statistics 0.46 2.04 -1.69 0.46 2.04 1.69 Energy 0.00127 0.02366 -5.39832 0.00127 0.02366 0.05895 T-Statistics 1.74 0.66 -2.32 1.74 0.66 2.32 Food & Beverages 0.00020 0.02153 -3.40330 0.00020 0.02153 0.03716 T-Statistics 0.38 0.83 -2.03 0.38 0.83 2.03 Healthcare 0.00013 0.04204 -3.36362 0.00013 0.04204 0.03673 T-Statistics 0.14 0.86 -1.07 0.14 0.86 1.07
(H.P)2
Products 0.00032 0.04840 -3.27825 0.00032 0.04840 0.03580 T-Statistics 0.51 1.57 -1.64 0.51 1.57 1.64 Materials 0.00024 0.10614 -2.78928 0.00024 0.10614 0.03046 T-Statistics 0.35 3.14 -1.28 0.35 3.14 1.28 Media -0.34421 -0.31637 -1.72521 -0.00023 -0.01044 0.04024 T-Statistics 0.00 -0.01 -3.69 -0.34 -0.32 1.73 Real Estate -0.00004 0.07430 -2.82959 -0.00004 0.07430 0.03090 T-Statistics -0.07 2.73 -1.61 -0.07 2.73 1.61 Retail -0.00010 0.07263 -3.00439 -0.00010 0.07263 0.03281 T-Statistics 0.22 0.44 -1.34 -0.16 2.40 1.54 Software & Services -0.00050 0.05559 -3.62900 -0.00050 0.05559 0.03963 T-Statistics -0.56 1.27 -1.28 -0.56 1.27 1.28
(T.H)3 & Equipment 0.00009 0.03581 -4.75795 0.00009 0.03581 0.05196
T-Statistics 0.12 0.90 -1.84 0.12 0.90 1.84 Transportation 0.00066 0.02032 -3.59273 0.00066 0.02032 0.03923 T-Statistics 1.06 0.67 -1.82 1.06 0.67 1.82 Others 0.00017 0.01683 -3.31265 0.00017 0.01683 0.03617
This table presents the regression analysis results for 18 Singapore Based Industries incorporating the terrorist attack in the United States. The first multiplicative dummy variable
equation, itftmtIftmtIIftIt~D*]r~r~[]r~r~[r~r~ ε+−β+−β+φ=− 21 , illustrates the impact on systematic risk, and the second
additive dummy variable equation, ε+α+−α+ϕ=− 21 ~D]r~r~[r~r~ IftmtIIftIt , shows the impact on the intercept.
1The term(C.D) represents the sector, Consumer Durables.
2The term (H.P) represents the sector, Household and Personal Products.
3The term (T.H) represents the sector, Technology, Hardware and Equipments.
itftmtIftmtIIftIt Drrrrrr εββφ ~*]~~[]~~[~~ 21 +−+−+=−itIftmtIIftIt Drrrr εααϕ ~]~~[~~ 21 ++−+=−
1
Iβiφ 2
Iβ iϕ 1
Iα 2
Iα
39
Table 6(d): The Impact of the London Bombings on Singapore Based Industry Indices- Regression Analysis
.
Industry
Automobiles 0.00065 0.02719 -0.75723 0.00065 0.02719 0.00187 T-Statistics 0.98 0.78 -0.07 0.98 0.78 0.07 Banks & Insurance 0.00072 0.05196 -3.27454 0.00072 0.05196 0.00809 T-Statistics 1.50 2.07 -0.42 1.50 2.07 0.42 Capital Goods 0.00037 0.03965 -3.33675 0.00037 0.03965 0.00825 T-Statistics 0.77 1.62 -0.44 0.77 1.62 0.44
(C.D)1 and Apparels -0.00005 0.06317 1.47512 -0.00005 0.06317 -0.00365
T-Statistics -0.09 1.99 0.15 -0.09 1.99 -0.15 Consumer Services 0.00013 0.04548 -1.63428 0.00013 0.04548 0.00404 T-Statistics 0.27 1.79 -0.21 0.27 1.79 0.21 Diversified Financials 0.00045 0.07102 -1.32665 0.00045 0.07102 0.00328 T-Statistics 0.86 2.62 -0.16 0.86 2.62 0.16 Energy 0.00137 0.02940 -1.72951 0.00137 0.02940 0.00428 T-Statistics 2.26 0.93 -0.18 2.26 0.93 0.18 Food & Beverages 0.00024 0.02753 -3.58312 0.00024 0.02753 0.00886 T-Statistics 0.53 1.19 -0.50 0.53 1.19 0.50 Healthcare 0.00019 0.04509 -10.25462 0.00019 0.04509 0.02535 T-Statistics 0.24 1.09 -0.81 0.24 1.09 0.81
(H.P)2
Products 0.00037 0.05223 -3.64771 0.00037 0.05223 0.00902 T-Statistics 0.71 1.94 -0.44 0.71 1.94 0.44 Materials 0.00020 0.10509 -0.64100 0.00020 0.10509 0.00158 T-Statistics 0.36 3.57 -0.07 0.36 3.57 0.07 Media -0.00007 0.00494 0.52084 -0.00007 0.00494 -0.00129 T-Statistics -0.13 0.17 0.06 -0.13 0.17 -0.06 Real Estate 0.00030 0.08098 -4.82460 0.00030 0.08098 -4.82460 T-Statistics 0.63 3.34 -0.65 0.46 0.43 0.32 Retail 0.00027 0.07993 -2.84591 0.00027 0.07993 0.00704 T-Statistics 0.51 2.96 -0.34 0.51 2.96 0.34 Software & Services -0.00037 0.06047 -3.17054 -0.00037 0.06047 0.00784 T-Statistics -0.51 1.62 -0.28 -0.51 1.62 0.28
(T.H)3 & Equipment -0.00002 0.04528 -8.35867 -0.00002 0.04528 0.02066
T-Statistics -0.03 1.31 -0.79 -0.03 1.31 0.79 Transportation 0.00102 0.02760 -9.07000 0.00102 0.02760 0.02242 T-Statistics 1.92 1.00 -1.07 1.92 1.00 1.07 Others 0.00029 0.01408 -3.19482 0.00029 0.01408 0.00790 T-Statistics 0.46 0.43 -0.32 0.46 0.43 0.32
This table presents the regression analysis results for 18 Singapore Based Industries incorporating the terrorist attack in the United States. The first multiplicative dummy variable equation,
itftmtIftmtIIftIt~D*]r~r~[]r~r~[r~r~ ε+−β+−β+φ=− 21 , illustrates the impact on systematic risk, and the second additive
dummy variable equation, ε+α+−α+ϕ=− 21 ~D]r~r~[r~r~ IftmtIIftIt , shows the impact on the intercept.
1The term (C.D) represents the sector Consumer Durable
2The term (H.P) represents the sector, Household and Personal Products.
3The term (T.H) represents the sector, Technology, Hardware and Equipments.
itftmtIftmtIIftIt Drrrrrr εββφ ~*]~~[]~~[~~ 21 +−+−+=−itIftmtIIftIt Drrrr εααϕ ~]~~[~~ 21 ++−+=−
1
Iβiφ 2
Iβ iϕ 1
Iα 2
Iα

40
Table 6(e): The Impact of the Mumbai Bombings on Singapore Based Industry Indices- Regression Analysis
.
Industry
Automobiles 0.00048 0.03650 -0.31125 0.00048 0.03650 -0.00271 T-Statistics 0.82 1.14 -0.11 0.82 1.14 -0.11 Banks & Insurance 0.00053 0.05811 0.35074 0.00053 0.05811 0.00305 T-Statistics 1.25 2.51 0.17 1.25 2.51 0.17 Capital Goods 0.00019 0.04706 0.21911 0.00019 0.04706 0.00191 T-Statistics 0.46 2.07 0.11 0.46 2.07 0.11
(C.D)1 and Apparels -0.00042 0.06125 1.63560 -0.00042 0.06125 0.01423
T-Statistics -0.78 2.07 0.61 -0.78 2.07 0.61 Consumer Services 0.00001 0.05174 0.31469 0.00001 0.05174 0.00274 T-Statistics 0.03 2.20 0.15 0.03 2.20 0.15 Diversified Financials 0.00026 0.07744 0.29454 0.00026 0.07744 0.00256 T-Statistics 0.57 3.12 0.13 0.57 3.12 0.13 Energy 0.00097 0.02875 0.86222 0.00097 0.02875 0.00750 T-Statistics 1.77 0.96 0.32 1.77 0.96 0.32 Food & Beverages 0.00015 0.03247 -0.83980 0.00015 0.03247 -0.00731 T-Statistics 0.36 1.49 -0.43 0.36 1.49 -0.43 Healthcare 0.00012 0.04625 0.59601 0.00012 0.04625 0.00519 T-Statistics 0.18 1.23 0.18 0.18 1.23 0.18
(H.P)2
Products 0.00029 0.05212 -1.00264 0.00029 0.05212 -0.00873 T-Statistics 0.62 2.08 -0.44 0.62 2.08 -0.44 Materials -0.00007 0.11647 -1.05012 -0.00007 0.11647 -0.00914 T-Statistics -0.13 4.14 -0.41 -0.13 4.14 -0.41 Media -0.00034 0.01487 -0.37953 -0.00034 0.01487 -0.00330 T-Statistics -0.68 0.55 -0.16 -0.68 0.55 -0.16 Real Estate 0.00018 0.08271 0.59588 0.00018 0.08271 0.00519 T-Statistics 0.42 3.62 0.29 0.42 3.62 0.29 Retail 0.00015 0.08764 0.23711 0.00015 0.08764 0.00206 T-Statistics 0.32 3.45 0.10 0.32 3.45 0.10 Software & Services -0.00036 0.06209 -0.59793 -0.00036 0.06209 -0.00520 T-Statistics -0.57 1.83 -0.19 -0.57 1.83 -0.19
(T.H)3 & Equipment -0.00029 0.04481 -1.32888 -0.00029 0.04481 -0.01156
T-Statistics -0.49 1.41 -0.46 -0.49 1.41 -0.46 Transportation 0.00085 0.03454 0.11799 0.00085 0.03454 0.00103 T-Statistics 1.76 1.32 0.05 1.76 1.32 0.05 Others 0.00026 0.01883 -0.35181 0.00026 0.01883 -0.00306 T-Statistics 0.48 0.63 -0.13 0.48 0.63 -0.13
This table presents the regression analysis results for 18 Singapore Based Industries incorporating the terrorist attack in the United States. The first multiplicative dummy variable equation,
itftmtIftmtIIftIt~D*]r~r~[]r~r~[r~r~ ε+−β+−β+φ=− 21 , illustrates the impact on systematic risk, and the second additive
dummy variable equation, ε+α+−α+ϕ=− 21 ~D]r~r~[r~r~ IftmtIIftIt , shows the impact on the intercept.
1The term(C.D) represents the sector Consumer Durable.
2The term (H & P) represents the sector, Household and Personal Products.
3The term (T.H) represents the sector, Technology, Hardware and Equipments.
itftmtIftmtIIftIt Drrrrrr εββφ ~*]~~[]~~[~~ 21 +−+−+=−itIftmtIIftIt Drrrr εααϕ ~]~~[~~ 21 ++−+=−
1
Iβiφ 2
Iβ iϕ 1
Iα 2
Iα

41
Table 7(a): The LONG TERM Impact of September 11 attack on Singapore Based Industry Indices- Regression Analysis
itIftmtIftmtIIit SDSDrrrrr εδδδϕ ~*]~~[]~~[~ 321 ++−+−+=
Industry Iϕ 1
Iδ 2
Iδ 3
Iδ
Automobiles -0.00061 -0.00483 0.04661 0.00153 T-Statistics -0.58 -0.09 0.76 1.25 Banks & Insurance 0.00092 0.02858 0.02584 -0.00040 T-Statistics 1.21 0.73 0.58 -0.45 Capital Goods -0.00065 -0.03740 0.11131 0.00137 T-Statistics -0.87 -0.97 2.54 1.56 Consumer Durables and Apparels -0.00056 0.08038 -0.02509 0.00028 T-Statistics -0.57 1.61 -0.44 0.25 Consumer Services -0.00060 -0.00089 0.08953 0.00114 T-Statistics -0.78 -0.02 1.97 1.26 Diversified Financials 0.00010 0.04319 0.03197 0.00037 T-Statistics 0.12 1.03 0.67 0.39 Energy 0.00001 -0.06970 0.12889 0.00133 T-Statistics 0.01 -1.38 2.23 1.14 Food & Beverages -0.00040 -0.02654 0.08285 0.00091 T-Statistics -0.56 -0.72 1.98 1.08 Healthcare -0.00047 -0.03289 0.11941 0.00088 T-Statistics -0.38 -0.52 1.65 0.60
(H.P)1 Products -0.00032 -0.02485 0.06621 0.00111
T-Statistics -0.39 -0.58 1.36 1.14 Materials -0.00052 0.10918 -0.03365 0.00072 T-Statistics -0.56 2.29 -0.62 0.66 Media -0.00087 -0.12079 0.19124 0.00094 T-Statistics -0.98 -2.65 3.68 0.90 Real Estate -0.00030 0.03155 0.04978 0.00095 T-Statistics -0.40 0.81 1.11 1.06 Retail -0.00110 0.06950 0.01395 0.00197 T-Statistics -1.32 1.61 0.28 1.99 Software & Services -0.00094 0.03872 0.02992 0.00103 T-Statistics -0.85 0.68 0.46 0.79
(T.H)2
& Equipment -0.00050 -0.01564 0.07188 0.00052 T-Statistics -0.48 -0.29 1.18 0.42 Transportation -0.00012 -0.03682 0.12162 0.00158 T-Statistics -0.14 -0.83 2.40 1.56 Others 0.00010 -0.04936 0.10395 0.00031 T-Statistics 0.10 -0.98 1.80 0.27
This table presents the regression analysis results for 18 Singapore Based Industries incorporating the terrorist
attack in the United States. The equation, itIftmtIftmtIIit~SDSD*]r~r~[]r~r~[r~ ε+δ+−δ+−δ+ϕ= 321 , illustrates the long
term impact on systematic risk. 1The term (H & P) represents the sector, Household and Personal Products.
2The term (T.H) represents the sector, Technology, Hardware and Equipments.

42
Table 7(b): The LONG TERM Impact of the Bali Bombings on Singapore Based Industry Indices- Regression Analysis
itIftmtIftmtIIit SDSDrrrrr εδδδϕ ~*]~~[]~~[~ 321 ++−+−+=
Industry Iϕ 1
Iδ 2
Iδ 3
Iδ
Automobiles 0.00002 0.02384 0.01910 0.00084 T-Statistics 0.02 0.73 0.36 0.75 Banks & Insurance 0.00075 0.04605 0.00351 -0.00021 T-Statistics 1.22 1.41 0.09 -0.26 Capital Goods -0.00025 0.01630 0.04761 0.00103 T-Statistics -0.41 0.51 1.21 1.28 Consumer Durables and Apparels 0.00007 0.06105 0.00086 -0.00074 T-Statistics 0.09 1.46 0.02 -0.71 Consumer Services -0.00030 0.02046 0.07108 0.00090 T-Statistics -0.47 0.62 1.75 1.08 Diversified Financials 0.00013 0.05980 0.01178 0.00041 T-Statistics 0.19 1.71 0.28 0.47 Energy 0.00059 -0.00678 0.05430 0.00066 T-Statistics 0.74 -0.16 1.05 0.62 Food & Beverages -0.00006 0.00293 0.05134 0.00054 T-Statistics -0.10 0.10 1.37 0.71 Healthcare -0.00011 0.03373 0.03771 0.00048 T-Statistics -0.11 0.64 0.58 0.36
(H.P)1 Products 0.00019 0.01993 0.00926 0.00051
T-Statistics 0.28 0.56 0.21 0.58 Materials 0.00027 0.11000 -0.03928 -0.00046 T-Statistics 0.36 2.77 -0.81 -0.47
Media -0.00039 -0.05334 0.11946 0.00035 T-Statistics -0.54 -1.40 2.56 0.37 Real Estate -0.00035 0.05488 0.02182 0.00127 T-Statistics -0.56 1.68 0.55 1.56 Retail -0.00040 0.08211 -0.00281 0.00125 T-Statistics -0.59 2.28 -0.06 1.39 Software & Services -0.00119 0.03273 0.04267 0.00172 T-Statistics -1.32 0.69 0.73 1.44
(T.H)2
& Equipment -0.00031 0.03617 0.00508 0.00032 T-Statistics -0.36 0.81 0.09 0.29 Transportation -0.00019 0.01767 0.05753 0.00212 T-Statistics -0.27 0.48 1.27 2.29 Others 0.00034 -0.01484 0.06824 -0.00003 T-Statistics 0.43 -0.35 1.32 -0.03
This table presents the regression analysis results for 18 Singapore Based Industries incorporating the terrorist
attack in Bali. The equation, itIftmtIftmtIIit~SDSD*]r~r~[]r~r~[r~ ε+δ+−δ+−δ+ϕ= 321 , illustrates the long term impact
on systematic risk. 1The term (H & P) represents the sector, Household and Personal Products.
2The term (T.H) represents the sector, Technology, Hardware and Equipments.
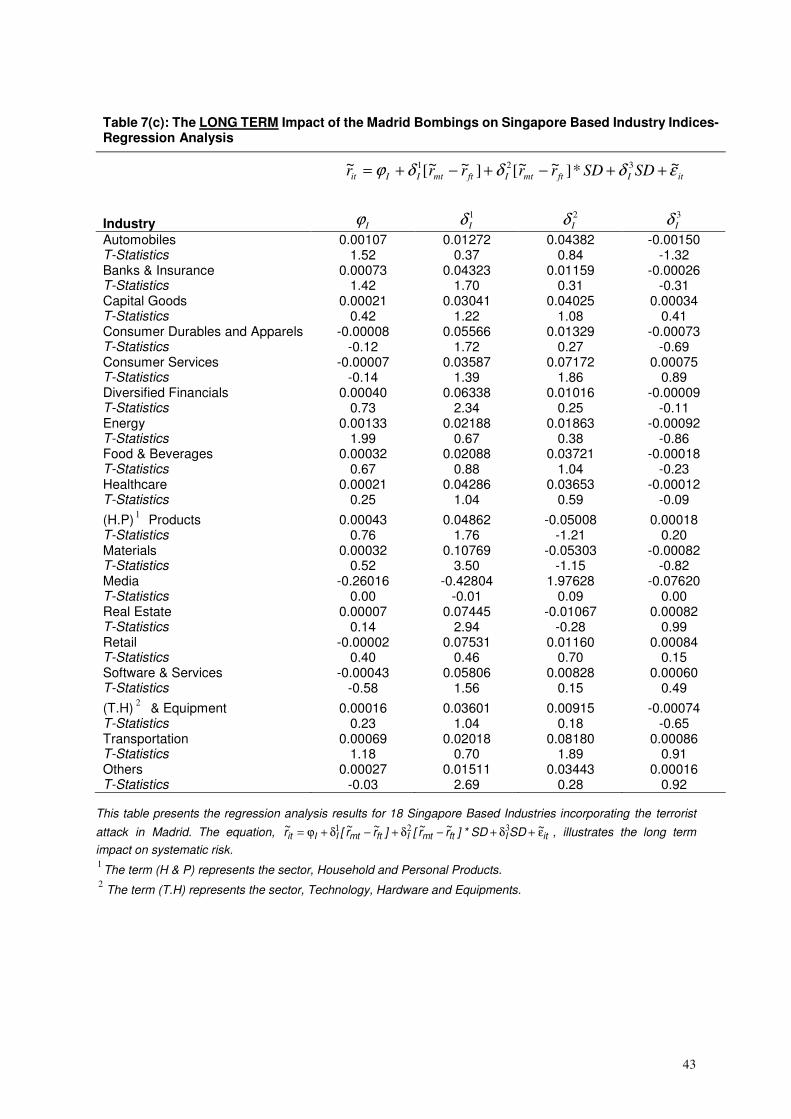
43
Table 7(c): The LONG TERM Impact of the Madrid Bombings on Singapore Based Industry Indices- Regression Analysis
itIftmtIftmtIIit SDSDrrrrr εδδδϕ ~*]~~[]~~[~ 321 ++−+−+=
Industry Iϕ 1
Iδ 2
Iδ 3
Iδ
Automobiles 0.00107 0.01272 0.04382 -0.00150 T-Statistics 1.52 0.37 0.84 -1.32 Banks & Insurance 0.00073 0.04323 0.01159 -0.00026 T-Statistics 1.42 1.70 0.31 -0.31 Capital Goods 0.00021 0.03041 0.04025 0.00034 T-Statistics 0.42 1.22 1.08 0.41 Consumer Durables and Apparels -0.00008 0.05566 0.01329 -0.00073 T-Statistics -0.12 1.72 0.27 -0.69 Consumer Services -0.00007 0.03587 0.07172 0.00075 T-Statistics -0.14 1.39 1.86 0.89 Diversified Financials 0.00040 0.06338 0.01016 -0.00009 T-Statistics 0.73 2.34 0.25 -0.11 Energy 0.00133 0.02188 0.01863 -0.00092 T-Statistics 1.99 0.67 0.38 -0.86 Food & Beverages 0.00032 0.02088 0.03721 -0.00018 T-Statistics 0.67 0.88 1.04 -0.23 Healthcare 0.00021 0.04286 0.03653 -0.00012 T-Statistics 0.25 1.04 0.59 -0.09
(H.P)1 Products 0.00043 0.04862 -0.05008 0.00018
T-Statistics 0.76 1.76 -1.21 0.20 Materials 0.00032 0.10769 -0.05303 -0.00082 T-Statistics 0.52 3.50 -1.15 -0.82 Media -0.26016 -0.42804 1.97628 -0.07620 T-Statistics 0.00 -0.01 0.09 0.00 Real Estate 0.00007 0.07445 -0.01067 0.00082 T-Statistics 0.14 2.94 -0.28 0.99 Retail -0.00002 0.07531 0.01160 0.00084 T-Statistics 0.40 0.46 0.70 0.15 Software & Services -0.00043 0.05806 0.00828 0.00060 T-Statistics -0.58 1.56 0.15 0.49
(T.H)2
& Equipment 0.00016 0.03601 0.00915 -0.00074 T-Statistics 0.23 1.04 0.18 -0.65 Transportation 0.00069 0.02018 0.08180 0.00086 T-Statistics 1.18 0.70 1.89 0.91 Others 0.00027 0.01511 0.03443 0.00016 T-Statistics -0.03 2.69 0.28 0.92
This table presents the regression analysis results for 18 Singapore Based Industries incorporating the terrorist
attack in Madrid. The equation, itIftmtIftmtIIit~SDSD*]r~r~[]r~r~[r~ ε+δ+−δ+−δ+ϕ= 321 , illustrates the long term
impact on systematic risk. 1The term (H & P) represents the sector, Household and Personal Products.
2The term (T.H) represents the sector, Technology, Hardware and Equipments.
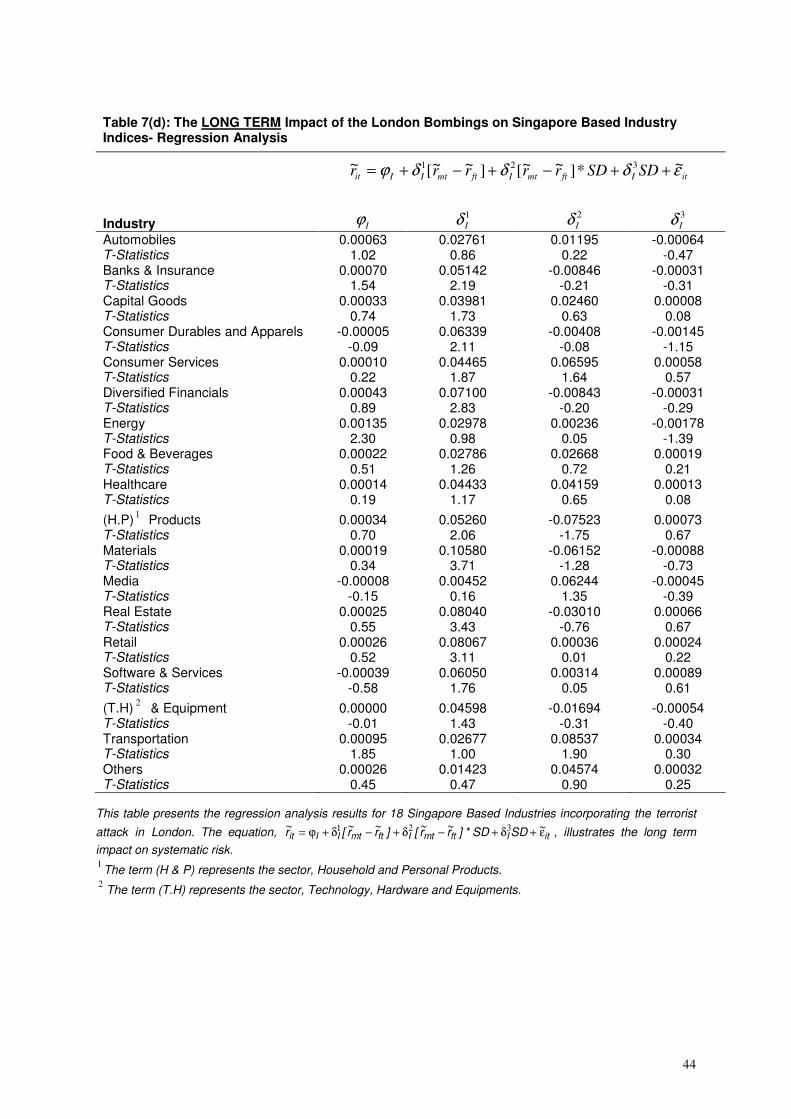
44
Table 7(d): The LONG TERM Impact of the London Bombings on Singapore Based Industry Indices- Regression Analysis
itIftmtIftmtIIit SDSDrrrrr εδδδϕ ~*]~~[]~~[~ 321 ++−+−+=
Industry Iϕ 1
Iδ 2
Iδ 3
Iδ
Automobiles 0.00063 0.02761 0.01195 -0.00064 T-Statistics 1.02 0.86 0.22 -0.47 Banks & Insurance 0.00070 0.05142 -0.00846 -0.00031 T-Statistics 1.54 2.19 -0.21 -0.31 Capital Goods 0.00033 0.03981 0.02460 0.00008 T-Statistics 0.74 1.73 0.63 0.08 Consumer Durables and Apparels -0.00005 0.06339 -0.00408 -0.00145 T-Statistics -0.09 2.11 -0.08 -1.15 Consumer Services 0.00010 0.04465 0.06595 0.00058 T-Statistics 0.22 1.87 1.64 0.57 Diversified Financials 0.00043 0.07100 -0.00843 -0.00031 T-Statistics 0.89 2.83 -0.20 -0.29 Energy 0.00135 0.02978 0.00236 -0.00178 T-Statistics 2.30 0.98 0.05 -1.39 Food & Beverages 0.00022 0.02786 0.02668 0.00019 T-Statistics 0.51 1.26 0.72 0.21 Healthcare 0.00014 0.04433 0.04159 0.00013 T-Statistics 0.19 1.17 0.65 0.08
(H.P)1 Products 0.00034 0.05260 -0.07523 0.00073
T-Statistics 0.70 2.06 -1.75 0.67 Materials 0.00019 0.10580 -0.06152 -0.00088 T-Statistics 0.34 3.71 -1.28 -0.73 Media -0.00008 0.00452 0.06244 -0.00045 T-Statistics -0.15 0.16 1.35 -0.39 Real Estate 0.00025 0.08040 -0.03010 0.00066 T-Statistics 0.55 3.43 -0.76 0.67 Retail 0.00026 0.08067 0.00036 0.00024 T-Statistics 0.52 3.11 0.01 0.22 Software & Services -0.00039 0.06050 0.00314 0.00089 T-Statistics -0.58 1.76 0.05 0.61
(T.H)2
& Equipment 0.00000 0.04598 -0.01694 -0.00054 T-Statistics -0.01 1.43 -0.31 -0.40 Transportation 0.00095 0.02677 0.08537 0.00034 T-Statistics 1.85 1.00 1.90 0.30 Others 0.00026 0.01423 0.04574 0.00032 T-Statistics 0.45 0.47 0.90 0.25
This table presents the regression analysis results for 18 Singapore Based Industries incorporating the terrorist
attack in London. The equation, itIftmtIftmtIIit~SDSD*]r~r~[]r~r~[r~ ε+δ+−δ+−δ+ϕ= 321 , illustrates the long term
impact on systematic risk. 1The term (H & P) represents the sector, Household and Personal Products.
2The term (T.H) represents the sector, Technology, Hardware and Equipments.

45
Table 7(e): The LONG TERM Impact of the Mumbai Bombings on Singapore Based Industry Indices- Regression Analysis
itIftmtIftmtIIit SDSDrrrrr εδδδϕ ~*]~~[]~~[~ 321 ++−+−+=
Industry Iϕ 1
Iδ 2
Iδ 3
Iδ
Automobiles 0.00047 0.03524 -0.01344 0.00044 T-Statistics 0.82 1.13 -0.24 0.21 Banks & Insurance 0.00052 0.05741 -0.03471 0.00165 T-Statistics 1.24 2.53 -0.84 1.07 Capital Goods 0.00017 0.04571 0.00171 0.00245 T-Statistics 0.40 2.05 0.04 1.62 Consumer Durables and Apparels -0.00044 0.06011 0.00017 0.00112 T-Statistics -0.82 2.07 0.00 0.57 Consumer Services 0.00000 0.05135 0.04574 0.00298 T-Statistics -0.01 2.23 1.09 1.90 Diversified Financials 0.00025 0.07619 -0.03227 0.00173 T-Statistics 0.55 3.14 -0.73 1.05 Energy 0.00097 0.02686 0.00894 0.00011 T-Statistics 1.78 0.91 0.17 0.05 Food & Beverages 0.00010 0.03275 0.00852 0.00214 T-Statistics 0.26 1.54 0.22 1.48 Healthcare 0.00009 0.04586 0.04017 0.00091 T-Statistics 0.14 1.25 0.60 0.36
(H.P)1 Products 0.00026 0.05156 -0.09191 0.00334
T-Statistics 0.58 2.09 -2.05 1.99 Materials -0.00010 0.11577 -0.10951 0.00169 T-Statistics -0.19 4.20 -2.19 0.90 Media -0.00035 0.01329 0.03543 0.00228 T-Statistics -0.71 0.50 0.74 1.27 Real Estate 0.00017 0.08232 -0.04900 0.00306 T-Statistics 0.41 3.63 -1.19 1.98 Retail 0.00013 0.08696 -0.02745 0.00257 T-Statistics 0.28 3.47 -0.60 1.51 Software & Services -0.00039 0.06108 -0.00456 0.00253 T-Statistics -0.63 1.84 -0.08 1.12
(T.H)2
& Equipment -0.00033 0.04515 -0.02641 0.00288 T-Statistics -0.57 1.46 -0.47 1.37 Transportation 0.00081 0.03335 0.06868 0.00277 T-Statistics 1.70 1.29 1.47 1.58 Others 0.00025 0.01745 0.03939 0.00103 T-Statistics 0.46 0.60 0.74 0.52
This table presents the regression analysis results for 18 Singapore Based Industries incorporating the terrorist
attack in London. The equation, itIftmtIftmtIIit~SDSD*]r~r~[]r~r~[r~ ε+δ+−δ+−δ+ϕ= 321 , illustrates the long term
impact on systematic risk. 1The term (H & P) represents the sector, Household and Personal Products.
2The term (T.H) represents the sector, Technology, Hardware and Equipments.

46