Embed Size (px)
Citation preview

CENTRAL SAVANNAH RIVER AREA
REGIONAL COMMISSION AUGUSTA, GEORGIA
COMPREHENSIVE ANNUAL FINANCIAL REPORT FISCAL YEAR ENDED JUNE 30, 2011
Burke Columbia Glascock Hancock Jefferson Jenkins Lincoln
McDuffie Richmond Taliaferro Warren Washington Wilkes
PREAMBLE OF THE CSRA REGIONAL COMMISSION
It is hereby affirmed that the local units of government in the CSRA have many common concerns that transcend their individual borders; the destinies of each unit rest with the interdependent actions of the family of local governments, which comprise the Central Savannah River Area. It is vital to retain local home rule while providing resources to meet area wide challenges beyond the capabilities of individual units; expansion of the concept of multi-county cooperation among units of local governments is an effective means of achieving this vital goal; and cooperation must be fostered in two ways, by strengthening the abilities of local governments to meet individual local needs and by developing an association of local government to meet common regional concerns.
CENTRAL SAVANNAH RIVER AREA REGIONAL COMMISSION
AUGUSTA, GEORGIA
COMPREHENSIVE ANNUAL FINANCIAL REPORT FISCAL YEAR ENDED JUNE 30, 2011
Prepared by the Department of Finance and Administration
L. Mack Shealy, CPA, CGFM, CICA
Chief Financial Officer

[This page is intentionally blank.]

TABLE OF CONTENTS
Page INTRODUCTORY SECTION
Transmittal Letter 1-4 GFOA Certificate of Achievement 5 Executive Committee and Principal Staff 6 Organizational Chart 7 Location Map 8
FINANCIAL SECTION
Independent Auditor’s Report 9-10 Management’s Discussion and Analysis 11-20 Basic Financial Statements:
Government Wide Financial Statements: Statement of Net Assets 22 Statement of Activities 23-24
Fund Financial Statements: Balance Sheet – Governmental Funds 25 Statement of Revenues, Expenditures and Changes in Fund Balances – Governmental Funds 26 Statement of Fund Net Assets – Proprietary Funds 27 Statement of Revenues, Expenses and Changes In Fund Net Assets – Proprietary Funds 28 Statement of Cash Flows – Proprietary Funds 29 Statement of Fiduciary Net Assets 30 Statement of Changes in Fiduciary Net Assets 31 Combining Statement of Net Assets – Component Units 32 Combining Statement of Revenues, Expenses and Changes In Fund Net Assets – Component Units 33
Notes to the Financial Statements 34-52 Combining and Individual Statements:
Statement of Revenues, Expenditures and Changes in Fund Balance – General Fund 54
Statement of Changes in Assets and Liabilities – Flexible Compensation Plan 55
Supplemental Schedules: Combining Statement of Cash Flows – Component Units 57 Schedule of Revenues and Expenditures by Activity – Budget and Actual 58-60 Grants, Contracts, and Activities - Schedule of Revenues and Expenditures – Budget and Actual:
Georgia Department of Human Resources - Division of Aging Services: Area Agency on Aging 61 Coordinated Transportation 62 US Department of Commerce: Economic Development Administration 301(B) Planning Grant 63 Georgia Department of Transportation: Planning Agreement 64 Georgia Department of Natural Resources: Historic Preservation 65 Watershed Improvement Plans 66

TABLE OF CONTENTS
Georgia Department of Community Affairs: Social Services Block Grant Enterprise Community 67 FY 2011 Support Contract 68 Local Contracts and Activities: Preparation of Community Development Block Grants For Members 69 Administration of CDBG Contracts for Members 70 Administration of Transportation Enhancement Grants For Members 71 Preparation of Hazard Mitigation Plans for Members 72 Administration of Brownfield Grants for Members 73 Non Contracted Technical Assistance for Members 74 Administration of the Unified Development Council 75 Administration of CSRA Business Lending – Component Units 76
Schedule of Indirect Cost Budget and Actual 77 Schedule of Fringe Benefits Budget and Actual 78 Schedule of Allocation Base 79 Schedule of City/County Assessment 80-81
STATISTICAL SECTION (unaudited)
Description of Statistical Section Schedules 83 Net Assets by Component 84 Changes in Net Assets 85-87 Fund Balances of Governmental Funds 88 Changes in Fund Balances of Governmental Funds 89 Schedule of Indirect Costs, Fringe Benefits, and Allocation Base 90-91 Chargeable and Non-Chargeable Staff Hours and Full Time Equivalents by Activity 92 Summary of Loan Activity by Fiscal Year 93 Schedule of Insurance in Force 94-95 Population of Counties in the Central Savannah River Area 96 Labor Force Activity – Annual Averages 97 Miscellaneous Statistics 98
SINGLE AUDIT SECTION
Schedule of Expenditures of Federal Awards 99-100 Notes to the Schedule of Expenditures of Federal Awards 101 Independent Auditor’s Report on Internal Control Over Financial Reporting and on Compliance and Other Matters Based on an Audit of Financial Statements Performed in Accordance With Government Auditing Standards 102-103 Independent Auditor’s Report on Compliance With Requirements That Could Have a Direct and Material Effect on Each Major Program and on Internal Control Over Compliance in Accordance with OMB Circular A-133 104-105 Schedule of Findings and Questioned Costs 106-107

INTRODUCTORY SECTION

[This page is intentionally blank.]

Page 1 of 108

rights, and benefits of the successor Commission. The Commission is a special purpose local government existing under the authority of Georgia law as provided for by the OCGA § 50-8-41. The responsibilities and authority of the Commission are contained in Sections 50-8-30 through 50-8-67 of OCGA. The Commission assists local governments in planning for common needs, cooperating for mutual benefit, and coordinating for sound regional development. Membership assessments, federal, state, local, and private grants/contracts finance operations of the Commission. Grants from federal, state, and other sources are the primary sources of revenues permitting the Commission to meet its responsibilities. The Commission's membership consists of the thirteen counties and thirty-nine cities in east Georgia, known as the Central Savannah River Area (CSRA). The Commission also is financially accountable for three legally separate corporations, all of which are reported separately within the Commission’s financial statements. The Commission’s component units operate collectively as CSRA Business Lending. Additional information about these legally separate entities can be found in Note l.A in the notes to the financial statements. The Commission's Council is responsible for establishing policy and direction. The objectives of the Commission are to develop, promote, and assist in establishing coordinated and comprehensive planning in Georgia; to provide local governments on both an individual and regional basis with professional technical assistance to improve local government service programs; to provide professional technical assistance with the development, collection, compilation, and maintenance of a local information base and network; to manage those nonprofit corporations created by the Commission in accordance with Georgia law for the operation of revolving loan programs and function as a certified development company; and to function as the designated Area Agency on Aging (AAA) for the CSRA, responsible for identifying the needs of older CSRA residents, planning and coordinating regional aging services, advocating on behalf of older persons in need, and contracting with a network of agencies to provide direct services to the elderly in the CSRA.
FACTORS AFFECTING FINANCIAL CONDITION The availability of State and Federal funding to the support activities undertaken by the Commission to assist its members directly affects the Commissions’ financial position. The Commission derived over ninety-five percent of its income in Fiscal Year (FY) 2011 through intergovernmental grants and contracts. This percentage is consistent with prior years. The Commission’s continued success is dependent upon its ability to continue providing services in a wide variety of programmatic areas to meet the needs of our members. The leveraging of members’ assessments is key to the financial success of the Commission. The Commission generated more than $20 for every one dollar in assessments collected. Without this advantage the Commission could not succeed in providing the level of services demanded by its members. Due to the nature of the Commission’s major activities, a significant portion of the Commission’s State and Federal funding is driven by the economic condition and success of its member governments and the populace. Therefore, the financial condition of the Commission and its revenues are also driven by the economic success or failure of the Commission’s members and populace. Due to the swings in availability of State and Federal funding, the Commission strives to maintain a sufficient level of liquid net assets to meet its obligations as they become due. The Commission must also maintain a high level of liquid assets due to its dependency on State and Federal grants and contracts. Most all of these grants and contracts operate on a reimbursable basis with an average collection period of forty-five to sixty days. The Commission is not empowered to borrow funds. With 5,146 square miles of land area in its jurisdiction, the Commission has a diverse group of constituents. The area consists of both urban and rural counties with the city of Augusta and Richmond and Columbia counties being predominantly urban. The fortunes of the Augusta urban area tie closely
Page 2 of 108

to the fortunes of both the CSRA rural counties and the urban area in South Carolina. According to U.S. Census estimates, the CSRA had a population of 454,901. Approximately 324,602 persons or 71.36% resided in the urbanized areas within Richmond and Columbia Counties. Most of the region's growth has occurred in and around the Augusta metropolitan area. With a projected 9% population growth to 502,290 residents, the Augusta metropolitan statistical area (MSA) ranks at 109 of the top U.S. metro areas in population and is Georgia’s second largest in terms of population and jobs. The Augusta metropolitan area serves as the economic engine of the CSRA. The Augusta MSA has a strong, stable economy, composed of: (1) an extensive base of manufacturers; (2) a core of technology-based employers; and (3) an expanding service sector. The diverse industrial base includes production of medical products, pharmaceuticals, golf carts, chemicals, industrial tools, and services centers among others. MAJOR INITIATIVES OF THE COMMISSION During FY2011, the Regional Commission worked with a number of our member governments in a wide variety of projects that are expected to create hundreds of jobs throughout the region during the coming year. Short-term recovery is expected to go slowly, but through the Commission’s regional leadership and assistance, our jurisdictions should be well poised to take advantage of long-term growth as it unfolds. The Commission is committed to ensuring that our local governments are prepared to take advantage of growth opportunities as they present themselves in the coming years.
Commission staff developed a Police Operations Manual for the City of Louisville and created a database of crime incidents in Louisville for the past 10 years which included maps and an interpretive report for enhanced public safety implementation. This project was implemented as part of a COPS Technology Grant, Department of Criminal Justice grant.
Local Government Services (LGS) staff secured a federal Brownfield Grant totaling $200,000 for cleanup of the former SOC gas station in the City of Millen.
During FY2011, the CCSP program served 933 clients in the community instead of a nursing facility, saving over $18.5 million Medicaid dollars.
The Planning Department worked with the CSRA Regional Transportation Roundtable to develop a list of 84 transportation related projects totaling $621 million for inclusion on the Transportation Investment Act of 2010 ballot initiative to be held in July, 2012.
The AAA’s Nutrition Services Program worked side by side with 21 region wide sites to provide 219,357 congregate and home delivered meals to seniors in the east central Georgia region at a net cost of $873,271.
Economic Development staff provided project consultation, grant writing assistance, and administration of state and federal funding to local governments, resulting in more than $4.08 million in economic development grant funds for member jurisdictions creating and/or retaining more than 600 jobs.
LGS staff applied for and/or received over $13.8 million of state and federal grants for infrastructure, Brownfields, housing assessment planning, hazard mitigation planning, and historic preservation projects. In addition, the Local Government Services Department administered over $25.4 million in grant funds.
CSRA Business Lending packaged and had approved 50 business loans totaling $17,381,569 representing total project costs of $44,789,098, and creating or retaining 341 jobs.
Page 3 of 108

While the nation as a whole continues to experience economic turmoil the urban areas of the CSRA are faring better. However, the rural areas of the CSRA continue to face unprecedented unemployment rates as local businesses continue to struggle. Meanwhile, many of these same communities, working with state partners, developed Community of Opportunity plans and became certified as Work Ready communities. The loss of employers has left the region with an ample supply of qualified, capable, and ready employees. Through local planning and development efforts, the CSRA’s communities are prepared to move forward as economic recovery begins. Helping our communities capitalize on anticipated future economic growth is a primary focus. Staff members provide a wide variety of services to our members in all areas of local governance. It is the intermingling of these services that fosters not only the quality of life within the region, but also the opportunities for local and regional economic growth and success. The Commission publishes a detailed report of all activities annually. This year’s Annual Report theme is “Leading and Assisting with Regional Recovery” Copies of that report can be obtained directly from the Commission or by accessing on the Commission’s web site www.csrarc.ga.gov.
AWARDS AND ACKNOWLEGEMENTS
The Government Finance Officers Association of the United States and Canada (GFOA) awarded a Certificate of Achievement for Excellence in Financial Reporting to the Commission for its comprehensive annual financial report for the year ended June 30, 2010. The Certificate of Achievement is a prestigious national award-recognizing conformance with the highest standards for preparation of state and local government financial reports. In order to be awarded a Certificate of Achievement, the Commission published an easily readable and efficiently organized comprehensive annual financial report, whose contents conform to program standards. This report satisfied both generally accepted accounting principles and applicable legal requirements. A Certificate of Achievement is valid for a period of one year. The Commission has received a Certificate of Achievement for the past eighteen years. We believe that our report continues to conform to the Certificate of Achievement program’s requirements, and therefore, we are submitting it to GFOA. The preparation of the comprehensive annual financial report on a timely basis was made possible by the dedicated service of the entire staff of the finance and administration department. The Executive Director and the Board of Directors are also commended for their interest and support in planning and conducting the financial operations of the Commission in a responsible and progressive manner. Respectfully Submitted,
Andy Crosson L. Mack Shealy, CPA, CGFM Executive Director Chief Financial Officer
Page 4 of 108
Page 5 of 108
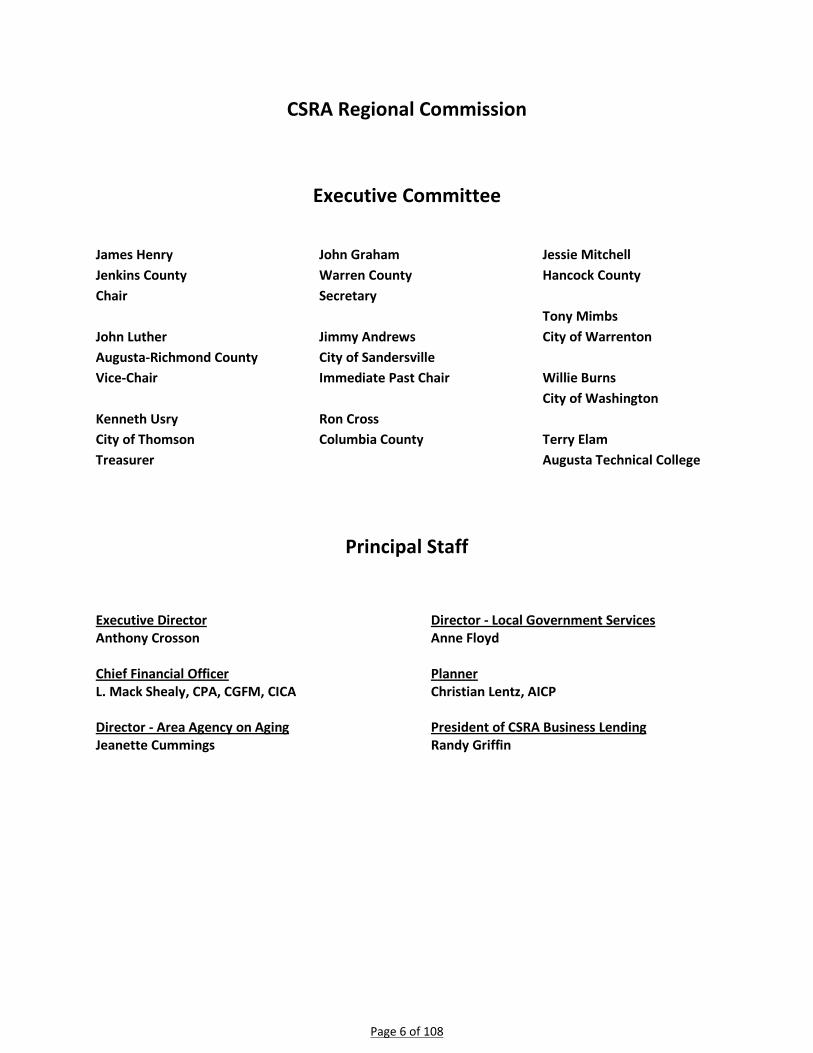
CSRA Regional Commission
Executive Committee
James Henry Jenkins County Chair John Luther Augusta-Richmond County Vice-Chair Kenneth Usry City of Thomson Treasurer
John Graham Warren County Secretary Jimmy Andrews City of Sandersville Immediate Past Chair Ron Cross Columbia County
Jessie Mitchell Hancock County Tony Mimbs City of Warrenton Willie Burns City of Washington Terry Elam Augusta Technical College
Principal Staff
Executive Director Anthony Crosson Chief Financial Officer L. Mack Shealy, CPA, CGFM, CICA Director - Area Agency on Aging Jeanette Cummings
Director - Local Government Services Anne Floyd Planner Christian Lentz, AICP President of CSRA Business Lending Randy Griffin
Page 6 of 108
Reg
iona
l Com
mis
sion
C
ounc
il
Exec
utiv
e D
irect
or
Fina
nce
and
Adm
inis
trat
ion
Are
a A
genc
y on
A
ging
Loca
l G
over
nmen
t Se
rvic
esPl
anni
ngC
SRA
D
evel
opm
ent
Com
pani
es
Chi
ef F
inan
cial
O
ffice
rA
AA
Dire
ctor
Loca
l G
over
nmen
t Se
rvic
es D
irect
orD
irect
orPr
esid
ent
Acc
ount
ant
Ass
ista
nt A
AA
D
irect
or
Pers
onne
l and
A
ccou
ntin
g C
oord
inat
orLo
an O
ffice
r
Seni
or L
oan
Offi
cer
Reg
iona
l Pla
nner
Dev
elop
men
t Sp
ecia
list
Com
pute
r Te
chni
cian
Gat
eway
/AD
RC
A
dmin
istr
ator
Qua
lity
Ass
uran
ce
Man
ager
Dat
a M
anag
emen
t Sp
ecia
list
Info
rmat
ion
ESP
Res
ourc
e Sp
ecia
list
Com
mun
ity
Res
ourc
e Sp
ecia
list
Lead
Info
rmat
ion
Ref
erra
l Spe
cial
ist
Econ
omic
D
evel
opm
ent
Dire
ctor
Tran
spor
tatio
nPl
anne
rG
rant
A
dmin
istr
ator
Acc
ount
ing
Tech
nici
an
Elde
r Pro
gram
M
anag
er
Info
rmat
ion
Ref
erra
l Spe
cial
ist
Info
rmat
ion
Ref
erra
l Spe
cial
ist
Info
rmat
ion
Ref
erra
l Spe
cial
ist
Info
rmat
ion
Ref
erra
l Spe
cial
ist
PT A
dmin
Se
cret
ary
Secr
etar
y
Nut
ritio
nSp
ecia
list
GA
Car
es
Prog
ram
M
anag
er
Cen
tral
Sav
anna
h R
iver
Are
aR
egio
nal C
omm
issi
onO
rgan
izat
iona
l Cha
rt
and
Pers
onne
l Pos
ition
s
Spec
ial P
roje
cts
Man
ager
Loan
Spe
cial
ist
Acc
ount
ant -
Para
prof
essi
onal
AA
A A
dvis
ory
Cou
ncil
His
toric
Pre
serv
atio
n A
dvis
ory
Cou
ncil
Hea
lth &
Wel
lnes
s C
oord
inat
or
GA
Car
es
Prog
ram
A
ssis
tant
Long
Ter
m C
are
Coo
rdin
ator
Long
Ter
m
Car
e M
anag
er
HC
BS
Cas
e M
anag
er
HC
BS
Cas
e M
anag
er
HC
BS
Cas
e M
anag
er
Dat
a M
anag
emen
t Sp
ecia
list/
Adm
inis
trat
ive
Ass
ista
nt
CSR
A U
nifie
d D
evel
opm
ent
Aut
horit
y
CSR
A U
nifie
d D
evel
opm
ent
Cou
ncil
Page 7 of 108
Central Savannah River AreaRegional Commission Service Delivery Area
Fort Gordon
HANCOCK
WASHINGTON
BURKE
JENKINSSCREVEN
COLUMBIA
LINCOLN
WILKES
TALIAFERRO
WARREN
GLASCOCK
MCDUFFIE
JEFFERSON
RICHMOND
Oglethorpe
Greene
Putnam
Baldwin
Wilkinson
JohnsonEmanuel
BullochEffingham
Elbert
SOUTHCAROLINA
McCormick
Edgefield
Aiken
Barnwell
AllendaleHampton
SavannahRiverSite
Laurens
Treutlen Candler
HEPHZIBAH
SANDERSVILLE
WASHINGTON
WADLEY
MILLEN
WRENS
WAYNESBORO
GIRARD
THOMSON
TIGNALL
LOUISVILLE
HARLEM
DAVISBORO
LINCOLNTON
SPARTA
GROVETOWN
MIDVILLE
CRAWFORDVILLE
SARDIS
HARRISON
BLYTHE
STAPLETON
WARRENTON
RAYLE
GIBSONMITCHELL
TENNILLE
DEEPSTEP
OCONEEBARTOW
CAMAK
KEYSVILLE
VIDETTE
SHARON
AVERA
DEARING
NORWOOD
RIDDLEVILLE
EDGE HILL
§̈¦520§̈¦20
§̈¦16
§̈¦520
§̈¦16
§̈¦16
UV72UV17§̈¦85
§̈¦20
§̈¦16
§̈¦95§̈¦75
§̈¦85
§̈¦75
§̈¦20
MemberCounty
Area
Fort Gordon
Central Savannah River Area Regional Commission
GIS Department3023 Riverwatch Parkway, Suite A
Augusta, GA 30904-2016www.csrarc.ga.gov
October, 2010
·Legend
Federal LandsRailwaysCitiesLakes and RiversCountiesCountiesSC Counties 0 10 20 30 405
Miles
Page 8 of 108

FINANCIAL SECTION

[This page is intentionally blank.]

300 MULBERRY STREET, SUITE 300 • POST OFFICE BOX 1877 • MACON, GEORGIA 31202-1877 • 478-464-8000 • FAX 478-464-8051 • www.mjcpa.com MEMBERS OF THE AMERICAN INSTITUTE OF CERTIFIED PUBLIC ACCOUNTANTS
INDEPENDENT AUDITOR’S REPORT
To the Council Members Central Savannah River Area
Regional Commission Augusta, Georgia We have audited the accompanying financial statements of the governmental activities, the business type activities, the aggregate discretely presented component units, each major fund, and the aggregate remaining fund information of the Central Savannah River Area Regional Commission (the “Commission”), as of and for the year ended June 30, 2011, which collectively comprise the Commission’s basic financial statements as listed in the table of contents. These financial statements are the responsibility of the Commission’s management. Our responsibility is to express opinions on these financial statements based on our audit. We conducted our audit in accordance with auditing standards generally accepted in the United States of America and the standards applicable to financial audits contained in Government Auditing Standards, issued by the Comptroller General of the United States. Those standards require that we plan and perform the audit to obtain reasonable assurance about whether the financial statements are free of material misstatement. An audit includes examining, on a test basis, evidence supporting the amounts and disclosures in the financial statements. An audit also includes assessing the accounting principles used and the significant estimates made by management, as well as evaluating the overall financial statement presentation. We believe that our audit provides a reasonable basis for our opinions. In our opinion, the financial statements referred to above present fairly, in all material respects, the respective financial position of the governmental activities, the business type activities, the aggregate discretely presented component units, each major fund, and the aggregate remaining fund information of the Central Savannah River Area Regional Commission as of June 30, 2011, and the respective changes in financial position and, where applicable, cash flows thereof for the year then ended in conformity with accounting principles generally accepted in the United States of America. As discussed in Note 1.J., the Commission implemented Governmental Accounting Standards Board (GASB) Statement No. 54, Fund Balance Reporting and Governmental Fund Type Definitions, as of July 1, 2010. In accordance with Government Auditing Standards, we have also issued our report dated November 11, 2011 on our consideration of the Commission’s internal control over financial reporting and on our tests of its compliance with certain provisions of laws, regulations, contracts, and grant agreements and other matters. The purpose of that report is to describe the scope of our testing of internal control over financial reporting and compliance and the results of that testing, and not to provide an opinion on the internal control over financial
Page 9 of 108

reporting or on compliance. That report is an integral part of an audit performed in accordance with Government Auditing Standards and should be considered in assessing the results of our audit.
Accounting principles generally accepted in the United States of America require that the
Management’s Discussion and Analysis (on pages 11 – 20) be presented to supplement the basic financial statements. Such information, although not a part of the basic financial statements, is required by the Governmental Accounting Standards Board who considers it to be an essential part of financial reporting for placing the basic financial statements in an appropriate operational, economic, or historical context. We have applied certain limited procedures to the required supplementary information in accordance with auditing standards generally accepted in the United States of America, which consisted of inquiries of management about the methods of preparing the information and comparing the information for consistency with management’s responses to our inquiries, the basic financial statements, and other knowledge we obtained during our audit of the basic financial statements. We do not express an opinion or provide any assurance on the information because the limited procedures do not provide us with sufficient evidence to express an opinion or provide any assurance. Our audit was conducted for the purpose of forming opinions on the financial statements that collectively comprise the Central Savannah River Area Regional Commission’s basic financial statements. The introductory section, combining and individual nonmajor fund financial statements and schedules, supplementary schedules and statistical tables are presented for purposes of additional analysis and are not a required part of the basic financial statements. The schedule of expenditures of federal awards is presented for purposes of additional analysis as required by U.S. Office of Management and Budget Circular A-133, Audits of States, Local Governments, and Non-Profit Organizations, and is also not a required part of the basic financial statements. The combining and individual nonmajor fund financial statements and schedules, supplementary schedules, and schedule of expenditures of federal awards are the responsibility of management and were derived from and relate directly to the underlying accounting and other records used to prepare the financial statements. The information has been subjected to the auditing procedures applied in the audit of the financial statements and certain additional procedures, including comparing and reconciling such information directly to the underlying accounting and other records used to prepare the financial statements or to the financial statements themselves, and other additional procedures in accordance with auditing standards generally accepted in the United States of America. In our opinion, the information is fairly stated in all material respects in relation to the financial statements as a whole. The introductory and statistical sections have not been subjected to the auditing procedures applied in the audit of the basic financial statements and, accordingly, we do not express an opinion or provide any assurance on them.
Macon, Georgia November 11, 2011
Page 10 of 108

MANAGEMENT’S DISCUSSION AND ANALYSIS As management of the Central Savannah River Area Regional Commission (Commission), we offer readers of the Commission’s financial statements this narrative overview and analysis of the financial activities of the Commission for the fiscal year (FY) ended June 30, 2011. We encourage readers to read the information presented here in conjunction with additional information that we have furnished in the Commission’s financial statements, which follow this narrative.
FINANCIAL HIGHLIGHTS PRIMARY GOVERNMENT
The assets of the Commission exceeded its liabilities at the close of the fiscal year by $2,511,895 (net assets). Of this amount, $2,435,091 (unrestricted net assets) may be used to meet the Commission’s ongoing obligations.
Net assets increased by $133,967. Total governmental and business activities expenditures exceeded program revenues by $302,692. Member assessments covered this deficit. The remaining member assessments of $132,562 ($435,254 - $302,692) plus the interest income of $1,405 represents the $133,967 net change in assets. This analysis is in accordance with the Commission’s policy to first apply cost-reimbursement grant resources, followed by local grants or contracts, and then by general revenues.
As of the close of the current fiscal year, the Commission’s governmental funds reported combined ending fund balances of $1,976,238 an increase of $236,473 from the prior year. This entire amount is unassigned and may be used to meet the Commission’s ongoing obligations.
FINANCIAL HIGHLIGHTS COMPONENT UNITS (CUs)
The assets of the CUs exceeded their liabilities at the close of the fiscal year by $4,163,997 (net
assets). Of this amount, $4,149,272 (unrestricted net assets) may be used to meet ongoing obligations.
The CUs total net assets increased by $131,083, a decrease of $288,984 over the prior year’s change in net assets. The decrease is related to both a decrease in interest rate adjustments on existing loans and lower interest rates on new loans.
Operating revenues decreased $249,419 and operating expenses increased $39,565. The CUs long-term debt decreased $185,860 due to continuing annual note payments.
OVERVIEW OF THE FINANCIAL STATEMENTS
This discussion and analysis is intended to serve as an introduction to the Commission’s basic financial statements. The Commission’s basic financial statements consist of three components; 1) government-wide financial statements, 2) fund financial statements, and 3) notes to the financial statements (see Figure 1). The basic financial statements present two different views of the Commission with government-wide statements and fund financial statements. In addition to the basic financial statements, this report contains other supplemental information that will enhance the reader’s understanding of the financial condition of the Commission. See figure 1 on the next page.
Page 11 of 108
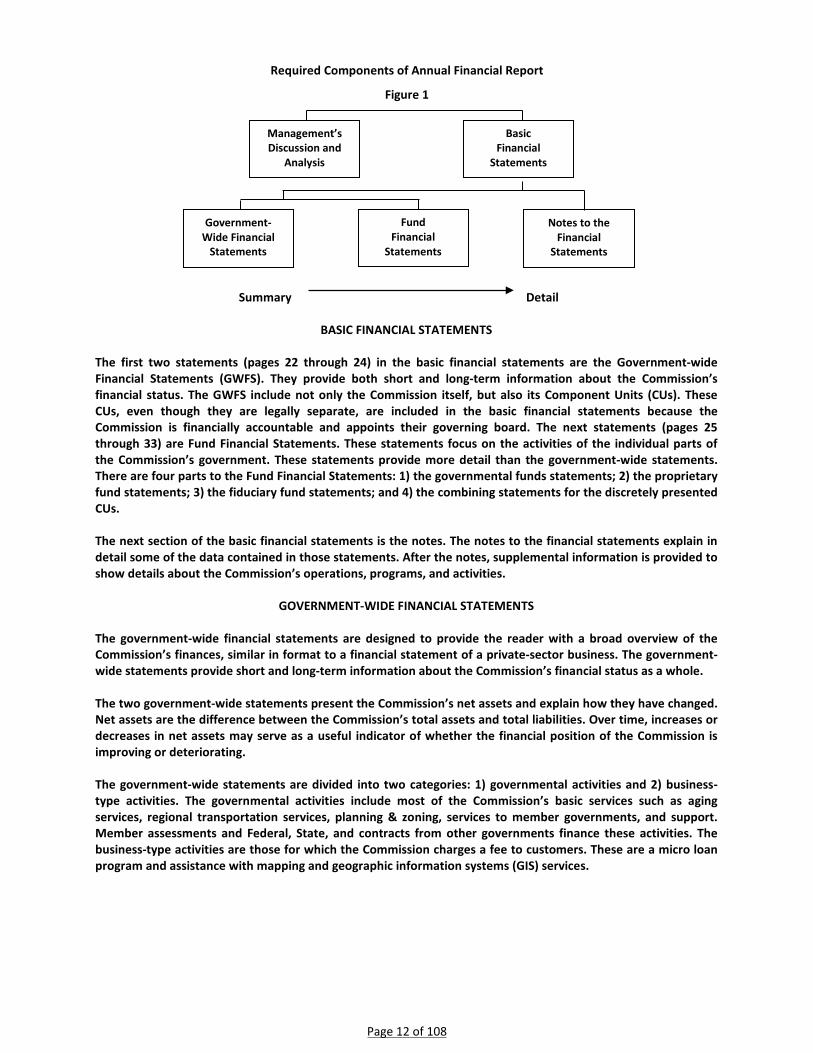
Required Components of Annual Financial Report
Figure 1
Summary Detail
BASIC FINANCIAL STATEMENTS
The first two statements (pages 22 through 24) in the basic financial statements are the Government-wide Financial Statements (GWFS). They provide both short and long-term information about the Commission’s financial status. The GWFS include not only the Commission itself, but also its Component Units (CUs). These CUs, even though they are legally separate, are included in the basic financial statements because the Commission is financially accountable and appoints their governing board. The next statements (pages 25 through 33) are Fund Financial Statements. These statements focus on the activities of the individual parts of the Commission’s government. These statements provide more detail than the government-wide statements. There are four parts to the Fund Financial Statements: 1) the governmental funds statements; 2) the proprietary fund statements; 3) the fiduciary fund statements; and 4) the combining statements for the discretely presented CUs. The next section of the basic financial statements is the notes. The notes to the financial statements explain in detail some of the data contained in those statements. After the notes, supplemental information is provided to show details about the Commission’s operations, programs, and activities.
GOVERNMENT-WIDE FINANCIAL STATEMENTS The government-wide financial statements are designed to provide the reader with a broad overview of the Commission’s finances, similar in format to a financial statement of a private-sector business. The government-wide statements provide short and long-term information about the Commission’s financial status as a whole. The two government-wide statements present the Commission’s net assets and explain how they have changed. Net assets are the difference between the Commission’s total assets and total liabilities. Over time, increases or decreases in net assets may serve as a useful indicator of whether the financial position of the Commission is improving or deteriorating. The government-wide statements are divided into two categories: 1) governmental activities and 2) business-type activities. The governmental activities include most of the Commission’s basic services such as aging services, regional transportation services, planning & zoning, services to member governments, and support. Member assessments and Federal, State, and contracts from other governments finance these activities. The business-type activities are those for which the Commission charges a fee to customers. These are a micro loan program and assistance with mapping and geographic information systems (GIS) services.
Management’s Discussion and
Analysis
Basic Financial
Statements
Government-Wide Financial
Statements
Fund Financial
Statements
Notes to the Financial
Statements
Page 12 of 108

FUND FINANCIAL STATEMENTS The fund financial statements provide a more detailed look at the Commission’s activities. A fund is a grouping of related accounts that is used to maintain control over resources that have been segregated for specific activities or objectives. The Commission, like all other governmental entities in Georgia, uses fund accounting to ensure and reflect compliance (or non-compliance) with finance-related legal requirements. All of the funds of the Commission can be divided into three categories: governmental funds, proprietary funds, and fiduciary funds. Governmental Funds – Governmental funds are used to account for those functions reported as governmental activities in the government-wide financial statements. Most of the Commission’s basic services are accounted for in governmental funds. These funds focus on how assets can readily be converted into cash and the amount of funds left at year-end that will be available for spending in the next year. Governmental funds are reported using an accounting method called modified accrual accounting. This method also has a current financial resources focus. As a result, the governmental fund financial statements give the reader a detailed short-term view that helps him or her determine if there are financial resources available to finance the Commission’s programs. The relationship between government activities (reported in the Statement of Net Assets and the Statement of Activities) and governmental funds is described in a reconciliation that is a part of the fund financial statements. An internal operating budget for the general, grants and contracts, and internal service funds is prepared by the Commission for management purposes. The budget is not subject to review or approval by the Legislature of the State of Georgia and, therefore, is not considered a legally adopted budget. Proprietary Funds –The Commission maintains two different types of proprietary funds. Enterprise Funds are used to report the same functions presented as business-type activities in the government-wide financial statements. The Commission uses enterprise funds to account for the operation of its micro loan program and assistance to member governments and internal departments in the area of mapping data and related information. Internal service funds are an accounting device used to accumulate and allocate cost internally among the Commission’s various grants and contracts. The Commission uses an internal service fund to account for indirect costs, payroll and fringe benefit payments and their allocation, and the receipt and disbursement of all the Commission’s funds. Because these services predominantly benefit governmental rather than business-type functions, the Internal Service Fund is reported with governmental activities in the government-wide financial statements. Fiduciary Funds – Fiduciary funds are used to account for resources held for the benefit of parties outside the Commission. The Commission has two fiduciary funds: one pension trust fund and one agency fund. Notes to the Financial Statements – The notes provide additional information that is essential to a full understanding of the data provided in the government-wide and fund financial statements. The notes to the financial statements start on page 34 of this report. Other Information – In addition to the basic financial statements and accompanying notes, this report includes certain required supplementary information concerning the Commission’s programs, activities, and operations.
GOVERNMENT-WIDE FINANCIAL ANALYSIS As noted earlier, net assets may serve over time as a useful indicator of a government’s financial position. In this case, the Commission’s assets exceed liabilities by $2,511,895 at the close of June 30, 2011, an increase over the prior year.
Page 13 of 108

Central Savannah River Area Regional Commission Net Assets – Primary Government
Figure 2
A small portion of the net assets, $76,804 (3.13%), reflects the Commission’s investment in capital assets (e.g. vehicles, office furniture and equipment). The Commission uses these capital assets to support staff. These assets are not available for future spending. The remaining portion of the Commission’s net assets, $2,435,091 is used to meet the Commission’s ongoing obligations to members and creditors. The Commission finances ninety-seven (95%) of its services through intergovernmental grants and contracts and, as a result, growth in net assets is limited. The majority of these grants and contracts operate on a reimbursable basis (revenues are limited to the actual costs incurred). Receivables, loans receivable, amounts due from component units, and prepaid items represent thirty-six percent (36%) or $1,531,268 of the Commission’s current assets. The average collection period ranges from forty-five to sixty days, requiring the Commission to maintain sufficient levels of cash to support current obligations. The Commission does not possess the corporate power to borrow therefore, it must maintain a sufficient level of net assets to sustain and support continued growth in services to members.
2011 2010 Change 2011 2010 Change 2011 2010
4,084,895$ 3,650,430$ 434,465$ 287,272$ 389,185$ (101,913)$ 4,372,167$ 4,039,615$ 72,915 99,862 (26,947) 3,889 4,482 (593) 76,804 104,344
4,157,810$ 3,750,292$ 407,518$ 291,161$ 393,667$ (102,506)$ 4,448,971$ 4,143,959$
91,806$ 73,365$ 18,441$ -$ -$ -$ 91,806$ 73,365$ 1,845,270 1,692,666 152,604 - - - 1,845,270 1,692,666 1,937,076 1,766,031 171,045 - - - 1,937,076 1,766,031
Invested in capital assets 72,915 99,862 (26,947) 3,889 4,482 (593) 76,804 104,344 Unrestricted 2,147,819 1,884,399 263,420 287,272 389,185 (101,913) 2,435,091 2,273,584 Total net assets 2,220,734$ 1,984,261$ 236,473$ 291,161$ 393,667$ (102,506)$ 2,511,895$ 2,377,928$
GovernmentalActivities
Business-typeActivities
Primary Government
Total
Net assets:
Total assets
Total Liabilities
Current and other assetsCapital assets
Long-term liabilities Other liabilities
Page 14 of 108
Central Savannah River Area Regional Commission Change in Net Assets - Primary Government
Figure 3
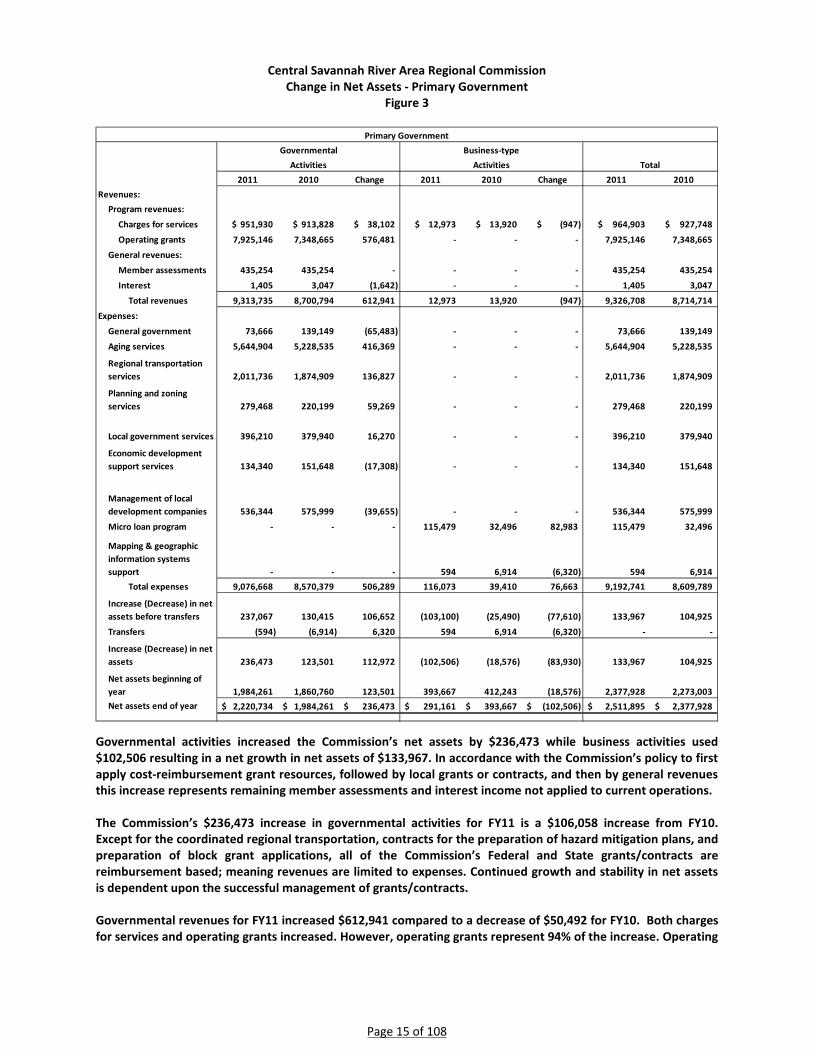
Governmental activities increased the Commission’s net assets by $236,473 while business activities used $102,506 resulting in a net growth in net assets of $133,967. In accordance with the Commission’s policy to first apply cost-reimbursement grant resources, followed by local grants or contracts, and then by general revenues this increase represents remaining member assessments and interest income not applied to current operations. The Commission’s $236,473 increase in governmental activities for FY11 is a $106,058 increase from FY10. Except for the coordinated regional transportation, contracts for the preparation of hazard mitigation plans, and preparation of block grant applications, all of the Commission’s Federal and State grants/contracts are reimbursement based; meaning revenues are limited to expenses. Continued growth and stability in net assets is dependent upon the successful management of grants/contracts. Governmental revenues for FY11 increased $612,941 compared to a decrease of $50,492 for FY10. Both charges for services and operating grants increased. However, operating grants represent 94% of the increase. Operating
2011 2010 Change 2011 2010 Change 2011 2010Revenues:
Program revenues:
Charges for services 951,930$ 913,828$ 38,102$ 12,973$ 13,920$ (947)$ 964,903$ 927,748$
Operating grants 7,925,146 7,348,665 576,481 - - - 7,925,146 7,348,665
General revenues:
Member assessments 435,254 435,254 - - - - 435,254 435,254
Interest 1,405 3,047 (1,642) - - - 1,405 3,047
Total revenues 9,313,735 8,700,794 612,941 12,973 13,920 (947) 9,326,708 8,714,714
Expenses:
General government 73,666 139,149 (65,483) - - - 73,666 139,149
Aging services 5,644,904 5,228,535 416,369 - - - 5,644,904 5,228,535
Regional transportation services 2,011,736 1,874,909 136,827 - - - 2,011,736 1,874,909
Planning and zoning services 279,468 220,199 59,269 - - - 279,468 220,199
Local government services 396,210 379,940 16,270 - - - 396,210 379,940
Economic development support services 134,340 151,648 (17,308) - - - 134,340 151,648
Management of local development companies 536,344 575,999 (39,655) - - - 536,344 575,999
Micro loan program - - - 115,479 32,496 82,983 115,479 32,496
Mapping & geographic information systems support - - - 594 6,914 (6,320) 594 6,914
Total expenses 9,076,668 8,570,379 506,289 116,073 39,410 76,663 9,192,741 8,609,789
Increase (Decrease) in net assets before transfers 237,067 130,415 106,652 (103,100) (25,490) (77,610) 133,967 104,925
Transfers (594) (6,914) 6,320 594 6,914 (6,320) - -
Increase (Decrease) in net assets 236,473 123,501 112,972 (102,506) (18,576) (83,930) 133,967 104,925
Net assets beginning of year 1,984,261 1,860,760 123,501 393,667 412,243 (18,576) 2,377,928 2,273,003 Net assets end of year 2,220,734$ 1,984,261$ 236,473$ 291,161$ 393,667$ (102,506)$ 2,511,895$ 2,377,928$
Primary Government
TotalGovernmental
ActivitiesBusiness-type
Activities
Page 15 of 108

grants for aging and transportation services increased $565,651, which is consistent with the increases aging and transportation services expenditures. Operating grants for planning, local government services, and economic development support taken together increased $10,830. These increases are consistent with Federal and State spending related to non-social and social services activities. Governmental expenses for FY11 increased $506,289 compared to a decrease of $49,421 for FY10. Changes in functional expenses directly mirror changes in operating grants for activities identified in the above paragraph. The decrease for general government is related to a $59,500 payment in FY10 for consultant services related to a regional grant application. The decrease in transfers is consistent with a decrease in expenditures for mapping and geographic information (GIS) services. Business-type activities decreased the Commission’s net assets by $102,506 compared to a decrease of $18,756 for FY10. The Herman Lodge Micro Loan Program (MLP) accounted for all of the decrease. The transfer from governmental activities covers the loss in GIS and Mapping Services (GIS). The Commission is transiting GIS from an internal staff activity to a contractual relationship with an outside entity. As a result, costs directly related to an activity are charged directly to that activity in governmental activities. However, GIS continues to incur cost related to existing software and equipment in support of planning activities but has no way to track and recover these costs by activity. Charges for services in the Herman Lodge Micro Loan program (MLP) remained relatively stable. However, expenses increase significantly. Bad debts accounted for $71,196 of the $82,983 decrease as the result of deterioration of the credit quality of existing loans. The MLP closed three loans for FY11 compared to one for FY10 accounting for the remaining increase attributed increased staff time charged.
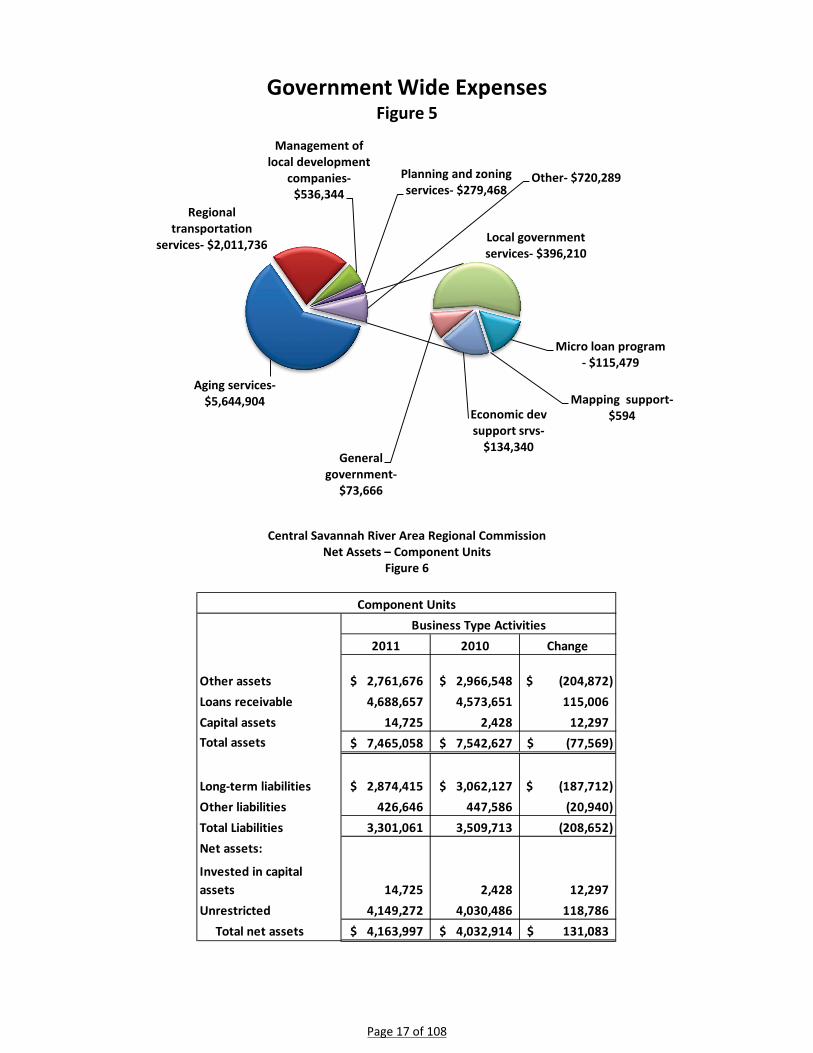
Charges for services, $964,903
Operating grants, $7,925,146
Member assessments,
$435,254
Interest, $1,405
GOVERNMENT WIDE REVENUES Figure 4
Page 16 of 108
Central Savannah River Area Regional Commission
Net Assets – Component Units Figure 6
Aging services- $5,644,904
Regional transportation
services- $2,011,736
Management of local development
companies- $536,344
Planning and zoning services- $279,468
Micro loan program - $115,479
Mapping support- $594 Economic dev
support srvs- $134,340
General government-
$73,666
Local government services- $396,210
Other- $720,289
Government Wide Expenses Figure 5
2011 2010 Change
Other assets 2,761,676$ 2,966,548$ (204,872)$ Loans receivable 4,688,657 4,573,651 115,006 Capital assets 14,725 2,428 12,297 Total assets 7,465,058$ 7,542,627$ (77,569)$
Long-term liabilities 2,874,415$ 3,062,127$ (187,712)$ Other liabilities 426,646 447,586 (20,940) Total Liabilities 3,301,061 3,509,713 (208,652) Net assets:
Invested in capital assets 14,725 2,428 12,297 Unrestricted 4,149,272 4,030,486 118,786 Total net assets 4,163,997$ 4,032,914$ 131,083$
Business Type ActivitiesComponent Units
Page 17 of 108

Central Savannah River Area Regional Commission Change in Net Assets - Component Units
Figure 7
The CUs’ total net assets increased by $131,083 compared to a $420,067 increase for FY10 because of a decrease in total revenues of $249,419. Interest from program loans decreased due to interest rate adjustments for existing loans and lower rates for new loans. Late charges reflect an improvement in the timeliness of payments. The increases in loan servicing fees reflect the addition of new loans during the fiscal year. Processing and servicing fees are based on a percentage of the CUs’ participation in the Small Business Administration’s (SBA) loan amount. The CSRA Local Development Corporation (CSRA LDC) added twenty-eight (28) new loans to the books during FY11 and is now receiving servicing fees on two hundred and eight (208) loans. Servicing fees are received over the life of the loan. Therefore, the level of servicing fees has a linear growth over time. The decrease in processing fees is directly related to changes made by the American Recovery and Reinvestment Act of 2009 (ARRA) on how processing fees are paid. Two thirds of the processing fee is now paid when an application is processed by the SBA with the remaining one third paid when the loan is closed. Previously the fee was not received until the loan closed. The decrease in processing fees is consistent with a surge in processing fees of $287,856 from FY09 to FY10. The decrease in processing fees for FY11 brings the level of processing fees back to trend levels. SBA regulations allow the CSRA LDC to operate anywhere in Georgia. The regulations not only allow the CSRA LDC to compete anywhere in Georgia but also allow other certified development companies (CDC) operating in Georgia to compete in the Commission’s operating area. Due to a continuing and strong marketing program, the
2011 2010 ChangeRevenues:
Program revenues:Interest - program loans 321,671$ 376,168$ (54,497)$ Late charges 10,793 18,107 (7,314) Loan servicing fees 432,228 356,647 75,581 Loan processing fees 272,678 528,511 (255,833) Miscellaneous 1,777 1,124 653
General revenues:Interest 34,765 42,774 (8,009)
Total revenues 1,073,912 1,323,331 (249,419) Expenses:
Operating costs 753,725 730,687 23,038 Bad debts 158,007 139,095 18,912 Interest 31,097 33,482 (2,385)
Total expenses 942,829 903,264 39,565 Change in net assets 131,083 420,067 (288,984)
Net assets beginning of year 4,032,914 3,612,847 420,067 Net assets end of year 4,163,997$ 4,032,914$ 131,083$
Business Type ActivitiesComponent Units
Page 18 of 108

CSRA LDC is making a strong penetration into other areas of Georgia, especially in the metro Atlanta area. The number of loans outside its original operating area evidences this. SBA approved thirty-eight (38) loans in FY11, eight-teen (18) outside the CSRA area compared to forty-five (45) loans in FY10, thirty (30) outside the CSRA area.
FINANCIAL ANALYSIS OF THE COMMISSION’S FUNDS As noted earlier, the Commission uses fund accounting to ensure and demonstrate compliance with finance-related legal requirements. The Commission maintains two governmental funds a general fund and grants and contracts fund. The focus of the Commission’s governmental funds is to provide information on near-term inflows, outflows, and balances of usable resources. Due to the nature of the Commission’s operations, the only reconciling items between the GWFS Statement of Net assets and the governmental funds balance statement is the net assets ($244,496) of the internal service fund included as a governmental activity in the GWFS. There are no reconciling item between GWFS Statement of Activities and the governmental funds operating statement. Due to the nature of the Commission’s operations, the information in the governmental funds statement is not different from that in the GWFS. Governmental fund balances increased by $236,473. The Commission operates its grant and contract fund on a breakeven basis transferring funds as needed from the general fund to cover deficits and transferring the excess of fixed fee revenues over expenditures to the general fund. As a result, the $236,473 increase in the general fund balances represents member assessments available to fund future operating periods. The Commission’s proprietary funds provide the same type of information found in the government-wide statements but in more detail. Factors concerning the operations of the proprietary funds are addressed in the discussion of the Commission’s business-type activities. Because the indirect cost fund is designed to recover costs there was no change in net assets. Total indirect costs decreased $12,599. Net assets held in trust for participants increased $928,254 from $4,276,715 to $5,204,969. Investment income for FY11 increased $353,384 (71%). This compares to an increase of $926,287 from net loss of $428,990 in FY09 to a gain of $497,297 for FY10. The increase continues to trend improvements in the markets relative to FY09 and FY08.
CAPITAL ASSETS The Commission’s capital assets for its governmental and business–type activities as of June 30 are $76,804 (net of accumulated depreciation). These assets include furniture, fixtures, equipment, vehicles, and leasehold improvements. Capital assets are defined by the Commission as assets with an initial, individual cost of more than $2,500 and an estimated useful life in excess of one year. Most of the Commission’s capital purchases are below this threshold. Therefore, over time the Commission’s investment in capital assets will generally decline. Additional information on the Commission’s capital assets can be found in note 1.G and 3.D of the basic financial statements.
Page 19 of 108
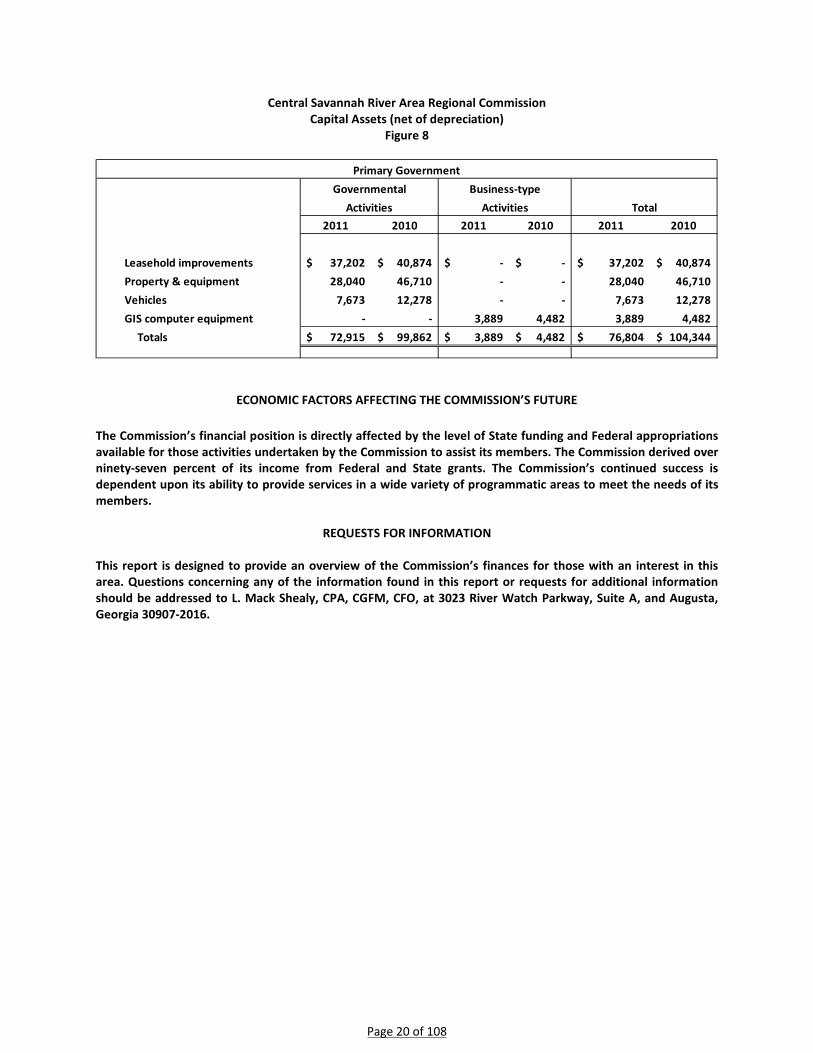
Central Savannah River Area Regional Commission Capital Assets (net of depreciation)
Figure 8
ECONOMIC FACTORS AFFECTING THE COMMISSION’S FUTURE The Commission’s financial position is directly affected by the level of State funding and Federal appropriations available for those activities undertaken by the Commission to assist its members. The Commission derived over ninety-seven percent of its income from Federal and State grants. The Commission’s continued success is dependent upon its ability to provide services in a wide variety of programmatic areas to meet the needs of its members.
REQUESTS FOR INFORMATION This report is designed to provide an overview of the Commission’s finances for those with an interest in this area. Questions concerning any of the information found in this report or requests for additional information should be addressed to L. Mack Shealy, CPA, CGFM, CFO, at 3023 River Watch Parkway, Suite A, and Augusta, Georgia 30907-2016.
2011 2010 2011 2010 2011 2010
Leasehold improvements 37,202$ 40,874$ -$ -$ 37,202$ 40,874$ Property & equipment 28,040 46,710 - - 28,040 46,710 Vehicles 7,673 12,278 - - 7,673 12,278 GIS computer equipment - - 3,889 4,482 3,889 4,482
Totals 72,915$ 99,862$ 3,889$ 4,482$ 76,804$ 104,344$
Governmental Business-typeTotal
Primary Government
Activities Activities
Page 20 of 108

BASIC FINANCIAL STATEMENTS
Page 21 of 108

The accompanying notes are an integral part of this statement.
COMPONENT UNITS
GOVERNMENTAL ACTIVITIES
BUSINESS-TYPE ACTIVITIES TOTAL COMBINED
ASSETSCurrent Assets:
Cash and cash equivalents 2,689,614$ -$ 2,689,614$ 2,694,097$ Receivables 1,215,258 - 1,215,258 25,608 Loans receivable, net of allowance - 41,429 41,429 714,898 Due from component units 223,859 - 223,859 - Internal balances (100,336) 100,336 - - Prepaid items 50,722 - 50,722 2,025
Total current assets 4,079,117 141,765 4,220,882 3,436,628 Non-Current Assets:
Non-current portion of loans receivable, net - 145,507 145,507 3,973,759 Capital assets, net 72,915 3,889 76,804 14,725 Security deposit 5,778 - 5,778 - Premium on loan - - - 36,946
Total non-current assets 78,693 149,396 228,089 4,025,430 Total assets 4,157,810$ 291,161$ 4,448,971$ 7,462,058$
LIABILITIESCurrent liabilities:
Accounts payable 1,500,681$ -$ 1,500,681$ -$ Accrued liabilities 88,713 - 88,713 12,649 Due to primary government - - - 223,859 Compensated absences payable 206,200 206,200 - Unearned revenues 49,676 - 49,676 - Notes payable - - - 187,138
Total current liabilities 1,845,270 - 1,845,270 423,646 Noncurrent liabilities:
Notes payable - - - 2,874,415 Compensated absences payable 91,806 - 91,806 -
Total noncurrent liabilities 91,806 - 91,806 2,874,415 Total liabilities 1,937,076 - 1,937,076 3,298,061
NET ASSETSInvested in capital assets 72,915 3,889 76,804 14,725 Unrestricted 2,147,819 287,272 2,435,091 4,149,272
Total net assets 2,220,734 291,161 2,511,895 4,163,997 Total liabilities and net assets 4,157,810$ 291,161$ 4,448,971$ 7,462,058$
PRIMARY GOVERNMENT
CENTRAL SAVANNAH RIVER AREA REGIONAL COMMISSION STATEMENT OF NET ASSETS
June 30, 2011
Page 22 of 108

The
acco
mpa
nyin
g no
tes a
re a
n in
tegr
al p
art o
f thi
s sta
tem
ent.
Func
tions
/Pro
gram
sEx
pens
es
Indi
rect
Ex
pens
es
Allo
catio
n Ch
arge
s for
Se
rvic
esO
pera
ting
Gra
nts
Prim
ary
gove
rnm
ent:
Gov
ernm
enta
l act
iviti
es:
Gen
eral
gov
ernm
ent
1,05
4,19
4$
(980
,528
)$
47
,665
$
-
$
Ag
ing
serv
ices
5,06
1,23
8
583,
666
21,1
25
5,52
1,94
5
Re
gion
al tr
ansp
orta
tion
serv
ices
2,00
8,05
1
3,68
5
-
2,
061,
186
Plan
ning
and
zoni
ng se
rvic
es19
7,03
4
82
,434
17
,465
24
3,99
0
Loca
l gov
ernm
ent s
ervi
ces
279,
121
117,
089
310,
761
14,8
18
Ec
onom
ic d
evel
opm
ent s
uppo
rt se
rvic
es11
0,12
8
24
,212
18
,570
83
,207
Man
agem
ent o
f loc
al d
evel
opm
ent c
ompa
nies
380,
887
155,
457
536,
344
-
Tota
l gov
ernm
enta
l act
iviti
es9,
090,
653
(1
3,98
5)
951,
930
7,92
5,14
6
Bu
sine
ss ty
pe a
ctiv
ities
:He
rman
Lod
ge M
icro
loan
pro
gram
10
1,49
4
13
,985
12
,973
-
M
appi
ng &
geo
grap
hic
info
rmat
ion
syst
ems s
uppo
rt59
4
-
-
-
Tota
l bus
ines
s typ
e ac
tiviti
es10
2,08
8
13
,985
12
,973
-
To
tal p
rimar
y go
vern
men
t9,
192,
741
$
-
$
96
4,90
3$
7,
925,
146
$
Com
pone
nt u
nits
:Bu
sine
ss le
ndin
g se
rvic
es
942,
829
$
1,03
9,14
7$
-$
Tota
l com
pone
nt u
nits
942,
829
$
1,03
9,14
7$
-$
Cont
inue
d on
nex
t pag
e.
Prog
ram
Rev
enue
s
CEN
TRAL
SAV
ANN
AH R
IVER
ARE
A RE
GIO
NAL
CO
MM
ISSI
ON
ST
ATEM
ENT
OF
ACT
IVIT
IES
FOR
THE
FISC
AL Y
EAR
ENDE
D Ju
ne 3
0, 2
011
Page 23 of 108

The
acco
mpa
nyin
g no
tes a
re a
n in
tegr
al p
art o
f thi
s sta
tem
ent.
Func
tions
/Pro
gram
sG
over
nmen
tal
Activ
ities
Busi
ness
-Typ
e Ac
tiviti
esTo
tal
Com
pone
nt U
nits
Prim
ary
gove
rnm
ent:
Gov
ernm
enta
l act
iviti
es:
Gen
eral
gov
ernm
ent
(26,
001)
$
-$
(26,
001)
$
-
$
Agin
g se
rvic
es(1
01,8
34)
-
(1
01,8
34)
-
Regi
onal
tran
spor
tatio
n se
rvic
es49
,450
-
49
,450
-
Pl
anni
ng a
nd zo
ning
serv
ices
(18,
013)
-
(18,
013)
-
Loca
l gov
ernm
ent s
ervi
ces
(70,
631)
-
(70,
631)
-
Econ
omic
dev
elop
men
t sup
port
serv
ices
(32,
563)
-
(32,
563)
-
Man
agem
ent o
f loc
al d
evel
opm
ent c
ompa
nies
-
-
-
-
Tota
l gov
ernm
enta
l act
iviti
es(1
99,5
92)
-
(1
99,5
92)
-
Busi
ness
type
act
iviti
es:
Mic
ro lo
an p
rogr
am
-
(1
02,5
06)
(1
02,5
06)
-
Map
ping
& g
eogr
aphi
c in
form
atio
n sy
stem
s sup
port
-
(5
94)
(5
94)
-
Tota
l bus
ines
s typ
e ac
tiviti
es-
(103
,100
)
(103
,100
)
-
To
tal p
rimar
y go
vern
men
t(1
99,5
92)
(1
03,1
00)
(3
02,6
92)
-
Com
pone
nt u
nits
:Bu
sine
ss le
ndin
g se
rvic
es
-
-
-
96
,318
To
tal c
ompo
nent
uni
ts-
-
-
96,3
18
Gen
eral
reve
nues
:M
embe
r ass
essm
ents
435,
254
-
435,
254
-
Inte
rest
1,
405
-
1,
405
34,7
65
Tran
sfer
s(5
94)
594
-
-
To
tal g
ener
al re
venu
es43
6,06
5
59
4
43
6,65
9
34,7
65
Chan
ge in
net
ass
ets
236,
473
(102
,506
)
133,
967
13
1,08
3
N
et a
sset
s - b
egin
ning
1,98
4,26
1
393,
667
2,
377,
928
4,03
2,91
4
Net
ass
ets -
end
ing
2,22
0,73
4$
291,
161
$
2,
511,
895
$
4,16
3,99
7$
Cont
inue
d fr
om p
revi
ous p
age.
Prim
ary
Gov
ernm
ent
CEN
TRAL
SAV
ANN
AH R
IVER
ARE
A RE
GIO
NAL
CO
MM
ISSI
ON
ST
ATEM
ENT
OF
ACT
IVIT
IES
FOR
THE
FISC
AL Y
EAR
ENDE
D Ju
ne 3
0, 2
011
Net
(Exp
ense
) Rev
enue
and
Cha
nges
In N
et A
sset
s
Page 24 of 108

The accompanying notes are an integral part of this statement.
GENERAL
GRANTS AND CONTRACTS
FUND
TOTAL GOVERNMENTAL
FUNDS
ASSETSReceivables 2,793$ 1,212,013$ 1,214,806$ Due from other funds 3,388,818 1,360,015 4,748,833 Due from component units 48,431 175,428 223,859 Prepaid items - 27,250 27,250
Total assets 3,440,042$ 2,774,706$ 6,214,748$
LIABILITIES AND FUND BALANCESLiabilities:
Accounts payable -$ 372,663$ 372,663$ Due to other funds 1,460,351 2,355,820 3,816,171 Due to component units - - - Deferred revenues 3,453 46,223 49,676
Total liabilities 1,463,804 2,774,706 4,238,510 Fund balances:
Unassigned, reported in:General fund 1,976,238 - 1,976,238 Special revenue fund - - -
Total fund balances 1,976,238 - 1,976,238 Total liabilities and fund balances 3,440,042$ 2,774,706$
244,496 Net assets of governmental fund activities 2,220,734$
An internal service fund is used by management to charge general and administrative costs to individual funds. The assets and liabilities of the internal service fund are included in governmental activities in the statement of net assets.
CENTRAL SAVANNAH RIVER AREA REGIONAL COMMISSION BALANCE SHEET
GOVERNMENTAL FUNDSJune 30, 2011
Amounts reported for governmental activities in the statement of net assets are different because:
Page 25 of 108
The accompanying notes are an integral part of this statement.
GENERAL
GRANTS AND CONTRACTS
FUND
TOTAL GOVERNMENTAL
FUNDS
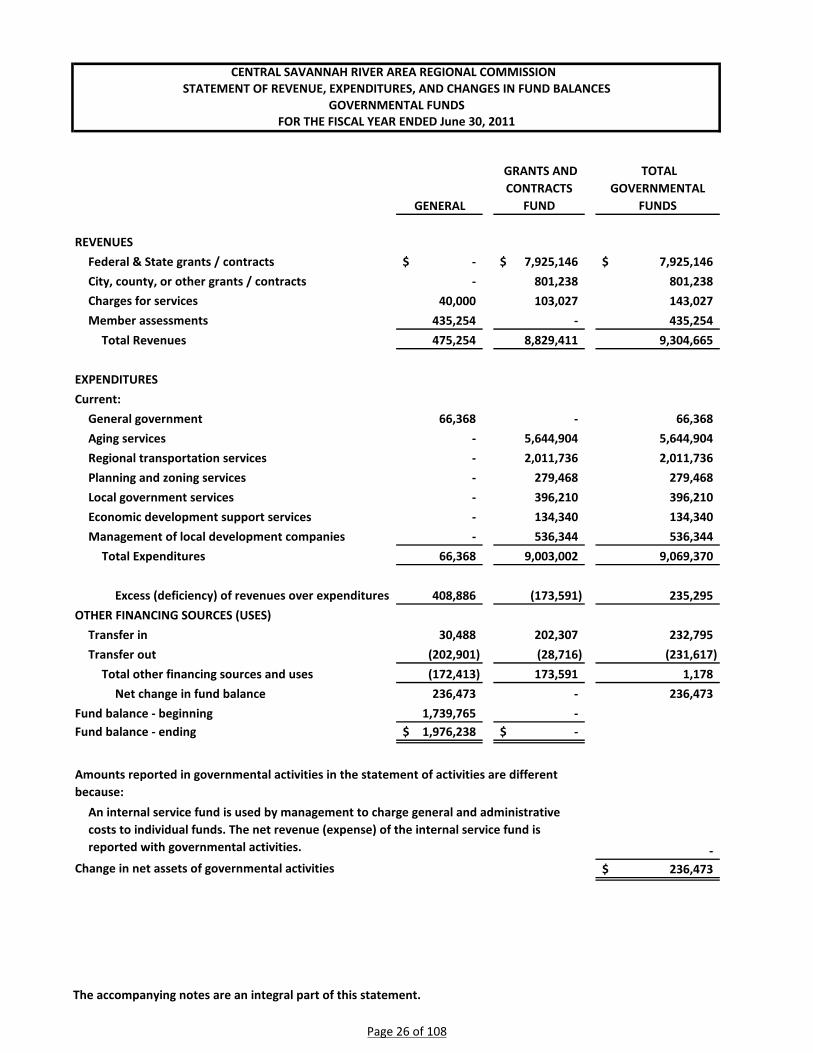
REVENUESFederal & State grants / contracts -$ 7,925,146$ 7,925,146$ City, county, or other grants / contracts - 801,238 801,238 Charges for services 40,000 103,027 143,027 Member assessments 435,254 - 435,254
Total Revenues 475,254 8,829,411 9,304,665
EXPENDITURESCurrent:
General government 66,368 - 66,368 Aging services - 5,644,904 5,644,904 Regional transportation services - 2,011,736 2,011,736 Planning and zoning services - 279,468 279,468 Local government services - 396,210 396,210 Economic development support services - 134,340 134,340 Management of local development companies - 536,344 536,344
Total Expenditures 66,368 9,003,002 9,069,370
Excess (deficiency) of revenues over expenditures 408,886 (173,591) 235,295 OTHER FINANCING SOURCES (USES)
Transfer in 30,488 202,307 232,795 Transfer out (202,901) (28,716) (231,617)
Total other financing sources and uses (172,413) 173,591 1,178 Net change in fund balance 236,473 - 236,473
Fund balance - beginning 1,739,765 - Fund balance - ending 1,976,238$ -$
- Change in net assets of governmental activities 236,473$
Amounts reported in governmental activities in the statement of activities are different because:
An internal service fund is used by management to charge general and administrative costs to individual funds. The net revenue (expense) of the internal service fund is reported with governmental activities.
CENTRAL SAVANNAH RIVER AREA REGIONAL COMMISSION STATEMENT OF REVENUE, EXPENDITURES, AND CHANGES IN FUND BALANCES
GOVERNMENTAL FUNDSFOR THE FISCAL YEAR ENDED June 30, 2011
Page 26 of 108

The accompanying notes are an integral part of this statement.
GOVERNMENTAL ACTIVITIES
HERMAN LODGE MICRO LOAN
PROGRAMGIS &
MAPPING TOTALINDIRECT COST
FUND
ASSETSCurrent Assets:
Cash and cash equivalents -$ -$ -$ 2,689,614$ Receivables - - - 452 Loans receivable 41,429 - 41,429 - Due from other funds 51,419 48,917 100,336 - Prepaid items - - - 23,472
Total current assets 92,848 48,917 141,765 2,713,538 Non-Current Assets:
Non-current portion of loans receivable, net 145,507 - 145,507 - Capital assets, net - 3,889 3,889 72,915 Security deposit - - - 5,778
Total non-current assets 145,507 3,889 149,396 78,693 Total assets 238,355$ 52,806$ 291,161$ 2,792,231$
LIABILITIESCurrent liabilities:
Accounts payable -$ -$ -$ 1,128,018$ Accrued liabilities - - - 88,713 Due to other funds - - - 1,032,998 Compensated absences payable - - - 206,200
Total current liabilities - - - 2,455,929 Noncurrent liabilities:
Compensated absences payable - - - 91,806 Total liabilities - - - 2,547,735
NET ASSETSInvested in capital assets - 3,889 3,889 72,915 Unrestricted 238,355 48,917 287,272 171,581
Total net assets 238,355 52,806 291,161 244,496 Total liabilities and net assets 238,355$ 52,806$ 291,161$ 2,792,231$
BUSINESS -TYPE ACTIVITIES - ENTERPRISE FUNDS
CENTRAL SAVANNAH RIVER AREA REGIONAL COMMISSION STATEMENT OF NET ASSETS
June 30, 2011PROPRIETARY FUNDS
Page 27 of 108
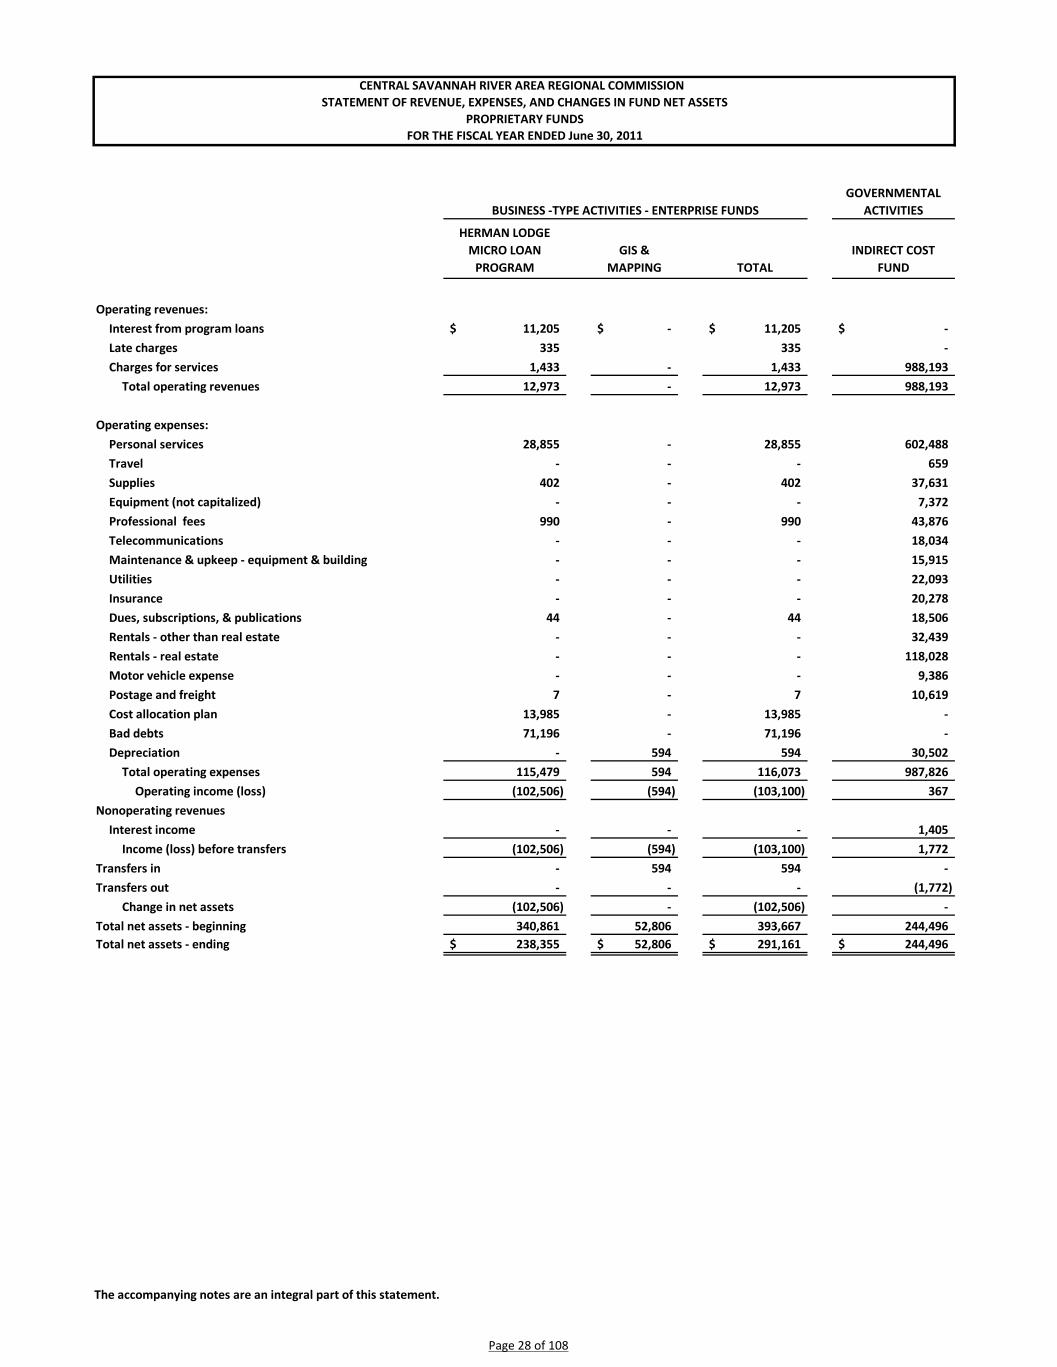
The accompanying notes are an integral part of this statement.
GOVERNMENTAL ACTIVITIES
HERMAN LODGE MICRO LOAN
PROGRAMGIS &
MAPPING TOTALINDIRECT COST
FUND
Operating revenues:Interest from program loans 11,205$ -$ 11,205$ -$ Late charges 335 335 - Charges for services 1,433 - 1,433 988,193
Total operating revenues 12,973 - 12,973 988,193
Operating expenses:Personal services 28,855 - 28,855 602,488 Travel - - - 659 Supplies 402 - 402 37,631 Equipment (not capitalized) - - - 7,372 Professional fees 990 - 990 43,876 Telecommunications - - - 18,034 Maintenance & upkeep - equipment & building - - - 15,915 Utilities - - - 22,093 Insurance - - - 20,278 Dues, subscriptions, & publications 44 - 44 18,506 Rentals - other than real estate - - - 32,439 Rentals - real estate - - - 118,028 Motor vehicle expense - - - 9,386 Postage and freight 7 - 7 10,619 Cost allocation plan 13,985 - 13,985 - Bad debts 71,196 - 71,196 - Depreciation - 594 594 30,502
Total operating expenses 115,479 594 116,073 987,826 Operating income (loss) (102,506) (594) (103,100) 367
Nonoperating revenues Interest income - - - 1,405
Income (loss) before transfers (102,506) (594) (103,100) 1,772 Transfers in - 594 594 - Transfers out - - - (1,772)
Change in net assets (102,506) - (102,506) - Total net assets - beginning 340,861 52,806 393,667 244,496 Total net assets - ending 238,355$ 52,806$ 291,161$ 244,496$
BUSINESS -TYPE ACTIVITIES - ENTERPRISE FUNDS
CENTRAL SAVANNAH RIVER AREA REGIONAL COMMISSION STATEMENT OF REVENUE, EXPENSES, AND CHANGES IN FUND NET ASSETS
FOR THE FISCAL YEAR ENDED June 30, 2011PROPRIETARY FUNDS
Page 28 of 108

The accompanying notes are an integral part of this statement.
GOVERNMENTAL ACTIVITIES
HERMAN LODGE MICRO LOAN
PROGRAMGIS &
MAPPING TOTALINDIRECT COST
FUND
CASH FLOWS FROM OPERATING ACTIVITIESReceipts from customers 12,879$ -$ 12,879$ 5,895$ Program loan principal repaid 28,145 - 28,145 - Program loan disbursed to recipient (143,319) - (143,319) - Receipts for interfund services provided - - - 983,000 Payments for employee services and benefits (28,855) - (28,855) (561,933) Payments to suppliers for goods and services (1,443) - (1,443) (197,540) Payments for interfund services used (13,985) - (13,985) -
Receipts from other funds for reimbursment of operating transactions 187,603 - 187,603 10,108,775
Payments to other funds for reimbursment of operating transactions (41,025) (594) (41,619) (9,478,615)
Net cash provided (used) by operating activities - (594) (594) 859,582
CASH FLOWS FROM NON CAPITAL FINANCING ACTIVITIESTransfers to other funds - - - (1,772) Transfers from other funds - 594 594 - Payment of advance from other General Fund - - - -
Net cash provided (used) by capital financing activities - 594 594 (1,772)
CASH FLOWS FROM CAPITAL AND RELATED FINANCING ACTIVITIES
Purchase of capital assets - - - (3,554) Net cash provided (used) by capital and related financing activities - - - (3,554)
CASH FLOWS FROM INVESTING ACTIVITIESInterest received - - - 1,405
Net cash provided (used) by investing activities - - - 1,405
Net increase (decrease) in cash and cash equivalents - - - 855,661 Balances - beginning of year - - - 1,833,953 Balance - end of year -$ -$ -$ 2,689,614$
( ) PROVIDED (USED) BY OPERATING ACTIVITIES:
Operating income (loss) (102,506)$ (594)$ (103,100)$ 367$ Adjustments to reconcile operating income (loss) to net cash provided (used) by operating activities
Depreciation expense - 594 594 30,502 Bad debt expenses 71,196 71,196 -
Changes in assets and liabilities: - Receivable - other - - - 702 Loans receivable (115,268) - (115,268) - Due from/to other funds 146,578 (594) 145,984 630,160 Prepaid expenses - - - (55) Accounts payable - - - 202,846 Accrued expenses - - - (45,495) Compensated absences payable - - - 40,555
Net cash provided (used) by operations -$ (594)$ (594)$ 859,582$
BUSINESS -TYPE ACTIVITIES - ENTERPRISE FUNDS
CENTRAL SAVANNAH RIVER AREA REGIONAL COMMISSION STATEMENT OF CASH FLOWS
FOR THE FISCAL YEAR ENDED June 30, 2011PROPRIETARY FUNDS
Page 29 of 108
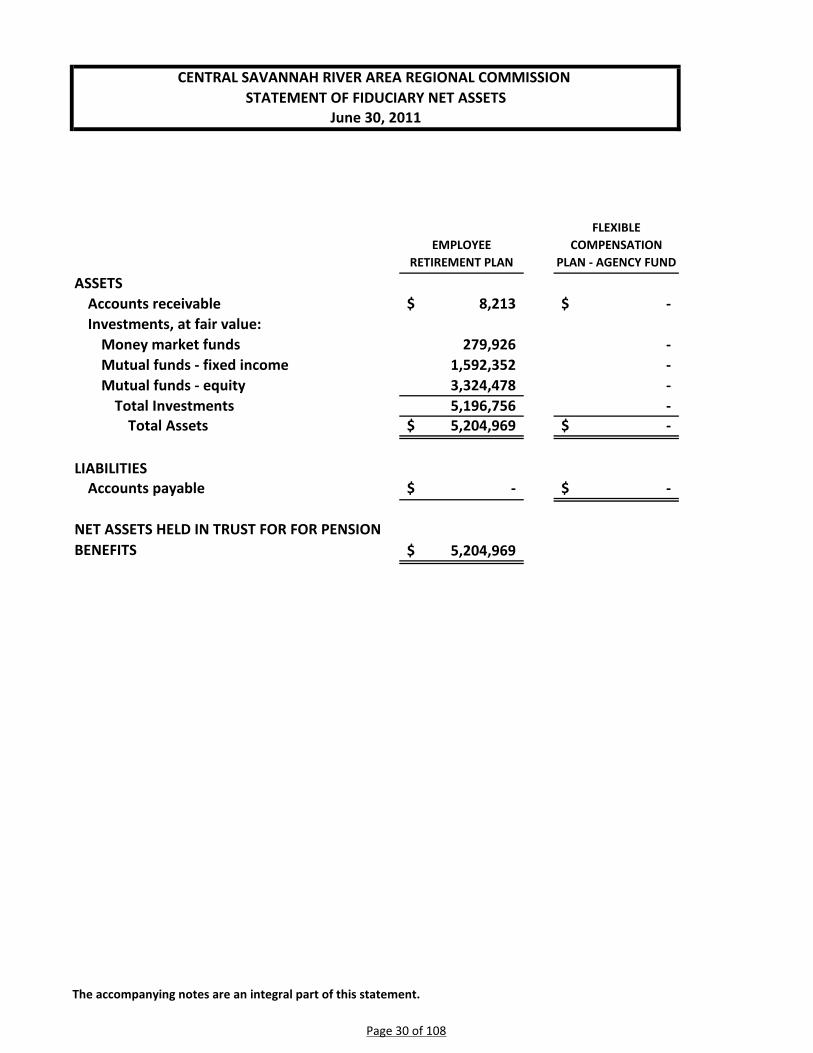
The accompanying notes are an integral part of this statement.
EMPLOYEE RETIREMENT PLAN
FLEXIBLE COMPENSATION
PLAN - AGENCY FUND
Accounts receivable 8,213$ -$ Investments, at fair value:
Money market funds 279,926 - Mutual funds - fixed income 1,592,352 - Mutual funds - equity 3,324,478 -
Total Investments 5,196,756 - Total Assets 5,204,969$ -$
Accounts payable -$ -$
5,204,969$
NET ASSETS HELD IN TRUST FOR FOR PENSION BENEFITS
LIABILITIES
CENTRAL SAVANNAH RIVER AREA REGIONAL COMMISSION STATEMENT OF FIDUCIARY NET ASSETS
June 30, 2011
ASSETS
Page 30 of 108
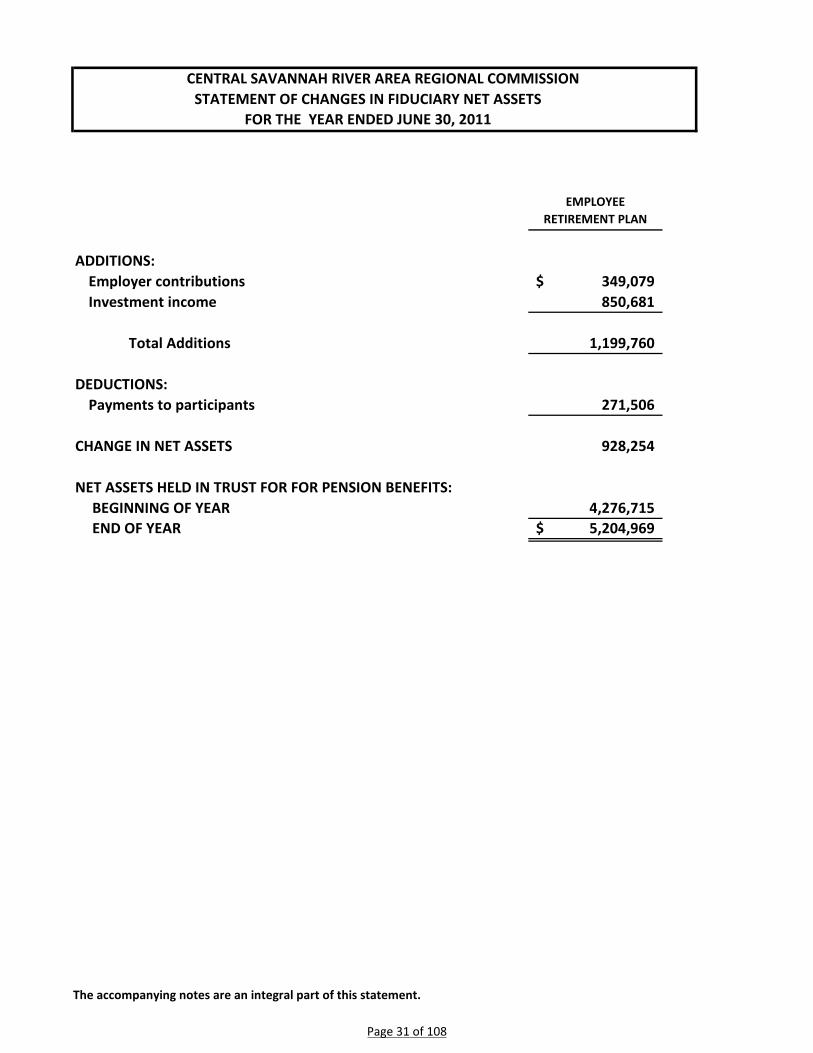
The accompanying notes are an integral part of this statement.
STATEMENT OF CHANGES IN FIDUCIARY NET ASSETSFOR THE YEAR ENDED JUNE 30, 2011
EMPLOYEE RETIREMENT PLAN
ADDITIONS:Employer contributions 349,079$ Investment income 850,681
Total Additions 1,199,760
DEDUCTIONS:Payments to participants 271,506
CHANGE IN NET ASSETS 928,254
BEGINNING OF YEAR 4,276,715 END OF YEAR 5,204,969$
NET ASSETS HELD IN TRUST FOR FOR PENSION BENEFITS:
CENTRAL SAVANNAH RIVER AREA REGIONAL COMMISSION
Page 31 of 108

The accompanying notes are an integral part of this statement.
CSRA RESOURCE DEVELOPMENT AGENCY, INC.
CSRA LOCAL DEVELOPMENT
CORPORATION, INC.
CSRA RURAL LENDING
AUTHORITY, INC. TOTAL
ASSETSCurrent Assets:
Cash and cash equivalents 386,129$ 1,519,900$ 788,068$ 2,694,097$ Loans receivable 249,769 4,437 460,692 714,898 Other receivable 5,223 11,136 9,249 25,608 Due from other funds 3,000 - - 3,000 Prepaid items - 2,025 - 2,025
Total current assets 644,121 1,537,498 1,258,009 3,439,628 Non-Current Assets:
Non-current portion of loans receivable, net 1,133,005 143,135 2,697,619 3,973,759 Capital assets, net - 14,725 - 14,725 Premium on loan, net - - 36,946 36,946
Total non-current assets 1,133,005 157,860 2,734,565 4,025,430 Total Assets 1,777,126$ 1,695,358$ 3,992,574$ 7,465,058$
LIABILITIESCurrent liabilities:
Accrued liabilities -$ -$ 12,649$ 12,649$ Due to primary government 28,079 151,145 44,635 223,859 Due to other funds - - 3,000 3,000 Notes payable - - 187,138 187,138
Total current liabilities 28,079 151,145 247,422 426,646 Noncurrent liabilities:
Notes payable - - 2,874,415 2,874,415 Total noncurrent liabilities - - 2,874,415 2,874,415
NET ASSETSInvested in capital assets - 14,725 - 14,725 Unrestricted 1,749,047 1,529,488 870,737 4,149,272
Total net assets 1,749,047 1,544,213 870,737 4,163,997 Total liabilities and net assets 1,777,126$ 1,695,358$ 3,992,574$ 7,465,058$
CENTRAL SAVANNAH RIVER AREA REGIONAL COMMISSION COMBINING STATEMENT OF NET ASSETS - COMPONENT UNITS
June 30, 2011
Page 32 of 108

The accompanying notes are an integral part of this statement.
CSRA RESOURCE DEVELOPMENT AGENCY, INC.
CSRA LOCAL DEVELOPMENT
CORPORATION, INC.
CSRA RURAL LENDING
AUTHORITY, INC. TOTAL
Operating revenues:Interest income from program loans 112,969$ 8,748$ 199,954$ 321,671$ Late charges 3,759 955 6,079 10,793 Loan processing fees 2,250 260,235 10,193 272,678 Loan servicing fees - 432,228 - 432,228 Misc Income 1,777 - - 1,777
Total operating revenues 120,755 702,166 216,226 1,039,147
Operating expenses:Administrative fee 98,311 314,576 123,458 536,345 Legal Fees - 61,400 446 61,846 Shared processing fees - 21,157 - 21,157 Entertainment - 1,218 - 1,218 Travel - 49,680 308 49,988 Supplies 1,113 4,005 1,805 6,923 Telecommunications 1,201 1,201 1,201 3,603 Dues, subscriptions, & publications 2,187 16,116 2,450 20,753 Postage and freight 1,132 9,673 1,146 11,951 Board meetings 533 533 533 1,599 Conferences & training - 18,803 - 18,803 Foreclosure Expense - 2,500 12,680 15,180 Bad debts - - 158,007 158,007 Amortization - - 2,842 2,842 Depreciation - 1,517 - 1,517
Total operating expenses 104,477 502,379 304,876 911,732
Operating income (loss) 16,278 199,787 (88,650) 127,415
Nonoperating revenues (expenses):Interest income 3,400 17,626 13,739 34,765 Interest expenses - - (31,097) (31,097)
Total nonoperating revenue (expenses) 3,400 17,626 (17,358) 3,668
Change in net assets 19,678 217,413 (106,008) 131,083
Total net assets - beginning 1,729,369 1,326,800 976,745 4,032,914
Total net assets - ending 1,749,047$ 1,544,213$ 870,737$ 4,163,997$
CENTRAL SAVANNAH RIVER AREA REGIONAL COMMISSION COMBINING STATEMENT OF REVENUE, EXPENSES, AND CHANGES IN FUND NET ASSETS
COMPONENT UNITSFOR THE FISCAL YEAR ENDED June 30, 2011
Page 33 of 108

CENTRAL SAVANNAH RIVER AREA REGIONAL COMMISSION NOTES TO THE FINANCIAL STATEMENTS
JUNE 30, 2011
NOTE 1 –SUMMARY OF SIGNIFICANT ACCOUNTING POLICIES Central Savannah River Area Regional Commission (“the Commission”) accounts for its financial position and results of operations in accordance with accounting principles generally accepted in the United States of America (GAAP) applicable to governmental units. The Commission’s reporting entity applies all relevant Government Accounting Standards Board (GASB) pronouncements. In the government-wide financial statements and in the proprietary fund financial statements, the Commission applies Financial Accounting Standards Board (FASB) pronouncements and Accounting Principles Board (APB) opinions issued on or before November 30, 1989, unless those pronouncements conflict with or contradict GASB pronouncements, in which case, GASB prevails. The following is a summary of the more significant policies. A. REPORTING ENTITY The Central Savannah River Area Regional Commission succeeded the former Central Savannah River Area Regional Development Center (Center) effective July 1, 2009. The Official Code of Georgia Annotated (OCGA) Section 50-8-41 provided for this succession. All contractual obligations to employees, other duties, rights, and benefits of the Center automatically became duties, obligations, rights, and benefits of the successor Commission. The Commission is a special purpose local government existing under the authority of Georgia law as provided for by the OCGA § 50-8-41. The responsibilities and authority of the Commission are contained in Sections 50-8-30 through 50-8-67 of OCGA. The Commission assists local governments in planning for common needs, cooperating for mutual benefit, and coordinating for sound regional development. Membership assessments, federal, state, local, and private grants/contracts finance operations of the Commission. Grants from federal, state, and other sources are the primary sources of revenues permitting the Commission to meet its responsibilities. County members of the Commission are Burke, Columbia, Glascock, Hancock, Jefferson, Jenkins, Lincoln, McDuffie, Richmond, Taliaferro, Warren, Washington, and Wilkes Counties. Municipalities members are: Waynesboro, Midvale, Sardis, Girard, Keysville, Grovetown, Harlem, Gibson, Edge hill, Mitchell, Sparta, Louisville, Wrens, Wadley, Stapleton, Bartow, Avira, Millen, Lincolnton, Thomson, Dearing, Hephzibah, Blythe, Crawfordville, Sharon, Warrenton, Norwood, Camas, Devisor, Deepstep, Harrison, Oconee, Riddleville, Sandersville, Tennille, Washington, Tignall, and Rayle. As provided by law these members pay mandatory dues in support of the Commission (see Note 4.A). The Commission is fiscally independent of other state and local government units and as such is considered a primary government. The Commission’s financial statements include the accounts of all the Commission’s operations and its component units (CUs), entities for which the Commission is considered to be financially accountable. CSRA Resource Development Agency, Inc., CSRA Local Development Corporation, Inc., and CSRA Rural Lending Authority, Inc. are included as CUs. The Commission’s Council (board of directors) appoints and has the authority to remove at will the directors of each corporation. These separate organizations do meet the financial accountability criteria described in GASB Statement 14 and are included. The nature and significance of the relationship of these separate organizations with the Commission are such that exclusion would cause the Commission’s financial statements to be incomplete. The Georgia Attorney General in his Official Opinion 96-8 dated May 9, 1996, stated, “It is my official opinion that an RDC [Center] lacks authority to abrogate its duty to be accountable for the nonprofit corporations it is authorized to create.” See Note 2.C. The CUs are discretely presented, meaning their combined totals are reported in a separate column in the
Page 34 of 108
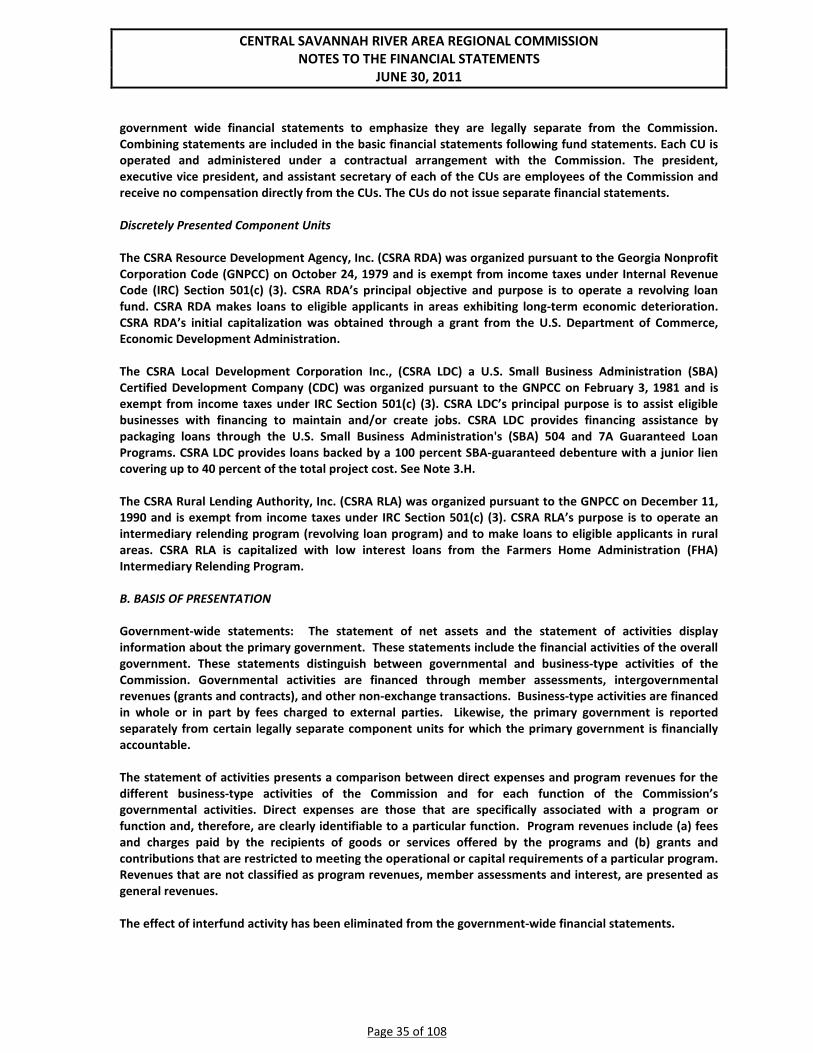
CENTRAL SAVANNAH RIVER AREA REGIONAL COMMISSION NOTES TO THE FINANCIAL STATEMENTS
JUNE 30, 2011
government wide financial statements to emphasize they are legally separate from the Commission. Combining statements are included in the basic financial statements following fund statements. Each CU is operated and administered under a contractual arrangement with the Commission. The president, executive vice president, and assistant secretary of each of the CUs are employees of the Commission and receive no compensation directly from the CUs. The CUs do not issue separate financial statements. Discretely Presented Component Units The CSRA Resource Development Agency, Inc. (CSRA RDA) was organized pursuant to the Georgia Nonprofit Corporation Code (GNPCC) on October 24, 1979 and is exempt from income taxes under Internal Revenue Code (IRC) Section 501(c) (3). CSRA RDA’s principal objective and purpose is to operate a revolving loan fund. CSRA RDA makes loans to eligible applicants in areas exhibiting long-term economic deterioration. CSRA RDA’s initial capitalization was obtained through a grant from the U.S. Department of Commerce, Economic Development Administration. The CSRA Local Development Corporation Inc., (CSRA LDC) a U.S. Small Business Administration (SBA) Certified Development Company (CDC) was organized pursuant to the GNPCC on February 3, 1981 and is exempt from income taxes under IRC Section 501(c) (3). CSRA LDC’s principal purpose is to assist eligible businesses with financing to maintain and/or create jobs. CSRA LDC provides financing assistance by packaging loans through the U.S. Small Business Administration's (SBA) 504 and 7A Guaranteed Loan Programs. CSRA LDC provides loans backed by a 100 percent SBA-guaranteed debenture with a junior lien covering up to 40 percent of the total project cost. See Note 3.H. The CSRA Rural Lending Authority, Inc. (CSRA RLA) was organized pursuant to the GNPCC on December 11, 1990 and is exempt from income taxes under IRC Section 501(c) (3). CSRA RLA’s purpose is to operate an intermediary relending program (revolving loan program) and to make loans to eligible applicants in rural areas. CSRA RLA is capitalized with low interest loans from the Farmers Home Administration (FHA) Intermediary Relending Program. B. BASIS OF PRESENTATION Government-wide statements: The statement of net assets and the statement of activities display information about the primary government. These statements include the financial activities of the overall government. These statements distinguish between governmental and business-type activities of the Commission. Governmental activities are financed through member assessments, intergovernmental revenues (grants and contracts), and other non-exchange transactions. Business-type activities are financed in whole or in part by fees charged to external parties. Likewise, the primary government is reported separately from certain legally separate component units for which the primary government is financially accountable. The statement of activities presents a comparison between direct expenses and program revenues for the different business-type activities of the Commission and for each function of the Commission’s governmental activities. Direct expenses are those that are specifically associated with a program or function and, therefore, are clearly identifiable to a particular function. Program revenues include (a) fees and charges paid by the recipients of goods or services offered by the programs and (b) grants and contributions that are restricted to meeting the operational or capital requirements of a particular program. Revenues that are not classified as program revenues, member assessments and interest, are presented as general revenues. The effect of interfund activity has been eliminated from the government-wide financial statements.
Page 35 of 108

CENTRAL SAVANNAH RIVER AREA REGIONAL COMMISSION NOTES TO THE FINANCIAL STATEMENTS
JUNE 30, 2011
Separate financial statements are provided for governmental funds, proprietary funds, and fiduciary funds, even though the latter are excluded from the government-wide financial statements. Fund financial statements: The fund financial statements provide information about the Commission’s funds. Separate statements for each fund category – governmental, proprietary, and fiduciary – are presented. The emphasis of fund financial statements is on major governmental and enterprise funds. In addition to the general fund the Commission has only one other governmental fund. Proprietary fund operation revenues, such as charges for services, result from exchange transactions associated with the principal activity of the fund. Exchange transactions are those in which each party receives and gives up essentially equal values. Nonoperating revenues, such as subsidies and investment earnings, result from non-exchange transactions or ancillary activities. The Commission reports the following major governmental funds:
The General Fund is used to account for all non-specific financial resources and those not accounted for in other funds. The general fund balance is available for any purpose provided it is expended or transferred according to the general laws of Georgia. The Grants and Contracts Fund is used to account for all the Commission’s grants and contracts undertaken to carry out the functional responsibilities of the Commission. Within this fund the Commission maintains records on a functional level.
The Commission reports the following major proprietary funds.
Herman Lodge Micro Loan Program is an enterprise fund used to account for revenues and expenses resulting from the operation of a micro revolving loan fund created by the Commission as a result of a Rural Enterprise Grant from USDA Rural Economic and Community Development. The Geographic Information Systems (GIS) / Mapping Fund is an enterprise fund used to account for special assistance provided to member governments and internal departments in the area of mapping data and related information. The Commission is anticipating closing this fund.
Additionally, the Commission reports the following funds:
The Indirect Cost Fund (ICF) is an internal service fund used to account for indirect costs, payroll and fringe benefit payments and their allocation, and the receipt and disbursement of all the Commission’s funds. Because these services predominantly benefit governmental rather than business-type functions, the Indirect Cost Fund is reported with governmental activities in the government-wide financial statements.
The Pension Trust Fund is a fiduciary fund used to account for the resources held for the benefit of participants in the Commission’s money purchase pension plan. Agency funds are custodial in nature and do not involve the measurement of operating results. The Commission uses an agency fund to account for assets it holds on behalf of others. The Flexible Compensation Plan Fund accounts for the funds withheld from employees’ pay for the purposes of reimbursing them for uninsured medical costs and dependent care costs.
Page 36 of 108
CENTRAL SAVANNAH RIVER AREA REGIONAL COMMISSION NOTES TO THE FINANCIAL STATEMENTS
JUNE 30, 2011
C. MEASUREMENT FOCUS AND BASIS OF ACCOUNTING Government-wide, Proprietary and Fiduciary Fund Financial Statements – The government-wide, proprietary fund and fiduciary financial statements are reported using the economic resources measurement focus, except for agency funds which have no measurement focus. The government-wide, proprietary fund and fiduciary financial statements are reported using the accrual basis of accounting. Revenues are recorded when earned and expenses are recorded at the time liabilities are incurred, regardless of when the related cash flows take place. Nonexchange transactions, in which the Commission gives (or receives) value without directly receiving (or giving) equal value in exchange, include member assessments and donations. On an accrual basis, revenue from member assessments is recognized at July 1 of each fiscal year. Revenue from grants and reimbursable contracts is recognized when program expenditures are incurred in accordance with program guidelines. Amounts reported as program revenues include charges for services provided and intergovernmental grants and contracts. General revenues include member assessments and interest income. Proprietary funds distinguish operating revenues and expenses from nonoperating items. Operating revenues and expenses generally result from providing services and producing and delivering goods in connection with a proprietary fund’s principal ongoing operations. The principal operating revenues of the Commission’s enterprise funds are charges to customers for sales and services and interest earned on program loans, as distinguished from interest earned on funds on deposit. Operating expenses for enterprise funds include the cost of sales and services, administrative expenses, and depreciation on capital assets. All revenues and expenses not meeting this definition are reported as nonoperating revenues and expenses. Governmental Fund Financial Statements – Governmental funds are reported using the current financial resources measurement focus and the modified accrual basis of accounting. Under this method, revenues are recognized when measurable and available. “Measurable” means the amount of the transaction can be determined and “available” means collectible within the current period. The Commission considers all revenues available if they are collected within 150 days after year-end. Expenditures are recorded when the related fund liability is incurred, except for claims and judgments and compensated absences, which are recognized as expenditures to the extent they have matured. General capital asset acquisitions are reported as expenditures in governmental funds. Proceeds of general long-term debt and acquisitions under capital leases are reported as other financing sources. Revenues of the Commission’s governmental funds susceptible to accrual are member assessments, interest, and the earned portion of grant and contracts. Grant and contract revenues are recognized when program expenditures are incurred in accordance with program guidelines. Such revenues are subject to review by the funding agency and may result in disallowance in subsequent periods. Unearned revenue arises when assets are recognized before revenue recognition criteria have been satisfied. It is the Commission’s policy to first apply cost-reimbursement grant resources, followed by local grants or contracts, and then by general revenues. D. CASH AND CASH EQUIVALENTS The Commission’s Cash and Cash Equivalents are considered to be cash on hand, demand deposits with banks and other financial institutions, and the State investment pool that has the general characteristics of demand deposit accounts in that the Commission may deposit additional cash at any time and also may withdraw cash at any time without prior notice or penalty. See Note 3.A.
Page 37 of 108

CENTRAL SAVANNAH RIVER AREA REGIONAL COMMISSION NOTES TO THE FINANCIAL STATEMENTS
JUNE 30, 2011
E. INVESTMENTS The Commission is authorized to invest in obligations of the United States, bonds or certificates of indebtedness of the State of Georgia, repurchase agreements where the underlying security is one of the foregoing, certificates of deposit and the State of Georgia’s Georgia Fund 1 (GA1), a stable net asset value investment pool. The pension trust fund is authorized to invest in securities consistent with the Employee Retirement Income Security Act of 1974 (ERISA) prudency and diversity of risk standards. The Pension Trust’s investment in mutual funds involves the Commission indirectly in derivatives. However, information relating to the nature and purpose of the derivative transactions or the Commission’s exposure to credit risk, market risk, and legal risk is not available. Investments are reported at fair value. Fair value is determined as follows: short-term investments are reported at cost, which approximates fair value; securities traded on national exchanges are valued at current prices or current prices of similar securities; securities for which an established market does not exist are reported at estimated fair value using selling prices for similar investments for which there is an active market. Georgia’s Office of Treasury and Fiscal Services (OTFS) operates in accordance with appropriate state laws and regulations. The reported value of the pool is the same as the fair value of the pool shares. See Note 3.A. F. INVENTORIES AND PREPAID ITEMS Even though the Commission has some expendable supplies (e.g., office and computer supplies) on hand at June 30, the quantities and dollar values were not material. Accordingly, none are shown on the statement of net assets at that date. The cost of supplies is recorded as expenditure at the time that the individual items are purchased. Certain payments to vendors reflect costs applicable to future accounting periods and are recorded as prepaid items in both government-wide and fund financial statements. G. CAPITAL ASSETS Capital assets are defined by the Commission as assets with an initial, individual cost of more than $2,500 and an estimated useful life in excess of one year. Purchased capital assets are reported at cost or estimated historical cost. Donated capital assets are recorded at their estimated fair value at the date of donation. Capital assets of the Commission consist of vehicles, furniture, fixtures, and equipment. The Commission has no public domain or infrastructure capital assets. The cost of normal maintenance and repairs that do not add to the value of the asset or materially extend the assets’ lives are not capitalized. Depreciation is computed using the straight-line method. A summary of the estimated useful lives is as follows: Vehicles 4 – 5 years Office Equipment 5 – 10 years Computer equipment 3 – 7 years Leasehold improvements 10 years H. COMPENSATED ABSENCES Effective July 1, 2002 the Commission adopted new leave policies. Paid Time Off (PTO) was created to replace both vacation and sick leave. The new policy allowed existing employees to retain their unused sick
Page 38 of 108

CENTRAL SAVANNAH RIVER AREA REGIONAL COMMISSION NOTES TO THE FINANCIAL STATEMENTS
JUNE 30, 2011
leave at June 30, 2002 and use as needed until exhausted. The paid time off policy of the Commission provides for the accumulation of up to four hundred hours of PTO at December 31. Hours accumulate at the rate of twelve to nineteen hours per month, depending upon the years of service. The employee's right to receive compensation for PTO vests as earned and is used through paid time off or cash payment at termination or retirement. For the Commission’s government-wide financial statements and proprietary fund financial statements, an expense and a liability for compensated absences and the salary-related payments are recorded as PTO is earned. The Commission has assumed a first-in, first-out method of using accumulated compensated time. The portion of that time that is estimated to be used in the next fiscal year has been designated as a current liability in the government-wide financial statements. No accrual has been established for accumulated sick leave of employees since it is the Commission’s policy to record the cost of sick leave only when it is used. However, at June 30 the value of unused sick leave was $104,416. I. LONG TERM OBLIGATIONS In the government-wide financial statements, and proprietary fund types in the fund financial statements, long-term debt is reported as a liability in the applicable governmental activities, business-type activities, or proprietary fund type statement of net assets. J. FUND EQUITY The Commission implemented GASB Statement No. 54, Fund Balance Reporting and Governmental Fund Type Definitions, as of July 1, 2010. This new standard changes the overall definitions and classifications of governmental fund balance. Governmental fund equity is classified as fund balance. Fund balance is further classified as nonspendable, restricted, committed, assigned, or unassigned. Nonspendable fund balance cannot be spent because of its form or because it is legally or contractually required to be maintained intact. Restricted fund balance has limitations imposed by creditors, grantors, or contributors or by enabling legislation or constitutional provisions. Committed fund balance is a limitation imposed by the Council through approval of resolutions. Assigned fund balance is a limitation imposed by either Council or the executive director with the intent to be used for a specific purpose(s) and is neither restricted nor committed. Unassigned fund balance is the residual classification for the General Fund. Fund equity for all other reporting is classified as net assets. K. DIRECT COSTS AND ALLOCATION OF INDIRECT COSTS AND EMPLOYEE BENEFITS The ICF is used to account for all administrative activities of the Commission, including the indirect cost pool, payroll and fringe benefit payments and allocations, and the receipt and disbursement of all the Commission’s funds. The expenses of the fund are reflected net of the reimbursements. Costs that can be identified specifically with a particular grant, contract, or project are considered direct costs and are charged directly to the applicable grant, contract, or project. Costs that are incurred for a common or joint purpose benefiting more than one program or activity are considered indirect costs. Indirect costs are recorded in the ICF and allocated to all grants, contracts, and projects in accordance with Office of Management and Budget (OMB) Circular A-87. Recoveries of these costs are recorded as operating revenues in the ICF and as expenditures or expenses in the paying fund. Costs not considered allowable under the Commission’s cost allocation plan are excluded from the cost allocation process and create an operating deficit in the fund. When this occurs funds are transferred from the General Fund to the ICF to cover the deficit created as the intent is for the fund to operate on a break even basis.
Page 39 of 108
CENTRAL SAVANNAH RIVER AREA REGIONAL COMMISSION NOTES TO THE FINANCIAL STATEMENTS
JUNE 30, 2011
The Commission’s indirect costs are allocated monthly to grants, contracts, and projects using direct chargeable personnel costs as the allocation base. Total indirect costs incurred by the Commission for the year were $983,000. The allocation base of direct chargeable personnel costs was $2,086,493; the effective indirect cost rate was 47.11%. The Commission’s employee benefits are also allocated monthly to grants, contracts, and projects as a percentage of salaries. The Commission incurred total fringe benefits of $846,132 for the year. The allocation base of direct chargeable salaries was $1,842,849; the effective fringe benefit rate was 45.91%. The Commission maintains a cost allocation plan in support of its fringe benefit and indirect cost allocation methodologies. L. USE OF ESTIMATES The preparation of financial statements in conformity with accounting principles generally accepted in the United States of America requires management to make estimates and assumptions that affect the reported amounts of assets and liabilities and the reported amount of revenues and expenditures/expenses during the reporting period. Actual results could differ from those estimates. NOTE 2 – STEWARDSHIP, COMPLIANCE, AND ACCOUNTABILITY A. BUDGETARY INFORMATION An internal operating budget for the general fund, special revenue fund, and internal service fund is prepared by the Commission for management purposes. The budget is not subject to review or approval by the Legislature of the State of Georgia and, therefore, is a nonappropriated budget. B. BOUNDARY OF OPERATIONS The Official Code of Georgia (O.C.G.A.) § 50-8-32 provides that the Commission’s jurisdiction and authority is limited to defined regional boundaries as specified by O.C.G.A. § 50-8-4 and is denoted as Region 7. However, the Georgia Department of Human Services (DHS), Division of Aging Services continues to recognize Screven County as being in the program service area of the Commission. Therefore, the Commission is required by the terms of its agreements with DHS to continue operating its Aging and Transportation programs in Screven County. O.C.G.A. § 50-8-35 (a)(2) provides that a commission may contract with any state agency for coordinated and comprehensive planning covering areas not within the territorial boundaries with approval of that contract by the regional commission’s council. C. COMPLIANCE CSRA Local Development Corporation (CSRA) received a letter from the US Small Business Administration (SBA) on August 7, 2007, stating “we have determined that CSRA is in violation of SBA’s federal regulations that require a Certified Development Company (CDC) to be independent and not controlled by another agency.” Based on the same criteria discussed in 1.A above SBA has determined that CSRA CDC is an affiliate and controlled by the Commission which violates SBA regulations. SBA requires that CDC's be autonomous entities and not controlled or affiliated with another entity. SBA has established specific guidelines of how the membership and board is to be governed to insure public accountability to the small business
Page 40 of 108
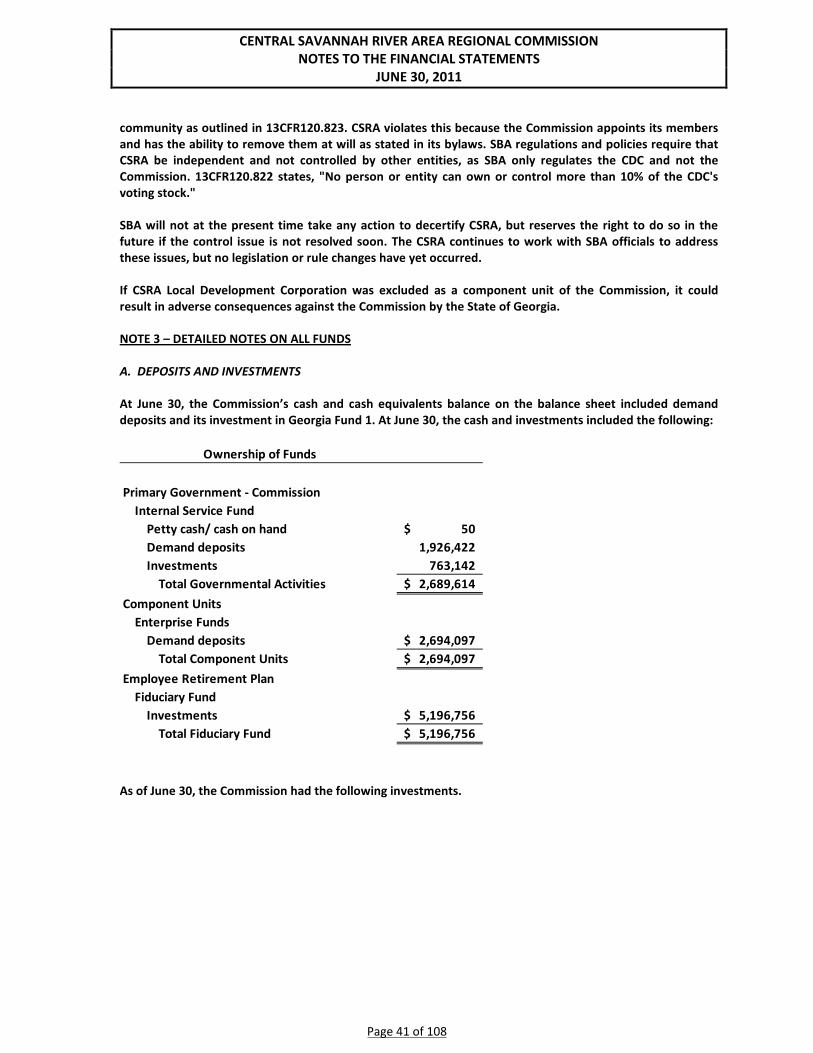
CENTRAL SAVANNAH RIVER AREA REGIONAL COMMISSION NOTES TO THE FINANCIAL STATEMENTS
JUNE 30, 2011
community as outlined in 13CFR120.823. CSRA violates this because the Commission appoints its members and has the ability to remove them at will as stated in its bylaws. SBA regulations and policies require that CSRA be independent and not controlled by other entities, as SBA only regulates the CDC and not the Commission. 13CFR120.822 states, "No person or entity can own or control more than 10% of the CDC's voting stock." SBA will not at the present time take any action to decertify CSRA, but reserves the right to do so in the future if the control issue is not resolved soon. The CSRA continues to work with SBA officials to address these issues, but no legislation or rule changes have yet occurred. If CSRA Local Development Corporation was excluded as a component unit of the Commission, it could result in adverse consequences against the Commission by the State of Georgia. NOTE 3 – DETAILED NOTES ON ALL FUNDS A. DEPOSITS AND INVESTMENTS At June 30, the Commission’s cash and cash equivalents balance on the balance sheet included demand deposits and its investment in Georgia Fund 1. At June 30, the cash and investments included the following:
As of June 30, the Commission had the following investments.
Ownership of Funds
Primary Government - CommissionInternal Service Fund
Petty cash/ cash on hand 50$ Demand deposits 1,926,422 Investments 763,142
Total Governmental Activities 2,689,614$ Component Units
Enterprise FundsDemand deposits 2,694,097$
Total Component Units 2,694,097$ Employee Retirement Plan
Fiduciary FundInvestments 5,196,756$
Total Fiduciary Fund 5,196,756$
Page 41 of 108
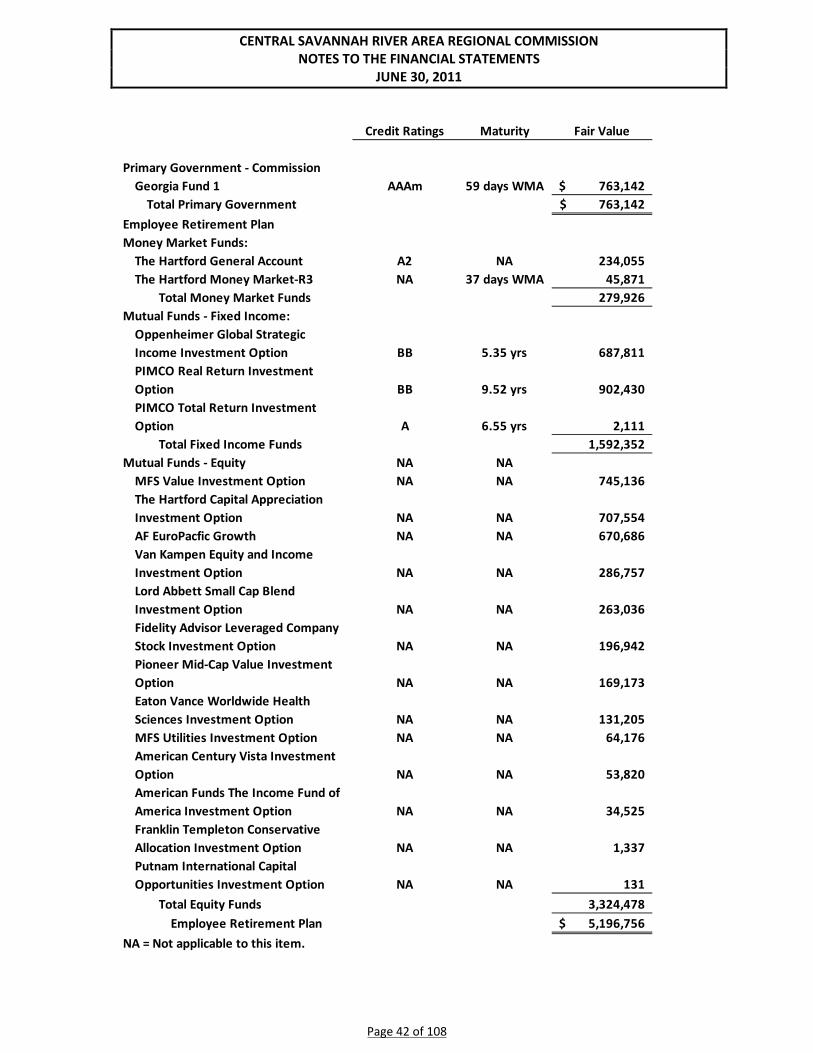
CENTRAL SAVANNAH RIVER AREA REGIONAL COMMISSION NOTES TO THE FINANCIAL STATEMENTS
JUNE 30, 2011
Credit Ratings Maturity Fair Value
Primary Government - CommissionGeorgia Fund 1 AAAm 59 days WMA 763,142$
Total Primary Government 763,142$ Employee Retirement PlanMoney Market Funds:
The Hartford General Account A2 NA 234,055 The Hartford Money Market-R3 NA 37 days WMA 45,871
Total Money Market Funds 279,926 Mutual Funds - Fixed Income:
Oppenheimer Global Strategic Income Investment Option BB 5.35 yrs 687,811 PIMCO Real Return Investment Option BB 9.52 yrs 902,430 PIMCO Total Return Investment Option A 6.55 yrs 2,111
Total Fixed Income Funds 1,592,352 Mutual Funds - Equity NA NA
MFS Value Investment Option NA NA 745,136 The Hartford Capital Appreciation Investment Option NA NA 707,554 AF EuroPacfic Growth NA NA 670,686 Van Kampen Equity and Income Investment Option NA NA 286,757 Lord Abbett Small Cap Blend Investment Option NA NA 263,036 Fidelity Advisor Leveraged Company Stock Investment Option NA NA 196,942 Pioneer Mid-Cap Value Investment Option NA NA 169,173 Eaton Vance Worldwide Health Sciences Investment Option NA NA 131,205 MFS Utilities Investment Option NA NA 64,176 American Century Vista Investment Option NA NA 53,820 American Funds The Income Fund of America Investment Option NA NA 34,525 Franklin Templeton Conservative Allocation Investment Option NA NA 1,337 Putnam International Capital Opportunities Investment Option NA NA 131
Total Equity Funds 3,324,478 Employee Retirement Plan 5,196,756$
NA = Not applicable to this item.
Page 42 of 108

CENTRAL SAVANNAH RIVER AREA REGIONAL COMMISSION NOTES TO THE FINANCIAL STATEMENTS
JUNE 30, 2011
Interest rate risk. The Commission does not have an investment policy that limits investment maturities as a means of managing its exposure to fair value losses arising from increasing interest rates. Credit Risk. The Commission does not have a formal investment policy that limits investments to only those rated by a nationally recognized statistical rating organization (NRSROs) nor to a specific level of rating issues by NRSROs. Concentration of Credit Risk. Concentration risk is defined as positions of five percent or more in the securities of a single issuer. The Commission has no investment policy protecting from concentration risk. Custodian credit risk – deposits. In the case of deposits, this is the risk that in the event of a bank failure, the Commission’s deposits or its CUs’ deposits may not be returned to it. Neither the government nor its CUs has a deposit policy for custodian risk. However, both the Commission and its CUs follow state law requiring pledges of collateral from depository institutions. The Dodd-Franklin Wall Street Reform and Consumer Protection Act raised the standard maximum deposit insurance amount to $250,000 per depositor, per insured depository institution for each account ownership category. As of June 30, the carrying amount of the Commission’s deposits with financial institutions was $1,926,422 and the bank balance was $1,408,373. Of the bank balance, $250,000 was covered by Federal depository insurance and $1,158,373 collateralized by securities in a Federal Reserve pledge account. Therefore, the Commission’s deposits are not subject to custodial credit risk. As of June 30, the carrying amount of the CUs’ deposits with financial institutions was $2,694,097 and the bank balance was $2,925,085. Of the bank balance, $750,000 was covered by Federal depository insurance and $1,946,805 was collateralized by a group of securities pledged by a group of financial institutions for the purpose of providing common collateral for their deposits of public funds. The pool has the ability to make additional assessments. Therefore, the CUs’ deposits are not subject to custodial credit risk. B. ACCOUNTS RECEIVABLE AND UNEARNED REVENUES A detail of accounts receivable and unearned revenues follows:
Accounts Receivable
Unearned Revenue
Governmental Activities:
Area Agency on Aging - Local Funds -$ 37,581$
Augusta-Richmond County - 2,646
Blythe, city of - 807
Burke BOC 3,803 -
CDBG - project fees - 700
City of Gibson - -
Columbia BOC 1,025 -
Downtown Development Authority of Augusta 1,888 -
Edge Hill, city of 33 -
Employee advances 361 -
GA Chapter of Alzheimer's Associaiton 470 -
Primary Government
Page 43 of 108

CENTRAL SAVANNAH RIVER AREA REGIONAL COMMISSION NOTES TO THE FINANCIAL STATEMENTS
JUNE 30, 2011
Accounts Receivable
Unearned Revenue
GA Department of Human Services - travel reimbursement 620$ -$
GA Department of Natural Services - EPD 8,144 -
GA Dept. of Community Affairs, FY11 Support 57,566 -
GA Dept. of Human Services, Chronic Disease Self-Management Program Contract #427-93-ARRA09012-99 1,773 -
GA Dept. of Human Services, Coordinated Transportation Contract ##42700-362-0000005517 351,119 -
GA Dept. of Human Services, Early Onset Alzheimer Contract #42700-373-0000007359 7,520 -
GA Dept. of Human Services, Multi-Funded Aging Services Contract #427000-373-0000004858 578,678 -
GA Dept. of Transportation, STP-0009-00(325) Project ID 0009325 4,199 -
Georgia Department of Labor 2,326 -
Girard, city of 226 -
Glascock Cnty BOC 1,870 -
Glascock Cnty COC 225 -
Hancock BOC 7,552 -
Heartland Hospice (sponsorship) 250 -
Jefferson BOC 4,312 -
Jenkins Cnty COC 175 -
Lincolnton, city of 2,134 -
Louisville, city of 11,679 -
McDuffie Cnty BOC's 1,000 -
McDuffie Cnty COC 175 -
Midville, city of 1,002 -
Millen, city of 10,035 -
Sandersville, city of 20,787 -
Sardis, city of 2,329 -
Sharon, city of 96 -
Sparta, city of 1,500 -
Tenille, city of 23,233 -
Thomson Housing Authority 1,359 -
Thomson, city of 15,204 -
U.S. Dept. of Commerce - Economic Development Admin. Award Number 04-83 2,562 -
U.S. Dept. of Commerce - Economic Development Admin. Award Number 04-83 31,295 -
Unified Development Council - local funds - 7,942
Vendor overpayment 92 -
Vidette, city of 112 -
Wadley, city of 15,409 -
Warren Cnty BOC 2,440 -
Washington BOC 2,092 -
Page 44 of 108
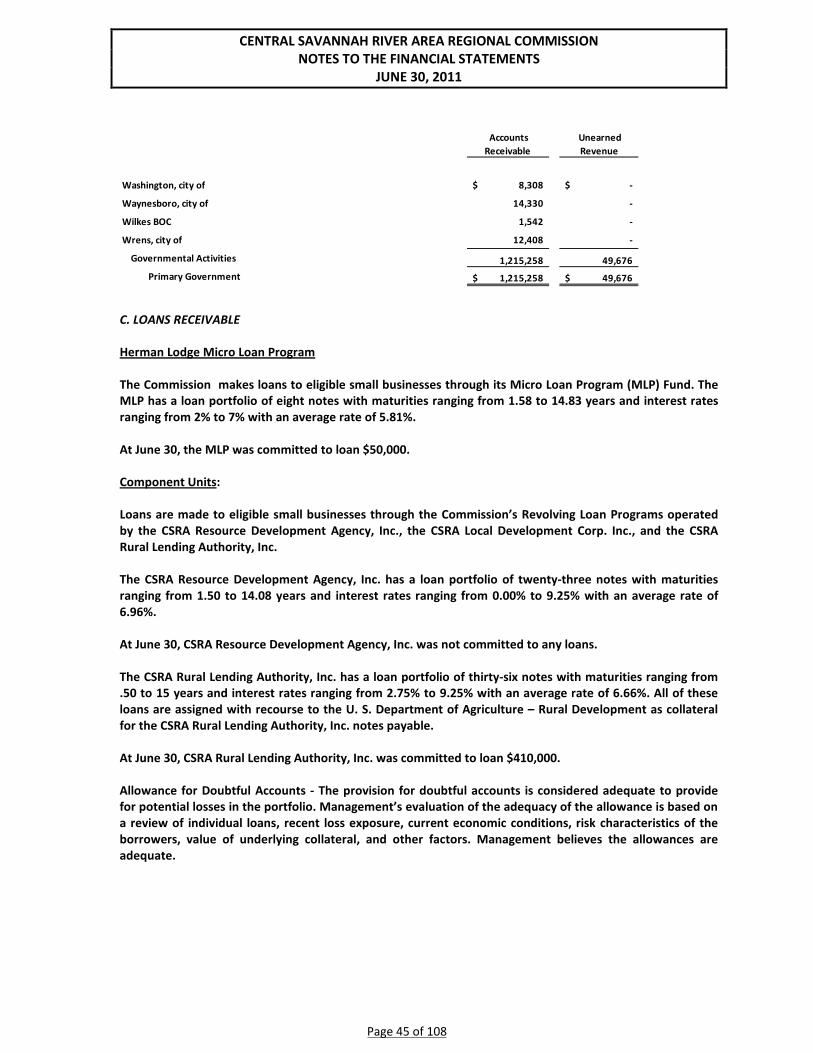
CENTRAL SAVANNAH RIVER AREA REGIONAL COMMISSION NOTES TO THE FINANCIAL STATEMENTS
JUNE 30, 2011
C. LOANS RECEIVABLE Herman Lodge Micro Loan Program The Commission makes loans to eligible small businesses through its Micro Loan Program (MLP) Fund. The MLP has a loan portfolio of eight notes with maturities ranging from 1.58 to 14.83 years and interest rates ranging from 2% to 7% with an average rate of 5.81%. At June 30, the MLP was committed to loan $50,000. Component Units: Loans are made to eligible small businesses through the Commission’s Revolving Loan Programs operated by the CSRA Resource Development Agency, Inc., the CSRA Local Development Corp. Inc., and the CSRA Rural Lending Authority, Inc. The CSRA Resource Development Agency, Inc. has a loan portfolio of twenty-three notes with maturities ranging from 1.50 to 14.08 years and interest rates ranging from 0.00% to 9.25% with an average rate of 6.96%. At June 30, CSRA Resource Development Agency, Inc. was not committed to any loans. The CSRA Rural Lending Authority, Inc. has a loan portfolio of thirty-six notes with maturities ranging from .50 to 15 years and interest rates ranging from 2.75% to 9.25% with an average rate of 6.66%. All of these loans are assigned with recourse to the U. S. Department of Agriculture – Rural Development as collateral for the CSRA Rural Lending Authority, Inc. notes payable. At June 30, CSRA Rural Lending Authority, Inc. was committed to loan $410,000. Allowance for Doubtful Accounts - The provision for doubtful accounts is considered adequate to provide for potential losses in the portfolio. Management’s evaluation of the adequacy of the allowance is based on a review of individual loans, recent loss exposure, current economic conditions, risk characteristics of the borrowers, value of underlying collateral, and other factors. Management believes the allowances are adequate.
Accounts Receivable
Unearned Revenue
Washington, city of 8,308$ -$
Waynesboro, city of 14,330 -
Wilkes BOC 1,542 -
Wrens, city of 12,408 -
Governmental Activities 1,215,258 49,676 Primary Government 1,215,258$ 49,676$
Page 45 of 108
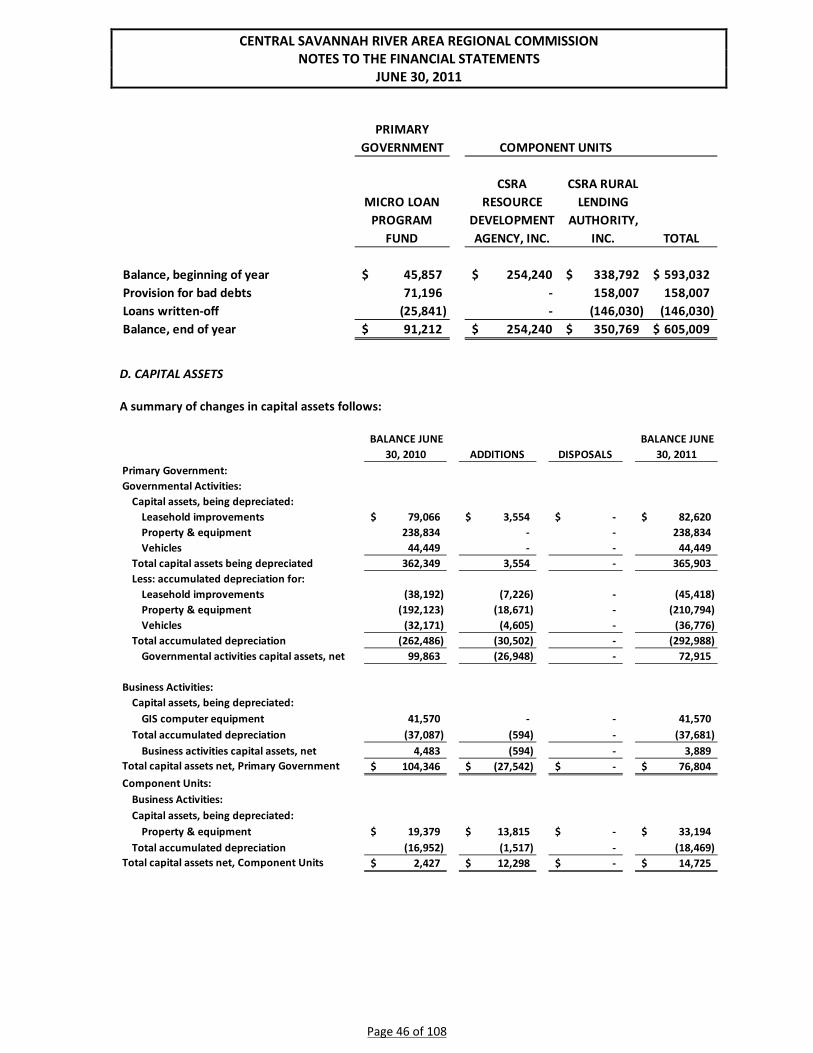
CENTRAL SAVANNAH RIVER AREA REGIONAL COMMISSION NOTES TO THE FINANCIAL STATEMENTS
JUNE 30, 2011
D. CAPITAL ASSETS A summary of changes in capital assets follows:
PRIMARY GOVERNMENT
MICRO LOAN PROGRAM
FUND
CSRA RESOURCE
DEVELOPMENT AGENCY, INC.
CSRA RURAL LENDING
AUTHORITY, INC. TOTAL
Balance, beginning of year 45,857$ 254,240$ 338,792$ 593,032$ Provision for bad debts 71,196 - 158,007 158,007 Loans written-off (25,841) - (146,030) (146,030) Balance, end of year 91,212$ 254,240$ 350,769$ 605,009$
COMPONENT UNITS
BALANCE JUNE 30, 2010 ADDITIONS DISPOSALS
BALANCE JUNE 30, 2011
Primary Government:Governmental Activities:
Capital assets, being depreciated:Leasehold improvements 79,066$ 3,554$ -$ 82,620$ Property & equipment 238,834 - - 238,834 Vehicles 44,449 - - 44,449
Total capital assets being depreciated 362,349 3,554 - 365,903 Less: accumulated depreciation for:
Leasehold improvements (38,192) (7,226) - (45,418) Property & equipment (192,123) (18,671) - (210,794) Vehicles (32,171) (4,605) - (36,776)
Total accumulated depreciation (262,486) (30,502) - (292,988) Governmental activities capital assets, net 99,863 (26,948) - 72,915
Business Activities:Capital assets, being depreciated:
GIS computer equipment 41,570 - - 41,570 Total accumulated depreciation (37,087) (594) - (37,681)
Business activities capital assets, net 4,483 (594) - 3,889 Total capital assets net, Primary Government 104,346$ (27,542)$ -$ 76,804$ Component Units:
Business Activities:Capital assets, being depreciated:
Property & equipment 19,379$ 13,815$ -$ 33,194$ Total accumulated depreciation (16,952) (1,517) - (18,469)
Total capital assets net, Component Units 2,427$ 12,298$ -$ 14,725$
Page 46 of 108

CENTRAL SAVANNAH RIVER AREA REGIONAL COMMISSION NOTES TO THE FINANCIAL STATEMENTS
JUNE 30, 2011
Depreciation expense is charged to functions as follows:
The general government depreciation of $30,502 is allocated to all functions through the Commission’s indirect cost allocation. E. INTERFUND RECEIVABLES, PAYABLES, AND TRANSFERS The composition of interfund balances as of June 30, is as follows:
The outstanding balances between funds result from the time lag between the dates that interfund goods and services are provided or reimbursable expenditures occur. These receivables and payables are classified
PRIMARY GOVERNMENT
COMPONENT UNITS
Governmental activities:General government 30,502$
Total depreciation - governmental activities 30,502$ Business activities:
Mapping & geographic information systems support 594$ Business lending services - 1,517 Total depreciation - business activities 594$ 1,517$
INTERFUNDRECEIVABLES PAYABLES
PRIMARY GOVERNMENT:General Fund:
Due from grants and contracts fund -$ -$ Due from indirect cost fund 1,032,998 - Due to GIS & mapping - 48,917 Due to grants and contracts fund 2,355,820 1,360,015 Due to Herman Lodge MLP - 51,419
Total General Fund 3,388,818 1,460,351 Grants and Contracts Fund:
Due from general fund 1,360,015 - Due to general fund - 2,355,820
Total Grants and Contracts Fund 1,360,015 2,355,820 Enterprise Fund:
Due from general fund - Herman Lodge MLP 51,419 - Due from general fund - GIS & mapping 48,917 -
Total Enterprise Fund 100,336 - Indirect Cost Fund:
Due to general fund - 1,032,998 Total Indirect Cost Fund - 1,032,998
Total Primary Government 4,849,169$ 4,849,169$
Page 47 of 108
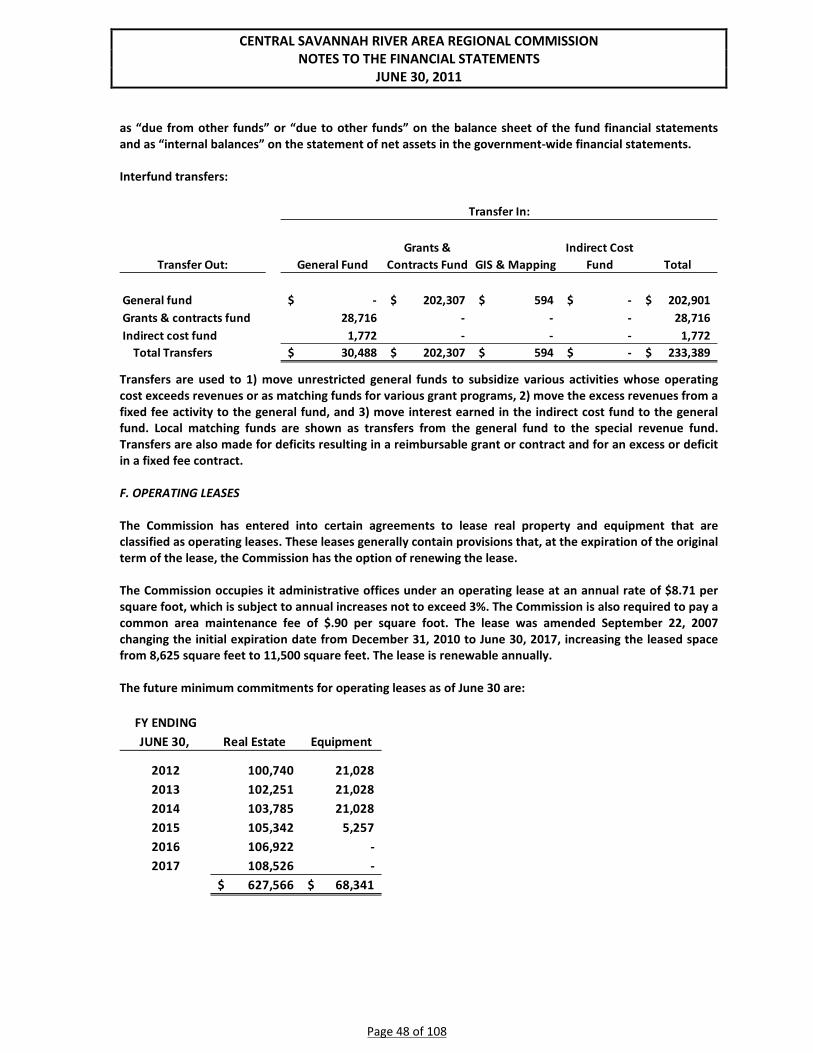
CENTRAL SAVANNAH RIVER AREA REGIONAL COMMISSION NOTES TO THE FINANCIAL STATEMENTS
JUNE 30, 2011
as “due from other funds” or “due to other funds” on the balance sheet of the fund financial statements and as “internal balances” on the statement of net assets in the government-wide financial statements. Interfund transfers:
Transfers are used to 1) move unrestricted general funds to subsidize various activities whose operating cost exceeds revenues or as matching funds for various grant programs, 2) move the excess revenues from a fixed fee activity to the general fund, and 3) move interest earned in the indirect cost fund to the general fund. Local matching funds are shown as transfers from the general fund to the special revenue fund. Transfers are also made for deficits resulting in a reimbursable grant or contract and for an excess or deficit in a fixed fee contract. F. OPERATING LEASES The Commission has entered into certain agreements to lease real property and equipment that are classified as operating leases. These leases generally contain provisions that, at the expiration of the original term of the lease, the Commission has the option of renewing the lease. The Commission occupies it administrative offices under an operating lease at an annual rate of $8.71 per square foot, which is subject to annual increases not to exceed 3%. The Commission is also required to pay a common area maintenance fee of $.90 per square foot. The lease was amended September 22, 2007 changing the initial expiration date from December 31, 2010 to June 30, 2017, increasing the leased space from 8,625 square feet to 11,500 square feet. The lease is renewable annually. The future minimum commitments for operating leases as of June 30 are:
Transfer Out: General FundGrants &
Contracts Fund GIS & MappingIndirect Cost
Fund Total
General fund -$ 202,307$ 594$ -$ 202,901$ Grants & contracts fund 28,716 - - - 28,716 Indirect cost fund 1,772 - - - 1,772
Total Transfers 30,488$ 202,307$ 594$ -$ 233,389$
Transfer In:
FY ENDINGJUNE 30, Real Estate Equipment
2012 100,740 21,028 2013 102,251 21,028 2014 103,785 21,028 2015 105,342 5,257 2016 106,922 - 2017 108,526 -
627,566$ 68,341$
Page 48 of 108

CENTRAL SAVANNAH RIVER AREA REGIONAL COMMISSION NOTES TO THE FINANCIAL STATEMENTS
JUNE 30, 2011
The Commission’s expenses for property and equipment leases for the fiscal year are:
G. LONG-TERM OBLIGATIONS Component Units – Notes Payable:
Note 1: The Central Savannah River Area Rural Lending Authority, Inc. (CSRA RLA) borrowed $1,000,000 from the U. S. Department of Agriculture, Rural Development (USDA RD) under a loan agreement dated October 30, 1991. Interest accrues at the rate of one percent (1%) per annum with payments of $39,900 beginning January 1, 1994 and continuing until October 31, 2021. Note 2: CSRA RLA executed a second loan agreement on July 26, 1994 with USDA RD to borrow an additional $1,000,000. Interest accrues at the rate of one percent (1%) per annum with payments of $39,900 beginning January 1, 1996 and continuing until July 26, 2024. Note 3: The CSRA RLA executed an assumption agreement on July 31, 1998 with Georgia Department of Community Affairs f/k/a GHFA Economic Financing Inc. (DCA) and USDA RD conferring to the CSRA RLA the rights and obligations under the note dated May 26, 1994. The principal balance of the note on July 31, 1998 was $1,918,935 and at that time, $1,487,500 of the principal remained to draw. Interest accrues at the rate of one percent (1%) per annum with payments of $84,900 beginning January 1, 2002 and continuing until May 26, 2024. Prior to the assumption DCA received $512,500 of the loan committed and repaid $81,065. See Premium on Loan following. Note 4: CSRA RLA executed a fourth agreement on December 13, 1999 with USDA RD to borrow an additional $500,000. Interest accrues at the rate of one percent (1%) per annum with payments of $21,225 beginning January 1, 2004 and continuing until December 31, 2029. Note 5: CSRA RLA executed a fifth agreement on June 26, 2001 with USDA RD to borrow an additional $750,000. Interest only was due on the note for the first three years. Interest accrues at the rate of one percent (1%) per annum with payments of $31,834 beginning June 26, 2005 and continuing until June 26, 2031.
Funds from all five loans capitalized the Intermediary Relending Program (IRP) to provide a revolving loan fund for qualified borrowers. The CSRA RLA, Inc. has pledged as collateral the balance of all loans receivable resulting from the re-lending of the proceeds of these notes and all other real and personal property of the CSRA RLA, Inc. Premium on Loan (Note 3): As part of the assumption agreement, CSRA RLA assumed three loans made by DCA from the $512,500 proceeds. The transaction resulted in the CSRA RLA paying a $73,890 premium for the right to assume the loan from DCA. This premium is being amortized over the term of the note.
Real estate 100,138$ Common area mainteance 17,889 Equipment 21,026 Total 139,054$
Page 49 of 108

CENTRAL SAVANNAH RIVER AREA REGIONAL COMMISSION NOTES TO THE FINANCIAL STATEMENTS
JUNE 30, 2011
A summary of long-term debt activity follows:
Annual debt service requirements to maturity for long-term obligations including interest follow:
H. ACCOUNTING TREATMENT FOR 504 LOANS AND DEBENTURES Small Business Administration notice No. 5000-207, effective May 17, 1988, clarified SBA's policy with respect to the accounting treatment CDCs should follow for 504 loans and debentures. There had been debate as to whether CDCs were required to follow a proposed regulation, Section 108.503-(4)(e), which was published in the Federal Register on July 5, 1984. This regulation would have required CDCs to record the 504 loan as an asset and the debenture as a liability. The notice above stated precisely that the SBA
Value of loans receivable from DCA 7/31/98 357,545$ Loan proceeds remaining to draw 7/31/98 1,487,500 Value of assets assumed 7/31/98 1,845,045 Note payable obligation assumed from DCA (1,918,935) Premium on loan assumed 73,890 Accumulated amortization 36,944 Carrying value at year end 36,946$
BALANCE BALANCE DUE WITHIN06/30/2010 INCREASES DECREASES 06/30/2011 ONE YEAR
Primary GovernmentInternal Service Fund:
Annual leave 257,451$ 199,009$ (158,454)$ 298,006$ 206,200$
Component Units:CSRA Rural Lending Authority, Inc. Notes Payable 3,247,413$ -$ (185,860)$ 3,061,553$ 187,138$
FISCAL YEAR ENDING JUNE 30, PRINCIPAL INTEREST
2012 187,138$ 30,616$ 2013 189,015 28,744 2014 190,905 26,854 2015 192,814 24,945 2016 194,742 23,017
2017 - 2021 1,003,315 85,480 2022 - 2026 866,500 33,571 2027 - 2031 237,124 6,737
Total 3,061,553$ 259,964$
COMPONENT UNITS
Page 50 of 108
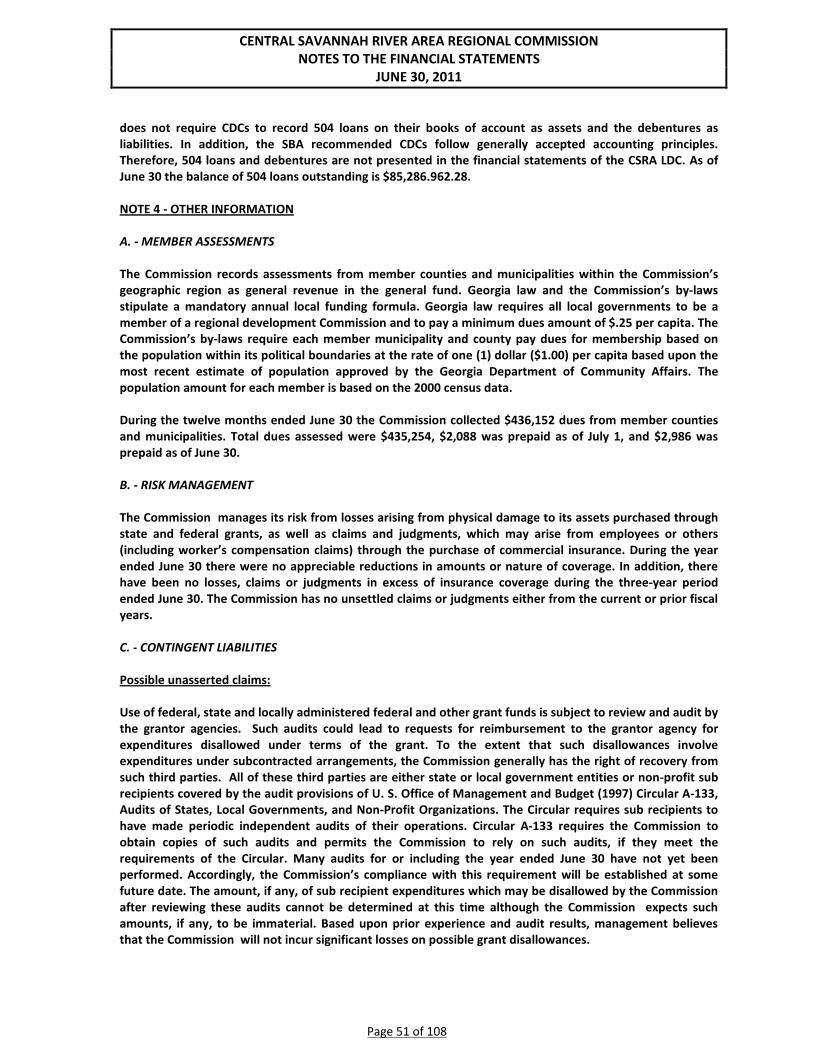
CENTRAL SAVANNAH RIVER AREA REGIONAL COMMISSION NOTES TO THE FINANCIAL STATEMENTS
JUNE 30, 2011
does not require CDCs to record 504 loans on their books of account as assets and the debentures as liabilities. In addition, the SBA recommended CDCs follow generally accepted accounting principles. Therefore, 504 loans and debentures are not presented in the financial statements of the CSRA LDC. As of June 30 the balance of 504 loans outstanding is $85,286.962.28. NOTE 4 - OTHER INFORMATION A. - MEMBER ASSESSMENTS The Commission records assessments from member counties and municipalities within the Commission’s geographic region as general revenue in the general fund. Georgia law and the Commission’s by-laws stipulate a mandatory annual local funding formula. Georgia law requires all local governments to be a member of a regional development Commission and to pay a minimum dues amount of $.25 per capita. The Commission’s by-laws require each member municipality and county pay dues for membership based on the population within its political boundaries at the rate of one (1) dollar ($1.00) per capita based upon the most recent estimate of population approved by the Georgia Department of Community Affairs. The population amount for each member is based on the 2000 census data. During the twelve months ended June 30 the Commission collected $436,152 dues from member counties and municipalities. Total dues assessed were $435,254, $2,088 was prepaid as of July 1, and $2,986 was prepaid as of June 30. B. - RISK MANAGEMENT The Commission manages its risk from losses arising from physical damage to its assets purchased through state and federal grants, as well as claims and judgments, which may arise from employees or others (including worker’s compensation claims) through the purchase of commercial insurance. During the year ended June 30 there were no appreciable reductions in amounts or nature of coverage. In addition, there have been no losses, claims or judgments in excess of insurance coverage during the three-year period ended June 30. The Commission has no unsettled claims or judgments either from the current or prior fiscal years. C. - CONTINGENT LIABILITIES Possible unasserted claims: Use of federal, state and locally administered federal and other grant funds is subject to review and audit by the grantor agencies. Such audits could lead to requests for reimbursement to the grantor agency for expenditures disallowed under terms of the grant. To the extent that such disallowances involve expenditures under subcontracted arrangements, the Commission generally has the right of recovery from such third parties. All of these third parties are either state or local government entities or non-profit sub recipients covered by the audit provisions of U. S. Office of Management and Budget (1997) Circular A-133, Audits of States, Local Governments, and Non-Profit Organizations. The Circular requires sub recipients to have made periodic independent audits of their operations. Circular A-133 requires the Commission to obtain copies of such audits and permits the Commission to rely on such audits, if they meet the requirements of the Circular. Many audits for or including the year ended June 30 have not yet been performed. Accordingly, the Commission’s compliance with this requirement will be established at some future date. The amount, if any, of sub recipient expenditures which may be disallowed by the Commission after reviewing these audits cannot be determined at this time although the Commission expects such amounts, if any, to be immaterial. Based upon prior experience and audit results, management believes that the Commission will not incur significant losses on possible grant disallowances.
Page 51 of 108
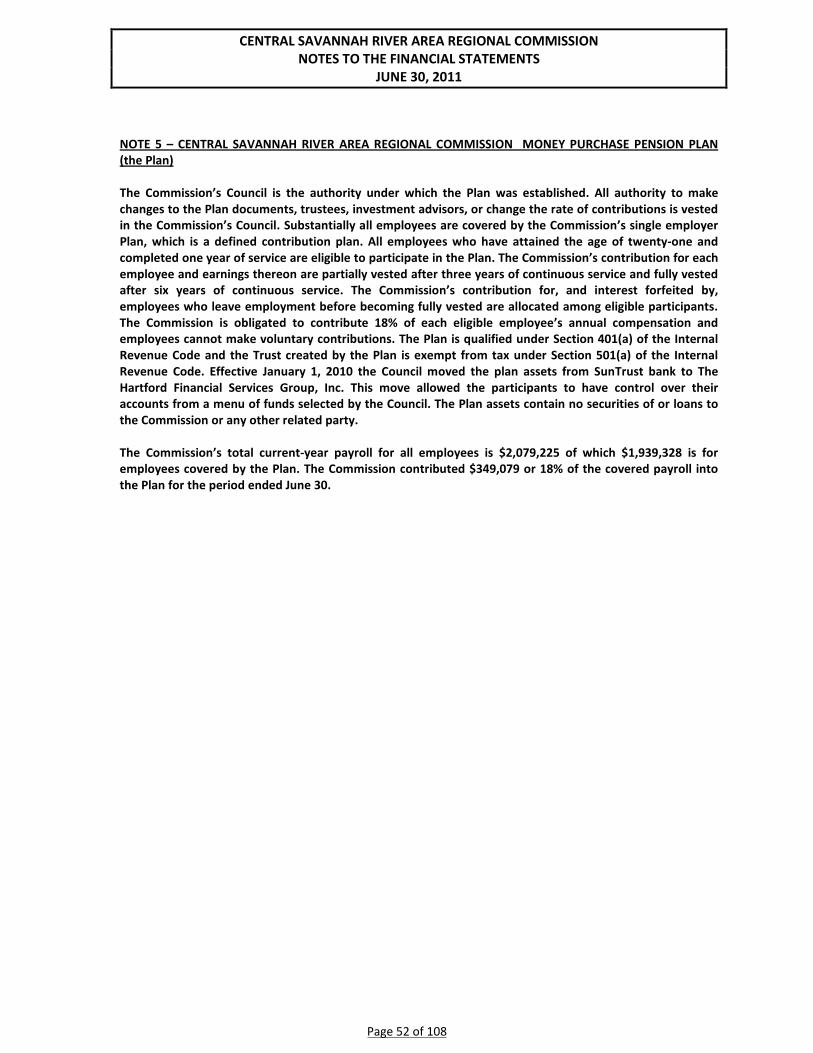
CENTRAL SAVANNAH RIVER AREA REGIONAL COMMISSION NOTES TO THE FINANCIAL STATEMENTS
JUNE 30, 2011
NOTE 5 – CENTRAL SAVANNAH RIVER AREA REGIONAL COMMISSION MONEY PURCHASE PENSION PLAN (the Plan) The Commission’s Council is the authority under which the Plan was established. All authority to make changes to the Plan documents, trustees, investment advisors, or change the rate of contributions is vested in the Commission’s Council. Substantially all employees are covered by the Commission’s single employer Plan, which is a defined contribution plan. All employees who have attained the age of twenty-one and completed one year of service are eligible to participate in the Plan. The Commission’s contribution for each employee and earnings thereon are partially vested after three years of continuous service and fully vested after six years of continuous service. The Commission’s contribution for, and interest forfeited by, employees who leave employment before becoming fully vested are allocated among eligible participants. The Commission is obligated to contribute 18% of each eligible employee’s annual compensation and employees cannot make voluntary contributions. The Plan is qualified under Section 401(a) of the Internal Revenue Code and the Trust created by the Plan is exempt from tax under Section 501(a) of the Internal Revenue Code. Effective January 1, 2010 the Council moved the plan assets from SunTrust bank to The Hartford Financial Services Group, Inc. This move allowed the participants to have control over their accounts from a menu of funds selected by the Council. The Plan assets contain no securities of or loans to the Commission or any other related party. The Commission’s total current-year payroll for all employees is $2,079,225 of which $1,939,328 is for employees covered by the Plan. The Commission contributed $349,079 or 18% of the covered payroll into the Plan for the period ended June 30.
Page 52 of 108

INDIVIDUAL STATEMENTS
Page 53 of 108
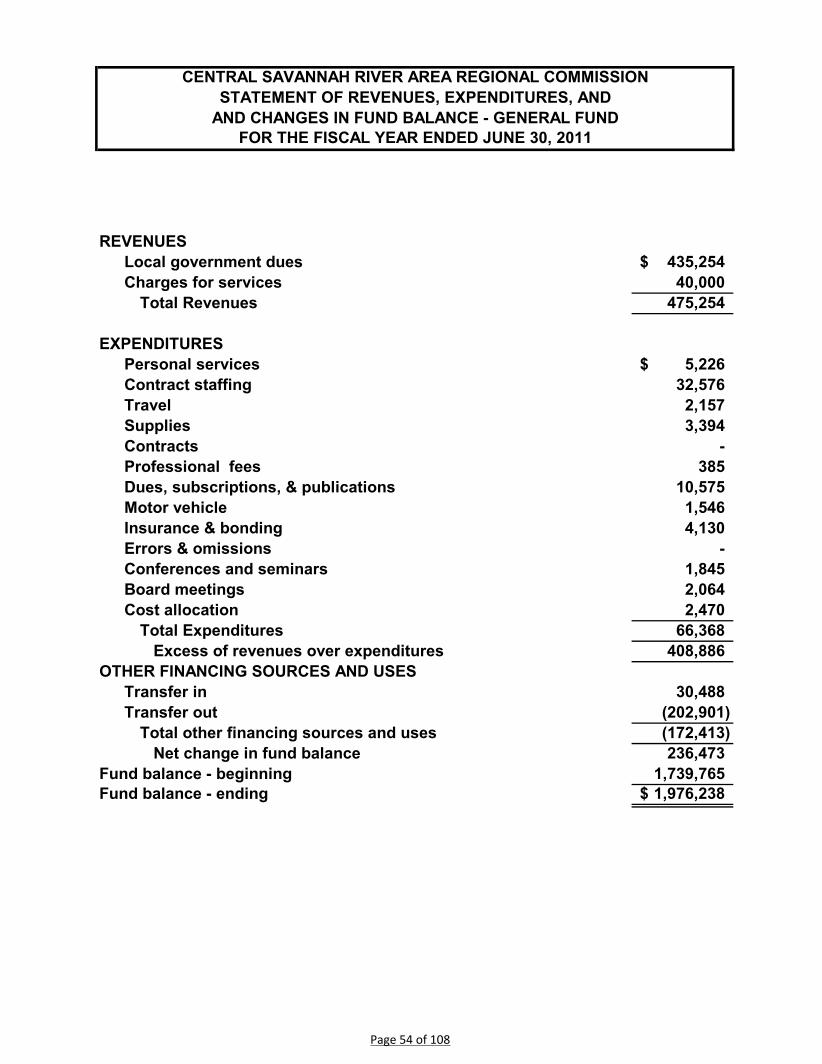
REVENUESLocal government dues 435,254$ Charges for services 40,000
Total Revenues 475,254
EXPENDITURESPersonal services 5,226$ Contract staffing 32,576 Travel 2,157 Supplies 3,394 Contracts - Professional fees 385 Dues, subscriptions, & publications 10,575 Motor vehicle 1,546 Insurance & bonding 4,130 Errors & omissions - Conferences and seminars 1,845 Board meetings 2,064 Cost allocation 2,470
Total Expenditures 66,368 Excess of revenues over expenditures 408,886
Transfer in 30,488 Transfer out (202,901)
(172,413) 236,473
1,739,765 1,976,238$
Net change in fund balanceFund balance - beginningFund balance - ending
CENTRAL SAVANNAH RIVER AREA REGIONAL COMMISSIONSTATEMENT OF REVENUES, EXPENDITURES, AND
AND CHANGES IN FUND BALANCE - GENERAL FUNDFOR THE FISCAL YEAR ENDED JUNE 30, 2011
OTHER FINANCING SOURCES AND USES
Total other financing sources and uses
Page 54 of 108
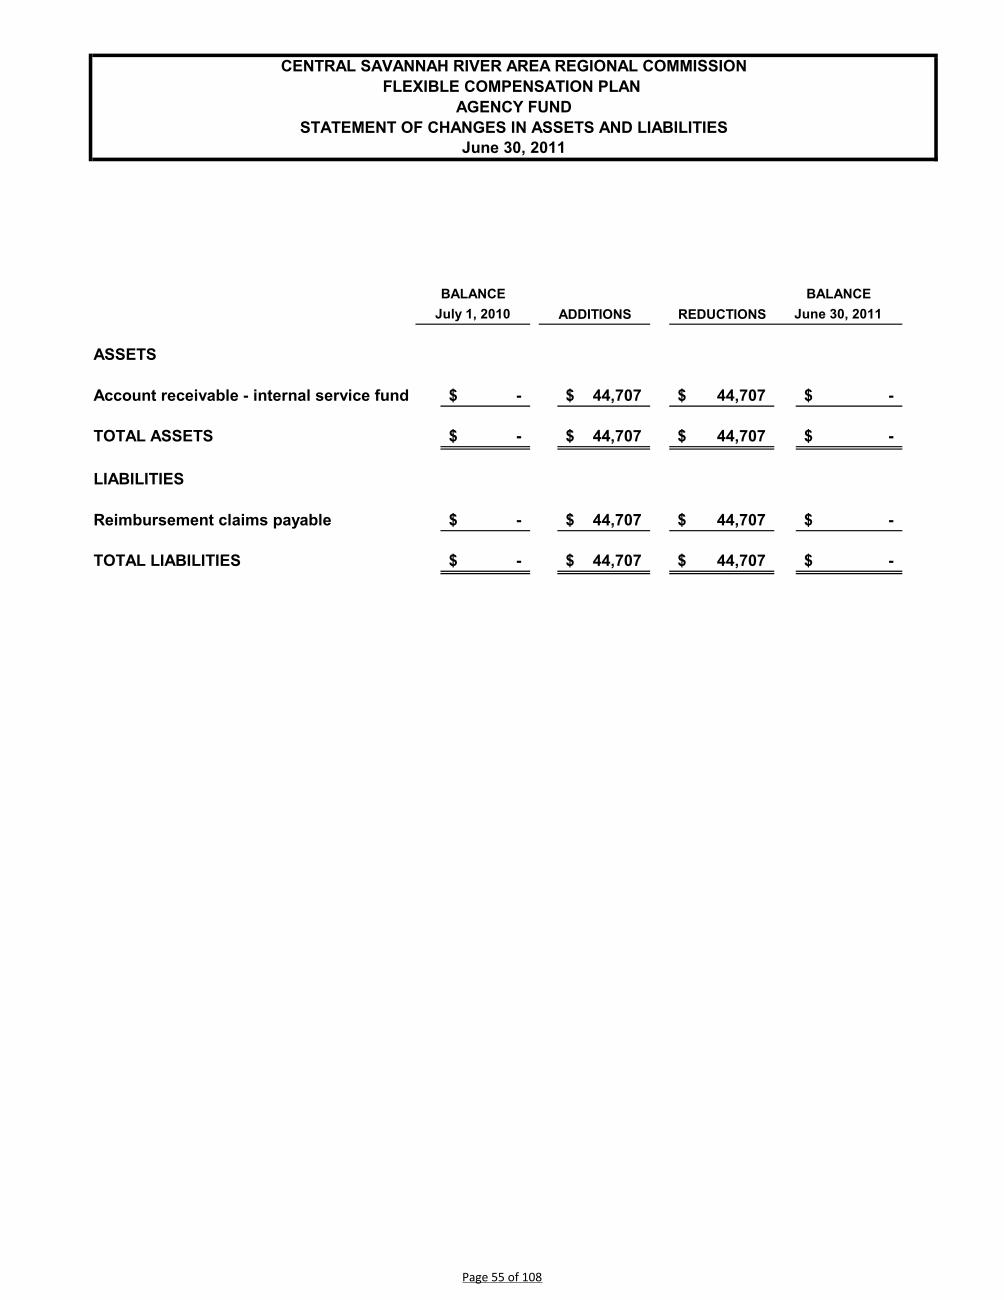
BALANCE BALANCEADDITIONS REDUCTIONS
ASSETS
Account receivable - internal service fund -$ 44,707$ 44,707$ -$
TOTAL ASSETS -$ 44,707$ 44,707$ -$
Reimbursement claims payable -$ 44,707$ 44,707$ -$
TOTAL LIABILITIES -$ 44,707$ 44,707$ -$
LIABILITIES
CENTRAL SAVANNAH RIVER AREA REGIONAL COMMISSIONFLEXIBLE COMPENSATION PLAN
AGENCY FUNDSTATEMENT OF CHANGES IN ASSETS AND LIABILITIES
June 30, 2011
July 1, 2010 June 30, 2011
Page 55 of 108

SUPPLEMENTAL SCHEDULES
Page 56 of 108
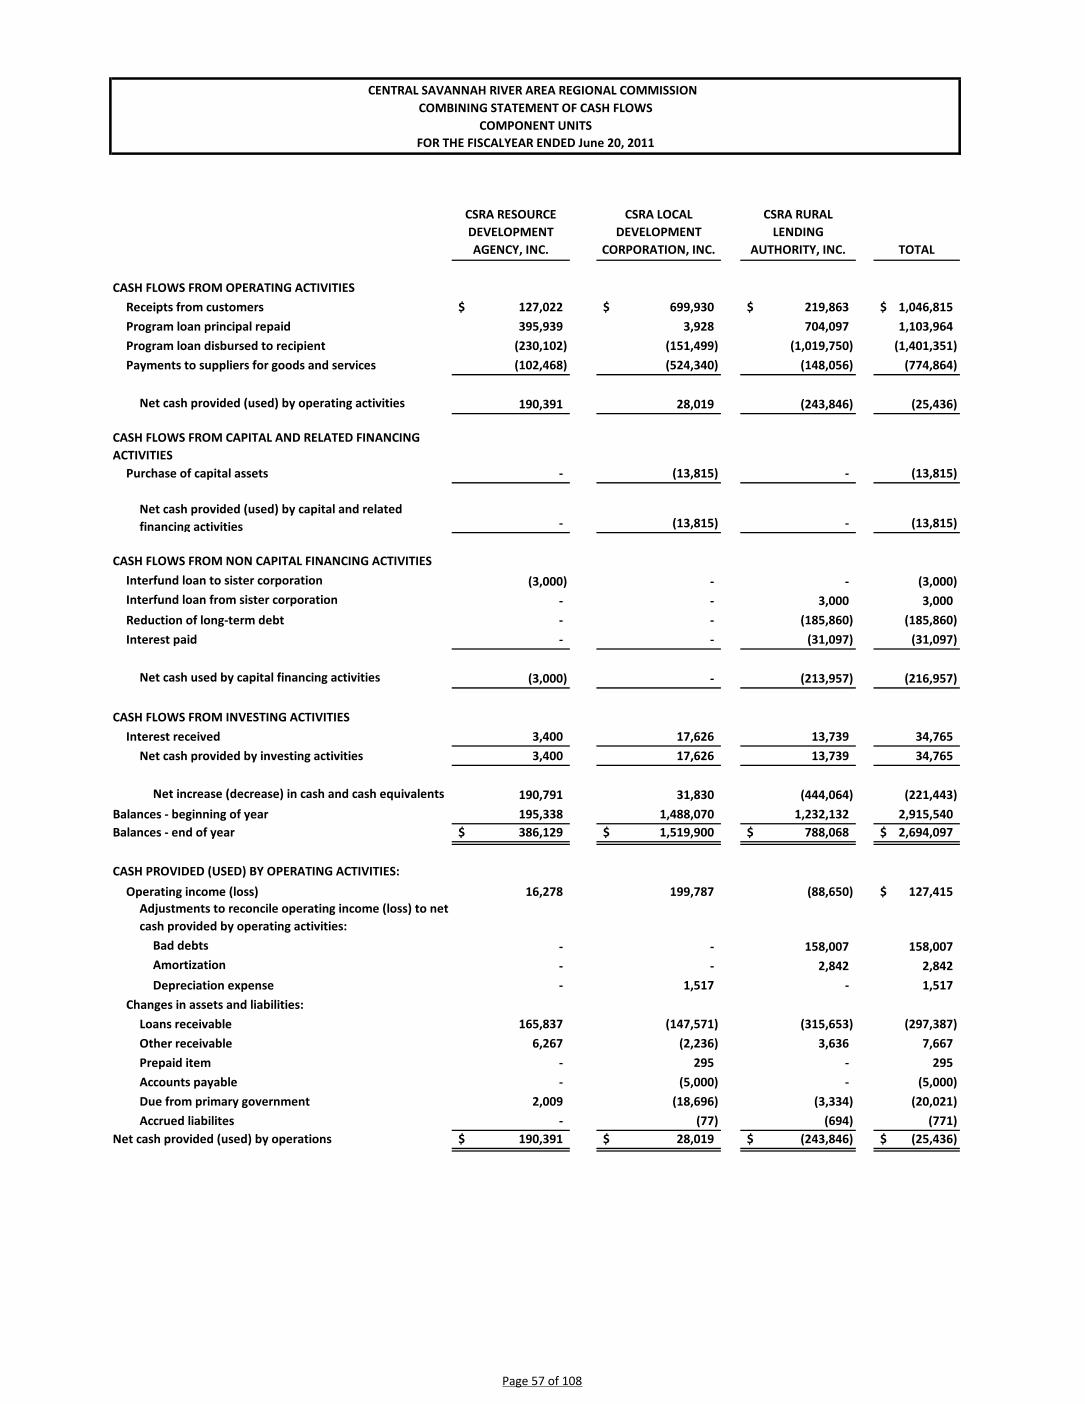
CSRA RESOURCE DEVELOPMENT AGENCY, INC.
CSRA LOCAL DEVELOPMENT
CORPORATION, INC.
CSRA RURAL LENDING
AUTHORITY, INC. TOTAL
CASH FLOWS FROM OPERATING ACTIVITIESReceipts from customers 127,022$ 699,930$ 219,863$ 1,046,815$ Program loan principal repaid 395,939 3,928 704,097 1,103,964 Program loan disbursed to recipient (230,102) (151,499) (1,019,750) (1,401,351) Payments to suppliers for goods and services (102,468) (524,340) (148,056) (774,864)
Net cash provided (used) by operating activities 190,391 28,019 (243,846) (25,436)
CASH FLOWS FROM CAPITAL AND RELATED FINANCING ACTIVITIES
Purchase of capital assets - (13,815) - (13,815)
Net cash provided (used) by capital and related financing activities - (13,815) - (13,815)
CASH FLOWS FROM NON CAPITAL FINANCING ACTIVITIESInterfund loan to sister corporation (3,000) - - (3,000) Interfund loan from sister corporation - - 3,000 3,000 Reduction of long-term debt - - (185,860) (185,860) Interest paid - - (31,097) (31,097)
Net cash used by capital financing activities (3,000) - (213,957) (216,957)
CASH FLOWS FROM INVESTING ACTIVITIESInterest received 3,400 17,626 13,739 34,765
Net cash provided by investing activities 3,400 17,626 13,739 34,765
Net increase (decrease) in cash and cash equivalents 190,791 31,830 (444,064) (221,443) Balances - beginning of year 195,338 1,488,070 1,232,132 2,915,540 Balances - end of year 386,129$ 1,519,900$ 788,068$ 2,694,097$
CASH PROVIDED (USED) BY OPERATING ACTIVITIES:
Operating income (loss) 16,278 199,787 (88,650) 127,415$ Adjustments to reconcile operating income (loss) to net cash provided by operating activities:
Bad debts - - 158,007 158,007 Amortization - - 2,842 2,842 Depreciation expense - 1,517 - 1,517
Changes in assets and liabilities:Loans receivable 165,837 (147,571) (315,653) (297,387) Other receivable 6,267 (2,236) 3,636 7,667 Prepaid item - 295 - 295 Accounts payable - (5,000) - (5,000) Due from primary government 2,009 (18,696) (3,334) (20,021) Accrued liabilites - (77) (694) (771)
Net cash provided (used) by operations 190,391$ 28,019$ (243,846)$ (25,436)$
CENTRAL SAVANNAH RIVER AREA REGIONAL COMMISSION COMBINING STATEMENT OF CASH FLOWS
COMPONENT UNITSFOR THE FISCALYEAR ENDED June 20, 2011
Page 57 of 108

CEN
TRAL
SAV
ANN
AH R
IVER
AR
EA R
EGIO
NAL
CO
MM
ISSI
ON
G
RAN
TS A
ND
CO
NTR
ACTS
FU
ND
SCH
EDU
LE O
F R
EVEN
UES
& E
XPEN
DIT
UR
ES B
Y AC
TIVI
TY -
BU
DG
ET T
O A
CTU
AL
FOR
TH
E YE
AR E
ND
ED J
UN
E 30
, 201
1(W
ith c
ompa
rativ
e to
tals
for t
he fi
scal
yea
r end
ed J
une
30, 2
010)
AGIN
G S
ERVI
CES
PLAN
NIN
G &
ZO
NIN
G S
ERVI
CES
B
UD
GET
ACTU
ALB
UD
GET
ACTU
ALB
UD
GET
ACTU
AL
REV
ENU
ESFe
dera
l & S
tate
gra
nts
/ con
trac
ts5,
883,
402
$
5,
521,
945
$
2,
116,
199
$
2,
061,
186
$
271,
589
$
243,
990
$
City
, cou
nty,
or o
ther
gra
nts
/ con
trac
ts-
-
-
-
25,0
00
17,1
05
Prog
ram
inco
me
-
21,1
25
-
-
-
360
TOTA
L R
EVEN
UES
5,88
3,40
2$
5,54
3,07
0$
2,11
6,19
9$
2,06
1,18
6$
29
6,58
9$
26
1,45
5$
EXPE
ND
ITU
RES
Pers
onal
Ser
vice
s1,
290,
790
$
1,
207,
199
$
17
,659
$
7,61
4$
170,
990
$
170,
248
$
Trav
el38
,704
40,4
56
50
0
26
3
7,
000
1,67
0
C
ontr
acts
3,93
7,01
3
3,74
7,30
6
2,04
7,20
2
2,00
0,12
4
30
,000
-
All o
ther
ope
ratin
g co
sts
74,5
62
66
,277
-
50
40
,870
25
,116
C
ost a
lloca
tion
plan
645,
999
583,
666
8,83
8
3,68
5
85,5
75
82,4
34
TOTA
L EX
PEN
DIT
UR
ES5,
987,
068
$
5,
644,
904
$
2,
074,
199
$
2,
011,
736
$
334,
435
$
279,
468
$
(103
,666
)$
(101
,834
)$
42,0
00$
49
,450
$
(37,
846)
$
(1
8,01
3)$
OTH
ER F
INAN
CIN
G S
OU
RC
ES (U
SES)
Tr
ansf
ers
in10
3,66
6$
10
1,83
4$
-
$
-
$
37
,846
$
19
,741
$
Tr
ansf
ers
out
-
-
(4
2,00
0)
(4
9,45
0)
-
(1,7
28)
TOTA
L O
THER
FIN
ANC
ING
SO
UR
CES
(USE
S)10
3,66
6$
10
1,83
4$
(4
2,00
0)$
(4
9,45
0)$
37
,846
$
18
,013
$
-$
-$
-
$
-
$
-
$
-$
Con
tinue
d on
nex
t pag
e.
EXC
ESS
(DEF
ICIT
) OF
REV
ENU
ES A
ND
OTH
ER
SOU
RC
ES O
VER
EXP
END
ITU
RES
AN
D O
THER
U
SES
REG
ION
AL T
RAN
SPO
RTA
TIO
N
SER
VIC
ES
EXC
ESS
(DEF
ICIT
) OF
REV
ENU
ES O
VER
EX
PEN
DIT
UR
ES
Page 58 of 108
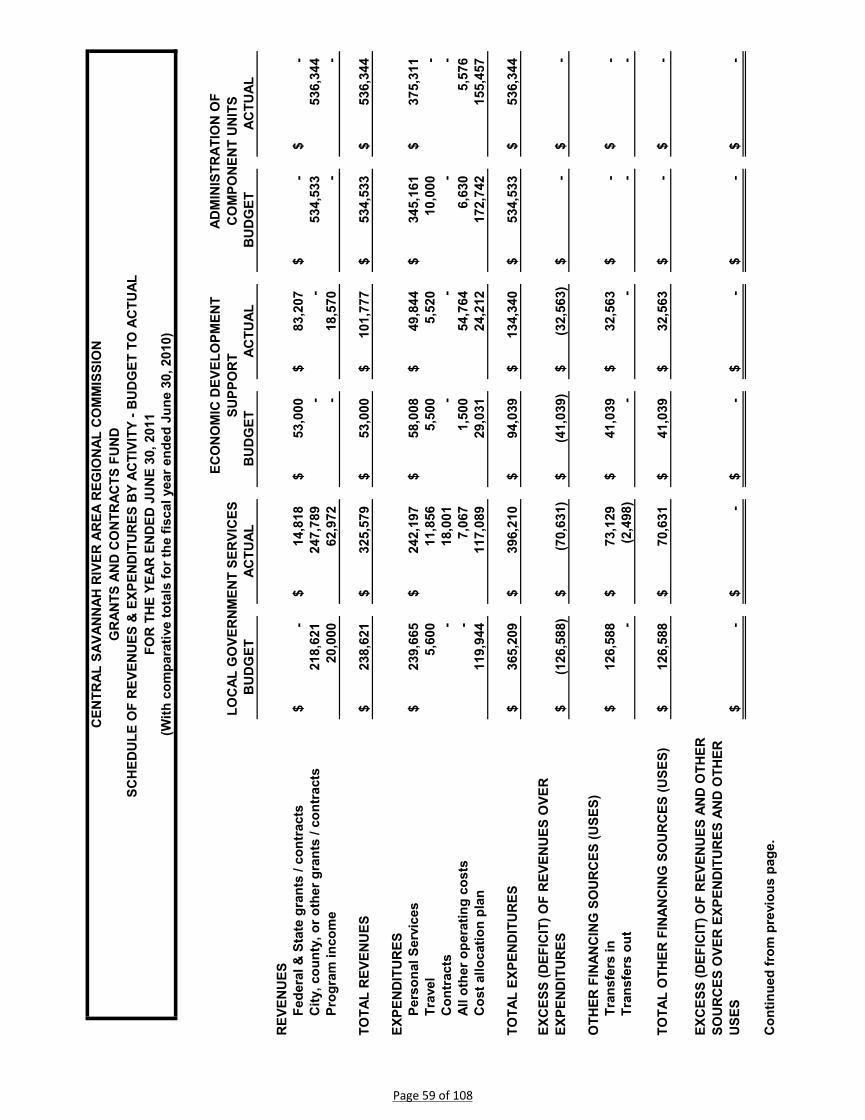
CEN
TRAL
SAV
ANN
AH R
IVER
AR
EA R
EGIO
NAL
CO
MM
ISSI
ON
G
RAN
TS A
ND
CO
NTR
ACTS
FU
ND
SCH
EDU
LE O
F R
EVEN
UES
& E
XPEN
DIT
UR
ES B
Y AC
TIVI
TY -
BU
DG
ET T
O A
CTU
AL
FOR
TH
E YE
AR E
ND
ED J
UN
E 30
, 201
1(W
ith c
ompa
rativ
e to
tals
for t
he fi
scal
yea
r end
ed J
une
30, 2
010)
LOC
AL G
OVE
RN
MEN
T SE
RVI
CES
AD
MIN
ISTR
ATIO
N O
F C
OM
PON
ENT
UN
ITS
BU
DG
ETAC
TUAL
BU
DG
ETAC
TUAL
BU
DG
ETAC
TUAL
REV
ENU
ESFe
dera
l & S
tate
gra
nts
/ con
trac
ts-
$
14,8
18$
53,0
00$
83
,207
$
-$
-
$
City
, cou
nty,
or o
ther
gra
nts
/ con
trac
ts21
8,62
1
24
7,78
9
-
-
53
4,53
3
53
6,34
4
Pr
ogra
m in
com
e20
,000
62
,972
-
18
,570
-
-
TOTA
L R
EVEN
UES
238,
621
$
325,
579
$
53,0
00$
10
1,77
7$
53
4,53
3$
53
6,34
4$
EXPE
ND
ITU
RES
Pers
onal
Ser
vice
s23
9,66
5$
24
2,19
7$
58
,008
$
49,8
44$
34
5,16
1$
37
5,31
1$
Tr
avel
5,60
0
11
,856
5,
500
5,
520
10
,000
-
Con
trac
ts-
18,0
01
-
-
-
-
All o
ther
ope
ratin
g co
sts
-
7,
067
1,50
0
54,7
64
6,
630
5,57
6
C
ost a
lloca
tion
plan
119,
944
117,
089
29,0
31
24
,212
172,
742
155,
457
TOTA
L EX
PEN
DIT
UR
ES36
5,20
9$
39
6,21
0$
94
,039
$
134,
340
$
534,
533
$
536,
344
$
(126
,588
)$
(7
0,63
1)$
(41,
039)
$
(32,
563)
$
-$
-
$
OTH
ER F
INAN
CIN
G S
OU
RC
ES (U
SES)
Tr
ansf
ers
in12
6,58
8$
73
,129
$
41
,039
$
32,5
63$
-
$
-$
Tr
ansf
ers
out
-
(2
,498
)
-
-
-
-
TOTA
L O
THER
FIN
ANC
ING
SO
UR
CES
(USE
S)12
6,58
8$
70
,631
$
41
,039
$
32,5
63$
-
$
-$
-$
-
$
-$
-$
-$
-
$
Con
tinue
d fr
om p
revi
ous
page
.
ECO
NO
MIC
DEV
ELO
PMEN
T SU
PPO
RT
EXC
ESS
(DEF
ICIT
) OF
REV
ENU
ES O
VER
EX
PEN
DIT
UR
ES
EXC
ESS
(DEF
ICIT
) OF
REV
ENU
ES A
ND
OTH
ER
SOU
RC
ES O
VER
EXP
END
ITU
RES
AN
D O
THER
U
SES
Page 59 of 108

CEN
TRAL
SAV
ANN
AH R
IVER
AR
EA R
EGIO
NAL
CO
MM
ISSI
ON
G
RAN
TS A
ND
CO
NTR
ACTS
FU
ND
SCH
EDU
LE O
F R
EVEN
UES
& E
XPEN
DIT
UR
ES B
Y AC
TIVI
TY -
BU
DG
ET T
O A
CTU
AL
FOR
TH
E YE
AR E
ND
ED J
UN
E 30
, 201
1(W
ith c
ompa
rativ
e to
tals
for t
he fi
scal
yea
r end
ed J
une
30, 2
010)
June
30,
201
1 To
tals
June
30,
201
0B
UD
GET
ACTU
ALAC
TUAL
REV
ENU
ESFe
dera
l & S
tate
gra
nts
/ con
trac
ts8,
324,
190
$
7,
925,
146
$
7,
348,
665
$
C
ity, c
ount
y, o
r oth
er g
rant
s / c
ontr
acts
778,
154
801,
238
845,
847
Prog
ram
inco
me
20,0
00
103,
027
66,3
36
TOTA
L R
EVEN
UES
9,12
2,34
4$
8,82
9,41
1$
8,26
0,84
8$
EXPE
ND
ITU
RES
Pers
onal
Ser
vice
s2,
122,
273
$
2,
052,
413
$
1,
988,
204
$
Tr
avel
67,3
04
59,7
65
36
,620
Con
trac
ts6,
014,
215
5,
765,
431
5,
297,
000
Al
l oth
er o
pera
ting
cost
s12
3,56
2
15
8,85
0
13
4,23
9
C
ost a
lloca
tion
plan
1,06
2,12
9
966,
543
974,
996
TOTA
L EX
PEN
DIT
UR
ES9,
389,
483
$
9,
003,
002
$
8,
431,
059
$
(267
,139
)$
(1
73,5
91)
$
(1
70,2
11)
$
OTH
ER F
INAN
CIN
G S
OU
RC
ES (U
SES)
Tran
sfer
s in
309,
139
$
227,
267
$
212,
858
$
Tran
sfer
s ou
t(4
2,00
0)
(5
3,67
6)
(4
2,64
7)
TOTA
L O
THER
FIN
ANC
ING
SO
UR
CES
(USE
S)26
7,13
9$
17
3,59
1$
17
0,21
1$
-$
-
$
-$
Con
tinue
d fr
om p
revi
ous
page
.
EXC
ESS
(DEF
ICIT
) OF
REV
ENU
ES A
ND
OTH
ER
SOU
RC
ES O
VER
EXP
END
ITU
RES
AN
D O
THER
USE
S
EXC
ESS
(DEF
ICIT
) OF
REV
ENU
ES O
VER
EX
PEN
DIT
UR
ES
Page 60 of 108

CENTRAL SAVANNAH RIVER AREA REGIONAL COMMISSION GEORGIA DEPT. OF HUMAN SERVICES - AREA AGENCY ON AGING
CONTRACT #'s 427000-373-0000004858, 427-93-ARRA09012-99, & 42700-373-0000007359SCHEDULE OF REVENUES AND EXPENDITURES - BUDGET AND ACTUAL
FOR THE FISCAL YEAR ENDED JUNE 30, 2011
BUDGET ACTUAL VARIANCE
REVENUESFederal & State grants / contracts 5,883,402$ 5,521,945$ (361,457)$ City, county, or other grants / contracts - - - Program income - 21,125 21,125
TOTAL REVENUES 5,883,402 5,543,070 (340,332)
EXPENDITURESPersonal Services 1,290,790 1,207,198 83,592 Travel 38,704 40,457 (1,753) Contracts 3,937,013 3,747,306 189,707 Other operating costs 74,562 66,277 8,285 Cost allocation plan 645,999 583,666 62,333
TOTAL EXPENDITURES 5,987,068 5,644,904 342,164
(103,666) (101,834) 1,832
OTHER FINANCING SOURCES (USES)Transfers in 103,666 101,834 (1,832) Transfers out - - -
TOTAL OTHER FINANCING SOURCES (USES) 103,666 101,834 (1,832)
-$ -$ -$ EXCESS (DEFICIT) OF REVENUES AND OTHER SOURCES OVER EXPENDITURES AND OTHER USES
EXCESS (DEFICIT) OF REVENUES OVER EXPENDITURES
Page 61 of 108

CENTRAL SAVANNAH RIVER AREA REGIONAL COMMISSION GEORGIA DEPT. OF HUMAN SERVICES - COORDINATED TRANSPORTATION PROGRAM
#42700-362-0000005517SCHEDULE OF REVENUES AND EXPENDITURES - BUDGET AND ACTUAL
FOR THE FISCAL YEAR ENDED JUNE 30, 2011
BUDGET ACTUAL VARIANCE
REVENUESFederal & State grants / contracts 2,116,199$ 2,061,186$ (55,013)$ City, county, or other grants / contracts - - - Program income - - -
TOTAL REVENUES 2,116,199 2,061,186 (55,013)
EXPENDITURESPersonal Services 17,659 7,614 10,045 Travel 500 263 237 Contracts 2,047,202 2,000,125 47,077 Other operating costs - 50 (50) Cost allocation plan 8,838 3,686 5,152
TOTAL EXPENDITURES 2,074,199 2,011,738 62,461
42,000 49,448 7,448
OTHER FINANCING SOURCES (USES)Transfers in - - - Transfers out (42,000) (49,448) (7,448)
TOTAL OTHER FINANCING SOURCES (USES) (42,000) (49,448) (7,448)
-$ -$ -$ EXCESS (DEFICIT) OF REVENUES AND OTHER SOURCES OVER EXPENDITURES AND OTHER USES
EXCESS (DEFICIT) OF REVENUES OVER EXPENDITURES
Page 62 of 108

CENTRAL SAVANNAH RIVER AREA REGIONAL COMMISSION U.S. DEPT. COMMERCE EDA 301(B) PLANNING GRANT
CONTRACT #'s # 04-83-06497, 04-83-06002, & # 04-69-06137SCHEDULE OF REVENUES AND EXPENDITURES - BUDGET AND ACTUAL
FOR THE FISCAL YEAR ENDED JUNE 30, 2011
BUDGET ACTUAL VARIANCE
REVENUESFederal & State grants / contracts 53,000$ 83,207$ 30,207$ City, county, or other grants / contracts - - - Program income - - -
TOTAL REVENUES 53,000 83,207 30,207
EXPENDITURESPersonal Services 58,008 49,686 8,322 Travel 5,500 5,520 (20) Contracts - - - Other operating costs 1,500 36,319 (34,819) Cost allocation plan 29,031 24,135 4,896
TOTAL EXPENDITURES 94,039 115,660 (21,621)
(41,039) (32,453) 8,586
OTHER FINANCING SOURCES (USES)Transfers in 41,039 32,453 (8,586) Transfers out - - -
TOTAL OTHER FINANCING SOURCES (USES) 41,039 32,453 (8,586)
-$ -$ -$ EXCESS (DEFICIT) OF REVENUES AND OTHER SOURCES OVER EXPENDITURES AND OTHER USES
EXCESS (DEFICIT) OF REVENUES OVER EXPENDITURES
Page 63 of 108
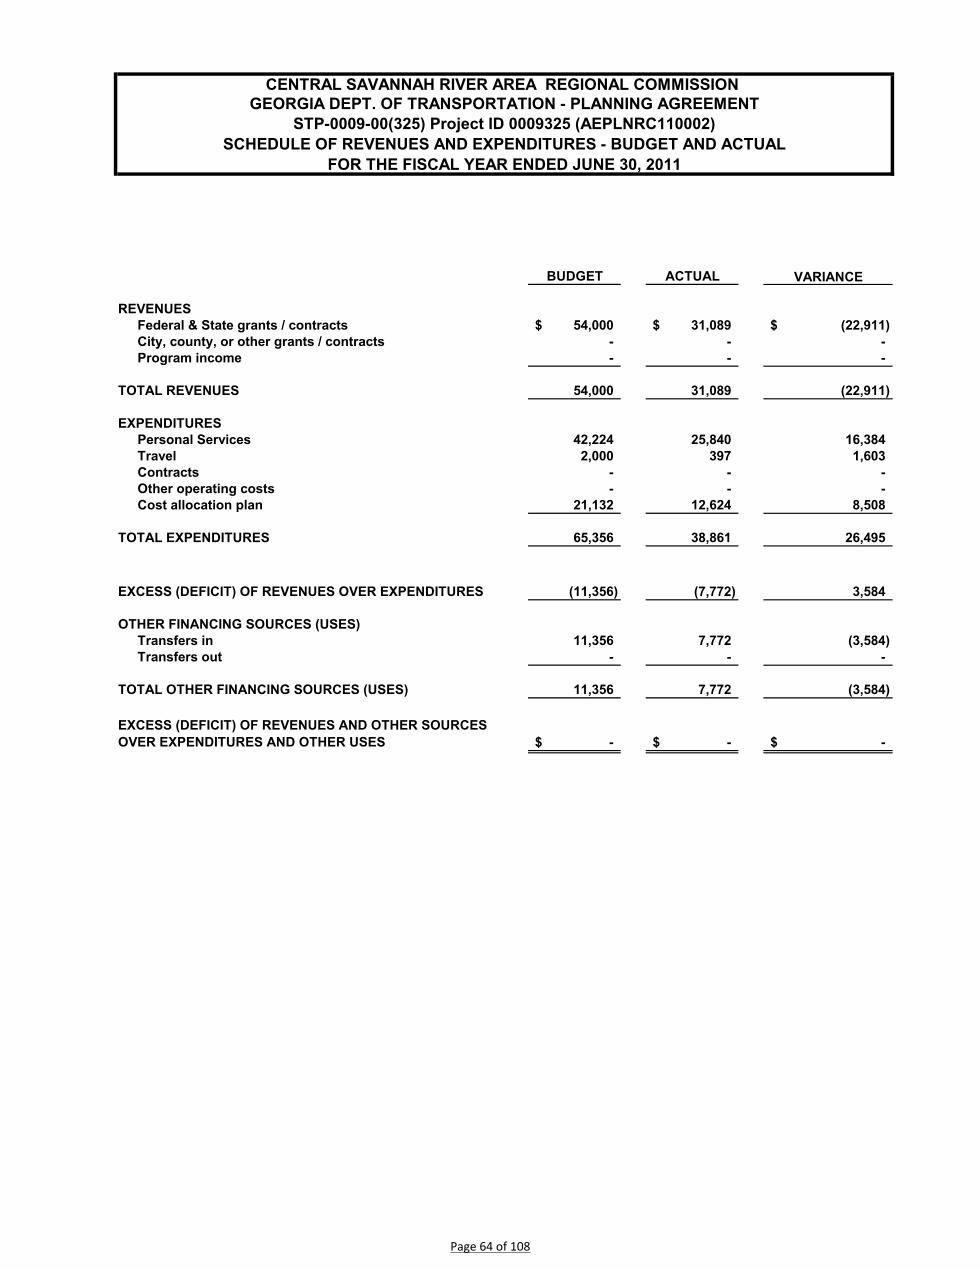
CENTRAL SAVANNAH RIVER AREA REGIONAL COMMISSION GEORGIA DEPT. OF TRANSPORTATION - PLANNING AGREEMENT
STP-0009-00(325) Project ID 0009325 (AEPLNRC110002)SCHEDULE OF REVENUES AND EXPENDITURES - BUDGET AND ACTUAL
FOR THE FISCAL YEAR ENDED JUNE 30, 2011
BUDGET ACTUAL VARIANCE
REVENUESFederal & State grants / contracts 54,000$ 31,089$ (22,911)$ City, county, or other grants / contracts - - - Program income - - -
TOTAL REVENUES 54,000 31,089 (22,911)
EXPENDITURESPersonal Services 42,224 25,840 16,384 Travel 2,000 397 1,603 Contracts - - - Other operating costs - - - Cost allocation plan 21,132 12,624 8,508
TOTAL EXPENDITURES 65,356 38,861 26,495
(11,356) (7,772) 3,584
OTHER FINANCING SOURCES (USES)Transfers in 11,356 7,772 (3,584) Transfers out - - -
TOTAL OTHER FINANCING SOURCES (USES) 11,356 7,772 (3,584)
-$ -$ -$ EXCESS (DEFICIT) OF REVENUES AND OTHER SOURCES OVER EXPENDITURES AND OTHER USES
EXCESS (DEFICIT) OF REVENUES OVER EXPENDITURES
Page 64 of 108
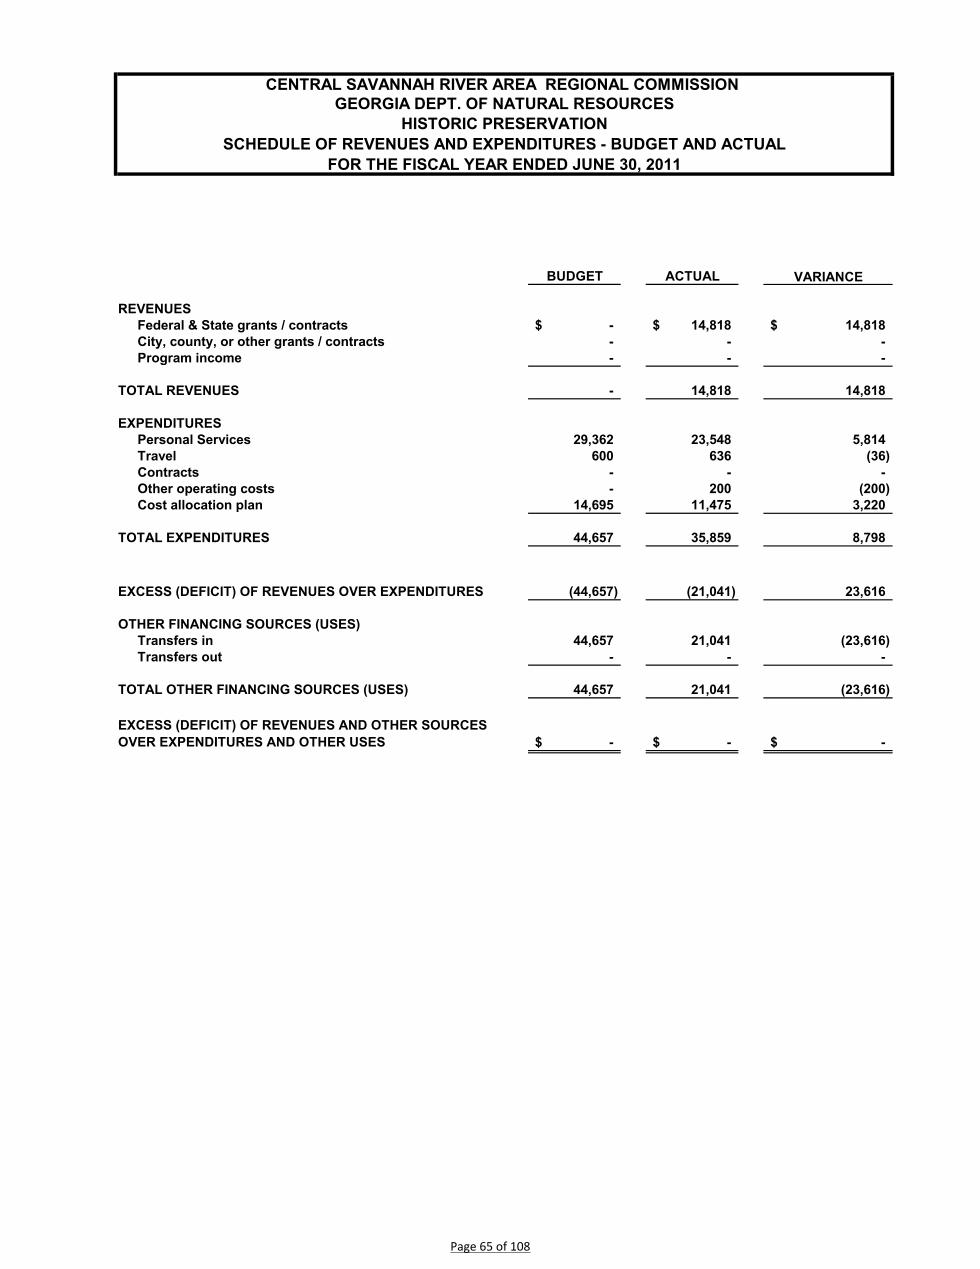
CENTRAL SAVANNAH RIVER AREA REGIONAL COMMISSION GEORGIA DEPT. OF NATURAL RESOURCES
HISTORIC PRESERVATION SCHEDULE OF REVENUES AND EXPENDITURES - BUDGET AND ACTUAL
FOR THE FISCAL YEAR ENDED JUNE 30, 2011
BUDGET ACTUAL VARIANCE
REVENUESFederal & State grants / contracts -$ 14,818$ 14,818$ City, county, or other grants / contracts - - - Program income - - -
TOTAL REVENUES - 14,818 14,818
EXPENDITURESPersonal Services 29,362 23,548 5,814 Travel 600 636 (36) Contracts - - - Other operating costs - 200 (200) Cost allocation plan 14,695 11,475 3,220
TOTAL EXPENDITURES 44,657 35,859 8,798
(44,657) (21,041) 23,616
OTHER FINANCING SOURCES (USES)Transfers in 44,657 21,041 (23,616) Transfers out - - -
TOTAL OTHER FINANCING SOURCES (USES) 44,657 21,041 (23,616)
-$ -$ -$ EXCESS (DEFICIT) OF REVENUES AND OTHER SOURCES OVER EXPENDITURES AND OTHER USES
EXCESS (DEFICIT) OF REVENUES OVER EXPENDITURES
Page 65 of 108

CENTRAL SAVANNAH RIVER AREA REGIONAL COMMISSION GEORGIA DEPT. OF NATURAL RESOURCES - ENVIRONMENTAL PROTECTION DIVISION
WATERSHED IMPROVEMENT PLANS (BRIER & HEADSTALL CREEKS) ANDINDENTIFICATION OF WATER MANAGEMENT PRACTICES
SCHEDULE OF REVENUES AND EXPENDITURES - BUDGET AND ACTUALFOR THE FISCAL YEAR ENDED JUNE 30, 2011
BUDGET ACTUAL VARIANCE
REVENUESFederal & State grants / contracts 12,500$ 16,508$ 4,008$ City, county, or other grants / contracts - - - Program income - - -
TOTAL REVENUES 12,500 16,508 4,008
EXPENDITURESPersonal Services 8,445 14,984 (6,539) Travel - 99 (99) Contracts - - - Other operating costs - 169 (169) Cost allocation plan 4,226 7,142 (2,916)
TOTAL EXPENDITURES 12,671 22,394 (9,723)
(171) (5,886) (5,715)
OTHER FINANCING SOURCES (USES)Transfers in 171 7,614 7,443 Transfers out - (1,728) (1,728)
TOTAL OTHER FINANCING SOURCES (USES) 171 5,886 5,715
-$ -$ -$ EXCESS (DEFICIT) OF REVENUES AND OTHER SOURCES OVER EXPENDITURES AND OTHER USES
EXCESS (DEFICIT) OF REVENUES OVER EXPENDITURES
Page 66 of 108
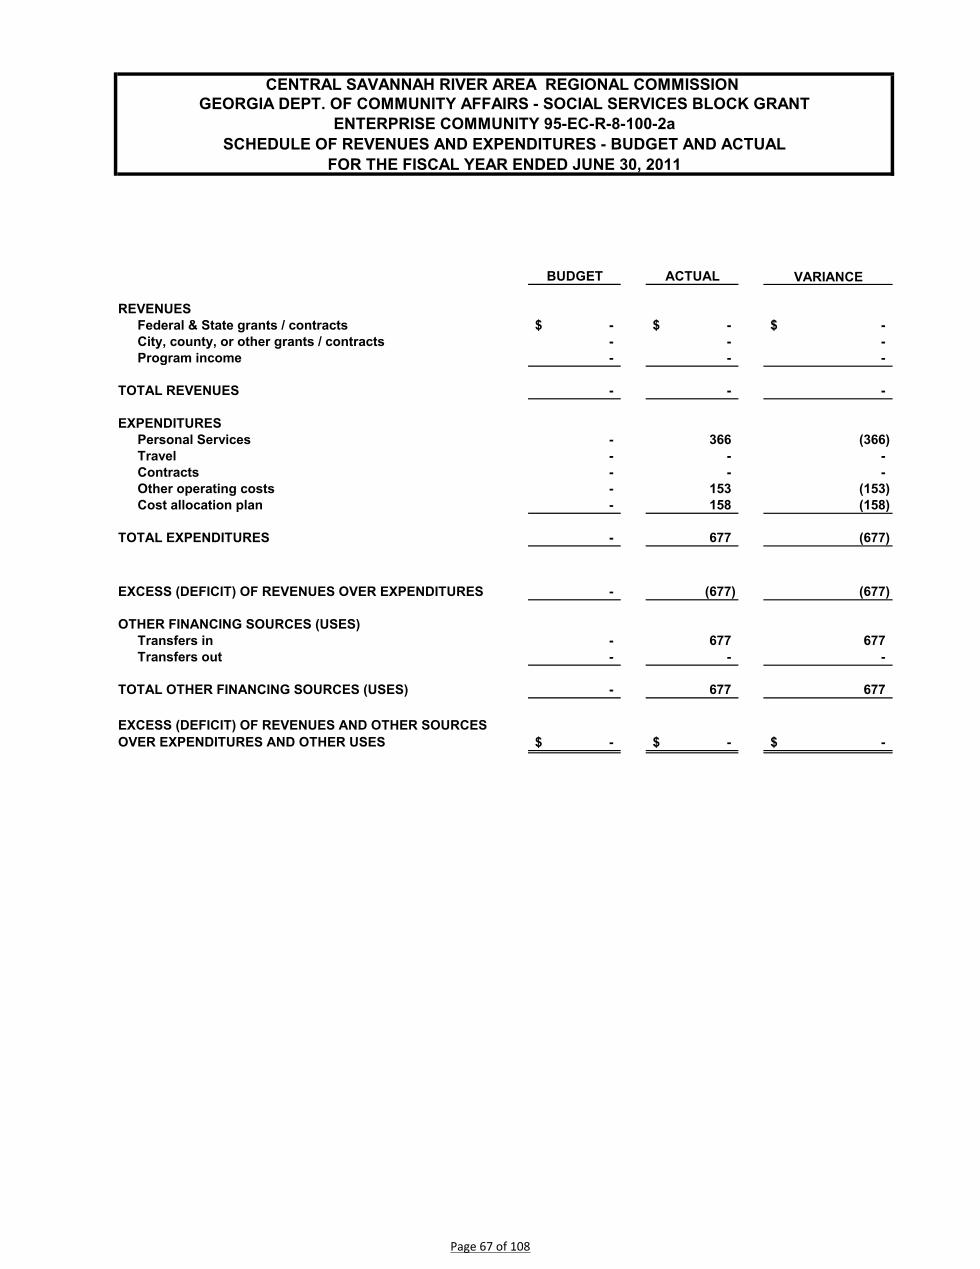
CENTRAL SAVANNAH RIVER AREA REGIONAL COMMISSION GEORGIA DEPT. OF COMMUNITY AFFAIRS - SOCIAL SERVICES BLOCK GRANT
ENTERPRISE COMMUNITY 95-EC-R-8-100-2aSCHEDULE OF REVENUES AND EXPENDITURES - BUDGET AND ACTUAL
FOR THE FISCAL YEAR ENDED JUNE 30, 2011
BUDGET ACTUAL VARIANCE
REVENUESFederal & State grants / contracts -$ -$ -$ City, county, or other grants / contracts - - - Program income - - -
TOTAL REVENUES - - -
EXPENDITURESPersonal Services - 366 (366) Travel - - - Contracts - - - Other operating costs - 153 (153) Cost allocation plan - 158 (158)
TOTAL EXPENDITURES - 677 (677)
- (677) (677)
OTHER FINANCING SOURCES (USES)Transfers in - 677 677 Transfers out - - -
TOTAL OTHER FINANCING SOURCES (USES) - 677 677
-$ -$ -$ EXCESS (DEFICIT) OF REVENUES AND OTHER SOURCES OVER EXPENDITURES AND OTHER USES
EXCESS (DEFICIT) OF REVENUES OVER EXPENDITURES
Page 67 of 108

CENTRAL SAVANNAH RIVER AREA REGIONAL COMMISSION GEORGIA DEPT. OF COMMUNITY AFFAIRS
FY 2011 SUPPORT CONTRACTSCHEDULE OF REVENUES AND EXPENDITURES - BUDGET AND ACTUAL
FOR THE FISCAL YEAR ENDED JUNE 30, 2011
BUDGET ACTUAL VARIANCE
REVENUESFederal & State grants / contracts 205,089$ 196,393$ (8,696)$ City, county, or other grants / contracts 25,000 17,105 (7,895) Program income - 360 360
TOTAL REVENUES 230,089 213,858 (16,231)
EXPENDITURESPersonal Services 120,321 129,424 (9,103) Travel 5,000 1,173 3,827 Contracts 30,000 - 30,000 Other operating costs 40,870 24,948 15,922 Cost allocation plan 60,217 62,669 (2,452)
TOTAL EXPENDITURES 256,408 218,214 38,194
(26,319) (4,356) 21,963
OTHER FINANCING SOURCES (USES)Transfers in 26,319 4,356 (21,963) Transfers out - - -
TOTAL OTHER FINANCING SOURCES (USES) 26,319 4,356 (21,963)
-$ -$ -$ EXCESS (DEFICIT) OF REVENUES AND OTHER SOURCES OVER EXPENDITURES AND OTHER USES
EXCESS (DEFICIT) OF REVENUES OVER EXPENDITURES
Page 68 of 108

CENTRAL SAVANNAH RIVER AREA REGIONAL COMMISSION PREPARATION OF COMMUNITY DEVELOPMENT BLOCK APPLICATIONS FOR MEMBERS
SCHEDULE OF REVENUES AND EXPENDITURES - BUDGET AND ACTUALFOR THE FISCAL YEAR ENDED JUNE 30, 2011
BUDGET ACTUAL VARIANCE
REVENUESFederal & State grants / contracts -$ -$ -$ City, county, or other grants / contracts - - - Program income 20,000 23,500 3,500
TOTAL REVENUES 20,000 23,500 3,500
EXPENDITURESPersonal Services 17,531 17,609 (78) Travel - 682 (682) Contracts - - - Other operating costs - 267 (267) Cost allocation plan 8,773 8,494 279
TOTAL EXPENDITURES 26,304 27,052 (748)
(6,304) (3,552) 2,752
OTHER FINANCING SOURCES (USES)Transfers in 6,304 3,552 (2,752) Transfers out - - -
TOTAL OTHER FINANCING SOURCES (USES) 6,304 3,552 (2,752)
-$ -$ -$ EXCESS (DEFICIT) OF REVENUES AND OTHER SOURCES OVER EXPENDITURES AND OTHER USES
EXCESS (DEFICIT) OF REVENUES OVER EXPENDITURES
Page 69 of 108
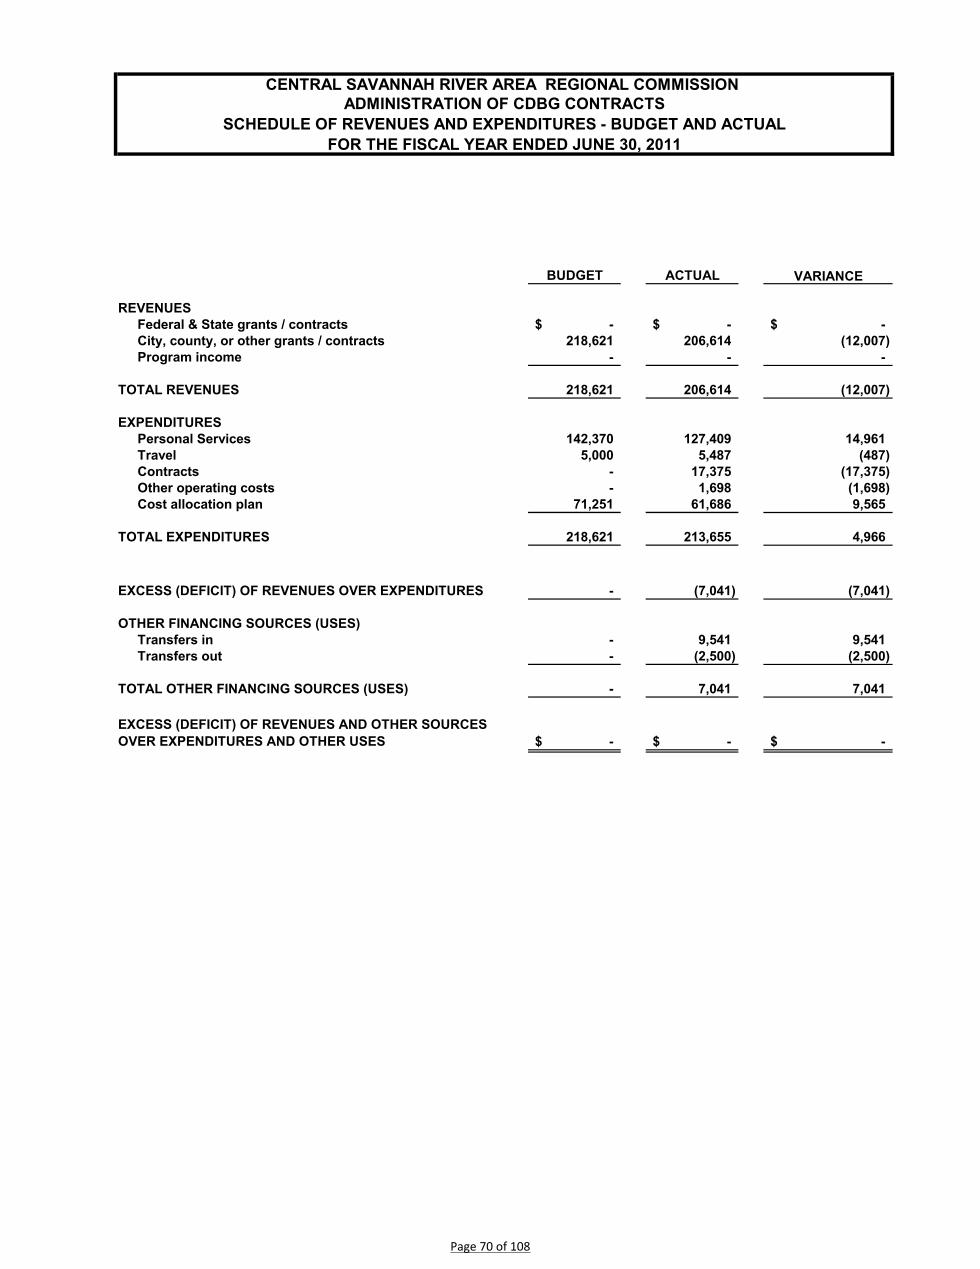
CENTRAL SAVANNAH RIVER AREA REGIONAL COMMISSION ADMINISTRATION OF CDBG CONTRACTS
SCHEDULE OF REVENUES AND EXPENDITURES - BUDGET AND ACTUALFOR THE FISCAL YEAR ENDED JUNE 30, 2011
BUDGET ACTUAL VARIANCE
REVENUESFederal & State grants / contracts -$ -$ -$ City, county, or other grants / contracts 218,621 206,614 (12,007) Program income - - -
TOTAL REVENUES 218,621 206,614 (12,007)
EXPENDITURESPersonal Services 142,370 127,409 14,961 Travel 5,000 5,487 (487) Contracts - 17,375 (17,375) Other operating costs - 1,698 (1,698) Cost allocation plan 71,251 61,686 9,565
TOTAL EXPENDITURES 218,621 213,655 4,966
- (7,041) (7,041)
OTHER FINANCING SOURCES (USES)Transfers in - 9,541 9,541 Transfers out - (2,500) (2,500)
TOTAL OTHER FINANCING SOURCES (USES) - 7,041 7,041
-$ -$ -$ EXCESS (DEFICIT) OF REVENUES AND OTHER SOURCES OVER EXPENDITURES AND OTHER USES
EXCESS (DEFICIT) OF REVENUES OVER EXPENDITURES
Page 70 of 108

CENTRAL SAVANNAH RIVER AREA REGIONAL COMMISSION ADMINISTRATION OF TRANSPORTATION ENHANCEMENT GRANTS
SCHEDULE OF REVENUES AND EXPENDITURES - BUDGET AND ACTUALFOR THE FISCAL YEAR ENDED JUNE 30, 2011
BUDGET ACTUAL VARIANCE
REVENUESFederal & State grants / contracts -$ -$ -$ City, county, or other grants / contracts - 29,761 29,761 Program income - - -
TOTAL REVENUES - 29,761 29,761
EXPENDITURESPersonal Services - 19,619 (19,619) Travel - 731 (731) Contracts - - - Other operating costs - 12 (12) Cost allocation plan - 9,408 (9,408)
TOTAL EXPENDITURES - 29,770 (29,770)
- (9) (9)
OTHER FINANCING SOURCES (USES)Transfers in - 9 9 Transfers out - - -
TOTAL OTHER FINANCING SOURCES (USES) - 9 9
-$ -$ -$ EXCESS (DEFICIT) OF REVENUES AND OTHER SOURCES OVER EXPENDITURES AND OTHER USES
EXCESS (DEFICIT) OF REVENUES OVER EXPENDITURES
Page 71 of 108

CENTRAL SAVANNAH RIVER AREA REGIONAL COMMISSION PREPARATION OF HAZARD MITIGATION PLANS
SCHEDULE OF REVENUES AND EXPENDITURES - BUDGET AND ACTUALFOR THE FISCAL YEAR ENDED JUNE 30, 2011
BUDGET ACTUAL VARIANCE
REVENUESFederal & State grants / contracts -$ -$ -$ City, county, or other grants / contracts - 11,414 11,414 Program income - - -
TOTAL REVENUES - 11,414 11,414
EXPENDITURESPersonal Services - 6,467 (6,467) Travel - 65 (65) Contracts - - - Other operating costs - 3,295 (3,295) Cost allocation plan - 3,078 (3,078)
TOTAL EXPENDITURES - 12,905 (12,905)
- (1,491) (1,491)
OTHER FINANCING SOURCES (USES)Transfers in - 1,491 1,491 Transfers out - - -
TOTAL OTHER FINANCING SOURCES (USES) - 1,491 1,491
-$ -$ -$ EXCESS (DEFICIT) OF REVENUES AND OTHER SOURCES OVER EXPENDITURES AND OTHER USES
EXCESS (DEFICIT) OF REVENUES OVER EXPENDITURES
Page 72 of 108

CENTRAL SAVANNAH RIVER AREA REGIONAL COMMISSION ADMINISTRATION OF BROWN FIELD GRANTS
SCHEDULE OF REVENUES AND EXPENDITURES - BUDGET AND ACTUALFOR THE FISCAL YEAR ENDED JUNE 30, 2011
BUDGET ACTUAL VARIANCE
REVENUESFederal & State grants / contracts -$ -$ -$ City, county, or other grants / contracts - - - Program income - 6,722 6,722
TOTAL REVENUES - 6,722 6,722
EXPENDITURESPersonal Services - 3,179 (3,179) Travel - 1,994 (1,994) Contracts - - - Other operating costs - 5 - Cost allocation plan - 1,544 (1,544)
TOTAL EXPENDITURES - 6,722 (6,722)
- - -
OTHER FINANCING SOURCES (USES)Transfers in - - - Transfers out - - -
TOTAL OTHER FINANCING SOURCES (USES) - - -
-$ -$ -$
EXCESS (DEFICIT) OF REVENUES OVER EXPENDITURES
EXCESS (DEFICIT) OF REVENUES AND OTHER SOURCES OVER EXPENDITURES AND OTHER USES
Page 73 of 108
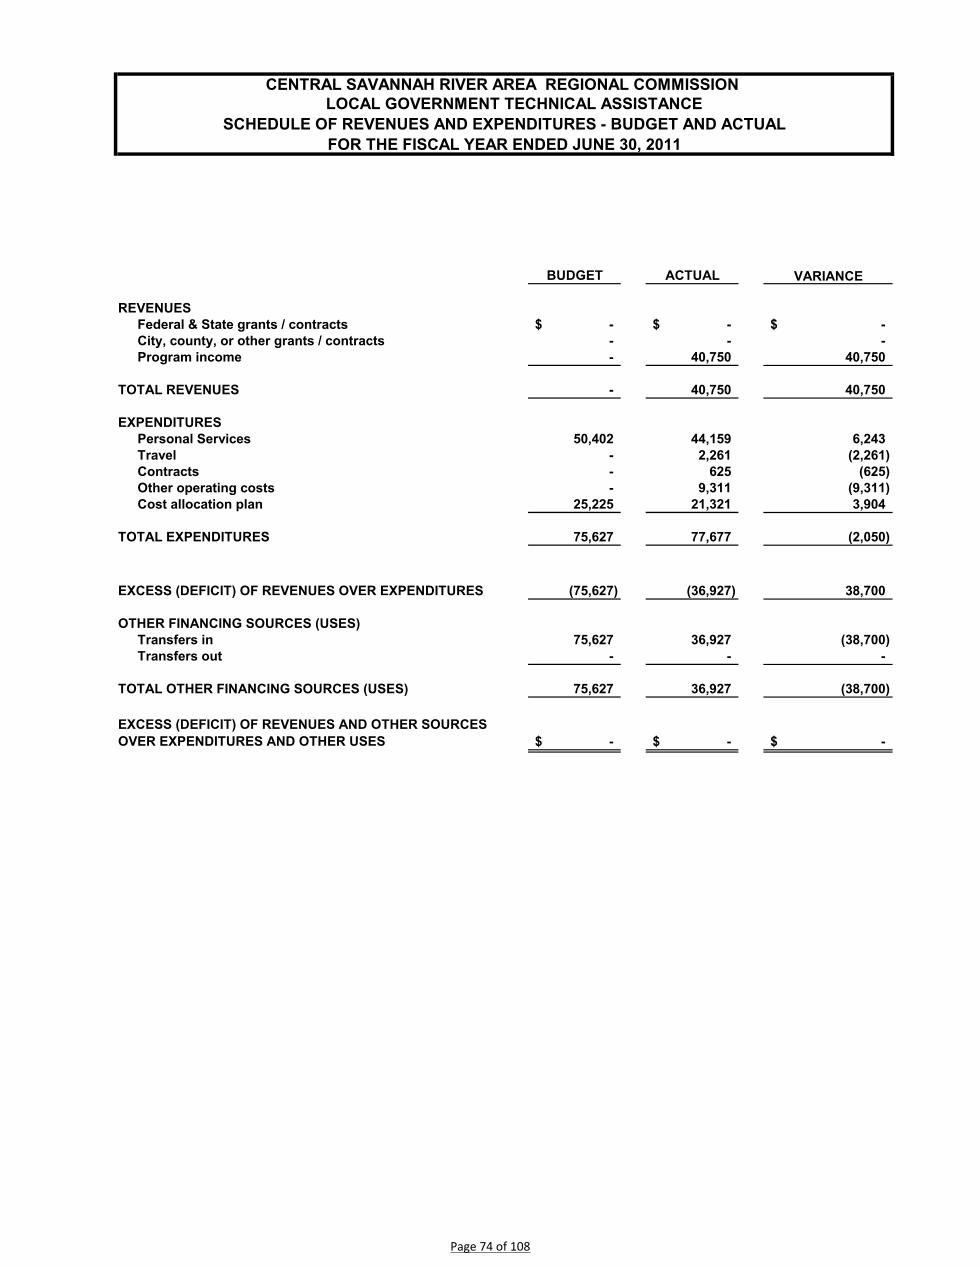
CENTRAL SAVANNAH RIVER AREA REGIONAL COMMISSION LOCAL GOVERNMENT TECHNICAL ASSISTANCE
SCHEDULE OF REVENUES AND EXPENDITURES - BUDGET AND ACTUALFOR THE FISCAL YEAR ENDED JUNE 30, 2011
BUDGET ACTUAL VARIANCE
REVENUESFederal & State grants / contracts -$ -$ -$ City, county, or other grants / contracts - - - Program income - 40,750 40,750
TOTAL REVENUES - 40,750 40,750
EXPENDITURESPersonal Services 50,402 44,159 6,243 Travel - 2,261 (2,261) Contracts - 625 (625) Other operating costs - 9,311 (9,311) Cost allocation plan 25,225 21,321 3,904
TOTAL EXPENDITURES 75,627 77,677 (2,050)
(75,627) (36,927) 38,700
OTHER FINANCING SOURCES (USES)Transfers in 75,627 36,927 (38,700) Transfers out - - -
TOTAL OTHER FINANCING SOURCES (USES) 75,627 36,927 (38,700)
-$ -$ -$ EXCESS (DEFICIT) OF REVENUES AND OTHER SOURCES OVER EXPENDITURES AND OTHER USES
EXCESS (DEFICIT) OF REVENUES OVER EXPENDITURES
Page 74 of 108

CENTRAL SAVANNAH RIVER AREA REGIONAL COMMISSION ADMINISTRATION OF UNIFIED DEVELOPMENT COUNCIL
SCHEDULE OF REVENUES AND EXPENDITURES - BUDGET AND ACTUALFOR THE FISCAL YEAR ENDED JUNE 30, 2011
BUDGET ACTUAL VARIANCE
REVENUESFederal & State grants / contracts -$ -$ -$ City, county, or other grants / contracts - - - Program income - 10,570 10,570
TOTAL REVENUES - 10,570 10,570
EXPENDITURESPersonal Services - - - Travel - - - Contracts - - - Other operating costs - 10,570 (10,570) Cost allocation plan - - -
TOTAL EXPENDITURES - 10,570 (10,570)
- - -
OTHER FINANCING SOURCES (USES)Transfers in - - - Transfers out - - -
TOTAL OTHER FINANCING SOURCES (USES) - - -
-$ -$ -$
EXCESS (DEFICIT) OF REVENUES OVER EXPENDITURES
EXCESS (DEFICIT) OF REVENUES AND OTHER SOURCES OVER EXPENDITURES AND OTHER USES
Page 75 of 108
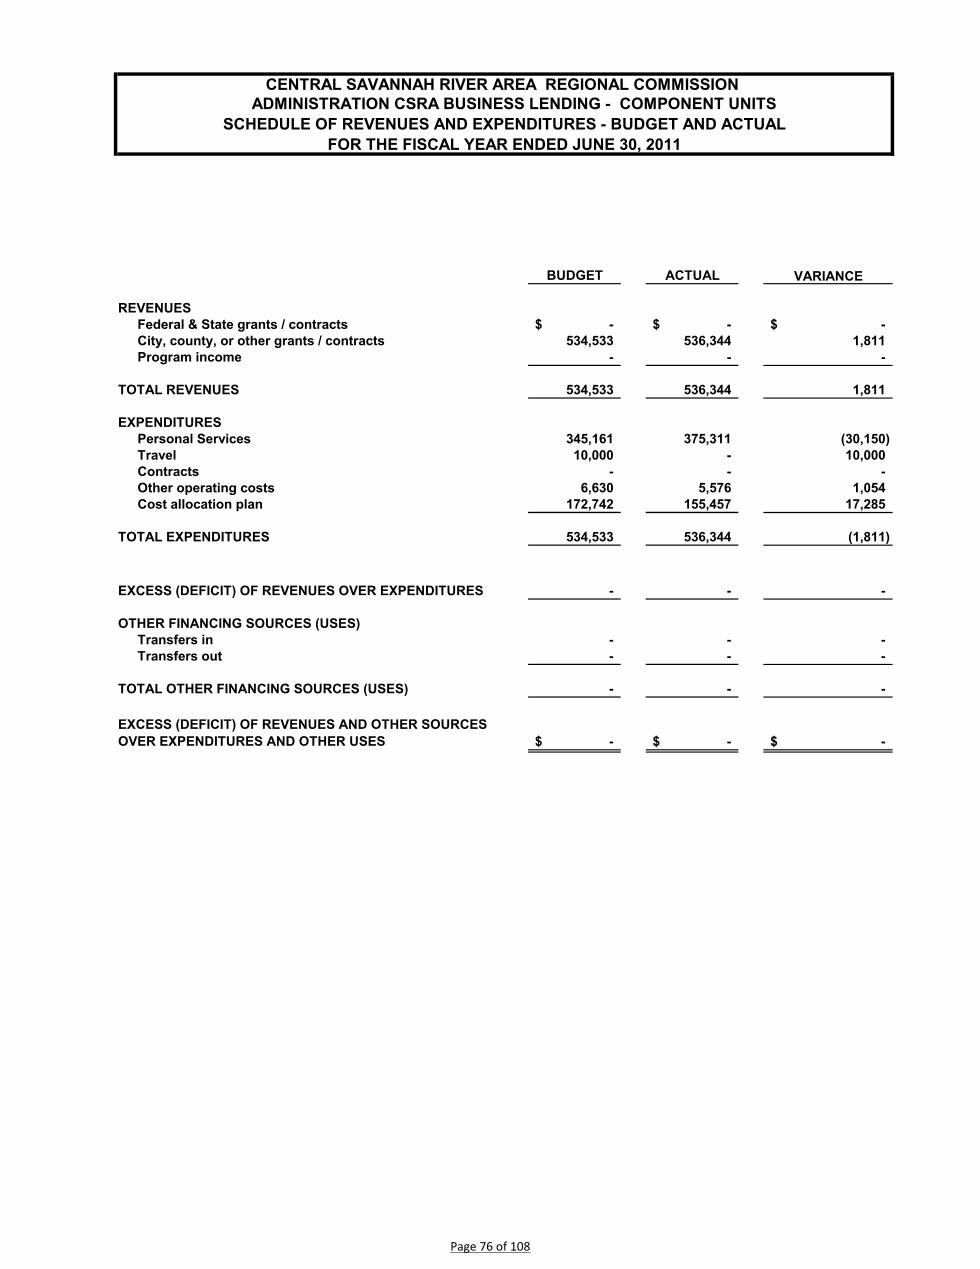
CENTRAL SAVANNAH RIVER AREA REGIONAL COMMISSION ADMINISTRATION CSRA BUSINESS LENDING - COMPONENT UNITS
SCHEDULE OF REVENUES AND EXPENDITURES - BUDGET AND ACTUALFOR THE FISCAL YEAR ENDED JUNE 30, 2011
BUDGET ACTUAL VARIANCE
REVENUESFederal & State grants / contracts -$ -$ -$ City, county, or other grants / contracts 534,533 536,344 1,811 Program income - - -
TOTAL REVENUES 534,533 536,344 1,811
EXPENDITURESPersonal Services 345,161 375,311 (30,150) Travel 10,000 - 10,000 Contracts - - - Other operating costs 6,630 5,576 1,054 Cost allocation plan 172,742 155,457 17,285
TOTAL EXPENDITURES 534,533 536,344 (1,811)
- - -
OTHER FINANCING SOURCES (USES)Transfers in - - - Transfers out - - -
TOTAL OTHER FINANCING SOURCES (USES) - - -
-$ -$ -$ EXCESS (DEFICIT) OF REVENUES AND OTHER SOURCES OVER EXPENDITURES AND OTHER USES
EXCESS (DEFICIT) OF REVENUES OVER EXPENDITURES
Page 76 of 108

BUDGET ACTUAL VARIANCE
Salaries 407,095$ 411,144$ (4,049)$ Fringe benefits 201,675 191,344 10,331 Travel 3,000 659 2,341 Supplies 46,997 37,631 9,366 Equipment (not capitalized) 25,000 7,372 17,628 Professional fees 60,000 43,876 16,124 Telecommunications 15,000 18,034 (3,034)
19,000 15,915 3,085 Utilities 27,500 22,093 5,407 Insurance 24,293 20,278 4,015 Dues, subscriptions, & publications 17,675 18,506 (831) Rentals - other than real estate 36,100 32,439 3,661 Rentals - real estate 119,131 118,028 1,103 Motor vehicle expense 10,000 9,386 614 Postage and freight 15,000 10,619 4,381 Temporary personnel services 1,500 - 1,500 Conferences and seminars 3,000 - 3,000 Depreciation 30,163 30,502 (339)
Total 1,062,129 987,826 74,303
1,772 - Less: cost not included in cost allocations - - Less: program income (net credits) - (6,598) 6,598
Total Indirect Cost Allocated 1,062,129$ 983,000$ 80,901$
COMPUTATION OF INDIRECT COST RATES
Allocation base = direct personnel costs 2,122,256$ 2,086,493$ 35,763$
Indirect Cost Rate 50.05% 47.11% (2.94%)
CENTRAL SAVANNAH RIVER AREA REGIONAL COMMISSION SCHEDULE OF INDIRECT COST - BUDGET AND ACTUAL
FOR THE FISCAL YEAR ENDED JUNE 30, 2011
Maintenance & upkeep - equip. & bldng
Add: excess costs allocated due to year end adjustments
Page 77 of 108

BUDGET ACTUAL VARIANCE
FRINGE BENEFITSContributions to pension trust 358,225$ 349,079$ 9,146$ Payroll taxes 33,689 35,693 (2,004) Group insurance 176,533 145,381 31,152 Workers compensation 7,519 5,541 1,978 Other 72,469 33,507 38,962 Paid time off earned 184,554 199,009 (14,455) Sick leave used - 1,129 (1,129) Holiday leave used 71,741 73,921 (2,180) Other leave used - 2,872 (2,872)
TOTAL FRINGE BENEFITS 904,730$ 846,132$ 58,598$
COMPUTATION OF EMPLOYEE BENEFIT RATE
Allocation base - salaries as adjusted 1,826,926$ 1,842,849$ $ (15,923)$
Fringe Benefit Rate 49.52% 45.91% (3.61%)
CENTRAL SAVANNAH RIVER AREA REGIONAL COMMISSION SCHEDULE OF FRINGE BENEFITS - BUDGET AND ACTUAL
FOR THE FISCAL YEAR ENDED JUNE 30, 2011
Page 78 of 108
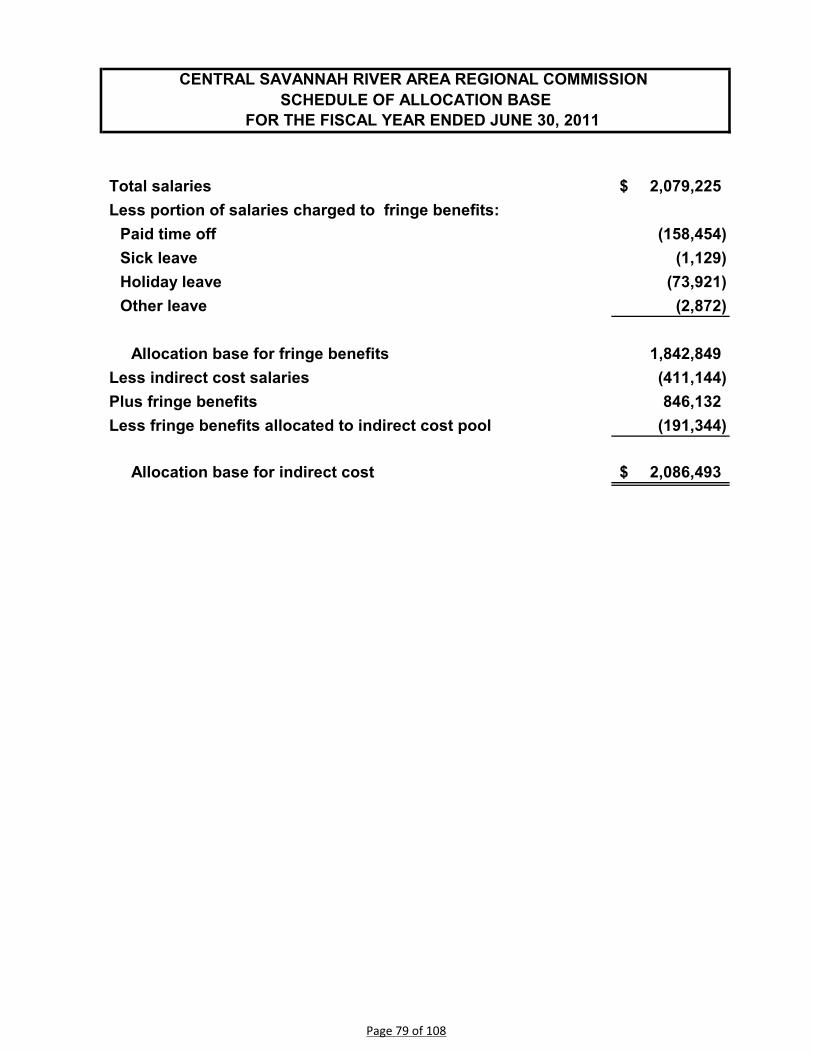
Total salaries 2,079,225$ Less portion of salaries charged to fringe benefits:
Paid time off (158,454) Sick leave (1,129) Holiday leave (73,921) Other leave (2,872)
Allocation base for fringe benefits 1,842,849 Less indirect cost salaries (411,144) Plus fringe benefits 846,132 Less fringe benefits allocated to indirect cost pool (191,344)
Allocation base for indirect cost 2,086,493$
CENTRAL SAVANNAH RIVER AREA REGIONAL COMMISSION SCHEDULE OF ALLOCATION BASE
FOR THE FISCAL YEAR ENDED JUNE 30, 2011
Page 79 of 108

FY 2011 FY 2011BAL DUE ASSESSMENTS COLLECTIONS BAL DUE
06/30/2010 BILLED ADJUSTMENT 06/30/2011
CENTRAL SAVANNAH RIVER AREA REGIONAL COMMISSION SCHEDULE OF CITY/COUNTY ASSESSMENTSFOR THE FISCAL YEAR ENDED JUNE 30, 2011
GOVERNMENT
Augusta City of (2,088)$ 192,142$ 192,700$ (2,646)$ Avera City of - 202 202 - Bartow City of - 281 281 - Blythe City of - 807 1,614 (807) Camak City of - 151 151 - Crawfordville City of - 522 522 - Davisboro City of - 1,768 1,768 - Dearing City of - 442 442 - Deepstep City of - 129 129 - Edge Hill City of - 33 - 33 Gibson City of - 754 754 - Girard City of - 226 - 226 Grovetown City of - 8,744 8,744 - Harlem City of - 1,899 1,899 - Harrison City of - 482 482 - Hephzibah City of - 4,434 4,434 - Keysville City of - 241 241 - Lincolnton City of - 1,509 1,509 - Louisville City of - 2,641 2,641 - Midville City of - 457 457 - Millen City of - 3,472 3,472 - Mitchell City of - 191 191 - Norwood City of - 286 286 - Oconee City of - 289 289 - Rayle City of - 133 133 - Riddlevile City of - 122 122 - Sandersville City of - 6,173 6,173 - Sardis City of - 1,188 1,188 - Sharon City of - 96 - 96 Sparta City of - 1,312 1,312 - Stapleton City of - 308 308 - Tennille City of - 1,461 1,461 - Thomson City of - 6,793 6,793 - Tignall City of - 628 628 - Vidette City of - 112 - 112 Wadley City of - 1,944 1,944 - Warrenton City of - 1,955 1,955 -
Page 80 of 108
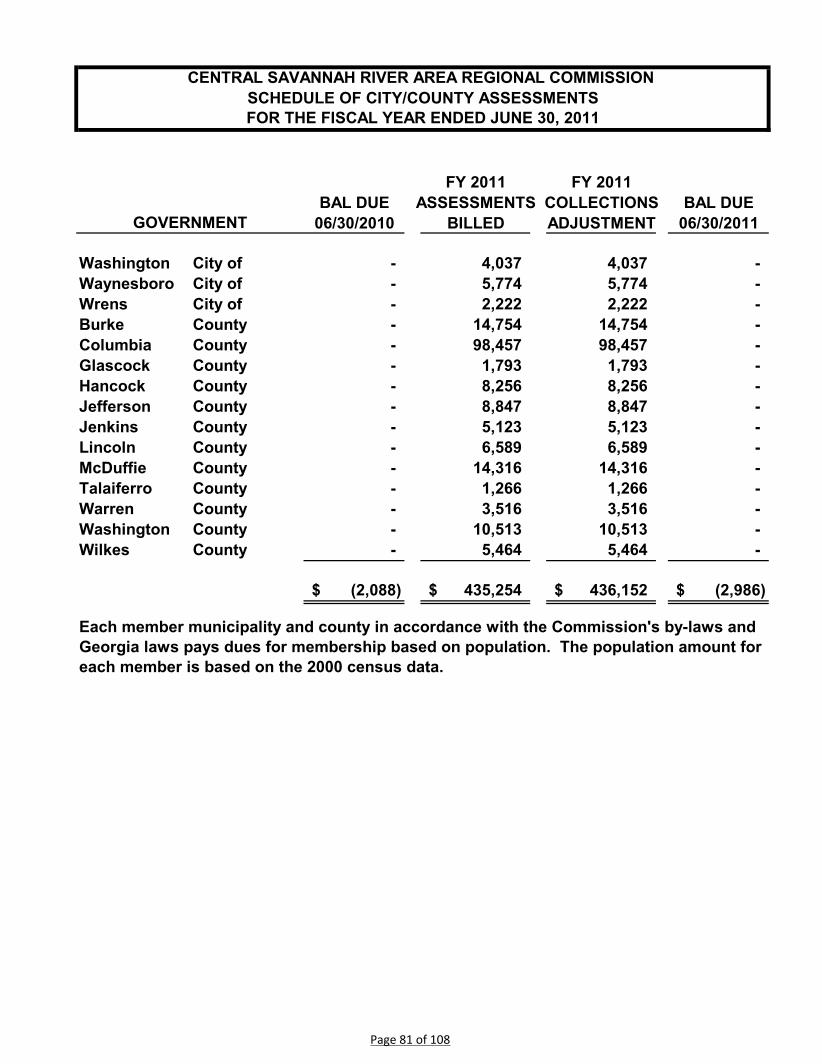
FY 2011 FY 2011BAL DUE ASSESSMENTS COLLECTIONS BAL DUE
06/30/2010 BILLED ADJUSTMENT 06/30/2011
CENTRAL SAVANNAH RIVER AREA REGIONAL COMMISSION SCHEDULE OF CITY/COUNTY ASSESSMENTSFOR THE FISCAL YEAR ENDED JUNE 30, 2011
GOVERNMENT
Washington City of - 4,037 4,037 - Waynesboro City of - 5,774 5,774 - Wrens City of - 2,222 2,222 - Burke County - 14,754 14,754 - Columbia County - 98,457 98,457 - Glascock County - 1,793 1,793 - Hancock County - 8,256 8,256 - Jefferson County - 8,847 8,847 - Jenkins County - 5,123 5,123 - Lincoln County - 6,589 6,589 - McDuffie County - 14,316 14,316 - Talaiferro County - 1,266 1,266 - Warren County - 3,516 3,516 - Washington County - 10,513 10,513 - Wilkes County - 5,464 5,464 -
(2,088)$ 435,254$ 436,152$ (2,986)$
Each member municipality and county in accordance with the Commission's by-laws and Georgia laws pays dues for membership based on population. The population amount for each member is based on the 2000 census data.
Page 81 of 108

[This page is intentionally blank.]
Page 82 of 108
STATISTICAL SECTION(UNAUDITED)

[This page is intentionally blank.]
STATISTICAL SECTION (UNAUDITED)
This part of the Commission’s Comprehensive Annual Financial Report presents detailed information as a context for understanding what the information in the financial statements, note disclosures, and required supplementary information says about the Commission’s overall financial health.
• Financial Trends - These schedules contain trend information to help the reader understand how the Commission’s financial performance and well-being have changed over time.
• Revenue Capacity - These schedules contain information to help the reader
assess the Commission’s most significant local revenue source, grants and contracts.
• Demographic and Economic Information - These schedules offer
demographic and economic indicators to help the reader understand the environment within which the Commission’s financial activities take place.
• Operating Information - These schedules contain service to help the reader
understand how the information in the Commission’s financial report relates to the services the Commission provides and the activities it performs.
Page 83 of 108
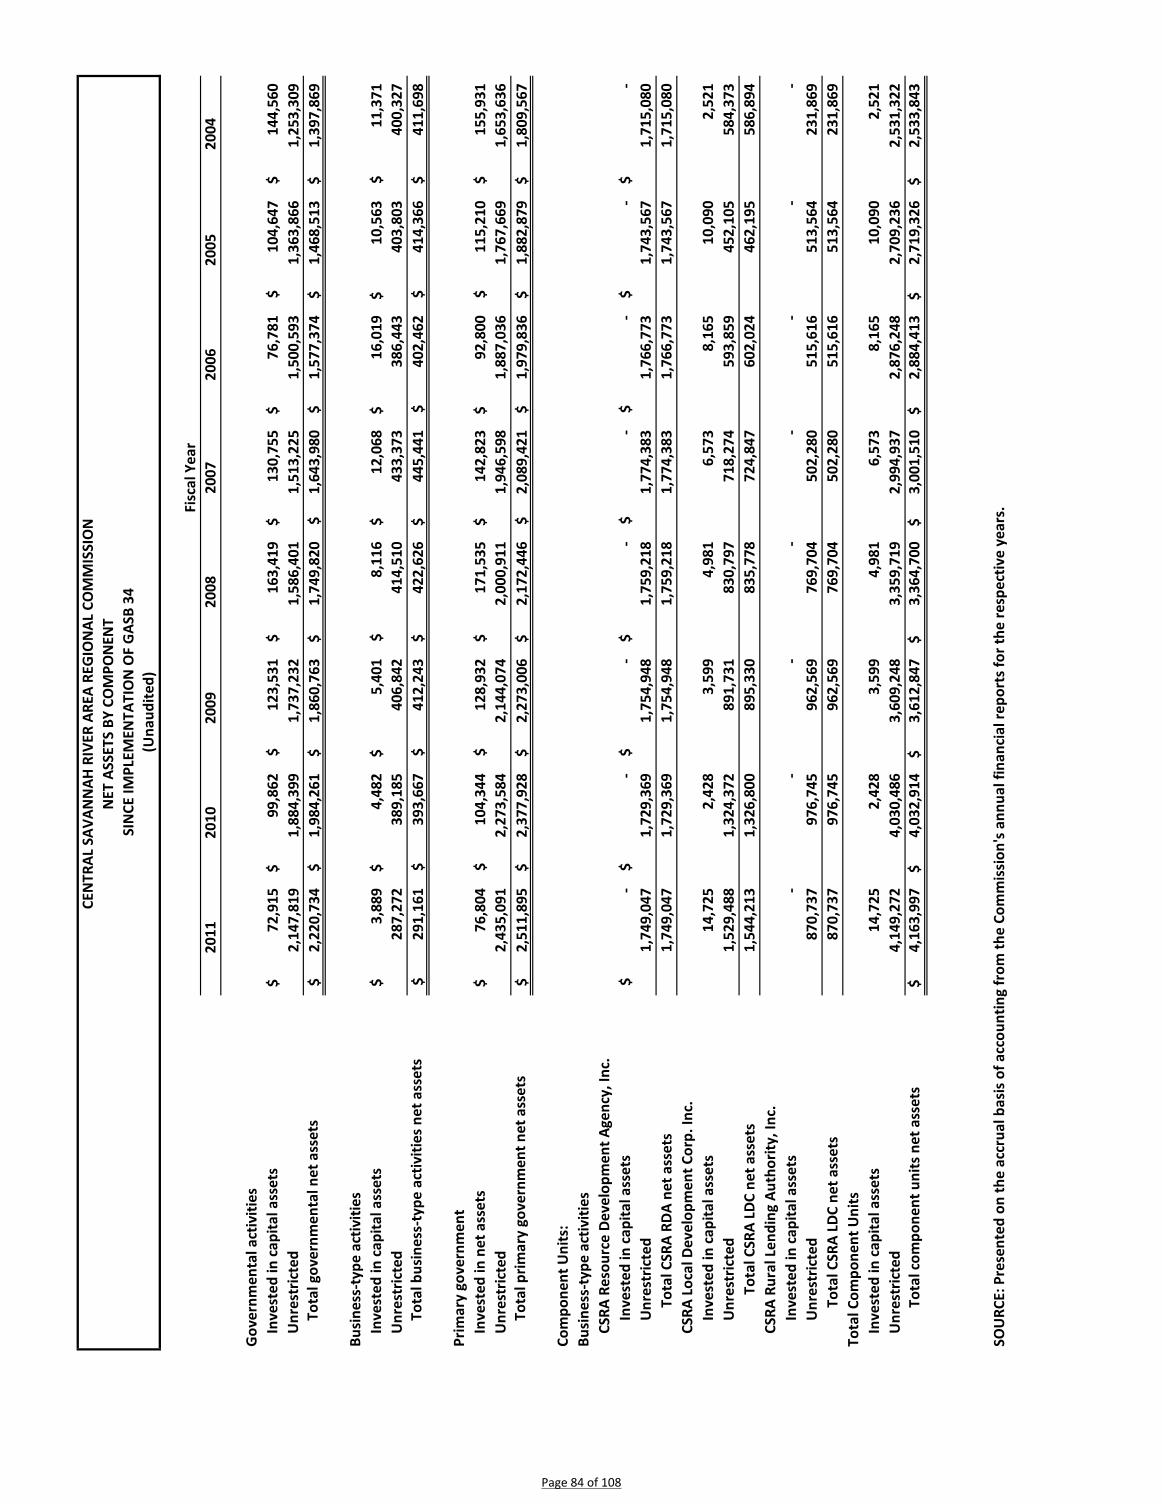
2011
2010
2009
2008
2007
2006
2005
2004
Gov
ernm
enta
l act
iviti
esIn
vest
ed in
cap
ital a
sset
s72
,915
$
99,8
62$
12
3,53
1$
163,
419
$
13
0,75
5$
76,7
81$
10
4,64
7$
144,
560
$
U
nres
tric
ted
2,14
7,81
9
1,
884,
399
1,73
7,23
2
1,
586,
401
1,51
3,22
5
1,50
0,59
3
1,
363,
866
1,25
3,30
9
To
tal g
over
nmen
tal n
et a
sset
s2,
220,
734
$
1,98
4,26
1$
1,
860,
763
$
1,74
9,82
0$
1,
643,
980
$
1,
577,
374
$
1,46
8,51
3$
1,
397,
869
$
Busi
ness
-typ
e ac
tiviti
esIn
vest
ed in
cap
ital a
sset
s3,
889
$
4,48
2$
5,
401
$
8,11
6$
12
,068
$
16
,019
$
10,5
63$
11
,371
$
Unr
estr
icte
d28
7,27
2
389,
185
40
6,84
2
414,
510
43
3,37
3
386,
443
40
3,80
3
400,
327
To
tal b
usin
ess-
type
act
iviti
es n
et a
sset
s29
1,16
1$
393,
667
$
41
2,24
3$
422,
626
$
44
5,44
1$
402,
462
$
41
4,36
6$
411,
698
$
Prim
ary
gove
rnm
ent
Inve
sted
in n
et a
sset
s76
,804
$
104,
344
$
12
8,93
2$
171,
535
$
14
2,82
3$
92,8
00$
11
5,21
0$
155,
931
$
U
nres
tric
ted
2,43
5,09
1
2,
273,
584
2,14
4,07
4
2,
000,
911
1,94
6,59
8
1,88
7,03
6
1,
767,
669
1,65
3,63
6
To
tal p
rimar
y go
vern
men
t net
ass
ets
2,51
1,89
5$
2,
377,
928
$
2,27
3,00
6$
2,
172,
446
$
2,08
9,42
1$
1,97
9,83
6$
1,
882,
879
$
1,80
9,56
7$
Com
pone
nt U
nits
:Bu
sine
ss-t
ype
activ
ities
CSRA
Res
ourc
e De
velo
pmen
t Age
ncy,
Inc.
In
vest
ed in
cap
ital a
sset
s-
$
-
$
-
$
-
$
-
$
-
$
-
$
-
$
U
nres
tric
ted
1,74
9,04
7
1,
729,
369
1,75
4,94
8
1,
759,
218
1,77
4,38
3
1,76
6,77
3
1,
743,
567
1,71
5,08
0
To
tal C
SRA
RDA
net a
sset
s1,
749,
047
1,72
9,36
9
1,
754,
948
1,75
9,21
8
1,
774,
383
1,
766,
773
1,74
3,56
7
1,
715,
080
CSRA
Loc
al D
evel
opm
ent C
orp.
Inc.
Inve
sted
in c
apita
l ass
ets
14,7
25
2,
428
3,59
9
4,
981
6,
573
8,16
5
10
,090
2,52
1
Unr
estr
icte
d1,
529,
488
1,32
4,37
2
89
1,73
1
830,
797
71
8,27
4
593,
859
45
2,10
5
584,
373
To
tal C
SRA
LDC
net a
sset
s1,
544,
213
1,32
6,80
0
89
5,33
0
835,
778
72
4,84
7
602,
024
46
2,19
5
586,
894
CS
RA R
ural
Len
ding
Aut
horit
y, In
c.In
vest
ed in
cap
ital a
sset
s-
-
-
-
-
-
-
-
U
nres
tric
ted
870,
737
97
6,74
5
962,
569
76
9,70
4
502,
280
51
5,61
6
513,
564
23
1,86
9
Tota
l CSR
A LD
C ne
t ass
ets
870,
737
97
6,74
5
962,
569
76
9,70
4
502,
280
51
5,61
6
513,
564
23
1,86
9
Tota
l Com
pone
nt U
nits
Inve
sted
in c
apita
l ass
ets
14,7
25
2,
428
3,59
9
4,
981
6,
573
8,16
5
10
,090
2,52
1
Unr
estr
icte
d4,
149,
272
4,03
0,48
6
3,
609,
248
3,35
9,71
9
2,
994,
937
2,
876,
248
2,70
9,23
6
2,
531,
322
Tota
l com
pone
nt u
nits
net
ass
ets
4,16
3,99
7$
4,
032,
914
$
3,61
2,84
7$
3,
364,
700
$
3,00
1,51
0$
2,88
4,41
3$
2,
719,
326
$
2,53
3,84
3$
CEN
TRAL
SAV
ANN
AH R
IVER
ARE
A RE
GIO
NAL
CO
MM
ISSI
ON
SOU
RCE:
Pre
sent
ed o
n th
e ac
crua
l bas
is o
f acc
ount
ing
from
the
Com
mis
sion
's an
nual
fina
ncia
l rep
orts
for t
he re
spec
tive
year
s. Fisc
al Y
ear
(Una
udite
d)SI
NCE
IMPL
EMEN
TATI
ON
OF
GAS
B 34
NET
ASS
ETS
BY C
OM
PON
ENT
Page 84 of 108

2011
2010
2009
2008
2007
2006
2005
2004
Expe
nses
Gov
ernm
enta
l act
iviti
es:
Gen
eral
gov
ernm
ent
73,6
66$
13
9,14
9$
54,2
11$
91
,270
$
58
,545
$
35
,769
$
54
,476
$
51
,251
$
Ag
ing
serv
ices
5,64
4,90
4
5,
228,
535
5,58
2,27
8
5,
439,
246
5,
402,
571
5,
247,
407
5,
096,
074
4,
943,
468
Re
gion
al tr
ansp
orta
tion
serv
ices
2,01
1,73
6
1,
874,
909
1,85
8,92
0
1,
806,
067
1,
862,
862
1,
752,
419
1,
698,
784
1,
799,
175
Pl
anni
ng a
nd zo
ning
serv
ices
279,
468
22
0,19
9
180,
407
27
6,81
8
32
1,94
0
24
5,48
6
31
2,67
7
26
0,19
3
Lo
cal g
over
nmen
t ser
vice
s39
6,21
0
379,
940
33
5,51
3
351,
756
291,
835
295,
048
253,
984
312,
598
Econ
omic
dev
elop
men
t sup
port
serv
ices
134,
340
15
1,64
8
85,4
14
10
3,81
4
16
0,44
2
81
,405
70
,866
14
7,53
7
M
anag
emen
t of l
ocal
dev
elop
men
t co
mpa
nies
536,
344
57
5,99
9
523,
054
54
2,48
2
45
3,26
0
40
3,99
7
35
9,46
0
31
8,44
1
To
tal g
over
nmen
tal a
ctiv
ities
9,07
6,66
8
8,
570,
379
8,61
9,79
7
8,
611,
453
8,
551,
455
8,
061,
531
7,
846,
321
7,
832,
663
Bu
sine
ss ty
pe a
ctiv
ities
:H
erm
an L
odge
Mic
ro lo
an p
rogr
am
115,
479
32
,496
26,0
76
37
,370
29
,958
26
,401
19
,446
21
,675
M
appi
ng &
geo
grap
hic
info
rmat
ion
syst
ems s
uppo
rt59
4
6,
914
25
,515
76,5
43
81,2
20
102,
673
90,5
71
196,
801
Tota
l bus
ines
s typ
e ac
tiviti
es e
xpen
ses
1
16,0
73
39,4
10
51,5
91
113,
913
111,
178
129,
074
110,
017
218,
476
Tota
l prim
ary
gove
rnm
ent e
xpen
ses
$
9,1
92,7
41
$
8,60
9,78
9 $
8
,671
,388
$
8
,725
,366
$
8,66
2,63
3 $
8,19
0,60
5 $
7,95
6,33
8 $
8,05
1,13
9
Prog
ram
reve
nues
Gov
ernm
enta
l act
iviti
es:
Char
ges f
or se
rvic
es:
Gen
eral
gov
ernm
ent
47,6
65$
1,
645
$
1,
614
$
63
,154
$
2,
700
$
4,06
0$
3,
966
$
6,29
5$
Ag
ing
serv
ices
21,1
25
18
,105
31,4
40
7,
098
7,23
1
19
,841
6,
889
7,73
9
Re
gion
al tr
ansp
orta
tion
serv
ices
-
-
-
-
-
-
2,
475
4,45
5
Pl
anni
ng a
nd zo
ning
serv
ices
17,4
65
38
,402
18,5
96
33
,416
36
4,50
0
19
,241
17
,326
Lo
cal g
over
nmen
t ser
vice
s31
0,76
1
269,
106
28
7,09
6
229,
360
24,2
50
34,4
32
23,5
00
223,
126
Econ
omic
dev
elop
men
t sup
port
serv
ices
18,5
70
10
,571
23,3
66
15
,324
8,
156
8,87
8
14
,279
31
,346
M
anag
emen
t of l
ocal
dev
elop
men
t co
mpa
nies
536,
344
57
5,99
9
523,
054
54
2,48
2
45
3,26
0
40
3,99
7
35
9,46
0
31
8,44
1
To
tal c
harg
e fo
r ser
vice
s95
1,93
0
913,
828
88
5,16
6
890,
834
495,
633
475,
708
429,
810
608,
728
Ope
ratin
g gr
ants
:Ag
ing
serv
ices
5,52
1,94
5
5,
112,
686
5,43
8,76
8
5,
339,
740
5,
326,
396
5,
154,
305
4,
978,
471
4,
859,
490
Re
gion
al tr
ansp
orta
tion
serv
ices
2,06
1,18
6
1,
904,
794
1,89
2,38
4
1,
825,
150
1,
888,
614
1,
771,
447
1,
713,
487
1,
815,
134
Pl
anni
ng a
nd zo
ning
serv
ices
243,
990
17
5,80
4
148,
341
23
7,96
6
26
8,60
3
21
3,40
0
26
5,69
3
16
1,13
8
CEN
TRAL
SAV
ANN
AH R
IVER
ARE
A RE
GIO
NAL
CO
MM
ISSI
ON
CHAN
GES
IN N
ET A
SSET
S
(Una
udite
d)SI
NCE
IMPL
EMEN
TATI
ON
OF
GAS
B 34
Fisc
al Y
ear
Page 85 of 108
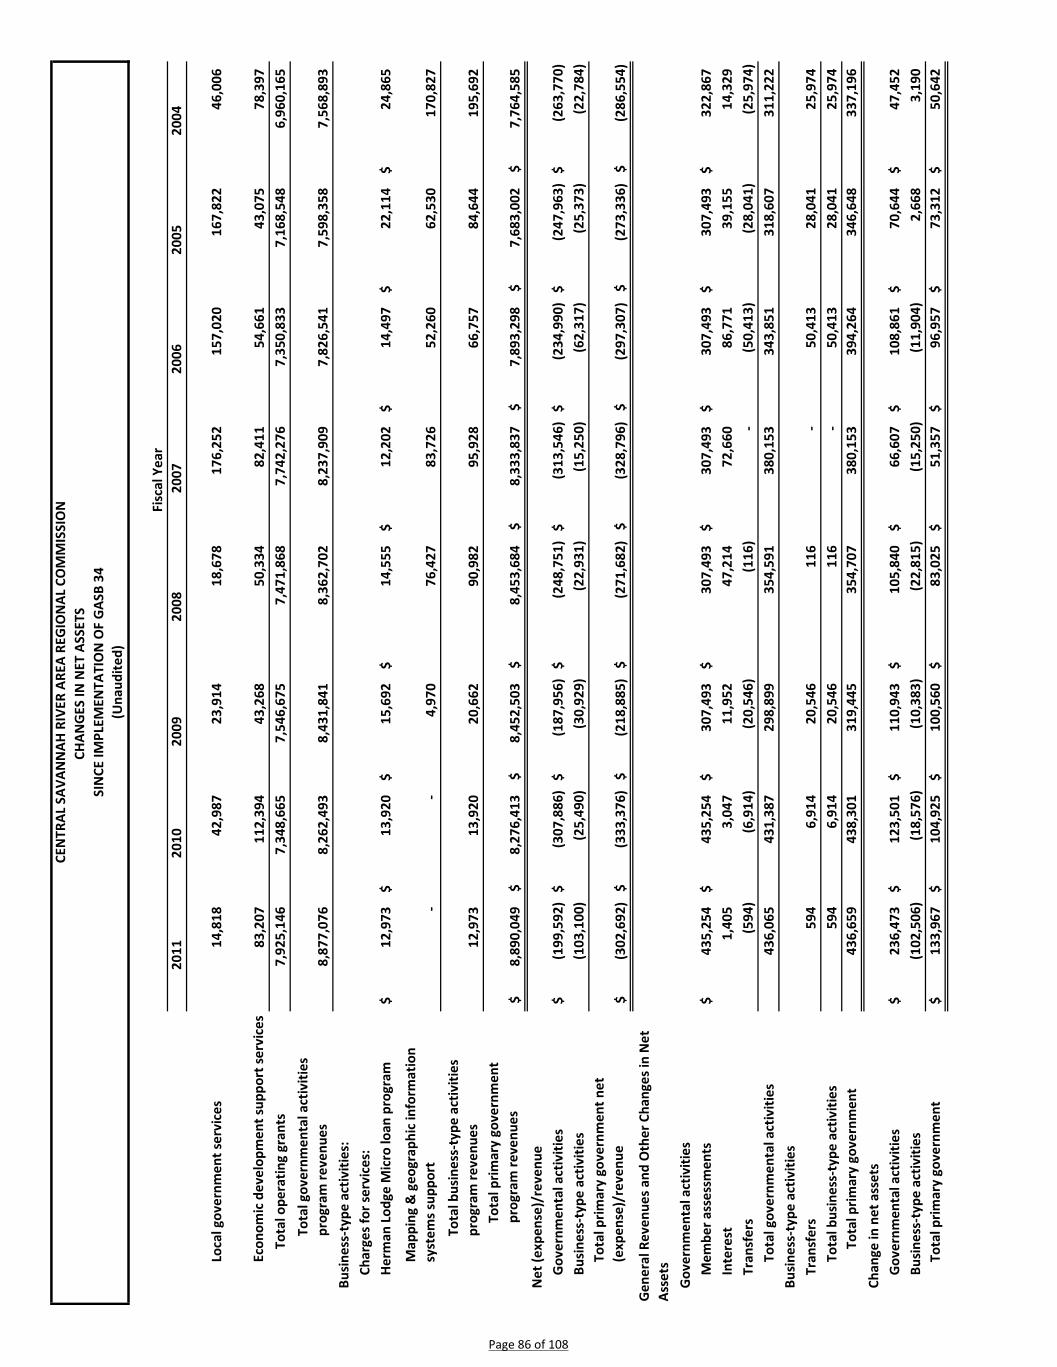
2011
2010
2009
2008
2007
2006
2005
2004
CEN
TRAL
SAV
ANN
AH R
IVER
ARE
A RE
GIO
NAL
CO
MM
ISSI
ON
CHAN
GES
IN N
ET A
SSET
S
(Una
udite
d)SI
NCE
IMPL
EMEN
TATI
ON
OF
GAS
B 34
Fisc
al Y
ear
Loca
l gov
ernm
ent s
ervi
ces
14,8
18
42
,987
23,9
14
18
,678
17
6,25
2
15
7,02
0
16
7,82
2
46
,006
Econ
omic
dev
elop
men
t sup
port
serv
ices
83,2
07
11
2,39
4
43,2
68
50
,334
82
,411
54
,661
43
,075
78
,397
To
tal o
pera
ting
gran
ts7,
925,
146
7,34
8,66
5
7,
546,
675
7,47
1,86
8
7,74
2,27
6
7,35
0,83
3
7,16
8,54
8
6,96
0,16
5
Tota
l gov
ernm
enta
l act
iviti
es
prog
ram
reve
nues
8,87
7,07
6
8,
262,
493
8,43
1,84
1
8,
362,
702
8,
237,
909
7,
826,
541
7,
598,
358
7,
568,
893
Bu
sine
ss-t
ype
activ
ities
:Ch
arge
s for
serv
ices
:H
erm
an L
odge
Mic
ro lo
an p
rogr
am
12,9
73$
13
,920
$
15,6
92$
14
,555
$
12
,202
$
14
,497
$
22
,114
$
24
,865
$
Map
ping
& g
eogr
aphi
c in
form
atio
n sy
stem
s sup
port
-
-
4,97
0
76,4
27
83,7
26
52,2
60
62,5
30
170,
827
Tota
l bus
ines
s-ty
pe a
ctiv
ities
pr
ogra
m re
venu
es12
,973
13,9
20
20
,662
90,9
82
95,9
28
66,7
57
84,6
44
195,
692
Tota
l prim
ary
gove
rnm
ent
prog
ram
reve
nues
8,89
0,04
9$
8,
276,
413
$
8,45
2,50
3$
8,
453,
684
$
8,
333,
837
$
7,
893,
298
$
7,
683,
002
$
7,
764,
585
$
N
et (e
xpen
se)/
reve
nue
Gov
ernm
enta
l act
iviti
es(1
99,5
92)
$
(3
07,8
86)
$
(1
87,9
56)
$
(2
48,7
51)
$
(313
,546
)$
(2
34,9
90)
$
(247
,963
)$
(2
63,7
70)
$
Busi
ness
-typ
e ac
tiviti
es(1
03,1
00)
(2
5,49
0)
(3
0,92
9)
(2
2,93
1)
(1
5,25
0)
(62,
317)
(2
5,37
3)
(22,
784)
To
tal p
rimar
y go
vern
men
t net
(e
xpen
se)/
reve
nue
(302
,692
)$
(333
,376
)$
(218
,885
)$
(271
,682
)$
(3
28,7
96)
$
(297
,307
)$
(2
73,3
36)
$
(286
,554
)$
Gen
eral
Rev
enue
s and
Oth
er C
hang
es in
Net
As
sets
Gov
ernm
enta
l act
iviti
esM
embe
r ass
essm
ents
435,
254
$
43
5,25
4$
307,
493
$
30
7,49
3$
30
7,49
3$
30
7,49
3$
30
7,49
3$
32
2,86
7$
In
tere
st1,
405
3,
047
11
,952
47,2
14
72,6
60
86,7
71
39,1
55
14,3
29
Tran
sfer
s(5
94)
(6,9
14)
(2
0,54
6)
(1
16)
-
(50,
413)
(2
8,04
1)
(25,
974)
To
tal g
over
nmen
tal a
ctiv
ities
436,
065
43
1,38
7
298,
899
35
4,59
1
38
0,15
3
34
3,85
1
31
8,60
7
31
1,22
2
Bu
sine
ss-t
ype
activ
ities
Tran
sfer
s59
4
6,
914
20
,546
116
-
50
,413
28
,041
25
,974
To
tal b
usin
ess-
type
act
iviti
es59
4
6,
914
20
,546
116
-
50
,413
28
,041
25
,974
To
tal p
rimar
y go
vern
men
t43
6,65
9
438,
301
31
9,44
5
354,
707
380,
153
394,
264
346,
648
337,
196
Chan
ge in
net
ass
ets
Gov
ernm
enta
l act
iviti
es23
6,47
3$
123,
501
$
11
0,94
3$
105,
840
$
66,6
07$
108,
861
$
70,6
44$
47,4
52$
Busi
ness
-typ
e ac
tiviti
es(1
02,5
06)
(1
8,57
6)
(1
0,38
3)
(2
2,81
5)
(1
5,25
0)
(11,
904)
2,
668
3,19
0
To
tal p
rimar
y go
vern
men
t13
3,96
7$
104,
925
$
10
0,56
0$
83,0
25$
51,3
57$
96,9
57$
73,3
12$
50,6
42$
Page 86 of 108
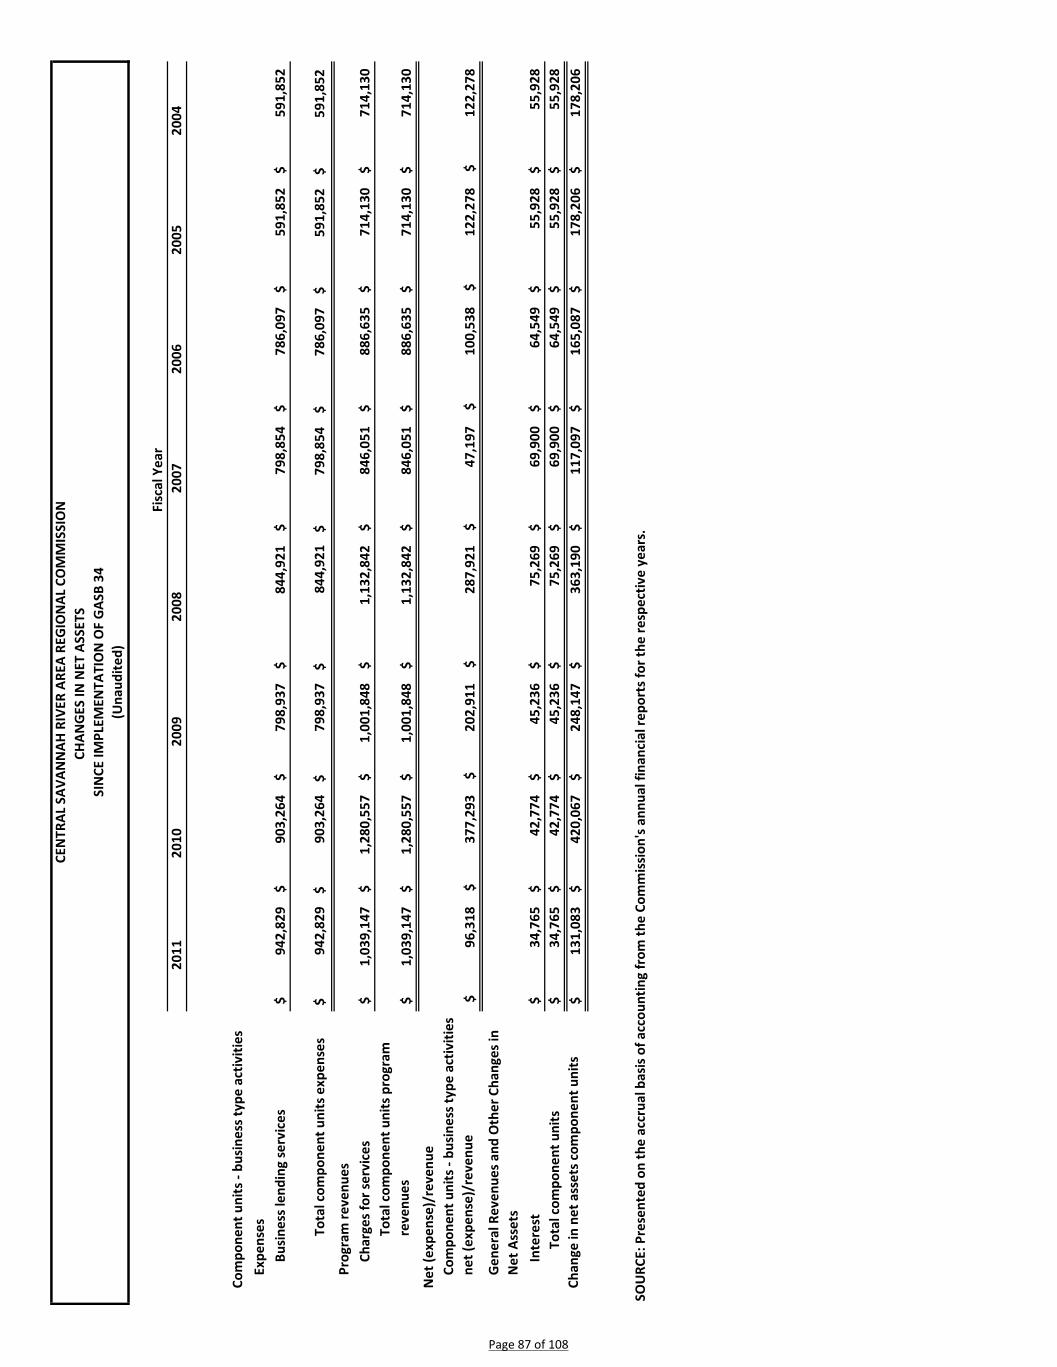
2011
2010
2009
2008
2007
2006
2005
2004
CEN
TRAL
SAV
ANN
AH R
IVER
ARE
A RE
GIO
NAL
CO
MM
ISSI
ON
CHAN
GES
IN N
ET A
SSET
S
(Una
udite
d)SI
NCE
IMPL
EMEN
TATI
ON
OF
GAS
B 34
Fisc
al Y
ear
Com
pone
nt u
nits
- bu
sine
ss ty
pe a
ctiv
ities
Expe
nses
Busi
ness
lend
ing
serv
ices
94
2,82
9$
903,
264
$
79
8,93
7$
844,
921
$
798,
854
$
786,
097
$
591,
852
$
591,
852
$
Tota
l com
pone
nt u
nits
exp
ense
s $
942
,829
$
903
,264
$
798
,937
$
84
4,92
1 $
79
8,85
4 $
78
6,09
7 $
59
1,85
2 $
59
1,85
2
Prog
ram
reve
nues
Char
ges f
or se
rvic
es1,
039,
147
$
1,28
0,55
7$
1,
001,
848
$
1,13
2,84
2$
846,
051
$
886,
635
$
714,
130
$
714,
130
$
Tota
l com
pone
nt u
nits
pro
gram
re
venu
es1,
039,
147
$
1,28
0,55
7$
1,
001,
848
$
1,13
2,84
2$
846,
051
$
886,
635
$
714,
130
$
714,
130
$
Net
(exp
ense
)/re
venu
eCo
mpo
nent
uni
ts -
busi
ness
type
act
iviti
es
net (
expe
nse)
/rev
enue
96,3
18$
37
7,29
3$
202,
911
$
28
7,92
1$
47
,197
$
10
0,53
8$
12
2,27
8$
12
2,27
8$
Gen
eral
Rev
enue
s and
Oth
er C
hang
es in
N
et A
sset
sIn
tere
st34
,765
$
42,7
74$
45
,236
$
75,2
69$
69,9
00$
64,5
49$
55,9
28$
55,9
28$
Tota
l com
pone
nt u
nits
34,7
65$
42
,774
$
45,2
36$
75
,269
$
69
,900
$
64
,549
$
55
,928
$
55
,928
$
Ch
ange
in n
et a
sset
s com
pone
nt u
nits
131,
083
$
42
0,06
7$
248,
147
$
36
3,19
0$
11
7,09
7$
16
5,08
7$
17
8,20
6$
17
8,20
6$
SOU
RCE:
Pre
sent
ed o
n th
e ac
crua
l bas
is o
f acc
ount
ing
from
the
Com
mis
sion
's a
nnua
l fin
anci
al re
port
s for
the
resp
ectiv
e ye
ars.
Page 87 of 108

2011
2010
2009
2008
2007
2006
2005
2004
2003
2002
Gen
eral
fund
Rese
rved
-$
-$
-$
-$
-$
235,
635
$
23
5,63
5$
235,
635
$
23
5,63
5$
235,
635
$
Unr
eser
ved
-
1,73
9,76
5
1,61
6,09
3
1,50
4,63
1
1,
397,
145
1,
091,
523
97
6,73
7
897,
155
83
9,51
5
749,
054
Una
ssig
ned
1,97
6,23
8
-
-
-
-
-
-
-
-
-
To
tal g
ener
al fu
nd1,
976,
238
$
1,
739,
765
$
1,
616,
093
$
1,
504,
631
$
1,
397,
145
$
1,
327,
158
$
1,
212,
372
$
1,
132,
790
$
1,
075,
150
$
98
4,68
9$
All o
ther
gov
ernm
enta
l fun
dsU
nres
erve
d-
$
-
$
-
$
-
$
-
$
-
$
-
$
-
$
-
$
-
$
Una
ssig
ned
-
-
-
-
-
-
-
-
-
-
To
tal a
ll ot
her g
over
nmen
tal f
unds
-$
-$
-$
-$
-$
-$
-$
-$
-$
-$
Tota
l fun
d ba
lanc
es1,
976,
238
$
1,
739,
765
$
1,
616,
093
$
1,
504,
631
$
1,
397,
145
$
1,
327,
158
$
1,
212,
372
$
1,
132,
790
$
1,
075,
150
$
98
4,68
9$
Fisc
al Y
ear
SOU
RCE:
Pre
sent
ed o
n th
e m
odifi
ed a
ccru
al b
asis
of a
ccou
ntin
g fr
om th
e Co
mm
issi
on's
ann
ual f
inan
cial
repo
rts f
or th
e re
spec
tive
year
s.
CEN
TRAL
SAV
ANN
AH R
IVER
ARE
A RE
GIO
NAL
CO
MM
ISSI
ON
FUN
D B
ALAN
CES
OF
GO
VERN
MEN
TAL
FUN
DS
LAST
TEN
FIS
CAL
YEAR
S(U
naud
ited)
Page 88 of 108

2011
2010
2009
2008
2007
2006
2005
2004
2003
2002
Reve
nues
Fede
ral &
Sta
te g
rant
s /
cont
ract
s7,
925,
146
$
7,
348,
665
$
7,
546,
675
$
7,
471,
868
$
7,
524,
307
$
7,
205,
606
$
6,95
7,10
5$
6,96
0,16
5$
7,38
2,30
5$
7,21
5,89
9$
City
, cou
nty,
or o
ther
gra
nts
/ co
ntra
cts
801,
238
845,
847
781,
921
769,
904
671,
229
549,
224
570,
903
608,
483
784,
766
547,
677
Char
ges
for s
ervi
ces
143,
027
66,3
36
101,
631
60,9
26
42,3
73
71
,711
69,1
39
-
45
,622
39
,415
M
embe
r ass
essm
ents
435,
254
435,
254
307,
493
307,
493
307,
493
307,
493
307,
493
322,
867
322,
867
322,
786
Tota
l Rev
enue
s9,
304,
665
8,
696,
102
8,
737,
720
8,
610,
191
8,
545,
402
8,
134,
034
7,90
4,64
0
7,89
1,51
5
8,53
5,56
0
8,12
5,77
7
Expe
nditu
res
Gen
eral
gov
ernm
ent
66,3
68
138,
601
52,1
32
28,1
69
21,5
84
35
,799
46,2
57
49,9
67
33
,008
33
,028
Ag
ing
serv
ices
5,64
4,90
4
5,22
8,36
4
5,58
1,75
8
5,43
7,60
0
5,39
9,53
5
5,24
2,16
9
5,
088,
343
4,
935,
005
5,
020,
113
4,
842,
238
Re
gion
al tr
ansp
orta
tion
serv
ices
2,01
1,73
6
1,87
4,90
9
1,85
8,92
0
1,80
6,06
7
1,86
2,86
2
1,75
2,41
9
1,
698,
097
1,
799,
175
1,
954,
130
2,
016,
406
Pl
anni
ng a
nd z
onin
g se
rvic
es27
9,46
8
22
0,19
9
18
0,40
7
27
6,81
8
32
1,59
7
24
4,79
9
31
2,67
7
25
9,50
6
49
8,73
9
31
6,38
9
Lo
cal g
over
nmen
t ser
vice
s
3
66,2
10
379,
940
3
35,5
13
3
51,7
56
2
91,8
35
2
95,0
48
2
53,9
84
3
12,5
99
336,
195
325,
626
Econ
omic
dev
elop
men
t sup
port
ser
vice
s
1
34,3
40
151,
648
85,
414
1
03,8
14
1
60,4
42
81,
405
70,
866
1
47,5
38
172,
674
171,
449
Man
agem
ent o
f loc
al d
evel
opm
ent c
ompa
nies
536,
344
575,
999
523,
054
542,
482
453,
260
403,
997
359,
460
318,
441
384,
256
369,
206
Tota
l Exp
endi
ture
s9,
039,
370
8,
569,
660
8,
617,
198
8,
546,
706
8,
511,
115
8,
055,
636
7,82
9,68
4
7,82
2,23
1
8,39
9,11
5
8,07
4,34
2
Exce
ss o
f rev
enue
s ov
er (u
nder
) exp
endi
ture
s26
5,29
5
12
6,44
2
12
0,52
2
63
,485
34
,287
78,3
98
74
,956
69
,284
136,
445
51,4
35
OTH
ER F
INAN
CIN
G S
OU
RCES
(USE
S)G
ain
on s
ale
of p
rope
rty
-
-
-
-
-
-
-
-
-
59
,474
Tr
ansf
er in
23
2,79
5
25
9,60
7
26
9,05
1
40
0,09
1
37
0,44
0
32
2,76
7
30
8,24
0
30
8,61
4
32
1,50
9
55
9,53
3
Tr
ansf
er o
ut(2
31,6
17)
(262
,377
)
(2
78,1
11)
(3
56,0
90)
(3
34,7
40)
(2
86,3
79)
(3
03,6
14)
(3
20,2
58)
(3
67,3
93)
(390
,634
)
To
tal o
ther
fina
ncin
g so
urce
s an
d us
es1,
178
(2,7
70)
(9
,060
)
44,0
01
35,7
00
36
,388
4,62
6
(11,
644)
(45,
884)
228,
373
Net
cha
nge
in fu
nd b
alan
ce26
6,47
3$
12
3,67
2$
11
1,46
2$
10
7,48
6$
69
,987
$
114,
786
$
79,5
82$
57,6
40$
90
,561
$
27
9,80
8$
Debt
serv
ices
as a
per
cent
age
of n
onca
pita
l ex
pend
iture
sN
AN
AN
AN
AN
AN
AN
AN
AN
AN
A
Tota
l fun
d ba
lanc
e as
per
cent
age
of n
onca
pita
l ex
pend
iture
s21
.86%
20.3
0%18
.75%
17.6
0%16
.42%
16.4
7%15
.48%
14.4
8%12
.80%
12.2
0%
CEN
TRAL
SAV
ANN
AH R
IVER
ARE
A RE
GIO
NAL
CO
MM
ISSI
ON
CHAN
GES
IN F
UN
D BA
LAN
CES
OF
GOVE
RNM
ENTA
L FU
NDS
LAST
TEN
FIS
CAL
YEAR
S(U
naud
ited)
SOU
RCE:
Pre
sent
ed o
n th
e m
odifi
ed a
ccru
al b
asis
of a
ccou
ntin
g fr
om th
e Co
mm
issi
on's
annu
al fi
nanc
ial r
epor
ts fo
r the
resp
ectiv
e ye
ars.
Fisc
al Y
ear
Page 89 of 108

2011
2010
2009
2008
2007
2006
2005
2004
2003
2002
Indi
rect
Sala
ries
411,
144
$
39
0,76
3$
397,
568
$
37
7,65
5$
342,
701
$
32
1,53
2$
301,
809
$
30
0,53
3$
313,
634
$
27
9,71
2$
Frin
ge b
enef
its19
1,34
4
188,
363
18
8,66
3
160,
369
16
3,68
8
143,
314
14
3,58
6
141,
453
13
7,34
3
118,
428
Tr
avel
65
9
75
8
1,
113
1,
193
1,
515
91
5
82
5
1,
520
4,
367
3,
575
Su
pplie
s37
,631
35,7
91
33
,541
61,0
82
49
,903
41,4
22
46
,434
53,9
96
55
,369
52,7
56
Eq
uipm
ent (
not c
apita
lized
)7,
372
28
,689
3,54
1
23,7
74
18
,382
20,3
57
11
,465
14,6
78
D
-
-
Prof
essi
onal
fee
s43
,876
50,9
81
50
,650
60,1
63
93
,710
32,7
29
32
,168
30,1
61
33
,578
35,8
53
Te
leco
mm
unic
atio
ns18
,034
14,4
69
18
,137
27,4
65
24
,065
27,8
12
25
,319
26,6
53
31
,027
56,0
66
Mai
nten
ance
& u
pkee
p - e
quip
men
t &
build
ing
15,9
15
19
,905
16,1
50
16
,466
13,0
54
12
,256
11,5
52
13
,101
14,3
80
18
,362
Util
ities
22,0
93
19
,272
21,6
19
20
,029
15,5
22
16
,023
13,1
83
12
,984
13,5
14
12
,651
Insu
ranc
e20
,278
19,7
76
20
,346
20,2
20
20
,826
22,1
70
21
,780
27,2
45
16
,201
12,7
35
Du
es, s
ubsc
riptio
ns, &
pub
licat
ions
18,5
06
13
,970
11,0
78
7,
718
6,
115
15
,289
15,8
00
5,
954
5,
997
4,
873
Re
ntal
s - o
ther
than
real
est
ate
32,4
39
29
,437
31,5
14
34
,283
28,1
39
22
,769
17,0
30
16
,605
11,3
28
3,
783
R e
ntal
s - re
al e
stat
e11
8,02
8
118,
441
10
8,16
0
103,
910
88
,978
86,9
90
83
,265
82,2
42
80
,919
80,5
25
M
otor
veh
icle
exp
ense
9,38
6
8,59
4
10,5
67
14
,741
15,2
15
12
,649
10,2
99
11
,047
8,36
0
9,58
6
Post
age
and
frei
ght
10,6
19
10
,097
12,8
73
21
,493
10,7
45
10
,964
11,9
43
13
,789
12,1
65
15
,322
Tem
pora
ry p
erso
nnel
-
10
,644
-
-
-
-
-
-
-
-
Com
pute
r ser
vice
s -
-
-
-
-
-
-
-
-
A
14,0
84
Co
nfer
ence
s and
sem
inar
s-
25
0
-
27
5
22
5
1,
500
51
9
85
0
2,
236
2,
409
De
prec
iatio
n30
,502
40,2
25
39
,369
35,8
36
20
,323
26,8
55
30
,975
42,1
58
48
,535
53,5
00
To
tal c
osts
in p
ool b
efor
e cr
edits
987,
826
1,
000,
425
964,
889
98
6,67
2
913,
106
81
5,54
6
777,
952
79
4,96
9
788,
953
77
4,22
0
Less
cre
dits
or c
ost e
xclu
ded
(4,8
26)
(548
)
(2,0
80)
(63,
098)
(3
6,96
0)
-
(7,6
88)
(245
)
-
-
Tota
l Ind
irect
Cos
t 98
3,00
0$
999,
877
$
96
2,80
9$
923,
574
$
87
6,14
6$
815,
546
$
77
0,26
4$
794,
724
$
78
8,95
3$
774,
220
$
Allo
catio
n ba
se =
dire
ct p
erso
nnel
cos
t 2,
086,
493
$
2,04
0,52
4$
1,
851,
098
$
2,02
3,18
1$
1,
951,
797
$
1,90
8,19
3$
1,
869,
039
$
1,88
3,33
2$
1,
898,
156
$
1,79
9,91
0$
In
dire
ct c
ost r
ate
47.1
1%49
.00%
52.0
1%45
.65%
44.8
9%42
.74%
41.2
1%42
.20%
41.5
6%43
.01%
CEN
TRAL
SAV
ANN
AH R
IVER
ARE
A RE
GIO
NAL
CO
MM
ISSI
ON
SCHE
DULE
OF
INDI
RECT
CO
STS,
FRI
NG
E BE
NEF
ITS,
AN
D AL
LOCA
TIO
N B
ASE
LAST
TEN
FIS
CAL
YEAR
S(U
naud
ited)
Fisc
al Y
ear
Page 90 of 108
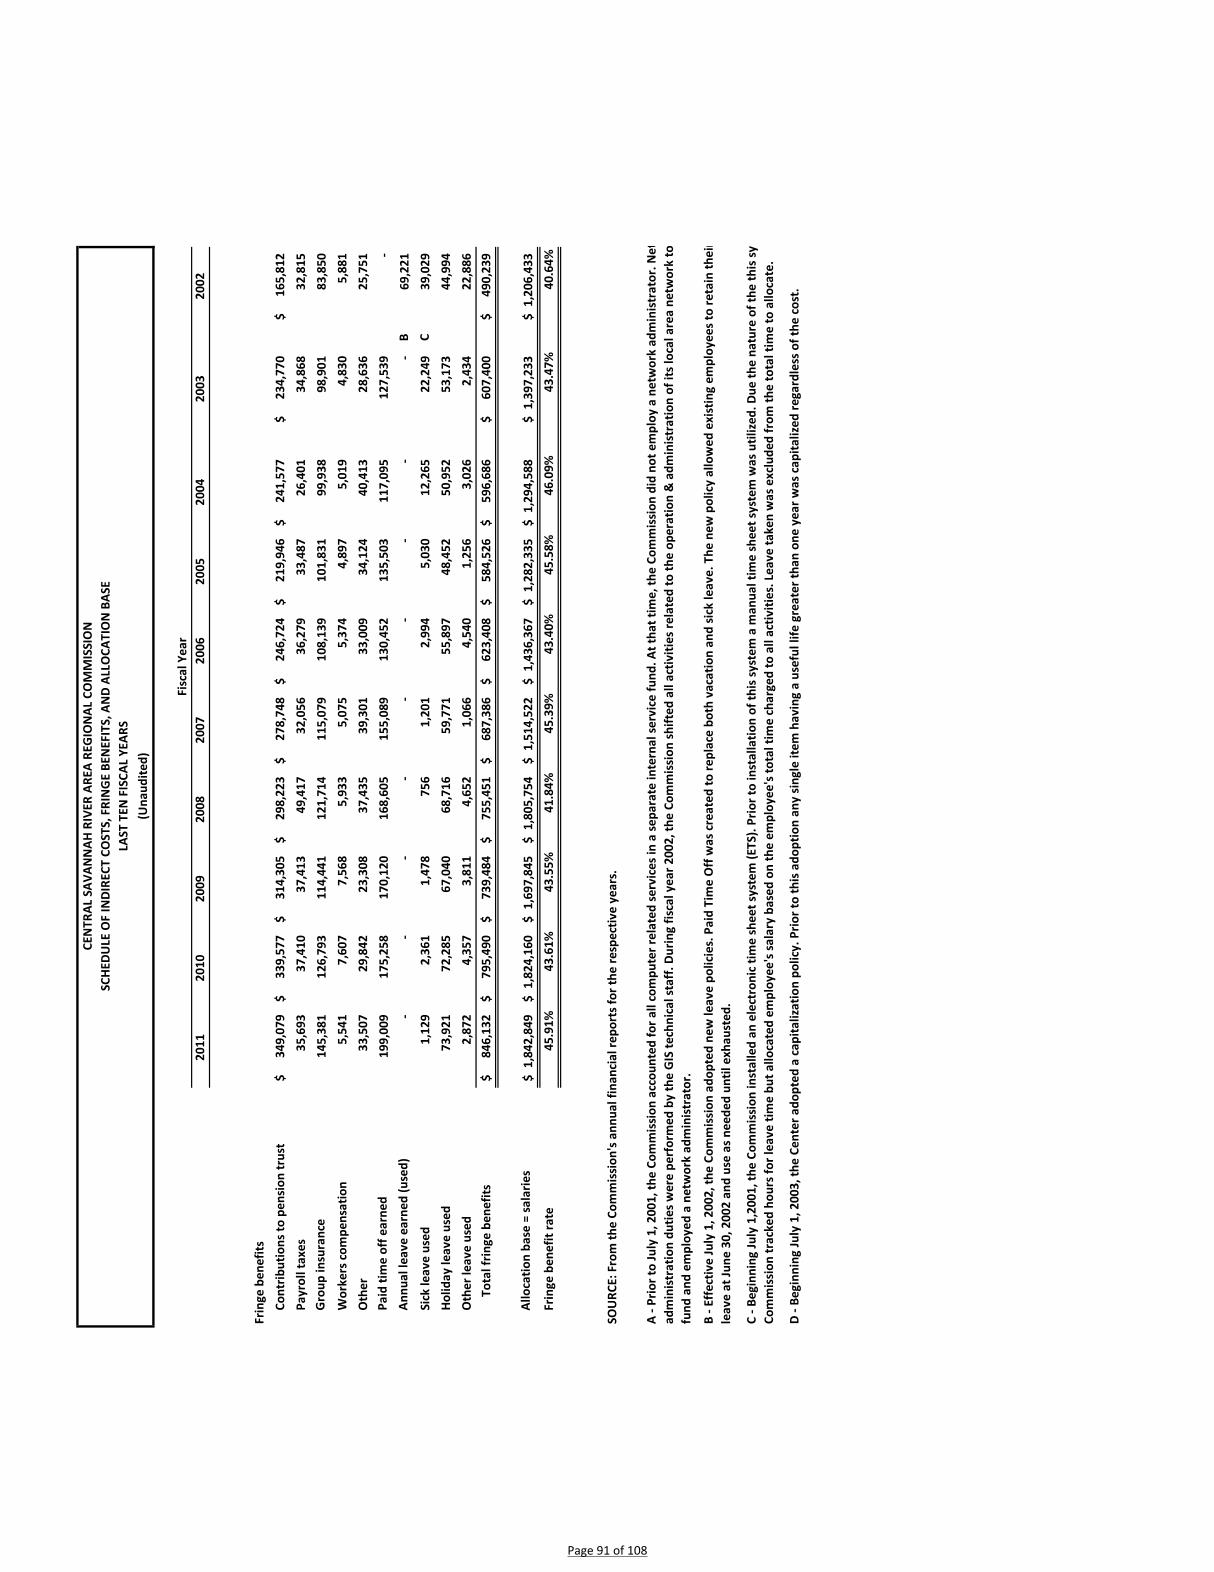
2011
2010
2009
2008
2007
2006
2005
2004
2003
2002
CEN
TRAL
SAV
ANN
AH R
IVER
ARE
A RE
GIO
NAL
CO
MM
ISSI
ON
SCHE
DULE
OF
INDI
RECT
CO
STS,
FRI
NG
E BE
NEF
ITS,
AN
D AL
LOCA
TIO
N B
ASE
LAST
TEN
FIS
CAL
YEAR
S(U
naud
ited)
Fisc
al Y
ear
Frin
ge b
enef
its
Cont
ribut
ions
to p
ensi
on tr
ust
349,
079
$
33
9,57
7$
314,
305
$
29
8,22
3$
278,
748
$
24
6,72
4$
219,
946
$
24
1,57
7$
234,
770
$
16
5,81
2$
Payr
oll t
axes
35,6
93
37
,410
37,4
13
49
,417
32,0
56
36
,279
33,4
87
26
,401
34,8
68
32
,815
Gro
up in
sura
nce
145,
381
12
6,79
3
114,
441
12
1,71
4
115,
079
10
8,13
9
101,
831
99
,938
98,9
01
83
,850
Wor
kers
com
pens
atio
n5,
541
7,
607
7,
568
5,
933
5,
075
5,
374
4,
897
5,
019
4,
830
5,
881
O
ther
33,5
07
29
,842
23,3
08
37
,435
39,3
01
33
,009
34,1
24
40
,413
28,6
36
25
,751
Paid
tim
e of
f ear
ned
199,
009
17
5,25
8
170,
120
16
8,60
5
155,
089
13
0,45
2
135,
503
11
7,09
5
127,
539
-
An
nual
leav
e ea
rned
(use
d)-
-
-
-
-
-
-
-
-
B
69,2
21
Si
ck le
ave
used
1,12
9
2,36
1
1,47
8
756
1,20
1
2,99
4
5,03
0
12,2
65
22
,249
C39
,029
Holid
ay le
ave
used
73,9
21
72
,285
67,0
40
68
,716
59,7
71
55
,897
48,4
52
50
,952
53,1
73
44
,994
Oth
er le
ave
used
2,87
2
4,35
7
3,81
1
4,65
2
1,06
6
4,54
0
1,25
6
3,02
6
2,43
4
22,8
86
To
tal f
ringe
ben
efits
846,
132
$
79
5,49
0$
739,
484
$
75
5,45
1$
687,
386
$
62
3,40
8$
584,
526
$
59
6,68
6$
607,
400
$
49
0,23
9$
Allo
catio
n ba
se =
sala
ries
1,84
2,84
9$
1,
824,
160
$
1,69
7,84
5$
1,
805,
754
$
1,51
4,52
2$
1,
436,
367
$
1,28
2,33
5$
1,
294,
588
$
1,39
7,23
3$
1,
206,
433
$
Frin
ge b
enef
it ra
te45
.91%
43.6
1%43
.55%
41.8
4%45
.39%
43.4
0%45
.58%
46.0
9%43
.47%
40.6
4%
D - B
egin
ning
July
1, 2
003,
the
Cent
er a
dopt
ed a
cap
italiz
atio
n po
licy.
Prio
r to
this
ado
ptio
n an
y si
ngle
item
hav
ing
a us
eful
life
gre
ater
than
one
yea
r was
cap
italiz
ed re
gard
less
of t
he c
ost.
SOU
RCE:
Fro
m th
e Co
mm
issi
on's
annu
al fi
nanc
ial r
epor
ts fo
r the
resp
ectiv
e ye
ars.
A - P
rior t
o Ju
ly 1
, 200
1, th
e Co
mm
issi
on a
ccou
nted
for a
ll co
mpu
ter r
elat
ed se
rvic
es in
a se
para
te in
tern
al se
rvic
e fu
nd. A
t tha
t tim
e, th
e Co
mm
issi
on d
id n
ot e
mpl
oy a
net
wor
k ad
min
istr
ator
. Net
ad
min
istr
atio
n du
ties w
ere
perf
orm
ed b
y th
e G
IS te
chni
cal s
taff
. Dur
ing
fisca
l yea
r 200
2, th
e Co
mm
issi
on sh
ifted
all
activ
ities
rela
ted
to th
e op
erat
ion
& a
dmin
istr
atio
n of
its l
ocal
are
a ne
twor
k to
fund
and
em
ploy
ed a
net
wor
k ad
min
istr
ator
.
B - E
ffec
tive
July
1, 2
002,
the
Com
mis
sion
ado
pted
new
leav
e po
licie
s. P
aid
Tim
e O
ff w
as c
reat
ed to
repl
ace
both
vac
atio
n an
d si
ck le
ave.
The
new
pol
icy
allo
wed
exi
stin
g em
ploy
ees t
o re
tain
thei
r
le
ave
at Ju
ne 3
0, 2
002
and
use
as n
eede
d un
til e
xhau
sted
.
C - B
egin
ning
July
1,2
001,
the
Com
mis
sion
inst
alle
d an
ele
ctro
nic
time
shee
t sys
tem
(ETS
). Pr
ior t
o in
stal
latio
n of
this
syst
em a
man
ual t
ime
shee
t sys
tem
was
util
ized
. Due
the
natu
re o
f the
this
sy
Co
mm
issi
on tr
acke
d ho
urs f
or le
ave
time
but a
lloca
ted
empl
oyee
's sa
lary
bas
ed o
n th
e em
ploy
ee's
tota
l tim
e ch
arge
d to
all
activ
ities
. Lea
ve ta
ken
was
exc
lude
d fr
om th
e to
tal t
ime
to a
lloca
te.
Page 91 of 108

2011
2010
2009
2008
2007
2006
2005
2004
2003
2002
Agin
g se
rvic
es40
,075
.20
38,5
12.2
5
38,4
91.0
5
41,9
90.4
1
32,9
89.7
0
34,5
27.0
0
31,8
37.2
5
29,4
59.0
0
28,8
23.1
5
25,0
85.5
0
Regi
onal
tran
spor
tatio
n se
rvic
es28
4.75
428.
00
663.
50
774.
00
887.
50
885.
75
895.
00
846.
75
1,69
9.50
-
Plan
ning
and
zoni
ng se
rvic
es5,
347.
50
5,48
2.05
3,71
5.75
4,95
9.25
6,20
3.00
5,03
3.50
6,87
0.00
4,96
4.25
5,73
0.75
5,43
7.00
Loca
l gov
ernm
ent s
ervi
ces
8,75
9.75
8,
473.
50
6,
561.
75
7,
253.
70
6,
077.
00
6
,220
.25
5,17
6.75
6,3
40.7
5
6,
524.
45
5
,856
.75
Econ
omic
dev
elop
men
t sup
port
serv
ices
1,83
1.75
1,
979.
50
1,
324.
00
1,
597.
00
2,
516.
00
1
,571
.50
1,25
9.75
1,9
04.0
0
2,
140.
25
2
,978
.00
Man
agem
ent o
f loc
al d
evel
opm
ent c
ompa
nies
6,40
4.50
6,
641.
00
6,
453.
75
6,
642.
75
5,
317.
75
4,
730.
50
5,
026.
75
4,
811.
25
6,
343.
75
6,
456.
00
Indi
rect
cos
t fun
d14
,289
.00
12,9
59.0
0
13,9
30.2
5
13,7
18.2
5
12,3
20.5
0
11,9
50.5
0
11,9
95.5
0
12,2
01.2
5
12,8
84.2
5
14,6
98.5
0
GIS
and
map
ping
serv
ices
-
-
26
1.25
1,
751.
50
1,
212.
75
1,
878.
75
1,
572.
75
3,
608.
75
3,
712.
00
3,
013.
50
Tota
l cha
rgea
ble
hour
s 76
,992
.45
74,4
75.3
0
71,4
01.3
0
78,6
86.8
6
67,5
24.2
0
66,7
97.7
5
64,6
33.7
5
64,1
36.0
0
67,8
58.1
0
63,5
25.2
5
Paid
tim
e of
f6,
500.
88
6,11
2.94
7,20
3.68
6,64
8.72
6,01
8.00
5,50
8.96
5,14
4.29
4,30
0.45
4,16
3.50
2,61
0.10
Holid
ay ti
me
off
3,08
5.20
3,
041.
80
2,
878.
40
3,
081.
10
2,
712.
20
2,
578.
50
2,
367.
30
2,
452.
00
2,
623.
50
2,
353.
40
Sick
leav
e tim
e43
.50
78
.50
89.5
0
30
.00
50.0
0
12
5.75
24
4.00
-
-
2,
059.
05
Oth
er le
ave
96.0
0
133.
20
170.
50
204.
00
63.7
0
26
3.45
68
.00
677.
25
1,22
0.71
1,30
6.75
Tota
l non
-cha
rgea
ble
hour
s9,
725.
58
9,36
6.44
10,3
42.0
8
9,96
3.82
8,84
3.90
8,47
6.66
7,82
3.59
7,42
9.70
8,00
7.71
8,32
9.30
Tota
l sta
ff ho
urs
86,7
18.0
3
83
,841
.74
81
,743
.38
88
,650
.68
76
,368
.10
75
,274
.41
72
,457
.34
71
,565
.70
75
,865
.81
71
,854
.55
Full-
Tim
e Eq
uiva
lent
Sta
ff by
Fis
cal Y
ear
2011
2010
2009
2008
2007
2006
2005
2004
2003
2002
Agin
g se
rvic
es19
.27
18
.52
18.5
1
20
.19
15.8
6
16
.60
15.3
1
14
.16
13.8
6
12
.06
Regi
onal
tran
spor
tatio
n se
rvic
es0.
14
0.
21
0.32
0.
37
0.43
0.
43
0.
43
0.41
0.
82
NC
Plan
ning
and
zoni
ng se
rvic
es2.
57
2.
64
1.79
2.
38
2.98
2.
42
3.
30
2.39
2.
76
2.61
Loca
l gov
ernm
ent s
ervi
ces
4.21
4.07
3.
15
3.49
2.
92
2.99
2.49
3.
05
3.14
2.
82
Econ
omic
dev
elop
men
t sup
port
serv
ices
0.88
0.95
0.
64
0.77
1.
21
0.76
0.61
0.
92
1.03
1.
43
Man
agem
ent o
f loc
al d
evel
opm
ent c
ompa
nies
3.08
3.19
3.
10
3.19
2.
56
2.27
2.42
2.
31
3.05
3.
10
Indi
rect
cos
t fun
d6.
87
6.
23
6.70
6.
60
5.92
5.
75
5.
77
5.87
6.
19
7.07
GIS
and
map
ping
serv
ices
NC
NC
0.13
0.
84
0.58
0.
90
0.
76
1.73
1.
78
1.45
Tota
l ful
l-tim
e eq
uiva
lent
s37
.02
35
.81
34.3
4
37
.83
32.4
6
32
.12
31.0
9
30
.84
32.6
3
30
.54
Paid
tim
e of
f3.
13
2.
94
3.46
3.
20
2.89
2.
65
2.
47
2.07
2.
00
1.25
Holid
ay ti
me
off
1.48
1.46
1.
38
1.48
1.
30
1.24
1.14
1.
18
1.26
1.
13
Sick
leav
e tim
e0.
02
0.
04
0.04
0.
01
0.02
0.
06
0.
12
-
-
0.99
Oth
er le
ave
0.05
0.06
0.
08
0.10
0.
03
0.13
0.03
0.
33
0.59
0.
63
Tota
l ful
l-tim
e eq
uiva
lent
s4.
68
4.
50
4.96
4.
79
4.24
4.
08
3.
76
3.58
3.
85
4.00
To
tal f
ull-t
ime
equi
vale
nts
41.7
0
40.3
1
39
.30
42.6
2
36
.70
36.2
0
34
.85
34.4
2
36
.48
34.5
4
Full-
time
equi
vale
nt is
com
pute
d by
div
idin
g th
e nu
mbe
r of h
ours
by
2080
hou
rs.
CEN
TRAL
SAV
ANN
AH R
IVER
ARE
A RE
GIO
NAL
CO
MM
ISSI
ON
SOU
RCE:
Em
ploy
ee ti
me
reco
rds.
Staf
f Hou
rs b
y Fi
scal
Yea
r
(Una
udite
d)LA
ST T
EN F
ISCA
L YE
ARS
CHAR
GEAB
LE A
ND
NO
N-C
HARG
EABL
E ST
AFF
HOU
RS A
ND
FULL
TIM
E EQ
UIV
ALEN
TS B
Y AC
TIVI
TY
Page 92 of 108

# of
loan
s pa
ckag
ed o
r ap
prov
ed#
disc
ontin
ued
# Cl
osed
# ca
rrie
d fo
rwar
dSB
A 50
4's
SBA
7(a)
's
pack
aged
CSRA
Res
ourc
e De
velo
pmen
t Age
ncy
CSRA
Rur
al
Lend
ing
Auth
ority
Mic
ro L
oan
Prog
ram
FY 2
011
50
1
55
49
38
1
1
7
3
FY
201
054
1
37
55
45
1
3
4
1
FY 2
009
32
-
46
32
22
-
5
4
1
FY
200
851
5
50
46
37
2
4
5
2
FY 2
007
53
3
50
50
43
-
4
5
1
FY
200
652
2
34
50
37
1
4
9
1
FY 2
005
39
5
42
34
27
1
3
7
1
FY
200
444
2
38
42
21
3
8
9
1
FY 2
003
41
3
27
38
16
4
3
11
4
FY 2
002
29
2
39
27
8
6
6
9
N/A
FY 2
001
43
4
38
39
23
6
5
8
N
/AFY
200
040
2
32
38
20
1
3
16
N
/AFY
199
936
4
30
32
16
1
5
14
N
/AFY
199
833
3
31
30
16
3
6
5
N/A
FY 1
997
33
2
31
31
22
1
2
4
N
/A
Sour
ce: C
SRA
Regi
onal
Com
mis
sion
Ann
ual R
epor
ts
CEN
TRAL
SAV
ANN
AH R
IVER
ARE
A RE
GIO
NAL
CO
MM
ISSI
ON
- CO
MPO
NEN
T U
NIT
Sd/
b/a
CSRA
BU
SIN
ESS
LEN
DIN
G
(Una
udite
d)
Loan
Vol
ume
Type
of L
oan
Pack
aged
or A
ppro
ved
SUM
MAR
Y O
F LO
AN A
CTIV
ITY
BY F
ISCA
L YE
AR
Page 93 of 108
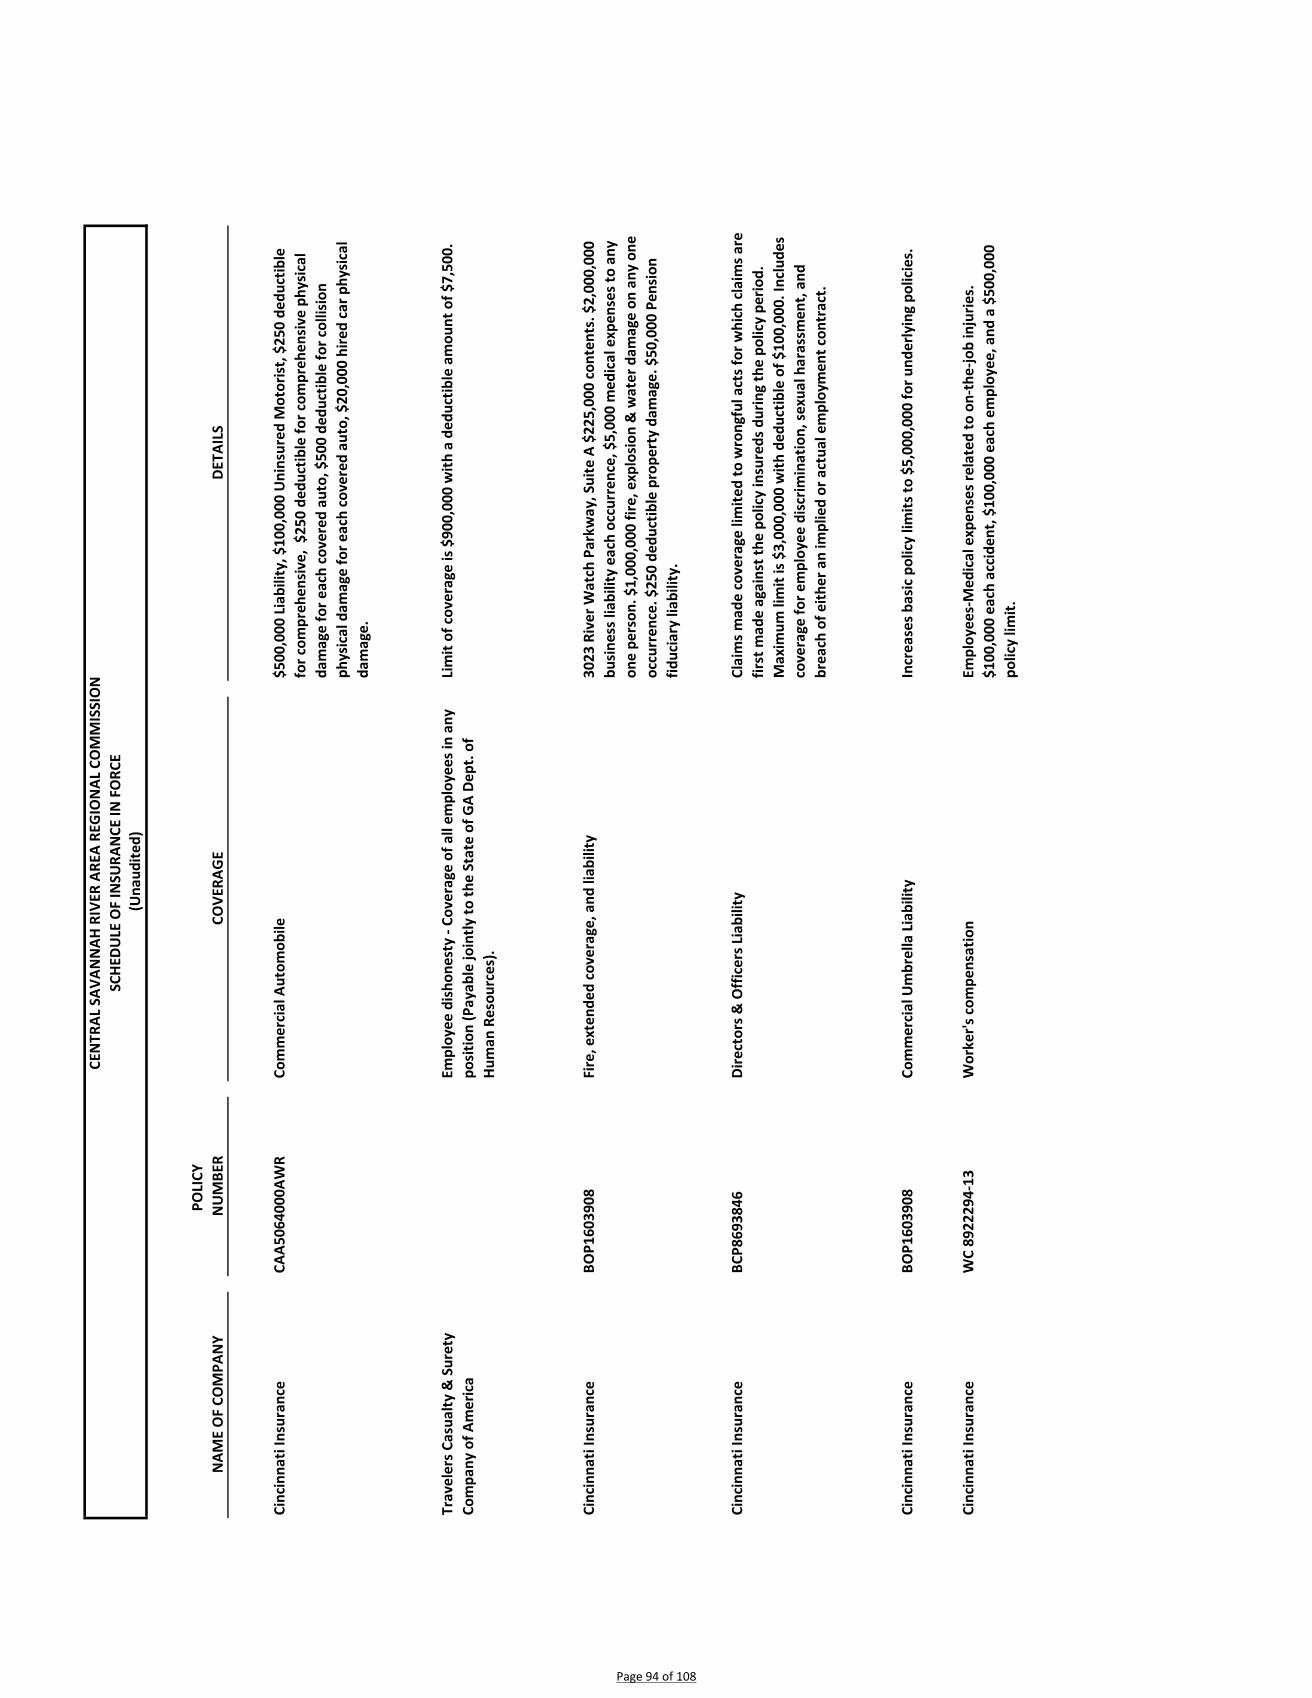
POLI
CY
NAM
E O
F CO
MPA
NY
NU
MBE
RCO
VERA
GE
DETA
ILS
Cinc
inna
ti In
sura
nce
CAA5
0640
00AW
RCo
mm
erci
al A
utom
obile
$5
00,0
00 L
iabi
lity,
$10
0,00
0 U
nins
ured
Mot
oris
t, $2
50 d
educ
tible
fo
r com
preh
ensi
ve,
$250
ded
uctib
le fo
r com
preh
ensi
ve p
hysi
cal
dam
age
for e
ach
cove
red
auto
, $50
0 de
duct
ible
for c
ollis
ion
phys
ical
dam
age
for e
ach
cove
red
auto
, $20
,000
hire
d ca
r phy
sica
l da
mag
e.
Trav
eler
s Cas
ualty
& S
uret
y Co
mpa
ny o
f Am
eric
aEm
ploy
ee d
isho
nest
y - C
over
age
of a
ll em
ploy
ees i
n an
y po
sitio
n (P
ayab
le jo
intly
to th
e St
ate
of G
A De
pt. o
f Hu
man
Res
ourc
es).
Lim
it of
cov
erag
e is
$90
0,00
0 w
ith a
ded
uctib
le a
mou
nt o
f $7,
500.
Cinc
inna
ti In
sura
nce
BOP1
6039
08Fi
re, e
xten
ded
cove
rage
, and
liab
ility
3023
Riv
er W
atch
Par
kway
, Sui
te A
$22
5,00
0 co
nten
ts. $
2,00
0,00
0 bu
sine
ss li
abili
ty e
ach
occu
rren
ce, $
5,00
0 m
edic
al e
xpen
ses t
o an
y on
e pe
rson
. $1,
000,
000
fire,
exp
losi
on &
wat
er d
amag
e on
any
one
oc
curr
ence
. $25
0 de
duct
ible
pro
pert
y da
mag
e. $
50,0
00 P
ensi
on
fiduc
iary
liab
ility
.
Ci
ncin
nati
Insu
ranc
eBC
P869
3846
Dire
ctor
s & O
ffic
ers L
iabi
lity
Clai
ms m
ade
cove
rage
lim
ited
to w
rong
ful a
cts f
or w
hich
cla
ims a
re
first
mad
e ag
ains
t the
pol
icy
insu
reds
dur
ing
the
polic
y pe
riod.
M
axim
um li
mit
is $
3,00
0,00
0 w
ith d
educ
tible
of $
100,
000.
Incl
udes
co
vera
ge fo
r em
ploy
ee d
iscr
imin
atio
n, se
xual
har
assm
ent,
and
brea
ch o
f eith
er a
n im
plie
d or
act
ual e
mpl
oym
ent c
ontr
act.
Cinc
inna
ti In
sura
nce
BOP1
6039
08Co
mm
erci
al U
mbr
ella
Lia
bilit
y In
crea
ses b
asic
pol
icy
limits
to $
5,00
0,00
0 fo
r und
erly
ing
polic
ies.
Cinc
inna
ti In
sura
nce
WC
8922
294-
13W
orke
r's c
ompe
nsat
ion
Empl
oyee
s-M
edic
al e
xpen
ses r
elat
ed to
on-
the-
job
inju
ries.
$1
00,0
00 e
ach
acci
dent
, $10
0,00
0 ea
ch e
mpl
oyee
, and
a $
500,
000
polic
y lim
it.
CEN
TRAL
SAV
ANN
AH R
IVER
ARE
A RE
GIO
NAL
CO
MM
ISSI
ON
(Una
udite
d)SC
HEDU
LE O
F IN
SURA
NCE
IN F
ORC
E
Page 94 of 108
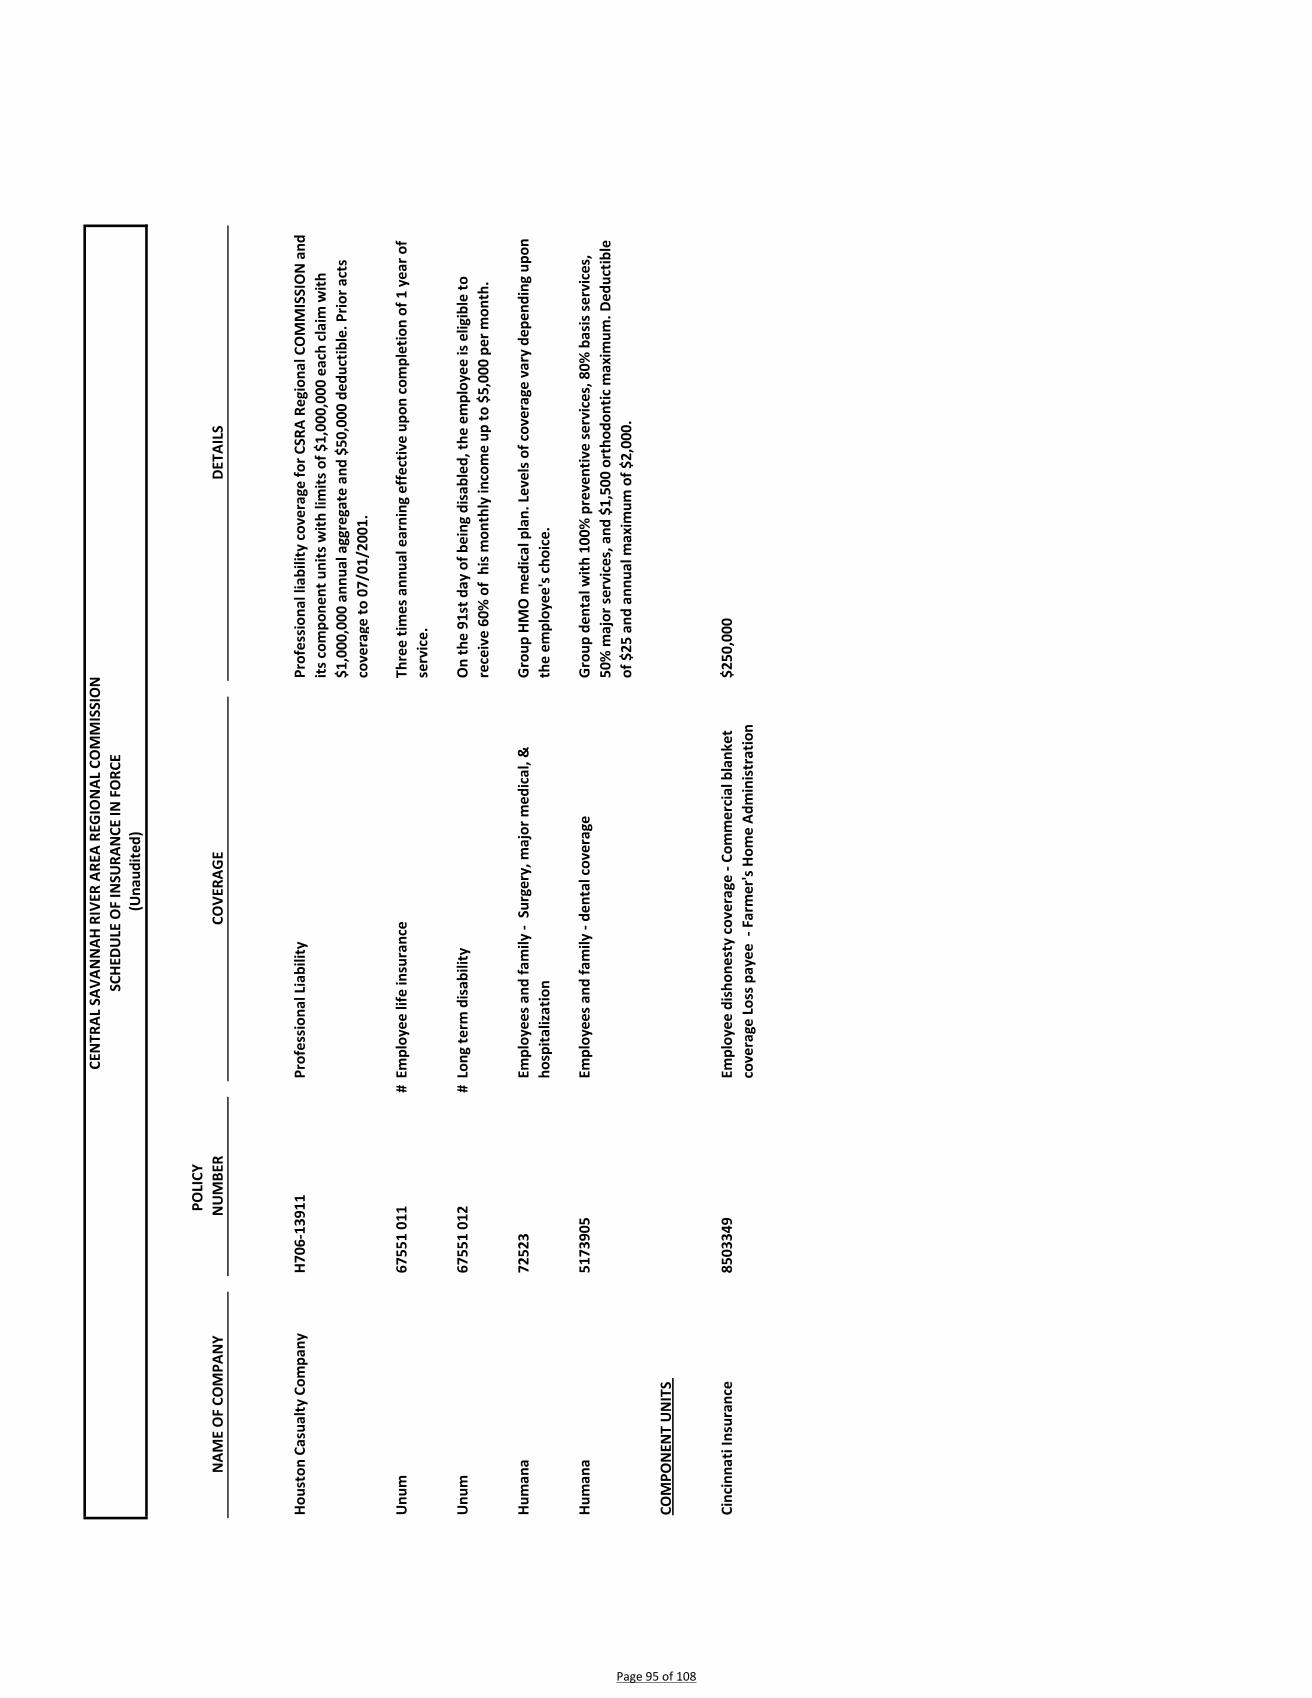
POLI
CY
NAM
E O
F CO
MPA
NY
NU
MBE
RCO
VERA
GE
DETA
ILS
CEN
TRAL
SAV
ANN
AH R
IVER
ARE
A RE
GIO
NAL
CO
MM
ISSI
ON
(Una
udite
d)SC
HEDU
LE O
F IN
SURA
NCE
IN F
ORC
E
Hous
ton
Casu
alty
Com
pany
H706
-139
11Pr
ofes
sion
al L
iabi
lity
Prof
essi
onal
liab
ility
cov
erag
e fo
r CSR
A Re
gion
al C
OM
MIS
SIO
N a
nd
its c
ompo
nent
uni
ts w
ith li
mits
of $
1,00
0,00
0 ea
ch c
laim
with
$1
,000
,000
ann
ual a
ggre
gate
and
$50
,000
ded
uctib
le. P
rior a
cts
cove
rage
to 0
7/01
/200
1.
Unu
m67
551
011
#Em
ploy
ee li
fe in
sura
nce
Thre
e tim
es a
nnua
l ear
ning
eff
ectiv
e up
on c
ompl
etio
n of
1 y
ear o
f se
rvic
e.
U
num
6755
1 01
2#
Long
term
dis
abili
tyO
n th
e 91
st d
ay o
f bei
ng d
isab
led,
the
empl
oyee
is e
ligib
le to
re
ceiv
e 60
% o
f hi
s mon
thly
inco
me
up to
$5,
000
per m
onth
.
Hum
ana
7252
3Em
ploy
ees a
nd fa
mily
- S
urge
ry, m
ajor
med
ical
, &
hosp
italiz
atio
nG
roup
HM
O m
edic
al p
lan.
Lev
els o
f cov
erag
e va
ry d
epen
ding
upo
n th
e em
ploy
ee's
choi
ce.
Hum
ana
5173
905
Empl
oyee
s and
fam
ily -
dent
al c
over
age
Gro
up d
enta
l with
100
% p
reve
ntiv
e se
rvic
es, 8
0% b
asis
serv
ices
, 50
% m
ajor
serv
ices
, and
$1,
500
orth
odon
tic m
axim
um. D
educ
tible
of
$25
and
ann
ual m
axim
um o
f $2,
000.
COM
PON
ENT
UN
ITS
Cinc
inna
ti In
sura
nce
8503
349
Empl
oyee
dis
hone
sty
cove
rage
- Co
mm
erci
al b
lank
et
cove
rage
Los
s pay
ee -
Far
mer
's Ho
me
Adm
inis
trat
ion
$250
,000
Page 95 of 108

2010
2009
2007
2006
2005
2004
2003
2002
2001
2000
Burk
e23
,316
22
,797
22,7
54
22
,986
23,1
54
23
,086
22,8
78
22
,777
22,7
25
22
,243
Co
lum
bia
124,
053
11
2,95
8
109,
100
10
6,88
7
103,
490
10
0,56
4
97,0
50
94
,644
91,8
32
89
,287
G
lasc
ock
3,08
2
2,
801
2,77
1
2,72
0
2,
670
2,
663
2,
596
2,
596
2,56
3
2,55
6
H
anco
ck9,
429
9,21
9
9,
568
9,
677
9,71
3
9,81
4
9,93
3
9,99
3
10
,032
10,0
74
Jeffe
rson
16,9
30
16,4
78
16
,545
16,7
68
16
,783
16,8
87
16
,922
17,0
89
17
,149
17,2
63
Jenk
ins
8,34
0
8,
450
8,59
5
8,72
5
8,
715
8,
632
8,
675
8,
647
8,64
5
8,57
5
Li
ncol
n7,
996
7,91
3
8,
098
8,
257
8,28
3
8,35
0
8,48
3
8,45
1
8,
441
8,
348
McD
uffie
21
,875
21
,862
21,5
51
21
,917
21,6
80
21
,536
21,3
56
21
,285
21,3
21
21
,232
Ri
chm
ond
200,
549
19
9,76
8
197,
372
19
4,39
8
194,
135
19
5,53
6
196,
591
19
7,85
4
198,
867
19
9,77
5
Talia
ferr
o1,
717
1,81
2
1,
884
1,
877
1,83
5
1,87
8
1,92
9
2,00
1
2,
012
2,
077
War
ren
5,83
4
5,
755
5,90
8
5,94
9
6,
067
6,
147
6,
157
6,
241
6,31
8
6,33
6
W
ashi
ngto
n21
,187
20
,879
20,9
37
20
,723
19,9
98
20
,953
20,9
38
20
,847
21,1
11
21
,176
W
ilkes
10
,593
10
,268
10,2
62
10
,687
10,6
52
10
,657
10,6
67
10
,546
10,4
80
10
,468
454,
901
44
0,96
0
435,
345
43
1,57
1
427,
175
42
6,70
3
424,
175
42
2,97
1
421,
496
41
9,41
0
CEN
TRAL
SAV
ANN
AH R
IVER
ARE
A RE
GIO
NAL
CO
MM
ISSI
ON
POPU
LATI
ON
OF
COU
NTI
ES IN
THE
CEN
TRAL
SAV
ANN
AH R
IVER
ARE
A (U
naud
ited)
SOU
RCE:
US
Cens
us B
urea
u an
d CS
RA R
egio
nal C
omm
issi
on. D
ata
not a
vaila
ble
for
2008
.
Page 96 of 108
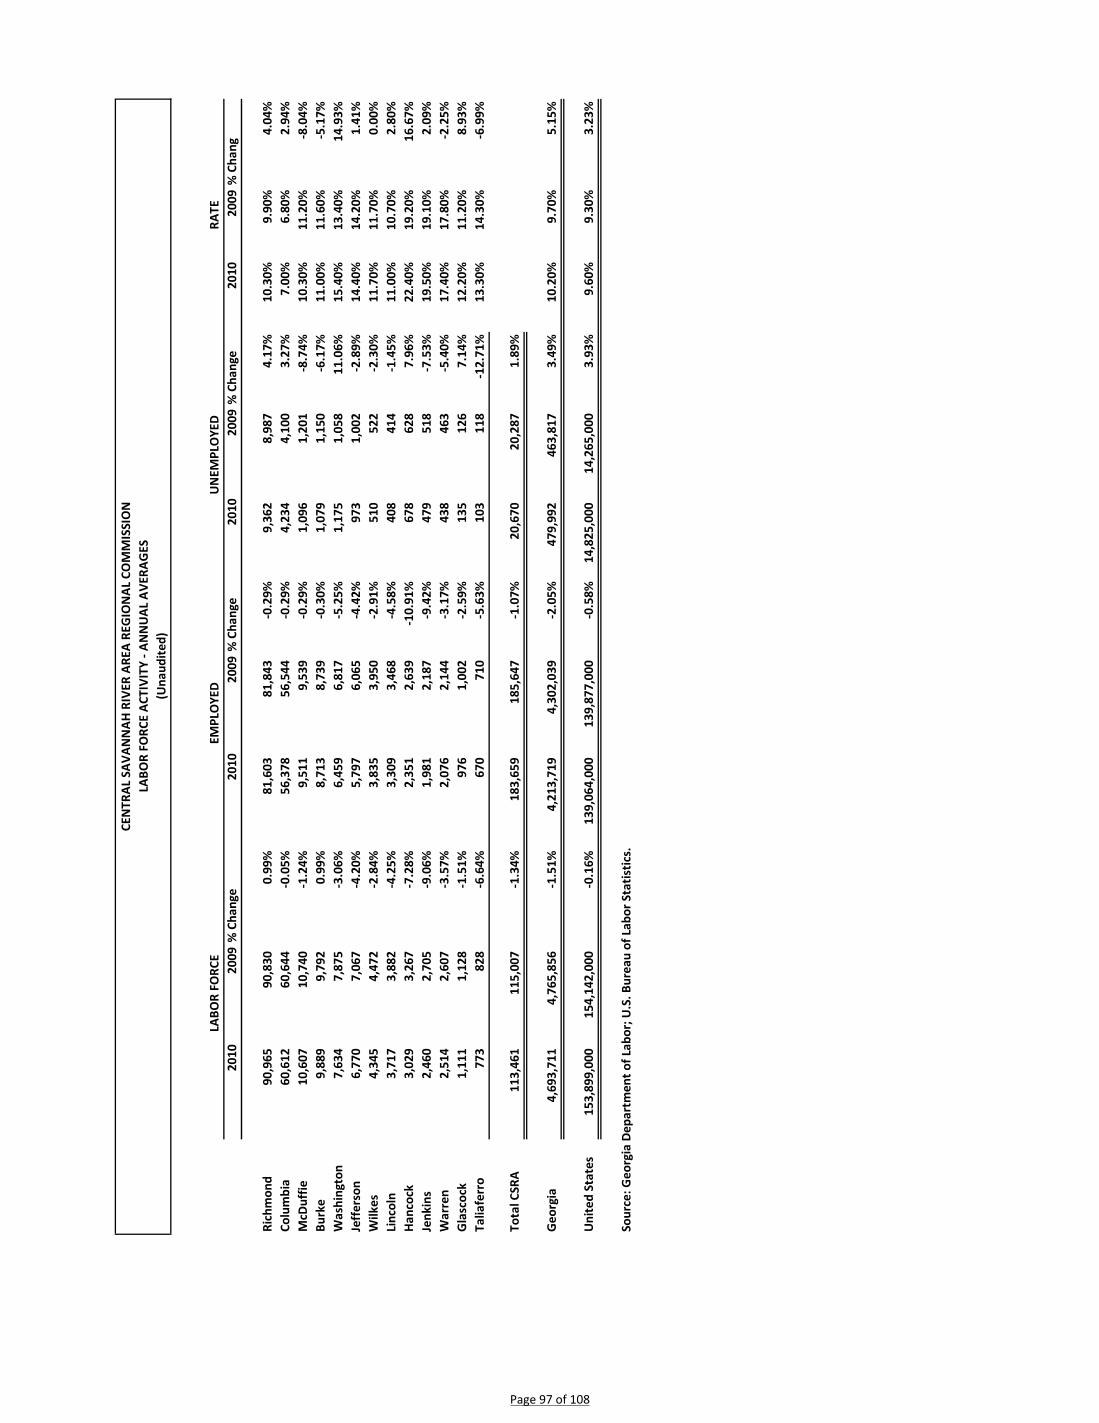
2010
2009
% C
hang
e20
1020
09%
Cha
nge
2010
2009
% C
hang
e20
1020
09%
Cha
ng
Rich
mon
d90
,965
90,8
30
0.
99%
81,6
03
81
,843
-0.2
9%9,
362
8,
987
4.17
%10
.30%
9.90
%4.
04%
Colu
mbi
a60
,612
60,6
44
-0
.05%
56,3
78
56
,544
-0.2
9%4,
234
4,
100
3.27
%7.
00%
6.80
%2.
94%
McD
uffie
10,6
07
10
,740
-1.2
4%9,
511
9,
539
-0
.29%
1,09
6
1,20
1
-8
.74%
10.3
0%11
.20%
-8.0
4%Bu
rke
9,88
9
9,79
2
0.99
%8,
713
8,
739
-0
.30%
1,07
9
1,15
0
-6
.17%
11.0
0%11
.60%
-5.1
7%W
ashi
ngto
n7,
634
7,
875
-3
.06%
6,45
9
6,81
7
-5.2
5%1,
175
1,
058
11.0
6%15
.40%
13.4
0%14
.93%
Jeff
erso
n6,
770
7,
067
-4
.20%
5,79
7
6,06
5
-4.4
2%97
3
1,
002
-2.8
9%14
.40%
14.2
0%1.
41%
Wilk
es4,
345
4,
472
-2
.84%
3,83
5
3,95
0
-2.9
1%51
0
52
2
-2.3
0%11
.70%
11.7
0%0.
00%
Linc
oln
3,71
7
3,88
2
-4.2
5%3,
309
3,
468
-4
.58%
408
414
-1
.45%
11.0
0%10
.70%
2.80
%Ha
ncoc
k3,
029
3,
267
-7
.28%
2,35
1
2,63
9
-10.
91%
678
628
7.
96%
22.4
0%19
.20%
16.6
7%Je
nkin
s2,
460
2,
705
-9
.06%
1,98
1
2,18
7
-9.4
2%47
9
51
8
-7.5
3%19
.50%
19.1
0%2.
09%
War
ren
2,51
4
2,60
7
-3.5
7%2,
076
2,
144
-3
.17%
438
463
-5
.40%
17.4
0%17
.80%
-2.2
5%G
lasc
ock
1,11
1
1,12
8
-1.5
1%97
6
1,
002
-2
.59%
135
126
7.
14%
12.2
0%11
.20%
8.93
%Ta
liafe
rro
773
828
-6.6
4%67
0
71
0
-5
.63%
103
118
-1
2.71
%13
.30%
14.3
0%-6
.99%
Tota
l CSR
A11
3,46
1
115,
007
-1
.34%
183,
659
18
5,64
7
-1.0
7%20
,670
20,2
87
1.89
%
Geo
rgia
4,69
3,71
1
4,
765,
856
-1.5
1%4,
213,
719
4,30
2,03
9
-2
.05%
479,
992
46
3,81
7
3.
49%
10.2
0%9.
70%
5.15
%
Uni
ted
Stat
es15
3,89
9,00
0
15
4,14
2,00
0
-0
.16%
139,
064,
000
139,
877,
000
-0.5
8%14
,825
,000
14,2
65,0
00
3.
93%
9.60
%9.
30%
3.23
%
Sour
ce: G
eorg
ia D
epar
tmen
t of L
abor
; U.S
. Bur
eau
of L
abor
Sta
tistic
s.
LABO
R FO
RCE
EMPL
OYE
DU
NEM
PLO
YED
RATE
CEN
TRAL
SAV
ANN
AH R
IVER
ARE
A RE
GIO
NAL
CO
MM
ISSI
ON
LABO
R FO
RCE
ACTI
VITY
- AN
NU
AL A
VERA
GES
(Una
udite
d)
Page 97 of 108
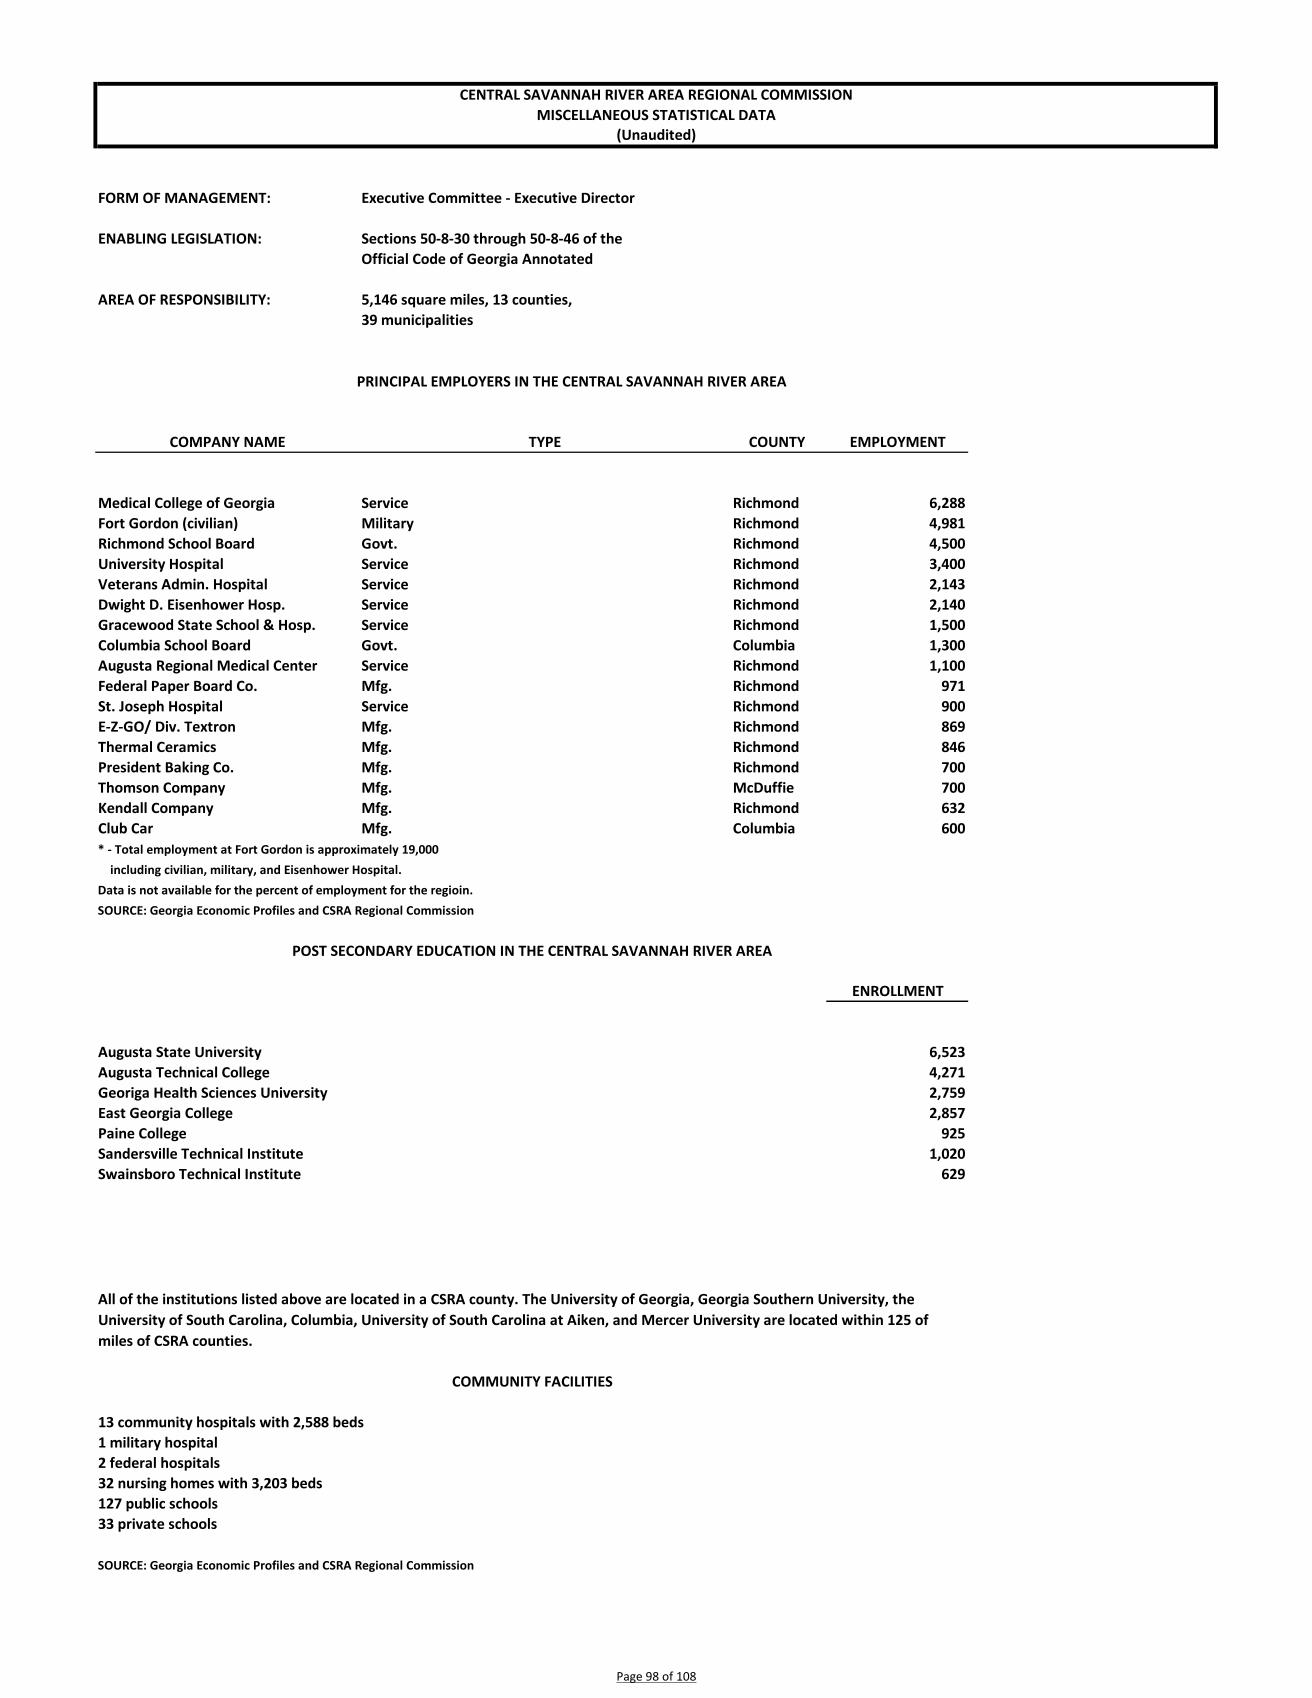
FORM OF MANAGEMENT: Executive Committee - Executive Director
ENABLING LEGISLATION: Sections 50-8-30 through 50-8-46 of the Official Code of Georgia Annotated
AREA OF RESPONSIBILITY: 5,146 square miles, 13 counties,39 municipalities
PRINCIPAL EMPLOYERS IN THE CENTRAL SAVANNAH RIVER AREA
COMPANY NAME TYPE COUNTY EMPLOYMENT
Medical College of Georgia Service Richmond 6,288Fort Gordon (civilian) Military Richmond 4,981Richmond School Board Govt. Richmond 4,500University Hospital Service Richmond 3,400Veterans Admin. Hospital Service Richmond 2,143Dwight D. Eisenhower Hosp. Service Richmond 2,140Gracewood State School & Hosp. Service Richmond 1,500Columbia School Board Govt. Columbia 1,300Augusta Regional Medical Center Service Richmond 1,100Federal Paper Board Co. Mfg. Richmond 971St. Joseph Hospital Service Richmond 900E-Z-GO/ Div. Textron Mfg. Richmond 869Thermal Ceramics Mfg. Richmond 846President Baking Co. Mfg. Richmond 700Thomson Company Mfg. McDuffie 700Kendall Company Mfg. Richmond 632Club Car Mfg. Columbia 600* - Total employment at Fort Gordon is approximately 19,000 including civilian, military, and Eisenhower Hospital.Data is not available for the percent of employment for the regioin. SOURCE: Georgia Economic Profiles and CSRA Regional Commission
POST SECONDARY EDUCATION IN THE CENTRAL SAVANNAH RIVER AREA
ENROLLMENT
Augusta State University 6,523Augusta Technical College 4,271Georiga Health Sciences University 2,759East Georgia College 2,857Paine College 925Sandersville Technical Institute 1,020Swainsboro Technical Institute 629
COMMUNITY FACILITIES
13 community hospitals with 2,588 beds1 military hospital2 federal hospitals32 nursing homes with 3,203 beds127 public schools33 private schools
SOURCE: Georgia Economic Profiles and CSRA Regional Commission
All of the institutions listed above are located in a CSRA county. The University of Georgia, Georgia Southern University, the University of South Carolina, Columbia, University of South Carolina at Aiken, and Mercer University are located within 125 of miles of CSRA counties.
CENTRAL SAVANNAH RIVER AREA REGIONAL COMMISSIONMISCELLANEOUS STATISTICAL DATA
(Unaudited)
Page 98 of 108
SINGLE AUDIT SECTION

[This page is intentionally blank.]

FED
ERAL
CF
DA
NU
MBE
RPA
SS-T
HRO
UG
H G
RAN
TOR'
S N
UM
BER
FED
ERAL
REV
ENU
ES
EXPE
ND
EDPA
SS T
HRO
UG
H T
O
SUB
RECI
PIEN
TS
U. S
. DEP
ARTM
ENT
OF
COM
MER
CE
Dire
ct P
rogr
ams:
Econ
omic
Dev
elop
men
t Sup
port
for P
lann
ing
Org
aniz
atio
ns11
.302
04-8
3-06
002-
0170
,296
$
-
$
Econ
omic
Adj
ustm
ent A
ssis
tanc
e, P
art o
f Pub
lic W
orks
& E
cono
mic
Dev
elop
men
t Clu
ster
11.3
0704
-69-
0613
712
,911
-
Econ
omic
Adj
ustm
ent A
ssis
tanc
e, P
art o
f Pub
lic W
orks
& E
cono
mic
Dev
elop
men
t Clu
ster
- N
ote
3.A
11.3
07N
ot A
ssig
ned
2,12
7,62
0
-
Tota
l Eco
nom
ic A
djus
tmen
t Ass
ista
nce
2,14
0,53
1
-
Tota
l U. S
. Dep
artm
ent o
f Com
mer
ce2,
210,
827
-
U. S
. DEP
ARTM
ENT
OF
HEA
LTH
AN
D H
UM
AN S
ERVI
CES
Agin
g Ti
tle II
I, Pr
t B: G
rant
s for
Sup
port
Ser
vice
s & S
r Cen
ters
93.0
4442
7-37
3-00
0000
4858
942,
778
639,
059
Agin
g Ti
tle II
I Prt
C: N
utrit
ion
Serv
ices
93
.045
427-
373-
0000
0048
5870
9,27
8
70
9,27
8
Nut
ritio
n Se
rvic
es In
cent
ive
Prog
ram
93.0
5342
7-37
3-00
0000
4858
122,
267
122,
267
Agin
g Cl
uste
r Tot
al
1,77
4,32
3
1,47
0,60
4
Agin
g Ti
tle II
I, Pa
rt D
, Dis
ease
Pre
vent
ion
& H
ealth
Pro
mot
ion
Serv
ices
93.0
4342
7-37
3-00
0000
4858
31,5
68
31,5
68
Agin
g Ti
tle V
II Ch
pt. 2
: Lon
g Te
rm C
are
Om
buds
man
Old
er In
divi
dual
s 93
.042
427-
373-
0000
0048
5834
,912
34
,912
Alzh
eim
er's
Dis
ease
Dem
onst
ratio
n G
rant
s to
Stat
es93
.051
4270
0-37
3-00
0000
7359
10,6
76
10,6
76
Nat
iona
l Car
egiv
er S
uppo
rt (I
II-E)
93.0
5242
7-37
3-00
0000
4858
245,
138
142,
021
Soci
al S
ervi
ce B
lock
Gra
nt
93.6
6742
7-37
3-00
0000
4858
141,
373
91,3
76
ARRA
- Co
mm
uniti
es P
uttin
g Pr
even
tion
to W
ork:
Chr
onic
Dis
ease
Sel
f Mng
t.93
.725
427-
93-A
RRA0
9012
-99
27,4
83
-
Com
mun
ity C
are
Serv
ices
Pro
gram
, Par
t of M
edic
aid
Clus
ter
93.7
7842
7-37
3-00
0000
4858
918,
252
660,
816
Hea
lth C
are
Fina
ncin
g Re
sear
ch, D
emon
stra
tions
, and
Eva
luat
ions
93.7
7942
7-37
3-00
0000
4858
189,
136
-
Tota
l U.S
. Hea
lth a
nd H
uman
Ser
vice
s3,
372,
861
2,
441,
973
Cont
inue
d on
nex
t pag
e.
CEN
TRAL
SAV
ANN
AH R
IVER
ARE
A RE
GIO
NAL
DEV
ELO
PMEN
T CO
MM
ISSI
ON
SCH
EDU
LE O
F EX
PEN
DIT
URE
S O
F FE
DER
AL A
WAR
DS
FOR
THE
FISC
AL Y
EAR
END
ED JU
NE
30, 2
011
GRA
NTO
R /
PRO
GRA
M T
ITLE
Agin
g Cl
uste
r:
Pass
ed T
hrou
gh G
eorg
ia D
epar
tmen
t of H
uman
Res
ourc
es (D
HR)
:
Page 99 of 108

FED
ERAL
CF
DA
NU
MBE
RPA
SS-T
HRO
UG
H G
RAN
TOR'
S N
UM
BER
FED
ERAL
REV
ENU
ES
EXPE
ND
EDPA
SS T
HRO
UG
H T
O
SUB
RECI
PIEN
TS
CEN
TRAL
SAV
ANN
AH R
IVER
ARE
A RE
GIO
NAL
DEV
ELO
PMEN
T CO
MM
ISSI
ON
SCH
EDU
LE O
F EX
PEN
DIT
URE
S O
F FE
DER
AL A
WAR
DS
FOR
THE
FISC
AL Y
EAR
END
ED JU
NE
30, 2
011
GRA
NTO
R /
PRO
GRA
M T
ITLE
U. S
. DEP
ARTM
ENT
OF
TRAN
SPO
RTAT
ION
Plan
ning
Gra
nt, H
ighw
ay P
lann
ing
& C
onst
ruct
ion
Clus
ter
20.2
05ST
P-00
09-0
0(32
5)31
,089
$
-
$
Tota
l U.S
. Dep
artm
ent o
f Tra
nspo
rtat
ion
31,0
89
-
U. S
. DEP
ARTM
ENT
OF
ENVI
RON
MEN
TAL
PRO
TECT
ION
AG
ENCY
Wat
er Q
ualit
y M
anag
emen
t Pla
nnin
g66
.454
Not
Ass
igne
d16
,508
-
Tota
l U.S
. Dep
artm
ent o
f Env
ironm
enta
l Pro
tect
ion
Agen
cy16
,508
-
U. S
. DEP
ARTM
ENT
OF
AGRI
CULT
URE
Inte
rmed
iary
Rel
endi
ng P
rogr
am, N
ote
3.B
10.7
67N
ot A
ssig
ned
3,06
1,55
3
-
Tota
l U.S
. Dep
artm
ent o
f Agr
icul
ture
3,06
1,55
3
-
Tota
l Fed
eral
Ass
ista
nce
8,69
2,83
8$
2,44
1,97
3$
Cont
inue
d fr
om p
revi
ous p
age.
Pass
ed T
hrou
gh G
eorg
ia D
epar
tmen
t of N
atur
al R
esou
rces
(GAD
NR)
:
Pass
ed T
hrou
gh G
eorg
ia D
epar
tmen
t of T
rans
port
atio
n (G
ADO
T):
Page 100 of 108
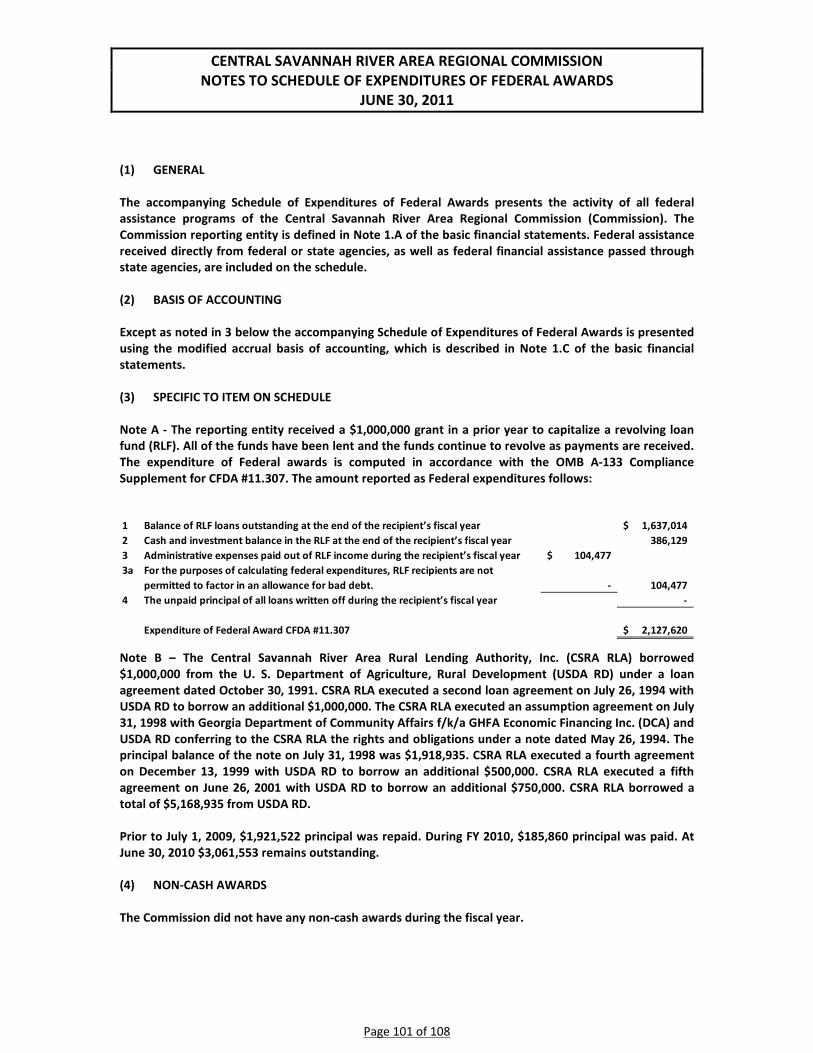
CENTRAL SAVANNAH RIVER AREA REGIONAL COMMISSION NOTES TO SCHEDULE OF EXPENDITURES OF FEDERAL AWARDS
JUNE 30, 2011 (1) GENERAL The accompanying Schedule of Expenditures of Federal Awards presents the activity of all federal assistance programs of the Central Savannah River Area Regional Commission (Commission). The Commission reporting entity is defined in Note 1.A of the basic financial statements. Federal assistance received directly from federal or state agencies, as well as federal financial assistance passed through state agencies, are included on the schedule. (2) BASIS OF ACCOUNTING Except as noted in 3 below the accompanying Schedule of Expenditures of Federal Awards is presented using the modified accrual basis of accounting, which is described in Note 1.C of the basic financial statements. (3) SPECIFIC TO ITEM ON SCHEDULE Note A - The reporting entity received a $1,000,000 grant in a prior year to capitalize a revolving loan fund (RLF). All of the funds have been lent and the funds continue to revolve as payments are received. The expenditure of Federal awards is computed in accordance with the OMB A-133 Compliance Supplement for CFDA #11.307. The amount reported as Federal expenditures follows:
Note B – The Central Savannah River Area Rural Lending Authority, Inc. (CSRA RLA) borrowed $1,000,000 from the U. S. Department of Agriculture, Rural Development (USDA RD) under a loan agreement dated October 30, 1991. CSRA RLA executed a second loan agreement on July 26, 1994 with USDA RD to borrow an additional $1,000,000. The CSRA RLA executed an assumption agreement on July 31, 1998 with Georgia Department of Community Affairs f/k/a GHFA Economic Financing Inc. (DCA) and USDA RD conferring to the CSRA RLA the rights and obligations under a note dated May 26, 1994. The principal balance of the note on July 31, 1998 was $1,918,935. CSRA RLA executed a fourth agreement on December 13, 1999 with USDA RD to borrow an additional $500,000. CSRA RLA executed a fifth agreement on June 26, 2001 with USDA RD to borrow an additional $750,000. CSRA RLA borrowed a total of $5,168,935 from USDA RD. Prior to July 1, 2009, $1,921,522 principal was repaid. During FY 2010, $185,860 principal was paid. At June 30, 2010 $3,061,553 remains outstanding. (4) NON-CASH AWARDS The Commission did not have any non-cash awards during the fiscal year.
1 Balance of RLF loans outstanding at the end of the recipient’s fiscal year 1,637,014$ 2 Cash and investment balance in the RLF at the end of the recipient’s fiscal year 386,129 3 Administrative expenses paid out of RLF income during the recipient’s fiscal year 104,477$ 3a For the purposes of calculating federal expenditures, RLF recipients are not
permitted to factor in an allowance for bad debt. - 104,477 4 The unpaid principal of all loans written off during the recipient’s fiscal year -
Expenditure of Federal Award CFDA #11.307 2,127,620$
Page 101 of 108
300 MULBERRY STREET, SUITE 300 • POST OFFICE BOX 1877 • MACON, GEORGIA 31202-1877 • 478-464-8000 • FAX 478-464-8051 • www.mjcpa.com MEMBERS OF THE AMERICAN INSTITUTE OF CERTIFIED PUBLIC ACCOUNTANTS
INDEPENDENT AUDITOR’S REPORT ON INTERNAL CONTROL OVER FINANCIAL REPORTING AND ON COMPLIANCE AND OTHER
MATTERS BASED ON AN AUDIT OF FINANCIAL STATEMENTS PERFORMED IN ACCORDANCE WITH
GOVERNMENT AUDITING STANDARDS To the Council Members Central Savannah River Area Regional Commission Augusta, Georgia We have audited the financial statements of the governmental activities, the business-type activities, the aggregate discretely presented component units, each major fund and the aggregate remaining fund information of Central Savannah River Area Regional Commission (the “Commission”), as of and for the year ended June 30, 2011, which collectively comprise the Commission’s basic financial statements and have issued our report thereon dated November 11, 2011. We conducted our audit in accordance with auditing standards generally accepted in the United States of America and the standards applicable to financial audits contained in Government Auditing Standards, issued by the Comptroller General of the United States. Internal Control Over Financial Reporting Management of the Commission is responsible for establishing and maintaining effective internal control over financial reporting. In planning and performing our audit, we considered the Commission’s internal control over financial reporting as a basis for designing our auditing procedures for the purpose of expressing our opinion on the financial statements, but not for the purpose of expressing an opinion on the effectiveness of the Commission’s internal control over financial reporting. Accordingly, we do not express an opinion on the effectiveness of the Commission’s internal control over financial reporting. A deficiency in internal control exists when the design or operation of a control does not allow management or employees, in the normal course of performing their assigned functions, to prevent, or detect and correct misstatements on a timely basis. A material weakness is a deficiency, or a combination of deficiencies, in internal control, such that there is a reasonable possibility that a material misstatement of the entity’s financial statements will not be prevented, or detected and corrected on a timely basis. Our consideration of internal control over financial reporting was for the limited purpose described in the first paragraph of this section and was not designed to identify all deficiencies in internal control over financial reporting that might be deficiencies, significant deficiencies or material weaknesses. We did not identify any deficiencies in internal control over financial reporting that we consider to be material weaknesses, as defined above.
Page 102 of 108

Compliance and Other Matters As part of obtaining reasonable assurance about whether the Commission’s financial statements are free of material misstatement, we performed tests of its compliance with certain provisions of laws, regulations, contracts, and grant agreements, noncompliance with which could have a direct and material effect on the determination of financial statement amounts. However, providing an opinion on compliance with those provisions was not an objective of our audit, and accordingly, we do not express such an opinion. The results of our tests disclosed no instances of noncompliance or other matters that are required to be reported under Government Auditing Standards. This report is intended solely for the information and use of the management and Council Members of the Central Savannah River Area Regional Commission, and federal awarding agencies and pass-through entities, and is not intended to be and should not be used by anyone other than these specified parties.
Macon, Georgia November 11, 2011
Page 103 of 108
300 MULBERRY STREET, SUITE 300 • POST OFFICE BOX 1877 • MACON, GEORGIA 31202-1877 • 478-464-8000 • FAX 478-464-8051 • www.mjcpa.com MEMBERS OF THE AMERICAN INSTITUTE OF CERTIFIED PUBLIC ACCOUNTANTS
INDEPENDENT AUDITOR’S REPORT ON COMPLIANCE WITH REQUIREMENTS THAT COULD HAVE A DIRECT AND
MATERIAL EFFECT ON EACH MAJOR PROGRAM AND ON INTERNAL CONTROL OVER COMPLIANCE IN
ACCORDANCE WITH OMB CIRCULAR A-133 To the Council Members Central Savannah River Area Regional Commission Augusta, Georgia Compliance We have audited the Central Savannah River Area Regional Commission’s (the “Commission”) compliance with the types of compliance requirements described in the OMB Circular A-133 Compliance Supplement that could have a direct and material effect on each of the Commission’s major federal programs for the year ended June 30, 2011. The Commission's major federal programs are identified in the summary of auditor’s results section of the accompanying schedule of findings and questioned costs. Compliance with the requirements of laws, regulations, contracts, and grants applicable to each of its major federal programs is the responsibility of the Commission's management. Our responsibility is to express an opinion on the Commission's compliance based on our audit. We conducted our audit of compliance in accordance with auditing standards generally accepted in the United States of America; the standards applicable to financial audits contained in Government Auditing Standards, issued by the Comptroller General of the United States; and OMB Circular A-133, Audits of States, Local Governments, and Non-Profit Organizations. Those standards and OMB Circular A-133 require that we plan and perform the audit to obtain reasonable assurance about whether noncompliance with the types of compliance requirements referred to above that could have a direct and material effect on a major federal program occurred. An audit includes examining, on a test basis, evidence about the Commission's compliance with those requirements and performing such other procedures as we considered necessary in the circumstances. We believe that our audit provides a reasonable basis for our opinion. Our audit does not provide a legal determination of the Commission's compliance with those requirements. In our opinion, the Commission complied, in all material respects, with the compliance requirements referred to above that could have a direct and material effect on each of its major federal programs for the year ended June 30, 2011.
Page 104 of 108

Internal Control Over Compliance Management of the Commission is responsible for establishing and maintaining effective internal control over compliance with the requirements of laws, regulations, contracts, and grants applicable to federal programs. In planning and performing our audit, we considered the Commission’s internal control over compliance with the requirements that could have a direct and material effect on a major federal program to determine the auditing procedures for the purpose of expressing our opinion on compliance and to test and report on internal control over compliance in accordance with OMB Circular A-133, but not for the purpose of expressing an opinion on the effectiveness of internal control over compliance. Accordingly, we do not express an opinion the effectiveness of the Commission’s internal control over compliance. A deficiency in internal control over compliance exists when the design or operation of a control over compliance does not allow management or employees, in the normal course of performing their assigned functions, to prevent, or detect and correct, noncompliance with a type of compliance requirement of a federal program on a timely basis. A material weakness in internal control over compliance is a deficiency, or combination of deficiencies, in internal control over compliance, such that there is a reasonable possibility that material noncompliance with a type of compliance requirement of a federal program will not be prevented, or detected and corrected, on a timely basis. Our consideration of internal control over compliance was for the limited purpose described in the first paragraph of this section and was not designed to identify all deficiencies in internal control over compliance that might be deficiencies, significant deficiencies, or material weaknesses. We did not identify any deficiencies in internal control over compliance that we consider to be material weaknesses, as defined above. This report is intended solely for the information and use of the management and Council Members of the Central Savannah River Area Regional Commission, and federal awarding agencies and pass-through entities and is not intended to be and should not be used by anyone other than these specified parties.
Macon, Georgia November 11, 2011
Page 105 of 108

CENTRAL SAVANNAH RIVER AREA REGIONAL COMMISSION SCHEDULE OF FINDINGS AND QUESTION COSTS
FOR THE YEAR ENDED JUNE 30, 2011
SECTION I SUMMARY OF AUDIT RESULTS
Financial Statements Type of auditor’s report issued Unqualified Internal control over financial reporting: Material weaknesses identified? yes X no Significant deficiencies identified not considered to be material weaknesses? yes X none reported Noncompliance material to financial statements noted? yes X no Federal Awards Internal Control over major programs: Material weaknesses identified? yes X no Significant deficiencies identified not considered to be material weaknesses? yes X none reported Type of auditor’s report issued on compliance for major programs Unqualified Any audit findings disclosed that are required to be reported in accordance with OMB Circular A-133, Section 510(a)? yes X no Identification of major program: CFDA Number Name of Federal Program or Cluster 11.307 Economic Adjustment Assistance 10.767 Intermediary Relending Program
Page 106 of 108
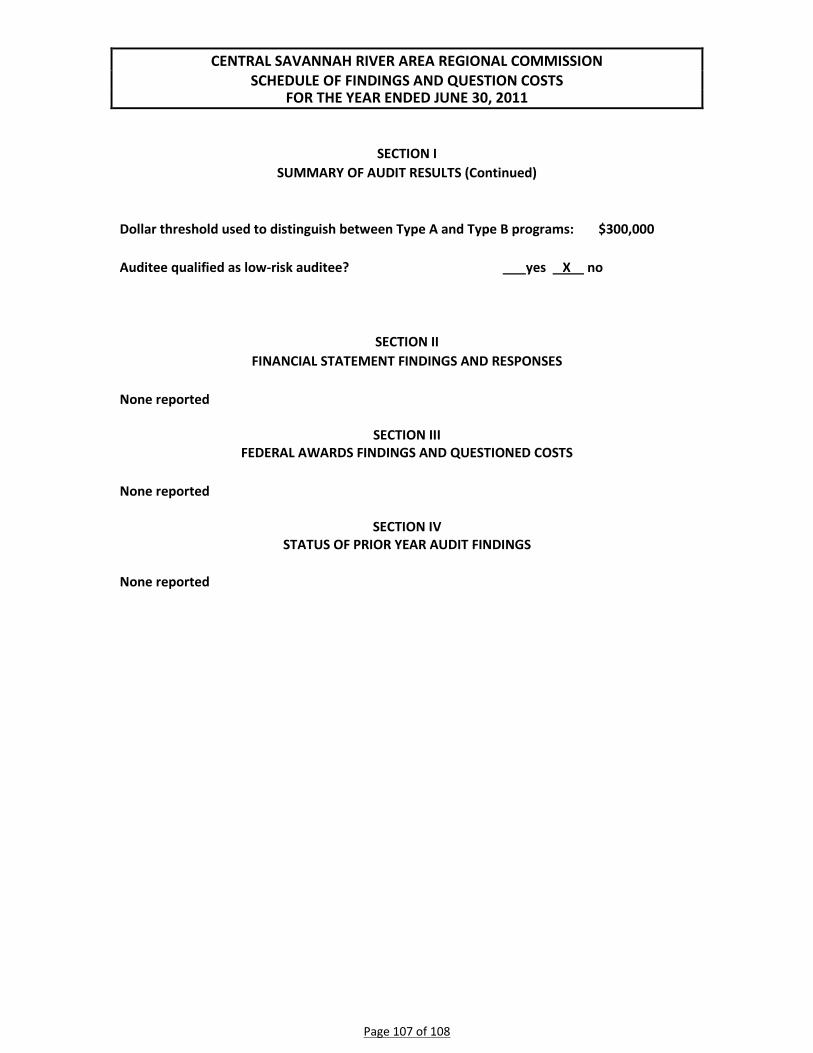
CENTRAL SAVANNAH RIVER AREA REGIONAL COMMISSION SCHEDULE OF FINDINGS AND QUESTION COSTS
FOR THE YEAR ENDED JUNE 30, 2011
SECTION I
SUMMARY OF AUDIT RESULTS (Continued)
Dollar threshold used to distinguish between Type A and Type B programs: $300,000 Auditee qualified as low-risk auditee? yes X no
SECTION II FINANCIAL STATEMENT FINDINGS AND RESPONSES
None reported
SECTION III
FEDERAL AWARDS FINDINGS AND QUESTIONED COSTS None reported
SECTION IV
STATUS OF PRIOR YEAR AUDIT FINDINGS
None reported
Page 107 of 108

[This page is intentionally blank.]
Page 108 of 108

MISSION OF THE CSRA REGIONAL COMMISSOIN
The mission of the Central Savannah River Area Regional Commission is to provide planning, management and information services to our members in a professional, ethical, cost effective and efficient manner; and to serve as a forum for addressing the needs of local government and its citizens’ needs.
CSRA Regional Commission 3023 River Watch Parkway, Suite A
Augusta, Georgia 30907
Tel: (706) 210-2000 Fax: (706) 210-2006
Please visit our web site at http://www.csrarc.ga.gov
![Savannah River Site · 2019/2/19 · für Nuklearanlagen (JEN) - located at the Forschungzentrum Jüelich (FZJ)] and the Savannah River Site, Savannah River Nuclear Solutions and/or](https://img.pdfslide.us/doc/110x75/605706d8d7c9c40ef07e6bf6/savannah-river-site-2019219-fr-nuklearanlagen-jen-located-at-the-forschungzentrum.jpg)