Embed Size (px)
Citation preview
TRIARII Strategy, Innovation, Implementation
National InventoryThe Netherlands
The Hague, 12 February 2012 Ron Overgoor, Stijn Santen, Melanie Provoost
Table of content
TRIARII BV – MAURITSKADE 33 – 2514 HD THE HAGUE – THE NETHERLANDS - TELEPHONE +31 (0)70 3283574 – FAX +31 (0)70 3284301 – [email protected]

1. Official or public reference documents on low carbon technologies in the Netherlands 31.1 Legislation 31.2 Surveys 51.3 Documentation and reports 6
2. Progress and ambitions 62.1 Transition of LCTs 62.2 Changes 132.3 Future 142.4 Dialogue 142.5 Alternative mitigation options 152.6 Levels of policy implementation 16
3. Economy 163.1 Expected implementation of LCTs 163.2 Economic effects on investments on LCTs 183.3 Rate of deployment of LCTs 193.4 Cost related issues related to LCTs 203.5 Energy dependence 20
4. Innovation and solutions 214.1 Innovative ideas and plans on LCTs 214.2 Solutions for decarbonisation 224.3 Possible limitations 24
5. Exchange and dialogue 255.1 Mutual learning 255.2 Dialogue initiatives 255.3 Concerns 265.4 Role of R&Dialogue 26
6. Stakeholders 276.1 Relevant stakeholders 276.2 Contribution of the stakeholders 286.3 Point of interest for the stakeholders 296.4 Views on transition 296.5 Possible ambassadors 30
7. Appendixes 31
1. Official or public reference documents on low carbon technologies in the Netherlands
2

This chapter will outline Dutch legislation on energy and low carbon technologies. It will point out surveys, documentations and reports written and published on energy and energy sources in current and future perspective.
1.1 Legislation There are specific laws to enable the development of low carbon technologies. Attachment 1 (table 1 - overview legislation), outlines an overview of rules and regulations implemented in the Netherlands. These are international, European, national, provincial and local laws and are distinguished per energy source.
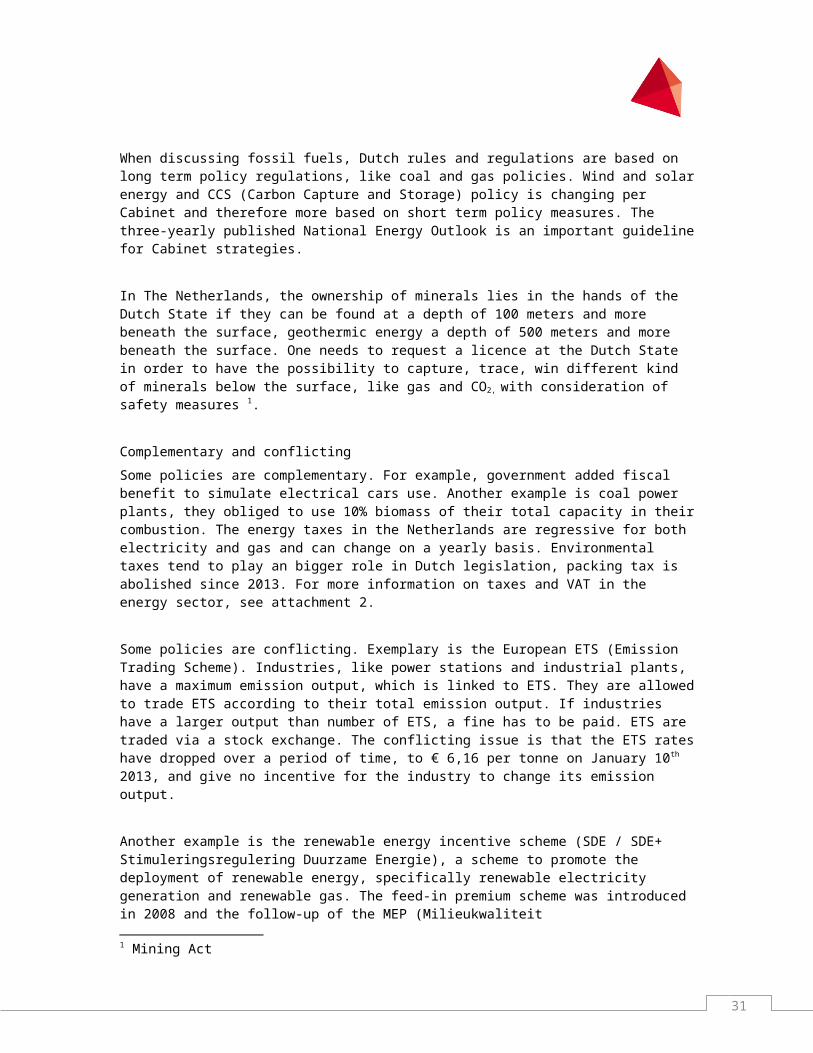
When discussing fossil fuels, Dutch rules and regulations are based on long term policy regulations, like coal and gas policies. Wind and solar energy and CCS (Carbon Capture and Storage) policy is changing per Cabinet and therefore more based on short term policy measures. The three-yearly published National Energy Outlook is an important guideline for Cabinet strategies.
In The Netherlands, the ownership of minerals lies in the hands of the Dutch State if they can be found at a depth of 100 meters and more beneath the surface, geothermic energy a depth of 500 meters and more beneath the surface. One needs to request a licence at the Dutch State in order to have the possibility to capture, trace, win different kind of minerals below the surface, like gas and CO2, with consideration of safety measures 1.
Complementary and conflicting Some policies are complementary. For example, government added fiscal benefit to simulate electrical cars use. Another example is coal power plants, they obliged to use 10% biomass of their total capacity in their combustion. The energy taxes in the Netherlands are regressive for both electricity and gas and can change on a yearly basis. Environmental taxes tend to play an bigger role in Dutch legislation, packing tax is abolished since 2013. For more information on taxes and VAT in the energy sector, see attachment 2.
Some policies are conflicting. Exemplary is the European ETS (Emission Trading Scheme). Industries, like power stations and industrial plants, have a maximum emission output, which is linked to ETS. They are allowed to trade ETS according to their total emission output. If industries have a larger output than number of ETS, a fine has to be paid. ETS are traded via a stock exchange. The conflicting issue is that the ETS rates have dropped over a period of time, to € 6,16 per tonne on January 10th
2013, and give no incentive for the industry to change its emission output.
Another example is the renewable energy incentive scheme (SDE / SDE+ Stimuleringsregulering Duurzame Energie), a scheme to promote the deployment of renewable energy, specifically renewable electricity generation and renewable gas. The feed-in premium scheme was introduced in 2008 and the follow-up of the MEP (Milieukwaliteit Elektriciteitsproductie) subsidies scheme of 2003. The MEP supplied a fixed feed-in tariff to raise production from renewable energy sources. The deployment incentive was discontinued due to a larger number of applications than 1 Mining Act
3
expected, which lead to an exceeded cost scheme. Projects that were included in the former scheme continued to receive support for a ten year period. In 2011, the SDE+ was implemented (an upgraded version of SDE), which according to Dutch government, is more cost effective than SDE in reaching targets since it delivers more volume from cheaper/est alternatives and is not driven by technological innovation. Within a ten year time space, the deployment incentives of government changed several times, which makes the policy incentives inconsistent and investors reserved to participate.
Rijkscoördinatieregeling The Netherlands has implemented a Rijkscoördinatieregeling (State coordination agreement) with the intention to structure, accelerate and coordinate the procedures for project implementation. National government is responsible for the coordination agreement and is a part of the spatial planning act, meaning that state government structures, accelerates and coordinates procedures concerning spatial planning projects with a focus on energy and infrastructure projects.
What falls under energy and infrastructure projects in the state coordination agreement:
Wind energy projects over 100 MW; Projects concerning other renewable energy sources over 50 MW; Conventional energy projects over 500 MW; National electricity grid projects over 200 Kilovolt; National gas grid projects concerning pipelines of at least 40 bar; Gas and electricity connectors; LNG installations with a capacity of 4 billion m3; Detection, winning and storage of minerals in delicate areas.
Dutch government is responsible for the decision-making process of the project and acts above lower government bodies. People have the possibility to respond to the proposed project in a consultation and submit a judgement or opinion of the project. The Council of State is the designated authority to judge the submitted opinions. The responsibilities for the developments of the project, namely permits and dispensations, still lies at the designated authorities like municipalities and provinces but the minister makes the final decisions.
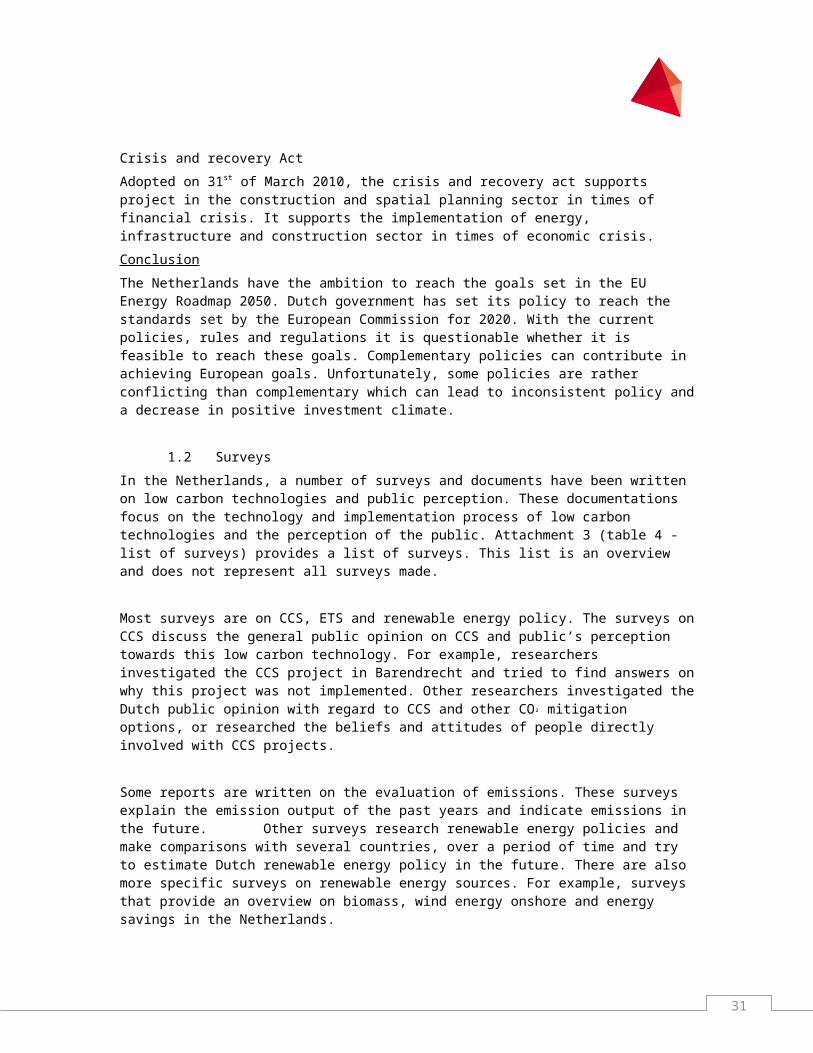
Crisis and recovery Act Adopted on 31st of March 2010, the crisis and recovery act supports project in the construction and spatial planning sector in times of financial crisis. It supports the implementation of energy, infrastructure and construction sector in times of economic crisis. ConclusionThe Netherlands have the ambition to reach the goals set in the EU Energy Roadmap 2050. Dutch government has set its policy to reach the standards set by the European Commission for 2020. With the current policies, rules and regulations it is questionable whether it is feasible to reach these goals. Complementary policies can contribute in achieving European goals. Unfortunately, some policies are rather
4

conflicting than complementary which can lead to inconsistent policy and a decrease in positive investment climate.
1.2 SurveysIn the Netherlands, a number of surveys and documents have been written on low carbon technologies and public perception. These documentations focus on the technology and implementation process of low carbon technologies and the perception of the public. Attachment 3 (table 4 - list of surveys) provides a list of surveys. This list is an overview and does not represent all surveys made.
Most surveys are on CCS, ETS and renewable energy policy. The surveys on CCS discuss the general public opinion on CCS and public’s perception towards this low carbon technology. For example, researchers investigated the CCS project in Barendrecht and tried to find answers on why this project was not implemented. Other researchers investigated the Dutch public opinion with regard to CCS and other CO² mitigation options, or researched the beliefs and attitudes of people directly involved with CCS projects.
Some reports are written on the evaluation of emissions. These surveys explain the emission output of the past years and indicate emissions in the future. Other surveys research renewable energy policies and make comparisons with several countries, over a period of time and try to estimate Dutch renewable energy policy in the future. There are also more specific surveys on renewable energy sources. For example, surveys that provide an overview on biomass, wind energy onshore and energy savings in the Netherlands. Conclusion Surveys on public perception towards low carbon technologies are taken in the Netherlands. Not every low carbon technology is provided with a survey on public perception. For example, there are more surveys on the public perception of CCS than on renewables like wind energy and solar photovoltaic (PV). In the case of CCS and the project in Barendrecht, researchers try to point out the reason why the project had to stop and the role public opinion and perception has on this.
More research is done by government and civil society organisations (CSOs) on future perspectives, transition policies and consequences. The next section gives more information on that.
1.3 Documentation and reports With energy as an important theme, the Netherlands are provided with forward-looking documents and reports on the future of the energy sector and low carbon technologies. Attachment 4 (table 5 – documents and reports), shows an overview of documents and reports on the energy sector in the Netherlands, the current situation and provides documentation with predictions future perspectives.
The documents and reports are divided by sector and institute. There are government documents and reports written by advisory councils for the government
5
and parliament. There are reports and documents written by CSOs and trade associations and research and scientific institutes. Depending on the author and sector, the perspectives of the reports and documents might exploit a different view. Conclusion In the Netherlands, many documents and reports are written on future perspectives and possibilities in the energy sector. These documentations and reports provide a possible future analysis, try to exemplify and create awareness. There is a difference in view that is exploited based on the sector and background and vision of the author.
2. Progress and ambition This chapter explains the ambitions of the Dutch government in the transition of the energy sector. Before taking a closer look at transition, changes and future perspectives, the electricity and gas grid is explained and the current situation is brought under attention.
2.1 Transition to LCTs The following section shows a historical overview and includes the transition to LCTs.
Time lineThe following section presents a historical time line with important happenings and policy initiatives that contributed to the transition. Not all happenings and policy initiatives are included, but a selection is made of happenings that had an effect on the energy system in the Netherlands. The time line start at the beginning of the 20th century and stretches on important events.
1902 | Dutch State Mines (DSM) is founded;1943 | discovery oil field in Schoonebeek by Shell; 1947 | Nederlandse Aardolie Maatschappij (NAM) is founded; 1948 | discovery of gas fields in Coevorden;1949 | discovery of gas fields in De Wijk;1950 | discovery of gas fields in Staphorst;1951 | discovery of gas fields in Wanneperven en Tubbergen;1952 | discovery of gas fields in Dennekamp; 1955 | construction of a nuclear research reactor in Petten;1959 | discovery of gas fields in Slochteren and Delfzijl. The Netherlands
became the biggest gas exporter of Western Europe;1961 | first offshore gas drilling in the North Sea by NAM; 1963 | Gasunie is founded;1965 | construction of the first nuclear power plant in Dodewaard; 1965 | closing of the coal mines in Limburg;
6

1969 | construction of the second power reactor in Borssele;1970/1980s | debate on alternative energy sources, conservation and decrease of
energy; 1990s | towards a gas market and sustainable energy sources, discussions
on natural-gas procession and storage;1997 | the power reactor in Dodewaard is closed down;2006 | Dutch government decides to keep the power reactor in Borssele
operating till 2033; 2005 | Dutch government starts plans for a gas roundabout; 2010 | municipality of Barendrecht and several in Drenthe and Groningen
decline CCS proposition; 2010 | Dutch government postpones CCS onshore;
When considering the historical perspective of the energy sector in the Netherlands, it is necessary to explain more specific the electricity and gas grid.
Gas grid This section will explain the gas sector in the Netherland. The gas sector is a complex business and in short the network, involved parties and liberalization process will be explained.
IntroductionThe Netherlands have a complex gas grid. The development of the gas grid started in the 60s when modest gas and oil wells came to deployment. Some of these wells were not as modest as first expected, like the biggest European gas reservoir in Slochteren – Groningen. Now one third of the European gas reservoirs can be found in The Netherlands.
The first steps towards the current gas grid started with coals. Coals were gasified and distributed on small scale, mostly on municipal level, and used for heating and cooking devices. With the discovery of gas wells in the north of The Netherlands this changed. The NAM (Nederlandse Aardolie Maatschappij B.V.) won the gas from the wells and was obliged to sell the gas to the Ministry of Economic Affairs in name of Dutch state.
NAM is a consortium of Shell and ExxonMobile who both have a 50% share in the company and are concessionaire of the wells. The turnover was managed via the Staatsgasbedrijf (state gas company). Considering the amounts of gas and oil won, this situation could not last. Therefore, Dutch state searched for a solution and found it in an increased involvement in the winning of these fossil fuels.
The Dutch state made an agreement with the NAM (Shell (50%) and ExxonMobile (50%)) and the State Mines (DSM) as involved parties in the common agreement on cooperation (Overeenkomst van Samenwerking (OvS)). In the OvS the winning, deployment, transport and turnover was discussed of the gas and oil wells in The Netherlands. The cooperation will continue as long as there is a Groninger field
7
concession. With the OvS, the Gasunie - responsible for the turnover, and Maatschap Groningen - responsible for the winning, were founded and both were responsible for the transport and sales of the gas. NAM was responsible for the winning of gas.
Liberalisation Due to the European liberalisation strategy, the relations in the energy sector had to change and The Netherlands made their first move to take part in the liberalisation from 1995 onwards.
In this liberalisation, Gasunie was separated in three divisions; (inter)national transport, sales and trade, administration and foreign contracts. By 2002, the market was free for large- and mid-scale consumers to choose the supplier of their interest and by 2004 small-scale consumers could do the same. The TSO (Transmission System Operator) and DSOs (Division System Operators) are placed under supervision of DTe / Service Execution and Supervision Energy of the Netherlands Competition Authority (NMa).
Situation since 2005The liberalisation of the gas market, the institutes active in the gas market had to adapt to the new situation. This had the following implications for the organisations and institutions in the gas grid:
Gasunie: shareholder Ministry of Finance (100%). Responsible for gas infrastructure both national as international. Responsible for foreign contracts and bilateral contracts. Creates infrastructure for the industrial and the domestic market. Has a network in the Netherlands and Germany. Works upstream – from well to power plant or distribution centre.
GTS: shareholder Gasunie (100%) National Transmission System Operator. Responsible for transport of gas to DSOs, large-scale consumers and export. Works upstream – from well to power plant or distribution centre.
Gasterra: shareholders Ministry of Economic Affairs (10%), EBN (40%), Shell (25%), ExxonMobil (25%). Responsible for the trade in gas, working downstream – from trader or NAM to buyer.
EBN: shareholder Ministry of Economic Affairs (100%). Participator in the production, trade and detection of gas on Dutch territory. Advises the Ministry of Economic Affairs on requested concessions by companies. Working upstream and midstream – from well to power plant / distribution centre.
NAM: shareholders Shell (50%) and ExxonMobil (50%). Responsible for the production, trade and detection of gas. Working upstream and midstream – from well to power plant or distribution centre. Sells only to Gasterra.
Smaller wells: several gas and oil companies with concession are responsible for the production, trade and detection of gas. Need permission from the Ministry of Economic Affairs to receive a concession. They are able to work up- and midstream - from well to power plant or distribution centre.
Maatschap Groningen: shareholders NAM (60% (Shell (50%), ExxonMobil (50%)), EBN (40%). Responsible for the production of the Groningen well and only sells to Gasterra. Working upstream and midstream – from well to power plant or distribution centre.
8
TTF: Title Transfer Facility like the APX-Endex. Virtual stock market to trade gas for a shipper or trader that will be transferred by GTS. Approximately 1/3 of gas trade is via TTF.
Bilateral: bilateral gas trade at national political level with countries like Norway and Russia. Approximately 2/3 of gas trade is bilateral.
Below an overview is made of three main gas companies in the Dutch gas grid with their board and supervisory board members.
Gasunie Board Supervisory BoardPaul van Gelder G. van LuijkRené Oudejans R. de JongGeert Graaf A. Lont
H. NoyM. Poots-BijlJ. Vermeire
GasterraBoard Supervisory Board Gertjan Lankhorst (ex DG EL&I) Stan Dessens (voorzitter / ex DG EZ) Anton Broenink (ex Exxon) D. Benschop (Shell)Maarten Blacquiere (nu Enexis) J. Bokhoven (EBN)Jacob Kielman (ex Gasunie) Jos de Groot (ex ELI)Herbert van Zijll de Jong Pieter Dekker (Shell)Johan Stäbler Mark Dierikx (DG EZ)Anton Buijs Joost van Roost (Exxon)Bart Westmaas A. van Veldhoven
NAMBoard Bart van de LeemputJoost van Roost (Exxon)Pieter Dekker (Shell)
Another important grid in the Netherlands is the electricity grid, which the next section will explain.
9
Electricity grid The following section will explain the role of the electricity grid at national and regional level.
TenneT Holding B.V. In the Netherlands and a part of Germany, TenneT is the national grid operator and responsible for the transport of electricity via high voltage lines; they manage the 110 kV-, 150 kV-, 220 kV-, and 380 kV grid. TenneT, as transmission system operator (TSO), is responsible for the transmission.
The Dutch state - Ministry of Finance, is shareholder of the TenneT stocks. The legal task of TenneT is to regulate, manage and maintain the transport network and the energy balance in in the Netherlands and parts of Germany. These legal tasks are executed by TenneT TSO B.V., some tasks are executed by subsidiary CertiQ B.V. (certifies energy generated by sustainable sources like solar, wind, water and biomass in Certificate of Origin). In Germany TenneT TSO GmbH and TenneT Offshore GmbH are the executive company.
Other tasks of TenneT, the so-called non-regulated tasks are part of the businesses of the following subsidiaries:
APX ENDEX (exchange for electricity and natural gas in the Netherlands, UK, Belgium of which TenneT Holding B.V. has 56.1% share, Gasunie N.V. 20.9%, Fluxys Europe B.V. (gas TSO) 3% share and Elia N.V. (electricity TSO) 20% share).
New Value B.V. (no information) NLink International B.V. (no information) NOVEC B.V. (independent supplier of antenna points for ether
communication).
With the national grid in hands of TenneT, there is a strict separation between the national grid in hands of a government owned party and regional parties owned by lower government bodies and commercial trade. TenneT transports electricity via the high voltage grid to regional parties or imports or exports electricity. These regional parties or regional operators are the grid operators of low voltage grids. Low voltage grids are grids below 110 to 150 kV. TenneT is responsible for the transmissions on the grid; from high voltage to low voltage.
TenneT transports electricity in three directions and vice versa: 1. from trader to trader 2. from trader to electricity plant 3. from electricity plant to regional grid operators.
It is the responsibility of TenneT to cope with the surplus or shortage of electricity and its transport on the grid. Involved parties - programme responsible parties (programma verantwoordelijke partijen) like commercial parties as industry, electricity companies - inform TenneT, on a daily basis on their expected production and supply of electricity. TenneT controls every fifteen minutes whether the grid is in total balance and if irregularities occur TenneT needs to regulate the grid and either
10

demand programme responsible parties to decrease their electricity demand or decrease their electricity production. If there is more electricity on the grid than demanded the electricity companies receives a lower price for the electricity as expense allowance or the electricity is exported. In case of a (possible) black out, electricity company Eneco has emergency capacity (noodvermogen).
Regional grid operators This section will explain the regional grid operators for electricity and gas.
There are 8 regional grid operators active in 10 regions for electricity, so-called distribution system operators (DSO). For gas, there are 9 DSOs operating in 14 regions and both operators for electricity and gas are responsible for the construction, maintenance and transport of gas in their region. Consumers cannot chose the operator of their choice and therefore DSOs have a monopoly position. Regional grid operators are obliged to provide grid connections, both for supply as reversed supply.
The grid operators are independent parties; all with public shareholders like provinces and municipalities. The Due to the Electricity Act of 1998 and the Gas Act of 2000 the grid operators had to become self-reliable. Before that period, they were part of, mostly, electricity or gas companies like Eneco, NUON, Delta. The figures below (figure 1 and 2 - regional grid operators gas and electricity) show the regions where the grid operators are active.
Gas grid The Netherlands
11

Electricity grid The Netherlands
Legislation
12
1. Rendo Netwerken2. Cogas Infra en Beheer3. Liander6. Stedin7. Westland Infra8. Stedin9. Delta Netwerkbedrijf12. Endinet Groep B.V.13. Enexis 14. Enexis
1. RENDO Netwerken2. Cogas Infra en Beheer3. Liander 5. Liander 6. Stedin7. Westland Infra8. Stedin9. Delta Netwerkbedrijf10. Intergas Netbeheer11. Endinet Groep B.V.12. Endinet Groep B.V.13. Enexis 14. Enexis

This section will shortly explain the legislation for TSOs and DSOs. Since the liberalisation of the energy sector the Energy Board (Energiekamer) of the Dutch Competitors Authority (Nederlandse Mededingingsautoriteit (NMa)) has the legal task to control and regulate the energy market and protect consumers.
The Electricity Act of 1998, the Gas Act of 2000 and the Construction Decree of 2003 obliged the sector to liberalise and privatise. Before the liberalisation in 2004, the supply of gas and electricity was the responsibility of public utilities (nutsbedrijven) with both, but mostly, public and private shareholders.
Since the liberalisation of the energy sector, public organisations sold their shares in these utilities and made merges possible towards private companies. The Energy Board controls the effects of liberalisation in the energy sector. It is a supervisor of the national, regional and European grid system. The Energy Board create market forces for the suppliers of electricity and gas, they control the quality and prices for the national and regional grid operators, they provide them supply licences and they have to be informed on quality and capacity every two years.
When consumers or companies have a conflict with the grid operator the Energy Board mediates. Furthermore, they monitor the market in order to create a trustworthy, sustainable and affordable electricity and gas grid.
ConclusionOver the years the Netherlands have taken initiatives towards a transition of the energy sector. In the energy sector, the electricity and gas sector play an important role. LCTs play an increasing role in the energy mix.
The electricity and gas grid have experienced changes over a period of time. The liberalisation and privatisation had an impact on the energy sector. Currently, there is a national grid operator for gas and electricity, several regional grid operators and multiple players in the production, supply and trade of electricity. Together they provide Dutch citizens of permanent gas and electricity supply and provide the possibility for reversed supply.
2.2 Changes With a growing necessity for a sustainable environment, the implementation of innovative possibilities in the energy sector and wish for a constant or growing economy without environmental damage and suffering has been the incentive for changes in the energy sector.
The Dutch government has agreed to meet the European environmental and energy goals set for 2020 and wants to meet the challenges set for 2050. Therefore, they publish every three years an Energy Report on the current energy situation and the policy measures required to reach the policy goals set for the governments’ term. After analysing the Energy Reports of 2005, 2008 and 2011 one can conclude that government policy is focussing on the exploitation of gas and the manufacturing of a ‘gas roundabout’ - The Netherlands as gas import and export centre for north-western Europe, wind energy on- and offshore, and the co-firing of biomass in power plants and usage of biomass as source for biofuels in the transport sector.
13

Furthermore, with the introduction of the policy focus on different top sectors (topsectoren), the incentive lies at the implementation of innovative ideas and the promotion of Dutch economy and creating the possibility to let Dutch economy grow, without negative influences on the environment. One of these top sectors is Top Sector Energy focussing on the improvement of the energy sector and looking at the future of gas, wind offshore, smart grids, bio-energy, solar power, energy saving in the industry and built environment.
Conclusion There have been changes in the energy sector in the past few years. These changes mainly focus on political and policy changes both implemented at European level as national level. The changes include the 2020 policy goals set by the European Commission and the European Roadmap 2050. It has to be noted that policy subject to political circumstances, meaning that depending on the political colour of government other incentives and policy actions are undertaken and policy incentives might not be continued. This causes a certain insecurity for everyone involved in the energy sector.
2.3 Future
In future perspectives the Netherlands aim at reaching the goals set by the European Commission to reduce CO2 emissions by 20% in 2020, to have a 16% share of renewables in the total mix of energy sources by 2020 and to reach a 20% energy reduction, all compared with the 1990 rates.
In order to reach these goals, Dutch government has put forward different policy incentives, rules and regulations. One can read these in attachment 1.
Current policy is focussing on the prolonging of existing polices like SDE+ and the focus on wind power offshore and the co-firing of biomass. The discussion concerning the prolonging of the current nuclear plant in Borssele, now set till 2033, or the construction of a new nuclear plant are put on hold.
Conclusion The Dutch government has the perspective to reach the 2020 goals set by the European Commission. The current government (2012) has outlined their wishes and incentives to reach this goal.
Despite governments wishes and incentives, it is questionable whether it is possible to reach the 2020 goal with current policy standards and actions.
2.4 DialogueThe transition to LCTs is mostly discussed at different levels. Most dialogue initiatives are held at professional level by e.g. civil servants, government, business and industry. Attachment 6 (Table 6 - Dialogue initiatives over the past years), shows some dialogue initiatives of the past. Some dialogues are held between local residents and governments and / or industries, mostly to explain or convince the persons present of the necessity for the implementation of that technology.
The topics of discord is mostly on the choice between long term costs and short term solutions and what concessions government is willing to take to reach
14

goals. Government, industry and society all struggle with these choices and have problems to oversee long term visions with short term solutions that might not provide long term solutions.
A topic where most of the involved ones agree upon is that change is needed towards a more sustainable and competitive energy market. As reports and surveys point out, shown in attachment 3 (table 4 - list of surveys), the ambitions to create a transition towards a sustainable and competitive energy market are present. When policy makers, industries and other stakeholders can overcome the discord the road towards reaching these ambitions might be shorter.
ConclusionThere is a dialogue on transitions in the energy sector. The dialogue is mostly held in the professional sphere, but also occur at local level. Topic where is agreed upon are the need of change towards a sustainable and competitive energy market. The way to reach that is topic of discord. Herein the choice between long term costs and short term solutions are leading.
2.5 Alternative mitigation options There are alternative mitigation options in the Netherlands. An important alternative are energy efficiency measures in buildings. New buildings, houses and offices, are built with strict rules and regulations on isolation, double glass windows, water and heating saving instruments and measures.
Another mitigation alternative is the usage of waste. The cradle to cradle principle is applicable to waste. In many forms, waste can be used as material for heating and electricity. Waste collecting companies Van Gansewinkel collect waste and transform it. In 2011, they had a heating production of 1296.000 PJ (is omgerekend van 1.296 TJ, klopt dit??) and delivered 0.694 MWh electricity to the net, an increase of 6% compared to 20102.
Furthermore, there is a promotional campaign for the implementation of electric cars. The biggest association of the Netherlands, the Royal Dutch Touring Club started a campaign to promote electric cars. Dutch government gave priority to electric cars by implementing fiscal benefits.
Alternative mitigation options focus on the combination of innovation and economic feasibility as stated in the Energy Reports of government and the implementation of Top Sector policy.
Conclusion In the Netherlands, alternative mitigation options are point of discussion and implemented like energy efficiency, the usage of waste material and changes in the transport sector. Dutch policy focusses on alternative mitigation options in the sphere of innovation and economic growth and profitability.
2 Van Ganswinkel, jaarverslag 2011 http://www.jaarverslagvangansewinkelgroep.nl/jaarverslag-2011/aDU1088_Belangrijkste-resultaten.aspx
15
2.6 Levels of policy implementation In the Netherlands, the level of policy implementation is mostly at national level. As attachment 1 (table 1 – overview legislation) shows, legislation is mostly drawn and formed at national level, as a follow up of European directives. A few policies are implemented at lower levels, like the policy concerning solar PV which is implemented by municipalities, at local level. At regional level, the implantation of policy concerning wind mills onshore takes place. Provinces are responsible for town and country planning and therefore responsible for the indication of wind mill parks onshore.
ConclusionThere are four levels of policy implementation, namely: European, national, provincial, municipality. The level of policy implementation mostly takes place at national level. A few policy areas, like solar PV and wind mill parks, are implemented at a lower level, respectively local and provincial level. This is due to the subsidiarity principle arguing that policy implementation should be handled by the lowest or least centralised authority capable of addressing the matter most effectively.
3. Economy The section below will show relevant information on the expected implementation of LCTs, the Dutch GDP growth, occupation of LCTs and fossil fuels, prices, import, export and energy dependence of the Netherlands.
3.1 Expected implementation of LCTsTo have a broad perspective, the following section first exemplifies the rate of deployment of all energy sources, in source and electricity and heat. Attachment 7 (table 7 - energy balance) shows the total deployment, winning, import and export of energy sources in the Netherlands. The table shows the energy balance in the Netherlands of the past few years.
Focussing on renewable energy sources an increase in total energy consumption is visible. The consumption of total renewable energy sources has more than doubled since 2000. Since 2000, the energy consumption of earth and earth depth energy is added to the energy balance and the total consumption of biomass had more than doubled. The latter is possibly a derivative of the policy implementation of an obliged 10% biomass co-firing in power plants.
Dutch government has the ambition to reach the European objectives of 2020. There are policy initiatives to increase the implementation of LCTs, chapter 4.1 explains this further. Dutch government mostly aims at wind, biomass, energy savings and solar power. In 2011, the Dutch government decided to spend yearly € 1,4 billion from 2015 onwards and set rules support the implementation of renewable energy sources and reduce CO2 emissions. Its aim is to increase the amount of renewable energy, energy saving measures, and is considering the possibility to discuss and implement nuclear energy and CO2 capture and storage in the energy mix.
16

According to European directives, in 2020 14% of the Dutch energy mix should come from renewable energy sources (RES). When looking at percentages of the total energy consumption renewable energy sources are in 2011 at a consumption level of 4%. Dutch government has the will to reach 16% RES in the energy mix by 2020.
The figure below shows the share of renewable energy sources in the energy balance and its share in the total energy consumption. The import and export of renewable energy sources is not included, since it is difficult to extract these details from the import and export of electricity. It can be expected that in the share of electricity, a possible share of imported renewable energy and nuclear power is converted to electricity.
9.6
38.444
4
1.2 1.61
energy balance 2011
coal
oil
gas
res
nuclear
waste
electricity
Figure 3 – energy balance 2011 (Source CBS 2012)
The overall total consumption and share of renewable energy sources and its percentage is shown in the table below. Since 2000, the percentage of energy consumption of renewable energy sources has more than doubled in 2010.
In PJ Total energy consumption
Total energy consumption RES
Percentage
2000 3066.70 53.18 1.7%2005 3315.95 88.58 2.6%2010 3492.64 127.35 3.6%2011 3257.84 132.38 4.0%Figure 4 – table on percentage of total energy consumption of RES (Source CBS 2012)
17

ConclusionThe ambitions of Dutch government is to reach the goals set in the European Energy Roadmap 2050 and its goals for 2020. It has initiated policy incentives to make these goals feasible. It has to be noted that it is not proven that the policy incentives will contribute to the policy goals set and there is no certainty in the sustainability of the policy goals.
3.2 Economic effects on investments on LCTsTo measure economic effects on investment on LCTs, the value of the energy sector is researched. Attachment 8 (table 8 financial overview) shows trading results and costs and benefits of the energy sector in 2010. More information is not available. In order to measure the economic effects on investment on LCTs, the investment on research and development in specific sectors is investigated. This is based on total Gross Domestic Product (GDP). The percentage of GDP that is spend on research and development was in 2005 1.9% of GDP. This was spend on research and development, in 2010 this was 1,85%. Attachment 9 (table 9 – GDP and R&D expenditure) on GDP and investment on research and development gives a clear overview.
Gas revenues play a very important role for Dutch State revenues and its GDP. Due to variations in the gas price, the contribution of gas revenues on Dutch GDP has doubled in 10 years’ time. The gas revenues are part of general funds and used for government purposes since the abolishment of Economic Structure Enhancing Fund (Fonds Economische Sructuurversterking) in 2011. The fund, established in 1995, was filled with gas revenues and used for investments in infrastructure and since 2005, for investments in the knowledge industry. The fund was managed by the Ministries of Finance and Economic Affairs. In 2010, the Economic Structure Enhancing Fund had an expenditure of € 2.3 billion.
Figure 5 - table on gas revenues The Netherlands Million € 2000 2005 2010 2011Gas revenues 4.490 7.579 10.670 12.391GDP 417.960 513.407 588.740 601.973% of GDP 1.07 % 1.47 % 1.81 % 2.05 %
Gas revenues are based on the revenues from the winning of gas. To make a comparison with RES the following figure will explain the percentages of gas and RES winning on the total of energy winning in The Netherlands. Attachment 2 (table 2 – taxes and table 3 - revenues from environmental taxes) explains the revenues for the Dutch state on taxes and environmental taxes in the energy sector.
Figure 6 – table on winning of gas and RES and its total percentage 2000 % 2005 % 2010 % 2011 %
Gas 2188,85 90.5 % 2356,7 89.7 % 2656,84 90.5 % 2418,97 89.3 %RES 53,18 2.2 % 88,58 3.37 % 127,35 4.33% 132,38 4.88 %
18

ConclusionIt is difficult to measure the economic effects on investments on LCTs. The impact they have is minor in comparison with the gas sector.
The energy sector is an important sector for Dutch economy. Especially considering the importance of gas revenues and its share on GDP. The National Energy Outlook of 2011 mentioned that the energy sector had a total output of € 36.4 billion in 2008 3.
3.3 Rate of deployment of LCTsTo narrow the perspective down and consider the rate of deployments of LCTs attachment 10 (table 10 – rate of deployment of LCTs) shows the rate of deployment of LCTs. This table shows that the rate of deployment of LCTs has increased the past few years. Considering attachment 7 (table 7 – energy balance) wind, solar and biomass contribute most to the deployment of renewable energy sources. The rate of deployment of LCTs in comparison with fossil fuels is minimal, since LCTs have a 4,28% share in the total energy consumption in 2011. Most part of the deployment of LCTs is on electricity and heating. In 2011, respectively 43 PJ and 36,6 PJ of a total of 92,6 PJ. The usage of LCTs for the transport sector has increased since 2000 when there was no usage of LCTs in the transport sector to 13 PJ and a percentage of 0,60 of the total consumption in 2011 (total consumption being 92,6 PJ and a 4,28% of the total energy consumption). In case of electricity, heat and transport the rate of deployment of renewables increased majorly.
Conclusion The overall rate of deployment of LCTs has increased over the years. Main deployment comes from wind, solar and biomass and is used for electricity, heat and transport. In 2011, the rate of deployment of LCTs was 4,28% of the total energy consumption.
3.4 Cost related issues related to LCTs
There are several plans and ideas on how to address cost related issues related to the transition towards usage of LCTs and the transition in the energy sector.
Policy documentations point out that independence, innovation, profitability and export are important factors to address the Dutch energy mix. Dutch government wants to retain revenue streams in the energy transition to LCTs. Export and import of energy are crucial factors to address cost related issues. The import of renewable energy from the grid in, e.g. Germany plays an important part in the discussion concerning cost related issues to LCTs. As the gas and oil industry form a significant part of the revenues of the Dutch state, it has to be clear that government is not keen on changing the economic possibilities this gives on the market. Dutch government considers economic growth and
3 National Energy Outlook 2011
19
sustainability as an interlinked issue and the one should and could not interfere with the other.
To be able to make a transition to LCTs without losing grip on the economic side of the energy market, Dutch government has put nine Top Sectors in place, including a Top Sector Energy. Chapter 4.1 explains goes deeper into this policy incentive 4.
Conclusion There are plans and ideas on how to address cost related issues related to the energy sector and the transition towards LCTs. Profitability, import and export, innovation and independence are main themes to address cost related issues. The plans and ideas are drawn by government in the Top Sector policy (see chapter 4.1).
3.5 Energy dependence The energy balance, in attachment 7 (table 7 - energy balance) shows the winning, import and export of energy sources in 2000, 2005, 2010 and 2011. Attachment 11 (table 11 - energy usage per sector) shows which energy source is used in what sector.
Considering energy dependence, the Netherlands are a partner in the import and export of energy sources, like coal, oil, gas and nuclear power and electricity. Due to its own gas reserves, the Netherlands can provide themselves with gas. The winning and import of energy sources like oil and gas is used for energetic consumption and non-energetic consumption. Oil and coal is used mainly for non-energetic consumption. There is not enough own winning of energy sources, therefore the Netherlands depend on the import of energy sources in the usage of electricity and heating and for the industrial sector.
Conclusion As attachment 7 (table 7 – energy balance) shows, the Netherlands had an increase in energy import and export from 1980 onwards. Though the Netherlands can provide themselves with gas, the industry depends on the import and export of fossil fuels like coal and oil for non-energetic consumption. The export and import of electricity has increased.
4. Innovation and solutionsThis chapter discusses innovative plans and ideas on LCTs and its implementation. More specific, it discusses the proposed solutions for decarbonisation of the habitat, industry, transports and agriculture. Technical problems and limitations on the implementation of LCTs is also discussed.
4.1 Innovative ideas and plans on LCTsThe Netherlands are creating innovative ideas and plans to create a sustainable society and on how to implement LCTs. The main focus lies in research and
4 http://www.rijksoverheid.nl/onderwerpen/ondernemersklimaat-en-innovatie/investeren-in-topsectoren
20
development of universities and companies With incentives of government, solutions are made to create a sustainable and competitive energy market.
Top Sector Policy (Topsectoren beleid) To be able to create solutions, the government has set up a policy to stimulate innovation and research, sustainable growth and competitiveness; top sector policy (topsectorenbeleid) 5. The top sectors should make prosperity possible, prolonging and focusses on nine sectors: 1. agriculture and food, 2. creative industry, 3. energy, 4. life sciences and health, 5. water, 6. high tech, 7. logistics, 8. chemical industry and 9. horticultural industry.
This new policy suggests; 1. less subsidies and lower taxes, 2. less and simple rules, 3. access to corporate finance, 4. usage of knowledge industry, 5. better affiliation of tax system, education and diplomacy on the needs of trade and industry. The top sectors’ policy has three main ambitions:
1. The Netherlands in top 5 of knowledge economies worldwide by 2020;2. Increase of Dutch R&D expenditure to 2,5% of GNP by 2020;3. Create a top consortium for knowledge and innovation - wherein private and
public participate with a value over € 500 million, whereof 40% is financed by trade and industry in 2015.
According to the global competitive index of the World Economic Forum the Netherlands are in the top 5 of knowledge economies worldwide in 2012. The ambition is to sustain at this position 6.
In 2010, the total R&D expenditure was € 10,8 billion and 1.85% of GDP. In comparison with other European countries, the R&D expenditure is below average. See also attachment 9 (table 9 GDP and investments on research and development) 7 8.
Decentralised initiativesSeveral local initiatives, cooperation and self-developed solutions, mostly financed by innovators themselves - privately and collectively - occur. One must think of PVs on rooftops, (self-made) urban or onshore wind mills, energy saving measures like isolation in buildings, energy-saving lights, and energy-efficient household devices. There are policy incentives from Dutch government to activate and promote decentralised initiatives.
ConclusionThe Netherlands create innovative plans and ideas on LCTs and its implementation. To be able to create innovative ideas and plans, Dutch government has set up the top sectors’ policy. At decentralised level, local initiatives and self-developed solutions occur.
5 www.top-sectoren.nl6http://www.kennisalliantie.nl/2012/09/nederland-in-top-5-van-de-wereldeconomie/7 http://www.cbs.nl/nl-NL/menu/themas/dossiers/ondernemingsklimaat/publicaties/artikelen/archief/2011/2011-3538-wm.htm8 Statline database 2012
21

4.2 Solutions for decarbonisationSolutions commonly proposed for the decarbonisation of sectors (habitat, industry, transports and agriculture) are mentioned below. This section also discusses controversial initiatives and focusses on innovative companies and businesses.
Habitat Solar chargers. Solar chargers have taken the leap when it comes to
improvement and innovation. For all kinds of household materials solar chargers have been developed and improved and are now widely spread in the Dutch market 9.
Decentralised solar PV. Households can invest in solar PVs for their rooftops and provide their household with electricity. Households are able to reverse their electricity supply.
Energy efficiency. Houses, devices, heating; all are made more efficient. Isolation for windows and walls. Household devices that are energy efficient and have an energy efficiency label. Consumers that are obliged to pay a disposal fee for household devices and new personal cars. More efficient heating systems, with central heating points and efficient boilers.
Recycling. There are several recycling systems active. Separated collection of, amongst others, glass, paper, plastic and compost that can be either recycled or used for other purposes. Industrial products or waste that is reused or used in other sectors to manufacture new or other products.
Heat pumps. Mostly used in devices like fridges. For example, heat pumps that are installed in supermarkets to keep the fridge cool and the rest of the supermarket heated.
Combined heat and power / cogeneration (CHP). Applied in buildings, houses and industry to manage the temperature of water and / or the surroundings.
Industry Usage of waste or biomass. Coal power plants are obliged to co-fire 10%
biomass of their total coal fire production. Recycling. Industries focus on the recycling of materials either for their own
industry or other. Geothermal. Industries using the warmth of the earth in their industrial
processes. CCS is a method which is close to direct deployment. New power plants are
obliged to build a CCS intercept in order to apply the possibility for CCS. It is a method not yet implemented in the Netherlands.
Transport Solar car and boat. For several years in a row, the Technical University Delft,
in cooperation with NUON/Vattenfall and Delta Lloyd, developed a solar car and boat for the World Solar Challenge and Energy Solar Challenge 10 11.
‘Green’ gas. Biogas, gas produced out of waste from fruits, vegetables and wood, mud with the same qualities of gas that can be applied in the same manner as gas. Mostly performed by farmers or the gas industry.
9Example of solar adaptor webshop: http://www.solar-oplader.nl/chargers/pages/solar-batterij-oplader.php10 http://www.nuonsolarteam.nl/11 http://www.deltalloydsolarboat.nl/
22

Electric vehicles. A new and rapid growing market is that of electric vehicles. The biggest consumers movement in the Netherlands, the Royal Dutch Touring Club (ANWB), is a promoter of electric vehicles and places chargers at several places. The interest in electric vehicles has grown in the past few years and corporate companies and governments are switching to a more energy efficient way of transport, e.g. Royal Bam Group (a construction company) and several municipal transport companies. There is a fiscal regulation to promote electric vehicles 12 13.
Gasoline from solar power. The Technical University Twente, together with partners, have developed solar gasoline methanol. The surplus of solar power can be used to produce methanol and this can be used as gasoline or energy stock 14.
Stimulation of public transport. Policy incentives try to stimulate public to use public transport instead of cars.
Agriculture Biogas. Gas produced out of waste from fruits, vegetables and wood, mud. Biomass to power. Biomass can be used as power for electricity and heating.
There are several kind of companies and business that focus on innovation and solutions for energy problems and a sustainable future. They mostly facilitate discussions, platforms and incentives for innovative plans. An example of innovative companies are WZK and Our Common Future, who try to create awareness, dialogue and facilitate innovation 15 16. They focus on sustainable products and services in the market. Shale gasA more controversial innovative energy source is shale gas. In parts of Dutch soil shale gas is found and technologically it is possible and safe to win shale gas. National government gave 4 licences to detect shale gas and several research and development projects are set up to investigate what the possible effects of ‘fracking’ are, how shale gas can be used, possible environmental risks and the impact of policy and incentives 17 18. Dutch community has not responded positively on the winning of shale gas; there is a lot of fear for the technological implications and safety 19. Currently, the Mnister of EL&I (Environment, Agriculture and Innovation) decided that the test drillings for shale gas are postponed till the summer of 201320.
Conclusion
12 http://www.bamopladen.nl/13 http://www.anwb.nl/auto/nieuws-en-tips/specials,/elektrisch-rijden/Elektrisch-rijden.html14 http://www.kennislink.nl/publicaties/de-toekomst-in-met-solar-fuel15 http://www.wzk.me/16 http://www.ourcommonfuture.nl/nl/welkom/17 http://www.fibronot.nl/download/Schaliegas-in-Nederland.pdf18 http://www.rijksoverheid.nl/onderwerpen/gas/gasexploratie-en-productie/onconventioneel-gas19 http://www.schaliegasvrij-haaren.nl/tegenstanders-schaliegas-voeren-actie-in-den-haag.html20 http://www.delta.tudelft.nl/artikel/proefboringen-schaliegas-uitgesteld/25603
23

There are a number of solutions proposed for the decarbonisation of sectors in the Netherlands. The ambitions are present, together with a high level of technology and research and development applicable to fulfil the ambitions set.
4.3 Possible limitationsPossible limitations to implement LCTs focus on barriers like finance, social acceptance and grid issues. Both Bellona and Clingendael Institute have done research on possible limitations for LCTs and the transition in the energy sector. According to the Bellona report and Clingendael Institute report the main barriers to renewable energy are:
Return on capital and financing; economic aspects, a check and balance of production, usage, sustainability, and external costs. Maintenance of LCTs is a very important aspect, which sometimes forgotten.
The non-competitiveness or less competitive (of) LCTs makes investors hesitate to implement forms of LCTs.
Social acceptance; the perception of LCTs in the community is very important. Social aspects as NIMBY (not in my backyard), BANANA (build absolutely nothing anywhere near anything), NOPE (nowhere on planet earth) and TINA (there is no alternative) play an important aspect in the acceptance of new forms of energy.
Grid issues; the only technical problem that diffuses LCTs is how to store power and the development of smart grid systems. One has to keep in mind that availability is important to make LCTs a success. Without wind no wind power, without sun no solar power, no tides no tidal power.
ConclusionTechnical problems are not so much limiting the diffusion of LCTs. The limitations moreover lie in the field of finance and politics, like a lack of access to low cost energy storage, the amount and contribution of public and private financing, an inconsistent government policy and unawareness amongst the public.
5. Exchange and dialogue The following chapter explains the objective of R&Dialogue, the used methodology and research proposal. Subsequently, this chapter gives examples of past dialogues and methods to discuss the energy transition in the Netherlands. Furthermore, concerns will be shared and finally the role of R&Dialogue is discussed.
5.1 Mutual learning The objective of the R&Dialogue project is to create mechanisms for effectively tackling the scientific and technology related challenges faced by society by proactively bringing together different actors with complementary knowledge and experience. This project organises a dialogue between R&D organisations (RDOs) and civil society organisations (CSOs) that results in a joint vision of CSOs and RDOs on the development of renewable energies and CCS for a low carbon society and identification of actions to improve the dialogue and associated mutual learning. R&Dialogue serves to bring topics, argumentations, stakeholders and everyone involved together to learn from one another and develop mutual understandings. Successful implementation of the national vision is an important objective.
24
ConclusionWithin R&Dialogue the aspects of mutual learning of RDOs and CSOs and the mutual learning of the consortium partners and national teams is of high importance.
5.2 Dialogue initiativesR&Dialogue is not the only project that tries to initiate dialogue in the energy sphere. There have been different dialogue initiatives in the past few years in the Netherlands. It has been difficult to map and order all dialogue initiatives due to lack of information and known records. Attachment 6 (table 6 - Dialogue initiatives in the past) shows dialogue initiatives of the past.
Most dialogue initiatives are held at professional level e.g. between industries, businesses, governments, CSOs, RDOs and NGOs. Some are held at local level, between stakeholder and public when a new energy source, e.g. wind mill parks, is implemented in the region. National public dialogue initiatives are not that common.
ConclusionThere is an on-going debate on the future of the energy sector and climate change which is not held at a broad level. Dialogue initiatives are mostly held among professionals in the field.
5.3 Concerns In Dutch society are concerns towards the sustainability of the energy sector and the implementation of LCTs. Documentations and reports, as mentioned in attachment 3 (table 4 – list of surveys) attachment 4 (table 5 – documents and reports) and attachment 6 (table 6 – dialogue initiatives), have done research on concerns of society towards LCTs and the sustainability of the energy sector. The report of Clingendael Institute (2005), mentions a combination of energy security and responsibility, overall energy demand, a stable price and market, and a clean and sustainable development as main concerns in the Netherlands21. Other surveys and research documents mention that the involvement of technologies in daily lives of people is a concern, see attachment 3 (table 4 – list of surveys), attachment 4 (table 5 – documents and reports) and attachment 6 (table 6 – dialogue initiatives). These concerns come to life in situations that result in conflicts, like CCS in Barendrecht, wind mill parks near Urk and the offshore Zandvoort Noordwijk area. Here, the community has expressed their concerns and opposed initiatives of government and industry.
In recent history; the past 10 years or so, it can be notified in the Netherlands that an increase in protest or action groups against new forms of policy and towards the lack of participation and consultation grew. It can be argued that conflicts occur based on socio-emotional reasoning; it is not so much the techniques that withhold people. How or which LCTs are implemented is important and decisive is the way it might affect peoples’ lives. Fear is an important issue. In the case of CCS, people are afraid of the damages of CO2 in the atmosphere. In the case of shale gas, people are afraid of the environmental damage the winning of shale gas could case. This is in overall 21 Clingendael International Energy Programme (2005) Dertig Jaar Nederlands Energiebeleid.
25

contrast with the already existing onshore underground gas storage in some parts of the Netherlands. In the case of wind energy, people are concerned with their view or horizon and the value of their estate.
ConclusionThe concerns in Dutch society are written down in several surveys and documentations. These concerns focus on implementation of low carbon techniques and public perception.
5.4 Role of R&DialogueThe role of R&Dialogue is to facilitate the possibility to have a constructive dialogue among stakeholders in order to create a shared vision on an energy system that is competitive economically and contributes to GDP and reduces greenhouse gas and other emissions.The role of R&Dialogue is:
To be able to affect the level of awareness of stakeholders and Dutch inhabitants on the energy mix;
To fulfil the role of network creator and mediator among stakeholders and interested parties;
To create an effective and sustainable dialogue; To facilitate transparency in information and process. The importance lies in
the transparency of dialogue and discussion; To be experienced as a trustworthy partner that treats stakeholders as equal
and independent partners; To provide a transparent network of stakeholders and people involved.
This role can succeed when all relevant stakeholders are willing to trust each other and develop a shared national vision on a common sustainable future for our society. ConclusionR&Dialogue needs to create a shared vision and outline its role in this project. The Dutch national team developed a communication outline which explains the role of the Dutch R&Dialogue team more thorough.
6. StakeholdersThe last chapter will discuss the stakeholders in this project. As discusses above, R&Dialogue proactively brings together different actors with complementary knowledge and experience. This chapter discusses the actors and analyses their point of interest and tries to identify possible ambassadors for the project. Furthermore, this chapter tries to analyse the perception of society towards energy transition. Finally, a possible ambassador is discussed.
6.1 Relevant Stakeholders There are many relevant actors in the Netherlands which R&Dialogue can bring together. Attachment 12 (table 12 – list of stakeholders) identifies many stakeholders in the field. The actors are mapped by sector, as government, research and
26

development organisations (RDOs), non-governmental organisations (NGOs), intergovernmental organisations (INGOs), trade associations, business, political parties, protests groups and media. R&Dialogue is leading in the consultation of stakeholders. The list is a selection and can be adjusted in future times.
With the identification of relevant stakeholders for R&Dialogue, an action plan can be drawn. In this action plan, first informal conversations will be held by the Dutch R&Dialogue team. With these input of these informal conversations a ‘coalition of the willing’ will be formed after which formal interviews will start. The list of relevant stakeholders for the informal interviews:
- Mark Dierkx Director General Ministry of Economics, Agriculture and Innovation;
- Arjan Dikmans Director Ministry of Infrastructure and Environment; - Guido van Woerkom Director ANWB (Royal Dutch Touring Club);- Marjan Minnesma Director Urgenda; - Martin van Pernis President Kivi – NIRIA (association for engineers);
Bert Stuij Agentschap NL;- Jan Brouwer Director CATO-2.
With the ‘coalition of the willing’ and other relevant stakeholders the development of the national vision can take place. In order to accompany the national vision with research, a theoretic framework is developed to give clear and factual information on the possible transition in the energy sector and the behaviour of stakeholders and society. More information on the theoretical framework can be found in the research proposal.
Conclusion The list in attachment 11 (table 11 – list of stakeholders) gives an overview of many stakeholders in the field. Depending on the progress of R&Dialogue, the relevance, intensity and number of stakeholders can change. The list depends on the upcoming conversations and interviews with stakeholders. The list may be incomplete and will be replenished in the coming period.
In order to reach relevant stakeholders an action plan is developed. This action plan starts with a round of informal conversations and tries to create a ‘coalition of the willing’ before the round of formal interviews start. Furthermore, R&Dialogue uses scientific theories to ground possible outcomes.
6.2 Contribution of the stakeholdersBy identifying the relevant stakeholders for this project, assumptions can be made on their contribution. Predicting and assuming certain scenarios and behaviour of stakeholders makes it easier for R&Dialogue to create mechanisms for effectively tackling challenges and proactively bring together different stakeholders.
In order to create a situation wherein stakeholders can contribute, R&Dialogue needs to provide a climate wherein stakeholders feel trusted, free to act, respected and independent. R&Dialogue facilitates the dialogue and makes the dialogue possible.
Predicted and assumed contribution:
27
respectable contribution to the dialogue; contribute on their level of knowledge, e.g. technical, social, economic,
influence and experience, personal expectations and emotions; difference in contribution between stakeholders, like different interests of
CSOs, RDOs, government, business, civilian and trade association; stakeholders will act according to their own interests and profile; all stakeholders are willing to cooperate and engage; all stakeholders are willing to share experiences; all stakeholders are open for mutual learning.
Conclusion R&Dialogue tries to take into account the possible contribution of stakeholders. For stakeholders to contribute, R&Dialogue facilitates the dialogue and brings stakeholders together in a climate that stimulates, feels trusted and is respected. The contribution of stakeholders is predicted and assumed in a general manner.
6.3 Point of interest for the stakeholders R&Dialogue tries to point out common points of interest for the stakeholders involved. Knowledge of common points of interest can bring stakeholders together and connect stakeholders that normally would not work together.
Possible points of interest could be: Vision on a sustainable future for our society, children, grandchildren; Provide consumers with energy and fulfil energy demand; Provide stability for the energy market; Dutch industry to remain competitive and profitable; Create stable and affordable energy prices; Vision on sustainable and ‘clean’ energy; Reduce GHG emissions; Increase production of low carbon energy industries; Creation of jobs; The Netherlands becomes an exporter of innovative ideas and LCTs.
ConclusionIdentifying possible common points of interest can be useful when predicting future behaviour and attitudes. Sharing and being transparent on points of interest can bring stakeholders together.
6.4 Views on transition In the process of R&Dialogue, it is possible to identify changes in society and changes that can provide transition. The research proposal and communication outline have outlined a theoretical perspective on how to investigate transition and public perception. Before starting the research, it is possible to identify possible emotions that might be present among stakeholders or others involved. It is important not to let presumptions influence this research and keep an open mind and attitude.
28
There are several stadia the transition can reflect on. Both stakeholders as society have stadia that could clarify their behaviour towards possible changes for transition. R&Dialogue starts with identifying possible views on transition. These are: ignorance, compliance, resilience, resistance, omniscience. Topics where stakeholders might act differently upon, either at the ignorance side or at the omniscience side, are among others, economic arguments, commitment with possible grassroots, level of cooperation and influence.
ConclusionIt is difficult to outline, at the beginning of this project, how a possible transition will be received by society and how this society can act upon transition. Five possible behaviours are outlined and can explain choices that are made in the energy sector and in the transition path. These behaviours are applicable to all kind of assumptions and might provide a structure in perceptions and views of stakeholders and involved ones.
6.5 Possible ambassadors R&Dialogue can benefit from an ambassador who carries out the objectives of the project, both nationally as European, and has therefore chosen to identify characteristics for an ambassador and possible persons with these characteristics. It has to be noted that, an ambassador is only useful if R&Dialogue creates logic tasks for this person to execute. For the Netherlands, it seems logic that an ambassador is able to connect stakeholders with one another, is respected in the field and beyond and has relevant knowledge.It is of course difficult to identify possible ambassadors for this project when the project finds itself in the first phase. An ambassador should have the following characteristics:
- Respected in the sector and country;- Charismatic in his/her communication;- Have the knowledge necessary; - Someone with a broad network;
- Someone who is visible in media and in the sector;
Possible ambassadors:
Ruud Lubbers: former politician or a former CEO of a big cooperation, ambassador of the Rotterdam Climate Initiative and has numerous experience in policy making, had and has an influential role, is a respected person and has the knowledge needed.
Marie van der Hoeve: executive director of the International Energy Agency and has proven her experience in the field, has a broad network and has knowledge of policy making.
Guido van Woerkom, executive director of the ANWB, the Royal Dutch Touring Club, and has a broad network, knowledge and an influential position.
Peter de Wit, former director of Shell Netherlands; now retired. Coby van der Linde, researcher at Clingendael Institute Netherlands. Jan Rotmans, professor sustainability and transition Erasmus University
Rotterdam.
29
Prins Carlos, chair foundation Netherlands get new energy. Ed Nijpels; former politician. Andre Kuipers; astronaut. Herman Wijffels: economist, political respected and involved, CEO of
Rabobank and currently leader of the Sustainable Finance Lab (and number 8 in the sustainable 100 list of Trouw newspaper).
Conclusion
R&Dialogue wishes to identify a possible ambassador for this project. A list with relevant characteristics is developed and persons with these characteristics are written down. Before appointing an ambassador, its necessity needs to be drawn.
30

TRIARII Strategy, Innovation, Implementation
Attachment 1. Table 1 - Overview legislation Legislation Level Sector Established in Last adjusted in Content
General information
UN Convention on Climate Change International International / UN members 1992 Definition of problems, objectives, principles and commitments concerning climate change worldwide
Kyoto Protocol International International 1997 Follow up of the Montreal Protocol (1987) and part of the UN Convention on Climate Change. Set of rules and regulations on how to prevent climate change and commit to a sustainable development.
Green Paper – Towards a European strategy for the security of energy supply
European European Commission / energy
2000 - Securing rising energy demand and dependence with observance of a sustainable society
The Energy Charter Treaty and related documents
European Energy Charter Secretariat / energy
2004 - Instrument focussing on the promotion on international cooperation in the energy sector
Communication: Energy 2020 – A strategy for competitive, sustainable and secure energy
European European Commission / energy
2010 - Incentives of EC to set a strategy on energy policy in 2020: 20% energy savings, free movement of energy – integrated energy market, secure, safe, affordable energy, focus on technology and innovation
White Paper – roadmap to a Single Euopean Transport Area – towards a competitive and resource efficient transport system
European European Commission / energy
2011 - Strategies for a competitive and sustainable internal market for the transport sector
CoalEnvironmental Supervision Act National National government 1979 2012 National hygiene and environment, waste management, supervision in the
broadest sense possibleEnvironmental Effect Reports (MER) National National government 1994 2010 Procedure to consider and weight environmental issues as a legal part of the
Environmental Supervision Act.Mining Act BES (Netherlands, Bonaire, St. Eustasius, Saba)
National National government 2002 2012 Rules and regulations concerning mining, treatment of coal, oil, gas and ccs on and offshore (assembly of four mining acts)
Act on Council for the Environment and Infrastructure
National National government 2012 Council for the environment and infrastructure that advices government on policy initiatives and implementations
OilEnvironmental Supervision Act National National government 1979 2012 National hygiene and environment, waste management, supervision in the
broadest sense possibleEnvironmental Effect Reports (MER) National National government 1994 2010 Procedure to consider and weight environmental issues as a legal part of the
Environmental Supervision Act.Mining Act BES (Netherlands, Bonaire, St. Eustasius, Saba)
National National government 2002 2012 Rules and regulations concerning mining, treatment of coal, oil, gas and ccs on and offshore (assembly of four mining acts)
Act on Council for the Environment and Infrastructure
National National government 2012 Council for the environment and infrastructure that advices government on policy initiatives and implementations
GasGas bill National National government 1962 2012 First division of activities concerning gas; drilling, transport and production.Environmental Supervision Act National National government 1979 2012 National hygiene and environment, waste management, supervision in the
broadest sense possible
TRIARII BV – MAURITSKADE 33 – 2514 HD THE HAGUE – THE NETHERLANDS - TELEPHONE +31 (0)70 3283574 – FAX +31 (0)70 3284301 – [email protected]
Air pollution Act National National government 1987 Policy for emission standards in turbines concerning air pollutionEnvironmental Effect Reports (MER) National National government 1994 2010 Procedure to consider and weight environmental issues as a legal part of the
Environmental Supervision Act.Gas Act National National Government 2000 Policy on transport and supply of gasEnvironmental Task gas companies gas act
National National Government 2002 Policy and regulations for gas companies to the environment
Export of gas act National National Government 2003 Supply of gas to householdsAmendment on Electricity and Gas Act
National National Government 2006 Amendment on independence in gas and electricity networks and transport
Act on Council for the Environment and Infrastructure
National National government 2012 Council for the environment and infrastructure that advices government on policy initiatives and implementations
Decree on burning of waste (materials)
European National government 2000 / 2004 Policy on burning of waste (materials) as biomass
ElectricityElectricity Act National National government 1998 Production, transport and supply of electricity in the NetherlandsAmendment on Electricity and Gas Act
National National Government 2006 Amendment on independence in gas and electricity networks and transport
Environmental Supervision Act National National government 1979 2012 National hygiene and environment, waste management, supervision in the broadest sense possible
Environmental Effect Reports (MER) National National government 1994 2010 Procedure to consider and weight environmental issues as a legal part of the Environmental Supervision Act.
Construction decree National National government 2003 Rules and regulations on construction considering security, health, sustainability, environment, relevance
Renewable energy sources
Environmental Supervision Act National National government 1979 2012 National hygiene and environment, waste management, supervision in the broadest sense possible
Environmental Effect Reports (MER) National National government 1994 2010 Procedure to consider and weight environmental issues as a legal part of the Environmental Supervision Act.
SDE European Commission
National government 2003 2009 Incentives for sustainable energy production with wind, solar PV, osmoses, water power
SDE+ European Commission
National government 2012 Incentives for sustainable energy production with wind, solar PV, water power, osmoses, biomass, geothermal energy
Stimulus sustainable energy production act
National National Government 2007 Subsidies for the production of renewable electricity, gas and warmth cogeneration
Energy and environment investment allowance Act
National National Government 2007 Allowance for energy and environmental investments
Implementation EU Directives energy efficiency act
National National Government 2011 Implementation of the EU Directive on energy efficiency
Act on ECN (Energy investigation centre Netherlands)
National National government 2012 Acknowledgement foundation Energy investigation Centre Netherlands (ECN) deliver personal control measures
Framework law subsidies for sustainability in public works and water management
National National government 2012 2015 Subsidies and fiscal benefits for electrical cars amongst others

Wind energySupervision Act on public works and water management
National Rijkswaterstaat (public works and water management
1996 2012 Legislation and policy acts on public works and water management
Housing Act National National, municipalities 1991 Rules and regulations concerning the building of houses, permits, development plans, commission on prosperity planning
Environment protection act (Natura 2000)
European Commission
National government 1998 2012 Policy concerning protection of the landscape and environment
Civil Code National National, provincial, municipality
Policy on the direct behaviour and surroundings of people
Environmental Effect Reports (MER) National National government 1994 2010 Procedure to consider and weight environmental issues as a legal part of the Environmental Supervision Act.
Electricity Act National National government 1998 Production, transport and supply of electricity in the NetherlandsSpatial Planning Act National National government,
provinces, municipalities2006 Rules and regulations concerning spatial planning
Water Act National National government 2009 2012 Policy on surface water, groundwater, permits, town and country planning, administration,
Crisis and recovery act National National government 2010 Rules and regulation for accelerated development and realization of spatial and infrastructural projects due to the economic and financial crisis
SolarElectricity Act National National government 1998 Production, transport and supply of electricity in the NetherlandsEnvironmental tax policy act National National government 1994 Taxation of environmental measures and products as coal tax, energy tax, tap
water tax and wrapping taxCivil Code National National, provincial,
municipalityPolicy on the direct behaviour and surroundings of people
Power from WaterProject European ComCoast flood risks management schemes
European WP3 European Commission 2007 European project which develops and demonstrates innovate solutions for flood protection in coastal areas
WINN Water Innovation Programme National Dutch Department of Public Works (Rijkswaterstaat)
2007 2011 Follow up of ComCoast and investigates the potential of multifunctional flood schemes
Water Act National National government 2009 2012 Policy on surface water, groundwater, permits, town and country planning, administration,
Environmental Effect Reports (MER) National National government 1994 2010 Procedure to consider and weight environmental issues as a legal part of the Environmental Supervision Act.
WasteDirective waste materials (2008/98/EG)
European Nation government 2006 2008 On treatment of waste in the European Union

Environmental Supervision Act National National government 1979 2012 National hygiene and environment, waste management, supervision in the broadest sense possible
Environmental Effect Reports (MER) National National government 1994 2010 Procedure to consider and weight environmental issues as a legal part of the Environmental Supervision Act.
Rural waste supervision plan (LAP)1 National Provinces and Municipalities 2003-2009 2004 Waste prevention, permits, maintenance and gathering (latter task of Municipality)
Rural waste supervision plan (LAP)2 National Provinces and Municipalities 2009-2015 2010 Waste prevention, permits, maintenance and gathering (latter task of Municipality)
NuclearNuclear energy act National National government 1963 2011 Act on nuclear energy, nuclear fuels, radioactive materials, ionising radiation,
responsibilities concerning maintenance, permits, safety and all other forms of regulation concerning nuclear energy.
Environmental Effect Reports (MER) National National government 1994 2010 Procedure to consider and weight environmental issues as a legal part of the Environmental Supervision Act.

TRIARII Strategy, Innovation, Implementation
Attachment 2. Table 2 – taxes
Tax on electricity and gas Electricity per kWh 2013 2012 exc. VAT0 – 10.000 € 0,1165 € 0,114010.001 – 50.000 € 0,0424 € 0,041550.001 – 10 million € 0,0113 € 0,0111> 10 million non business € 0,0010 € 0,0010> 10 million business € 0,0005 € 0,0005
Gas per m3 2013 2012 exc. VAT0 – 5.000 € 0,1862 € 0,16675.001 – 170.000 € 0,1862 € 0,1443170.001 – 1 million € 0,0439 € 0,0400> 1 million – 10 million* € 0,0160 € 0,0127> 10 million non business* € 0,0115 € 0,0119> 10 million business € 0,0115 € 0,0083For motors** € 0,0959 € 0.0639* distinction between non business and business is lapsed since 2013** only for CNG (Compressed Natural Gas)
Table 3 - Revenues from environmental tax
TRIARII BV – MAURITSKADE 33 – 2514 HD THE HAGUE – THE NETHERLANDS - TELEPHONE +31 (0)70 3283574 – FAX +31 (0)70 3284301 – [email protected]
Million € 2000 2005 2010 2011Total € 13973 € 17270 € 19871 € 19601From economic activities € 5854 € 6700 € 7972 € 8076
On the account of the industry and energy sector
€ 1213 € 1068 € 1805 € 1818
Whereof Industry € 710 € 839 € 1531 € 1539Whereof energy production and distribution
€ 287 € 26 € 33 € 34
Households € 7748 € 10175 € 11409 € 11035Non-residents € 371 € 395 € 490 € 490
Attachment 3. Table 4 – list of surveys
ECN – Reference Projection Energy and Emissions 2010 – 2020 (December 2010); http://www.ecn.nl/docs/library/report/2010/e10049.pdf
ECN – Referentieraming energie en emissies: actualisatie 2012 (July 2012); http://www.ecn.nl/docs/library/report/2012/e12039.pdf
Bellona – Renewable energy policies in Europe (May 2012); http://bellona.no/filearchive/fil_Renewable_energy_policies_in_Europe_samlet_rapport.pdf
Cato2 – The Dutch general public’s opinion on CCS and energy transition: Development in awareness, knowledge, beliefs and opinions related to information and media coverage (April 2011); http://www.co2-cato.org/publications/publications/the-dutch-general-public-s-opinion-on-ccs-and-energy-transition-development-in-awareness-knowledge-beliefs-and-opinions-related-to-information-and-media-coverage

De Best-Waldhober et al. – informed public opinion in the Netherlands: Evaluation of CO2 capture and storage technologies in comparison with other CO2 mitigation options (May 2012); http://www.sciencedirect.com/science/journal/17505836
Terwel et al. – It’s not only about safety: Beliefs and attitudes of 811 local residents regarding a CCS project in Barendrecht (March 2012); http://www.sciencedirect.com/science/article/pii/S1750583612000576
Schmidt – Vol in de wind, een vergelijkende landenstudie naar succesfactoren achter het groeitempo van windenergie op land (April 2003);
CBS – Renewable energy in the Netherlands 2010 (2012); http://www.cbs.nl/en-GB/menu/themas/industrie-energie/publicaties/publicaties/archief/2012/2012-renawble-energy.htm
ECN – Realised energy savings 1995-2002 (Oktober 2004); http://www.ecn.nl/docs/library/report/2004/c04085.pdf ECN – Renewable energy projections as published in the national renewable energy action plans of the European
member states (November 2011; http://www.ecn.nl/docs/library/report/2010/e10069.pdf ING – Hernieuwbare energie in Nederland tot 2020 (September 2011);
http://www.ing.nl/Images/Hernieuwbare_energie_in_Nederland_tot_2020_tcm7-93708.pdf ECN en KEMA – Biomassa: feiten, cijfers, observaties. Stand van zaken 2010 (2010);
http://www.eon.nl/Cms_Data/Contents/Eon_business/Media/document/Biomassa-feiten-cijfers-observaties.pdf
Attachment 4. Table 5 – documents and reports Government and advise councils for the government
RLI – Remmen los (October 2011); http://www.rli.nl/publicaties/2011/advies/remmen-los-advies-over-versnelling-energietransitie
Ministerie van Economische Zaken, Landbouw en Innovatie (2011) - Energierapport 2011 Agentschap NL (2010) – Zonnestroom en de Nederlandse wetgeving; Milieu en Natuur Planbureau (2007) – Milieubalans;
Research and scientific institutes CE Delft, KEMA – Maatschappelijke kosten en baten van intelligente netten (March 2012);
http://www.rijksoverheid.nl/documenten-en-publicaties/rapporten/2012/03/30/maatschappelijke-kosten-en-baten-van-intelligente-netten.html
ECN – Reference Projection Energy and Emissions 2010 – 2020 (December 2010); http://www.ecn.nl/docs/library/report/2010/e10049.pdf
ECN – Referentieraming energie en emissies: actualisatie 2012 (July 2012); http://www.ecn.nl/docs/library/report/2012/e12039.pdf
Civil society organisations Stichting Natuur en Milieu (2008) – Zeekracht; Urgenda (2010) – Samen, snelle, duurzamer; IMSA Amsterdam (2010) – Grenzen aan de groei, club van Rome 1972-2100;
Trade associations / business Royal HasKoning (2010) - Schaliegas in Nederland; ING (2011) – Hernieuwbare energie in Nederland tot 2020;
Attachment 5. Overview gas grid Netherlands

Attachment 6. Table 6 – Dialogue initiatives

The debate cycle of FD (financial times of The Netherlands) together with E.On (European energy company) on the role and future of energy. Started in the fall of 2011 with a cycle of debates and tend to proceed. The audience are people from known energy and related industries and trade companies, policy makers, consultants and journalists; mostly professionals 22;
Development of a Netherlands Energy transition agreement, September 3rd 2012: representatives of several political parties have agreed to develop a national energy transition agreement the day after the elections (September 12th 2012). It is a government led and stimulated initiative at national level made possible by Foundation Netherlands Get New Energy 23;
The Dutch Sustainable Growth Coalition provided by Ernst & Young http://www.ey.com/NL/nl/Newsroom/PR-activities/Dutch-Sustainable-Growth-Coalition_event
SenterNovem (predecessor of AgentschapNL) organised several debates and symposia on innovation, emissions and corporate social responsibility in 2008 and 2009;
Stichting Energie Dialoog (Foudation Energy Dialogue) http://www.energiedialoog.nl/ founded in 2006 and has set up research and dialogue on the failed implementation of CCS in Barendrecht. Not active anymore;
Masterclass Energie in debat (Energy in debate) of University Nyenrode and RTLZ (broadcasting agency) http://www.rtl.nl/service/masterclasses/energiedebat/ a one day course in September 2011 providing information on future perspectives, alternatives and dependences;
Dialogue on the new to build wind mill park in the Flevopolder, near Urk. From 2010 onwards there has been an eager discussion on the future of a wind mill park in the Flevopolder. Protest groups and an on-going debate emerged. Some argue that lack of commitment and early consultation of government with the people are a result of the many protests 24;
On-going discussion in province Noord-Holland on whether or not to build new wind mill parks onshore. The province Noord-Holland has legally banned wind mill parks onshore, only municipalities, like Amsterdam, are against this ban 25. Besides this, there is an action platform protesting against the building of a wind mill park offshore near Noordwijk;
Since 2007 there has been a discussion on the implementation of CCS onshore in Barendrecht. After years of debate, the involved stakeholders had to decide to stop this initiative. Several research documents argue that lack of communication is an important reason for this dialogue to collapse 26;
Instituut voor Milieuvraagstukken and Copernicus instituut held in 2007 and 2008 a discussion and dialogue concerning biomass; biomassadialoog 27;
22 FD / E.On debates http://fd.nl/events/fdenergiedebat/23 Stichting Nederland krijgt nieuwe energie http://www.nederlandkrijgtnieuweenergie.nl/cms/index.php?mid=&pagina=nieuws&nid=16524 http://www.nrc.nl/nieuws/2011/01/06/definitief-besluit-over-windmolenpark-bij-urk/25 http://www.bnr.nl/programma/bnrduurzaam/217672-1209/noord-holland-zegt-nee-tegen-nieuwe-windmolens26 ECN 2010 – What happened in Barendrecht? 27 Instituut voor Milieuvraagstukken 2009 – biomassadialoog eindrapport

Attachment 7. Table 7 – energy balance Energy balance in PJ
Balance Winning Import Export Total energy conversion
Total energy consumption
Total balance energy conversion
Energetic final consumption
Non-energetic final consumption
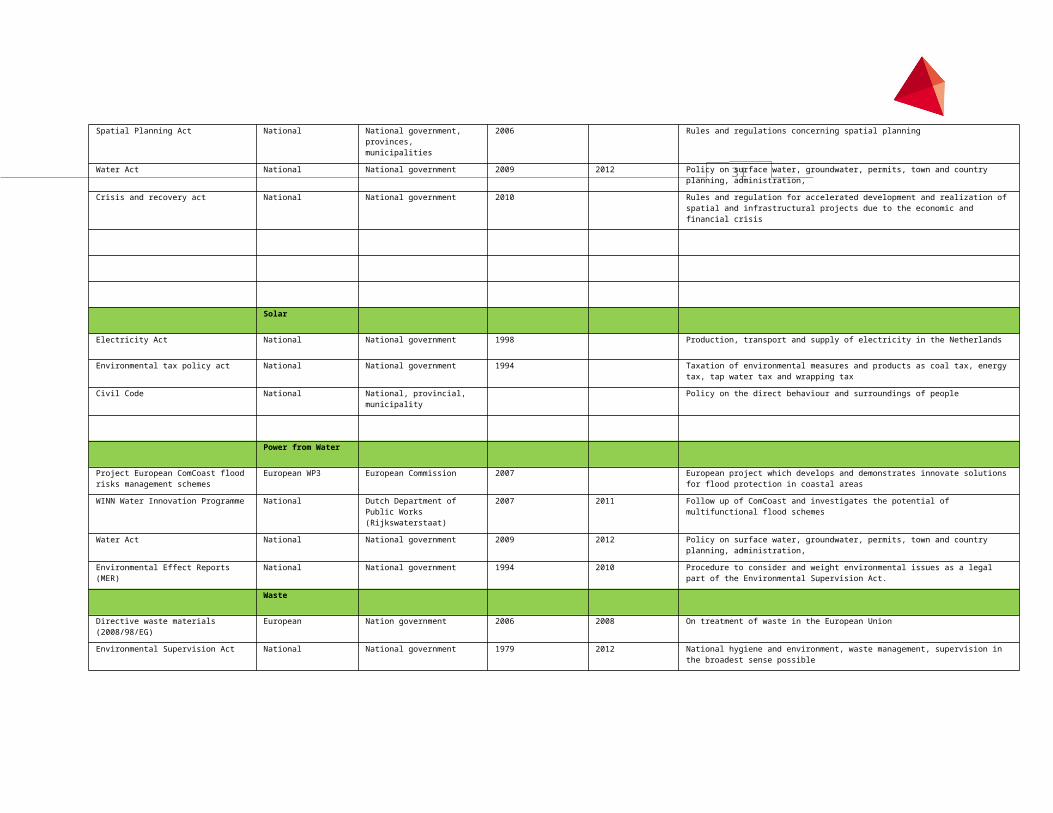
Total 2000 2417,04 7528,53 6075,78 4836,34 3066,7 459,7 2112,44 494,562005 2628,42 8588,92 6977,98 5417,4 3315,95 500,24 2171,06 644,652010 2934,61 9593,71 8299,96 4399,68 3492,64 511,17 2264,73 716,732011 2707,37 9313,18 7954,17 4228,49 3257,84 471,04 2128,13 658,67
Coal and other coal products
2000 - 597,77 262,23 363,6 328,56 251,28 20,12 57,162005 - 553,53 206,31 376,37 342,1 253,44 21,28 67,382010 - 543,02 157,7 354,71 318,17 240,29 20,24 57,642011 - 635,99 145,68 343,62 312,77 228,76 19,51 64,5
Oil and oil products 2000 102,56 6325,89 4557,11 3798,78 1074,36 116,97 648,82 308,572005 97,89 7261,87 5187,32 4277,52 1254,17 104,19 696,16 452,822010 60,86 8222,07 6310,06 3137,34 1304,63 51,9 709,77 542,962011 62,99 7912,63 6091,29 3030,28 1251,63 49,89 716,87 484,87
Gas Winning Import Export Total energy conversion
Total energy consumption
Total balance energy conversion
Energetic final consumption
Non-energetic final consumption
2000 2188,85 522,26 1241,93 530,71 1469,05 530,71 836,32 102,022005 2356,7 688,24 1564,91 588,7 1480 588,7 796,96 94,342010 2656,84 772,52 1786,1 691,14 1642,67 687,21 861,86 93,62011 2418,97 690,32 1675,69 628,92 1434,11 624,77 719,85 89,5
RES Total RES 2000 53,18 - - 37,5 53,18 37,5 15,68 -2005 88,58 - - 72,31 88,58 72,31 16,28 -2010 127,35 - - 110,75 127,35 110,75 16,6 -2011 132,38 - - 115,86 132,38 115,86 16,52 -
Wind 2000 2,98 - - 2,98 2,98 2,98 - -2005 7,44 - - 7,44 7,44 7,44 - -2010 14,38 - - 14,38 14,38 14,38 - -

2011 18,38 - - 18,38 18,38 18,38 - -Hydro Winning Import Export Total energy
conversionTotal energy consumption
Total balance energy conversion
Energetic final consumption
Non-energetic final consumption
2000 0,51 - - 0,51 0,51 0,51 - -2005 0,32 - - 0,32 0,32 0,32 - -2010 0,37 - - 0,37 0,37 0,37 - -2011 0,2 - - 02 0,2 0,2 - -
Solar 2000 0,48 - - 0,03 0,48 0,03 0,46 -2005 0,91 - - 0,12 0,91 0,12 0,79 -2010 1,21 - - 0,21 1,21 0,21 1 -2011 1,25 - - 0,26 1,25 0,26 0,99 -
Earth energy, deep
2000 - - - - - - - -2005 - - - - - - - -2010 0,32 - - - 0,32 - 0,32 -2011 0,32 - - - 0,32 - 0,32 -
Total biomass
2000 49,21 - - 33,98 49,21 33,98 15,23 -
2005 79,91 - - 64,43 79,91 64,43 15,49 -2010 111,07 - - 95,79 111,07 95,79 15,28 -2011 112,23 - - 97,02 112,23 97,02 15,21 -
Biogeen, domestic waste
2000 25,51 - - 25,51 25,51 25,51 - -2005 26,66 - - 26,66 26,66 26,66 - -2010 34,21 - - 34,21 34,21 34,21 -2011 36,95 - - 36,95 36,95 36,95 - -
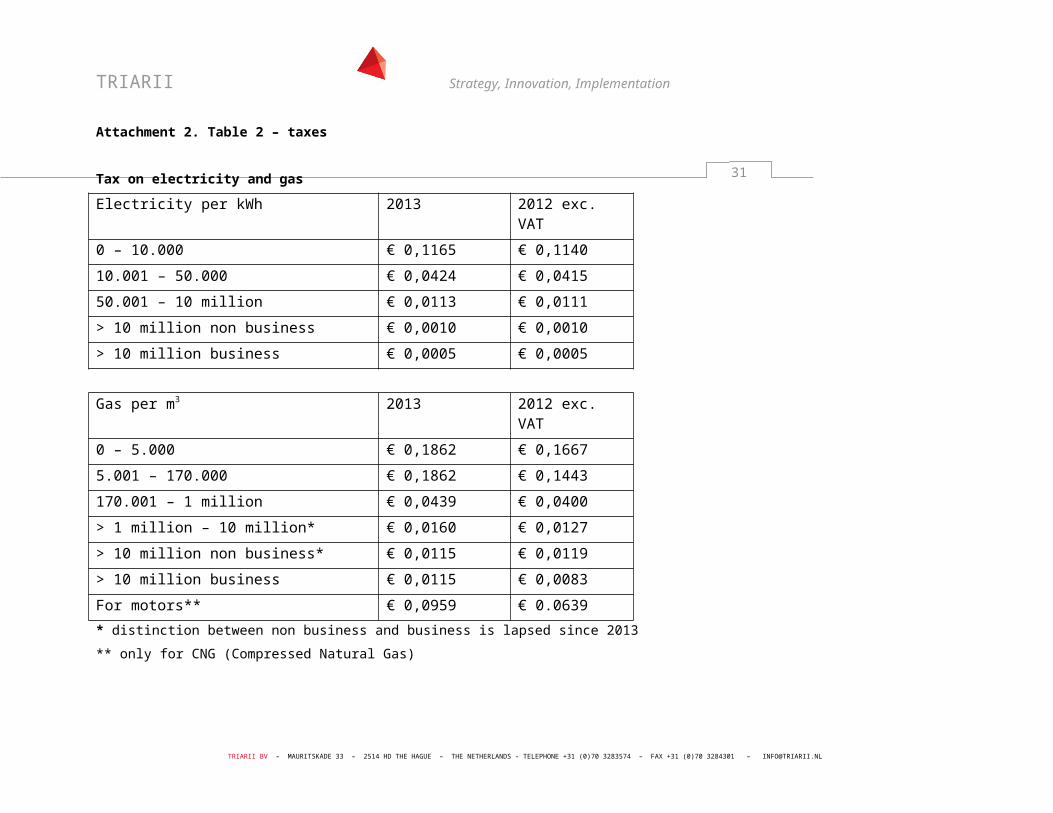
Solid and liquid biomass
2000 17,55 - - 5,09 17,55 5,09 12,47 -2005 47,36 - - 34,22 47,36 34,22 13,14 -2010 63,97 - - 50,49 63,97 50,49 13,48 -2011 62,78 - - 49,16 62,78 49,16 13,62 -
Biogas Winning Import Export Total energy conversion
Total energy consumption
Total balance energy conversion
Energetic final consumption
Non-energetic final consumption
2000 6,14 - - 3,38 6,14 3,38 2,76 -2005 5,89 - - 3,55 5,89 3,55 2,35 -2010 12,89 - - 11,08 12,89 11,08 1,8 -2011 12,5 - - 10,91 12,5 10,91 1,59 -
Nuclear 2000 40,5 - - 40,5 40,5 40,5 - -2005 41,27 - - 41,27 41,27 41,27 - -2010 38,41 - - 38,41 38,41 38,41 - -2011 40,16 - - 40,16 40,16 40,16 - -
Waste and others 2000 32,94 - - 28,98 32,94 28,98 3,96 -2005 43,98 - - 33,39 43,98 33,39 10,59 -2010 51,15 - - 33,45 51,15 33,45 17,71 -2011 52,87 - - 35,36 52,87 35,36 17,51 -
Electricity 2000 - 82,61 14,15 15,57 68,09 -307,1 348,39 26,82005 - 85,29 19,43 17,35 65,85 -344,17 380,91 29,122010 - 56,1 46,11 16,38 10 -408,92 396,4 22,522011 - 74,23 41,51 16,98 33,77 -389,44 403,4 1981
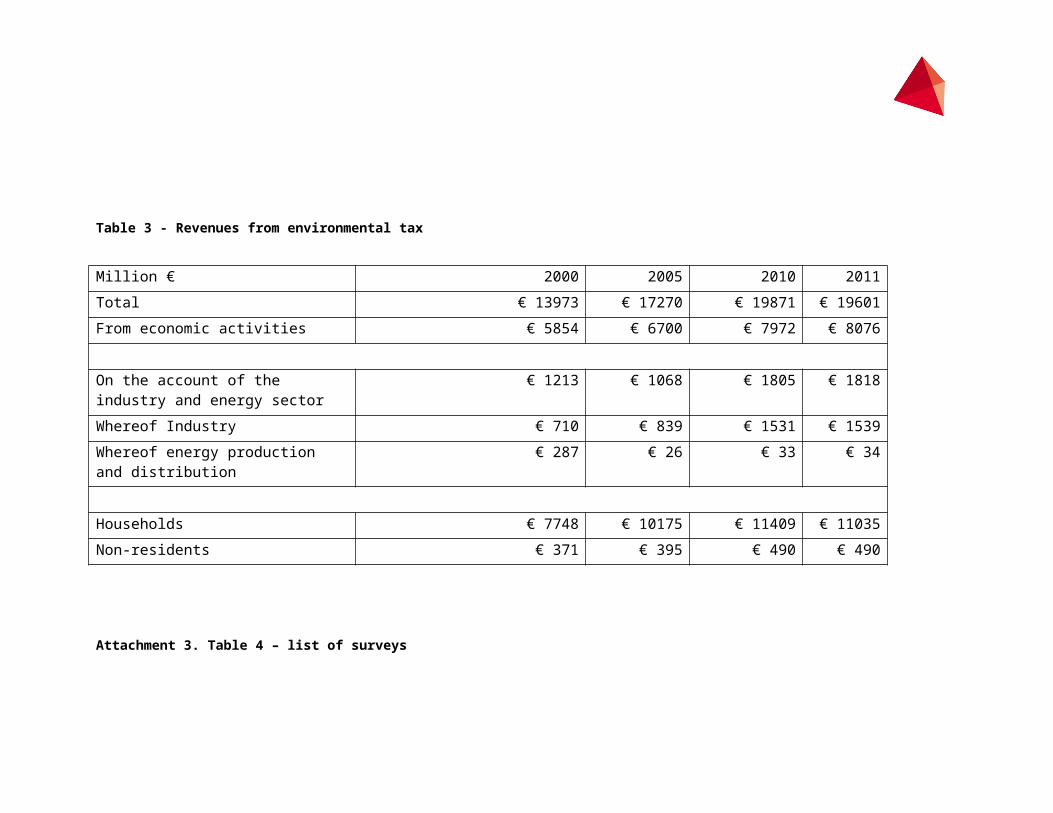
Heat 2000 - - - 20,71 - -239,15 239,15 -2005 - - - 10,49 - -248,88 248,88 -2010 - - - 17,49 - -241,91 242,162011 - - - 17,3 - -234,33 234,47 -
Attachment 8. Table 8 – Financial information of companies active in the energy sector according to SBI 2008 Energy supply Energy companies Trade in electricity and gas
Business revenues / net profit In million € 40 910 40 910 No info
Trading results 3525 3 525 No info
Balance financial costs and benefits 1 338 1 338 No info
Attachment 9. Table 9 – GDP and investment on research and development In million € 2000 2005 2010 2011
GDP total 417 960 513 407 588 740 601 973
Specified to industry (without construction) and energy
Industry without construction and energy
71 271 84 813 99 002 105 033
Mineral winning 9 050 12 532 17 039 19 708
Industry 54 655 61 405 65 086 69 626
Energy supply 4 060 6 933 12 385 11 104
Water and waste management
3 506 3 943 4 492 4 595
Research and development share % of GDP % of GDPTotal spend on R&D 9 772 1.9% 10 892 1.85%
Businesses’ share 5 169 5 218
Institutes’ share 1 216 1 279
Educations’ share 3 387 4 395
Source: CBS website 2012

Attachment 10. Table 10 – rate of deployment LCTs
In PJ Total energy usage % of total energy consumption
Electricity % of total energy consumption
Heat % of total energy consumption
Transport
% of total energy consumption
Total consumption 2000 29,4 1,37 10,3 0,48 19,0 0,89 - -
2005 51,6 2,31 26,8 1,20 24,7 1,11 0,10 0,0
2010 86,4 3,75 42,1 1,83 34,6 1,50 9,6 0,42
2011 92,6 4,28 43,0 1,99 36,6 1,69 13,0 0,60
Attachment 11. Table 11 – energy usage per sector
PJ 2000 2005 2010 2011Energy sector Total 556 610 608 582
Coal and related products 224 247 234 223Oil and related products 190 184 117 123Gas 443 495 560 506Renewables 9 40 51 52Nuclear energy 41 41 38 40waste 0 1 0 0Electricity -247 -268 -300 -276Heat -123 -130 -92 -85
Industry Total 1113 1260 1293 1213Coal and related products 83 95 84 90Oil and related products 386 539 664 596Gas 415 375 339 323Renewables 4 5 5 5Nuclear energy - - - -

waste 5 6 5 5Electricity 124 129 124 123Heat 95 111 72 71
Transport Total 462 486 492 499Coal and related products - - - -Oil and related products 457 481 485 493Gas 0 0 0 1Renewables - - - -Nuclear energy - - - -waste - - - -Electricity 6 6 6 6Heat - - - -PJ 2000 2005 2010 2011
Households Total 432 425 479 405Coal and related products 0 0 0 0Oil and related products 4 4 4 3Gas 334 315 362 294Renewables 10 10 10 10Nuclear energy - - - -waste 0 1 2 2Electricity 78 87 89 85Heat 6 8 11 10
2000 2005 2010 2011Agriculture,Fisheries andServices
Total 502 534 620 546Coal and related products 1 0 0 0Oil and related products 38 46 34 26Gas 278 296 382 310Renewables 30 33 60 65Nuclear energy - - - -waste 27 36 44 45

Electricity 107 112 91 95Heat 221 11 9 4
Attachment 12. Table 12 – List of stakeholdersStakeholders
Research institutes
Universities NGOs Government and government institutes
Trade Associations Business Political parties
TNO TU Eindhoven Stichting Milieu Centraal Agentschap NL Stichting Netbeheer Nederland Shell PVV
ECN TU Delft MilieuDefensie Ministerie EL&I VNO-NCW Exxon VVDNODE TU Wageningen Wereld Natuur
Fonds Ministerie I&M MKB Nederland BP SGPIpsos Synovate Vrije Universiteit
AmsterdamGreenpeace
Eerste Kamer Energie Nederland NAM CDADNV-KEMA Universiteit van
Amsterdamconsumentenbond Tweede Kamer Nogepa Eon D66
Energy Delta Institute
Universiteit Leiden
meermetminderProvinciale Staten Stichting zero emissie busvervoer Nuon PvdA
Universiteit Utrecht
ANWB Vereniging Nederlandse Gemeenten Mr. Green Essent PvdD
Universiteit van Tilburg
vereniging eigen huis gemeente Rotterdam VNCI Eneco GL
Erasmus Universiteit Rotterdam
KIVI-NIRIA
provincie Groningen VNPI Gasunie CU
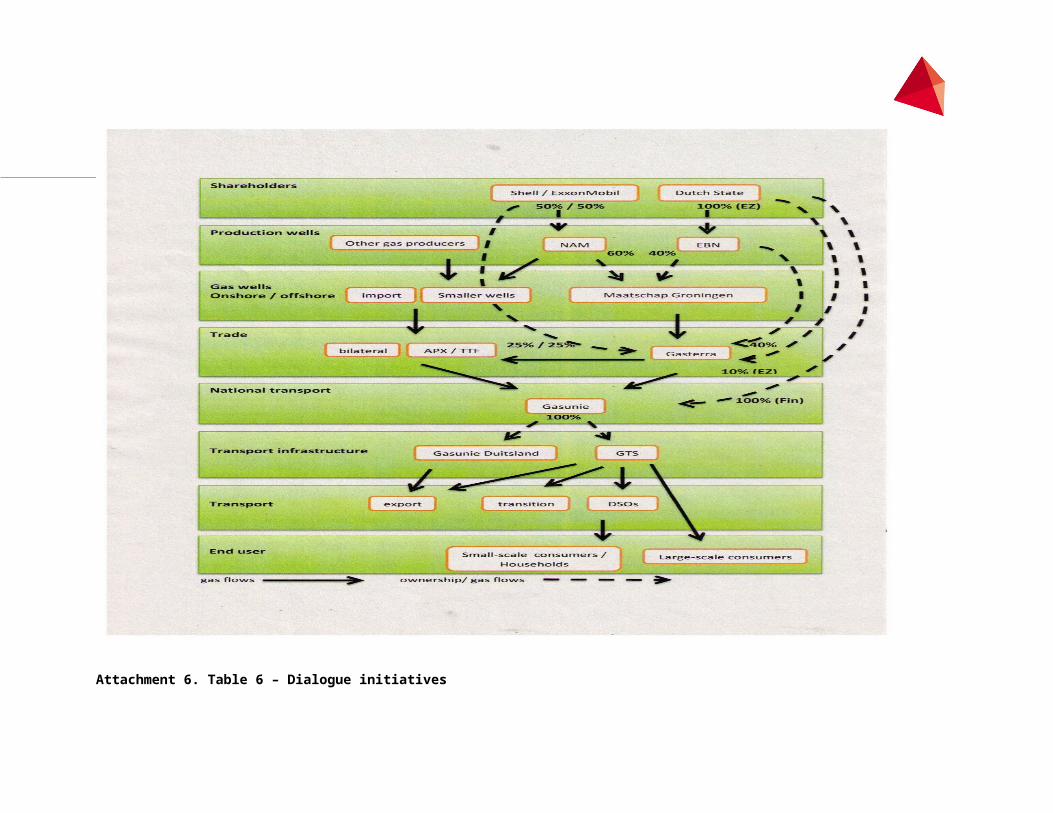
Rijksuniversiteit Groningen
Energy valley milieudienst Rijnmond DCMR
COGG (Centraal Overleg Gevaarlijke Goederen) Electrabel SP
Stichting Borg Europia Stedinwoningcorporaties NEA (Nederlandse
Emissieautoriteit Delta
Tennet
GasterraHavenbedrijf Rotterdam
deltalinqs
Liander
EnexisEnergie Beheer Nederland (EBN)
GATE
EMO
RABO bankYellow & Blue (investeerder)
Triodos bank


![EUROPEAN ETS 300 799 TELECOMMUNICATION STANDARD€¦ · ETS 300 799: September 1997 Introduction This ETS is one of a set associated with ETS 300 401 [1] describes the transmitted](https://img.pdfslide.us/doc/110x75/602b481e7085d253135ff9e5/european-ets-300-799-telecommunication-standard-ets-300-799-september-1997-introduction.jpg)