Embed Size (px)
Citation preview
Central Okanagan Economic Profile for
Agriculture
NOVEMBER, 2015
The Central Okanagan Economic Development Commission extends special thanks to Carl
Withler, Industry Specialist, Tree Fruits & Grapes, with the BC Ministry of Agriculture for his
assistance in the development of this document.
ContentsThe Changing Face of Agriculture ....... 3
Current Environment for Canadian Farmers ......4
British Columbia and the Thompson-Okanagan Region .............................................................................. 5
A Hub for Agricultural Research and Innovation ............................................................................................9
Agri-Tourism ................................................................ 10
Business Planning for Farm Operators ............... 10
Statistical Data - Agriculture in Brief – Regional District of Central Okanagan .................................. 12
Statistical Data - 2011 Census of Agriculture Highlights for Thompson-Okanagan .................. 13
Operating a Business on Agricultural Land – What You Need to Know .......... 14
Regulatory Agencies and Processes Affecting Agricultural Land Use .............................................. 15
The ALR Process ......................................................... 16
BC Ministry of Agriculture Information and Resources ..................................................................... 17
Okanagan Industry Contacts ................................. 18
Resources ..................................................20
3 CENTRAL OKANAGAN ECONOMIC PROFILE FOR AGRICULTURE
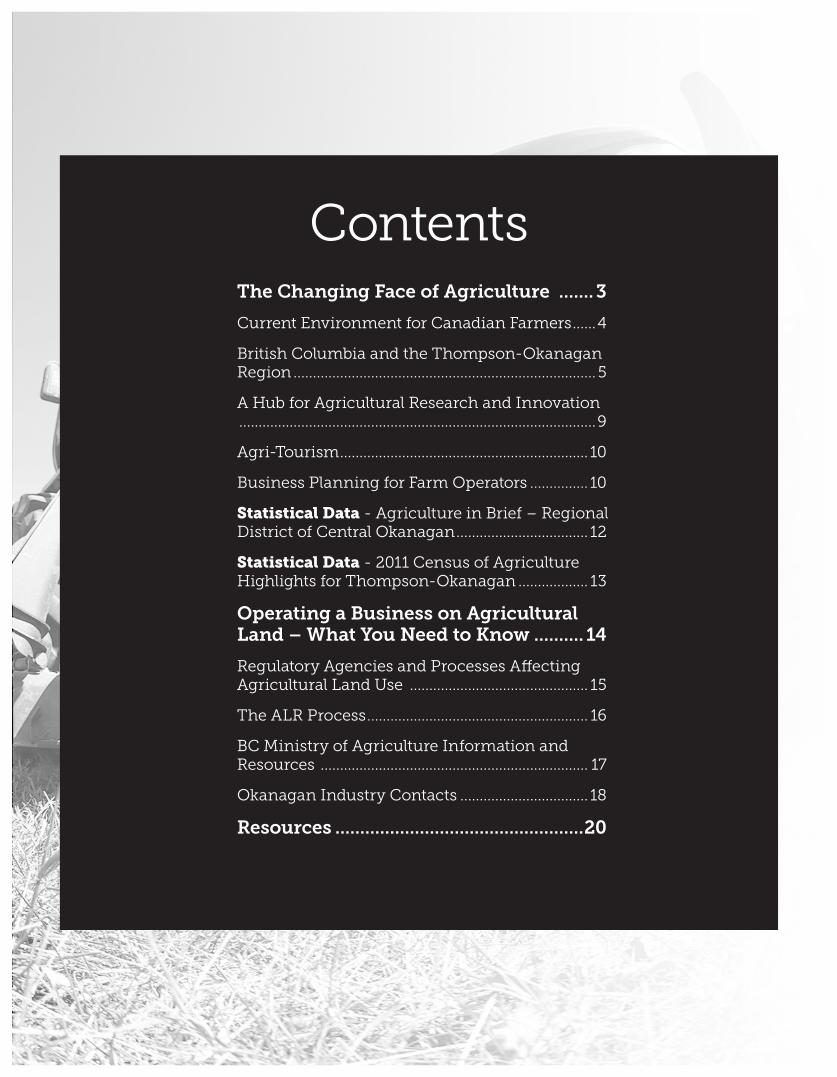
The Changing Face of Agriculture
In every part of the world, agriculture is changing, posing
both challenges and opportunities around the production
of food. With global population expected to reach 9 billion
by 2050, the need to produce more food for developing
countries such as China and India is paramount. In addition,
rising income and urbanization have created the demand
for food that meets diverse and changing tastes.
Climate change has impacted not only agriculture produc-
tion, there is a new awareness of the need to preserve and
protect the environment by adopting innovative growing
techniques. As agriculture has become increasingly driven
by technology and environmental concerns, farmers are
challenged to grow more food without cultivating signifi-
cantly more land.
A report on world agriculture presented in July, 2015
jointly by the United Nations Organization for Economic
Co-operation and Development (OECD) and the Food and
Agriculture Organization described several outcomes as a
result of these trends. Agricultural trade will increase more
slowly than in the past decade, while agricultural produc-
tion and consumption will be stable. Exports of agricultural
commodities will be concentrated among a few exporting
countries, and a growing number of countries will import
agricultural products.
Rising incomes will prompt consumers to continue diver-
sifying their diets, notably increasing their consumption of
Serina Penner, Jackaloupe Farms, West Kelowna
4 CENTRAL OKANAGAN ECONOMIC PROFILE FOR AGRICULTURE
animal protein relative to starches. Worldwide fisheries pro-
duction is projected to expand by almost 20% by 2024 with
aquaculture expected to surpass total capture fisheries in
2023. Production of other protein foods such as soybeans
should increase.
Current Environment for Canadian Farmers
Since the Second World War, growth of Canada’s economy
and related social changes have contributed to increased
productivity from fewer and larger farms, and food process-
ing and distribution firms. Increased income and the prev-
alence of dual-income families combined with Canada’s
broad ethnic mix have fuelled the demand for greater vari-
ety of foods including “healthy” foods, convenience foods,
ethnic foods, and fresh fruits and vegetables. The liberal-
ization of international trade regulations has increased pro-
ductivity and helped many agricultural sub-sectors become
more internationally competitive, with considerable exports
of Canadian oilseeds, grains, pork, beef and livestock.
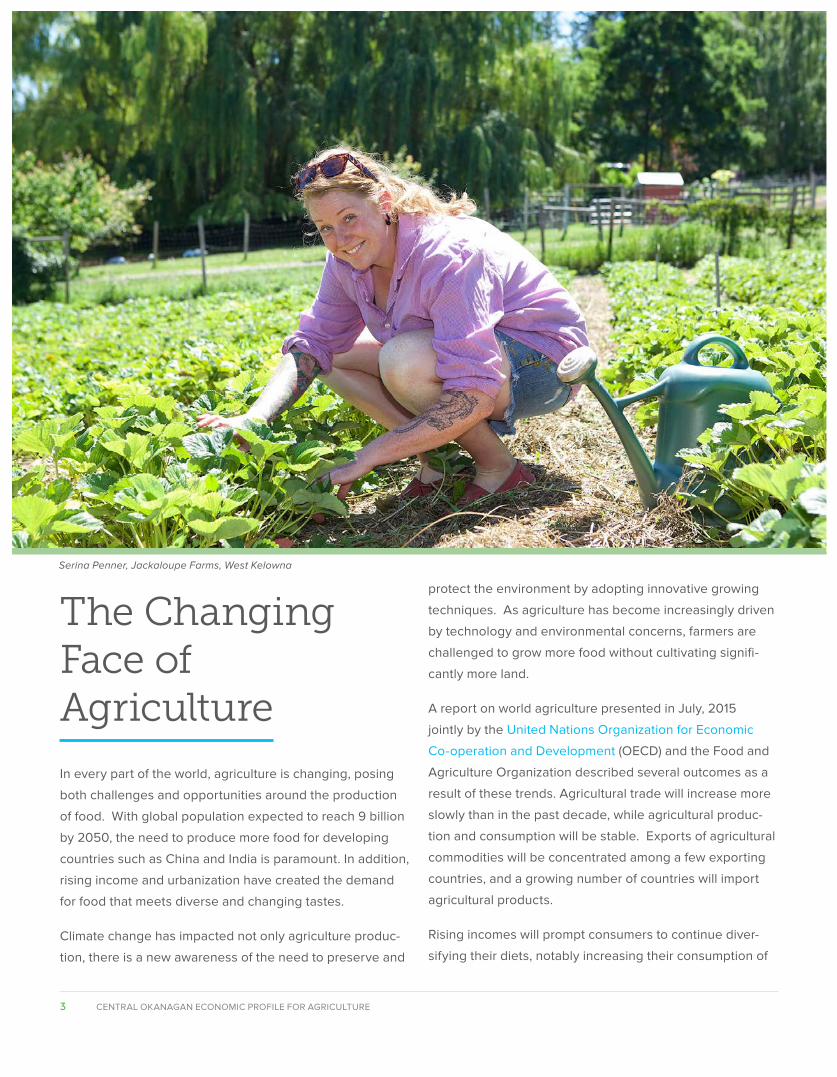
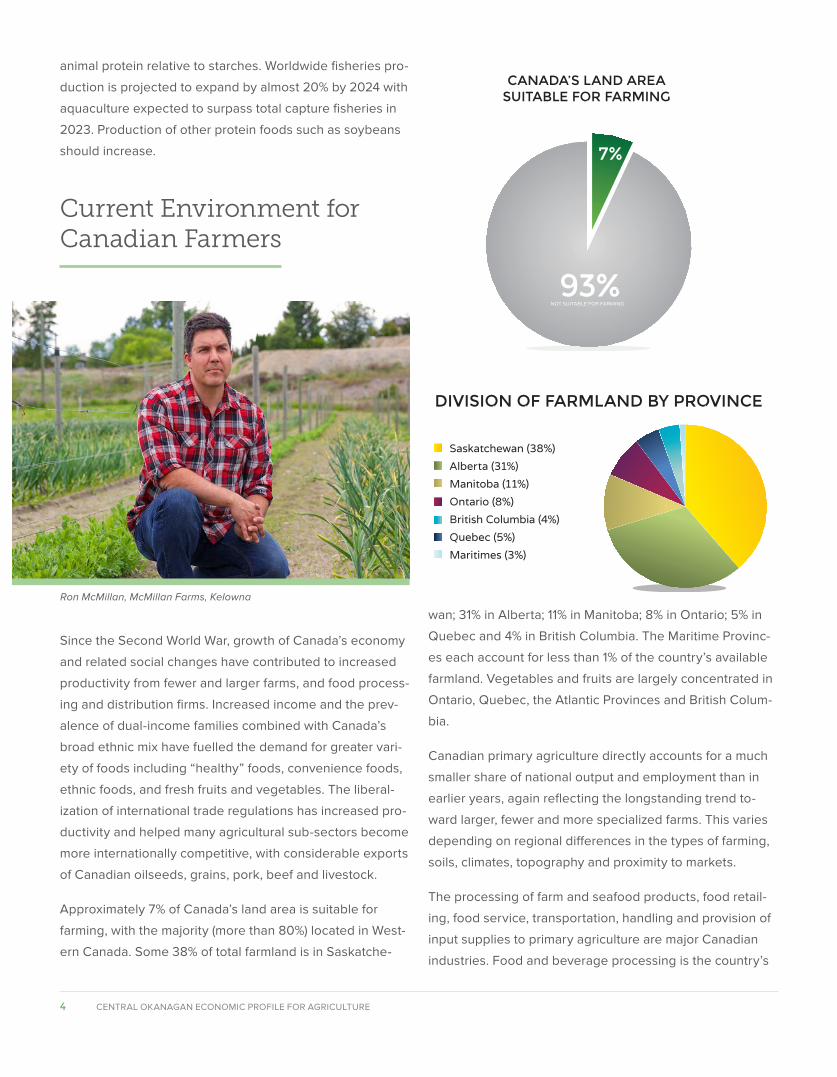
Approximately 7% of Canada’s land area is suitable for
farming, with the majority (more than 80%) located in West-
ern Canada. Some 38% of total farmland is in Saskatche-
wan; 31% in Alberta; 11% in Manitoba; 8% in Ontario; 5% in
Quebec and 4% in British Columbia. The Maritime Provinc-
es each account for less than 1% of the country’s available
farmland. Vegetables and fruits are largely concentrated in
Ontario, Quebec, the Atlantic Provinces and British Colum-
bia.
Canadian primary agriculture directly accounts for a much
smaller share of national output and employment than in
earlier years, again reflecting the longstanding trend to-
ward larger, fewer and more specialized farms. This varies
depending on regional differences in the types of farming,
soils, climates, topography and proximity to markets.
The processing of farm and seafood products, food retail-
ing, food service, transportation, handling and provision of
input supplies to primary agriculture are major Canadian
industries. Food and beverage processing is the country’s
7%
93%NOT SUITABLE FOR FARMING
CANADA’S LAND AREASUITABLE FOR FARMING
Saskatchewan (38%)Alberta (31%)
British Columbia (4%)
Manitoba (11%)Ontario (8%)
Quebec (5%)Maritimes (3%)
DIVISION OF FARMLAND BY PROVINCE
Ron McMillan, McMillan Farms, Kelowna
5 CENTRAL OKANAGAN ECONOMIC PROFILE FOR AGRICULTURE
second largest manufacturing sector representing 16%
of total shipments and 2% of the national gross domestic
product (GDP). Sales are greatest for meat processing fol-
lowed by dairy products, beverages, grain and oilseed mill-
ing, bakery products and fruit and vegetable processing.
Nearly all Canadian farms are owned and operated by farm
families but often farming is only one of a number of in-
come-earning activities for farmers and family members. As
the average size and capital value of farms has increased,
the number of people employed on farms and the number
of farms has decreased.
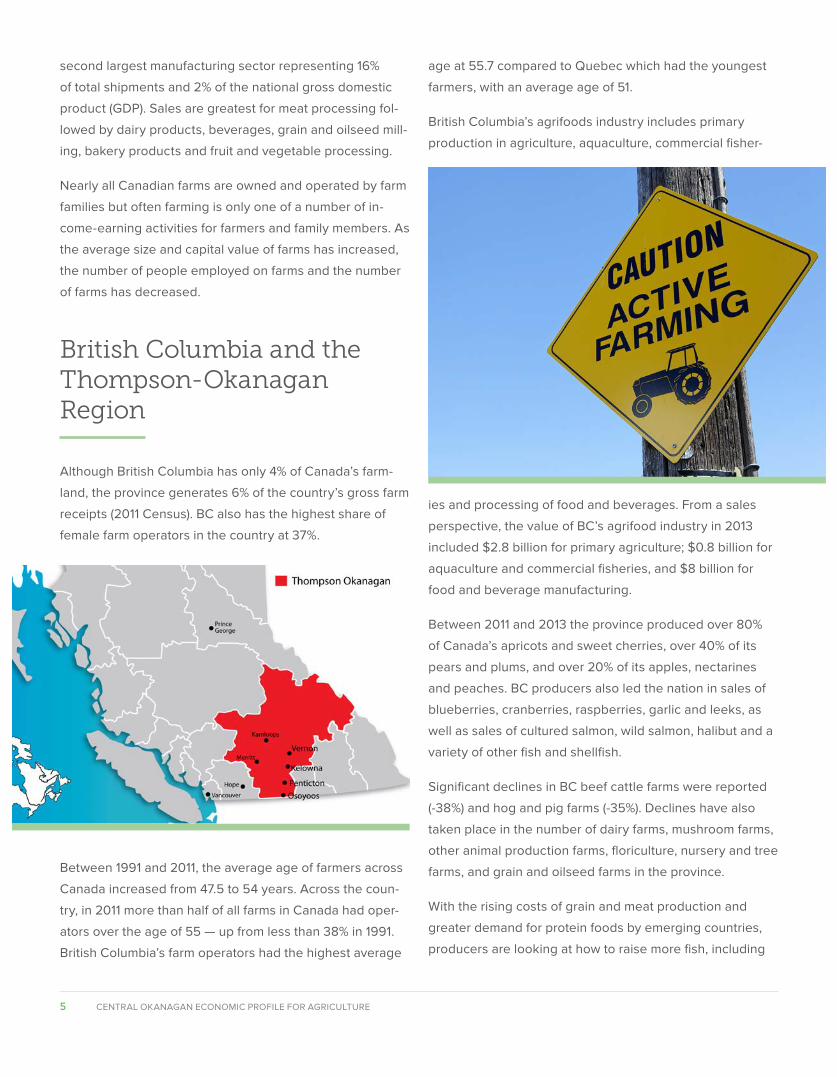
British Columbia and the Thompson-Okanagan Region
Although British Columbia has only 4% of Canada’s farm-
land, the province generates 6% of the country’s gross farm
receipts (2011 Census). BC also has the highest share of
female farm operators in the country at 37%.
Between 1991 and 2011, the average age of farmers across
Canada increased from 47.5 to 54 years. Across the coun-
try, in 2011 more than half of all farms in Canada had oper-
ators over the age of 55 — up from less than 38% in 1991.
British Columbia’s farm operators had the highest average
age at 55.7 compared to Quebec which had the youngest
farmers, with an average age of 51.
British Columbia’s agrifoods industry includes primary
production in agriculture, aquaculture, commercial fisher-
ies and processing of food and beverages. From a sales
perspective, the value of BC’s agrifood industry in 2013
included $2.8 billion for primary agriculture; $0.8 billion for
aquaculture and commercial fisheries, and $8 billion for
food and beverage manufacturing.
Between 2011 and 2013 the province produced over 80%
of Canada’s apricots and sweet cherries, over 40% of its
pears and plums, and over 20% of its apples, nectarines
and peaches. BC producers also led the nation in sales of
blueberries, cranberries, raspberries, garlic and leeks, as
well as sales of cultured salmon, wild salmon, halibut and a
variety of other fish and shellfish.
Significant declines in BC beef cattle farms were reported
(-38%) and hog and pig farms (-35%). Declines have also
taken place in the number of dairy farms, mushroom farms,
other animal production farms, floriculture, nursery and tree
farms, and grain and oilseed farms in the province.
With the rising costs of grain and meat production and
greater demand for protein foods by emerging countries,
producers are looking at how to raise more fish, including
6 CENTRAL OKANAGAN ECONOMIC PROFILE FOR AGRICULTURE
• Father Charles Pandosy, a French Catholic mission-ary, is credited with planting the first Okanagan fruit trees – apple seedlings – in 1859. By 1900, more than 1 million fruit trees were growing in the Okana-gan.
• By 1913, there were four co-ops in the Okanagan and extensive irrigation projects throughout the Valley allowed more and more orchards to be planted. This stimulated the formation of numerous sales agencies and the construction of dozens of packing-houses.
• The Kettle Valley Railway, headquar-tered in Penticton, was completed in 1914 linking the coast and the Koo-tenays and providing the Okanagan fruit orchards with access to more distant markets.
• The Government of Canada estab-lished the Dominion Experimental Farm in 1914 to support British Colum-bia’s fledgling agriculture industry. The facility was renamed the Summerland Research Station in 1959 to reflect the amalgamation of the farm with plant pathology and entomology laborato-ries. The research scope narrowed to focus on the primary challenges in tree fruit, grape production and food processing and the facility was renamed the Pacific Agri-Food Research Centre in 1996.
• Apple production surged in the 1920s; the 1921 crop was 2.7 million boxes, more than double the produc-tion of 1920. In 1923 Associated Growers of British Columbia was formed, representing approximately 2,700 growers and 85% of potential crops.
• Although renowned for its fruit, farm crops and wine industry, Kelowna was once home to a thriving
tobacco industry as well. The Okanagan climate and fertile soil appeared ideal to grow tobacco imported from Cuba and two factories were established. At its peak, the Kelowna soil proved very suitable for growing tobacco which had its heydey as a cash crop around the beginning of the 20th century. Eventually competition from Ontario tobacco grow-ers resulted in the demise of the industry and many Okanagan farmers switched to growing fruit.
• In 1946, BC Fruit Processing Ltd. was formed to pro-duce and sell 100% pure apple juice marketed under the brand, Sun-Rype.
• By 1957 there were 36 cooperative societies, 20 independent shippers, and 5 grower shippers in the Okanagan whose products were sold around the world through BC Tree Fruits.
• New technology for controlled atmosphere storage was introduced in the 1970s, radically changing the marketing season of apples.
• As recently as the summer of 2015, the BC Fruit Growers Association reported a very slight expan-sion of acreage devoted to apple growing in the
Okanagan Valley after decades of decline in apple acreage. There were also noticeable inquiries from grape growers asking about switching over to apple production. Reasons for this may be a levelling off in demand for Okanagan-grown wine grapes, and increased export opportunities for apples.
WINE NOTES
• The first commercial plantings of grapes were made in the Kelowna area in 1926. Acreage for grape
production was minimal until the 1960s, however. From the late 1960s
to early 1970s, Okanagan producers began to focus on grape varieties better suited to local climate and soils.
• From the 1970s on growers began experimenting with varieties of grapes which could withstand the cold Okanagan winters. Grape production was sup-ported by increasing liberal trade laws and federal government support for Canadian grape growers to compete with imported wines.
• Significant growth in the industry took place in the 1990s. Today the Okanagan is one of the largest pro-ducers of fruit and wine in Canada.
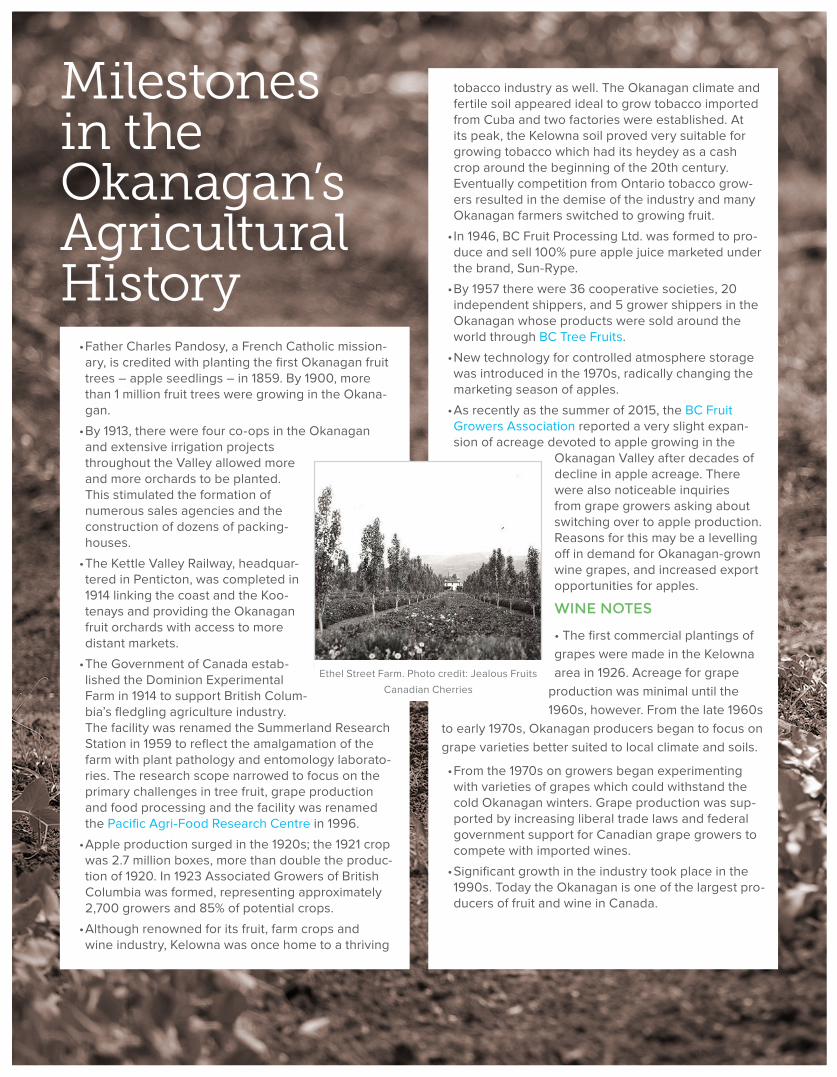
Milestones in the Okanagan’s Agricultural History
Ethel Street Farm. Photo credit: Jealous Fruits
Canadian Cherries
7 CENTRAL OKANAGAN ECONOMIC PROFILE FOR AGRICULTURE
land-based salmon production. Several facilities in British
Columbia are involved with research efforts to demonstrate
Atlantic salmon can be raised on land in a more efficient
and environmentally friendly way than ocean-based sys-
tems.
The province’s major areas for agriculture production are
divided into Development Regions as follows: Thomp-
son-Okanagan, Nechako, Kootenay, Cariboo, Lower Main-
land Southwest, North Coast, Peace River and Vancouver
Island-Coast regions. The Thompson-Okanagan region
includes the Okanagan Similkameen, Central Okana-
gan, North Okanagan, Thompson-Nicola and Columbia
Shuswap regional districts.
The Okanagan Valley has long been a major centre for
agriculture production in the province. Approximately 200
km long and 20 km wide, it lies between the Columbia and
Cascade mountain ranges in south-central British Colum-
bia. Glacier activity thousands of years ago left large de-
posits of sediment on the bottom and sides of the valley –
the cities of Vernon, Kelowna and Penticton partially stand
on these deposits and deltas today. The soil, topography
and hot, sunny, dry climate associated with this region
provide an environment that supports important agriculture
production.
Based on the 2011 Census of Agriculture, the Thomp-
son-Okanagan Region has the second largest number of
farms in the province – 5,486 – accounting for 28 percent
of BC’s total farms. While this number is down from ap-
proximately 5,700 farms in 2006, total gross farm receipts
increased 6%. The region also has the highest number of
farms reporting certified organic products for sale with a
12% increase in the number of organic producers. The 2011
census showed 44 farms reporting products that were in
transition to becoming certified organic.
Between 2006 and 2011, the shift from beef cattle farms to
hay and other crop farms in British Columbia was greatest
in the Thompson-Okanagan region (332 fewer beef cattle
farms and 321 more hay farms).
Although the region’s economy has become increasingly
diverse, agriculture continues to have important links to
the Okanagan’s reputation as a world-class destination
for tourism. Vast rural landscapes of orchard and farmland
are accessible to visitors who may never have seen many
foods at their source. Locally grown products and authen-
tic experiences not only enhance tourism, they enrich the
quality of life that the Okanagan is known for.
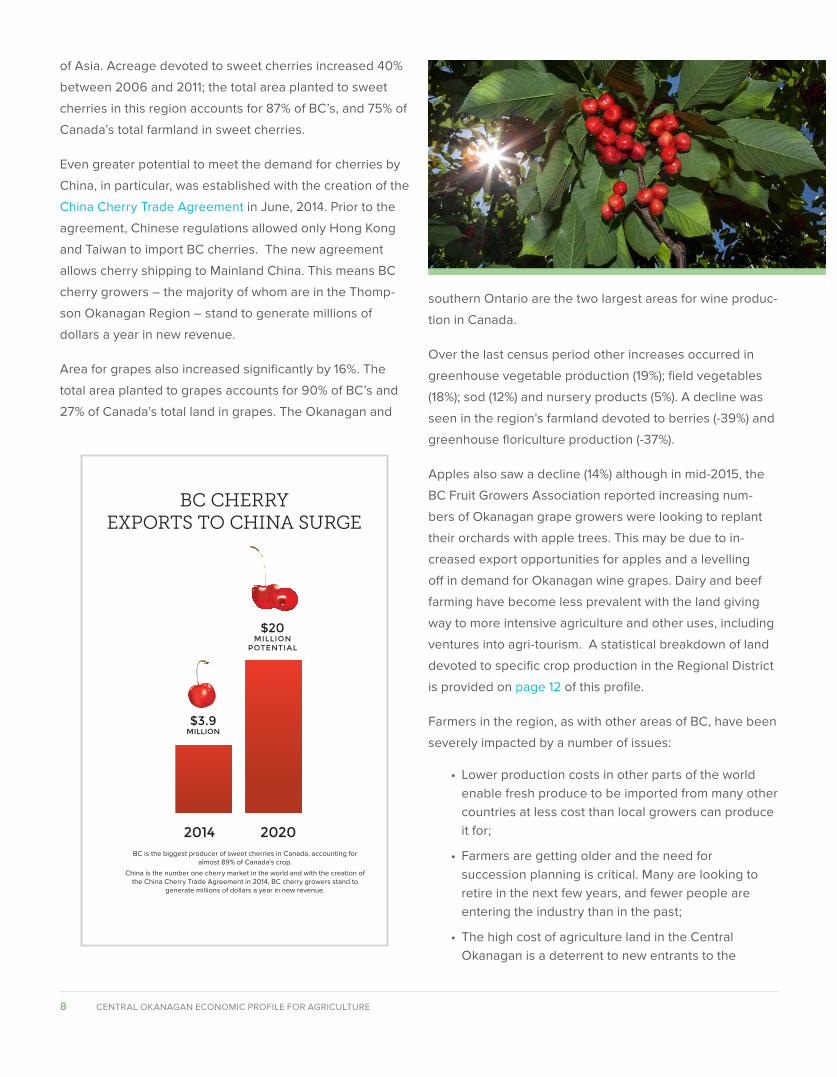
A noticeable trend in recent years is the demand for sweet
cherries, particularly by customers in China and other parts
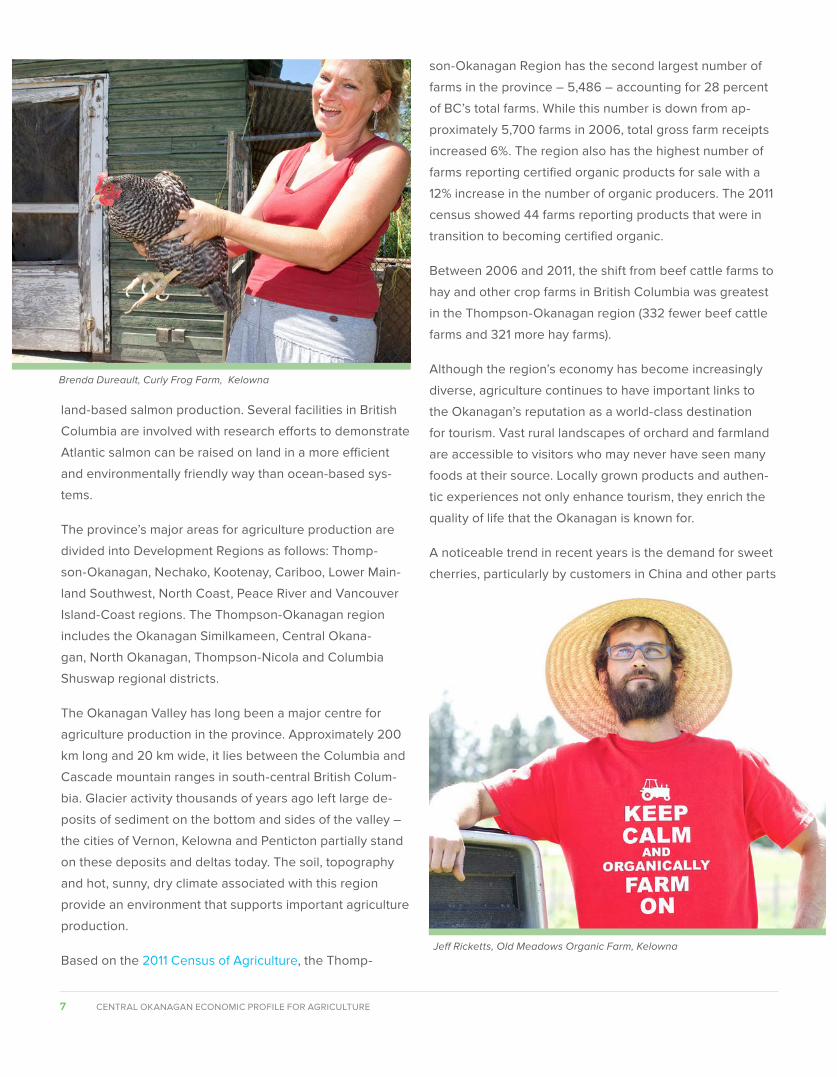
Brenda Dureault, Curly Frog Farm, Kelowna
Jeff Ricketts, Old Meadows Organic Farm, Kelowna
8 CENTRAL OKANAGAN ECONOMIC PROFILE FOR AGRICULTURE
of Asia. Acreage devoted to sweet cherries increased 40%
between 2006 and 2011; the total area planted to sweet
cherries in this region accounts for 87% of BC’s, and 75% of
Canada’s total farmland in sweet cherries.
Even greater potential to meet the demand for cherries by
China, in particular, was established with the creation of the
China Cherry Trade Agreement in June, 2014. Prior to the
agreement, Chinese regulations allowed only Hong Kong
and Taiwan to import BC cherries. The new agreement
allows cherry shipping to Mainland China. This means BC
cherry growers – the majority of whom are in the Thomp-
son Okanagan Region – stand to generate millions of
dollars a year in new revenue.
Area for grapes also increased significantly by 16%. The
total area planted to grapes accounts for 90% of BC’s and
27% of Canada’s total land in grapes. The Okanagan and
southern Ontario are the two largest areas for wine produc-
tion in Canada.
Over the last census period other increases occurred in
greenhouse vegetable production (19%); field vegetables
(18%); sod (12%) and nursery products (5%). A decline was
seen in the region’s farmland devoted to berries (-39%) and
greenhouse floriculture production (-37%).
Apples also saw a decline (14%) although in mid-2015, the
BC Fruit Growers Association reported increasing num-
bers of Okanagan grape growers were looking to replant
their orchards with apple trees. This may be due to in-
creased export opportunities for apples and a levelling
off in demand for Okanagan wine grapes. Dairy and beef
farming have become less prevalent with the land giving
way to more intensive agriculture and other uses, including
ventures into agri-tourism. A statistical breakdown of land
devoted to specific crop production in the Regional District
is provided on page 12 of this profile.
Farmers in the region, as with other areas of BC, have been
severely impacted by a number of issues:
• Lower production costs in other parts of the world enable fresh produce to be imported from many other countries at less cost than local growers can produce it for;
• Farmers are getting older and the need for succession planning is critical. Many are looking to retire in the next few years, and fewer people are entering the industry than in the past;
• The high cost of agriculture land in the Central Okanagan is a deterrent to new entrants to the
20202014
$3.9MILLION
$20MILLION
POTENTIAL
BC CHERRYEXPORTS TO CHINA SURGE
BC is the biggest producer of sweet cherries in Canada, accounting for almost 89% of Canada’s crop.
China is the number one cherry market in the world and with the creation of the China Cherry Trade Agreement in 2014, BC cherry growers stand to
generate millions of dollars a year in new revenue.
9 CENTRAL OKANAGAN ECONOMIC PROFILE FOR AGRICULTURE
industry, including young farmers;
• The seasonal nature of agriculture means large numbers of workers are needed on a seasonal basis in the spring, summer and fall – approximately one-third of workers are temporary employees.
As in other parts of Canada, the Region has also seen a de-
cline in the number of farms and an increase in the average
size of farms. In the Regional District of Central Okanagan
between 1996 and 2011, the average farm increased from
27.5 to 31.0 hectares, or approximately 13%.
A Hub for Agricultural Research and Innovation
The Okanagan Valley is a focal point for agriculture re-
search and provides many examples of farmers adapting
to modern industry challenges. This includes finding new
ways to get their products to consumers, growing new
types of crops and using environmentally responsible
growing methods.
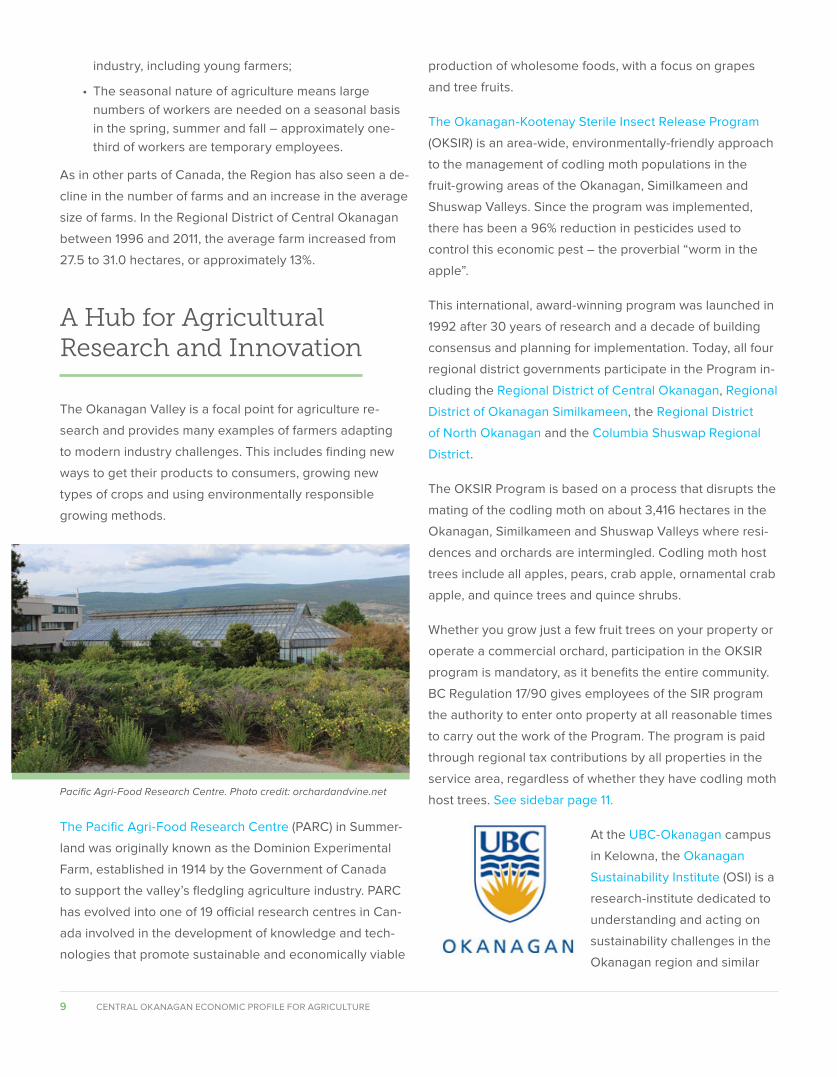
The Pacific Agri-Food Research Centre (PARC) in Summer-
land was originally known as the Dominion Experimental
Farm, established in 1914 by the Government of Canada
to support the valley’s fledgling agriculture industry. PARC
has evolved into one of 19 official research centres in Can-
ada involved in the development of knowledge and tech-
nologies that promote sustainable and economically viable
production of wholesome foods, with a focus on grapes
and tree fruits.
The Okanagan-Kootenay Sterile Insect Release Program
(OKSIR) is an area-wide, environmentally-friendly approach
to the management of codling moth populations in the
fruit-growing areas of the Okanagan, Similkameen and
Shuswap Valleys. Since the program was implemented,
there has been a 96% reduction in pesticides used to
control this economic pest – the proverbial “worm in the
apple”.
This international, award-winning program was launched in
1992 after 30 years of research and a decade of building
consensus and planning for implementation. Today, all four
regional district governments participate in the Program in-
cluding the Regional District of Central Okanagan, Regional
District of Okanagan Similkameen, the Regional District
of North Okanagan and the Columbia Shuswap Regional
District.
The OKSIR Program is based on a process that disrupts the
mating of the codling moth on about 3,416 hectares in the
Okanagan, Similkameen and Shuswap Valleys where resi-
dences and orchards are intermingled. Codling moth host
trees include all apples, pears, crab apple, ornamental crab
apple, and quince trees and quince shrubs.
Whether you grow just a few fruit trees on your property or
operate a commercial orchard, participation in the OKSIR
program is mandatory, as it benefits the entire community.
BC Regulation 17/90 gives employees of the SIR program
the authority to enter onto property at all reasonable times
to carry out the work of the Program. The program is paid
through regional tax contributions by all properties in the
service area, regardless of whether they have codling moth
host trees. See sidebar page 11.
At the UBC-Okanagan campus
in Kelowna, the Okanagan
Sustainability Institute (OSI) is a
research-institute dedicated to
understanding and acting on
sustainability challenges in the
Okanagan region and similar
Pacific Agri-Food Research Centre. Photo credit: orchardandvine.net
regions worldwide. The Institute’s current focus is on issues
at the intersection of water, urbanization and rural areas.
The OSI convenes gatherings of researchers and communi-
ty partners, coordinates the development of collaborative
research agendas and works to put knowledge into prac-
tice by encouraging researchers and partners to communi-
cate their findings and how they worked together.
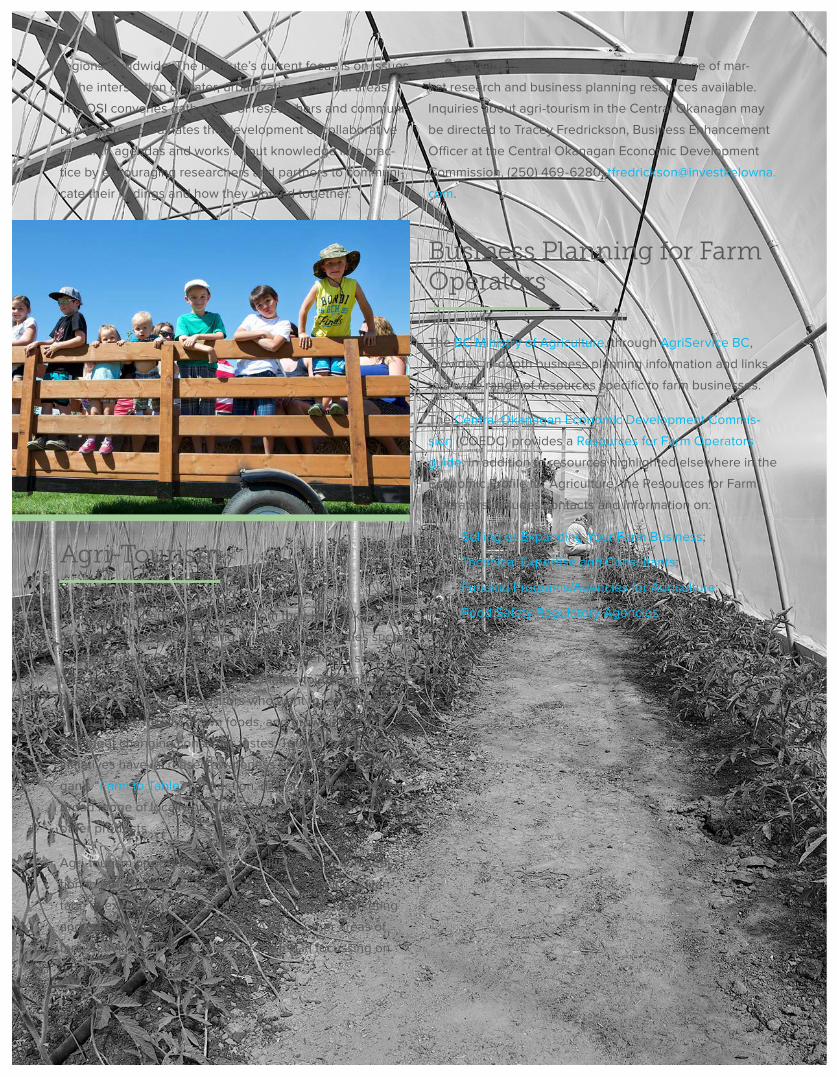
Agri-Tourism
In an effort to derive more value from their land, Okanagan
farm operators are embracing value-added activities such
as agri-tourism. Successful agri-tourism operators see
themselves as part of the area’s dynamic tourism industry,
meeting the interests of visitors who want to learn about
and purchase locally-grown foods, and grow new crops
that meet changing consumer tastes. Tourism marketing
initiatives have increased awareness of the Central Okana-
gan’s “Farm to Table” connection, drawing attention to the
broad range of locally produced meats, produce, wines and
other products.
Agri-tourism opportunities are usually conducted in addi-
tion to other mainstream farming activities, taking advan-
tage of existing investment in land, employees, marketing
and other operational expenses. As with other areas of
farm activities, farm operators interested in focussing on
agri-tourism are encouraged to take advantage of mar-
ket research and business planning resources available.
Inquiries about agri-tourism in the Central Okanagan may
be directed to Tracey Fredrickson, Business Enhancement
Officer at the Central Okanagan Economic Development
Commission, (250) 469-6280; tfredrickson@investkelowna.
com.
Business Planning for Farm Operators
The BC Ministry of Agriculture, through AgriService BC,
provides in-depth business planning information and links
to a wide range of resources specific to farm businesses.
The Central Okanagan Economic Development Commis-
sion (COEDC) provides a Resources for Farm Operators
guide. In addition to resources highlighted elsewhere in the
Economic Profile for Agriculture, the Resources for Farm
Operators includes contacts and information on:
• Selling or Expanding Your Farm Business;
• Technical Expertise and Consultants;
• Funding Programs/Agencies for Agriculture;
• Food Safety Regulatory Agencies.
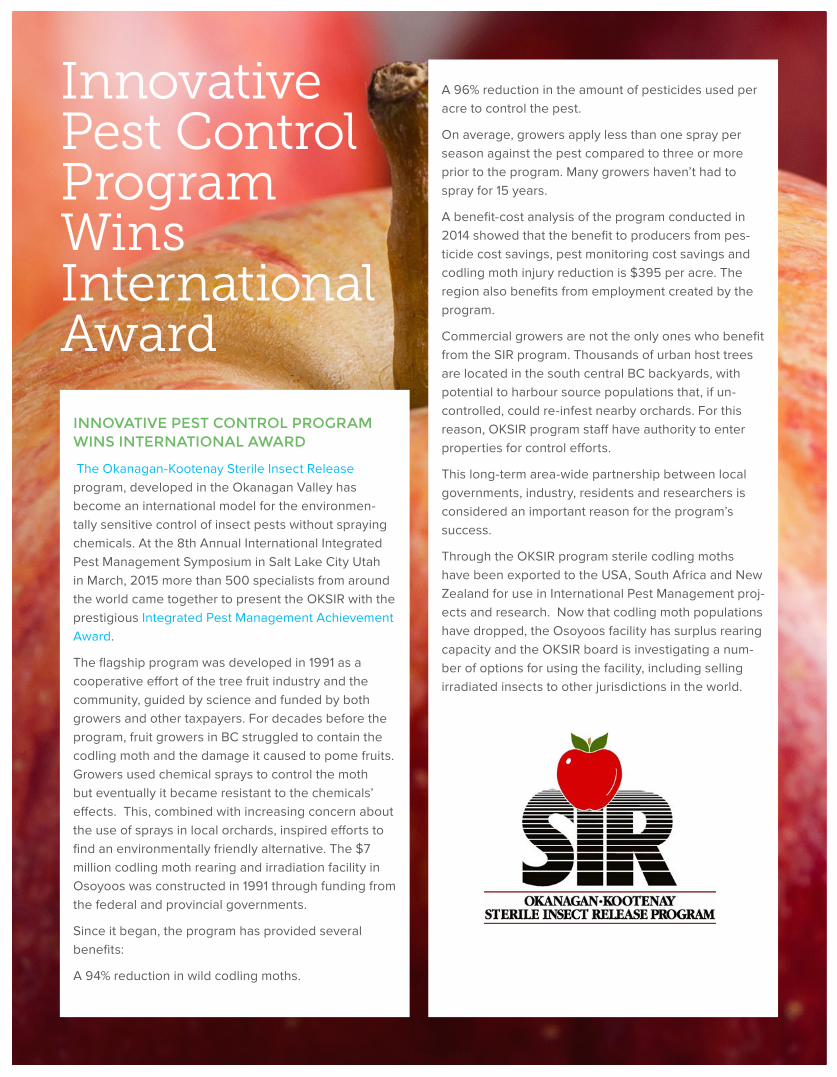
INNOVATIVE PEST CONTROL PROGRAM WINS INTERNATIONAL AWARD
The Okanagan-Kootenay Sterile Insect Release program, developed in the Okanagan Valley has become an international model for the environmen-tally sensitive control of insect pests without spraying chemicals. At the 8th Annual International Integrated Pest Management Symposium in Salt Lake City Utah in March, 2015 more than 500 specialists from around the world came together to present the OKSIR with the prestigious Integrated Pest Management Achievement Award.
The flagship program was developed in 1991 as a cooperative effort of the tree fruit industry and the community, guided by science and funded by both growers and other taxpayers. For decades before the program, fruit growers in BC struggled to contain the codling moth and the damage it caused to pome fruits. Growers used chemical sprays to control the moth but eventually it became resistant to the chemicals’ effects. This, combined with increasing concern about the use of sprays in local orchards, inspired efforts to find an environmentally friendly alternative. The $7 million codling moth rearing and irradiation facility in Osoyoos was constructed in 1991 through funding from the federal and provincial governments.
Since it began, the program has provided several benefits:
A 94% reduction in wild codling moths.
A 96% reduction in the amount of pesticides used per acre to control the pest.
On average, growers apply less than one spray per season against the pest compared to three or more prior to the program. Many growers haven’t had to spray for 15 years.
A benefit-cost analysis of the program conducted in 2014 showed that the benefit to producers from pes-ticide cost savings, pest monitoring cost savings and codling moth injury reduction is $395 per acre. The region also benefits from employment created by the program.
Commercial growers are not the only ones who benefit from the SIR program. Thousands of urban host trees are located in the south central BC backyards, with potential to harbour source populations that, if un-controlled, could re-infest nearby orchards. For this reason, OKSIR program staff have authority to enter properties for control efforts.
This long-term area-wide partnership between local governments, industry, residents and researchers is considered an important reason for the program’s success.
Through the OKSIR program sterile codling moths have been exported to the USA, South Africa and New Zealand for use in International Pest Management proj-ects and research. Now that codling moth populations have dropped, the Osoyoos facility has surplus rearing capacity and the OKSIR board is investigating a num-ber of options for using the facility, including selling irradiated insects to other jurisdictions in the world.
Innovative Pest Control Program Wins International Award
12 CENTRAL OKANAGAN ECONOMIC PROFILE FOR AGRICULTURE
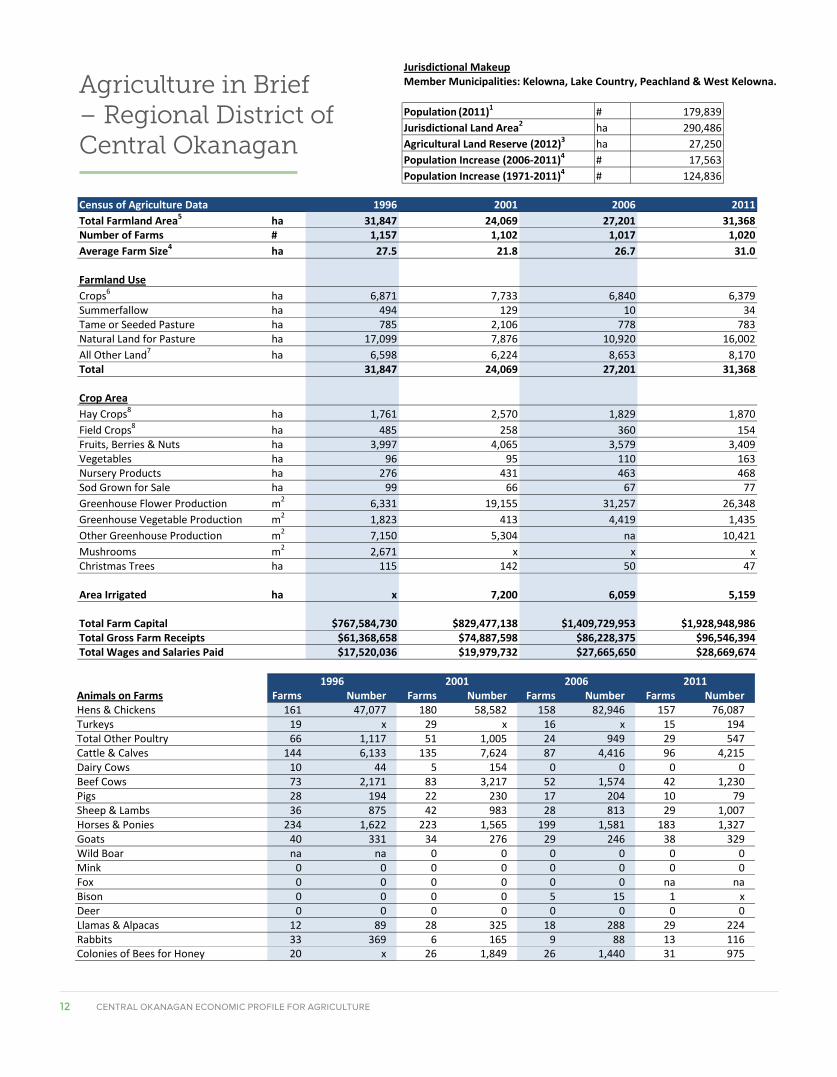
Population (2011)1 # 179,839Jurisdictional Land Area2 ha 290,486Agricultural Land Reserve (2012)3 ha 27,250Population Increase (2006‐2011)4 # 17,563Population Increase (1971‐2011)4 # 124,836
Census of Agriculture Data 1996 2001 2006 2011Total Farmland Area5 ha 31,847 24,069 27,201 31,368
Jurisdictional MakeupMember Municipalities: Kelowna, Lake Country, Peachland & West Kelowna.
, , , ,Number of Farms # 1,157 1,102 1,017 1,020Average Farm Size4 ha 27.5 21.8 26.7 31.0
Farmland UseCrops6 ha 6,871 7,733 6,840 6,379Summerfallow ha 494 129 10 34Tame or Seeded Pasture ha 785 2,106 778 783Natural Land for Pasture ha 17,099 7,876 10,920 16,002All Other Land7 ha 6,598 6,224 8,653 8,170Total 31,847 24,069 27,201 31,368
Crop AreaHay Crops8 ha 1,761 2,570 1,829 1,870Field Crops8 ha 485 258 360 154Fruits, Berries & Nuts ha 3,997 4,065 3,579 3,409Vegetables ha 96 95 110 163Nursery Products ha 276 431 463 468Sod Grown for Sale ha 99 66 67 77Greenhouse Flower Production m2 6,331 19,155 31,257 26,348Greenhouse Vegetable Production m2 1,823 413 4,419 1,435Other Greenhouse Production m2 7,150 5,304 na 10,421Mushrooms m2 2,671 x x xChristmas Trees ha 115 142 50 47
Area Irrigated ha x 7,200 6,059 5,159
Total Farm Capital $767,584,730 $829,477,138Total Gross Farm Receipts $61,368,658 $74,887,598 $86,228,375 $96,546,394Total Wages and Salaries Paid $17,520,036 $19,979,732 $27,665,650 $28,669,674
$1,409,729,953 $1,928,948,986
Animals on Farms Farms Number Farms Number Farms Number Farms NumberHens & Chickens 161 47,077 180 58,582 158 82,946 157 76,087Turkeys 19 x 29 x 16 x 15 194Total Other Poultry 66 1,117 51 1,005 24 949 29 547Cattle & Calves 144 6,133 135 7,624 87 4,416 96 4,215Dairy Cows 10 44 5 154 0 0 0 0Beef Cows 73 2,171 83 3,217 52 1,574 42 1,230Pigs 28 194 22 230 17 204 10 79Sheep & Lambs 36 875 42 983 28 813 29 1,007Horses & Ponies 234 1,622 223 1,565 199 1,581 183 1,327Goats 40 331 34 276 29 246 38 329Wild Boar na na 0 0 0 0 0 0Mink 0 0 0 0 0 0 0 0Fox 0 0 0 0 0 0 na naBison 0 0 0 0 5 15 1 xDeer 0 0 0 0 0 0 0 0Llamas & Alpacas 12 89 28 325 18 288 29 224Rabbits 33 369 6 165 9 88 13 116
1996 2001 2006 2011
Colonies of Bees for Honey 20 x 26 1,849 26 1,440 31 975
CreditsSource: Statistics Canada. Census of Agriculture, 1996, 2001, 2006, 2011, unless otherwise specified.Prepared by Ministry of Agriculture, Statistics and Research. January 2013
End Notes1 Source: Statistics Canada. Census of Population.
3 Source: Agricultural Land Commission. Agricultural Land Reserve as of January 1, 2008 (for 2006) and April 1, 2012 (for 2011). 4 Source: Ministry of Agriculture, Adapted from Statistics Canada Censuses.5 Total farmland area includes both workable and non‐workable land on farm operations in B.C.6 Crops includes: hay crops, field crops, total vegetables, total fruits and nuts, sod and nursery products.
Notesx ‐ indicates farms reporting but information suppressed to meet the confidentiality requirements of the Statistics Actna ‐ indicates data is not available for a specific reference period
2 Source: Statistics Canada, Geosuite, Land Area file: http://www12.statcan.gc.ca/census‐recensement/2006/ref/dict/tables/table‐tableau‐7‐eng.cfm
7 Other farmland area includes: woodland, wetlands, Christmas tree land, land on which farm buildings, barnyards, lanes, home gardens, greenhouses
8 Does not include those crop areas suppressed to meet the confidentiality requirements of the Statistics Act. and mushroom houses are located, and idle land.
Agriculture in Brief – Regional District of Central Okanagan
Population (2011)1 # 179,839Jurisdictional Land Area2 ha 290,486Agricultural Land Reserve (2012)3 ha 27,250Population Increase (2006‐2011)4 # 17,563Population Increase (1971‐2011)4 # 124,836
Census of Agriculture Data 1996 2001 2006 2011Total Farmland Area5 ha 31,847 24,069 27,201 31,368
Jurisdictional MakeupMember Municipalities: Kelowna, Lake Country, Peachland & West Kelowna.
, , , ,Number of Farms # 1,157 1,102 1,017 1,020Average Farm Size4 ha 27.5 21.8 26.7 31.0
Farmland UseCrops6 ha 6,871 7,733 6,840 6,379Summerfallow ha 494 129 10 34Tame or Seeded Pasture ha 785 2,106 778 783Natural Land for Pasture ha 17,099 7,876 10,920 16,002All Other Land7 ha 6,598 6,224 8,653 8,170Total 31,847 24,069 27,201 31,368
Crop AreaHay Crops8 ha 1,761 2,570 1,829 1,870Field Crops8 ha 485 258 360 154Fruits, Berries & Nuts ha 3,997 4,065 3,579 3,409Vegetables ha 96 95 110 163Nursery Products ha 276 431 463 468Sod Grown for Sale ha 99 66 67 77Greenhouse Flower Production m2 6,331 19,155 31,257 26,348Greenhouse Vegetable Production m2 1,823 413 4,419 1,435Other Greenhouse Production m2 7,150 5,304 na 10,421Mushrooms m2 2,671 x x xChristmas Trees ha 115 142 50 47
Area Irrigated ha x 7,200 6,059 5,159
Total Farm Capital $767,584,730 $829,477,138Total Gross Farm Receipts $61,368,658 $74,887,598 $86,228,375 $96,546,394Total Wages and Salaries Paid $17,520,036 $19,979,732 $27,665,650 $28,669,674
$1,409,729,953 $1,928,948,986
13 CENTRAL OKANAGAN ECONOMIC PROFILE FOR AGRICULTURE
2011 CENSUS OF AGRICULTURE | BRITISH COLUMBIA HIGHLIGHTS 27 26 2011 CENSUS OF AGRICULTURE | BRITISH COLUMBIA HIGHLIGHTS
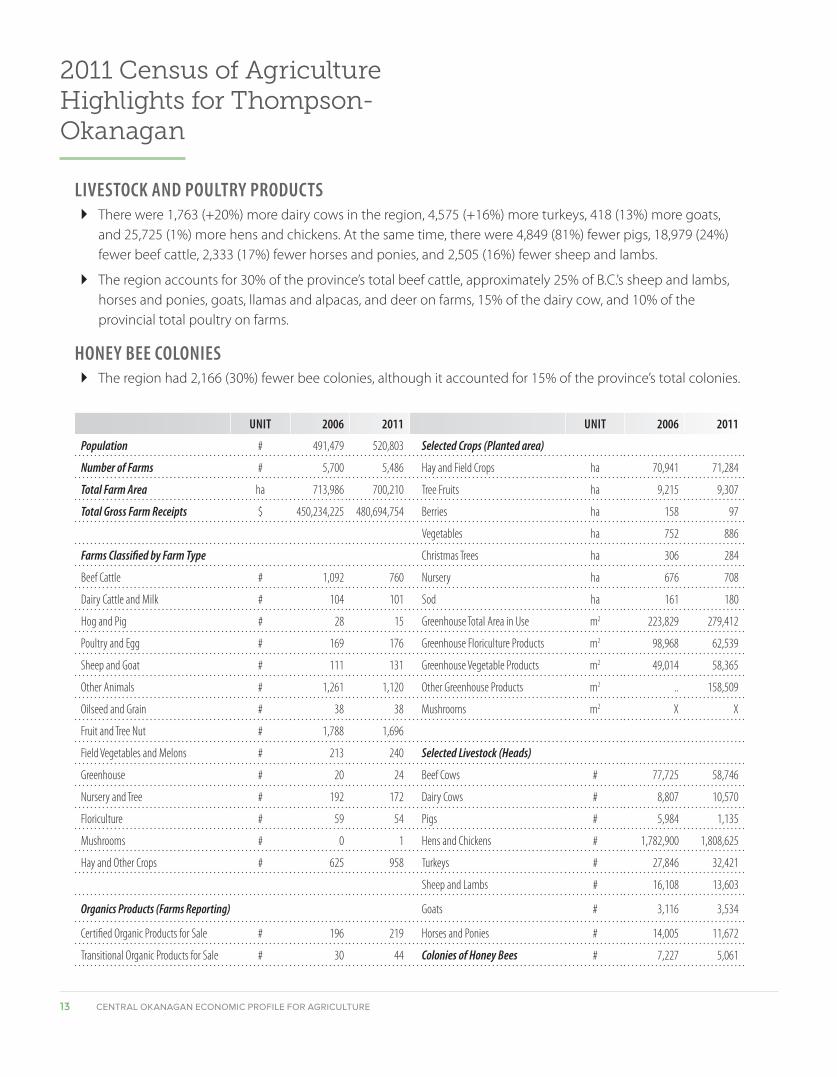
LIVESTOCK AND POULTRY PRODUCTS } There were 1,763 (+20%) more dairy cows in the region, 4,575 (+16%) more turkeys, 418 (13%) more goats,
and 25,725 (1%) more hens and chickens . At the same time, there were 4,849 (81%) fewer pigs, 18,979 (24%) fewer beef cattle, 2,333 (17%) fewer horses and ponies, and 2,505 (16%) fewer sheep and lambs .
} The region accounts for 30% of the province’s total beef cattle, approximately 25% of B .C .’s sheep and lambs, horses and ponies, goats, llamas and alpacas, and deer on farms, 15% of the dairy cow, and 10% of the provincial total poultry on farms .
HONEY BEE COLONIES } The region had 2,166 (30%) fewer bee colonies, although it accounted for 15% of the province’s total colonies .
UNIT 2006 2011 UNIT 2006 2011
Population # 491,479 520,803 Selected Crops (Planted area)
Number of Farms # 5,700 5,486 Hay and Field Crops ha 70,941 71,284
Total Farm Area ha 713,986 700,210 Tree Fruits ha 9,215 9,307
Total Gross Farm Receipts $ 450,234,225 480,694,754 Berries ha 158 97
Vegetables ha 752 886
Farms Classified by Farm Type Christmas Trees ha 306 284
Beef Cattle # 1,092 760 Nursery ha 676 708
Dairy Cattle and Milk # 104 101 Sod ha 161 180
Hog and Pig # 28 15 Greenhouse Total Area in Use m2 223,829 279,412
Poultry and Egg # 169 176 Greenhouse Floriculture Products m2 98,968 62,539
Sheep and Goat # 111 131 Greenhouse Vegetable Products m2 49,014 58,365
Other Animals # 1,261 1,120 Other Greenhouse Products m2 .. 158,509
Oilseed and Grain # 38 38 Mushrooms m2 X X
Fruit and Tree Nut # 1,788 1,696
Field Vegetables and Melons # 213 240 Selected Livestock (Heads)
Greenhouse # 20 24 Beef Cows # 77,725 58,746
Nursery and Tree # 192 172 Dairy Cows # 8,807 10,570
Floriculture # 59 54 Pigs # 5,984 1,135
Mushrooms # 0 1 Hens and Chickens # 1,782,900 1,808,625
Hay and Other Crops # 625 958 Turkeys # 27,846 32,421
Sheep and Lambs # 16,108 13,603
Organics Products (Farms Reporting) Goats # 3,116 3,534
Certified Organic Products for Sale # 196 219 Horses and Ponies # 14,005 11,672
Transitional Organic Products for Sale # 30 44 Colonies of Honey Bees # 7,227 5,061
2011 Census of Agriculture Highlights for Thompson-Okanagan
14 CENTRAL OKANAGAN ECONOMIC PROFILE FOR AGRICULTURE
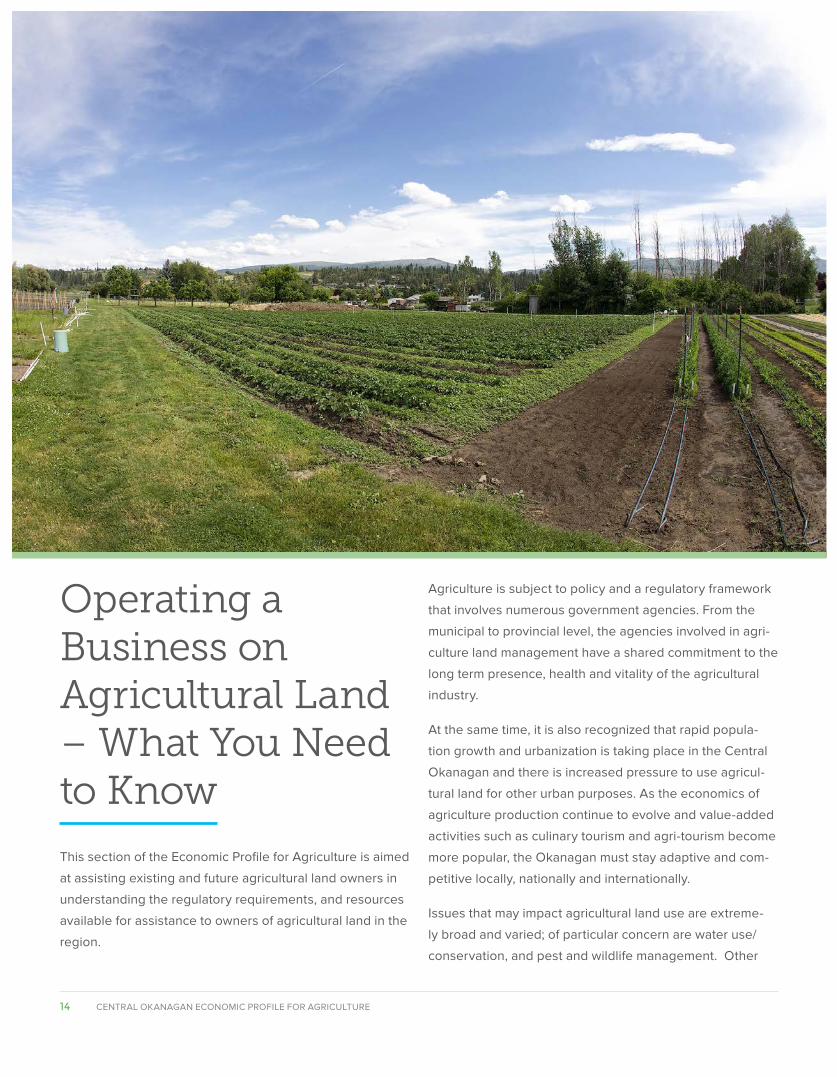
Operating a Business on Agricultural Land – What You Need to Know
This section of the Economic Profile for Agriculture is aimed
at assisting existing and future agricultural land owners in
understanding the regulatory requirements, and resources
available for assistance to owners of agricultural land in the
region.
Agriculture is subject to policy and a regulatory framework
that involves numerous government agencies. From the
municipal to provincial level, the agencies involved in agri-
culture land management have a shared commitment to the
long term presence, health and vitality of the agricultural
industry.
At the same time, it is also recognized that rapid popula-
tion growth and urbanization is taking place in the Central
Okanagan and there is increased pressure to use agricul-
tural land for other urban purposes. As the economics of
agriculture production continue to evolve and value-added
activities such as culinary tourism and agri-tourism become
more popular, the Okanagan must stay adaptive and com-
petitive locally, nationally and internationally.
Issues that may impact agricultural land use are extreme-
ly broad and varied; of particular concern are water use/
conservation, and pest and wildlife management. Other

15 CENTRAL OKANAGAN ECONOMIC PROFILE FOR AGRICULTURE
potential impacts that may need to be considered include
soil erosion, agricultural waste management, transportation
of farm goods and equipment, and implications of bringing
the public on to farm land related to parking and safety.
Early in the process of developing a business plan, commu-
nication with such organizations as the local water board,
Chamber of Commerce, utility services, conservation
authority and/or others will help agriculture land owners
understand the risks and regulations associated with oper-
ating on agricultural land.
The process begins with understanding the organizations
that govern and support agriculture and the services they
provide.
Regulatory Agencies and Processes Affecting Agricultural Land Use
The Agricultural Land Reserve (ALR) refers to approximate-
ly 5% of the province of BC that is considered good agricul-
tural land. The ALR was created in 1974 to preserve prime
agricultural land for farming and future food production
across the province. The province’s best agricultural land
is concentrated in Richmond, South Vancouver Island, the
Fraser Valley and the Okanagan.
In 1973, the Agricultural Land Commission Act (ALCA) was
created in response to the rapid loss of farm land and the
intense pressure on agricultural land for non-agricultural
uses in the province. The ALCA contains maps showing
lands in the ALR; restricted non-agricultural use areas, and
policies and regulations for activities in the ALR.
The Provincial Agricultural Land Commission (ALC) is a
group of people appointed by the province with the author-
ity to deal with all applications. The ALC makes decisions
on all applications under the ALCA.
Should you wish to purchase agricultural land, you should
confirm the ALR status of the parcel. If the land is in the
ALR be aware that land uses are restricted and agriculture
is the priority use.
Staff in the Planning Section of the Regional District of Cen-
tral Okanagan, Community Services Department, are the
first people to contact when discussing land in the ALR.
The Regional District of Central Okanagan
• Is the local liaison for applications to the ALC;
• Has maps showing ALR boundaries;
• Provides applications and assistance to the public in reviewing policies and regulations which may affect an application, etc.
The Regional District of Central Okanagan provides a de-
tailed guide to the ALR application process. See Chart on
Page 16.
Some of the most important legislation to be aware of in
any community is Right to Farm legislation. Throughout
North America, Right to Farm laws exist to ensure that
farmers are protected from lawsuits, primarily related to
“nuisance” issues when they are using normal, accepted
farm practices. Right to Farm legislation tends to increase
as more farmland is lost, as the stock of open space in a
municipality decreases and becomes more congested and
quality of life becomes more compromised.
Brenda Dureault, Curly Frog Farm, Kelowna

PUBLIC NOTIFICATION
If the application is for exclusion of property from the ALR, proof of public notification must be submitted with the application.
Submit complete application to the Planning Section of the Community Services Department of Regional District of Central Okanagan.
APPLICATION REVIEWED
Staff, relevant agencies, the Advisory Planning Commission, and the Agricultural Advisory Commission are asked to provide comments on the proposal. Staff then prepares a report to the Regional Board.
CONSIDERATION BY THE REGIONAL BOARD
The Regional Board may:
• Not approve the application and stop the process,• Call for a public meeting to obtain more input,• Authorize the application to proceed to the Agricultural Land Commis-
sion along with recommendations.
DISCUSS THE PROPOSAL WITH REGIONAL DISTRICT OF CENTRAL OKANAGAN PLANNING STAFF
Staff can provide applications and information. They can also discuss any bylaws and policies that may affect the application.
AGRICULTURAL LAND COMMISSION CONSIDERS THE APPLICATION
The Commission will give most applicants an opportunity to present their application. The Commission either approves (often with conditions) or does not approve the application and notifies the applicant and affected agencies.
APPLICATION FORWARDED TO THE AGRICULTURAL LAND COMMISSION
The ALR Process

17 CENTRAL OKANAGAN ECONOMIC PROFILE FOR AGRICULTURE
The British Columbia Farm Practices Protection Act (Right
to Farm Act) was created in 1996 and applies to:
• Land in the Agricultural Land Reserve;
• Land where farm use is allowed under the Local Government Act;
• Land licensed for aquaculture;
• Crown land designated as a farming area.
The Act also overrides the Local Government (Regional
District) Act by providing that zoning and rural land use
bylaws created by local government may be subject to
provincial standards, and the approval of the Minister of
Agriculture.
The British Columbia Farm Industry Review Board was
established to resolve disputes among landowners and
handles nuisance claims arising under the Act. The board
investigates and attempts to resolve disputes before hear-
ings are held.
In British Columbia, Agricultural Advisory Committees
(AACs) provide a way for municipal, regional and provincial
governments to link with their farm and ranch communities.
The appointed AACs provide local governments with ad-
vice from knowledgeable members of the farm community
in a timely manner on any issue that might affect agricul-
ture.
Most AACs advise local governments in two areas: day-
to-day issues, such as reviewing proposed bylaws, official
community plans and rezoning applications and advising
on applications under the Agricultural Land Commission
Act. AACs also become involved with broader initiatives,
including agricultural studies, advising on the need for farm
bylaws and raising agricultural awareness.
Individuals making applications may have the opportunity
to make a presentation on their application at AAC meet-
ings.
For more information and meetings dates of specific Ag-
ricultural Advisory Committees in the Central Okanagan
region, visit:
• Regional District of Central Okanagan Agricultural Advisory Committee
• City of Kelowna Agricultural Advisory Committee
• District of Lake Country Agricultural Advisory Committee
• City of West Kelowna Agricultural Advisory Committee
BC Ministry of Agriculture Information and Resources
Through AgriService BC, the provincial government pro-
vides a broad range of information to support the agri-
culture industry via online links, by phone or email, and
through offices throughout the region.
For a complete list of programs and services available from
different levels of government, go to the AGPAL Program
and Service Finder.

18 CENTRAL OKANAGAN ECONOMIC PROFILE FOR AGRICULTURE
To get in touch with staff at the Ministry of Agriculture, from
anywhere in British Columbia
Telephone: 1-888-221-7141
Email: [email protected]
The Central Okanagan is served by two Ministry of Agricul-
ture office locations:
Room 200 - 1690 Powick Rd
Kelowna, BC V1X 7G5
Toll Free: 1-888-332-3352
Tel: 250 861-7211
Fax: 250 861-7490
Unit 200 -1500 Hardy Street (Hardy Place)
Kelowna, BC V1Y 8H2
Toll Free: 1-877-343-2767
Tel: 250 712-3797
Fax: 250 712-3269
Okanagan Industry Contacts
Connections to a number of Okanagan local industry con-
tacts related to business, marketing and non-profit organi-
zations supporting the Okanagan agricultural industry are
available online. These include:
• Regional Marketing Resources to Tourism
organizations throughout the region;
• Producer Organizations and Agricultural Institutes;
• Regional Business Development Organizations for business planning and financing;
• Land and Tenure information on buying, selling or leasing farm or ranchland in BC;
• Youth Resources – education resources and agricultural experience for youth in the Okanagan.
Other valuable resources available through AgriService BC
include:
New Farm Start-Up Guide – If you are starting a farm this
guide takes you through everything you need to think
about when starting a new farm businesses, from traits of
successful farmers to financial considerations, marketing
opportunities and assessing your land capabilities.
SmartFarmBC is particularly useful for existing farm opera-
tors wanting to grow their agrifood businesses. It provides
information to learn and implement best business practic-
es, and a self-assessment service to determine your eligi-
bility for Farm Business Advisory services funding.
Market Development and Trade information is available
to assist in planning for both domestic and international
agrifood trade including research statistic and reports;
marketing plan development assistance, and marketing
organizations.
Insurance and Income Protection information is available
to help you understand how to protect your agricultural
business against severe market volatility and disaster situa-
tions. This includes information on crop, livestock insurance
and programs to help manage income declines and the
effect of drops in market prices.
See the following links for detailed information:
• Agriculture Income Protection;
• Crop Loss & Damage Due to Wildlife;
19 CENTRAL OKANAGAN ECONOMIC PROFILE FOR AGRICULTURE
• Livestock Price Insurance;
• Production Insurance;
• Agri Invest;
• Advance Payments Program;
• BC Beef Financial Programs.
The Guide to Developing a BC Agriculture Employee Hand-
book takes you through seven steps to an Employee Hand-
book for your farm, an essential farm management tool
which ultimately improves communication for farm employ-
ers, managers and employees. This Guide is relevant to a
wide range of organizational structures from small, family
farms to complex operations with hundreds of employees.
Approximately 3% of BC’s water resources is licensed for
consumptive uses such as industrial, commercial, drinking
water and agriculture. For information on ensuring the
efficient management of agriculture water allocation, Agri-
culture Water Management information is available through
AgriService BC. This includes a number of strategies and
projects being undertaken in British Columbia.
20 CENTRAL OKANAGAN ECONOMIC PROFILE FOR AGRICULTURE
RESOURCESStatistics, trends and general industry information obtained
through the following Provincial and Federal Government
departments and other organizations:
• Food and Agriculture Organization (FAO)
• Statistics Canada
• Agriculture and Agri-Food Canada
• Canadian Aquaculture Industry Alliance
• Farm Credit Canada
• 2011 Census of Agriculture for British Columbia
• BC Ministry of Agriculture
• BC Ministry of Transportation and Infrastructure Online
• BC Ministry of Environment
• Agriculture Land Reserve
• Regional District of Central Okanagan
• Okanagan Sustainability Institute – UBC Okanagan Campus
• City of Kelowna
• Tourism Kelowna
• Thompson Okanagan Tourism Association
• Central Okanagan Food Policy Council
• Pacific Agri-Food Research Centre (PARC)
ADDITIONAL REPORTS/STUDIESOkanagan Valley 2015 Economic Profile
“Canada in a Changing Climate: Sector Perspectives on
Impacts and Adaptation” – Natural Resources Canada
Wine Grape & Tree Fruit Production – Okanagan Region
British Columbia Agriculture & Food Climate Action Initiative
BC Tree Fruits History - BC Tree Fruits
Right to Farm Legislation in British Columbia - University of
Toronto Law School
The OECD-FAO Agriculture Outlook 2015-2024 – United
Nations Organization for International Cooperation and De-
velopment/Food and Agriculture Organization
“Agriculture and Food”, Okanagan Valley Overview – The
Canadian Encyclopedia
“Helping Solve the World’s Challenges” – CropLife Canada
IN-PERSON INTERVIEWS• Federal and Provincial government specialists in
agriculture trends and statistics
• Regional/municipal planners, tourism industry specialists
• Central Okanagan farmers/agri-tourism operators