Embed Size (px)
Citation preview

Central MinnesotaEconomic and Business Conditions ReportFirst Quarter 2017
This issue is part of a series for the six planning areas of Minnesota – Central, Northeast, Northwest, Southeast, Southwest, and Twin Cities. The Central Minnesota
Planning Area consists of 13 counties: Benton, Chisago, Isanti, Kanabec, Kandiyohi, McLeod, Meeker, Mille Lacs, Pine, Renville, Sherburne, Stearns, and Wright.

1
TABLE OF CONTENTS
Executive Summary ............................................................................................................... 1
Central Minnesota Leading Economic Indicators Index ......................................................... 2
Central Minnesota Business Filings ....................................................................................... 4
Minnesota Business Snapshot Survey Results ....................................................................... 9
Maps .................................................................................................................................... 15
Central Minnesota Labor Market Conditions ...................................................................... 17
Central Minnesota Bankruptcies ......................................................................................... 22
Economic Indicators ............................................................................................................ 23
Sources ................................................................................................................................ 26
Executive Summary
The Central Minnesota planning area is expected to experience steady economic growth over the next several months according to predictions of the Central Minnesota Index of Leading Economic Indicators (LEI). The leading index rose by 2.03 points in the most recent period, with four components producing positive readings. Among other things, strength in a general measure of statewide business conditions and a small uptick in national durable goods orders helped lift the Central Minnesota planning area LEI in the first quarter.
There were 1,579 new business filings with the Office of the Minnesota Secretary of State in Central Minnesota in the first quarter of 2017 — representing a 3.3 percent increase from one year ago. There were 161 new regional business incorporations in the first quarter, an 11.5 percent reduction from year ago levels. New limited liability company (LLC) filings in Central Minnesota increased 6.9 percent relative to the first quarter of 2016. New assumed names totaled 463 over the recent quarter—an increase of 2 percent compared to the same period in 2016. Current quarter new filings for Central Minnesota non-profit were 7.5 percent higher than one year ago.
Sixty-eight percent of new business filers in the Central Minnesota planning area completed the voluntary Minnesota Business Snapshot (MBS) survey in this year’s first quarter. Results of this voluntary survey indicate that about 5 percent of new filers come from communities of color. A similar percentage are veterans. About 1 percent of new filers come from the disability community and more than 3 percent of new filings are made by the immigrant community. Forty-three percent of new business filings in Central Minnesota in this year’s first quarter were initiated by women. MBS results also show that most new business filers in Central Minnesota have between 0 and $10,000 in annual gross revenues (although 109 new filers have revenues in excess of $50,000). The most popular industries for new businesses in Central Minnesota are construction, retail trade, and other services. Employment levels at most new firms are between 0 and 5 workers, and 43 percent of those starting a new business consider this a part-time activity.
Central Minnesota employment was 0.4 percent higher in March 2017 than it was one year earlier and the March regional unemployment rate was 5.4%--slightly lower than one year ago. Initial claims for unemployment insurance were 11 percent higher in March than they were in the same month last year. The Central Minnesota labor force rose by 0.3 percent over the past year and the region’s job vacancies remain elevated. Regional bankruptcies continue to decline.Economic performance in the St. Cloud area was mostly favorable. The future outlook from a survey of St. Cloud area business leaders conducted quarterly by St. Cloud State University was primarily positive, with most components increasing from one year earlier. Three out of five measures of St. Cloud area new business filings rose, employment expanded, the unemployment rate fell, average hours worked and the average weekly wage each increased, and median home sales prices were up.

2
Central Minnesota Leading Economic Indicators Index
The SCSU Central Minnesota Leading Economic Indicators (LEI) index is designed to predict performance of the regional economy with a four-to-six month lead time. The LEI rose 2.03 points in the first quarter after being largely unchanged in last year’s fourth quarter. Compared to one year ago, the LEI is now 1.25 percent higher. Five of Minnesota’s six planning areas experienced increased leading indexes in the first quarter of 2017—only Northwest Minnesota had a (slightly) negative LEI.
Component of Index Contribution to LEI, 1st quarter 2017 Contribution to LEI, 4th quarter 2016Minnesota Business Conditions Index 3.29 1.53
Central Minnesota initial claims for unemployment insurance 0.75 -1.16
Central Minnesota new filingsof incorporation 2.59 -0.64
St. Cloud MSA residentialbuilding permits -4.80 -0.05
National new orders fordurable goods, real 0.20 0.08
TOTAL CHANGE 2.03 -0.24
SCSU Central Minnesota Index of Leading Economic Indicators (December 1999 = 100)
Year
Inde
x
Components of SCSU Central Minnesota Leading Economic Indicators Index
3
Leading Economic Indicators Index
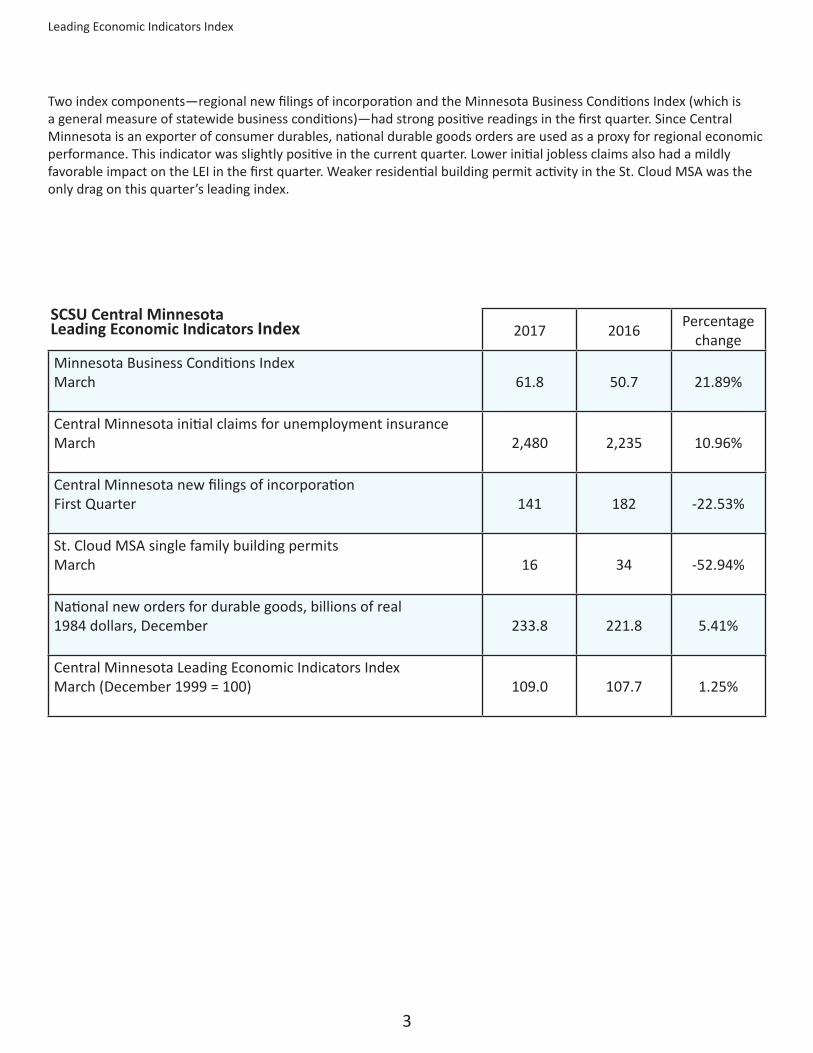
Two index components—regional new filings of incorporation and the Minnesota Business Conditions Index (which is a general measure of statewide business conditions)—had strong positive readings in the first quarter. Since Central Minnesota is an exporter of consumer durables, national durable goods orders are used as a proxy for regional economic performance. This indicator was slightly positive in the current quarter. Lower initial jobless claims also had a mildly favorable impact on the LEI in the first quarter. Weaker residential building permit activity in the St. Cloud MSA was the only drag on this quarter’s leading index.
2017 2016 Percentage change
Minnesota Business Conditions Index March 61.8 50.7 21.89%
Central Minnesota initial claims for unemployment insuranceMarch 2,480 2,235 10.96%
Central Minnesota new filings of incorporationFirst Quarter 141 182 -22.53%
St. Cloud MSA single family building permitsMarch 16 34 -52.94%
National new orders for durable goods, billions of real 1984 dollars, December 233.8 221.8 5.41%
Central Minnesota Leading Economic Indicators IndexMarch (December 1999 = 100) 109.0 107.7 1.25%
SCSU Central Minnesota Leading Economic Indicators Index

4
Central Minnesota Business Filings
Total New Business Filings—Central Minnesota Planning Area (12-month moving total)
Quarter I: 2016
II: 2016
III: 2016
IV: 2016
I: 2017
2017 Quarter I: Percent change from prior year
Central Minnesota Total New Business Filings 1,529 1,454 1,191 1,280 1,579 3.3%
The graphs in this section show 12-month moving totals for the various new business filings in Central Minnesota that are registered with the Office of the Minnesota Secretary of State. There were 1,579 new business filings in Central Minnesota in the first quarter. This represents a 3.3 percent increase from the same period in 2016. As can be seen in the accompanying graph, there was an abrupt increase in new business filings in mid-2008. This resulted from a sharp increase in new LLC filings at that time. This outlier (resembling a shark fin) is related to considerably higher filings in the construction industry and appears to be a one-time only transitory event seen in the data in all regions of Minnesota. The 12-month moving total of new business filings has generally trended upward since the end of 2015.
Year
Filin
gs

5
Business Filings
New Incorporations—Central Minnesota Planning Area (12-month moving total)
Quarter I: 2016
II: 2016
III: 2016
IV: 2016
I: 2017
2017 Quarter I: Percent change from prior year
Central Minnesota New Business Incorporations 182 163 117 134 161 -11.5%
After a decade of decline, new business incorporations had levelled out since the end of 2015. However, the declining trend appears to have resumed in the recent two quarters. After falling by a year-over-year rate of 24.3 percent in last year’s fourth quarter, this quarter’s Central Minnesota new business incorporations declined by 11.5 percent compared to one year earlier. As can be seen in the figure below, this dragged down the moving total of new business incorporations in the region.
Year
Filin
gs

6
Business Filings
Quarter I: 2016
II: 2016
III: 2016
IV: 2016
I: 2017
2017 Quarter I: Percent change from prior year
Central Minnesota New Limited Liability Companies 840 792 686 754 898 6.9%
There has been a move away from the traditional incorporation form of business organization towards the LLC throughout Minnesota. While new business incorporations remain an important indicator of new business formation in Central Minnesota, LLCs are increasingly useful in evaluating regional economic performance. The number of new LLCs increased by 6.9 percent (to 898) from one year earlier. As can be seen in the accompanying graph, the number of Central Minnesota LLCs has slowly trended upward in recent years.
New Limited Liability Companies—Central Minnesota Planning Area (12-month moving total)
Year
Filin
gs
7
Business Filings
Quarter I: 2016
II: 2016
III: 2016
IV: 2016
I: 2017
2017 Quarter I: Percent change from prior year
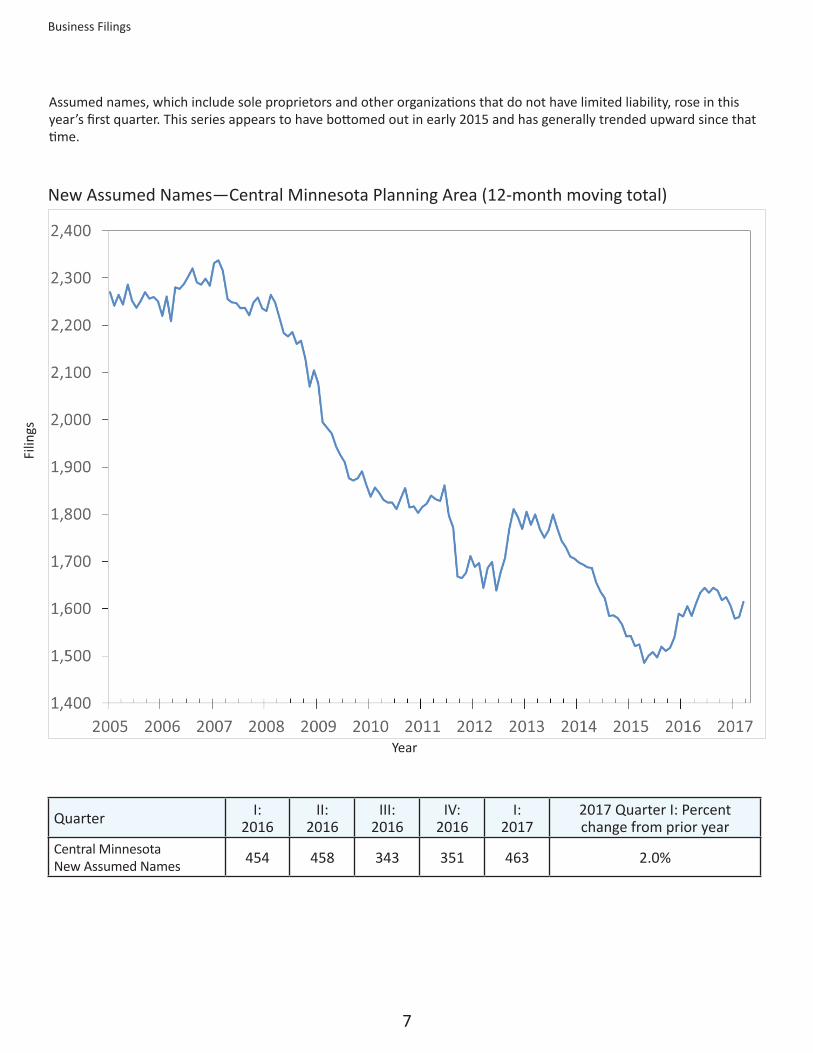
Central Minnesota New Assumed Names 454 458 343 351 463 2.0%
Assumed names, which include sole proprietors and other organizations that do not have limited liability, rose in this year’s first quarter. This series appears to have bottomed out in early 2015 and has generally trended upward since that time.
New Assumed Names—Central Minnesota Planning Area (12-month moving total)
Year
Filin
gs

8
Business Filings
New Non-Profits—Central Minnesota Planning Area (12-month moving total)
Quarter I: 2016
II: 2016
III: 2016
IV: 2016
I: 2017
2017 Quarter I: Percent change from prior year
Central Minnesota New Non-Profits 53 41 45 41 57 7.5%
There were 57 new Central Minnesota non-profits registered with the Office of the Minnesota Secretary of State in the first quarter of 2017. This was 7.5 percent more filings than one year ago.
Year
Filin
gs

9
Minnesota Business Snapshot Survey Results
In Fall 2016, the Office of the Minnesota Secretary of State initiated a short voluntary survey, known as the Minnesota Business Snapshot or MBS, for both new and continuing business filers. Questions found in the survey address basic questions related to the background of business filers, industry classification, employment levels and annual revenue of the filer, and whether the business is a full- or part-time activity for the filing entity. While a comprehensive analysis of this promising new data set is the beyond the scope of this regional economic and business conditions report, the survey results do provide useful additional background information to complement the business filing data.
To match up MBS information with the data analyzed in this report, only surveys accompanying new filings in the first quarter of 2017 are analyzed. For the entire State of Minnesota, the overall response rate for this voluntary survey is approximately 60 percent. This yields thousands of self-reported records in this emerging data set. For Central Minnesota, over 68 percent of new business filers completed at least some portion of the MBS survey. The results are reported in this section.
Approximately 5 percent of those new filers completing the MBS from the Central Minnesota planning area report being from a community of color. This is a considerably lower percentage than in the Twin Cities, but is higher than in most other regions of Minnesota.

10
Minnesota Business Snapshot Survey Results
A small percentage of Central Minnesota’s new filers—around 1 percent—are from the disability community.
Over 3 percent of new business filings in Central Minnesota come from the immigrant community. Only the Twin Cities has a higher percentage.

11
Minnesota Business Snapshot Survey Results
Nearly six percent of new filings in Central Minnesota come from military veterans.
Woman owners represented approximately 43 percent of the new business filings in Central Minnesota in the first quarter of 2017.

12
Minnesota Business Snapshot Survey Results
While not all of those participating in the survey completed all portions of the Minnesota Business Snapshot (those not responding to a particular question are represented in this section by “NAP”—no answer provided), more than 1,000 responses were tallied to a question asking the new business filer to indicate the range of employment at the business. As expected, most new businesses start small—employment at most companies submitting a new filing ranges from 0-5 employees.

13
Minnesota Business Snapshot Survey Results
Using the North American Industry Classification System (NAICS), businesses submitting new filings were asked to identify the industry in which their company was operating. While a range of industries were reported, construction, retail trade, and “other services” lead the way. Agriculture (see the bar labelled fishing, hunting...), transportation and warehousing, real estate rental and leasing, and professional, scientific, and technical are also well represented in the sample. Relatively few new businesses in Central Minnesota are entering the high employment sectors of health care and education.

14
Minnesota Business Snapshot Survey Results
Nearly half of those submitting a new business filing in Central Minnesota are part-time ventures.
More than 300 new business filers in Central Minnesota did not provide an answer to the MBS item that asked them to report the company’s revenue. Of those businesses that answered the question, the largest share report revenues of less than $10,000. More than 100 firms report revenues in excess of $50,000.

15
Maps
The first map shown below is a visual representation of new business filings around the Central Minnesota planning area in the first quarter of 2017. As usual, the densest areas of new business filings are in the St. Cloud metro as well as along the I-94/US-10 corridor approaching the Twin Cities. The geographic center of new filings lies within that I-94/US-10 corridor. Well-traveled roadways are also a predictor of new business filings in Central Minnesota.
Central Minnesota Planning Area--New Business Formation--Quarter 1: 2017

16
Maps
The second map shows new business filings for the state as a whole. This visual aid demonstrates the considerable extent to which the Twin Cities metro area dominates new business formation in the state. The map shows how the Twin Cities metro stretches along roadways into the Southeast, Southwest and Central planning areas. The map demonstrates the importance of cities and roadways in encouraging economic development. St. Cloud now appears to be integrated into the Twin Cities metro as the I-94/US-10 corridor continues to be a magnet for new business formation. The importance of Interstates 90 and 35 as well as US-10 and MN 61 (along the North Shore) in new business filings is also easily seen in this map.
Minnesota--New Business Formation--Quarter 1: 2017
1717
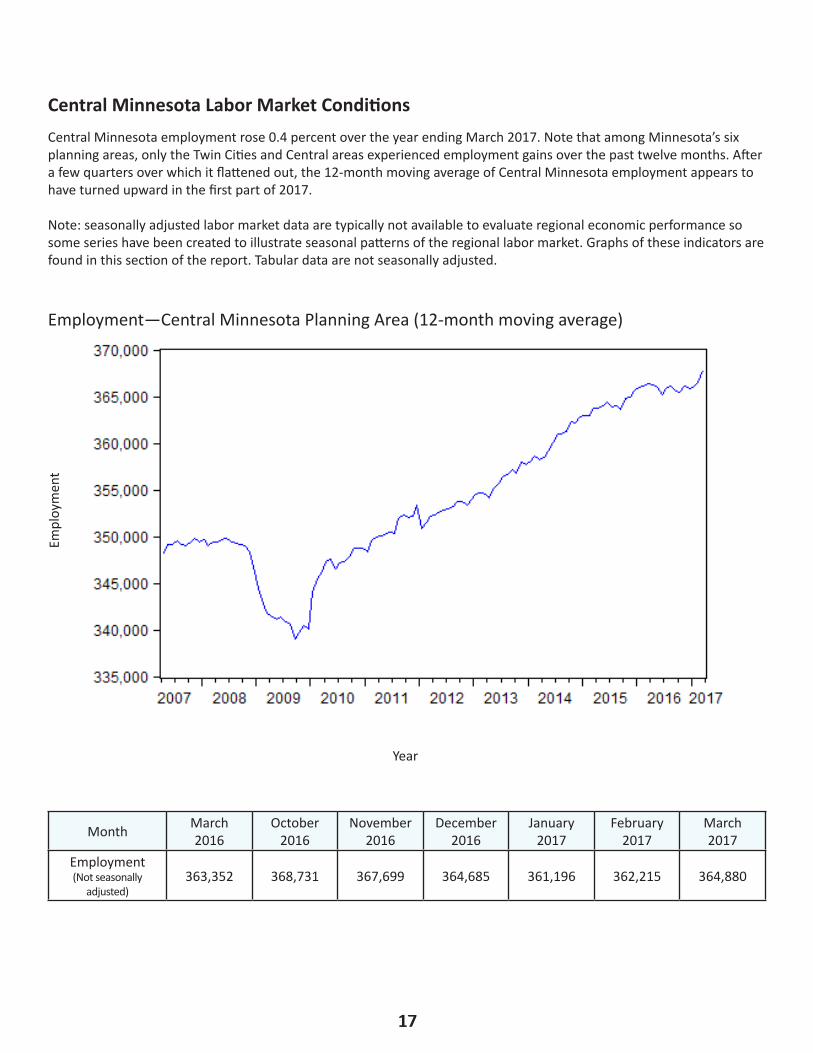
Central Minnesota Labor Market ConditionsCentral Minnesota employment rose 0.4 percent over the year ending March 2017. Note that among Minnesota’s six planning areas, only the Twin Cities and Central areas experienced employment gains over the past twelve months. After a few quarters over which it flattened out, the 12-month moving average of Central Minnesota employment appears to have turned upward in the first part of 2017.
Note: seasonally adjusted labor market data are typically not available to evaluate regional economic performance so some series have been created to illustrate seasonal patterns of the regional labor market. Graphs of these indicators are found in this section of the report. Tabular data are not seasonally adjusted.
Employment—Central Minnesota Planning Area (12-month moving average)
Month March2016
October 2016
November 2016
December 2016
January 2017
February 2017
March2017
Employment (Not seasonally
adjusted)363,352 368,731 367,699 364,685 361,196 362,215 364,880
Year
Empl
oym
ent

18
Labor Market Conditions
Despite a rising labor force, Central Minnesota’s unemployment rate was 5.4 percent in March 2017, slightly lower than one year earlier. After rising in recent quarters, the seasonally adjusted unemployment rate started the new year with a small decline.
Month March2016
October 2016
November 2016
December 2016
January 2017
February 2017
March2017
Unemployment Rate(Not seasonally adjusted) 5.5% 3.5% 3.6% 4.8% 6.1% 5.9% 5.4%
Unemployment Rate, seasonally adjusted—Central Minnesota Planning Area
Year
Une
mpl
oym
ent R
ate

19
Labor Market Conditions
Period March2016
October 2016
November 2016
December 2016
January 2017
February 2017
March2017
Initial claims(Not seasonally adjusted) 2,235 2,130 5,760 5,795 3,759 2,117 2,480
Initial claims for unemployment insurance in the Central Minnesota planning area were 2,480 in March 2017. This represents 11 percent more claims than one year ago. Despite this (as can be seen in the accompanying graph), the seasonally adjusted initial jobless claims series has been trending downward in recent quarters.
Total Initial Claims for Unemployment Insurance, seasonally adjusted—Central Minnesota Planning Area
Year
Clai
ms

20
Labor Market Conditions
Quarter 2014:II 2014:IV 2015:II 2015:IV 2016:II 2016:IV Job Vacancies per 100
Unemployed 52.12 60.30 80.39 82 74.10 65.49
The ratio of job vacancies per 100 unemployed remains elevated in Central Minnesota. With 65.49 job vacancies per 100 unemployed, the shortage of qualified workers continues to plague Central Minnesota. Fortunately, this job vacancy ratio has been trending downward since its peak in the second quarter of 2015. While Central Minnesota’s job vacancy ratio is about the same as observed in the Northeast and Northwest planning areas, the rate of job vacancies is considerably higher in the Twin Cities, Southeast and Southwest portions of the state. The ratio of job vacancies per 100 unemployed in the Twin Cities now stands at 106.83, representing more job vacancies than unemployed people available to fill these vacancies.
Job Vacancies per 100 Unemployed---Central Minnesota Planning Area
Quarter
Vaca
ncie
s

21
Labor Market Conditions
Year (March) 2012 2013 2014 2015 2016 2017Labor Force
(Not seasonally adjusted) 377,338 376,321 379,202 380,835 384,657 385,799
The Central Minnesota labor force expanded at a 0.3 percent rate over the year ending in March 2017. As seen in the accompanying graph, as a result of recently revised data, it now looks like the 12-month moving average of the regional labor force has been steadily rising over the past several years. Among Minnesota’s six planning areas, only the Twin Cities has experienced similar labor force growth. Northwest and Southeast planning area labor force growth has been weaker and more erratic, while Southwest Minnesota has seen its labor force growth flatten out. The Northeast Minnesota planning area has experienced a steadily declining work force for several years.
Labor Force—Central Minnesota Planning Area (12-month moving average)
Year
Labo
r For
ce

22
Year (First Quarter) 2012 2013 2014 2015 2016 2017Annual Bankruptcies(Not seasonally adjusted) 3,016 2,483 2,154 1,994 1,565 1,487
The figure below shows the 12-month moving total for Central Minnesota bankruptcies since the second quarter of 2007 (shortly before the beginning of the Great Recession). As can be seen in the figure, this moving total peaked out in the second quarter of 2010, and has slowly declined since that time. With 1,487 bankruptcies over the past twelve months, the annual level of bankruptcies in Central Minnesota is slightly lower than it was in the first quarter of 2016.
Central Minnesota Bankruptcies (12-month moving total)
Central Minnesota Bankruptcies
Quarter
Bank
rupt
cies

23
Economic Indicators
St. Cloud MSA Indicators
(m) represents a monthly series; (q) represents a quarterly series
Period Covered Current Period
Prior Year
Annual Percent Change
Long-Term Average (since 1999, unless noted)
LABOR MARKET
Employment March 2017 (m) 107,409 106,312 1.0% ↑ 0.9%
Manufacturing Employment March 2017 (m) 14,819 15,066 -1.6% ↓ -0.7%
Average Weekly Work Hours--Private Sector March 2017 (m) 33.3 32.3 3.1% ↑ 33.1
Average Earnings Per Hour--Private Sector March 2017 (m) $26.76 $24.83 7.8% ↑ 3.6%
Unemployment Rate March 2017 (m) 4.7% 4.9% NA ↓ 5.9%
Labor Force March 2017 (m) 110,320 110,304 0.0% ↔ 0.7%
SCSU Future Employment Index February 2017 (q) 37.3 31 20.3% ↑ 32.3 (since 2005)
SCSU Future Length of Workweek Index February 2017 (q) 22.2 13.8 60.9% ↑ 18.7 (since 2005)
SCSU Future Employee Compensation Index February 2017 (q) 68.9 60.3 14.3% ↑ 43.5 (since 2005)
SCSU Future Worker Shortage Index February 2017 (q) 26.4 39.7 -33.5% ↓ 18.8
St. Cloud-Area New Unemployment Insurance Claims March 2017 (m) 610 522 16.9% ↑ NA
St. Cloud Times Help Wanted Linage January 2017 (q) 2,029.4 2,522.8 -19.6% ↓ NA
BUSINESS FORMATION
New Business Filings First Quarter 2017 401 364 10.2% ↑ 367 (since 2000)
Assumed Names First Quarter 2017 133 107 24.3% ↑ 125 (since 2000)
Business Incorporations First Quarter 2017 35 43 -18.6% ↓ 72 (since 2000)
Limited Liability Companies First Quarter 2017 222 196 13.3% ↑ 157 (since 2000)
Non-Profits First Quarter 2017 11 18 -38.9% ↓ 13 (since 2000)

24
Economic Indicators
Central Minnesota contains the St. Cloud MSA, where signals of the future economic health of this metropolitan area are mostly favorable. For example, the future outlook from a survey of St. Cloud area business leaders conducted quarterly by St. Cloud State University was primarily positive, with most components increasing from one year earlier. Three out of five measures of St. Cloud area new business filings rose, employment expanded, the unemployment rate fell, average hours worked and the average weekly wage each increased, and median home sales prices were up.
Period Covered Current Period Prior Year Annual Percent
ChangeLong-Term Average (since
1999, unless noted)
BUSINESS ACTIVITY
SCSU Future Business Activity Index February 2017 (q) 57.8 44.9 28.7% ↑ 53.7 (since 2005)
SCSU Future Capital Expenditures Index February 2017 (q) 22.3 22.5 -0.9% ↓ 19.5 (since 2005)
SCSU Future National Business Activity Index February 2017 (q) 35.6 18.9 88.4% ↑ 26.4 (since 2005)
St. Cloud Index of Leading Economic Indicators January 2017 (m) 102.7 102.6 0.1% ↑ NA
PRICES
St. Cloud Median Home Sales Prices March 2017 (m) $168,400 $138,750 21.4% ↑ NA
SCSU Future Prices Received Index February 2017 (q) 22.2 32.8 -32.2% ↓ 22 (since 2005)
St. Cloud MSA Indicators, Cont’d.
(m) represents a monthly series; (q) represents a quarterly series

25
Economic Indicators
State and National Indicators
Across the state, all year-over year categories of economic performance found in the State and National Indicators table are favorable. There was growth in payrolls, higher earnings per hour, more average weekly hours worked in the private sector, and a lower seasonally adjusted unemployment rate over the past twelve months. Current and leading Indicators from the Federal Reserve Bank of Philadelphia are both higher than one year earlier and the Minnesota Business Conditions index rose nearly 22 percent. Milk prices are higher than one year ago (although they declined over the three months ending March 2017) and enplanements at the Minneapolis-St. Paul airport increased by 4.1 percent over the last twelve months.
While three national economic indicators shown in the table were weaker over the past three months, most of the measures in this part of the table reinforce the strong economic outlook found throughout this report. Over the past twelve months, stock prices rose, employment increased, and real income and consumer expenditures expanded. The national unemployment rate fell and retail sales improved. Industrial production picked up. National building permits were also higher. As noted last quarter, oil prices have firmed up to $50 per barrel compared to under $40 a year ago. While rising oil prices adversely impact the discretionary income of households, they also improve the economic well-being of those employed in the energy sector (which has been struggling in recent years).
MINNESOTA Indicators Mar 2017 Dec 2016 Mar 2016
Change from one
quarter agoAnnual Change
Nonfarm payroll employment, SA 2,879,836 2,915,048 2,831,674 -1.2% 1.7%Average weekly hours worked, private sector 33.7 33.9 33.5 -0.6% 0.6%Unemployment rate, seasonally adjusted 3.8% 4.0% 3.9% NA NAEarnings per hour, private sector $28.21 $27.85 $27.05 1.3% 4.3%Philadelphia Fed Coincident Indicator, MN 198.50 196.42 192.93 1.1% 2.9%Philadelphia Fed Leading Indicator, MN 2.88 1.47 1.47 95.9 % 95.9%Minnesota Business Conditions Index 61.8 52.3 50.7 18.2% 21.9%Price of milk received by farmers (cwt) $17.50 $19.60 $15.80 -10.7% 10.8%Enplanements, MSP airport, thousands 1,731.6 1,456.8 1,662.9 18.9% 4.1%
NATIONAL Indicators Mar 2017 Dec 2016 Mar 2016
Change from one
quarter agoAnnual Change
Nonfarm payroll employment, SA, thousands 145,858 145,325 143,673 0.4% 1.5%Industrial production, index, SA 104.1 103.8 102.5 0.3% 1.6%Real retail sales, SA ($) 193,165 193,812 188,072 -0.3% 2.7%Real personal income less transfers ($, bill.) 12,154.6 12,088.4 11,825.3 0.5% 2.8%Real personal consumption expenditures ($, bill.) 11,695.6 11,709.4 11,374.4 -0.1% 2.8%Unemployment rate, SA 4.5% 4.7% 5.0% NA NANew building permits, SA, thousands 22,864 17,581 19,300 30.0% 18.5%Standard & Poor’s 500 stock price index 2,366.8 2,246.6 2,022.0 5.4% 17.1%Oil, price per barrel in Cushing, OK $49.33 $51.97 $37.55 -5.1% 31.4%

26
Sources
The Central Minnesota Quarterly Economic and Business Conditions Report is a collaboration between the Office of the Minnesota Secretary of State and the School of Public Affairs Research Institute (SOPARI) of St. Cloud State University. All calculations and text are the result of work by SOPARI, which is solely responsible for errors and omissions herein.
Text authored by Professors King Banaian and Rich MacDonald of the Economics Department of St. Cloud State University. Research assistance provided by Alex Franta and Natalie Hughes. Professor David Wall of the SCSU Geography Department provided GIS assistance.
Sources
Council for Community and Economic Research: Cost of Living Index.
Creighton University Heider College of Business: Minnesota Business Conditions Index, Rural MainStreet Index.
Federal Reserve Bank of Philadelphia: Minnesota Coincident Indicator Index, Minnesota Leading Indicators Index.
Federal Reserve Board of Governors: Industrial Production.
Institute for Supply Management: Manufacturing Business Survey, Purchasing Managers Index.
Metropolitan Airports Commission: MSP Enplanements.
Minnesota Department of Employment and Economic Development (and U.S. Department of Labor Bureau of Labor Statistics):
Average Hourly Earnings, Average Weekly Work Hours, Employment, Initial Claims for Unemployment Insurance, Job Vacancies, Labor
Force, Manufacturing Employment, Unemployment Rate.
Office of the Minnesota Secretary of State: Assumed Names, Business Incorporations, Limited Liability Companies, Non-Profits,
Minnesota Business Snapshot.
SCSU School of Public Affairs Research Institute: SCSU Central Minnesota Index of Leading Economic Indicators, SCSU Future Business
Activity Index, SCSU Future Capital Expenditures Index, SCSU Future Employee Compensation Index, SCSU Future Employment Index,
SCSU Future Length of Workweek Index, SCSU Future National Business Activity Index, SCSU Future Prices Received Index, SCSU Future
Worker Shortage Index, St. Cloud Index of Leading Economic Indicators.
St. Cloud Area Association of REALTORS: Median Home Prices.
St. Cloud Times: St. Cloud Times Help Wanted Linage.
Standard & Poor’s: Standard & Poor’s 500 Stock Price Index.
Thomson Reuters and University of Michigan: Index of Consumer Sentiment
U.S. Bankruptcy Courts: Bankruptcies
U.S. Bureau of Census: Durable Goods Orders, Housing Permits, Residential Building Permits, Retail Sales.
U.S. Department of Agriculture: Milk Prices.
U.S. Department of Commerce Bureau of Economic Analysis: Real Personal Consumption, Real Personal Income, Real Wages and
Salaries.
U.S. Energy Information Administration: Oil Prices.