Embed Size (px)
Citation preview
Central Indiana Water StudyKick-off Meeting
April 29, 2019

An Overview of Indiana’s SWWF Registration and Water
Use Reporting ProgramIFA Central Indiana Water Study Kick-off Meeting
April 29, 2019
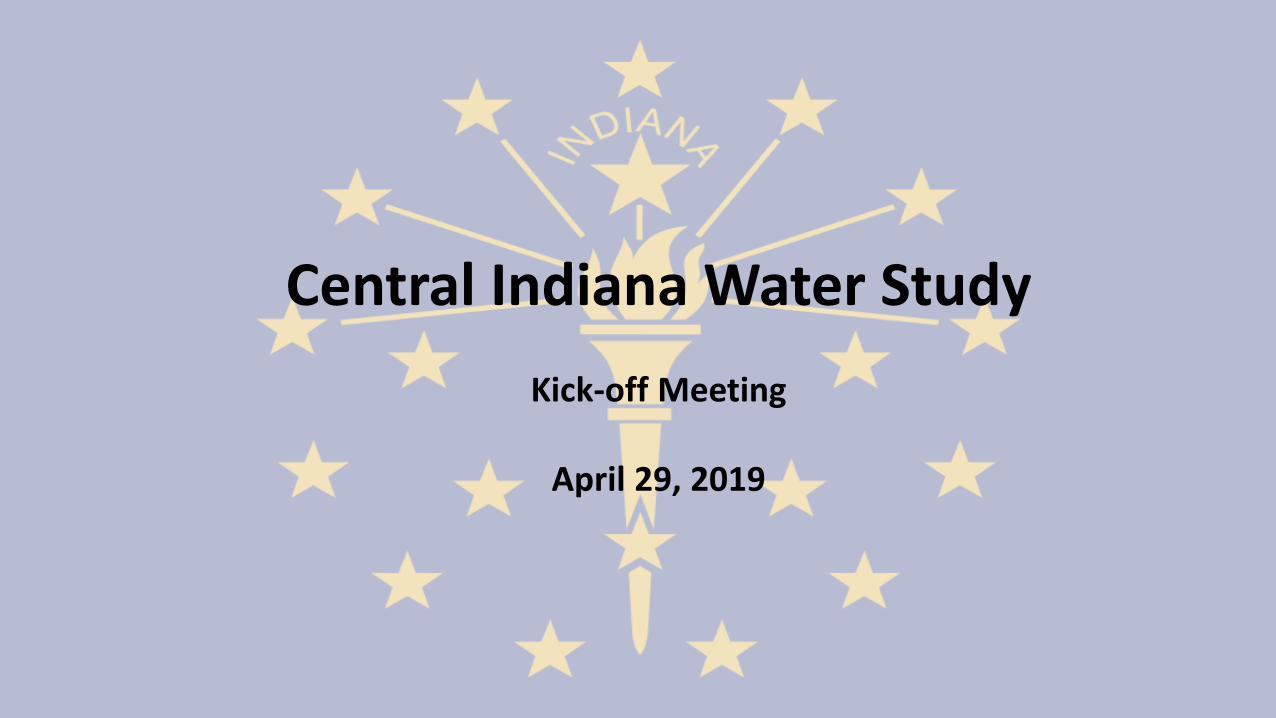
IC 14-25-7: Water Resources Management Act• Enacted in 1983• Requires registration of all
SWWF (gw & sw)• Facility defined as greater
than 100,000 GPD capability• Capability is aggregate of all
wells & intakes• Annual water use reporting
required• Approximately 4100 SWWFs
currently registered
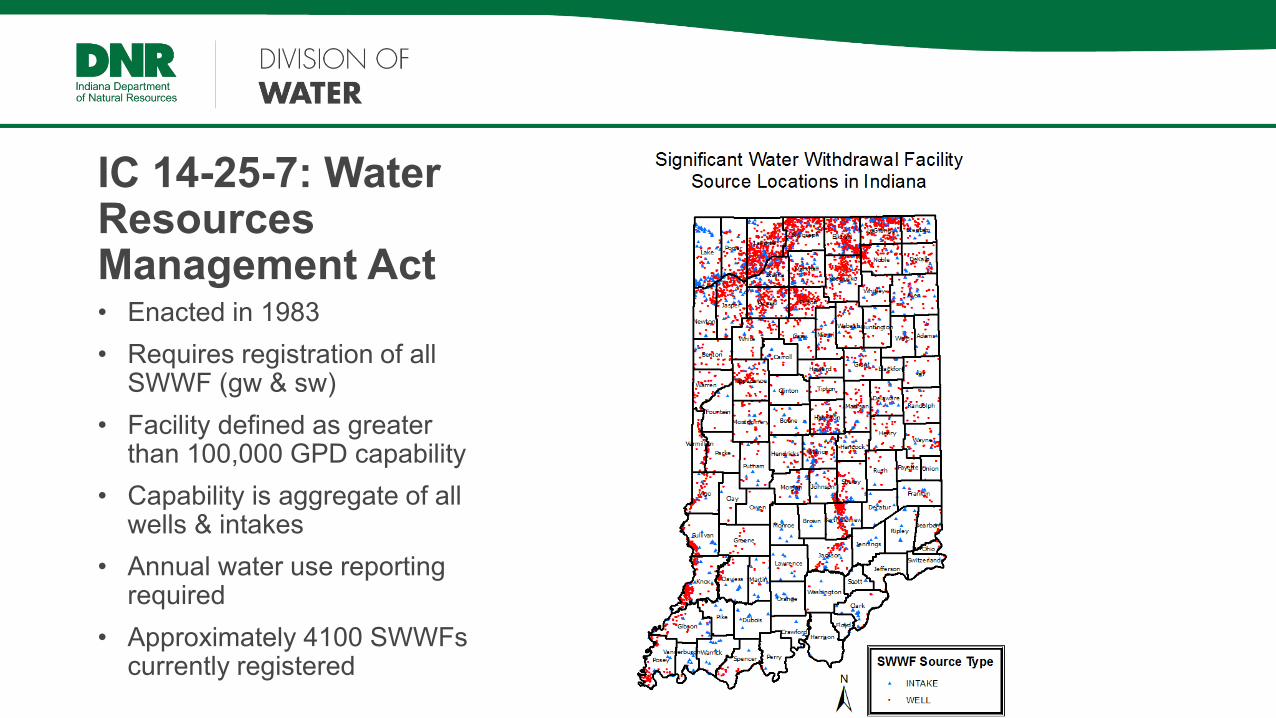
2017 Indiana Registered SWWFsWater Use Code Number of Facilities Number of Wells Number of Intakes
EP 92 259 95
IN 378 688 291
IR 2767 3786 805
MI 135 234 51
PS 706 2182 64
RU 58 145 12
TOTAL 4136 7294 1318

2017 State Totals
Withdrawals(BG)
Capacity(MGD)
Withdrawalsvs Capacity
Current Number
SurfaceIntakes 2033 17610 31.6% 1318
Wells 222 6035 10% 7294
TOTAL 2255 23645 26.1% 8612
Facilities 4136

0
500
1000
1500
2000
2500
3000
3500
4000
Tota
l With
draw
als (
BG)
Total Annual Withdrawals 1985-2017
Total
SW
GW

0
50
100
150
200
250
300
Tota
l With
draw
als (
BG)
Total Annual Withdrawals- Central IN Region1985-2017
Total
SW
GW
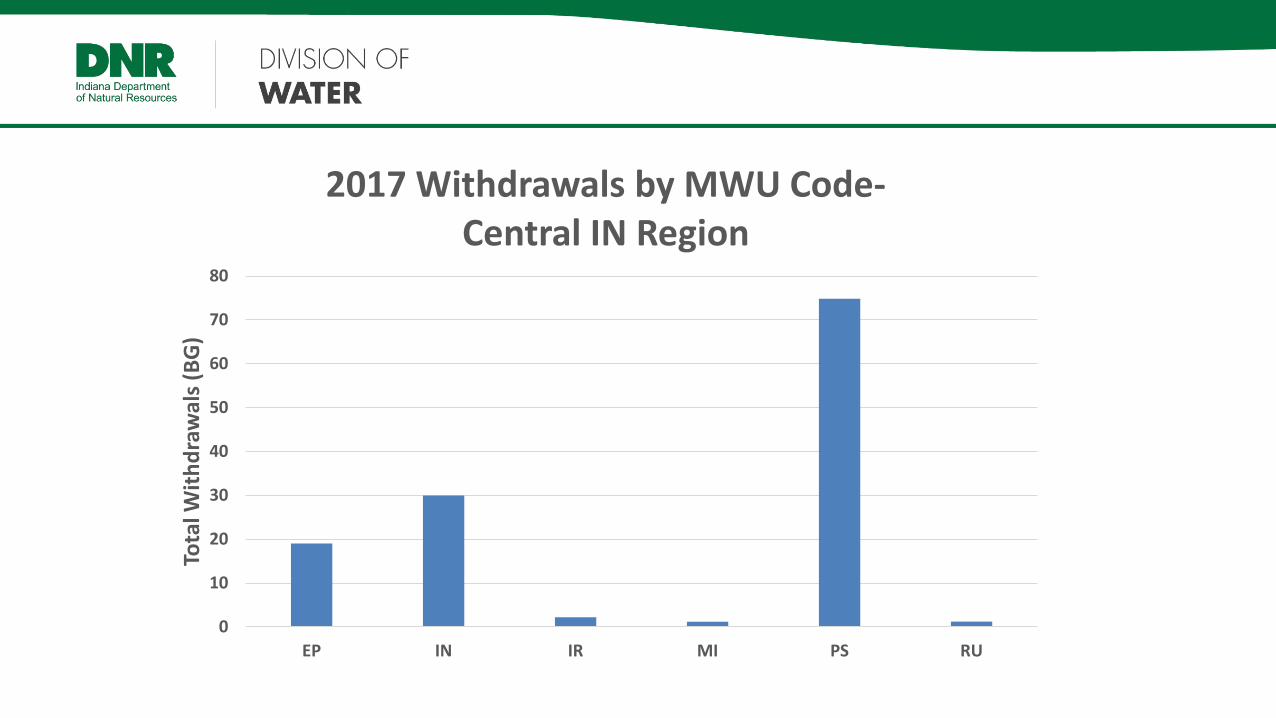
0
10
20
30
40
50
60
70
80
EP IN IR MI PS RU
Tota
l With
draw
als (
BG)
2017 Withdrawals by MWU Code-Central IN Region

0
10
20
30
40
50
60
70
80
90
100
Tota
l With
draw
als (
BG)
Total Annual Withdrawals- Central IN RegionPublic Supply 1985-2017

0
10
20
30
40
50
60
70
80
90
2012 2013 2014 2015 2016 2017
Tota
l With
draw
als (
BG)
Withdrawals by MWU Code 2012-2017Central IN Region
EP
IN
IR
MI
PS
RU
For More Information Regarding Indiana’s SWWF Registration and Water Use Program
Allison Mann [email protected]

Climate Trends, Extremes, and Variability
in Central Indiana
Beth Hall
Director, Indiana State Climate Office
Purdue UniversityApril 2019

Indiana Climate Divisions

Average Annual Temperature
47.0
48.0
49.0
50.0
51.0
52.0
53.0
54.0
55.0
1895
1900
1905
1910
1915
1920
1925
1930
1935
1940
1945
1950
1955
1960
1965
1970
1975
1980
1985
1990
1995
2000
2005
2010
2015
Tem
pera
ture
(F)
Annual Average Temperature - Central Indiana

Average Annual Temperature
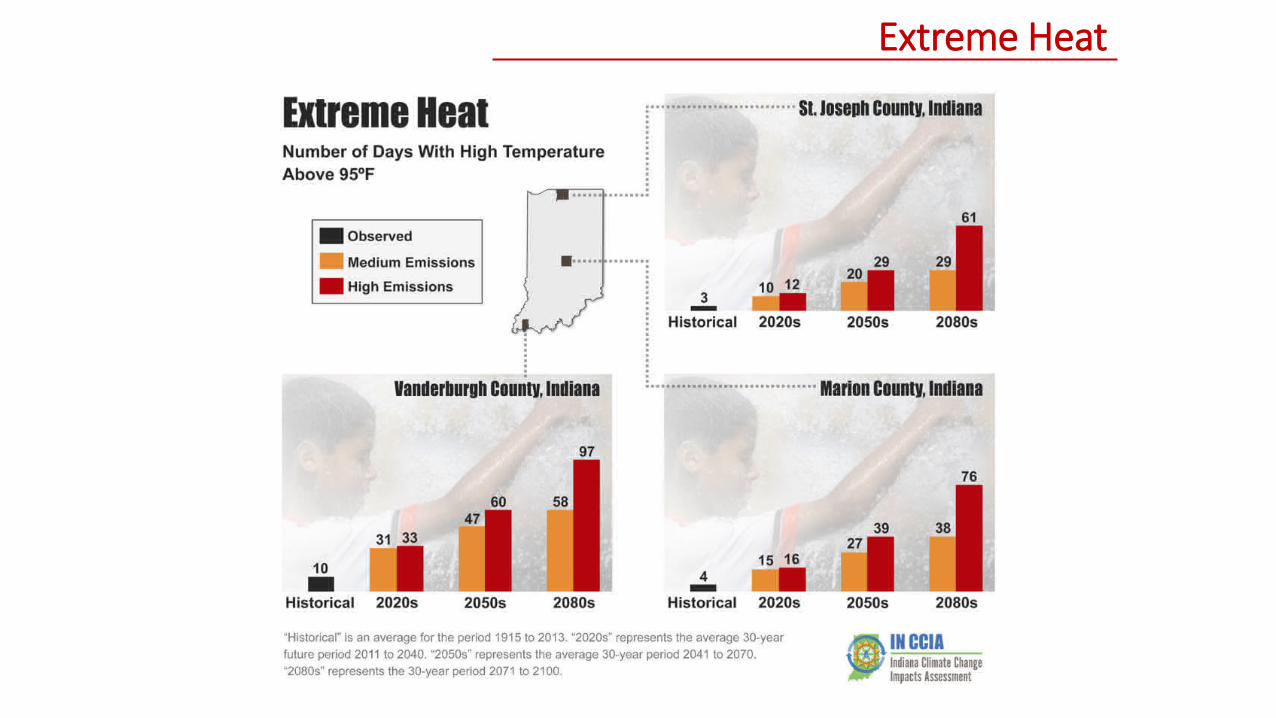
Extreme Heat

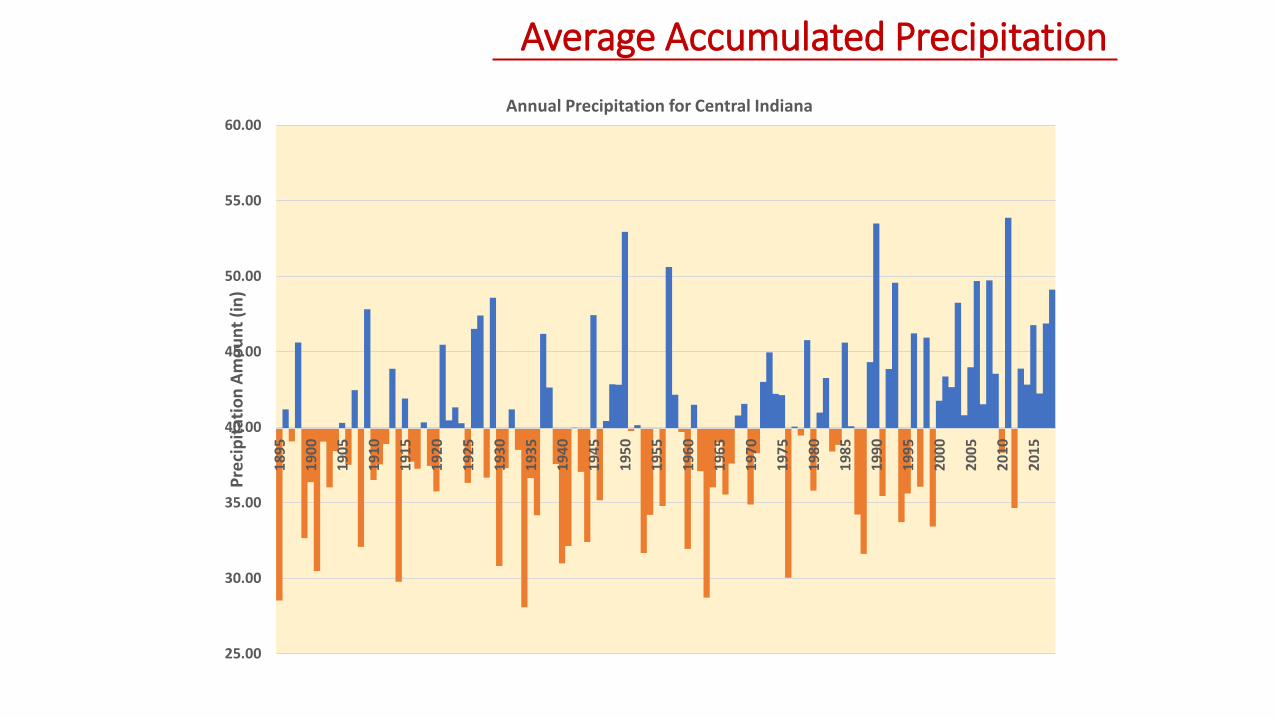
Average Accumulated Precipitation
25.00
30.00
35.00
40.00
45.00
50.00
55.00
60.00
1895
1900
1905
1910
1915
1920
1925
1930
1935
1940
1945
1950
1955
1960
1965
1970
1975
1980
1985
1990
1995
2000
2005
2010
2015
Prec
ipita
tion
Amou
nt (i
n)
Annual Precipitation for Central Indiana
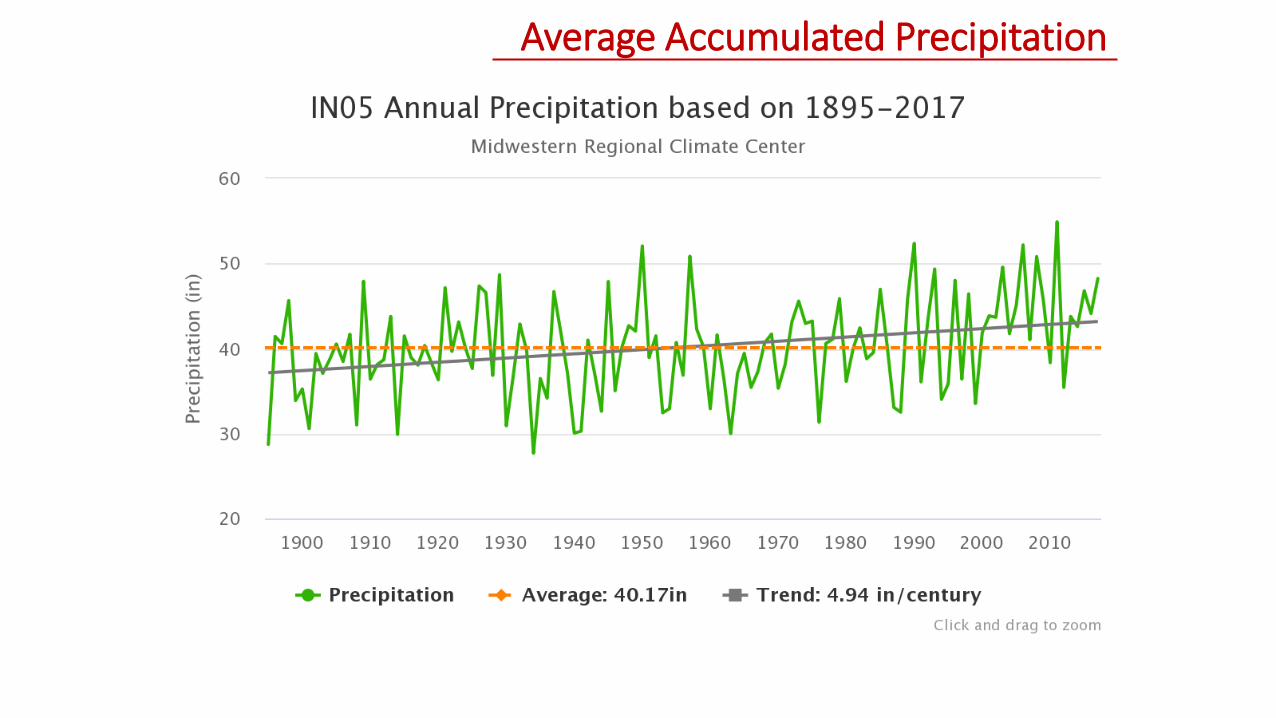
Average Accumulated Precipitation

Average Accumulated Precipitation
Shaded areas indicate range of uncertainty

Drought / Flood Variability
0
10
20
30
40
50
60
70
80
90
100
12/27 1/31 3/6 4/10 5/15 6/19 7/24 8/28 10/2 11/6 12/11
Perc
enta
ge w
ithin
Dro
ught
Cat
egor
ies
2012 Indiana Drought Monitor
No Drought D0 D1 D2 D3 D4
Average Accumulated Precipitation
25.00
30.00
35.00
40.00
45.00
50.00
55.00
60.00
1895
1900
1905
1910
1915
1920
1925
1930
1935
1940
1945
1950
1955
1960
1965
1970
1975
1980
1985
1990
1995
2000
2005
2010
2015
Prec
ipita
tion
Amou
nt (i
n)
Annual Precipitation for Central Indiana
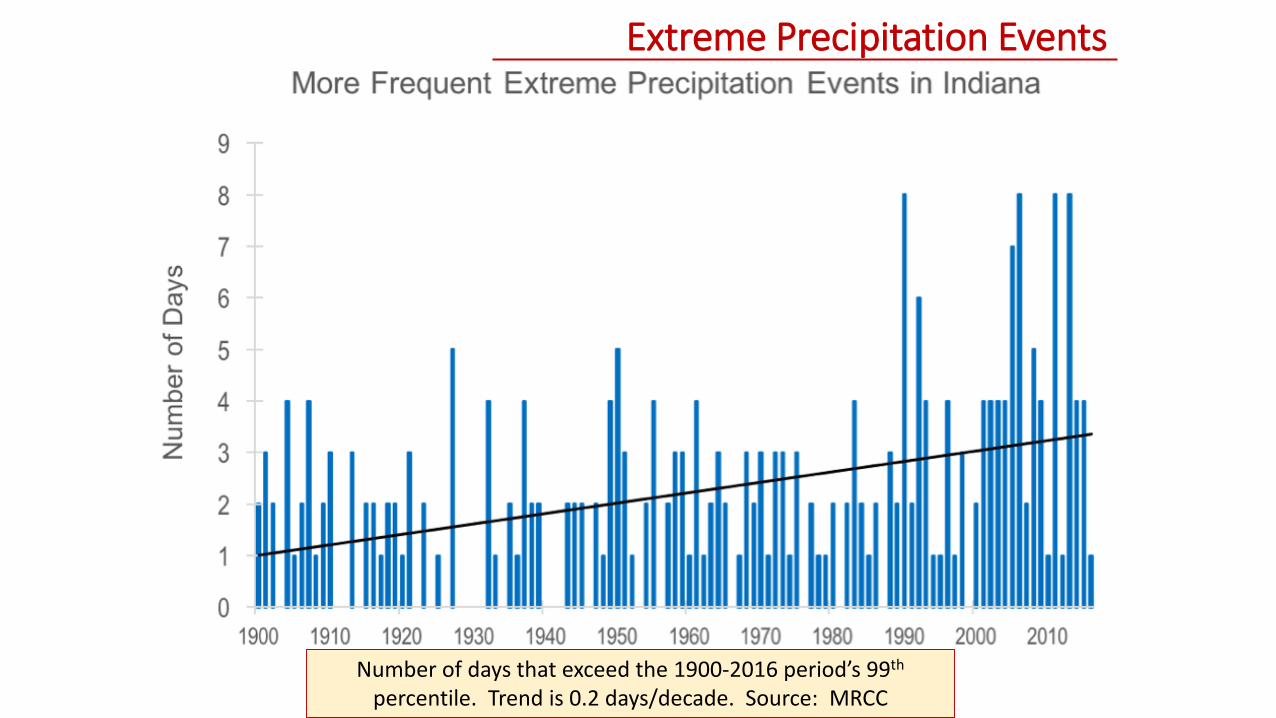
Extreme Precipitation Events
Number of days that exceed the 1900-2016 period’s 99th
percentile. Trend is 0.2 days/decade. Source: MRCC

Average Accumulated Precipitation

Questions?
Beth Hall
Director, Indiana State Climate Office
Purdue University

U.S. Department of the InteriorU.S. Geological Survey
Indiana Groundwater Monitoring: What is our current status and
where do we lack monitoring?
David Lampe, Randy Bayless, Jeff Frey U.S. Geological Survey, Ohio-Kentucky-Indiana Water Science Center (OKI WSC)
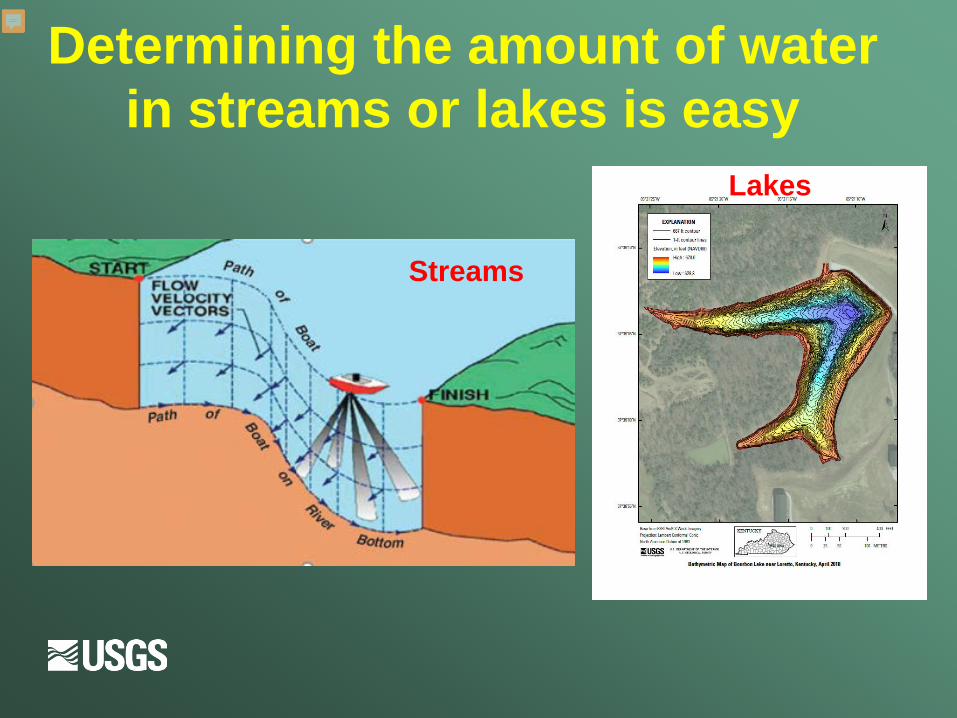
Determining the amount of water in streams or lakes is easy
Lakes
Streams

Determining the amount of water in aquifers is more difficult
Groundwater level data and physical characteristics of the system are used to estimate the amount of water stored in the aquifer
Water budget

88 Wells 37 Wells
Wells can tell us groundwater levels: they have decreased dramatically over time
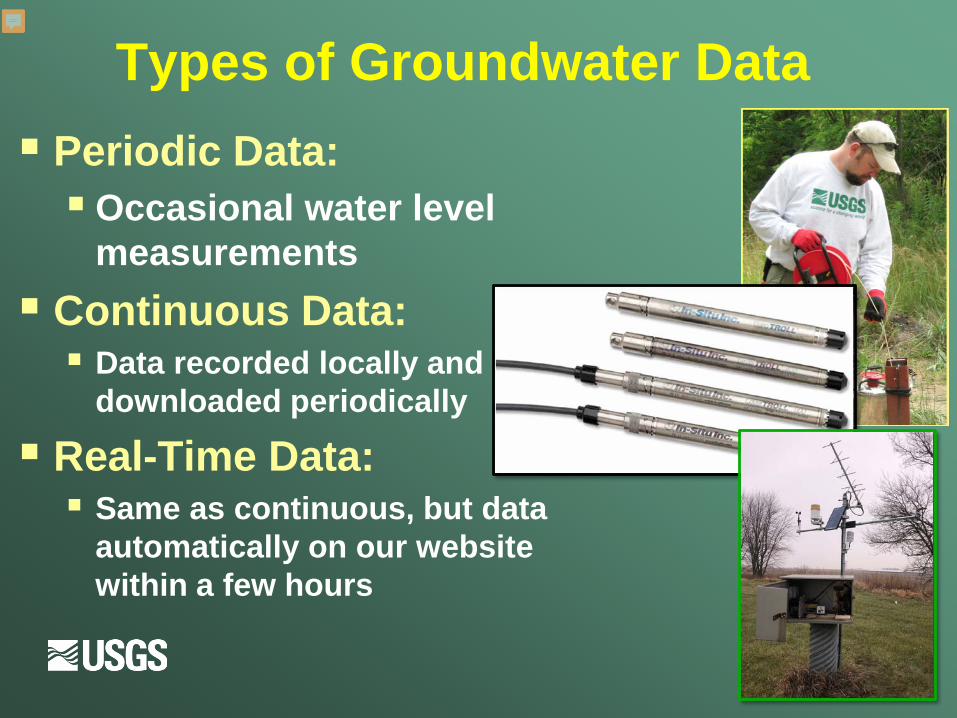
Types of Groundwater Data Periodic Data:Occasional water level
measurements Continuous Data: Data recorded locally and
downloaded periodically
Real-Time Data: Same as continuous, but data
automatically on our website within a few hours
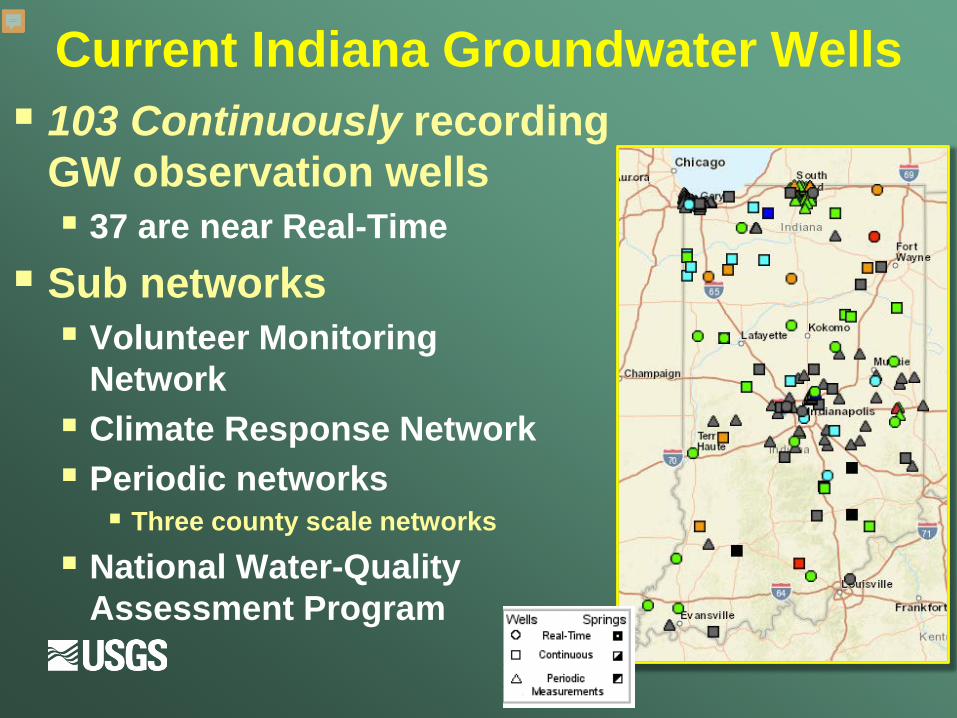
Current Indiana Groundwater Wells 103 Continuously recording
GW observation wells 37 are near Real-Time
Sub networks Volunteer Monitoring
Network Climate Response Network Periodic networks Three county scale networks
National Water-Quality Assessment Program
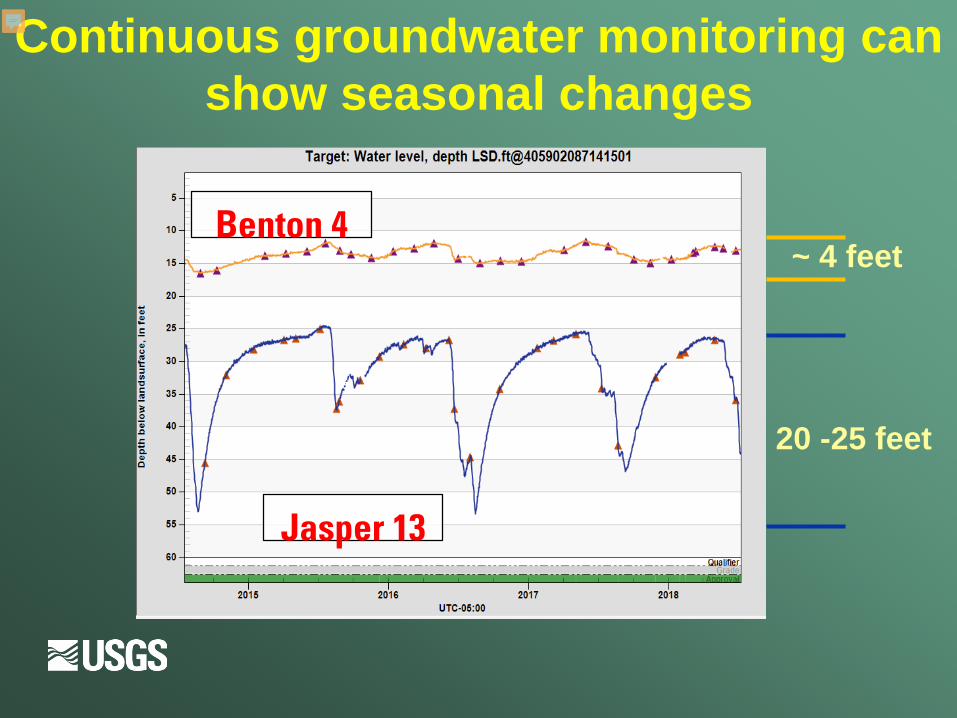
Continuous groundwater monitoring can show seasonal changes
Jasper 13
Benton 4~ 4 feet
20 -25 feet

USGS Active GW Network portal
https://groundwaterwatch.usgs.gov/netmapT4L1.asp?ncd=IDV
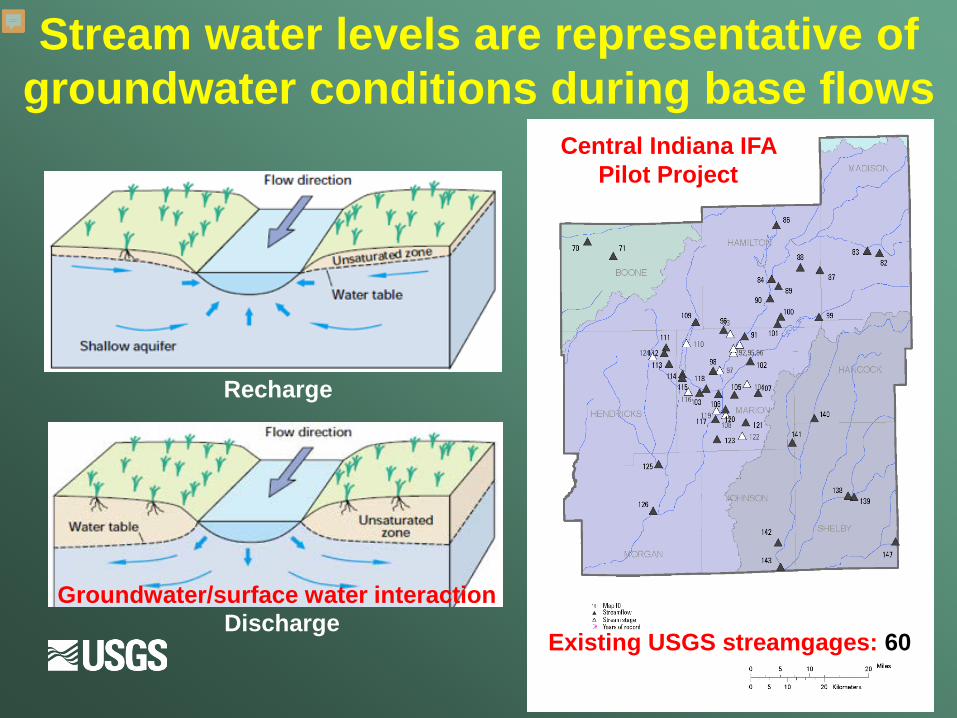
Stream water levels are representative of groundwater conditions during base flows
Groundwater/surface water interaction
Existing USGS streamgages: 60
Central Indiana IFA Pilot Project
Recharge
Discharge

How do we know the depth and extent of an aquifer?
Groundwater level and physical characteristics data will tell us the water levels of the aquifer but how do we know the extent of the aquifer?
Groundwater

Aquifers are not homogenous
Water budget

There are several ways to estimate aquifer capacity
Existing Data: IDNR well log data base Previously published studies of groundwater systems Previous mapping studies
Collect New Data: Drill new wells in areas lacking data Use noninvasive geophysical techniques to penetrate
subsurface and determine material properties Use statistics to estimate aquifer properties based on
existing datasets

There are several ways to estimate aquifer capacity (cont.)
Well drillers logs dataset Penetrates the entire
thickness of the unconsolidated deposits Identifies depth of the
aquifer Well drillers log dataset
needs updating Critical for the
modeling component
Yellow areas lack data

Combining reservoir water levels and storage capacity information allows for
the estimation of available water
Eagle Creek, Morse and Geist Reservoirs are key to monitoring and modeling efforts.
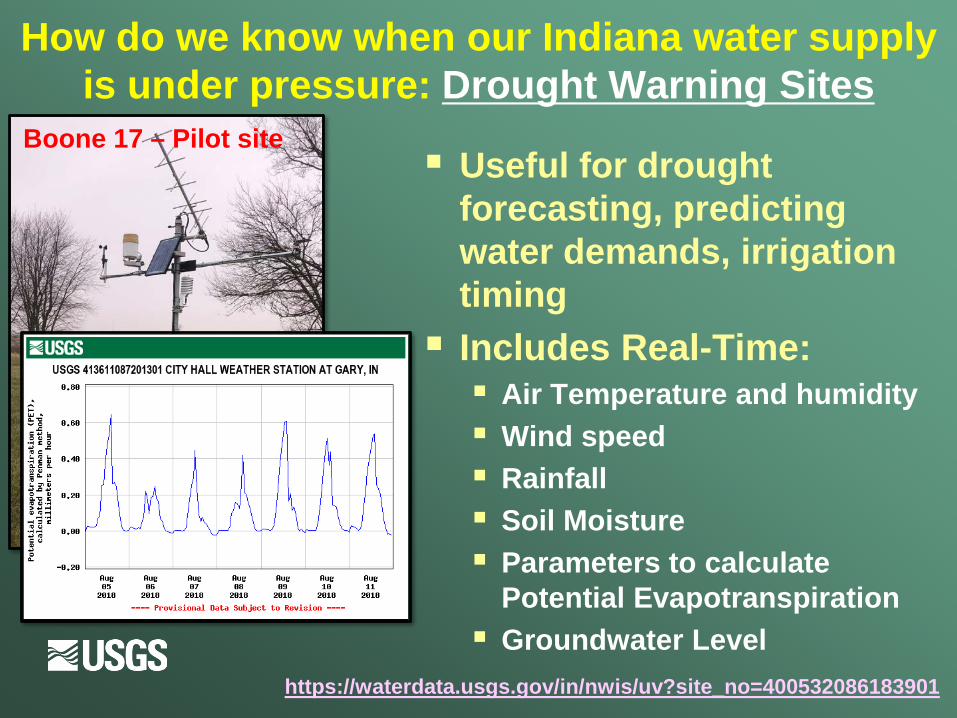
How do we know when our Indiana water supply is under pressure: Drought Warning Sites
Useful for drought forecasting, predicting water demands, irrigation timing Includes Real-Time: Air Temperature and humidity Wind speed Rainfall Soil Moisture Parameters to calculate
Potential Evapotranspiration Groundwater Level
https://waterdata.usgs.gov/in/nwis/uv?site_no=400532086183901
Boone 17 – Pilot site

Bringing together groundwater and surface water: GW/SW Interaction Sites
Useful for understanding recharge/discharge conditions
School Branch

Bringing together groundwater and surface water: GW/SW Interaction Sites
USGS data Sept. 2015 thru Nov. 2016(some data are provisional)
School Branch
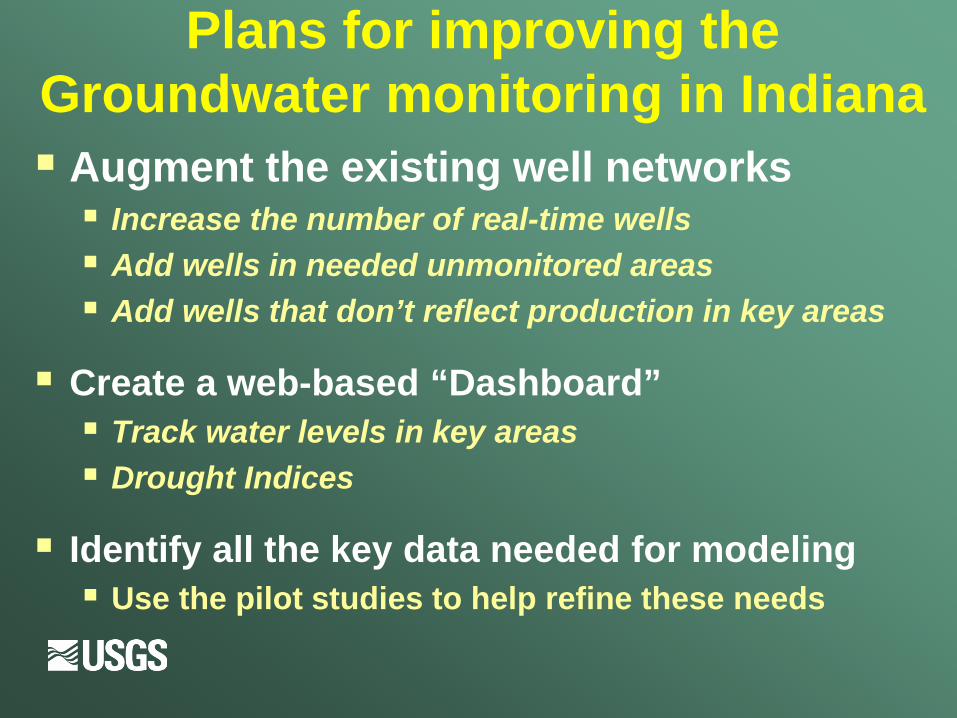
Plans for improving the Groundwater monitoring in Indiana Augment the existing well networks Increase the number of real-time wells Add wells in needed unmonitored areas Add wells that don’t reflect production in key areas
Create a web-based “Dashboard” Track water levels in key areas Drought Indices
Identify all the key data needed for modeling Use the pilot studies to help refine these needs

Recommendations for Increased Monitoring of Indiana’s Water Resource
“Evaluate the adequacy of existing monitoring” – Water Utility Resource Report; Indiana Utility Regulatory Commission (2013)
“Create a robust system for monitoring water resources”
– Modernizing the State’s Approach to a Critical Resource; Indiana Chamber (2014)
“Utilities believe that the state should invest in water resource data collection and analysis”
– Evaluation of Water Utility Planning in Indiana; Indiana Finance Authority (2015)
Central Indiana Water StudyIndiana Finance Authority (IFA)
April 29, 2019

• Which part of the state?
• Existing group of engaged utilities considering supply & demand issues
• What study area boundaries to use?
• Central Indiana Drinking Water Collaborative
• What to study?
• Central Indiana Drinking Water Collaborative
• IDNR
• IDEM
• USGS
Regional Water Studies: where and how to continue?
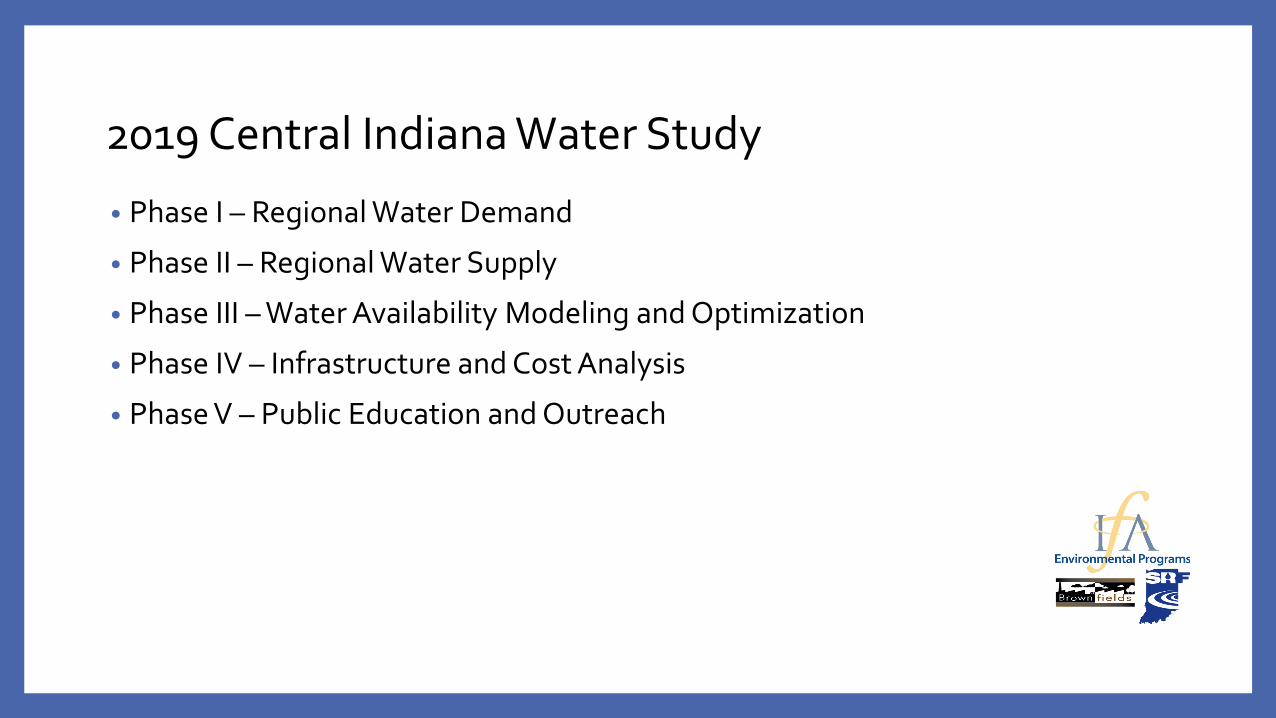
• Phase I – Regional Water Demand
• Phase II – Regional Water Supply
• Phase III – Water Availability Modeling and Optimization
• Phase IV – Infrastructure and Cost Analysis
• Phase V – Public Education and Outreach
2019 Central Indiana Water Study

• Tasks:• Determine baseline use• Consider all sectors: residential, commercial, industrial, and agricultural• Forecast water demand in the study area out to the year 2070• Evaluate multiple overlapping growth and drought scenarios
• Standard summer• Drought of Record• Future climate change scenarios• Water conservation• Lawn irrigation
• RFP on hold
Phase I – Regional Water Demand

• USGS
• Tasks:• Identify and collect data necessary to have a better understanding of
groundwater and surface water supplies in central Indiana, including aquifer levels and stream flows
• Install/update monitoring wells• Install stream gauges• Upgrade weather stations• Other analyzes
Phase II – Regional Water Supply

• Responses to RFP under review by IFA
• Tasks:• Construct a regional water model• Determine total water availability in the study area• Define areas of aquifer stress and potential limitations and/or surpluses under
various operational and climate scenarios • Collect localized data needed to understand the effects of utility water
withdrawal operations on groundwater and surface water systems• Tool that will allow utilities to add wells and change pumping rates for predictive
purposes
Phase III – Water Availability Modeling and Optimization

• RFP on IFA website (https://www.in.gov/ifa/3006.htm) due today!
• Tasks:• Evaluate potential infrastructure needed to address deficits forecasted in Phase
III, including a cost benefit analysis, environmental siting, regulatory, and permitting conditions
• Evaluate potential interconnections, and the technical, regulatory and operational issues that would need to be addressed
Phase IV – Infrastructure and Cost Analysis

• RFP on IFA website (https://www.in.gov/ifa/3006.htm)
• Tasks:• Identity topics that would aid the utilities in the study area to better
communicate water supply and demand issues with the residents of Central Indiana
• Work with utilities in the study area to develop a regional public education message regarding the water supply and demand issues
• Develop needed public education materials• Develop outreach implementation plans that include timelines and estimated
costs
Phase V – Public Education and Outreach

CY 2019 CY 2020
Phase Topic Q1 Q2 Q3 Q4 Q1 Q2 Q3 Q4
Phase I Regional Demand
Phase II Regional Supply
Phase III Water Availability Modeling and Optimization
Phase IV Infrastructure and Cost Analysis
Phase V Public Education and Outreach
Central Indiana Water Study Timeline

• IDNR
• IDEM
• Central Indiana Drinking Water Collaborative
• Indiana ACEC (American Council of Engineering Companies)
• Indiana University
Central Indiana Water Study Advisory Committee

• Engage USGS/consultants and begin work – starting in May/June/July
• Post updates on website
• Today’s agenda and presentations
• Give updates at the Central Indiana Drinking Water Collaborative’s meetings
• Conduct additional public meetings – starting this fall/winter
Central Indiana Water Study: next steps
Sarah Hudson, IFA Water Resources and Infrastructure Planning Program
Daniel Lundberg, IFA Water Resources and Infrastructure Planning Program (RFP responses)
Joanie Jones, IFA Environmental Programs
(Central Indiana Water Study email list for updates)
Questions? IFA website (https://www.in.gov/ifa/3006.htm)