Embed Size (px)
Citation preview

CENTRAL ILLINOIS(U) ILLINOIS STATE WATER SURVEY DIVURBANA J L VOGEL JUN 83 SWS-CR-328 ARO-15529.i4-65
UNLSIID NSF-ATM78 08865' F/G 4/2 N
EhEEE E0h
EsEEEEEEn

U., J&2
1.25 1. 1.4
MICRCOP REOION TES CH2.TMAkNi U REA OFSADAD-I 6-
E0M

.. .- . .. . . . .
-U!iclassified
SECURITY CLASSIFICATION OF THIS PAGE (IN,.. Veo. Entered)
REPORT DOCUMENTATION PAGE BSFORE COMPLETING FORM.rRapORT NUMBER 1*GOVT ACCESSION NO. 3. RECIPIENT'S CATALOG NUMBER
15529.1l4-GS I_____________4. TITLE (und Subtitle) S. TYPE OF REPORT & PERIOD COVERED
Sub-Cloud Layer Kinematics and Convective RainfallIn Central Illinois 6. PERFORMING ORG. REPORT NUMBER
1AUTMON~e) S.CONTRACT Or RAVIT NGMSLR40)John L. Vogel
ARO 20-78
S. PERFORMING ORGANIZATION NAME AND ADDRESS 110. -PROGRAM ELEMENT. PROJECT, TASK
University of Illinois AREA & WORK UNIT NUMBERSCahmpaign, IL
11. CONTROLLING OFFICE N4AMIE AND ADDRESS 12. REPORT DATEU. S. Army Research Office Jun 83Post Office Box 12211 1i. NUMBER OF PAGESResearch Triangle Park, NC 27709 5
14. MONITORING AGENCY MNCES ADDRSS(Il diferent from, Controlling 0tlh.) 1S. SECURITY CLASS. (of this report)
16. DISTRIBUTION STATEMENT (of this Report)
Approved for public -release; distribution unlimited.
FcE C V (L_
17. DISTRIBUTION STATEMENT (of the oetroot entered In Block20 It different htem Report)
2~.IS. SUPPLEMENTARY NOTES.
C-7 The view, opinions, and/or findings contained in this report are those of theauthor(s) and should not be construed as an official Department of the ArmyLH position, 3olicy, or decision, unless so designated by other documentation
LLIt. K EY WORDS (Continue an reverse side It necessay and Identity by block number) r
C.2 rainfallconvection
S meteorology
20. ASrACT (C0~efa an reverse stI NI neseeiny an Ideralfy by block number)
-'The kinematic parameters of divergence and vorticity in the lowest 450 m of theatmosphere were calculated for a 750 km area in east central Illinois from windmeasurements obtained using pilot balloons. The area for which the analysis hasbeen made Is triangular, wiest of Champaign/Urbana. These and similar data for thesurface have been analyzed for nine days of the summer of 1979. Most of theobservations were made during the afternoon and early evening hours during periodswhen tropical air masses overlay the observational network. The maximum surface -
D D1 h I 10*=S 3 901IRO0OF I M@V 65IS OBSOLETE UNCLASSIFIED -83 11S07U02TY CLASIICATION OF THIS PAGE (When Doel Entered)

UNCLASSIFIEDS6CUITY CLASSIFICATION OF THIS PAGIEjWhm Date Enaeev
ABSTRACT (cont.)
S'temperatures on these days ranged from 26.5 to 35 C, and the surface dew-pointtemperatures varied from 18 to 24 C, approximately normal for temperature butmore humid then normal. (The average dew-point for central Illinois is 18 Cduring July, 17 C in August.) The precipitable water content from the surface to400 mb ranged from 3.2 to 5.3 cm, higher (by as much as 77% at the extreme) thanthe normal precipitable water over central Illinois during July or August(Lott, 1976). -
Accession ForN--T-IS GRA& IDTIC TAB E1Unannounced ElJustification
By -
Distribut ion/
AvailabilityCoeAvail and/or o
Dist Special
UNCLASSIFIED
SaCUMITY CLASSIFICATION OF THIS PAOE(lImten Date Enteed)
State Water Survey DivsionMETEOROLOGY SECTION
AT THEIllincis Department of
UNIVRSIT OFILLIOISEnergy and Natural Resources
SWS Contract Report 328
SUB-CLOUD LAYER KINEMATICS
AND CONVECTIVE RAINFALL IN CENTRAL ILLINOIS
byJohn L. Vogel
Illinois State Water Survey
rI
Technical Report 8NSF Grant ATM 78-068605
Low Leve Convrgenomc and thePredaction of Convection Precipitation
Champaign, Illinois
June, 1083
r&.000/

State Voter Survey Division E 'METEOROLOGY SECTION
AT THE Illinois Department of
'1UNIVERSITY OF ILLINOIS Energy and Natural Resources
SWS Contract Report 328
SUB-CLOUD LAYER KINEMATICS
AND CONVECTIVE RAINFALL IN CENTRAL ILLINOIS
byJohn L. Vogel
Illinois State Water Survey
Technical Report 8NSF Grant ATM 78-08865
Low Level Convergence and thePrediction of Convection Precipitation
Champaign, Illinois*
June, 1983 ....
DISTRIBUTION Ui 'f IT.
*Approved fox Unlimi-'dDisribtin p lmit E;VCO

The project "Low-level Convergence and the Prediction of ConvectivePrecipitation" is a coordinated research effort by the State Water SurveyDivision of the Department of Energy and Natural Resources, the Officeof Weather Research and Modification in the National Oceanic and Atmo-spheric Administration, and the Department of Environmental Sciences ofthe University of Virginia. Support of this research has been provided tothe State Water Survey by the Division of Atmospheric Sciences, NationalScience Foundation, through grant ATM-78-08865. This award includesfunds from the Army Research Office and the Air Force Office of ScientificResearch of the Department of Defense.
TABLE OF CONTENTS
PAGE
SECTION
I INTRODUCTION---------------------------------- 1
II DAILY ANALYSES-------------------------------- 6
13 July 1979-------------------------------- 7
14 July 1979------------------------------- 11
24 July 1979------------------------------- 14
30 Julyl979------------------------------- 18
10 August 1979----------------------------- 24
18 August 1979-----------------28
19 August 1979----------------------------- 32
22 August 1979-----------------35
23 August 1979----------------------------- 37
III SYNTHESIS AND DISCUSSION-------------------- 43
REFERENCES---------------------49
ACKNOWLEDGMENTS------------------------------ 51

SECTION I
INTRODUCTION
Byers and Braham (1949), reported on observations showingthe relationship between surface and mid-level convergence andconvective activity. Their measurements indicated that conver-gence occurred in the surface mesoscale wind fields for 20 to 30minutes prior to the first appearance of a radar echo associatedwith thunderstorm formation. Likewise, convergence was found inthe mid-level winds around forming cumuli. Using Florida datawith similar resolution, Ulanski and Garstang (1978) found a typ-ical "signature" in the temporal evolution of surface divergencewhich could be related to the rainfall volume and maximum rain-fall rate of individual convective elements. This signature wasassociated with the thunderstorm gust front and they hypothesizedthat such a signature could be used to predict the onset and in-tensity of convective precipitation.
One of the objectives of the VIN project was to furthertest the Ulanski-Garstang hypothesis for Florida and to examine
* its applicability to the Midwest. In addition, the relationshipbetween the surface and sub-cloud layer wind parameters was to be
* examined to deermine the depth through which the surfacekinematic fields might be representative. It was perceived thatthe link between the surface and the cloud layer might be strong-est in the sub-cloud region, and that the mesoscale process mightbe reflected in the sub-cloud region even more strongly than atthe surface. To explore this possibility, a small pilot balloonnetwork was implemented as part of the observational program car-ried out in Illinois in 1979 (Ackerman et al., 1983).
This report focuses on the sub-cloud layer (200 to 700 mMSL) wind field and its relationship to surface convergence andrainfall within a dense mesoscale network on nine days during thefield program. In Section II, the sub-cloud layer kinematics arepresented for each day and the synoptic and mesoscale weather isbriefly described, to provide background for the discussion. Thefinal section provides a summary, synthesization and discussion
. of the study results.
*VIN is formed from the names of the cooperating organizations:University of Yirginia, Illinois State Water Survey, and .OAA.

-2-
flaQkggound
Using surface wind data from the NOAA/FACE, Watson et al.(1981) concluded that areal divergence (inflow) held promise forpredicting the initiation, amount, and maximum intensity of rainwithin an area on the Florida peninsula. In addition, the"weighted" convergence, (the average convergence over the regionof converging flow only), was found to be a better predictor ofrain than the total areal divergence. Watson and Holle (1982)
*' conducted a similar analysis using surface data collected in cen-tral Illinois during the VIN field experiment. They found acorrelation between the surface inflow and rainfall in Illinoisof 0.5, compared to 0.6 in Florida. Similar to the Floridaresults, the correlation between mass inflow and rainfall was im-proved when synoptic parameters, such as relative humidity, sta-bility indices, and wind speed between 300 and 3,000 m were usedto stratify the data.
Achtemeier (1980), using rainfall and wind data collected inMETROMEX in 1975, examined the divergence patterns within a smallnetwork similar to that of Ulanski and Garstang (1978). Based on19 "raincells" from a 7-day sample, he found that the agreement
*between rainfall and the spatial distribution of divergenceremained small until approximately 15 minutes prior to the startof rain within the network. He also concluded from case studiesthat there was a physical relation between rainfall and surfaceconvergence at both the raincell- and network-scales.
Data Ba and Anlyis Tnie
The special mesoscale networks in VIN consisted of a denseraingage network (station spacing about 4.8 km) and a slightlysmaller and less dense network (station spacing about 6.5 to 10km) of instruments to measure temperature, humidity, pressure,and wind (Figs. 1 and 2). The networks were located in east cen-tral Illinois (see state map lower right, Fig. 1). A radiosondesite at which releases were made at 1300 and 1800 CDT on opera-tional days was co-located with the CHILL radar near the easternboundary of the raingage network. In addition, special ra-diosonde observations were made at 1300 CDT by the NationalWeather Service (NWS) stations at Peoria, IL and Salem, IL, onrequest.
The winds in the lower troposphere were measured at threesingle-theodolite observational sites. These 3 stations formed atriangle with area of 750 km in the center of the VIN network(Fig. 2). Pibal (pilot balloon) releases were made every 30minutes, usually from early afternoon to dusk, using 30-g bal-loons. The azimuth and elevation angles were measured every 30seconds. Winds were calculated for 30-second layers (approxi-mately 100 m) using standard techniques. The balloon height atthe end of every 30-second interval was calculated using the
'd .

-3-4
a A.. .(~4~* 9 0
a -- a 2 E ~-4*a 9- . 9 - 9 9 S 9
£ - a 3~ - - 2-I
9 9 9 - * 2 C',
a SQ
I,- - a *. I.1* 9 9 * ; 2
'4
UI e C. I 2
*4! .'- N - ________________ *'C 9 'I
2 C.9 2 . 9 . a *- - 1 2 9
9 - 9 9 9
~ 9 9
3 82* - ':7 - I -* 2 - C. ., * 2
'C-
* 2 9 a 2* (~j 9 94, -'C..-.- 9
- ~~1& 9 4-
a S 4.-- ..- - I9 9 'N !-~~4 ~ 9 *
'S ~ ** S
S 3 - '.c3 *9 * 9% 9 C.-z * *- 2 9
f * 9 9 3
* - a -~ I -~ '~ ~~* 1 * N 4.C.. ~ .'~'4. '4 5"
Li 2:*~; ~ S - U - I 2
* 9 '*3
9 2 * 3 2 ~ *~ a I *' I9 I 9 9 ,9 ~ *
2 ~ .~E* 2 - '~,--\' -
-I'- * '4 -~ **~zsa 2 *~
* 3 E j* 2 2 * ~ aL~
9 5 2 a .1 -. * -. *
* K . 2 -. a ..
2 9 1 --~
-~ * * * . *~~*1-...
2 -C. 9 5 -,2-..9 9 -C.-.-- 9 - C. I
.4 C. -C.---- . * . 9-.------'~ ~ 9 9* 9 9 2 ~ - -r -
2 9 9 9 S _________ 9.* 9 9A -
9 39*, - .1
5 2 1 o *
-'
5*
~*q4 *S*~. *~*~ . . . - - - . . . *- * . . >. .. - -, -

-4--
00
CC'.
-C 94%J
r~o. g~~0 > C'.
C---2A . C14
C0. .- u r-)r
C, . ~ O fJ - cUo . 40 c Nle
0 C') ~ U)
(I kC :, 0.4
coo' 4 o . N . o
* 4 ocm 4 W. 0a-
0 C.) 0)C~
to o
*OEOC4. 4 z

-5-
standard rise rates for 30-g balloons. Divergence and vorticitywere calculated at intervals of 50 m MSL for the triangle by theareal "expansion" method (Bellamy, 1949), using winds interpo-lated from the calculated winds at each station. The verticalvelocity was then calculated from the continuity equation. Thesecalculations were averaged over 100-m MSL overlapping layers todetermine the smoothed values of divergence, vorticity, and vert-ical velocity at 50-m MSL intervals.
The study reported on herein was limited to the layer thatextended from the surface (about 275 m MSL) to 700 m MSL. Thisprovided the most complete data base for the nine days and a con-sistent means of comparison. Surface divergence, calculated fromthe measurements at three surface stations which closely approxi-mated the upper-air triangle, were supplied by Watson, one of thNOAA participants in VIN (1981, private communication). Totarainfall amounts and percent of area covered by rain during 30minute periods were obtained from recording raingages in the tri.angle formed by the pibal stations and in "downstorm" areas whicwere delineated by displacement of triangle limits by distancequal to 1-hour storm movement. There were 29 raingage stationLin the pibal triangle; the number of stations in downstorm areasvaried.
.1
"4
-* '40. . . . . . . . . . * '. .

-6-
SECTION II
DAILY ANALYSES
Day-to-day descriptions of the sub-cloud layer winds andderived kinematic parameters, surface divergence, and rainfallfor the pibal triangle are given below for each of the nine daysexamined in this study. In addition brief background informationabout the synoptic and mesoscale weather is provided.
A uniform approach was used in the analysis and in the re-porting of the results. The routine NWS surface and upper airanalysis were closely examined for dynamic factors which couldtrigger convection, but no special computations were made. Ther-modynamic indices were calculated for the State of Illinois fromboth routine and special radiosondes. The indices computed wereShowalter Index, Lifted Index and the precipitable water for thelayer from the surface to 400 mb.
The surface wind and raingage data were continuously avail-able at 5-min intervals throughout the 24 hours. As mentioned inSection I, the boundary layer measurements were available only at30-min intervals and for several hours during the afternoon andearly evening, with a 30-min break midway through the observa-tional period set aside for a rest period for the single observerat the site.
The discussion for each day centers around three diagrams.One is a single panel, height-time section of wind direction andspeed, from one of the three stations having the most completedata set for the day. The second figure has three panels, givingheight-time cross-sections for the pibal triangle of (a) diver-gence, surface to 700 m MSL, (b) vertical velocity obtained byintegrating the continuity equation from the surface upward, and(c) vorticity from 300 to 700 m MSL. Since the computations ofthe kinematic parameters require measurements from all threesites, none of the three parameters could be determined when ob-servations were missed because of rain or because the balloon wasobscured at one or more stations. When the analysis was based oninterpolated information through these periods of missed data theisolines are shown by dashes.
The third figure used in the discussion is also 3-panel and* is usually presented first because reference is made to it
throughout. In the top panel (a) are given a time series of thecolumn-average values of divergence for the layer surface to 700m MSL, column average vorticity for the layer, 300 to 700 m MSL,and the vertical motion calculated at 700 m MSL. In the middlepanel, (b), is plotted the time series of the average surfacedivergence in the triangle for each 5 minutes. In the bottompanel, (c), are shown the time series of the total 30-min rain-fall in the triangle and of the fraction of raingages in the tri-angle in which rain was recorded during the 30-min period.

-7-
.. Z I.y 1
Central Illinois was embedded in a warm, tropical air massthroughout 13 July. The remnants of Hurricane Bob which hadmoved up the Mississippi Valley from the Gulf in the previous 48hours had reached southern Ohio by 1300 CDT. A slow-moving coldfront stretched from northern Wisconsin to northwest Kansas dur-ing the afternoon and evening. The upper-tropospheric trough as-sociated with Hurricane Bob filled during the day, and theupper-air flow became zonal by evening with a shallow short wavemoving across the northern part of the United States.
The afternoon maximum temperatures ranged from 31 to 34 C,and the surface dew-point temperatures were 18 to 23 C. The pre-cipitable water, surface to 400 mb, at 1300 CDT varied from 3.4cm at Salem to 4.1 cm at Peoria, and the Lifted and Showalterstability indices ranged from -2 at Peoria to -3 at Salem. Thus,the atmosphere was conditionally unstable over Illinois.
Showers and thunderstorms formed over northwestern Illinoisin advance of the cold front and spread southeast into centralIllinois. Additional convective activity was initiated in ad-vance of this area of showers and thunderstorms. Convectiveechoes formed within the VIN network at 1435 CDT and continueduntil 1935 CDT. The more intense convective activity on this daywas south of the network. The heaviest rains within the networkfell between 1500 and 1700 CDT, as individual convective elements
- moved from the west-northwest at 40 to 55 km/hr.
Within the pibal triangle rains fell from 1505 to 1725 CDTand again from 1855 to 1905 CDT (Fig. 3c). The first rains inthe triangle were light scattered showers in advance of the mainline of showers and thunderstorms which advected into the trian-gle at 1540 CDT. The most intense rains during the first rainperiod fell southwest and south of the triangle. The secondperiod of rain in the triangle was very short and light (lessthan 1 mm accumulation), and consisted of a rainshower on thenorthern edge of the general storm area.
The winds in the low levels shifted from the south-southeastthrough west to north between 1430 and 1530 CDT (Fig. 4). Thewind speeds during this period were light, generally less than
* 2.5 m/sec. The wind continued to change direction over the nexttwo hours, in response to the rainshowers which formed in thetriangle, and/or to the more intense convective activity whichmoved onto the northern portion of the dense raingage network at1505 CDT. It shifted back to south and southwest when the firstrain period in the 1 triangle ended. The wind speed was generally
- less than 2 m s before the rain, increased slightly after thefirst rain period, with larger increase after the main cloud linemoved through the area. Whereas the wind direction was uniformthrough the lower 500 m early on, it veered with height after1830 CDT.

-8-
2 1 1 - 10
I a Vertical velocity N- V rti1t1 f N .,<:-Vertical velocity
' 0 0
1- Divergence _
-2 ~'~Divergence otcy -1
-2
Surface divergence
0
0
.~-2
80 -C Total rainfall. mm 1 40
60 -I3CE
S 40 / Percent of areal coverage -20 E
20 Julyl13,1979 10~- I
1400 1500 1600 1700 1800 1900 2000 2100TIME (CDT)
Figure 3. Time series of (a) colwnnm-average (300-700 m MS'L) divergence and vorticity(10-4 s ) and vertical motion at 700 m MSL (cm s- 1 ), Wb surfacedivergence and (c) total 30-min rainfall and percent of area covered,all for pibal triangle, on 13 July 1979.
1 2412 1 301 1 27 70
700- 12.5 21 24 7.5
600 21I
x 500-2 1 lsogons (10deg)
400-
36 i
300 July 13. 1979 /I I ' 5 j '5
1400 1500 1600 1700 1800 1900 2000TIME (CDT)
Figure 4. Time-height analyses of wind di'-ection (isogons) and wind speed (isotachs)in sub-cloud layer on 13 July 1919.
-9-
Winds were available at all three sites at 1430 and 1500 CDTand again from 1830 to 2000 CDT. Rain occurred at one or moresites at observation times between 1500 and 1730 CDT. In thehalf-hour prior to the start of rain (1430-1500) the layer fromthe surface to 700 m MSL was convergent (Fig. 5a). The average
- convergence for the _4ayer 1decreased between 1430 and 1500 CDT* from -0.9 to -0.7 x 10 sec (Fig. 3a); however, the average
convergence for the lowest 200 m4 fromlthe surface to 450 m MSL,increased from -0.6 to -1.4 x 10 sec . After the first rainsystem moved out of the triangle, the wind field was divergentwith a mid-level maximum (1830 CDT). Subsequently, the diver-
i' gence decreased and the wind field became increasingly convergentand convergence characterized the wind field above the surfaceafter 1930 CDT, increasing in magnitude with height. The effectis especially evident in the vertical velocity (Fig. 3a), as itchanged from subsiding motion of 4.2 cm/sec at 700 m MSL at 1830CDT to an upward motion of 6.7 cm/sec by 2000 CDT.
The relative vorticity was mostly cyclonic prior to thestart of rain at 1505 CDT (Fig. 5ac, 3a). After the first rainit was weakly anticyclonic but increased rapidly after the mainshower line had passed through (1930 to 2000 CDT).
* The surface flow in the triangle was convergent prior to thestart of the rain (Fig. 3b), as it had been from about 0700 CDT.There was a gradual increase in surface convergence from approxi-mately 1400 to 1445 CDT, followed by a decrease, and then a rapidincrease in convergence from 1505 CDT to 1530 CDT, signaling the
i. beginning of the shower outflow with its typical "S-shaped" sig-nature. This "signature" began at the same time that the rain
- started in the triangle (1505 CDT). Concurrently there was aline of showers and thunderstorms NW of the triangle. The largechanges in surface divergence after 1505 CDT were in response tothe outflow asociated with the convection within and/or outsideof the triangle. The increase in convergence from 1400 to 1445
• CDT was the fore-runner of the subsequent rain storm.
The surface flow changed from divergent to convergent andthen back to divergent between 1820 and 1940 CDT. These changesin the surface field appears to have been related to the widelyscattered light showers which fell in the raingage network
*.' between 1855 and 1935 CDT, one of which skirted the pibal trian-gle.
The average boundary layer measurements showed both conver-gence and cyclonic vorticity in the triangle from 1430 to 1500CDT, prior to the start of rain in the triangle (Fig. 3a). At
* . 1830 CDT, after the main rains in the triangle, the flow was an-ticyclonic and divergent. Although the sub-cloud layer wind
* field was convergent by 1900 CDT, with convergence increasing inmagnitude over the next hour, as the flow in the triangle becameincreasingly more anticyclonic. The surface divergence valuesalso began to decrease and become convergent, but only after 2010CDT, lagging the boundary layer convergence by about 1 hour.

-. T
-10-
-0.5 0.5700-
-1.0 Divergence (10-4 S-1)1.0
600-
-2.5- 2
500--1.0 - a-.
400 -0.5
_-0.5 c D 0 Dtlf 0 -SFC7t1I!,
43 1 1 0 1700 Vertical velocity (cm s- 1)
in, 600-
1--1
0.5 -2-2
700-
600-
500-1.0 C
400 -
-July 13, 1979SFC I I I I I I
1400 1500 1600 1700 1800 1900 2000
RAIN PERIOD TM CT
Figure 5. Time-height analyses of (a) divergence, (b) vertical motion,and (c) vorticity, in the sub-cloud layer on 13 July 1979.Times of surface convergence/divergence when pibal data ar'emissing i3 indicated by C/D, resp. in (a).

]A ZU4 1979
A cold front extended southwestward from the northeastcorner of Illinois to the northeast corner of Missouri at 1300CDT on 14 July. A short wave, which was well defined at 850 and700 mb, was situated over Iowa and Kansas at 0700 CDT. Boththese features moved rapidly across Illinois during the afternoonand evening, with the front passing through the VIN network incentral Illinois between 1830 and 1900 CDT. By 2200 CDT thefront had traversed all but the southern tip of Illinois. Satel-lite photo's showed the southern half of Illinois mostly cloudfree during the morning and early afternoon.
Showers and thunderstorms formed over most of the southerntwo-thirds of Illinois by 1500 CDT. These scattered showers andthunderstorms continued to 1700 CDT, when the convective activitybecame organized into N-S lines. Two lines, one lying to thesouth and the other to the north of the VIN area, skirted theraingage network. Light rain occurred at one station in the pibaltriangle (Fig. 6c). The strongest convection (according to NWSWSR-57 radar network) in Illinois in the late afternoon and even-
* ing occurred in the south, over 130 km south of the VIN network.
The surface dew-point temperatures in the tropical air mass*i ahead of the cold front ranged from 21 to 24 C. The 1300 CDT* Champaign sounding indicated 5.3 cm of precipitable water in the
column from the surface to 400 mb, and the Lifted Index was -2.Thus, the atmosphere was moist and conditionally unstable, andable to support organized convective activity providing suitable
*. dynamics existed.
The winds in the lay8 r between 300 and 700 m MSL graduallyshifted from 210 to 250 between 1400 and 1830 CDT, as the coldfront approached (Fig. 7). The winds veered more rapidly with thefrontal passage between 1830 and 1900 CDT, coming around tonorthwest by 2000 CDT. The wind speeds above 500 m MSL variedfrom 7.5 to 13 m/sec, whereas the speeds below 500 m MSL were
*between 5 and 7.5 m/sec.
The wind field prior to the cold frontal passage was conver-gent near the surface except for the period from 1630 to 1730 CDT(Fig. 6b), but divergence dominated the upper portions of thesub-cloud layer from 1500 to 1800 CDT (Fig. 8a). Just prior tothe cold frontal passage (1830 to 1900 CDT) the flow became con-vergent throughout the sub-cloud layer, resulting in upward mo-tion of over 6 cm/sec at 700 m MSL (Fig. 8b). Immediately afterthe cold frontal passage the wind field became divergent and the
* vertical motion quickly reversed. From 1500 on, the sign of thedivergence at the surface was the same as in the layers above,but maxima tended to occur aloft.
The vorticity was anticyclonic until 1530 CDT throughout thesub-cloud layer, then it became cyclonic in the upper levels
* (>500 m MSL) and remained so until 1930 CDT (Fig. 8c). Below 500* m MSL the relative vorticity alternated between cyclonic and
* * 9

0 0 E
-e Surface divergence0
40 20I
820-Jl141979 Total rainfall,mm Percent of areal coverage
1400 1500 1600 1700 1800 1900 2000 2100TIME (CDT)
Figure 6. Scme as Figure 3, for 14 July 1979.
2210 124 281 30
700 X' I
12.5
I ~t 'I 32600 -Isogons (10 deg)11
2 10
E~ i Isotachs (mns-1) I' 10
400
300 g July 14, 1979 I
7.5I i I1400 1500 1600 1700 1800 1900 2000
TIME (CDT)
Figure 7. Sam as Figure 4, for 14 July 1979.

-13-
0 -1 0.5 Divergence (10 4 s 1 -0.5
600 -0.50.5 -1
500 -2a-1 -0.5 + '* I
500 -2 0.
0*_-2.5
.. SFC 0 0
'" 70 - -1 Vertical velocity (cm s- 1) 6 0 -4
600 -1
- . + 11 '.
5 -2 -1 ~ Vetclvlctbc -)6 0 -7400 112[
n 0 0 -1
3-
21 1
.- SFC '0
-d.s-I 6 - --
700 -4 2{f\ .
0 0 '. Vorticity (10-4 s - 1) 0.5 6-i
600 0 1 ' 1i-1-1.0
, I 1..'I
400 Il40 '% I I / 2"
July 14, 1979 0.5 0SFC
1400 1500 1600 1700 1800 1900 2000TIME (CDT)
Figure 8. Time-height analyses of (a) divergence, (b) verticalmotion, and (c) vorticity in the sub-cloud layeron 14 July 1979.
o'.4 • o . . . - . ,• _ , • . . . • • . .

-14-
anticyclonic until 1730 CDT, about an hour prior to the frontalpassage, when it became cyclonic and remained so until 1930 CDT.After the frontal passage, the vorticity shifted to anticyclonicagain throughout the layer.
Only one short shower of 0.6 mm fell within the triangle(one station) during the afternoon and evening of 14 July. Therewas strong surge in surface convergence from 1730 to 1755 CDT,just prior to the rain within the triangle when it increased fromnear zero at 1730 CDT to 1.1 x 10 sec at 1755 CDT (Fig. 6b).
Other rain showers occurred along the southern and northernedges of the VIN raingage network, but no others in the triangle.
The rains along the southern edge began at 1615 CDT and lasteduntil 1735 CDT. These rains, generaI-y light with a maximum gagerainfall of 5.5 mm, moved east. Rains advected east along thenorthern edge of the trianglebeginnina at 1720 CDT and lastinguntil 1900 CDT. These showers built on the southwest flank of thelarger area of convection, and it was the southern edge of one ofthese storms that grazed the triangle. The heaviest gage rain-fall observed along the northern border of the VIN network was5.5 mm.
It is possible that the surge of convergence at the surfacebetween 1730 and 1755 was due to outflow from one of these con-vective systems or it could have been associated with the frontalpassage. The second surge of convergence, between 1820 and 1840CDT, however appears to be associated with the frontal passage.The peak in divergence at 1945 CDT does not appear to have beencaused by rain on the network, but could have been associatedwith the dynamics of the frontal passage or with outflow from adistant convective system.
The average flow for the column from 350 to 700 m MSL after1500 CDT was characterized by cyclonic vorticity, with maximumjust prior to and during frontal passage. The strong divergencenoted over the triangle at 1400 CDT was associated with anticy-clonic flow, whereas the convergent wind field at 1830 CDT wasassociated with cyclonic flow in the sub-cloud layer.
2A IL i2M7
Central Illinois was embedded in a broad area of southerlyflow from the Gulf of Mexico throughout the afternoon and eveninghours of 24 July. Showers and thunderstorms formed in the moist,tropical air mass in the area most of the day. A dynamic"trigger" was provided for the storms by a nearly stationaryupper-air trough situated over central Missouri and Iowa. Hurri-cane Claudette moved onto the southeast Gulf Coast of Texas dur-ing the day, and a cold front which stretched from northwestWisconsin to the Panhandle of Texas moved very slowly east. Thisfront remained well west of Illinois.

-15-
The afternoon high temperatures in Illinois ranged from 27to 32 C, and the dew-point temperatures were 21 to 23 C. At 1300CDT the precipitable water from the surface to 400 mb ranged from4.5 cm at Champaign to 5.2 at Salem. All three special soundingsat 1300 CDT (Champaign, Peoria, and Salem) had Lifted Indices of
* about -2, which indicated that the atmosphere was thermodynami-cally favorable for convection.
Within the pibal triangle there were periods of rain in theafternoon and evening, a showery period from 1550 to 1625 CDT andcontinuously from 1715 to beyond 2000 CDT (Fig. 9c). Rains were
*- observed over some part of the VIN raingage network throughoutthe day on 24 July and continued into the morning of the 25th.The rain activity during the afternoon and evening came fromsmall radar echoes over the network and from a series of linesoriented southwest-northeast. The individual elements moved fromthe southwest and west. At least one of the thunderstorm linesdeveloped within the network.
Pibals were released every 30 minutes from all three sitesfrom 1330 to 01800 CDT except at 1530. The winds were generallyfrom 180 to 190 within the sub-cloud layer from early afternoonto 1800 CDT (Fig. 10). Wind speeds were generally less than 10m/s except for a slightly higher values in the upper part of thelayer after 1700 CDT. This wind maximum occurred approximately30 minutes after the onset of the second period of rain withinthe triangle.
The time-height section of the sub-cloud layer divergence(Fig. lla) indicates a rapid change from convergence to diver-
"" gence and then back to convergence between 1330 and 1500 CDT.The4 divejgence values at 500 m MSL changed from -0.9 to +1.3 x10 4 sec _ibetween 1330 and 1400 CDT, and then back to -0.1 x
10 sec at 1430 CDT. Throughout this change in the sub-clouddivergence, the surface flow remained weakly convergent. There
. was no tendency for the surface pattern to become divergent, infact the general tendency of the surface pattern was to become
* more convergent between 1305 and 1415 CDT (Fig. 9b). From 1500 to1700 CDT the flow in the triangle was convergent from the surfaceto 700 m MSL, with the maximum convergence in the upper levels.After 1700 CDT the flow becamegivergynt, and by 1800 CDT itreached a maximum of +2 x 10 sec at 550 m MSL. The surfaceflow was divergent for a short time between 1730 and 1800 CDT,but became convergent again by 1800. Thus, the surface diver-gence did not always mirror that in the layer immediately above,even in sign.
The vertical velocity (Fig. llb) near the surface was posi-*. tive from 1305 CDT until 1725 CDT, but aloft there was a short
period of subsidence at 1400. The upward motion in the sub-cloudlayer maximized at 1600 CDT with a value of 7.4 cm/sec at 700 mMSL. Between 1630 and 1730 CDT the vertical motion reversedreaching an area-average downward value of -4.6 cm/sec at the topof the layer.

-16-
2 I I I I I I I 10S
i..- -. Vertical Velocity i
1 Divergence 5..- - "
0~ 0E
1 b_ i 2I II I I I I i i
0 Surface Divergence
i:- - / i I I I I I i I ii I / ]
so-140i 1 0° 0 i I i I I I I I I I I I 5 0i s
!80 -- I40
.60 /Total rainfall, mm60-1 / 30 E
E40 /202 - _ Percent of areal coverage
July 24, 1979 - 10Sl- I i i i , -- .- .. - . .' ' i I i i I I i I 0
1300 1400 1500 1600 1700 1800 1900 2000 2100TIME (CDT)
Figure 9. Same as Figure 3, but for 24 July 1979.
7 0 0 - J u ly 2 4 , 1 9 7 9 7 5 1 1 9 1 /700 /I i lsogons(lOdegI 10
I I
%%-/ ,-' . i -t
600 7.5 , Jsotachs (m s-1)I
-J 5I191 7
, 500 I "-1
19 1400-
3 18 I '+1400 1500 1600 1700 1800
TIME (CDT)
Figure 10. Same as Figure 4, but for 24 JuZy 1979.

-17-
-0.5-1 Divergence (10'- 4 s 1 )700 / - /
0- /0]i. ./ -1.5I
600 (0 i / 0.5 1.5;' I00 600 -
500 - 2.0a- '\
400 )La
-0.5 0I ~I-OC ' - I -- -L
1 3 5 76 4 2 0700\ ~y U6 4-4
l
600 %
-o. - 3 i
E 1 \\ \"j liltE 0b2
3 500 "
I
400
Vertical velocity (cm s10 - s -SFC Ver I __ 10
700 -1.0 -05 1.0 0.5
600 0
-0.0
-0.55500 5)
I
400 - ~/ +
July 24, 1979 Vrity(10-4s1SFC
1300 1400 1500 10 70 10TIME (CDT)
RAIN PERIOD
,," Figure 11. Same as Figure 8, but for 24 Juiy 1979.
-
- --

-18-
The sub-cloud layer vorticity was weakly anti-cyclonic dur-ing the afternoon, except for levels above 500 m MSL (Fig. llc).From 1530 to 1800 CDT, the flow in the upper part of the layerhad cyclonic vorticity, coincident with the strongest convergenceand upward motion. The flow was cyclonic throughout the layer fora short period around 1700, just as the second rain periodstarted.
The summary diagram of the surface and upper-air measure-ments (Fig. 9) shows that a long period of convergence precededthe main rains and that the greatest values of surface divergenceand convergence occurred after 1700 CDT when it was raining inthe triangle. These surface changes in divergence were probablyin response to convection both within and outside the triangle,and it is difficult to relate the "signature" to any single con-vective complex. Prior to the onset of raij in t~e triangle thestrongest surface convergence was -0.6 x 10 sec at 1415 CDT.For 4the nixt two hours, it meandered between near zero and -0.4 x1 0-1 sec- At 1620 CDT, about the time that the first rainperiod within the triangle ended, the cinvergece at the surfaceincreased from -0.3 to nearly -0.6 x 10 sec , and then de-creased relatively steady until 1720 CDT when the flow at thesurface became divergent. The second period of rain in the tri-angle began at 1700 CDT, approximately 30 minutes after the dou-bling in surface convergence. The layer-average convergence and
*[ upward motion in the sub-cloud layer maximized at 1600 CDT, about1 hour prior to the onset of the second rain period, and near the
* end of the early rains in the triangle.
The average sub-cloud flow was divergent at 1400 CDT while. the surface field was convergent. After 1430 CDT the sub-cloud
flow became convergent, increasingly so for 90 minutes* thereafter. However, at the surface there was little or no*change until 1620 CDT. The decrease in the layer-mean conver-
gence from 1600 to 1800 CDT preceded that at the surface by about30 minutes. On the other hand, there appears to have been littleor no lag at the surface in the reversal from convergence to
* divergence shortly after 1700 and, though the data aloft end at1800, there is a suggestion that the return to convergent flow atthe surface preceded that in the 400 m above.
.U 0 l 1979
Two cold fronts, one extending from Minnesota to Coloradoand the other from northern Minnesota to North Dakota, moved
*[ slowly southeast during the day and evening of 30 July. However,this dual cold front system did not reach northern Illinois untilthe morning of 31 July. Short-wave troughs aloft and a strong
" jet at 200 mb accompanied the fronts providing favorable dynamicconditions for convection along and in advance of the cold front.
During the afternoon and early evening of 30 July, east-central Illinois was embedded in a warm, tropical air mass with
% , , - , < ., .. . q '? . . ' . " . L .- -
." " . - -'- . '- "
"
-19-
afternoon temperatures ranging from 30 to 34 C. At 1300 and 1900CDT the precipitable water over southern Illinois was 4.8 and 4.7cm, respectively, and the Lifted Index was -5 and -8, respec-
" tively, while at mid-day at Champaign the precipitable water was3.9 cm. Thus, the air mass over southern and central Illinois
• was capable of supporting intense thunderstorm activity provideda dynamic mechanism was present.
There were two rain periods during che afternoon and early* .evening hours on 30 July. The first rain in the pibal triangle* began at 1525 CDT and maximized between 1545 and 1615 CDT (Fig.
12c). This rain system moved east and merged with a mesoscale* rain storm over and east of Champaign-Urbana (Changnon and Vogel,
1981). Although the system as a whole produced heavy rains tothe east, the rain was quite light in the triangle. The secondrain period was associated with a squall line which moved acrossthe network from the north, with individual precipitation enti-ties within the squall line moving from the west. This rainstormmoved onto the triangle at 1825 CDT, and passed through by 2030CDT. The heaviest rains in the triangle fell from 1845 to 1945CDT.
Pilot balloon measurements were made between 1330 CDT and1800 CDT. The winds prior to and during the first rain periodwere from the SSW at 5 m/s near the surface to greater than 10
* m/s above 400 m MSL (Fig. 13). After the first period of rainended, the winds veered and were from the southwest (220 to 230 )for a short -eriod--and then shifted dramatically, especially at
* low levels, to SE as the second storm approached and started tomove through the network. The wind speeds after 1730 CDT ini-
*tially varied between 5 and 10 m/s and then decreased after 1800.
Time sections of divergence, vertical velocity, and relativevorticity from 1330 to 1800 CDT are given in Fig. 14. (Thekinematic parameters could not be calculated at 1630 or 1700 CDTbecause of missing data). The flow from the surface to 700 m MSL
-* was convergent for virtually the whole time. The data indicate" that a minimum in convergence occurred as the early rain shower. (which was light) slackened and moved out of the triangle and
then increased again well ahead of the storm whiih movyd in fromthe north. The maximum in convergence (2.1 x 10 sec ) was ob-
*. served at 1400 CDT at 6JO m MSL, with an average value for thecolumn of -1.6 x 10 sec at that time (Fig. 12a). There is astrong suggestion that the flow was strongly convergent in the
* upper part of the sub-cloud layer well before the rain firststarted and that the height of strongest convergence decreased asthe rain approached.
The largest calculated vertical velocity was 6 cm/sec at 700m at 1400 CDT (Fig. 14b). From 1330 CDT to after 1530 CDT thevertical velocities at 700 m MSL were all in excess of 3 cm
- sec . At 1800 and 1830 the vertical motion at 700 m MSL was- greater than 3 cm/sec and increasing.
-............

-20-
a' Vo~rtical velocity 1
.~5Vot.it Vertical velocity
-1 _DnmrenceVorticity-~ 1 ivegeceDivergence E5
-2 I I I -10
Surface divergence0
100 C50
80- 40
-Percent of areal coverage 30\
S40- Total rainfall, mm -/~ 20
20 - July 30, 1979 -1
0 - -L= -_ 01400 1500 1600 1700 1800 1900 2000
TIME (CDT)
Figure 12. Same as Figure 3, but for 30 July 1979.
1 7.5 101 1 21 7.21 10 2 .700 - July 30,1979 7. 1
II 23
I~ Isogorta(10 deg)600 -f~
I II :19
1 500 - r VIsotachs (m s1) II I
g I I 17
I 115
400 - 21 )\ 13
300 - I It,~ ~ 1
130 140 10 6070 10 1 900
Figure 13. Saene as Figure 4, but for 30 July 1979.
6

700 -. -- 0.5 dta
-005.--1 Divergence (10-4 S-1)
2 -0.25
600-
500- 25-2
400 -1.25
Rain--f 0SFC 1 5 j -05 - 0. 5
615' 1 4 32 1 Vertical'700- velocity (cm s-I)
3
:: 600-
SFC
400 - -.
0 ~ I I
4 - 1 0.5- -0.5
70 Jouci y 0 , 1 979
6 00 - 050 160 100 10
0iur J4 aea iue8 ulyfo 30 1979 179

-22-
The relative vorticity from 1330 to 1430 CDT was mostly an-ticyclonic except below 400 m MSL at 1400 (Fig. 14c). Between
1430 and 1500 CDT the flow in the sub-cloud layer underwent a ra-pid transformation from anticyclonic vorticity tV cycloyic withthe column average changing from -0.3 to 0.9 x 10 sec (Fig.12a). The vorticity remained cyclonic during the first rainstorm, with maximum value above 500 m MSL, but became anticy-clonic after it ended.
The summary diagram in Fig. 12 clearly shows that the flowwas convergent throughout the (roughly) lowest 400-450 m of theatmosphere prior to the first rain shower. Inflow in the surfacelayer decreased slightly during the light rain from 1530 to 1700whereas the average for the sub-cloud layer decreased dramati-cally.
There was a slight increase in average layer convergencefrom 1730 to 1800 CDT, the last time for which divergence couldbe calculated. This was 45 minutes before the start of thesecond rain period in the triangle. The surface divergence, how-ever, shows a typical gust-front signature aster 1815 (Fig. 12b).The convergence increased by 1.3 x 10 sec in 20 minutes, fol-lowed by a rapid decrgase ayd switch to divergence for a totalchange of 3.4 x 10 sec- in 50 minutes. Divergence maximizedat 1925 CDT, about the same time that the rainfall in the trian-gle maximized.
The divergence in sub-cloud and surface layers showed simi-lar patterns until 1600 CDT, except that the upper-air conver-gence decreased about 30 minutes prior to any decrease in thesurface convergence. A slight increase in upper-air convergencepreceded the dramatic increase in surface convergence between1815 and 1835 CDT, but only two upper-air observations wereavailable after 1600.
Between 1430 to 1500 CDT there was a dramatic shift from an-ticyclonic vorticity to cyclonic vorticity in the flow in thatriaygle, as the column average changed from -0.3 to 0.9 x 10sec (Fig. 12a). The vorticity decreased somewhat but remainedcyclonic from 1500 to 1600 CDT. After the first rain period, andbefore the start of the second, the vorticity was anticyclonicwith a small decreasing trend between 1730 and 1800.
The CHILL radar, located on the east edge of the VIN net-work, detected several small echoes in the triangle beginning at1511 CDT. However, no major echoes were observed within the tri-angle prior to 1525 CDT when the first echo core formed. (Echocores are defined herein as echo clusters which maintained a de-finable reflectivity maximum for at least 15 minutes.) The numberof radar cores and the percent of area covered by radar echoesincreased from 1525 to 1611 CDT (Fig. 15c). Radar data after1611 and to 1715 is sporadic because of frequent power surges andloss of power to the radar due to lightning. Prior to that timethe percent of area covered by radar echoes and the percent ofarea covered by rainshowers, as indicated by the raingage

-23-
1312
11 Maximum radar tops
Ie 10 -
w 8
% 5II
60-
50- Maximum reflectivity
40-
30,
20 -L~u15-
M010-D LL) 5- July 30, 1979z 0,0
1500 1530 1600 1630 1700
TIME (CDT)
Figure 15. Time sequence of the characteristics of the radarechoes in the pibal triangle on 30 July: (a) topheight of tallest echo; (b) strongest echo; (c)number of reflectivity cores. (See text forexolanations).

-24-
network, were similar with slightly more radar echo coverage thansurface rainfall coverage, as would be expected.
The maximum radar-measured tops, maximum reflectivity lev-els, and number of radar cores within the triangle changed littlebetween 1525 and 1533 CDT (Fig. 15). After 1533 all three in-creased, primarily because of the advection of radar cores fromthe west into the triangle, rather than because of new echodevelopment or growth of existing echoes in the triangle. Themaximum tops and reflectivities after 1533 CDT occurred in thoseradar echoes which moved into the triangle and which continuedactively to form new cores. The maximum tops increased from 5.25
.- km at 1533 CDT to 12.25 km at 1557 CDT. The maximum reflectivity*- until 1533 CDT was 37.5 dbz but after the advection of radar
cores a maximum reflectivity of 57.5 dbz was measured severaltimes.
The second rain period within the triangle began at 1825 CDTand quickly increased from an areal coverage of 10% to 100% by1925 CDT (Fig. 12c). The average rain intensity increased froman areal average of less than 1 cm for the 30-minute period from1800 to 1830 CDT to 27.8 cm for the 30-minute period from 1915 to1945 CDT. The surface divergence field showed a typical gustfront4 signaure with an increase in convergence from -0.5 to -1.8x 10 sec 4 froT 1815 to 1825 CDT, and then divergence maximized(1.5 x 10 sec ) at 1925 CDT. The sudden increase of surfaceconvergence beginning at 1815 CDT preceded the rain within the
.* triangle by only 10 minutes.
Ast 1979
A cold front moved through the VIN network between 1300 and1600 CDT and a short wave trough over Minnesota and eastern Ne-braska at 0700 CDT moved across the network during the evening.At 1300 the cold front was to the west and extended from SouthBend, Indiana, to Peoria, Illinois, to St. Louis, Missouri. By1600 CDT the surface winds across the VIN network had shiftedfrom west-southwest to west-northwest.
The maximum temperatures over central Illinois varied from"' 27 to 29 C, and the surface dew-point temperatures prior to andup to 6 hours after the passage of the cold front were 18 to 22C. The 1300 CDT soundings at Champaign, Peoria, and Salem indi-cated that the Showalter Stability Index for the area was about-1 and the Lifted Index varied from 0 to -3. The precipitablewater at Salem was 4.2 cm, while to the north, at Peoria andChampaign, it was 4.7 and 4.8 cm, respectively. Thus, the airover central Illinois was more moist than over the southern partof the State.
Scattered showers and thunderstorms were active over centralIllinois from near noon to midnight. Individual rain cells movedfrom the west or west-northwest at 35 to 45 km/hr. Rain fell inthe pibal triangle during three periods: 1) 1245 to 1340 CDT, 2)

-25-
1535 to 1620 CDT, and 3) 1735 to 1925 CDT (Fig. 16c). The heavi-est rains over the VIN raingage network occurred in the periodfrom 1700 to 2100 CDT, when an area of showers and thunderstormstraversed the network from the northwest corner to the south-central border. The most intense rains during this period oc-curred in the south-central and western portions of the network,only grazing the western raingages in the pibal triangle.
The early rains (1245-1340 CDT) were scattered light showers(maximum point rainfall of 0.65 cm or less) in advance of thecold front. The second rain period (1535-1625 CDT) was also dueto widely scattered showers with the maximum point rainfall of0.75 cm recorded south of the triangle. The third rainfallperiod began at 1735 CDT and was associated with the over-runningcold front; the maximum point rainfall was 3.35 cm in the extremesouth-central part of the raingage network.
Pibal observations began at 1000 CDT and continued to 1700CDT, with some observations missing at 1300 and 1330 CDT. From1000 to 1300 CDT the low-level winds were mostly from the westand west-southwest with winds above 350 m MSL more west to west-northwest (Fig. 17). At about 1400 CDT the wind at 300 m MSLshifted to north of west, asociated with the passage of the coldfront through the VIN network. The winds continued veering to amore northerly component for the remainder of the observationalperiod. The wind speeds after the passage of the cold front wererelatively light, generally less than 5 m/s.
The flow was convergent from just above the surface to 700 mMSL at 1000 CDT, and continued so above 500 m until 1200 CDT(Fig. 18a), when it became divergent. During the rain periodfrom 1245 to 1340 CDT the surface wind field was slightly conver-gent, but the sub-cloud layer winds above were divergent beforeand after these first rains, and probably during them as well.Above 450 m MSL, the wind field became convergent just before1500 CDT, at least 30 minutes prior to the start of rain at thesurface and remained so through most of the second rain period.
" The surface winds on the other hand were predominantly divergent,except for a very short time. Convergence was again observedfrom the surface to 350 m MSL and above 500 m MSL at 1700 CDT, 35minutes prior to the start of heavy rains in the triangle, andabout 15 minutes before the rain entered the VIN network at thenorthwest corner.
The compensating vertical motion shows strong upward motionat 1000 CDT with a rapid reversal by 1030 CDT (Fig. 18b). Thedownward motion continued through 1230 CDT, and probablythroughout the first period of rain. Weak upward motion wasnoted from 1500 to 1600 CDT above 600 m MSL, during and justprior to the second rain period. There was upward vertical mo-tion again near the surface and above 550 m MSL at 1700 CDT, 35minutes before rain began in the triangle for the third time onthis day.

I'7.
6-.
-26-
- -1 Vorticity Vertical velocity Vetca5elct
%-2 -10III
X Surface divergence
100 T50
80- 40
S60- 30 EU E
O 40 Percent of areal coverage 2
20 - Aug'ust 10, 1979 Total rainfall, mm - 10
0- '--/S
1000 1100 1200 1300 1400 1500 1600 1700 1800
TIME (CDT)
Figure 16. Same as Figure 3, for 10 August 1979.
5 1 7 . 2 7 1 ' 2 9 1 7 . 2 72 5 1 3 1 1 .
600-~I
E 500 -I Isogons(lodeg) 31_
0 9w -*. 2.51
4, ~ 4 -lsotachs (ms-1) I400 / -
300 August 10, 1979
I II 2.5 1 291 2.511000 1100 1200 1300 1400 1500 1600 170
TIME (CDT)
Figure 17. Sam as Figure 4, for 10 August 1979.

-27-
, I ' 1 , I / I 1 0 , 1 '
700 - 0600 -0.5 I 0.5 I--2 / 0.5 1 -0.50.
600 Divergence (1 -04 s0.5
I . I-1.5
[_5 00 1
0.5 00i 0 0 0-
SFC /
700 -1 0 -1-3
:600 -2 J5002 / I6- 0
50-
0,T Vertical velocity (cm s -')
400-1
SFC 0 0
700- to / 0 kVorticity (10-4 s- 1)
-0.5 I
0 - 0 .5 0 . 0
400
(1_,_A
ugust 10, 1979 0J.SFC [ I ,I , 1 ,I ,I , 1 ,I I -,."1000 1100 1200 1300 1400 1500 1600 1700• .. ' TIME (CDT) I'------;
RAIN PERIOD RAIN PERIOD
!d Figure 18. Same as Figfure 8, for 10 August 1979.o,'
'0p
4
A u 10 1979. .
"F I -
100 -10 10 30 40 10 60 10
-28-
The vorticity was cyclonic in the low levels at 1000 CDT,but became anticyclonic at 1030 CDT. Except for some weak cy-clonic vorticity between 450 and 600 m MSL at 1100 CDT, the flowhad anticyclonic vorticity in the sub-cloud layer until the startof the first rain period. After the first rain period the vorti-city was mostly cyclonic.
The "summary" diagram of the surface and upper-air features(Fig. 16), shows that the surface divergence field tended to be-come convergent beginning atll135 CDT. The surface _divergincechanged from 0.1 x 10 sec at 1135 CDT to -0.4 x 10 sec at1205 CDT, about 40 minutes before rain began anywhere in thedense raingage network. However, the column average divergencewas either near zero or divergent after 1000 CDT, with compensat-ing downward vertical motion (Fig. 16a). There apparently was nocoupling between the near-surface and surface kinematics. Asecond increase in convergence occurred at the surface between1320 and 1335 CDT which was followed by return to divergent sur-face flow by 1440 CDT. This second "surge" of convergence ended110 minutes prior to the second rain period, and was most likelyrelated to convection occurring just east of the triangle. Afterthe first rain period the average divergence from the surface to700 m MSL became less divergent, and between 1500 and 1600 CDTthe average sub-cloud flow was convergent. A comparison of thecurves for sub-cloud and surface divergence in Figs. 16a and bsuggests that the surface and upper-air kinematics were coupledafter 1600 CDT.
August 1979
At 1300 CDT on 18 August a cold front was centered in a gen-eral pressure trough which extended from southwest Michigan tocentral Nebraska. This cold front moved slowly southeast duringthe day, sagging as far south as Champaign by 0100 CDT on 19 Au-gust. A series of short-wave troughs embedded in the long wavecirculation at 700 and 500 mb, slid across Illinois and flattenedan anticyclonic circulation centered over the southern GulfStates. The flow at 850 mb throughout the day was from thesouthwest.
The maximum surface temperatures over central Illinoisranged from 29 to 33 C, with dew-point temperatures of 21 to 24C. The air mass south of the front was moist, as indicated bythe 1300 CDT precipitable water of 4.2 cm at Salem and Champaignand 3.6 cm at Peoria. The atmosphere was unstable with the 1300Showalter Stability Indices of -2 and Lifted indices ranging from-4 to -6 at the three radiosonde sites.
Ahead of the cold front, scattered showers and thunderstormsdeveloped in central Illinois at 1700 CDT, and continued throughthe evening. The precipitation cells moved from the west at 35to 40 km/hr. As the front moved southward, the areal coverageand intensity of the convective activity increased, and by 2000

-1 ;-- -_7 -7
-29-
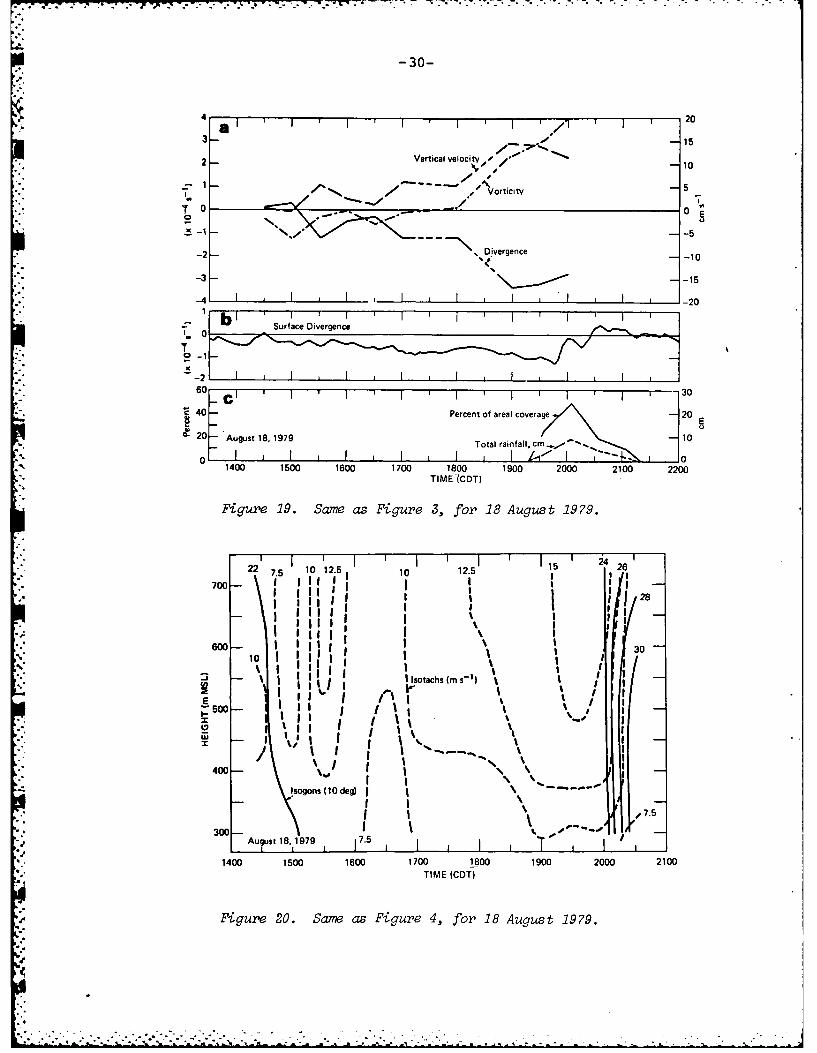
CDT a general area of showers and thunderstorms extended on aneast-west line from central Indiana to west-central Illinois.The earliest rain in the VIN network was 10 km east of the pibaltriangle, and a rainstorm initiated over the center of the trian-gle shortly before 1930 CDT. Rain continued in the triangle un-til 2120 CDT (Fig. 19c). The storms over the dense raingage net-work moved east, with new storms initiating north and south ofthe triangle between 2000 and 2100 CDT.
Pibals were released from 1430 to 2000 CDT with the 1730 and'1830 CDT measurements missing. The winds for this period were"- usually between 220 and 230 with wind speeds generally in excess
of 7.5 m/s (Fig. 20). A maximum in wind speed was measured above550 m MSL at 1530 CDT, which corresponded in time to a maximum inthe convergence field and strong upward vertical motion (Fig.21). The wind speeds in both the upper and lower levels of thesub-cloud layer began to increase at approximately 1700 CDT andreached maximum at 1930 CDT, about the time that rain started inand west of the triangle. Between 2000 and 2030 CDT the wingspeed decreased and the wind directioB shifted from 230 to 310at 300 m MSL and from 240 to 270 at 700 m MSL. This sudden
. shift in wind direction was coincident in time with the peak in-. the rainfall and apparently was a response to convective activity*" in and/or just outside of the triangle.
The wind field from the surface to 700 m MSL was mostly con-vergent, except in the upper levels at 1430 CDT and between 350
*and 450 m MSL at 1630 CDT (Fig. 21a). At 1800 CDT the conver-gence rapidly increased, efpecially between 350 and 550 m MSL,reaching nearly 4 x 10 sec shortly after 1900. This increaseto strong convergernce preceded the start of rain in the pibaltriangle by nearly 90 minutes. The compensating vertical motion(Fig. 21b) was mostly upward during the afternoon and evening.The strongest upward motion (14.9 cm/sec at 1900 CDT) was at 70
*m MSL from 1900 to 1930 CDT, just prior to, and coincident with,the onset of precipitation.
• iPrior to 1800 CDT the relative vorticity alternated betweencyclonic and anticyclonic in the region from 350 to 700 m MSL(Fig. 21c). After 1800 CDT, howiver,_it was increasingly morecyclonic, reaching over 4 x 10 sec between 400 and 650 m MSLat 2000 CDT. The strong increase in cyclonic vorticity startedabout an hour before the start of rain in the dense raingage net-
* work.There was a general increase in surface convergence from
early afternoon until 1945 CDT when the surface wind field wasaffected by thunderstorm outflows (Fig. 19b). This increase insurface convergence was mirrored by an even stronger increase inconvergence in the column from 350 to 700 m MSL (Fig. 19a). The
- average _.ivergence in the sub-clud layer changed from +0.3 x10 sec at 1500 CDT to -3.4 x 10 sec at 1900 CDT. Theaverage vorticity in the layer from 350 to 700 m MSL was weaklyanticyclonic until 1800 CDT, but then became increasingly cy-clonic, mirroring the increase in convergence. The strong
A7.1
-30-
4 ' I I 203- Of - 15
:2 - Vertical velocity , ' 102 e cis/ 10
- Vorticitv 5
S.... . /-~--
-2- Divergence-,, -- -10
-3 s -15
-4 I I I I I I -2011 h i ' I I ' I
- ISurface Divergence
o-1-2i I I I
60 I I I 30
40 Percent of areal coverage 20
" 20 'August 18, 1979 Total rainfall, cm. ,..- .. 10o I I I I i I .- '-I '7=-4-.. ,1 o
1400 1500 1600 1700 1800 1900 2000 2100 2200TIME(CDT)
Figure 19. Same as Figure 3, for 18 August 1979.
.- T 1I5 24 2
22 75 10 12.5 10 12.5 126I '"lIf700 I I I I
-I IO !• .' Io I I i .' "'-" I I3iI0,' II
l ,sotachs(ms-) -
"' 0'I '" ' ' Il500II I
zI 'S,
40 \" I 9 .
400-
Isogons (10 deg) "I I 'S
300 I I \ -August 18, 1979 7.5I I [ I
1400 1500 1600 1700 1800 1900 2000 2100
TIME (CDT)
Figure 20. Same as Figure 4, for 18 August 1979.

-. -. . .- -; - -. * - :- * .. - -- . - *7~~~ - -. 7
-31-
'-1 -0.5 -1 1 7 1.5 -2 -2.5 -2.5700 li 1
0.5 +Divergence (10-4S1
600-0
0 11111-3.050I I -I I " -3.
500 0
400 -0.5 .5
SFC 0 -05
70 0 5s 1'4 13112
/ 10'
600/9to) 8
p500 63
2 OLU
400- 31 2
Vertical velocity (cm s- 1) -
SFC I
0 10 6. 1 01 1'2 1 3 3.5 170
600-05~I
Vorticity (10-4 -1 ) 1 '
500 N I
-0.5 -0.5
400 -1) 'IAugust 18, 1979
SFC I1400 1500 1600 1700 1800 1900 2000
TIME (CDT)
RAIN PERIOD
Figure 21. Samne as Figure 8., for 18 August 1979.

-32-
organization of the surface and sub-cloud layer flow preceded thestart of precipitation within the triangle and over the denseraingage network but probably was coincident with the organiza-tion of the convection.
Only 50% of the triangle was covered by precipitation at anygiven time, and only 63% of the stations in the triangle receivedrain. However, 100% of the stations in the downstorm area on thedense raingage network experienced rains.
'" 19 August IM7
The VIN network was embedded in a warm tropical air masswith surface dew-point temperatures ranging from 20 to 24 C on 19August. A stationary front was oriented on an east-west lineacross northern Illinois. This front had drifted south to cen-tral Illinois as a cold front during the early morning hcurs, butthen drifted back north during the day. At 1300 CDT it was lo-cated between Chicago and Champaign. Light southerly winds withmaximum temperatures between 30 and 35 C were observed during theafternoon and early evening hours. The upper-air flow was lightzonal with a train of weak short waves drifting through Illinois.This train of short waves continued to flatten the anticycloniccirculation centered over the Gulf States, causing general wes-terly flow over Illinois at 700 and 500 mb. The flow at the sur-face and up through 850 mb was from the south and southwest.
The air mass was moist with precipitable water content of3.7 cm at both Peoria and Champaign at 1300 CDT. The atmospherewas also unstable, with Showalter Stability Index of -1 and
* Lifted Indices of -4 and -5 at Champaign and Peoria, respec-tively. No rain occurred in the triangle from 1330 to 1930 CDT,
:* the period when pibal observations were made. Some light rains(less than 1.3 mm) did occur, however, about 10 to 20 km east ofthe triangle between 2000 and 2300 CDT.
The winds n the sub-cloud layer at 1300 CDT were 2400 andbacked to 200 by 1500 CDT. For the remainder of the 8bserva-tional period the wind direction varied from 190 to 210 (Fig.
- 221. The wind speeds prior to 1700 CDT varied between 2 and 6 ms , but increased after 1700 CDT to 10 to 12.5 m/s above thesurface.
- The surface flow was weakly divergent except for some minorconvergence between 1740 and 1845 CDT (Fig. 23b). The columnaverage values of relative vorticity indicates a "cycling"between cyclonic and anticyclonic paralleled by similar changesin divergence, (Fig. 23a), indicating little organization in thewind field over the network during the afternoon or early eveningof 19 August. The temporal variability in the kinematic fieldsis also evident in the time-height profiles in Fig. 24. Thedivergence was generally weak and changed sign several times atall levels in the sub-cloud layer. The most organized period was
-,- .-- - 2 2•A

-33-
24 I 2020
700m 5 I I-- ~~22 , \
I -Isotachs (m s- )20 I I
60 - Isogons (0 deg) I-. i I I /
I I12.
_ o=I I'1 IIIII
400I
I 20
I August 19, 1979300 N . .
, 5 2.5 I I I I1300 1400 1500 1600 1700 1800 1900 2000
TIME (CDT)
Figure 22. Time-height analysis of wind direction (isogons) and wind speed(isotachs) in sub-cloud layer on 19 August 1979.
2° I0 II2 10"[ 1-Vorticity 5%-
Vertical velocity
o 1 Divergence-
°l-2' 10
o2
6 0 Surface divergencex
-1 August 19, 1979
1300 1400 1500 1600 1700 1800 1900 2000TIME (CDT)
NO RAIN IN TRIANGLE
Figure 23. Time series of (a) colum-avel,"ze (300-700 m .i2L) divergenceand vorticity (10- 4 s-1 ), and v7'rttcal motion at 700 m MSL,and (b) surface divergence ovwr the pibaZ trian -77e, on19 August 1979.

-34-
-0.250~ 0 0. 0 0.5 0 -0.5 00111700 - '
I 0
600 + X
0.5'50 -0.25 aj
Divergence (10-4 S-1 ) -1
0~ USFC
051 2 1-211.1' 0O4 10700 - + I0.
I 1600 - 3
LU
500 -/
-Vertical velocity (cm s1
SFC
August 19, 1979 Vorticity (10 o- s1)700--. -0.5
-0.5 d 0 -0.5
600-
500 C
-0.5 +
SF01300 1400 1500 1600 1700 1800 1900 2000
NO RAIN IN TRIANGLE TM CT
Figure 24. Sam as Ficure 8., but for 19 August 1979.

-35-
at 1830 CDT when both the surface and the upper-level flows wereconvergent. The convergence maximized between 350 and 450 m MSLbetween 1800 and 1900, the only time that the surface flow waseven weakly convergent. The vertical motion compensatiyg for thedivergence maximized with an upward motion of 4 cm sec at 1800CDT _jFig. 24b), and a maximum downward vertical motion of -2.4 cmsec at 1600 CDT.
The relative vorticity was even more variable than the- divergence field, shifting about every 30 to 60 minutes between
cyclonic and anticyclonic, at least to 1730. After 1730 CDT theflow primarily had anticyclonic vorticity. The vortic~ty dujing
* the period of observation ranged from -0.9 to 1.1 x 10 sec
22 August 1979
During the morning of 22 August a warm front moved north* across the VIN network, and continued into Wisconsin and Michi-
gan. The warm front was associated with a low pressure areawhich moved from a position in northeast Kansas at 0700 CDT to
*west central Wisconsin by 2200 CDT. The upper air was character-ized by a trough over western Iowa and Missouri which deepenedduring the day, but remained stationary.
During the afternoon the VIN network was embedded in warm,moist, tropical air. The afternoon maximum temperatures rangedfrom 26.5 to 29 C, and the surface dew-point temperatures hovered
* between 21 and 22 C. The precipitable water at 1300 CST rangedfrom 3.2 cm at Salem in southern Illinois to 3.6 cm at Peoria.
* The Lifted Index indicated that the atmosphere was conditionallyunstable with values of 0 at Salem, -3 at Champaign, and -5 atPeoria.
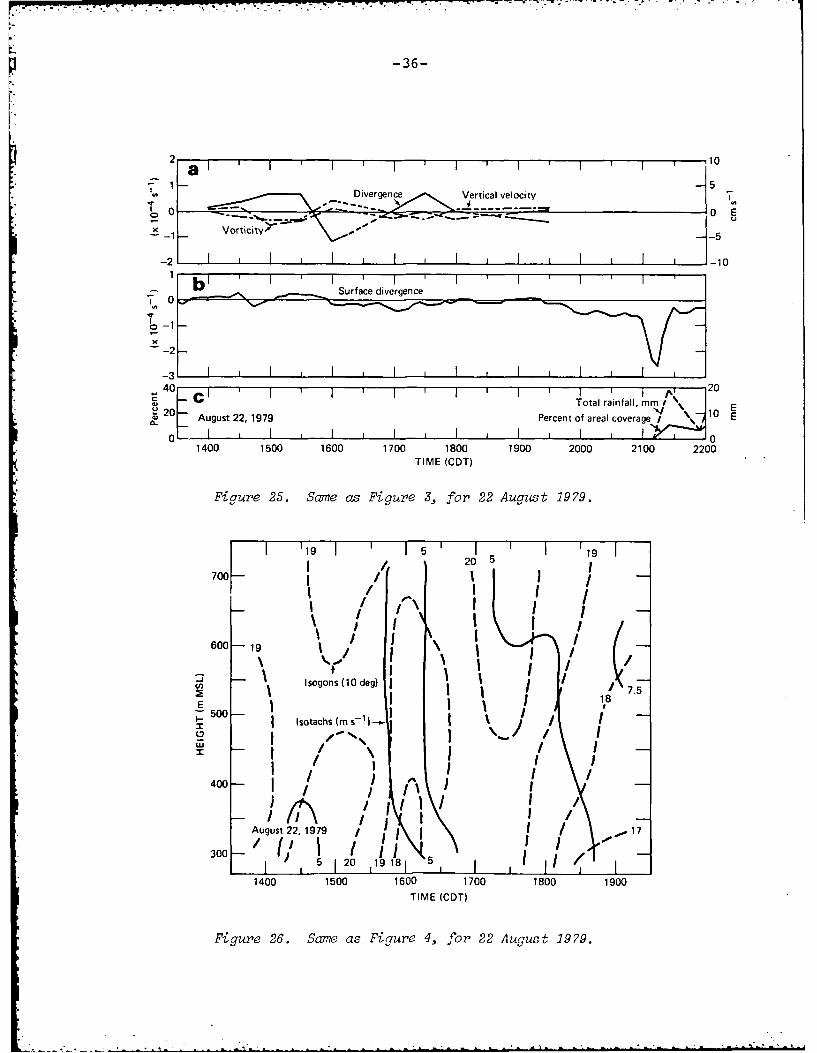
Showers and thunderstorms were detected along the Missis-sippi River at 1335 CDT by NWS WSR 57 radars. This convectiveactivity moved east at 35 to 45 km/hr, with individual convectiveentities moving from the west-southwest at the same speed. Theshowers anbd thunderstormL moved onto the VIN dense raingage net-work at 2000 CDT. Point rainfall amounts in excess of 2.5 cm
*.were observed in 1-hour periods from 2000 to 2300 CDT over thenorthern part of the dense raingage network, north of the pibaltriangle. Only light rainshowers, 5-minute amounts of 4 mm or
* less, were observed anywhere in the network between 2000 and 2035CDT. After 2035, heavier rains moved in, and also formed over,the network, primarily over the northern third.
The rain did not begin in the triangle until after 2110 CDT(Fig. 25c), about 70 minutes after rain was first observed overthe dense raingage network. Within the triangle, less than 20%of the raingages received rain in any 30-minute period, and the
* total rain at all the raingages within the triangle in any 30-minute period was less than 3 cm.
.; -. -,-: .w r.t
r - . ; , , : ,/ . , , . . .- -: .. -. . . - ,- . . . , • , . . . . :
-36-
2- 1 ----
Divergence Vertical velocity l
1 Vorticity;:
" ,, ss
-2 1 -10
1 b i I Surfa'ce divelrgence'-2 1 i I J l J I J iI I I I I - o
1o_
3 I I I I I I I I
40C 1 I C1I I 20Total rainfall, m m i
2- V-..-.
C 2 August 22, 1979 Percent of areal coverage , E
I I I I I 01400 1500 1600 1700 1800 1900 2000 2100 2200
TIME (CDT)
Fiaure 25. Same as Figure 3, for 22 August 1979.
1 19 5 1 1 19/ 20 5700K Il/I i-
00I / I I /
\ I (\ I /\ II I
600-19 \ /\ - ., I /-
Isogons (10 deg) 7*550018
oI stachs (m s-'-
I / I III / , I ,1-
400 I / I il I -o- I /I, rI I /
August 22, 1979 I I /17/Ij//II I ,300F 5 ' I I I I
5 20 ,1918 -
1400 1500 1600 1700 1800 1900
TIME (CDT)
Figure 26. Same as Figure 4, for 22 August 1979.

-37-
Pilot-balloon measurements were taken from 1400 to 1930 CDTwith no measurement made at 1630, and measurements missing at oneof the s~tes at ;830. The boundary layer winds were generallyfrom 190 to 200 during the afternoon, with spe~ds of 3o 6 m/s(Fig. 26). After 1800 the winds backed from 190 to 170 in thelow levels, and the speeds were greater than 5 m/s with a maximumof 7.5 m/s at 600 m MSL at 1900 CDT.
The wind field in the sub-cloud layer alternated betweendivergent and convergent flow during the afternoon and evening(Fig. 27a), which is reflected in a similar cycling in compensat-ing vertical motion (Fig. 27b). The highest upward motion, 5cm/sec, occurred at 1600 CDT, and the highest downward motion,-2.9 cm/sec, at 1730 CDT, both at the top of the sub-cloud layer.The flow in the triangle during most of the afternoon had onlyweak vorticity, alternating between anticyclonic and cyclonic(Fig. 26c). In general anticyclonic vorticity was associatedwith diviergence and cyclonic with convergence.
The cycling between convergence and divergence occurred inthe sub-cloud layer with a frequency of approximately an hour,until 1700. After that (to 1930 at least), the flow was veryweakly convergent, with indications that convergence was on theincrease (Fig. 25a).
The surface divergence field also alternated between weakconvergence and divergence during the afternoon (Fig. 25b). Agradual increase in convergence started at 1945 more than an hourbefore rain occurred within the triangle and shortly before thefirst rain in the raingage network. A typical thunderstormgust-front signature occurred in divergence starting 10 minutesbefore the start of rain in the triangle.
The pibal measurements ceased nearly 1 1/2 hours before rainstarted in the pibal triangle. However, there is evidence in boththe column average divergence (Fig. 25a) and in the time heightprofiles (Fig. 27a) that the increase in convergence associatedwith the developing or advecting convection in the early eveningmay have started earlier in the sub-cloud layer than it did atthe surface.
23 Augs 1979
A double cold front system pushed across Illi Aois during thedaylight hours of 23 August, with passage across the VIN networkbetween 1600 and 1700 CDT. The upper-air flow across Illinois onthis day was southwesterly. The air mass in advance of the coldfront had precipitable water content of 3.2 cm. In addition, theair mass was conditionally unstable, with a Showalter StabilityIndex of 0 and a Lifted Index of -2. The maximum temperatures,which occurred prior to the cold front passage, varied between26.5 and 29.5 C, and the surface dew-point temperatures rangedfrom 19 to 21 C.

,,L :++%,:
• , + , ,.U.,. - -. . . .. . , •. .- .- . . .
-38-
0 -0.5 0. 0' -
600- 00 5.5,, -+ -I /I -11 I /
II +jl --60/
I I /
500 .Divergence (10- 4 s- 1)
40 -0.5
SFC, 0 0I V I I
1 -1-2 -3 ' T
700-- /it I 1
F 0 410 +
6000
=-°..3 1 ,E ' I -1 0 s -
I)
3:500 2
0 Izj / Vertical velocity (cm S-1)
400 I
0'0I 0
SFC 0
700 -0 0
0600
I Varticity (10'-4 S-1)
500- +1II - 0
400-
- 0.5 -0.5 0 August 22, 1979+"S F C I * I I I
1400 1500 1600 1700 1800 1900 2000TIME (CDT)
Figure 27. Same as Figure 8, for 22 August 1979.

-39-
Some scattered light rainshowers fell in advance of the coldfront over the dense raingage network, beginning at 1335 CDT.Showers tended to generate just west of the network and moveeast. The heaviest rains fell on the east-central edge of theraingage network between 1600 and 1800 CDT with hourly measure-ments between 2.3 and 2.5 cm. Scattered light showers and thun-derstorms continued over the extreme eastern part of the raingagenetwork until 2010 CDT. The rain in the triangle began at 1435CDT and ended at 1620 CDT (Fig. 28c). The rains which occurredwithin the triangle were from showers which initiated 5 to 10 kmto the west at 1415 CDT and then moved into the triangle.
Pibals were released from 1330 to 1900 CDT, but wind meas-urements at one or more of the three sites were not available at1600 and 1630 and after 1800. The winds from 300 to 700 m MSLwere from the SW with speeds between 4 and 9 m/s until 1530 (Fig.29). The wind veered to the west by 1700 CDT and continued to
* veer to north of west. Maxima in wind speed occurred just before_ the rain started and just after it ended.
The sub-cloud layer flow was weakly divergent at 1330 CDT,but by 1400 had become convergent (Fig. 28a). The sub-cloud con-
* vergence increased in magnitude at all levels up through at least* the first 30 minutes of the period that rain was occurring within
the triangle (Fig. 30a). The surface winds in the triangle wereconvergent, even when the sub-cloud flow was divergent (Fig.28b). After the frontal passage (1600 to 1700 CDT), the sub-cloud flow became divergent between 350 and 550 m MSL, and thenagain become convergent by 1800 CDT.
The compensating vertical motion through most of the periodwas upward, as would be expected, except for some slight downwardmotion at 1330 and 1730 CDT. The upward motion maximized at 10.3cm/sec at 1530 CDT during the time that rain was falling withinthe triangle.
The relative vorticity pattern prior to 1500 CDT varied ra-pidly from cyclonic to anticyclonic and then back to cyclonic.After the frontal passage the flow was anticyclonic, but therewas evidence of shift back to cyclonic above 550 m MSL at 1800.
The surface flow was convergent from 1330 to 1855 CDT (Fi 428c)1 There was an increase in convergence from -0.05 x 10sec between 1400 and 1415, about 20 minutes prior to the ini-tiation of rain within the triangle. Another increase occurredbetween 1430 and 1440 CDT. Both of these "surges" could havebeen due to outflow from the shower and thunderstorm activitywithin or outside of the triangle. The flow in the layer from350 to 700 m MSL was mostly convergent during the periods whenadequate observations were available. Before and through themiddle of the rain period within the triangle the flow was wellorganized, with strong upward motion, cyclonic flow, and conver-gence from the surface through 700 m MSL (Fig. 30). After therain ended in the triangle (but was still occurring to the east),the vertical motion at 700 m MSL was weak and the relative
, I ! ]1 I I " ! iI
I. I.I ii . . ., " "1 " i - * " ' I I , " . . . . .

-40-
a 15
2 *-10Vorticit, v-liVertical velocity
!,i o--./.,o-v veoct-ertical c -
- -r Divergence - -5
-2Divergence Vorticity -1-2 - -10
-3 I I 1-15
T I bl Surface Divergence
-2 I I I II
40C I I I 20
Cs-o 2 0 L Percent of areal --- '\J
T tal rainfall mm --ae10 E
CL -August 23, 1979 - ' I IIE1300 1400 1500 1600 1700 1800 1900 2000
TIME (CDT)
Figure 28, Same as Figure 3, for 23 August 1979.
S 5I 23 7.512322 27 10 28
700 l I;.5I7o1 .5 1
I I , I
600- I I I" I sotachs (m s- 1) I
- - 5 I I I \\ I
500- I sogons (10 deg)
r 2200-I- I I I \"I 0 0 I ) 7
22 1 I / - - -I' *' /
I r I I I 5
300 )August 23. 1979/
1300 1400 1500 1600 1700 1800 1900
TIME (CDT)
Figure 29. Same as Figrue 4, for 23 August 1979.
.-~.-

-4-2
60 - -0501. . 0.5-.
600 0 0
500 0
+1
SFC
4700 Vertical velocity (cm 1
600- ) 6
E 0 \7 5500--b
64
w 5400 -4 1 3
3 2
2
SFCI
700 -0.5 1.
600-
- 20 Vorticity (1- S-1) 0-
400
0.5 August 23, 1979 -0.5]
SFC - - I I I I I1300 1400 1500 1600 1700 1800
TIME (CDT)
RAIN PERIOD
Figure 30. Scone as Figure 8, for 23 August 1979.

-42-
vorticity had shifted from cyclonic to anticyclonic. By 1800 CDTthere was a trend toward less anticyclonic vorticity, more con-vergence, and greater upward motions at the 700 m MSL level.
. ..
-43-
SECTION III
SYNTHESIS AND DISCUSSION
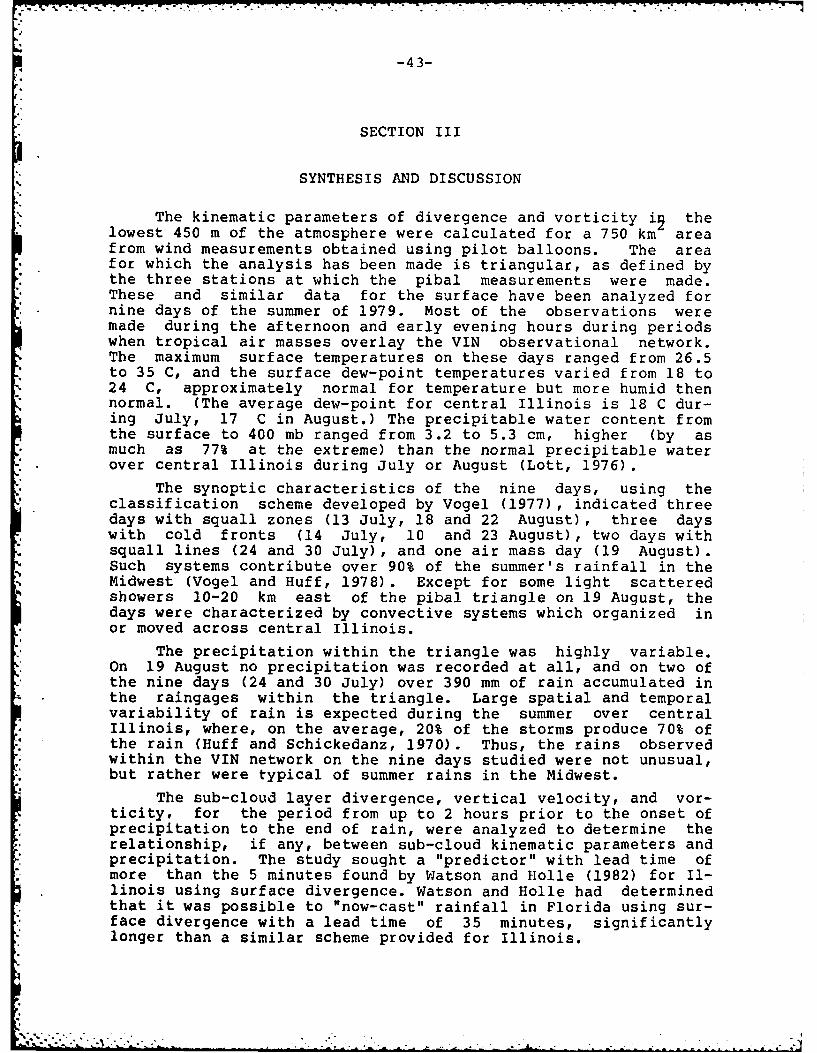
The kinematic parameters of divergence and vorticity i2 the* lowest 450 m of the atmosphere were calculated for a 750 km area
from wind measurements obtained using pilot balloons. The areafor which the analysis has been made is triangular, as defined bythe three stations at which the pibal measurements were made.These and similar data for the surface have been analyzed fornine days of the summer of 1979. Most of the observations weremade during the afternoon and early evening hours during periodswhen tropical air masses overlay the VIN observational network.The maximum surface temperatures on these days ranged from 26.5to 35 C, and the surface dew-point temperatures varied from 18 to24 C, approximately normal for temperature but more humid thennormal. (The average dew-point for central Illinois is 18 C dur-ing July, 17 C in August.) The precipitable water content fromthe surface to 400 mb ranged from 3.2 to 5.3 cm, higher (by as
*. much as 77% at the extreme) than the normal precipitable waterover central Illinois during July or August (Lott, 1976).
The synoptic characteristics of the nine days, using theclassification scheme developed by Vogel (1977), indicated threedays with squall zones (13 July, 18 and 22 August), three dayswith cold fronts (14 July, 10 and 23 August), two days withsquall lines (24 and 30 July), and one air mass day (19 August).Such systems contribute over 90% of the summer's rainfall in theMidwest (Vogel and Huff, 1978). Except for some light scatteredshowers 10-20 km east of the pibal triangle on 19 August, thedays were characterized by convective systems which organized in
-* or moved across central Illinois.
The precipitation within the triangle was highly variable.On 19 August no precipitation was recorded at all, and on two ofthe nine days (24 and 30 July) over 390 mm of rain accumulated inthe raingages within the triangle. Large spatial and temporalvariability of rain is expected during the summer over centralIllinois, where, on the average, 20% of the storms produce 70% of
*. the rain (Huff and Schickedanz, 1970). Thus, the rains observed"* within the VIN network on the nine days studied were not unusual,
but rather were typical of summer rains in the Midwest.
The sub-cloud layer divergence, vertical velocity, and vor-ticityo for the period from up to 2 hours prior to the onset ofprecipitation to the end of rain, were analyzed to determine therelationship, if any, between sub-cloud kinematic parameters andprecipitation. The study sought a "predictor" with lead time ofmore than the 5 minutes found by Watson and Holle (1982) for Il-
* linois using surface divergence. Watson and Holle had determinedthat it was possible to "now-cast" rainfall in Florida using sur-
*face divergence with a lead time of 35 minutes, significantlylonger than a similar scheme provided for Illinois.

-44-
A major factor contributing to the disagreement in the rela-tionships that they found for the two regions is difference inthe dynamic factors leading to convection. In Florida, the lowlevel convergence associated with the sea breeze circulation overthe peninsula is important in triggering convective rains. Thun-derstorms regularly develop in the afternoon in response to thisdiurnal circulation and convective systems are characterized byrelatively little movement from the time the first clouds form tothe dissipation of the system. In contrast, convective systemsand thunderstorms in the Midwest are often initiated by a combi-nation of migratory surface and upper-air dynamic factors. Thesemidlatitude convective systems frequyntly form large clusters orlines which advect at 30 to 50 km hr , and rarely develop, ma-ture, and dissipate in the same general locale. Development ischaracterized by concurrent growth and dissipation as the systemadvects across a rather large region. Thus, the typical develop-mental sequence of convective systems in Florida and in Illinoisare different, and this could play an important role in the leadtime which can be anticipated between a signature in the surfacedivergence and the initiation of rain in the same location.
Since dynamic triggers for convection in Illinois may comefrom the middle and lower troposphere and be enhanced by localcloud circulations, the planetary boundary layer flow may respondmore strongly and earlier than the surface flow. Thus bothlayers have been considered in this study.
The degree of correlation between kinematic parameters andrainfall parameters was determined in an attempt to quantize therelationships, if any. Surface and sub-cloud parameters weretreated separately, with the former confined to measures ofdivergence. For the sub-cloud layer, vorticity and vertical mo-tion were also considered. The rainfall variables were 1) totalrainfall in triangle, 2) maximum 30-minute point accumulation inthe triangle, 3) total rainfall in triangle plus that in the"downstorm" area, and 4) maximum 30-minute point accumulation forthe area defined by the triangle and the "downstorm" region.(The downstorm region was defined as the area added when thesides of the triangle were "translated" a distance equal to thattraveled by the storms in one hour. Total rainfall was the totalaccumulation for all raingages in applicable region.)
In all 12 storm events occurred in the pibal triangle duringthe eight days with rain. For this "statistical" analysis ofsub-cloud paramters the sample was reduced to seven storms. Somecases had to be omitted because kinematic parameters could not becalculated for pertinent times due to rain or other obscurationsat a pibal site. Also on several occasions, it was evident thatthe wind fields were affected by convective systems outside ofthe triangle, and that the resulting measurements represented acomposite of effects. Thus the final sample of seven relates toconvective rains originating in or close to the triangle.
The correlation coefficients between rain and sub-cloud
parameters in this seven storm sample were all 0.8 or greater
-. . . . -. .. - . , .. .., .- . .. .. - _ . * *- , . . . , - *. : *_-_ , _ ._*;

-45-
(Table 1). The column average divergence at, or just prior to,the initiation of rain within the triangle was storngly corre-lated with rain, with coefficient3 of -0.82 or -0.83 for all raincategories, (i.e., positive correlations of rain with conver-gence). Similarly, the correlations coefficients between rainand the minimum values of divergence within 2 hours of the startof rain ranged from -0.85 to -0.87. The correlation between rainand vertical velocity at 700 m MSL, an integration of divergencefrom the surface to 700 m MSL, was similarly high. The columnaverage vorticity at the measurement time closest to the initia-tion of rain in the triangle and the maximum cyclonic vorticitywithin 2 hours of the start of rain were equally well correlatedto rainfall, with correlation coefficients of 0.80 to 0.97. Themaximum values of cyclonic vorticity were observed within 30minutes of the initiation of rain in 5 of the 7 cases.
On some of the days (14, 24, and 30 July) convergence maximawere observed as much as 3 to 4 hours prior to the initiation ofrain. However, the relative vorticity at the same time was ei-ther very weakly cyclonic or anticyclonic. The rains did notstart until the sub-cloud vorticity was cyclonic, except for thestorm on 23 August. On this day cyclonic vorticity and conver-gence was observed in the sub-cloud layer prior to rain withinthe triangle but the vorticity changed to weakly anticyclonicwhen the rain started. The wind fields were evidently being af-fected by the low-level outflow from the thunderstorms.
The correlation coefficients between surface divergence and* :rainfall are shown in Table 2, for both the limited sample used
for the sub-cloud layer calculations and for the sample which in-cluded cases where pibal measurements were missing. Surfacedivergence at the time closest to start of rain in the trianglewas the more closely correlated to the rain than the other sur-face parameters which were tested. The correlation coefficientsranged from -0.52 to -0.60, not as high as those for sub-cloud
. divergence and rain. The other divergence variables, includingthe change associated with the "gust front signature", had corre-lation coefficients of less than 0.50.
The small sample size does not permit us to attach much sta-tistical significance to the correlations. Nevertheless, there isan indication that the sub-cloud parameters examined could ex-plain more of the variance in rainfall than the best surfacedivergence parameter. There appears to be a strong positive re-lationship between rainfall and the strength of the sub-cloud in-flow prior to the start of rain, and between rainfall and posi-tive relative vorticity. The stronger correlation of rain to thesub-cloud layer should not be too surprising since the cloud"feeds" on the whole layer and the measurements in this regionshould provide a better indicator of the integrated mass flowinto the cloud. The surface values only represent a portion ofthe inflow from the surface to cloud base.
Watson and Holle (1982) using a larger sample from the VINnetwork also found that correlations between surface divergence

p -46-
+
r- '.0 N- r- N- - NN C
$4 0CL) - ~ -
4-- CO r"CO C
* .0 U) II
on ca s- '- 'cn 00-. .o -H 00 0 0.0 0
W.U E-4I I
o 0 CI
CU0 (V)
-4 -H
()+ S-I .,,-4 ?. U) 0 -
0$4 -H 4-4 4J CU
$4 . ca p R 1 1 tC) co0 -40 CU *4
0 41 alC) 5-(2co -4 u 1-:9 rz ) -4 4.
Uu 4--124 44o
41 CI 4a c , 1f 1-H 0 00U 0 00 ~ OD
u- rU 1 -
44 Q) 4.J
4-4 .0 W4) :3 .J 1-
-I 12 41 c*0 U 2)(4
CU 00
S-i -4
rw 5$- 00)CU "q~ CU = H 0 %m 4 40 c -i - . C14 I4 CUc c
01 V4 Ai 0 4 . $ 0w) P.% 0~c ca 4J-4 4.l4 S-0
41,. $4 CH 0 p 200 Iz w$ -H Ai *.4 (LC) co
~0 m $4 1-. iC -*y-4C4 44- OC 0 C C 4J -

-47-
cr O 0-0 0-0 -D 1 C CO IO
* - LJ) I-n -t n - in
C)
U C)
cIn
C.)
CCCD
9- 4-j
-4
C n ('A ~ - \0 In \j.VmV U) 0f 0 0 0 0
-~ E I I I I I
C)f 03
.0
t 4 4.
0(10
4-J CD()
(- . C"UD. 0 t
>) 0) J) 4
0 ~ C, u j '
F-. ~ ~ C 4-) c 4 ) 4u 1) :3 ~ f
vi $c i C)t" " C) i0.4 V)~ H 4 ~ i C

-48-
and rain were low in Illinois, but improved when the data werestratified by the wind speed in the lowest 3 km. The correlationcoefficient was higher when the winds were less than 5 m s , analower when they were stronger (-.73 and -.46, respectively forthe average of the divergence at uniformly space grid points).However, a significant fraction of the rain events were notdetected in the divergence time series as a "convergence event"(defined _ y thim as sustained change in divergence of less than-2.5 x 10 sec for more than 10 minutes). Nine rains out of221 were undetected for low winds and 19 out of 50 for winds >5 mS
The relationships between rainfall and sub-cloud layerkinematic parameters was sufficiently good to suggest that theymay provide statistical predictors of precipitation amount whichcould be useful in weather modification experiments. However be-cause of the small sample size, the low correlation coefficientsfor rain and surface divergence, and short lead time, it is notpossible to draw a favorable conclusion as to the value of sub-cloud and surface kinmatics as a now-casting tool for rainfall inthe Midwest.
- .
--- - -

-49-
REFERENCES
Achtemeier, G. L., 1980: Bound ar Lav Structur- ai Its Rela-tion to Precipitpp over the St. Louis Ar.. Tech. Rpt.2, NSF grant ATM78-08865, Illinois State Water Survey, Cham-paign, IL.
Ackerman, B., R. W. Scott, and N. E. Westcott, 1983: Summary ofthe VIN F Progra, Sumg 1979. Tech. Rpt. 1, NSF grantATM78-08865, Illinois State Water Survey, Chamapign, IL.
Bellamy, J. C., 1949: Objective calculations of divergence,vertical velocity and vcrticity. Bull. Amer. Meteor. Soc.,30, 45-49.
Byers, H. R., and R. R. Braham, Jr., 1949: The Thunderstorm. U.S. Govt. Printing Office, 282 pp. (Out of print; availablethrough NTIS.)
Changnon, S. A., Jr., and J. I. Vogel, 1981: Hydroclimatologicalcharacteristics of isolated severe rainstorms. WaterResources Res., 171, 1694-1700.
Huff, F. A., J. L. Vogel, and S. A. Changnon, Jr., 1981: Real-time rainfall monitoring-prediction system and urban hydro-logic operations. Proceeding of the Amer. Soc. Civ. Eh.,Z. Water Resources Planning and Management, 107, WR2, 419-435.
Huff, F. A., and P. T. Schickedanz, 1970: Rainfall EvaluationStudies, Final Report - Part II. Contract Report for NSFGA-1360, Illinois State Water Survey, Urbana, IL, 224 pp.
Lott, G. A., 1976: Precipitable Water Over the United States,Volume j: Monthly M . NOAA Technical Report NWS 20, Su-perintendent of Documents, U. S. Government Printing Office,Washington, D.C., 173 pp.
Ulanski, S. L., and M. Garstang, 1978: The role of surfacedivergence and vorticity in the life cycle of convectiverainfall. Part I. Observation and analysis. I. Atmos.Sci., 35, 1047-1069.
U. S. Naval Weather Service, 1969: World-Wide Airfield Sumarie3LqO. VIII, P 3, 4, and 5. Federal Clearinghouse forScientific and Technical Information, Springfield, VA.
Vogel, J. L., 1977: Synoptic weather relations, in Summary QMETROMEX, Voqle 1: Weather Anomalies and Impacts. Bul-letin 62, Illinois State Water Survey, Urbana, IL, 85-112.

-50-
Vogel, J. L., and F. A. Huff, 1978: Relation between the St.Louis urban precipitation anomaly and synoptic weather fac-tors . ApL. Meteor., 17, 1141-1152.
Watson, A. I., R. L. Holle, J. B. Cunning, P. T. Gannon, and D.0. Blanchard, 1981: Low-I&vi Convergence and th edicionof Convective PrecipitatiQn in E&2ii Florida. Tech. Rpt. 4,NSF grant ATM78-08865, Illinois State Water Survey, Cham-paign, IL.
Watson, A. I., and R. L. Holle, 1982: The Rliai-hp BetweenLow-Level Convergence and Convective Precipitation in Illi-nois and South Florida. Tech. Rpt. 7, NSF grant ATM78-08865, Illinois State Water Survey, Champaign, IL.

• . .- .-.a . ..
-51-
ACKNOWLEDGMENTS
Contributions to this report came from a number of sources.Robert W. Scott implemented and supervised the pilot balloonfield operations and the involved task of reducing, editing andprocessing the data. Also to be recognized are the efforts ofthe three student observers who spent the summer of 1979 peeringthrough theodolites at little red points in the sky.
Irene Conroy did much of the computer programming and as-*i sisted in the analysis. A. I. Watson of NOAA/ERL provided the
surface divergence quantities. The final product would not bewithout the contributions of John Brother and his staff in theGraphic Arts Unit of the Illinois State Water Survey and ofRebecca Runge who turned poorly handwritten copy into a finishedproduct.
-4.
. .

~ ~14
~~J44~ t:Nlr,
'd~~qaA 7~ '
4.4
.A10.t "~it it~4 " 'v ;s~% .4IL
'It
let 1 - I
4 1 4,. ~ ~t,~ ,"IN
I, xio I$ Ad ''~Jt 1 t
- 1-6.~ Y-. -
e.o '~ p-jc.s - A--