Embed Size (px)
Citation preview
Central Highlands Regional Bioenergy Working Group
Central Highlands Bioenergy Scoping Study and
Biomass Audit
August 2009
Central Highlands Bioenergy Scoping Study
Page 2 of 110
C:\Documents and Settings\Laurie\My Documents\Laurie\Farm Business\CHAF\Biodiesel and Bioenergy\Bioenergy\Bioenergy Working Group\Working Group Business plan\Business Plan Project\Stage 2 report\LN_CHAF Bioenergy scoping study FINAL.doc
August 2009
Acknowledgements
Funding for this project was provided by Regional Development Victoria, Department of Innovation, Industry and Regional Development, Regional Communities and STI Program; Central Highlands Agribusiness Forum (CHAF) and the City of Ballarat with support from Central Victorian Greenhouse Alliance. The work undertaken by Mr Mark Stewart, University of Melbourne, Department of Forest Ecosystem Science, Creswick who provided detail on the forestry biomass component is gratefully acknowledged. Support provided by members of the Regional Bioenergy Working Group formed for the purpose of developing this scoping study and in particular the Steering Committee is also acknowledged. Further information on this project is available from: Laurie Norman Executive Officer Central Highlands Agribusiness Forum P: (03) 5343 2555 E: [email protected]
Central Highlands Bioenergy Scoping Study
Page 3 of 110
C:\Documents and Settings\Laurie\My Documents\Laurie\Farm Business\CHAF\Biodiesel and Bioenergy\Bioenergy\Bioenergy Working Group\Working Group Business plan\Business Plan Project\Stage 2 report\LN_CHAF Bioenergy scoping study FINAL.doc
August 2009
Contents
DISCLAIMER............................................................................................................................. 9
INTRODUCTION...................................................................................................................... 10
PROJECT BACKGROUND..................................................................................................... 11
BIOENERGY IN CONTEXT..................................................................................................... 12
BENEFITS OF BIOENERGY................................................................................................... 15
Economic....................................................................................................................................................................... 15
Environmental ............................................................................................................................................................... 15
Energy security and continuity of supply................................................................................................................. 15
Thermal value-add....................................................................................................................................................... 16
Connection infrastructure........................................................................................................................................... 17
THE ENERGY ENVIRONMENT IN AUSTRALIA .................................................................... 17
The Australian energy market.................................................................................................................................... 17
Energy production and consumption in Australia................................................................................................. 18
Comparative economics of renewable energy sources..................................................................................... 20
The energy sector and greenhouse gas emissions................................................................................................ 22
THE NATIONAL POLITICAL AND REGULATORY ENVIRONMENT .................................... 23
Carbon Pollution Reduction Scheme....................................................................................................................... 23
How it will work............................................................................................................................................................................. 23
CPRS and renewables................................................................................................................................................................ 24
Implications of the CPRS for local government ..................................................................................................................... 24
Mandatory Renewable Energy Target (MRET) ....................................................................................................... 25
Garnaut Climate Change Review............................................................................................................................ 26
Australian Bioenergy Roadmap ................................................................................................................................ 26
THE VICTORIAN POLITICAL AND REGULATORY ENVIRONMENT ................................... 27
Victorian Climate Change Green Paper ................................................................................................................ 27
Central Highlands Bioenergy Scoping Study
Page 4 of 110
C:\Documents and Settings\Laurie\My Documents\Laurie\Farm Business\CHAF\Biodiesel and Bioenergy\Bioenergy\Bioenergy Working Group\Working Group Business plan\Business Plan Project\Stage 2 report\LN_CHAF Bioenergy scoping study FINAL.doc
August 2009
The impacts of climate change for Victoria .......................................................................................................................... 28
Key VCCGP policy statements ................................................................................................................................................. 29
VCCGP next steps....................................................................................................................................................................... 31
Victorian Renewable Energy Target......................................................................................................................... 32
Energy for Victoria........................................................................................................................................................ 32
Towards Zero Waste Strategy..................................................................................................................................... 32
Feed-in tariffs ................................................................................................................................................................. 34
Summary of possible policy implications ................................................................................................................. 35
RENEWABLE ENERGY IN AUSTRALIA AND VICTORIA..................................................... 35
Solar photovoltaic and solar thermal electric systems ......................................................................................... 36
Wind turbines and wind farms ................................................................................................................................... 37
Hydro power.................................................................................................................................................................. 37
Biomass-fuelled energy plants ................................................................................................................................... 37
Biomass generators in Victoria.................................................................................................................................................. 37
Biomass generators elsewhere in Australia............................................................................................................................. 39
BIOMASS TO ENERGY: FEEDSTOCKS AND TECHNOLOGIES ......................................... 40
Dry waste feedstocks................................................................................................................................................... 41
Dry waste types ........................................................................................................................................................................... 41
Dry biomass-to-energy technologies....................................................................................................................................... 41
Specific fuel/technology considerations ................................................................................................................................ 42
Dry biomass to energy plants.................................................................................................................................................... 44
Wet biomass feedstocks ............................................................................................................................................. 46
Wet waste types .......................................................................................................................................................................... 46
Wet biomass-to-energy technologies ..................................................................................................................................... 46
Wet biomass to energy plants .................................................................................................................................................. 48
CENTRAL HIGHLANDS BIOMASS AUDIT ............................................................................ 49
General references...................................................................................................................................................... 49
Overview........................................................................................................................................................................ 50
Dry wastes...................................................................................................................................................................... 51
Central Highlands Bioenergy Scoping Study
Page 5 of 110
C:\Documents and Settings\Laurie\My Documents\Laurie\Farm Business\CHAF\Biodiesel and Bioenergy\Bioenergy\Bioenergy Working Group\Working Group Business plan\Business Plan Project\Stage 2 report\LN_CHAF Bioenergy scoping study FINAL.doc
August 2009
Woody waste ............................................................................................................................................................................... 51
Agricultural residues: crop stubbles ......................................................................................................................................... 55
Poultry litter ................................................................................................................................................................................... 57
Municipal, industrial/commercial and construction/demolition solid waste................................................................... 57
Wet wastes .................................................................................................................................................................... 58
Sewage ......................................................................................................................................................................................... 58
Animal effluents ........................................................................................................................................................................... 59
Municipal and industrial / commercial putrescible waste .................................................................................................. 60
Summary ........................................................................................................................................................................ 61
INTERNATIONAL BIOENERGY DEVELOPMENT ................................................................. 61
Brazil ................................................................................................................................................................................ 62
China .............................................................................................................................................................................. 62
Sweden .......................................................................................................................................................................... 62
Swedish case study 1 – Torsvik plant ........................................................................................................................................ 62
Swedish case study 2 – Filbona plant ...................................................................................................................................... 65
Denmark......................................................................................................................................................................... 66
Austria ............................................................................................................................................................................. 67
European Union ............................................................................................................................................................ 67
THE BUSINESS CASE FRAMEWORK................................................................................... 68
The opportunity............................................................................................................................................................. 68
Environmental scanning ............................................................................................................................................. 68
The value chain ............................................................................................................................................................ 68
Market analysis ............................................................................................................................................................. 69
Investment and funding environment ..................................................................................................................... 69
Funds and grants from Australian governments.................................................................................................................... 72
Financials........................................................................................................................................................................ 73
Capital costs ................................................................................................................................................................................ 73
Approvals....................................................................................................................................................................... 76
Central Highlands Bioenergy Scoping Study
Page 6 of 110
C:\Documents and Settings\Laurie\My Documents\Laurie\Farm Business\CHAF\Biodiesel and Bioenergy\Bioenergy\Bioenergy Working Group\Working Group Business plan\Business Plan Project\Stage 2 report\LN_CHAF Bioenergy scoping study FINAL.doc
August 2009
Australian Energy Market Operator ......................................................................................................................................... 76
Environmental approvals ........................................................................................................................................................... 77
Local government planning approvals .................................................................................................................................. 77
Other considerations ................................................................................................................................................... 78
Connecting to the grid .............................................................................................................................................................. 78
Electricity distributors and retailers in Victoria ........................................................................................................................ 79
Community awareness and acceptance.............................................................................................................. 80
BIOENERGY POTENTIAL IN THE CENTRAL HIGHLANDS REGION .................................. 82
Technology options for the Central Highlands region .......................................................................................... 82
Cost and practicality of bioenergy options............................................................................................................ 82
Likely outputs and usage potential .......................................................................................................................... 83
Scenario one................................................................................................................................................................................ 83
Scenario two ................................................................................................................................................................................ 84
For putrescible biomass............................................................................................................................................... 85
Benefits of bioenergy for the region from wood waste........................................................................................ 85
Ballarat region employment benefits....................................................................................................................... 86
Likely or possible spin-off benefits.............................................................................................................................. 87
Comparable overseas examples for the Ballarat region..................................................................................... 87
OBSERVATIONS AND RECOMMENDATIONS ..................................................................... 88
CONCLUSION......................................................................................................................... 89
ACKNOWLEDGEMENTS........................................................................................................ 90
APPENDIX 1: ABBREVIATIONS ........................................................................................... 91
APPENDIX 2: GLOSSARY..................................................................................................... 93
APPENDIX 3: UNITS AND CONVERSIONS.......................................................................... 96
Conversions ................................................................................................................................................................... 96
What do we mean by energy?................................................................................................................................. 96
The output of a bioenergy plant............................................................................................................................... 96
Central Highlands Bioenergy Scoping Study
Page 7 of 110
C:\Documents and Settings\Laurie\My Documents\Laurie\Farm Business\CHAF\Biodiesel and Bioenergy\Bioenergy\Bioenergy Working Group\Working Group Business plan\Business Plan Project\Stage 2 report\LN_CHAF Bioenergy scoping study FINAL.doc
August 2009
General rules of thumb for energy ........................................................................................................................... 96
Units of wood chip biomass – cubic content/weight ........................................................................................... 97
Units of calorific value ................................................................................................................................................. 97
Prefixes for energy units (Energy in Sweden 2007)................................................................................................. 98
Some units for biogas .................................................................................................................................................. 98
APPENDIX 4: WASTE-TO-ENERGY IN SWEDEN AND DENMARK .................................... 99
Sweden .......................................................................................................................................................................... 99
Denmark....................................................................................................................................................................... 100
APPENDIX 5: SCANDINAVIAN BIOENERGY OPTIONS IN PRACTICE............................ 101
Dry wastes.................................................................................................................................................................... 101
Wet wastes .................................................................................................................................................................. 101
District heating plants in Sweden............................................................................................................................ 102
Combined heat and power (CHP) plants recently built in Sweden................................................................ 102
Wet wastes plants in Sweden .................................................................................................................................. 103
Woody biomass for CHP plants in Denmark, Sweden and Finland.................................................................. 104
Averdøre multi-fuel power plant, Denmark.......................................................................................................................... 105
Herning CHP plant..................................................................................................................................................................... 105
Wrams Gunnarstorp .................................................................................................................................................................. 107
APPENDIX 6: REFERENCE MATERIAL ............................................................................. 108
Key reports and documents..................................................................................................................................... 108
Key websites................................................................................................................................................................ 109
Figure 1: Bioenergy closed carbon cycle ...........................................................................................12 Figure 2: Sample international bioenergy contribution to electricity generation.........................13 Figure 3: National electricity market structure in Australia pre July 20097 ......................................17 Figure 4: Average capital cost comparison per kW .........................................................................20 Figure 5: Relative costs per MWh of energy types.............................................................................21 Figure 6: Resource recovery rate for municipal solid waste ............................................................34 Figure 7: Renewable electricity power stations (DEWHA April 2009) ..............................................36 Figure 8: Biomass generators Victoria – June 2005 ............................................................................39 Figure 10: Biomass district heating 5MW plant ...................................................................................44 Figure 11: MSW bunker – Llungby CHP plant, Sweden......................................................................48
Central Highlands Bioenergy Scoping Study
Page 8 of 110
C:\Documents and Settings\Laurie\My Documents\Laurie\Farm Business\CHAF\Biodiesel and Bioenergy\Bioenergy\Bioenergy Working Group\Working Group Business plan\Business Plan Project\Stage 2 report\LN_CHAF Bioenergy scoping study FINAL.doc
August 2009
Figure 13: Victorian winter crop production from 1997/98 to 2007/08 ..........................................56 Figure 14: Torsvik waste to energy plant, Sweden.............................................................................63 Figure 15: Global trends in sustainable energy investment 2009.....................................................70 Figure 16: Grid connected renewable energy system .....................................................................79 Table 1: 2006 German renewable industry summary statistics ........................................................16 Table 2: Energy production by fuel type - Australia ..........................................................................18 Table 3: Energy consumption by state - Australia..............................................................................19 Table 4: Energy consumption by fuel type - Australia.......................................................................19 Table 5: Renewable energy consumption by fuel - Australia ..........................................................19 Table 6: Comparison of electricity sold...............................................................................................21 Table 7: Australia's net greenhouse gas emissions ............................................................................22 Table 8: Effects of climate change on Victoria .................................................................................29 Table 9: TZW objectives and targets....................................................................................................33 Table 10: 2006-2007 projected and actual results against TZW 2014 targets.................................33 Table 11: Installed renewable generation in Victoria – January 2008............................................36 Table 12: Biomass energy production - Victoria (DEWHA April 2009) .............................................37 Table 13: Potential Australian feedstock electricity generation......................................................41 Table 14: Example biogas yields ..........................................................................................................46 Table 15: Estimated 5-year supply (tonnes) of pine and blue gum harvesting residues..............52 Table 16: Residues from two major timber processors ......................................................................53 Table 17: Yields of major crops in Victorian statistical divisions........................................................55 Table 18: Chicken numbers by statistical division..............................................................................57 Table 19: Livestock numbers by statistical division.............................................................................59 Table 20: Summary of potential bioenergy feedstocks in the Central Highlands region ............61 Table 21: New investment by geographic location..........................................................................71 Table 22: Facility type, energy supply, feedstocks and estimated cost.........................................75 Table 23: Overview of expenditure and income for a 1 MW-e facility...........................................76
Central Highlands Bioenergy Scoping Study
Page 9 of 110
C:\Documents and Settings\Laurie\My Documents\Laurie\Farm Business\CHAF\Biodiesel and Bioenergy\Bioenergy\Bioenergy Working Group\Working Group Business plan\Business Plan Project\Stage 2 report\LN_CHAF Bioenergy scoping study FINAL.doc
August 2009
Disclaimer
The Central Highlands Bioenergy Scoping Study has been prepared specifically for Central Highlands
Agribusiness Forum as the client.
The Central Highlands Bioenergy Scoping Study and its contents are not to be referred to, quoted or
used by any party in any statement or application, other than by Central Highlands Agribusiness Forum,
without written approval from SED Consulting.
The information contained in this document has been gained from anecdotal evidence and research.
It has been prepared in good faith and in conjunction with Central Highlands Agribusiness Forum.
Neither SED Consulting, nor its servants, consultants, agents or staff shall be responsible in any way
whatsoever to any person in respect to the Report, including errors or omission therein, however caused.
SED Consulting - Central and Western
International Standards Certifications Lic: QAC/R61/0760
Central Highlands Bioenergy Scoping Study
Page 10 of 110
C:\Documents and Settings\Laurie\My Documents\Laurie\Farm Business\CHAF\Biodiesel and Bioenergy\Bioenergy\Bioenergy Working Group\Working Group Business plan\Business Plan Project\Stage 2 report\LN_CHAF Bioenergy scoping study FINAL.doc
August 2009
Introduction
“Even if the future looks dark it doesn’t have to have a given end. Change is constant. We have gone
through an Age of Steam and an Age of Oil. Now we have to do it smarter.
Since 1990 in Sweden we have managed to increase renewable energy to almost 40%, reduce
greenhouse gas emissions by 9% and grow our GDP by 44%. Bioenergy for us is no longer an alternative
energy but a major part of our energy supply system.”
Ms Maud Olofsson Minister for Enterprise and Energy and Deputy Prime Minister, Sweden (Opening address to World Bioenergy Conference, Jönköping Sweden, 27 May 2008)
In the Central Highlands region of Victoria in the mid 1800s, greenhouse gas (GHG) emissions were
effectively zero, whether per person or from the entire populations of many thousands. Energy for
heating and cooking came from wood. High temperature heat for blacksmiths was from charcoal.
After the gold rush industrial steam engines were fuelled by wood, sometimes carted from great
distances of perhaps 30 or 40 miles by bullock wagon. All land transport was by horse power or foot until
the steam locomotive. Longer distance transport used wind and wooden boats.
Lighting came from candles of rendered sheep fat or beeswax, or from whale oil or vegetable oils
soaked into wicks. Clothing was made from wool, cotton, leather, jute and hemp, and dyes and
colours were all from natural sources. Fasteners were often buttons of shell or bone. Household waste
was minimal, generally highly biodegradable and mostly went to feed household animals. Many
families owned a cow or goat and kept poultry or a few pigs, and grew at least some of their own
vegetables. Salt was the common preservative. Food, other than perhaps flour, was grown, traded
and consumed within a radius of a few miles. Municipal waste as we know it now was miniscule. Food
and goods were rarely packaged. Paper bags, wrappings, cardboard boxes and string were usually
kept for reuse, and newspapers often had a second life as wall paper.
Up to World War II our GHG emissions were still very low. Horses were still a major part of agriculture.
Bicycles or public transport were the way most people got to work. Petrol was very expensive, to the
point that in outback Western Australia pre-war cars and trucks were powered with the charcoal
gasifiers that became such a ubiquitous feature of commercial vehicles during the war. Sewage gas
was known, though for its danger rather than its potential value as a renewable energy source. In rural
Victoria steam locomotives were usually still fuelled by wood, as was most heating and cooking in
households and institutions. Hurricane lamps and pressure lanterns used fossil fuels like kerosene but only
single rooms were lit up, not whole towns.
Central Highlands Bioenergy Scoping Study
Page 11 of 110
C:\Documents and Settings\Laurie\My Documents\Laurie\Farm Business\CHAF\Biodiesel and Bioenergy\Bioenergy\Bioenergy Working Group\Working Group Business plan\Business Plan Project\Stage 2 report\LN_CHAF Bioenergy scoping study FINAL.doc
August 2009
Food was mostly fresh and staples came in bulk. Milk and cream came in bulk or reusable bottles and
tinned goods were seen as luxuries. Recycling was universally practiced and regarded as a domestic
virtue, and electrical household appliances were only just beginning to appear.
In this era, before the great proliferation of use of fossil fuels, the material from plants and animals that
was used to produce heat, light and mechanical work (and from this electricity) we now call biomass
(from bios, the Greek word for life). The energy produced from biomass we call bioenergy.
GHG emissions in our community have gone from near zero in the 1800s to being among the world’s
highest now. Nationally we have the challenge to cut them by 2050 to perhaps the emission levels of
the 1970s. One way to assist with this is to produce low-emission energy locally using the large volumes
of underutilised biomass we have around us, applying systems that have been developed in Europe
and Scandinavia.
Project background
The Central Highlands Agribusiness Forum (CHAF) co-sponsored Andrew Lang of SMARTimbers to attend
the World Bioenergy Conference in Sweden in 2008. Following Andrew’s return a regional meeting was
held to discuss the experiences from Andrew’s attendance at the conference and to form a Regional
Bioenergy Working Group to investigate the potential for developing a long term strategy for production
of energy from regional waste material and biomass. The regional meeting was also addressed by Prof
Loren Kellogg who was on sabbatical with the Cooperative Research Centre Wood Innovations at
Creswick from Ontario University. Prof Kellogg’s address detailed a project undertaken by State of
Oregon Forest Biomass Working Group to assess biomass resources available for bioenergy production.
He also explained the development of the Working Group, its function, membership and objectives.
The meeting to discuss the formation of a Regional Bioenergy Working Group attracted interest from the
Shires of Moorabool, Hepburn, Macedon Ranges, Golden Plains and Buloke, the City of Ballarat, the
Rural City of Ararat, Highlands Regional Waste Management Group, Central Murray Regional Waste
Management Group, Central Victorian Greenhouse Alliance, University of Ballarat, University of
Melbourne (Creswick Campus), timber industry companies and environmental groups. This meeting
approved the formation of a Regional Bioenergy Working Group and nominated a Steering Committee
to develop a scoping study to progress the future direction for bioenergy development in the region.
The Steering Committee includes:
� Laurie Norman (CHAF);
� Ian Rossiter (City of Ballarat);
� Bronwen Machin (Central Victorian Greenhouse Alliance); and
� Andrew Lang (Central Victorian Farm Plantations committee, and SMARTimbers Cooperative).
Central Highlands Bioenergy Scoping Study
Page 12 of 110
C:\Documents and Settings\Laurie\My Documents\Laurie\Farm Business\CHAF\Biodiesel and Bioenergy\Bioenergy\Bioenergy Working Group\Working Group Business plan\Business Plan Project\Stage 2 report\LN_CHAF Bioenergy scoping study FINAL.doc
August 2009
This Scoping Study is intended to provide information on:
� Energy industry structures;
� The expected impacts of, and opportunities arising from, climate change mitigation strategies and
policy;
� Available bioenergy feedstocks in the Central Highlands region;
� Best-fit technologies for the region based on the outcomes of the feedstock audit;
� Benefits and barriers to bioenergy development in the region; and
� A broad implementation strategy to develop the regional bioenergy sector.
It is intended that this Scoping Study will be utilised by a range of current and potential stakeholders with
an interest in progressing small, medium and larger scale bioenergy initiatives including local
governments, biomass producers, the energy industry, general business and industry, research and
development entities and broader communities of interest.
Bioenergy in context
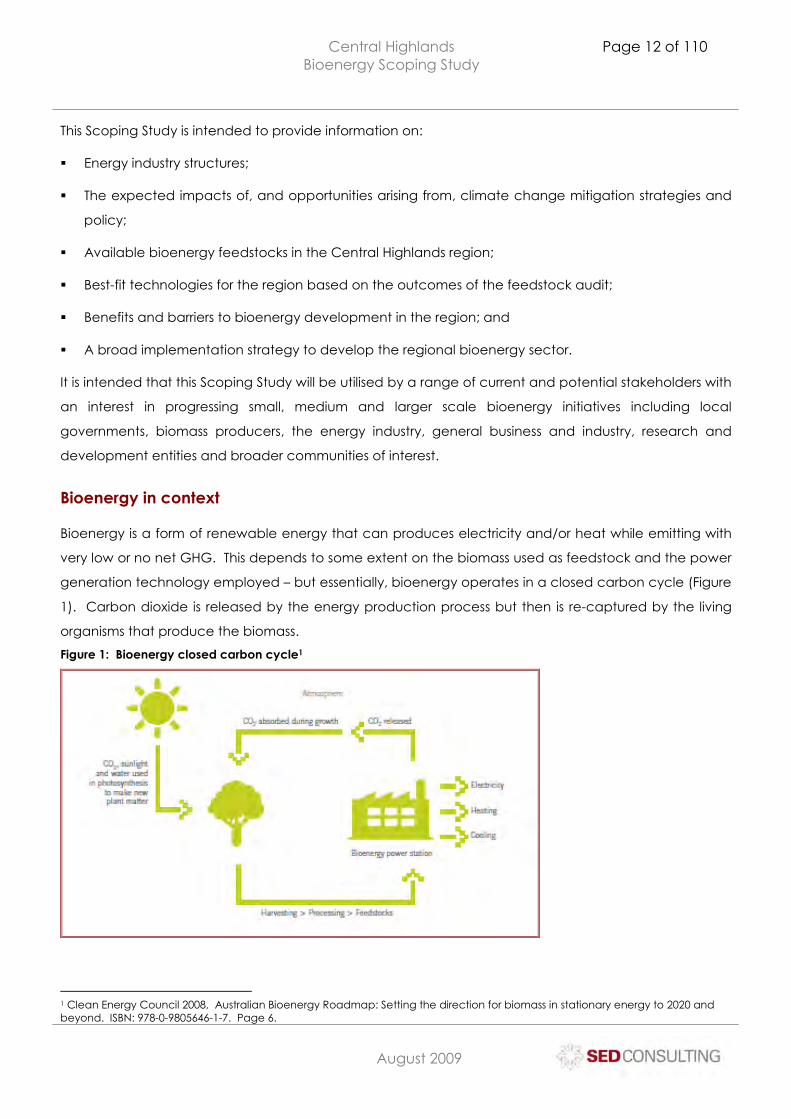
Bioenergy is a form of renewable energy that can produces electricity and/or heat while emitting with
very low or no net GHG. This depends to some extent on the biomass used as feedstock and the power
generation technology employed – but essentially, bioenergy operates in a closed carbon cycle (Figure
1). Carbon dioxide is released by the energy production process but then is re-captured by the living
organisms that produce the biomass.
Figure 1: Bioenergy closed carbon cycle1
1 Clean Energy Council 2008, Australian Bioenergy Roadmap: Setting the direction for biomass in stationary energy to 2020 and beyond. ISBN: 978-0-9805646-1-7. Page 6.
Central Highlands Bioenergy Scoping Study
Page 13 of 110
C:\Documents and Settings\Laurie\My Documents\Laurie\Farm Business\CHAF\Biodiesel and Bioenergy\Bioenergy\Bioenergy Working Group\Working Group Business plan\Business Plan Project\Stage 2 report\LN_CHAF Bioenergy scoping study FINAL.doc
August 2009
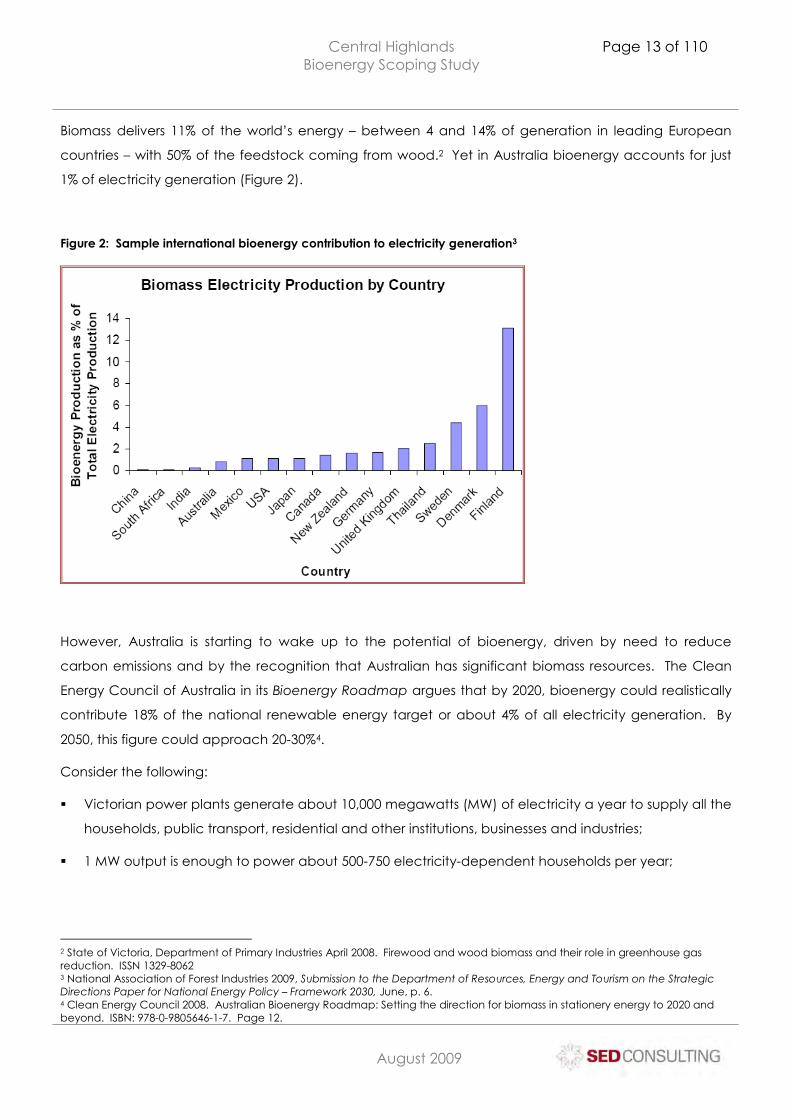
Biomass delivers 11% of the world’s energy – between 4 and 14% of generation in leading European
countries – with 50% of the feedstock coming from wood.2 Yet in Australia bioenergy accounts for just
1% of electricity generation (Figure 2).
Figure 2: Sample international bioenergy contribution to electricity generation3
However, Australia is starting to wake up to the potential of bioenergy, driven by need to reduce
carbon emissions and by the recognition that Australian has significant biomass resources. The Clean
Energy Council of Australia in its Bioenergy Roadmap argues that by 2020, bioenergy could realistically
contribute 18% of the national renewable energy target or about 4% of all electricity generation. By
2050, this figure could approach 20-30%4.
Consider the following:
� Victorian power plants generate about 10,000 megawatts (MW) of electricity a year to supply all the
households, public transport, residential and other institutions, businesses and industries;
� 1 MW output is enough to power about 500-750 electricity-dependent households per year;
2 State of Victoria, Department of Primary Industries April 2008. Firewood and wood biomass and their role in greenhouse gas reduction. ISSN 1329-8062 3 National Association of Forest Industries 2009, Submission to the Department of Resources, Energy and Tourism on the Strategic Directions Paper for National Energy Policy – Framework 2030, June, p. 6. 4 Clean Energy Council 2008. Australian Bioenergy Roadmap: Setting the direction for biomass in stationery energy to 2020 and beyond. ISBN: 978-0-9805646-1-7. Page 12.
Central Highlands Bioenergy Scoping Study
Page 14 of 110
C:\Documents and Settings\Laurie\My Documents\Laurie\Farm Business\CHAF\Biodiesel and Bioenergy\Bioenergy\Bioenergy Working Group\Working Group Business plan\Business Plan Project\Stage 2 report\LN_CHAF Bioenergy scoping study FINAL.doc
August 2009
� An average Australian family household that uses electricity for heating of water and cooking as
well as appliances will use about 13,000 kilowatt hours a year (or 13 MWh or 1.5 kW). Up to half this
electricity is used to heat spaces and water;
� Each of the brown-coal-fired power plants in the Latrobe Valley produces between 800 and 1500
MW of electricity a year. Some extra electricity for Victoria comes from the Snowy hydro scheme
and from a smaller coal-fired power plant near Anglesea. In these condensing power plants for
every MW of electricity produced about 2 MW of heat are produced and lost;
� The energy value per tonne of brown coal is similar to that of green woodchip. Bone-dry woodchip
or dry municipal solid waste (sorted dry domestic waste including plastics) has an energy per tonne
up to double that of brown coal. The burning of a tonne of brown coal in one hour produces about
2.7 megawatts of energy over that hour (2.7 MWh);
� Leakage of electricity from power lines over a distance (Yallourn to Portland or Mildura) can be 10-
15% of the amount fed into the start of the line; and
� Production of carbon dioxide from burning brown coal is of the order of 1 tonne of CO2 per tonne of
coal, and overall the Yallourn power plants produce about 70-80 million tonnes of CO2 a year.
Burning biomass in furnaces also produces CO2 but since the fuel is from recently living material and
if the material is regrown to replace what was cut, this CO2 is regarded as being very quickly
reincorporated in the new plant material and so this biomass is thus regarded as being a carbon
neutral fuel.
Central Highlands Bioenergy Scoping Study
Page 15 of 110
C:\Documents and Settings\Laurie\My Documents\Laurie\Farm Business\CHAF\Biodiesel and Bioenergy\Bioenergy\Bioenergy Working Group\Working Group Business plan\Business Plan Project\Stage 2 report\LN_CHAF Bioenergy scoping study FINAL.doc
August 2009
Benefits of bioenergy
Economic
Generating energy from biomass requires a range of processes, at times quite complex, that can deliver
various economic, environment and social benefits. These benefits are more greatly felt in regional and
rural communities where fossil energy fuels are sometimes imported at substantial cost to producers and
end users. Renewable energy resources are, by and large, produced at provided locally which creates
jobs and supports socio-economic development. Direct and indirect employment is created along the
supply chain from ongoing, cyclical biomass supply, conversion technology development and
manufacture, transportation, installation, servicing and energy supply.
There is evidence of industry restructuring in regional and rural economies with, for example, declines in
employment in and economic outputs from agribusiness and traditional manufacturing. The
development and attraction of ‘new industries’ to support and sustain these sectors will become
sustainable community imperatives. There are significant opportunities for localised bioenergy plants to
generate income for these sectors as power is supplied into the grid.
Environmental
Traditional fossil fuels are significant contributors to Australia’s greenhouse gas (GHG) emissions with
stationary power contributing for approximately 50% of Australia’s total emissions. As discussed above,
bioenergy essentially produces no net GHG.
The raw supply requirement for woody biomass-based bioenergy will in itself act as an encouragement
to plant more trees which will soak up CO2 as well as producing electricity without emitting additional
GHG. Australia produces 10m cubic metres of wood waste per year5 which has the potential to
contribute to up to 30% of Australia’s national renewable energy target.
In addition, appropriate management of wood waste supplies from forestry industries and plantations
would improve the health and vitality of those forests and end timber produced. Managed plantations
require regular thinning of low grade tree stock, imposing significant costs to plantation management.
Bioenergy provides an income stream for this waste wood product and an offset of operational costs.
Energy security and continuity of supply
According to the Clean Energy Council’s (CEC) Biomass Resource Appraisal, (BRA) undertaken as part
of the Australian Bioenergy Roadmap (ABR), there are plentiful, renewable supplies of feedstock for the
bioenergy industry in Australia. In many cases, these feedstock supplies will be geographically clustered
which will lead to both localised solutions for the type of power generation required and the distribution
5 National Association of Forest Industries 2008. Forest for renewable energy: Why some critics can’t see the wood waste for the trees. Dr John Raison, CSIRO. http://www.nafi.com.au/site/forestsRenewableEnergy.php?id=52.
Central Highlands Bioenergy Scoping Study
Page 16 of 110
C:\Documents and Settings\Laurie\My Documents\Laurie\Farm Business\CHAF\Biodiesel and Bioenergy\Bioenergy\Bioenergy Working Group\Working Group Business plan\Business Plan Project\Stage 2 report\LN_CHAF Bioenergy scoping study FINAL.doc
August 2009
reach of the power generated. Unlike conventional power generation where initial output is in large,
geographically distant power stations that each service significant, collective end users, possible power
interruption from bioenergy plants would have smaller impacts particularly for rural and regional
communities at the end of the traditional power grid. For these communities, bioenergy has the
potential to reduce the impacts on power supply caused by outages, reduction in power output during
intense power usage, adverse weather and natural disasters.
Bioenergy also has some advantages over nature-based generated power (wind and solar) which are
subject to variables in weather conditions. Bioenergy delivers continuous power output regardless of
external conditions and provides energy during peak and/or off-peak times. Some bioenergy plants will
be subject to the seasonality of feedstocks but can overcome this by storing fuel or switching to other
feedstocks – which wind and solar cannot do.
Thermal value-add
Bioenergy has the capacity to generate thermal energy in addition to electricity, a process known as
co-generation. Fully utilising this waste heat more than doubles the energy efficiency of bioenergy
plants and there are a range of potential applications for the heat captured – for example, ethanol
distillation for the production of bio-fuels, heating or cooling of co-located plant and facilities, drying
processes or heating of water or liquids.
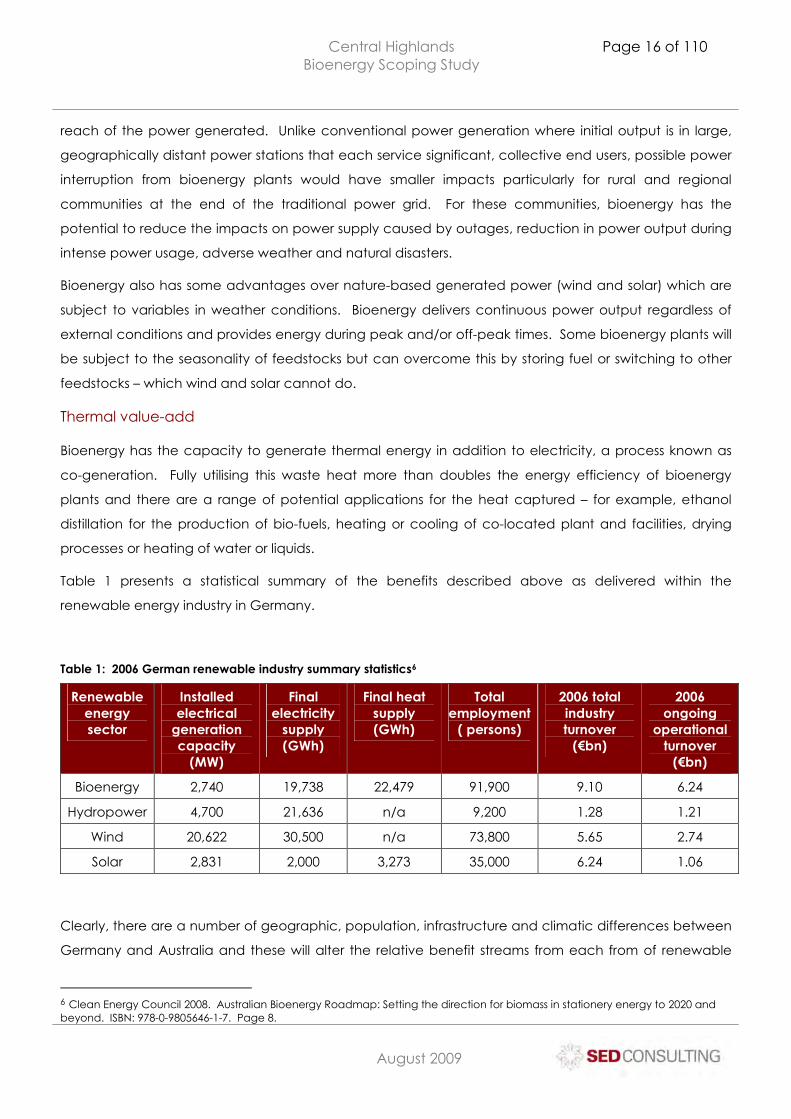
Table 1 presents a statistical summary of the benefits described above as delivered within the
renewable energy industry in Germany.
Table 1: 2006 German renewable industry summary statistics6
Renewable energy sector
Installed electrical
generation capacity
(MW)
Final electricity
supply (GWh)
Final heat supply (GWh)
Total employment
( persons)
2006 total industry turnover
(€bn)
2006 ongoing
operational turnover
(€bn)
Bioenergy 2,740 19,738 22,479 91,900 9.10 6.24
Hydropower 4,700 21,636 n/a 9,200 1.28 1.21
Wind 20,622 30,500 n/a 73,800 5.65 2.74
Solar 2,831 2,000 3,273 35,000 6.24 1.06
Clearly, there are a number of geographic, population, infrastructure and climatic differences between
Germany and Australia and these will alter the relative benefit streams from each from of renewable
6 Clean Energy Council 2008. Australian Bioenergy Roadmap: Setting the direction for biomass in stationery energy to 2020 and beyond. ISBN: 978-0-9805646-1-7. Page 8.
Central Highlands Bioenergy Scoping Study
Page 17 of 110
C:\Documents and Settings\Laurie\My Documents\Laurie\Farm Business\CHAF\Biodiesel and Bioenergy\Bioenergy\Bioenergy Working Group\Working Group Business plan\Business Plan Project\Stage 2 report\LN_CHAF Bioenergy scoping study FINAL.doc
August 2009
energy. However, the data from Germany provide compelling impetus to further develop renewable
energy in Australia and in particular to look more critically at bioenergy.
Connection infrastructure
The cost of connecting regional and rural communities to the energy grid can be highly cost prohibitive.
With bioenergy, power generation is localised, meaning that the power supply is located near to
demand and can be incorporated into local distribution networks. Communities located near to the
bioenergy power source will experience improved energy reliability due to reduced energy losses
associated with being at the end of major transmission lines and networks.
The energy environment in Australia
The Australian energy market
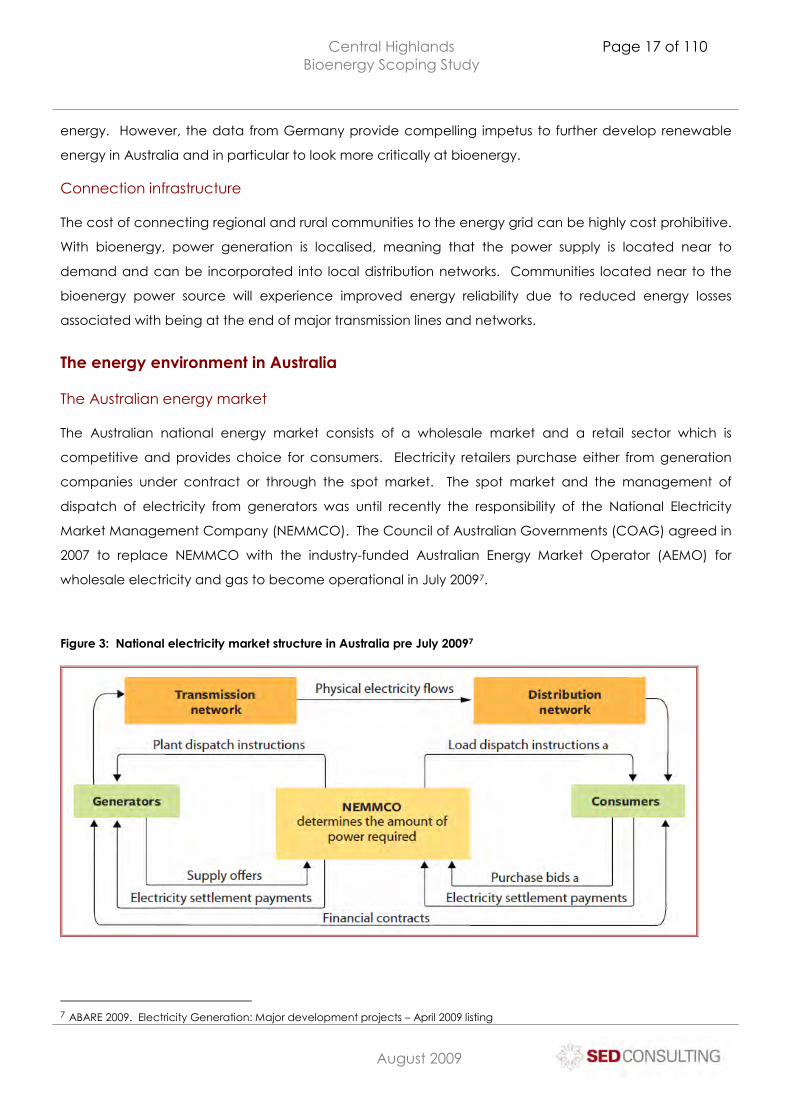
The Australian national energy market consists of a wholesale market and a retail sector which is
competitive and provides choice for consumers. Electricity retailers purchase either from generation
companies under contract or through the spot market. The spot market and the management of
dispatch of electricity from generators was until recently the responsibility of the National Electricity
Market Management Company (NEMMCO). The Council of Australian Governments (COAG) agreed in
2007 to replace NEMMCO with the industry-funded Australian Energy Market Operator (AEMO) for
wholesale electricity and gas to become operational in July 20097.
Figure 3: National electricity market structure in Australia pre July 20097
7 ABARE 2009. Electricity Generation: Major development projects – April 2009 listing
Central Highlands Bioenergy Scoping Study
Page 18 of 110
C:\Documents and Settings\Laurie\My Documents\Laurie\Farm Business\CHAF\Biodiesel and Bioenergy\Bioenergy\Bioenergy Working Group\Working Group Business plan\Business Plan Project\Stage 2 report\LN_CHAF Bioenergy scoping study FINAL.doc
August 2009
The Australian Energy Regulator (AER) is responsible for the regulation of transmission and generation
with an extension of its responsibilities to electricity and gas markets, gas transmission and electricity
transmission in parts of Australia by 2010. Western Australia will retain its state-based regulation
framework.
Energy production and consumption in Australia
According to Sustainability Victoria8, a major challenge for Victoria will be increasing demand for
energy with consumption in 2005 having doubled since 1973. ABARE9 reports that energy demand in
Victoria grew at an annual rate of 1.2% between 2001 and 2006 but fell in 2006-2007 by 0.9%. The
decline was attributed to an shift to service industries within the state. Nationally, energy demand is
growing at around 2.3% per year. This will represent an increase of 46% between the period 2004 to
2030. Biomass–based energy consumption is expected to increase from 46,982 GWh in 2009/2010 to
58,102 GWh in 2029/2030, an increase of 23%.
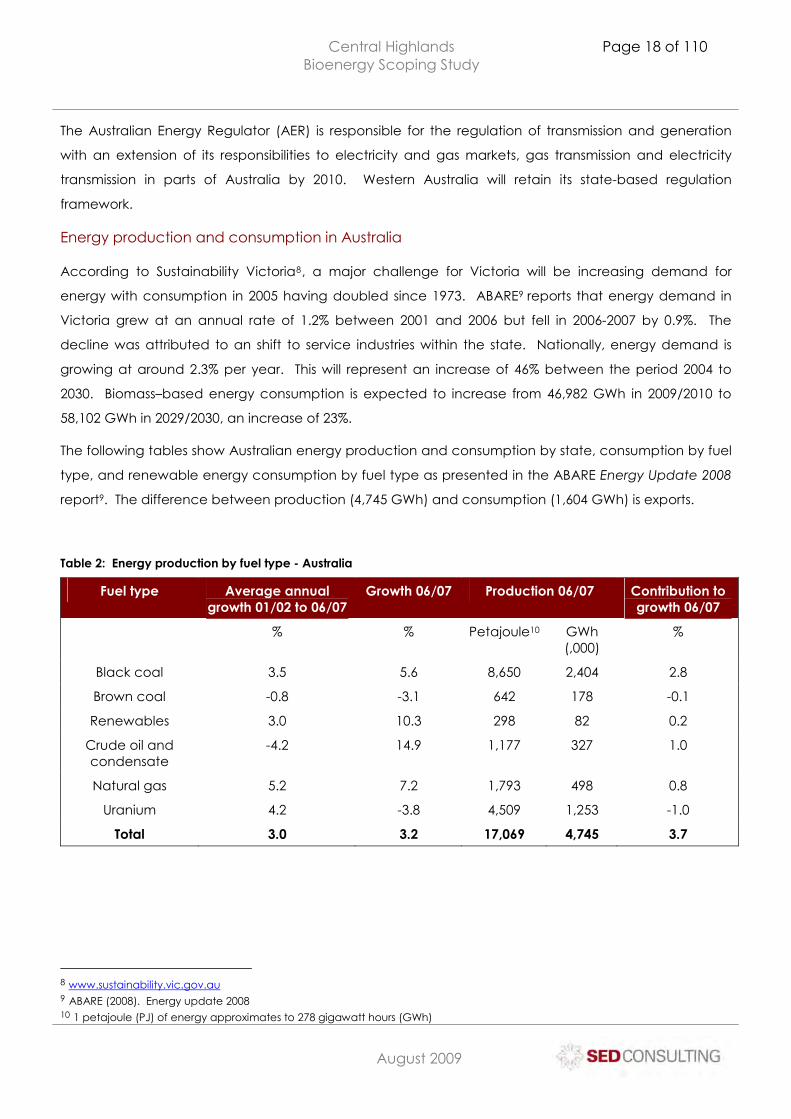
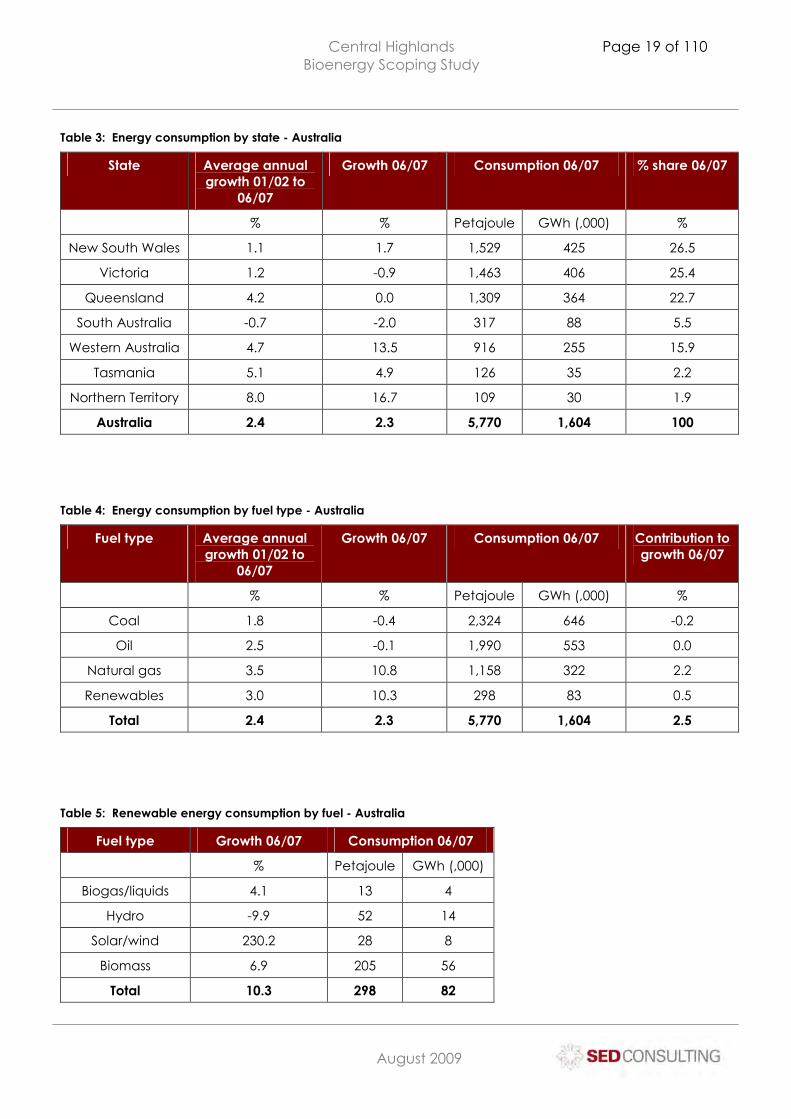
The following tables show Australian energy production and consumption by state, consumption by fuel
type, and renewable energy consumption by fuel type as presented in the ABARE Energy Update 2008
report9. The difference between production (4,745 GWh) and consumption (1,604 GWh) is exports.
Table 2: Energy production by fuel type - Australia
Fuel type Average annual growth 01/02 to 06/07
Growth 06/07 Production 06/07 Contribution to growth 06/07
% % Petajoule10 GWh (,000)
%
Black coal 3.5 5.6 8,650 2,404 2.8
Brown coal -0.8 -3.1 642 178 -0.1
Renewables 3.0 10.3 298 82 0.2
Crude oil and condensate
-4.2 14.9 1,177 327 1.0
Natural gas 5.2 7.2 1,793 498 0.8
Uranium 4.2 -3.8 4,509 1,253 -1.0
Total 3.0 3.2 17,069 4,745 3.7
8 www.sustainability.vic.gov.au 9 ABARE (2008). Energy update 2008 10 1 petajoule (PJ) of energy approximates to 278 gigawatt hours (GWh)
Central Highlands Bioenergy Scoping Study
Page 19 of 110
C:\Documents and Settings\Laurie\My Documents\Laurie\Farm Business\CHAF\Biodiesel and Bioenergy\Bioenergy\Bioenergy Working Group\Working Group Business plan\Business Plan Project\Stage 2 report\LN_CHAF Bioenergy scoping study FINAL.doc
August 2009
Table 3: Energy consumption by state - Australia
State Average annual growth 01/02 to
06/07
Growth 06/07 Consumption 06/07 % share 06/07
% % Petajoule GWh (,000) %
New South Wales 1.1 1.7 1,529 425 26.5
Victoria 1.2 -0.9 1,463 406 25.4
Queensland 4.2 0.0 1,309 364 22.7
South Australia -0.7 -2.0 317 88 5.5
Western Australia 4.7 13.5 916 255 15.9
Tasmania 5.1 4.9 126 35 2.2
Northern Territory 8.0 16.7 109 30 1.9
Australia 2.4 2.3 5,770 1,604 100
Table 4: Energy consumption by fuel type - Australia
Fuel type Average annual growth 01/02 to
06/07
Growth 06/07 Consumption 06/07 Contribution to growth 06/07
% % Petajoule GWh (,000) %
Coal 1.8 -0.4 2,324 646 -0.2
Oil 2.5 -0.1 1,990 553 0.0
Natural gas 3.5 10.8 1,158 322 2.2
Renewables 3.0 10.3 298 83 0.5
Total 2.4 2.3 5,770 1,604 2.5
Table 5: Renewable energy consumption by fuel - Australia
Fuel type Growth 06/07 Consumption 06/07
% Petajoule GWh (,000)
Biogas/liquids 4.1 13 4
Hydro -9.9 52 14
Solar/wind 230.2 28 8
Biomass 6.9 205 56
Total 10.3 298 82
Central Highlands Bioenergy Scoping Study
Page 20 of 110
C:\Documents and Settings\Laurie\My Documents\Laurie\Farm Business\CHAF\Biodiesel and Bioenergy\Bioenergy\Bioenergy Working Group\Working Group Business plan\Business Plan Project\Stage 2 report\LN_CHAF Bioenergy scoping study FINAL.doc
August 2009
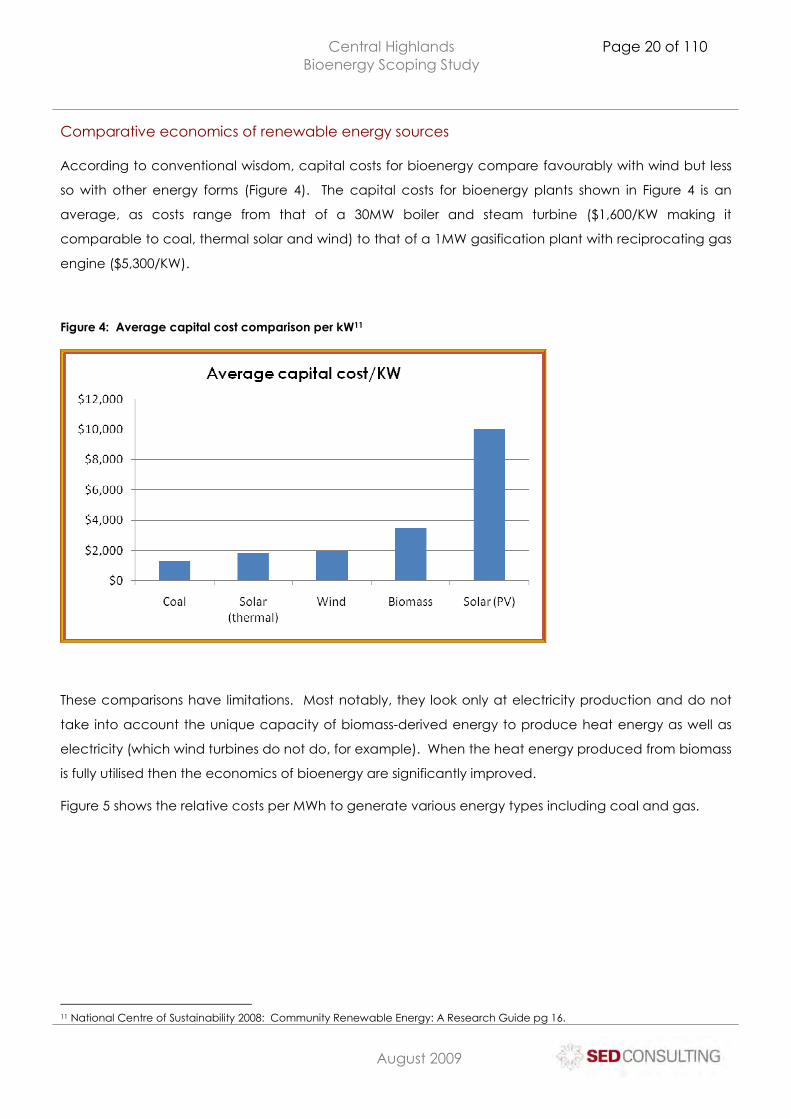
Comparative economics of renewable energy sources
According to conventional wisdom, capital costs for bioenergy compare favourably with wind but less
so with other energy forms (Figure 4). The capital costs for bioenergy plants shown in Figure 4 is an
average, as costs range from that of a 30MW boiler and steam turbine ($1,600/KW making it
comparable to coal, thermal solar and wind) to that of a 1MW gasification plant with reciprocating gas
engine ($5,300/KW).
Figure 4: Average capital cost comparison per kW11
These comparisons have limitations. Most notably, they look only at electricity production and do not
take into account the unique capacity of biomass-derived energy to produce heat energy as well as
electricity (which wind turbines do not do, for example). When the heat energy produced from biomass
is fully utilised then the economics of bioenergy are significantly improved.
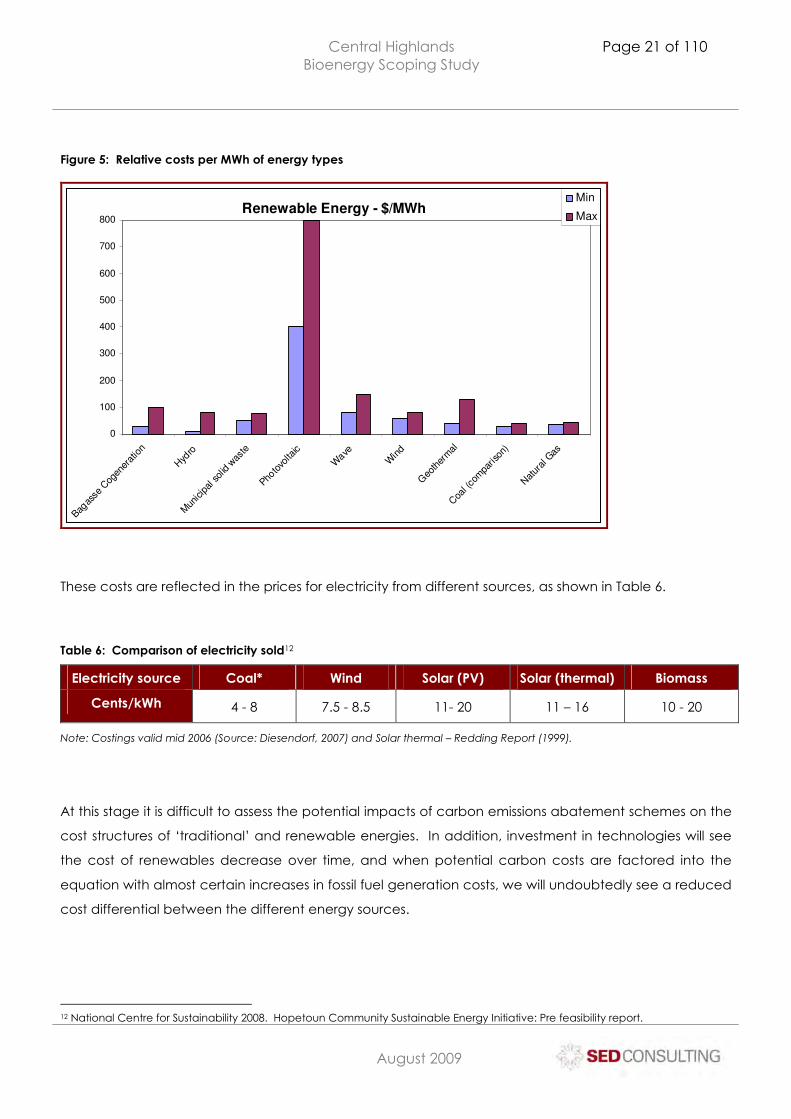
Figure 5 shows the relative costs per MWh to generate various energy types including coal and gas.
11 National Centre of Sustainability 2008: Community Renewable Energy: A Research Guide pg 16.
Central Highlands Bioenergy Scoping Study
Page 21 of 110
C:\Documents and Settings\Laurie\My Documents\Laurie\Farm Business\CHAF\Biodiesel and Bioenergy\Bioenergy\Bioenergy Working Group\Working Group Business plan\Business Plan Project\Stage 2 report\LN_CHAF Bioenergy scoping study FINAL.doc
August 2009
Figure 5: Relative costs per MWh of energy types
Renewable Energy - $/MWh
0
100
200
300
400
500
600
700
800
Bagas
se C
ogen
erat
ion
Hyd
ro
Mun
icip
al sol
id w
aste
Photo
volta
ic
Wave
Win
d
Geo
ther
mal
Coa
l (co
mpa
rison
)
Nat
ural
Gas
Min
Max
These costs are reflected in the prices for electricity from different sources, as shown in Table 6.
Table 6: Comparison of electricity sold12
Electricity source Coal* Wind Solar (PV) Solar (thermal) Biomass
Cents/kWh 4 - 8 7.5 - 8.5 11- 20 11 – 16 10 - 20
Note: Costings valid mid 2006 (Source: Diesendorf, 2007) and Solar thermal – Redding Report (1999).
At this stage it is difficult to assess the potential impacts of carbon emissions abatement schemes on the
cost structures of ‘traditional’ and renewable energies. In addition, investment in technologies will see
the cost of renewables decrease over time, and when potential carbon costs are factored into the
equation with almost certain increases in fossil fuel generation costs, we will undoubtedly see a reduced
cost differential between the different energy sources.
12 National Centre for Sustainability 2008. Hopetoun Community Sustainable Energy Initiative: Pre feasibility report.
Central Highlands Bioenergy Scoping Study
Page 22 of 110
C:\Documents and Settings\Laurie\My Documents\Laurie\Farm Business\CHAF\Biodiesel and Bioenergy\Bioenergy\Bioenergy Working Group\Working Group Business plan\Business Plan Project\Stage 2 report\LN_CHAF Bioenergy scoping study FINAL.doc
August 2009
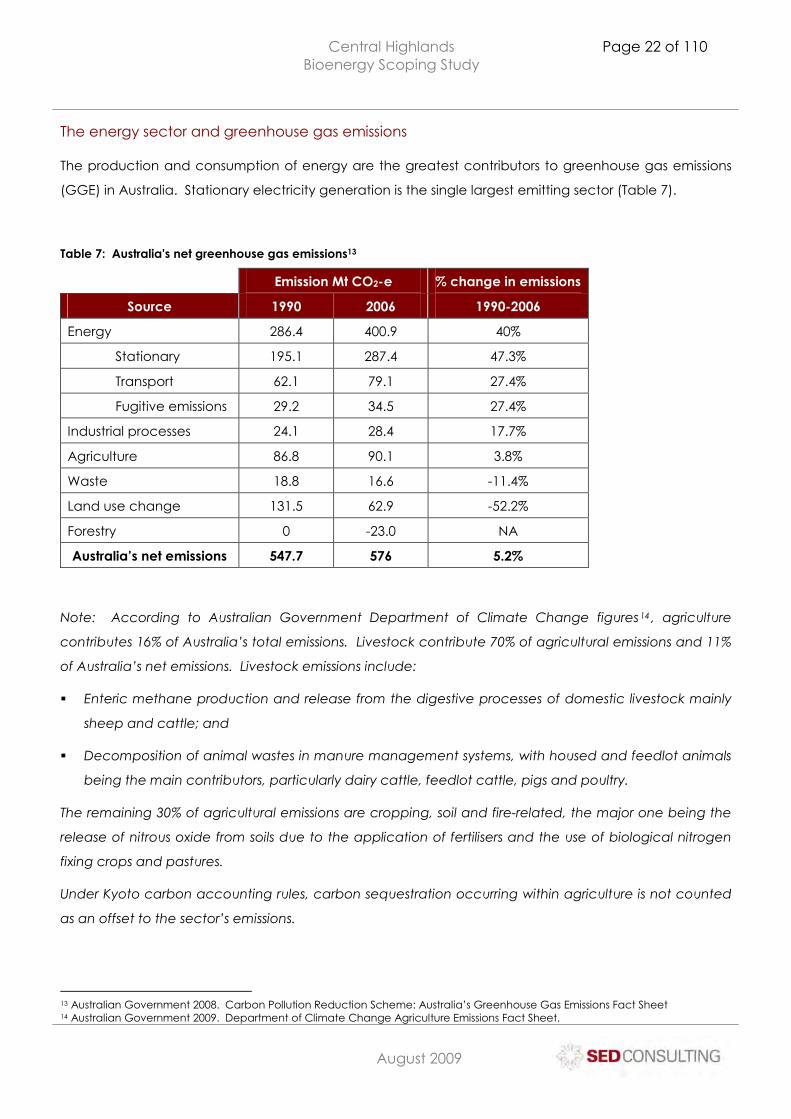
The energy sector and greenhouse gas emissions
The production and consumption of energy are the greatest contributors to greenhouse gas emissions
(GGE) in Australia. Stationary electricity generation is the single largest emitting sector (Table 7).
Table 7: Australia's net greenhouse gas emissions13
Emission Mt CO2-e % change in emissions
Source 1990 2006 1990-2006
Energy 286.4 400.9 40%
Stationary 195.1 287.4 47.3%
Transport 62.1 79.1 27.4%
Fugitive emissions 29.2 34.5 27.4%
Industrial processes 24.1 28.4 17.7%
Agriculture 86.8 90.1 3.8%
Waste 18.8 16.6 -11.4%
Land use change 131.5 62.9 -52.2%
Forestry 0 -23.0 NA
Australia’s net emissions 547.7 576 5.2%
Note: According to Australian Government Department of Climate Change figures14 , agriculture
contributes 16% of Australia’s total emissions. Livestock contribute 70% of agricultural emissions and 11%
of Australia’s net emissions. Livestock emissions include:
� Enteric methane production and release from the digestive processes of domestic livestock mainly
sheep and cattle; and
� Decomposition of animal wastes in manure management systems, with housed and feedlot animals
being the main contributors, particularly dairy cattle, feedlot cattle, pigs and poultry.
The remaining 30% of agricultural emissions are cropping, soil and fire-related, the major one being the
release of nitrous oxide from soils due to the application of fertilisers and the use of biological nitrogen
fixing crops and pastures.
Under Kyoto carbon accounting rules, carbon sequestration occurring within agriculture is not counted
as an offset to the sector’s emissions.
13 Australian Government 2008. Carbon Pollution Reduction Scheme: Australia’s Greenhouse Gas Emissions Fact Sheet 14 Australian Government 2009. Department of Climate Change Agriculture Emissions Fact Sheet.
Central Highlands Bioenergy Scoping Study
Page 23 of 110
C:\Documents and Settings\Laurie\My Documents\Laurie\Farm Business\CHAF\Biodiesel and Bioenergy\Bioenergy\Bioenergy Working Group\Working Group Business plan\Business Plan Project\Stage 2 report\LN_CHAF Bioenergy scoping study FINAL.doc
August 2009
The national political and regulatory environment
The political and regulatory environment existing at the time of this report is complex and uncertain. The
Federal Government has presented the Carbon Pollution Reduction Scheme Bill 2009 (only to have it
rejected by the Senate). The CPRS bill is tied to the bill legislating the Mandatory Renewable Energy
Target so both changes have been stalled, despite the latter having bipartisan political support. Other
pieces of policy and strategy in relation to energy, climate change and renewables are in place or
progressing.
These two sections of the report are not intended to be a fully comprehensive presentation of all related
policy and strategy, but rather an overview of the key policy statements and strategies that can or will
influence the investment, acceptance and uptake of bioenergy by business, industry, government and
households.
Carbon Pollution Reduction Scheme
The Carbon Pollution Reduction Scheme (CPRS) is the comprehensive Federal Government strategic
policy to tackle climate change based on three pillars:
� Reducing Australia’s carbon pollution;
� Adapting to unavoidable climate change; and
� Helping to shape a global solution.
The CPRS White Paper was released in December 2008 and presents the Government’s policy in relation
to 2 major elements of its mitigation strategy:
� A medium-term target of national emissions; and
� The final design of the CPRS.
In the CPRS White Paper, the Government reaffirms its commitment to meeting its long-term target of a
60% reduction in GGE from 2000 levels by 2050. In addition, it also commits to a medium-term national
target to reduce Australia’s GGE by between 5% (irrespective of actions by other nations) and 15% (in
the context of global agreements) below 2000 levels by 2020. As Australia’s primary policy on GGE
reductions, it is the intention of the Government to commence the CPRS on 1 July 2010.
How it will work
The CPRS will put a price on carbon through a ‘cap and trade’ emissions trading process to limit GGE.
The mechanics of this scheme are as follows:
� Emitters of greenhouse gases need to acquire a permit for every tonne of greenhouse gas that they
emit (expressed in units of tonnes of carbon dioxide-equivalent or tonnes CO2-e);
� The quantity of emissions produced by firms will be monitored, reported and audited;
Central Highlands Bioenergy Scoping Study
Page 24 of 110
C:\Documents and Settings\Laurie\My Documents\Laurie\Farm Business\CHAF\Biodiesel and Bioenergy\Bioenergy\Bioenergy Working Group\Working Group Business plan\Business Plan Project\Stage 2 report\LN_CHAF Bioenergy scoping study FINAL.doc
August 2009
� At the end of each year, each liable entity will need to surrender a permit for every tonne of
emissions that they produced in that year;
� The number of permits issued by the Government in each year will be limited;
� Firms will compete to purchase the number of permits that they require. Firms that value the permits
most highly will be prepared to pay the most for them, either at auction or on a secondary trading
market. For some firms, it will be cheaper to reduce emissions than to buy permits; and
� Certain categories of firms will receive an administrative allocation of permits as a transitional
assistance measure. Those firms can use the permits or sell them.
The introduction of a carbon price will present a financial incentive for investment in low-emissions
technology research, development and commercialisation. The number of tradable carbon pollution
permits will be equal to the CPRS cap. For example, if the cap were set at 100 million tonnes CO2-e in a
year, 100 million permits would be issued for that year. Entities responsible for emissions sources covered
by the CPRS will be obliged to surrender a permit for each tonne of CO2-e that they have emitted.
The CPRS will cover around 75% of Australia’s emissions and involve mandatory obligations for
approximately 1000 entities. The CPRS will cover emissions from stationary energy, transport, fugitive
industrial processes, waste and forestry sectors. A decision on the inclusion of agriculture in the scheme
will be made in 2013 for a 2015 start.
CPRS and renewables
The Government believes the CPRS will play a significant role in encouraging the adoption of low-
pollution alternatives. The Renewable Energy Target (RET – see below) requires that 20% of Australia’s
electricity be sourced from renewable generators by 2020 necessitating accelerated deployment of
renewable technology.
This process is supported by the $500 million Renewable Energy Fund which reduces the cost of
demonstrating and deploying these key technologies. Many of these renewable energy projects will be
based in regional Australia.
Policy position 6.14 in the Government’s White Paper states that CPRS obligations will not apply to
emissions from combustion of biofuels and biomass for energy including CO2-e emissions from
combustion of methane from waste landfill facilities – these will receive a zero rating.
Implications of the CPRS for local government
A 2009 briefing paper on the CPRS and associated legislation commissioned by the Australian Local
Government Association identifies the following implications of the CPRS for local government:15
15 Australian Local Government Association April 2009: Briefing Paper on Carbon Pollution Reduction Scheme Bill April 2009 and associated legislation.
Central Highlands Bioenergy Scoping Study
Page 25 of 110
C:\Documents and Settings\Laurie\My Documents\Laurie\Farm Business\CHAF\Biodiesel and Bioenergy\Bioenergy\Bioenergy Working Group\Working Group Business plan\Business Plan Project\Stage 2 report\LN_CHAF Bioenergy scoping study FINAL.doc
August 2009
� A council with operational control over a landfill with emissions exceeding 25,000 tonnes of CO2-e
per financial year will be a liable entity under the CPRS. This threshold may be reduced to 10,000t in
certain circumstances, for example where one landfill is in close proximity to another, to prevent
diversion of waste in order to keep the primary facility below the 25,000t threshold;
� As a liable entity, the council will be required to purchase and surrender eligible emission units by 15
December after the relevant financial year. Councils will need to consider how they fund this liability.
They will also be required to submit report under the National Greenhouse and Energy Reporting
Scheme (NGERS);
� Council-owned landfills that closed prior to 1 July 2008 will not be covered by the CPRS. Emissions
from waste deposited at a landfill prior to 1 July 2008 (‘legacy’ waste) will not incur a liability until
2018;
� Councils that do not have direct operational control over a landfill that is liable under the CPRS are
likely to experience increased waste disposal costs and will need to review the contractual
arrangements with the landfill operator; and
� Councils will also experience increased costs for electricity, fuel, and any other emissions-intensive
goods and services. Councils may be able to ‘opt in’ to the CPRS through reforestation activities.
Clearly, the CPRS will increase the incentives for local governments to divert material from landfill.
Options to achieve this include the capture and beneficial use of biomass such as garden waste.
The CPRS implications and responses identified by the Victorian State Government within their Climate
Change Green Paper are discussed below.
Mandatory Renewable Energy Target (MRET)
The Mandatory Renewable Energy Target (MRET) scheme has been in place since 2001. The initial MRET
of 9,600 GWh by 2010 was achieved by 2009. The next iteration of the MRET has a proposed target of
20% renewable energy or 45,000 GWh by 2020. However, despite bipartisan political support, the new
MRET has not been legislated because the bill to do so is coupled with the CPRS legislation.
The MRET requires certain proportion of the national power supply to be derived from renewable
sources such as solar, wind and bioenergy. This proportion will increase annually to reach the target 20%
by 2020. The unit of currency for the MRET is the Renewable Energy Certificate (REC). One REC is
equivalent to 1 MWh of electricity generation for a renewable source.
RECs are created, sold and transferred in the REC Registry by eligible parties including accredited
renewable energy generators and owners or agents of small generation units including solar water
heaters. In the latter case, the RECs are issued equivalent to the electricity not needing to be drawn
from the grid over a determined period. Liable parties (electricity wholesalers) must surrender, each
Central Highlands Bioenergy Scoping Study
Page 26 of 110
C:\Documents and Settings\Laurie\My Documents\Laurie\Farm Business\CHAF\Biodiesel and Bioenergy\Bioenergy\Bioenergy Working Group\Working Group Business plan\Business Plan Project\Stage 2 report\LN_CHAF Bioenergy scoping study FINAL.doc
August 2009
year in arrears, RECs equivalent to their liability. Registered RECs can be voluntarily surrendered by
parties wishing to encourage renewable energy production.
If accredited as renewable energy generators, bioenergy plants may produce RECs that can be traded
separately to any electricity used internally or sold into the grid. However, there are restrictions on the
eligibility of the wood waste used to generate renewable energy. The waste must come from sources
complying with all government requirements with regard to sustainable forestry. Wood waste from
native forests must not have been harvested with power production as its primary purpose and may be
subject to the test that the total financial value of the high-value processes must be higher than the
financial value of the other products of harvesting. Plantation timber is also subject to the test that there
is no higher-value use than bioenergy production at time of harvesting, but this provision appears set to
be overturned.
Garnaut Climate Change Review
Completed in 2008, the Garnaut Climate Change Review reported on the impacts of climate change
on the Australian economy and makes recommendations on medium to long-term policies and policy
frameworks to improve sustainability. The Garnaut Review formed the basis for the Government’s White
Paper and subsequent CPRS bill described above.
It is worth noting here a reference made by the Garnaut Review to bioenergy. In section 22.3.5 (‘other
forms of bioenergy’), the report comments that biomass could form the basis for ‘negative emissions’
energy if linked to carbon capture and storage or secure storage of biochar. Specifically:
‘Polgasse et all (2008) assessed the potential economic outcomes and environmental impacts across
Australia of agroforestry for dedicated bioenergy and integrated tree processing (that is, integrated
production of bioenergy, activated carbon and eucalyptus oil) based on various species of mallee and
other eucalyptus. They conclude that dedicated bioenergy and integrated tree processing systems are
unlikely to be profitable unless they are close to processing facilities. This is due to the high cost of
production (harvesting and transport) relative to the low product price for wood energy. Lehmann
(2007) suggests that, in the United States, biochar production in conjunction with bioenergy from
pyrolysis could be economically attractive at an emissions permit price of US$37 per tonne’.
It is worth noting that, under the CPRS, the Government has decided to set an emission price cap for 5
years of AU$40 per tonne at CPRS commencement, rising at 5% real per year. The assumed initial
emission price is anticipated to be approximately AU$25, but Australia’s emission price will be
determined by the global price if there are no restrictions on international emissions trade.
Australian Bioenergy Roadmap
Although not a Government document, the Clean Energy Council’s (CEC’s) Australian Bioenergy
Roadmap is worth mentioning here.
Central Highlands Bioenergy Scoping Study
Page 27 of 110
C:\Documents and Settings\Laurie\My Documents\Laurie\Farm Business\CHAF\Biodiesel and Bioenergy\Bioenergy\Bioenergy Working Group\Working Group Business plan\Business Plan Project\Stage 2 report\LN_CHAF Bioenergy scoping study FINAL.doc
August 2009
The CEC is described on its web site16 as being an amalgamation of the Australian Wind Energy Industry
Association (Auswind) and the Australian Business Council for Sustainable Energy (BCSE). Its membership
includes over 400 businesses covering a quarter of Australia's total electricity production including gas,
wind, hydro, bioenergy, solar photovoltaic, solar hot water, biomass, geothermal and cogeneration.
The CRC received funding from the Australian Government to develop the Roadmap in September
200817. The report was developed in partnership with the bioenergy sector to set the strategy to build
the Australian bioenergy industry by 2020. In addition to the overall strategy, the report developed the
accompanying Biomass Resource Appraisal18. The BRA assesses the type and level of biomass resource
availability in Australia using a ‘bottom-up’ approach focusing on biomass resources that have strong
potential to be matched with technologies that can contribute to stationary energy supplies.
Key Roadmap objectives are:
� To create a self-sustaining bioenergy industry through increased industry advocacy and developing
skills, knowledge and capacity;
� To increase the public profile of bioenergy to mirror that achieved by wind and solar power and to
achieve policy equity when measured against other renewables (including a valuing of heat
energy);
� To encourage long-term investments by the renewable energy industry through a policy framework
that provides surety and reduces competitive disadvantage;
� To ensure that supplies of biomass resources are secure to attract and support long-term investment;
and
� To secure full-value for the National Energy Market (NEM) or other Australian grids that connect to
bioenergy generators.
The Roadmap argues the potential of the bioenergy industry to deliver renewable energy generation in
Australia and provides strategic recommendations to achieve that potential. The extent to which these
recommendations have been followed is not known to the authors of this Study but the Roadmap
certainly provides a solid foundation for a national bioenergy approach.
The Victorian political and regulatory environment
Victorian Climate Change Green Paper
The Victorian State Government published its Victorian Climate Change Green Paper (VCCGP) in June
2009. The paper intends to respond to and complement the CPRS and deliver a framework to give
16 www.cleanenergycouncil.org.au 17 Clean Energy Council 2008. Australian Bioenergy Roadmap: Setting the direction for biomass in stationery energy to 2020 and beyond. ISBN: 978-0-9805646-1-7 18 Clean Energy Council 2008. Biomass: Resource Appraisal. ISBN: 978-0-9805646-1-7
Central Highlands Bioenergy Scoping Study
Page 28 of 110
C:\Documents and Settings\Laurie\My Documents\Laurie\Farm Business\CHAF\Biodiesel and Bioenergy\Bioenergy\Bioenergy Working Group\Working Group Business plan\Business Plan Project\Stage 2 report\LN_CHAF Bioenergy scoping study FINAL.doc
August 2009
Victoria a competitive edge in a low-carbon economy, secure new markets and generate new jobs.
The framework for State action is presented under the following themes and actions:
� Complementing the CPRS to drive emissions abatement in areas of market failure or those sectors
not covered by the CPRS. In particular the VCCGP will address specific opportunities in energy,
transport, built environment, waster, water, agriculture and ecosystems;
� Positioning Victoria to take advantage of the opportunities created by the transition to a carbon
constrained economy. The objective is to maximise the potential of the green economy by
attracting investment and creating employment opportunities. The VCCGP also aims to facilitate
community-led initiatives to encourage households and business to adopt cost-effective energy
efficiency initiatives; and
� Adapting to the impacts of climate change we can no longer avoid. The State Government will
take a leadership role in ensuring that business, households and communities can understand and
prepare for climate change pressures through a mix of policies and resources. This will also require
new thinking around management of natural resources and delivery models for public services.
The impacts of climate change for Victoria
The VCCGP provides some important detail and scenarios around potential impacts of climate change
on Victoria. It states that between 1950 and 2007 the daily maximum temperatures in Victoria increased
by about 0.80C with 2007 being the warmest year on record with a mean annual temperature around
1.20C above the long-term average. It is expected that Victoria will warm at a slightly faster rate than
the global average particularly in the north and east of the state. It is expected that, by 2030, the
annual average temperature will increase by a further 0.80C on 1990 levels (based on a modelled range
of 0.60C to 1.20C). The VCCGP details the potential impacts of these temperature scenarios as
presented in Table 8.
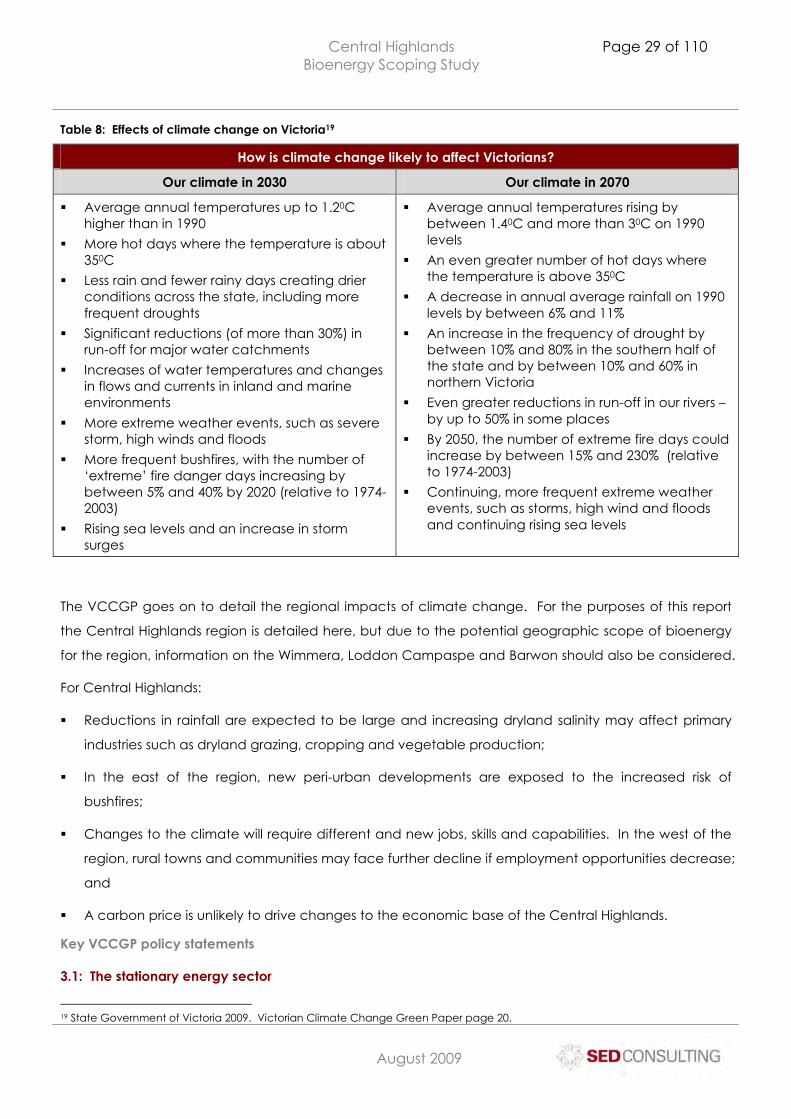
Central Highlands Bioenergy Scoping Study
Page 29 of 110
C:\Documents and Settings\Laurie\My Documents\Laurie\Farm Business\CHAF\Biodiesel and Bioenergy\Bioenergy\Bioenergy Working Group\Working Group Business plan\Business Plan Project\Stage 2 report\LN_CHAF Bioenergy scoping study FINAL.doc
August 2009
Table 8: Effects of climate change on Victoria19
How is climate change likely to affect Victorians?
Our climate in 2030 Our climate in 2070
� Average annual temperatures up to 1.20C higher than in 1990
� More hot days where the temperature is about 350C
� Less rain and fewer rainy days creating drier conditions across the state, including more frequent droughts
� Significant reductions (of more than 30%) in run-off for major water catchments
� Increases of water temperatures and changes in flows and currents in inland and marine environments
� More extreme weather events, such as severe storm, high winds and floods
� More frequent bushfires, with the number of ‘extreme’ fire danger days increasing by between 5% and 40% by 2020 (relative to 1974-2003)
� Rising sea levels and an increase in storm surges
� Average annual temperatures rising by between 1.40C and more than 30C on 1990 levels
� An even greater number of hot days where the temperature is above 350C
� A decrease in annual average rainfall on 1990 levels by between 6% and 11%
� An increase in the frequency of drought by between 10% and 80% in the southern half of the state and by between 10% and 60% in northern Victoria
� Even greater reductions in run-off in our rivers – by up to 50% in some places
� By 2050, the number of extreme fire days could increase by between 15% and 230% (relative to 1974-2003)
� Continuing, more frequent extreme weather events, such as storms, high wind and floods and continuing rising sea levels
The VCCGP goes on to detail the regional impacts of climate change. For the purposes of this report
the Central Highlands region is detailed here, but due to the potential geographic scope of bioenergy
for the region, information on the Wimmera, Loddon Campaspe and Barwon should also be considered.
For Central Highlands:
� Reductions in rainfall are expected to be large and increasing dryland salinity may affect primary
industries such as dryland grazing, cropping and vegetable production;
� In the east of the region, new peri-urban developments are exposed to the increased risk of
bushfires;
� Changes to the climate will require different and new jobs, skills and capabilities. In the west of the
region, rural towns and communities may face further decline if employment opportunities decrease;
and
� A carbon price is unlikely to drive changes to the economic base of the Central Highlands.
Key VCCGP policy statements
3.1: The stationary energy sector
19 State Government of Victoria 2009. Victorian Climate Change Green Paper page 20.
Central Highlands Bioenergy Scoping Study
Page 30 of 110
C:\Documents and Settings\Laurie\My Documents\Laurie\Farm Business\CHAF\Biodiesel and Bioenergy\Bioenergy\Bioenergy Working Group\Working Group Business plan\Business Plan Project\Stage 2 report\LN_CHAF Bioenergy scoping study FINAL.doc
August 2009
‘As a major contributor to Victoria’s overall greenhouse gas emissions, the stationary energy sector will
need to undergo a major transformation to make the transition to lower emissions future.’
The State Government’s main objectives for the stationary energy sector into the future are:
� Support the provision of an efficient, reliable, safe and secure energy system that recognises and
addresses the need to reduce greenhouse gas emissions;
� Maintain access to energy by ensuring a fair, competitive market;
� Promote energy supply and use that is environmentally sustainable and less greenhouse intensive;
and
� Address planning barriers to the promotion and uptake of low carbon energy forms.
Under the CPRS, the Victorian Government has access to a range of measures to facilitate the
transformation of the stationary energy sector in the state including:
� Direct investment in large-scale low-emission energy projects;
� Regulation and removal of regulatory barriers, for example wind farm planning approvals and
regulatory framework for the operation of new technologies such as carbon capture and storage;
� Innovation and research and development support, for example the Energy Technology Innovation
Strategy;
� Information provision and market facilitation such as mapping of energy resources across Victoria
and developing and promoting the business case for investment; and
� Skill development and training to provide the new skills that will be required for low-emissions energy
industries.
The VCCGP asks ‘What might Victoria’s energy system look like in 10 years?’ Of particular relevance to
this report is the following statement.
Small and large business will also be much more energy efficient. In 10 years, the Carbon Pollution
Reduction Scheme will be transforming our energy sector – with a clear limit on the amount of carbon
emissions industry can emit and companies actively trading permits for emissions. Many companies will
have taken action to reduce their emissions, rather than buy permits. The investment of billions of dollars
in innovative low emission energy technologies will be reducing greenhouse gas emissions, maintaining
a secure energy supply and creating thousands of ‘green’ jobs. Government will have clearly
articulated a strategy to ensure that future infrastructure investment in response to the CPRS is efficient
from an economy wide perspective and to facilitate appropriate investments through a stream-lined
planning and approvals framework.
Central Highlands Bioenergy Scoping Study
Page 31 of 110
C:\Documents and Settings\Laurie\My Documents\Laurie\Farm Business\CHAF\Biodiesel and Bioenergy\Bioenergy\Bioenergy Working Group\Working Group Business plan\Business Plan Project\Stage 2 report\LN_CHAF Bioenergy scoping study FINAL.doc
August 2009
While there will still be concerns about new energy developments, most Victorians will welcome the use
of more sustainable energy generation – generation that is taking place, in some cases, closer to
communities.
The national Renewable Energy Target scheme will have driven investment in renewable energy
generation. Almost 20 per cent of Victoria’s electricity consumption will come from renewable sources
(up from less than 5 per cent in 2009). Although many different technologies will be in use – or being
trialled – most new renewable energy supply will be from wind, with supply from bagasse, waste,
geothermal and large-scale solar energy plants also expanding. Renewable energy will be more
competitive with coal and gas-fired generation technology, and research and development into
energy generation and efficiency will be opening up exciting new options.20
3.5: Solid waste management
‘The solid waste management sector plays a vital role in Victoria’s economy, society and environment.
It ensures the safe and hygienic disposal of the waste generated as a result of our everyday activities.
New waste technologies will also be a key part of Victoria’s Green Economy.’
The decomposition of garden and food wastes, paper products and timber is a primary source of
emissions for the waste management sector. Decomposition occurs mainly in landfills producing
methane gas, which has 21 times the global warming potential of carbon dioxide.
To make new waste management technologies and processes workable, a range of supply chain and
market settings need to be established. These include efficient processes for waste separation, pricing
of landfill and the development of markets for end-products.
The $10 million Victorian Advanced Resource Recovery Initiative will create partnerships between and
the State and local governments to build and demonstrate the business cases for new waste
technologies investment.
VCCGP next steps
Following the publication of the VCCGP in June 2009, the Government will seek comment on the Green
Paper through June to September 2009 and will consider feedback and comments from June 2009 to
October 2009. In late 2009, the Government will release a White Paper which will detail its final policy
position and will also release a draft Climate Change Bill to complement the White Paper’s policies and
actions.
20 State Government of Victoria 2009. Victorian Climate Change Green Paper, page 20.
Central Highlands Bioenergy Scoping Study
Page 32 of 110
C:\Documents and Settings\Laurie\My Documents\Laurie\Farm Business\CHAF\Biodiesel and Bioenergy\Bioenergy\Bioenergy Working Group\Working Group Business plan\Business Plan Project\Stage 2 report\LN_CHAF Bioenergy scoping study FINAL.doc
August 2009
Victorian Renewable Energy Target
The Victorian Renewable Energy Target (VRET) commenced in 2007. It is similar in principle to the
national scheme described above. The Victorian legislation seeks to deliver a 10% market share for
renewables in Victoria by 201621.
The current Commonwealth bill to expand the Mandatory Renewable Energy Target (see above) will
subsume the Victorian RET legislation (and that of other states). There are transition provisions in the
draft legislation regarding the transfer of accredited generators and state-based RECs to the
Commonwealth scheme.
Energy for Victoria
In 2002, the Victorian State Government released its Energy for Victoria policy and strategy statement.22
The objectives of the energy policy are to:
� Ensure an efficient and secure energy system. This requires ongoing investment in both supplies and
the efficient use of those supplies. We need to provide for the state’s economic and social
wellbeing as cost-effectively as possible;
� Ensure those supplies are delivered reliably and safely. The reliable distribution of energy –
particularly electricity, which cannot be stored on a significant scale – is an ongoing challenge.
Fossil fuels and electricity are inherently hazardous, so they must be distributed and used safely;
� Ensure consumers can access energy at affordable prices. The Government is committed to
ensuring all consumers, especially low income earners, can access essential energy services at
affordable prices; and
� Ensure our energy supplies and the way we use them are environmentally sustainable – and in
particular less greenhouse intensive. Achieving sustainability is a key challenge for Victoria. We
generate most of our low cost electricity from brown coal, which brings major economic benefits
but also contributes about half of our greenhouse gas emissions. We have to find ways to ensure our
mix of energy sources and our use of them minimises damage to the environment and economy
and in particular reduce the intensity of our greenhouse emissions.
Towards Zero Waste Strategy
The Victorian Government released its Sustainability in Action: Toward Zero Waste Strategy (TZW) in 2005.
The TZW contain a range of strategies to be implemented over a 10-year period to minimise the
generation of waste and to maximise reuse. The strategy focuses on municipal, industry and business
21 www.dpi.vic.gov.au/dpi/dpinenergy.nsf/childdocs/-3F827E74C37E0836CA25729D00101EB0-866B51F390263BA1CA2572B2001634F9-2D9B7B1F0DF350AECA2572B2001974E2?open 22 The State of Victoria, Department of Natural Resources and Environment, 2002. Energy for Victoria: A Statement by the Minister for Energy and Resources. ISBN 1 74106 298 5
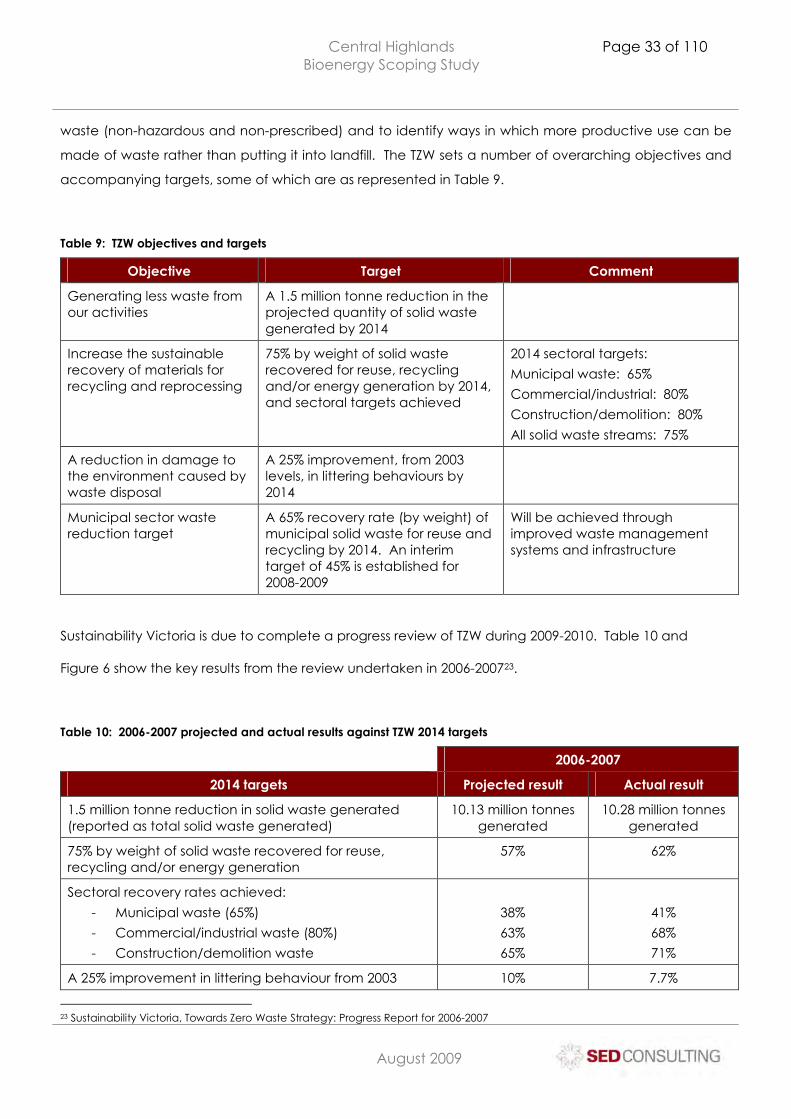
Central Highlands Bioenergy Scoping Study
Page 33 of 110
C:\Documents and Settings\Laurie\My Documents\Laurie\Farm Business\CHAF\Biodiesel and Bioenergy\Bioenergy\Bioenergy Working Group\Working Group Business plan\Business Plan Project\Stage 2 report\LN_CHAF Bioenergy scoping study FINAL.doc
August 2009
waste (non-hazardous and non-prescribed) and to identify ways in which more productive use can be
made of waste rather than putting it into landfill. The TZW sets a number of overarching objectives and
accompanying targets, some of which are as represented in Table 9.
Table 9: TZW objectives and targets
Objective Target Comment
Generating less waste from our activities
A 1.5 million tonne reduction in the projected quantity of solid waste generated by 2014
Increase the sustainable recovery of materials for recycling and reprocessing
75% by weight of solid waste recovered for reuse, recycling and/or energy generation by 2014, and sectoral targets achieved
2014 sectoral targets:
Municipal waste: 65%
Commercial/industrial: 80%
Construction/demolition: 80%
All solid waste streams: 75%
A reduction in damage to the environment caused by waste disposal
A 25% improvement, from 2003 levels, in littering behaviours by 2014
Municipal sector waste reduction target
A 65% recovery rate (by weight) of municipal solid waste for reuse and recycling by 2014. An interim target of 45% is established for 2008-2009
Will be achieved through improved waste management systems and infrastructure
Sustainability Victoria is due to complete a progress review of TZW during 2009-2010. Table 10 and
Figure 6 show the key results from the review undertaken in 2006-200723.
Table 10: 2006-2007 projected and actual results against TZW 2014 targets
2006-2007
2014 targets Projected result Actual result
1.5 million tonne reduction in solid waste generated (reported as total solid waste generated)
10.13 million tonnes generated
10.28 million tonnes generated
75% by weight of solid waste recovered for reuse, recycling and/or energy generation
57% 62%
Sectoral recovery rates achieved:
- Municipal waste (65%)
- Commercial/industrial waste (80%)
- Construction/demolition waste
38%
63%
65%
41%
68%
71%
A 25% improvement in littering behaviour from 2003 10% 7.7%
23 Sustainability Victoria, Towards Zero Waste Strategy: Progress Report for 2006-2007
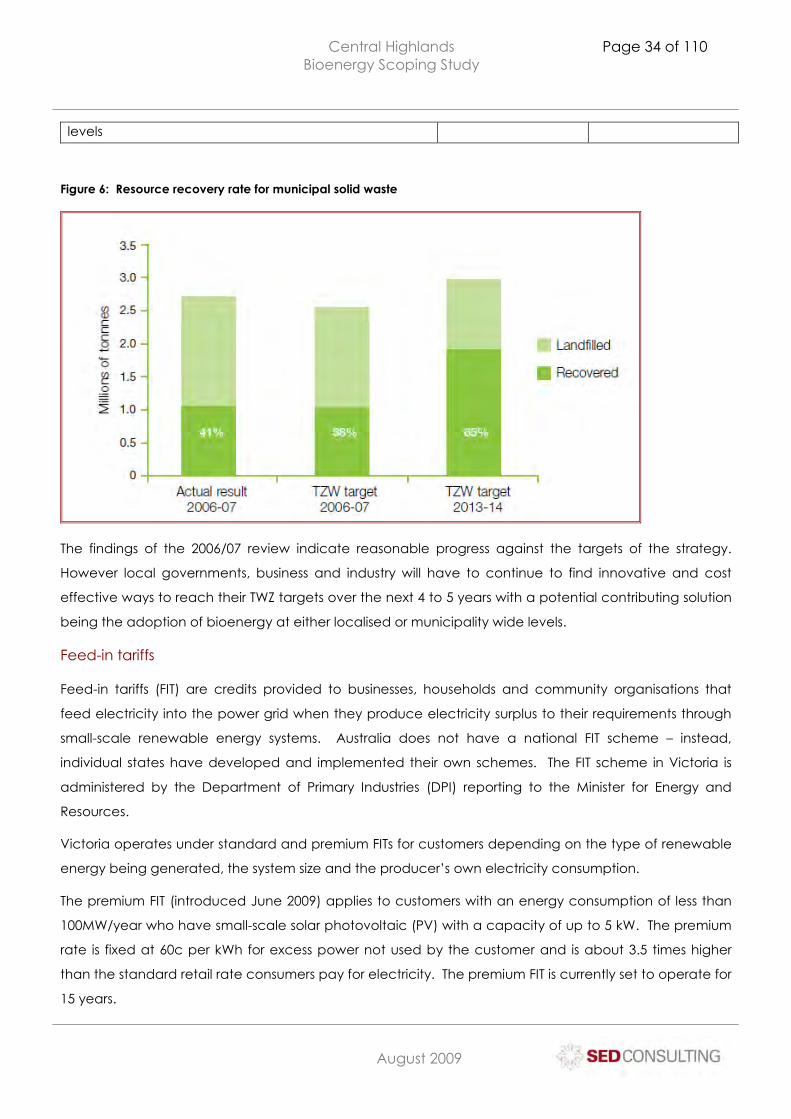
Central Highlands Bioenergy Scoping Study
Page 34 of 110
C:\Documents and Settings\Laurie\My Documents\Laurie\Farm Business\CHAF\Biodiesel and Bioenergy\Bioenergy\Bioenergy Working Group\Working Group Business plan\Business Plan Project\Stage 2 report\LN_CHAF Bioenergy scoping study FINAL.doc
August 2009
levels
Figure 6: Resource recovery rate for municipal solid waste
The findings of the 2006/07 review indicate reasonable progress against the targets of the strategy.
However local governments, business and industry will have to continue to find innovative and cost
effective ways to reach their TWZ targets over the next 4 to 5 years with a potential contributing solution
being the adoption of bioenergy at either localised or municipality wide levels.
Feed-in tariffs
Feed-in tariffs (FIT) are credits provided to businesses, households and community organisations that
feed electricity into the power grid when they produce electricity surplus to their requirements through
small-scale renewable energy systems. Australia does not have a national FIT scheme – instead,
individual states have developed and implemented their own schemes. The FIT scheme in Victoria is
administered by the Department of Primary Industries (DPI) reporting to the Minister for Energy and
Resources.
Victoria operates under standard and premium FITs for customers depending on the type of renewable
energy being generated, the system size and the producer’s own electricity consumption.
The premium FIT (introduced June 2009) applies to customers with an energy consumption of less than
100MW/year who have small-scale solar photovoltaic (PV) with a capacity of up to 5 kW. The premium
rate is fixed at 60c per kWh for excess power not used by the customer and is about 3.5 times higher
than the standard retail rate consumers pay for electricity. The premium FIT is currently set to operate for
15 years.
Central Highlands Bioenergy Scoping Study
Page 35 of 110
C:\Documents and Settings\Laurie\My Documents\Laurie\Farm Business\CHAF\Biodiesel and Bioenergy\Bioenergy\Bioenergy Working Group\Working Group Business plan\Business Plan Project\Stage 2 report\LN_CHAF Bioenergy scoping study FINAL.doc
August 2009
The ongoing standard FIT is available to customers producing power under renewable energy systems
with a capacity of up to 100 kW including power generated through wind, solar, hydro or bioenergy.
Excess power fed back into the grid under the standard FIT is credited at the same retail rate charged
for electricity consumed. As the premium FIT only applies to PV systems, the standard FIT scheme is the
applicable scheme for this report.
Individual agreements are entered into with electricity retailers which will vary from retailer to retailer.
Careful assessment of terms and conditions should be undertaken before entering into an agreement
for a FIT scheme.
Summary of possible policy implications
Clearly, current developments in climate change, energy and waste policy at Commonwealth and
State levels are pointing to an environment much more conducive to investment in renewable energies
including bioenergy.
However, there are many unknowns at this stage, and these will make difficult precise business planning
for a bioenergy initiative. The uncertainties include:
� The timing and precise form of the CPRS;
� Revisions and reviews of the VCCGP;
� The carbon price;
� Levels of government funding and development grants for renewable energy systems and in
particular support for non-wind and solar systems for business, industry and local governments; and
� Development of clear policies and actions for reaching stated targets of energy production by
renewables and in particular bioenergy which currently contributes towards 0.9% of energy
production in Australia with a target of just under 4% by 2020, in effect requiring a tripling of this
contribution in less than 10 years.
Renewable energy in Australia and Victoria
To address the issues of global warming, climate change and the finite resources of fossil fuels globally,
countries across the globe are focusing on the development of renewable energy. This section of the
Study describes the major forms of renewable energy generation (electricity, heat and fuel).
According to figures from the Department of Environment, Water, Heritage and the Arts (DEWHA), there
are over 630 renewable electricity power stations in Australia with a total capacity of 11,000 MW (Figure
7).
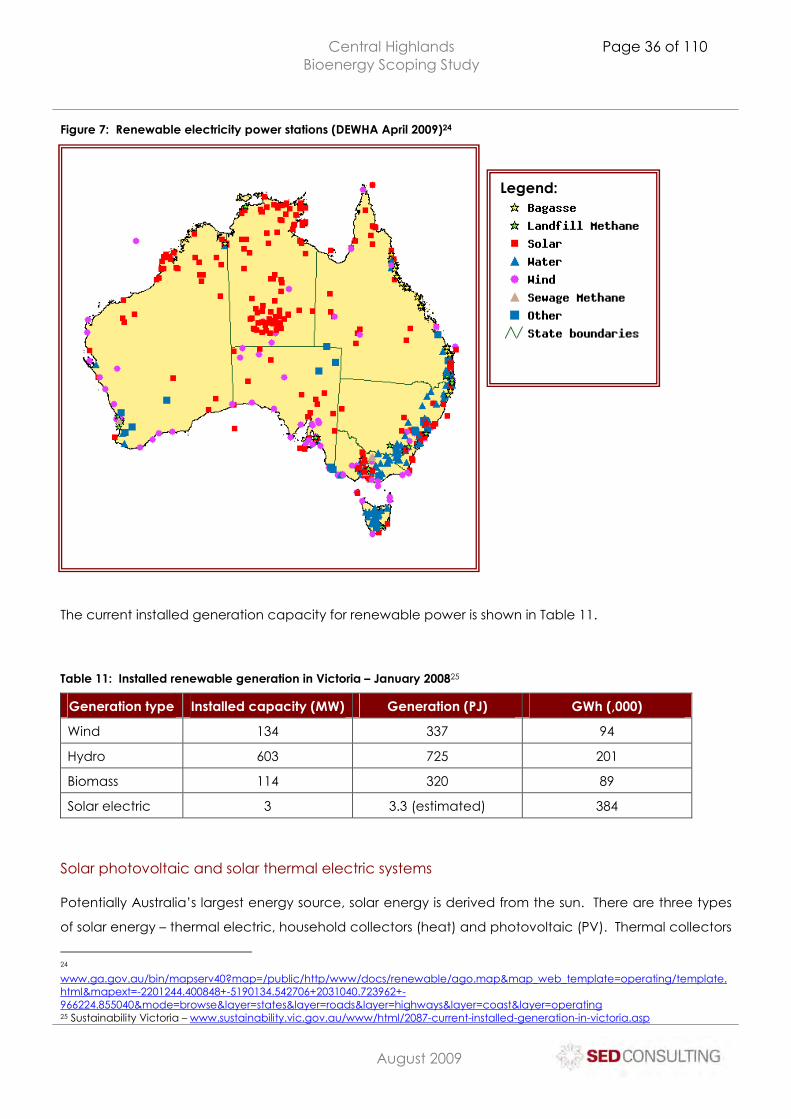
Central Highlands Bioenergy Scoping Study
Page 36 of 110
C:\Documents and Settings\Laurie\My Documents\Laurie\Farm Business\CHAF\Biodiesel and Bioenergy\Bioenergy\Bioenergy Working Group\Working Group Business plan\Business Plan Project\Stage 2 report\LN_CHAF Bioenergy scoping study FINAL.doc
August 2009
Figure 7: Renewable electricity power stations (DEWHA April 2009)24
The current installed generation capacity for renewable power is shown in Table 11.
Table 11: Installed renewable generation in Victoria – January 200825
Generation type Installed capacity (MW) Generation (PJ) GWh (,000)
Wind 134 337 94
Hydro 603 725 201
Biomass 114 320 89
Solar electric 3 3.3 (estimated) 384
Solar photovoltaic and solar thermal electric systems
Potentially Australia’s largest energy source, solar energy is derived from the sun. There are three types
of solar energy – thermal electric, household collectors (heat) and photovoltaic (PV). Thermal collectors
24 www.ga.gov.au/bin/mapserv40?map=/public/http/www/docs/renewable/ago.map&map_web_template=operating/template.html&mapext=-2201244.400848+-5190134.542706+2031040.723962+-966224.855040&mode=browse&layer=states&layer=roads&layer=highways&layer=coast&layer=operating 25 Sustainability Victoria – www.sustainability.vic.gov.au/www/html/2087-current-installed-generation-in-victoria.asp
Legend:
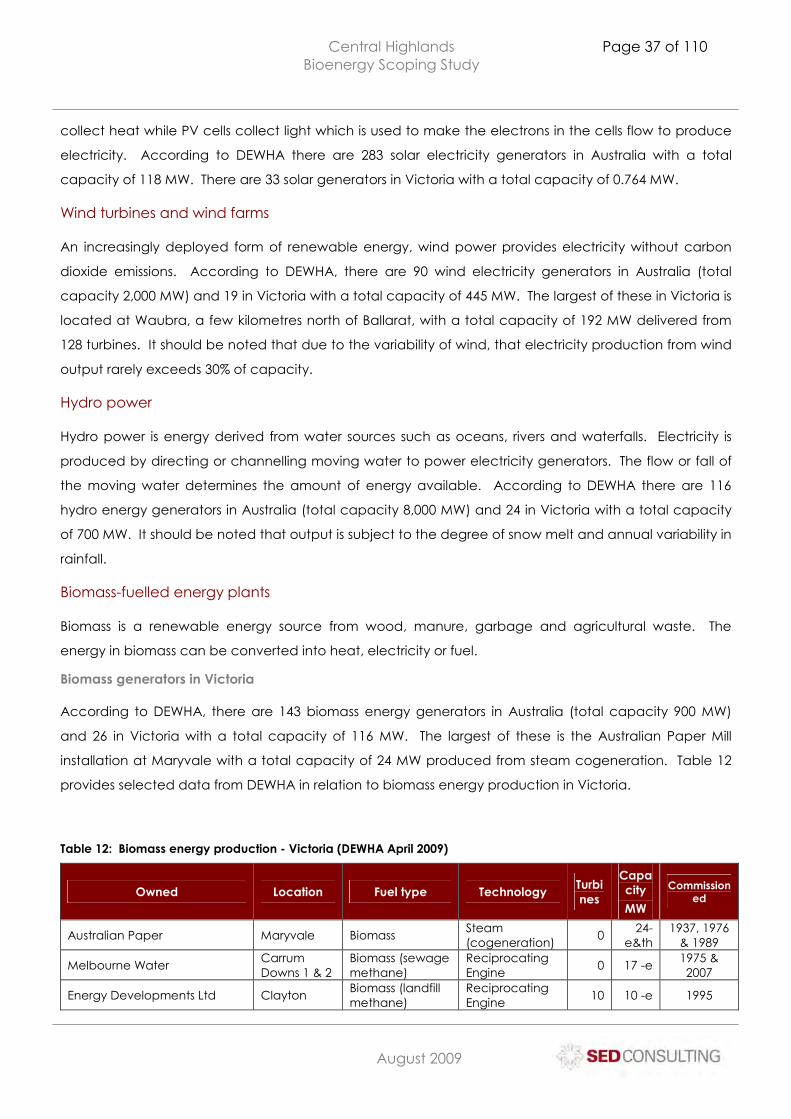
Central Highlands Bioenergy Scoping Study
Page 37 of 110
C:\Documents and Settings\Laurie\My Documents\Laurie\Farm Business\CHAF\Biodiesel and Bioenergy\Bioenergy\Bioenergy Working Group\Working Group Business plan\Business Plan Project\Stage 2 report\LN_CHAF Bioenergy scoping study FINAL.doc
August 2009
collect heat while PV cells collect light which is used to make the electrons in the cells flow to produce
electricity. According to DEWHA there are 283 solar electricity generators in Australia with a total
capacity of 118 MW. There are 33 solar generators in Victoria with a total capacity of 0.764 MW.
Wind turbines and wind farms
An increasingly deployed form of renewable energy, wind power provides electricity without carbon
dioxide emissions. According to DEWHA, there are 90 wind electricity generators in Australia (total
capacity 2,000 MW) and 19 in Victoria with a total capacity of 445 MW. The largest of these in Victoria is
located at Waubra, a few kilometres north of Ballarat, with a total capacity of 192 MW delivered from
128 turbines. It should be noted that due to the variability of wind, that electricity production from wind
output rarely exceeds 30% of capacity.
Hydro power
Hydro power is energy derived from water sources such as oceans, rivers and waterfalls. Electricity is
produced by directing or channelling moving water to power electricity generators. The flow or fall of
the moving water determines the amount of energy available. According to DEWHA there are 116
hydro energy generators in Australia (total capacity 8,000 MW) and 24 in Victoria with a total capacity
of 700 MW. It should be noted that output is subject to the degree of snow melt and annual variability in
rainfall.
Biomass-fuelled energy plants
Biomass is a renewable energy source from wood, manure, garbage and agricultural waste. The
energy in biomass can be converted into heat, electricity or fuel.
Biomass generators in Victoria
According to DEWHA, there are 143 biomass energy generators in Australia (total capacity 900 MW)
and 26 in Victoria with a total capacity of 116 MW. The largest of these is the Australian Paper Mill
installation at Maryvale with a total capacity of 24 MW produced from steam cogeneration. Table 12
provides selected data from DEWHA in relation to biomass energy production in Victoria.
Table 12: Biomass energy production - Victoria (DEWHA April 2009)
Owned Location Fuel type Technology Turbines
Capacity
MW
Commissioned
Australian Paper Maryvale Biomass Steam (cogeneration)
0 24-e&th
1937, 1976 & 1989
Melbourne Water Carrum Downs 1 & 2
Biomass (sewage methane)
Reciprocating Engine
0 17 -e 1975 & 2007
Energy Developments Ltd Clayton Biomass (landfill methane)
Reciprocating Engine
10 10 -e 1995
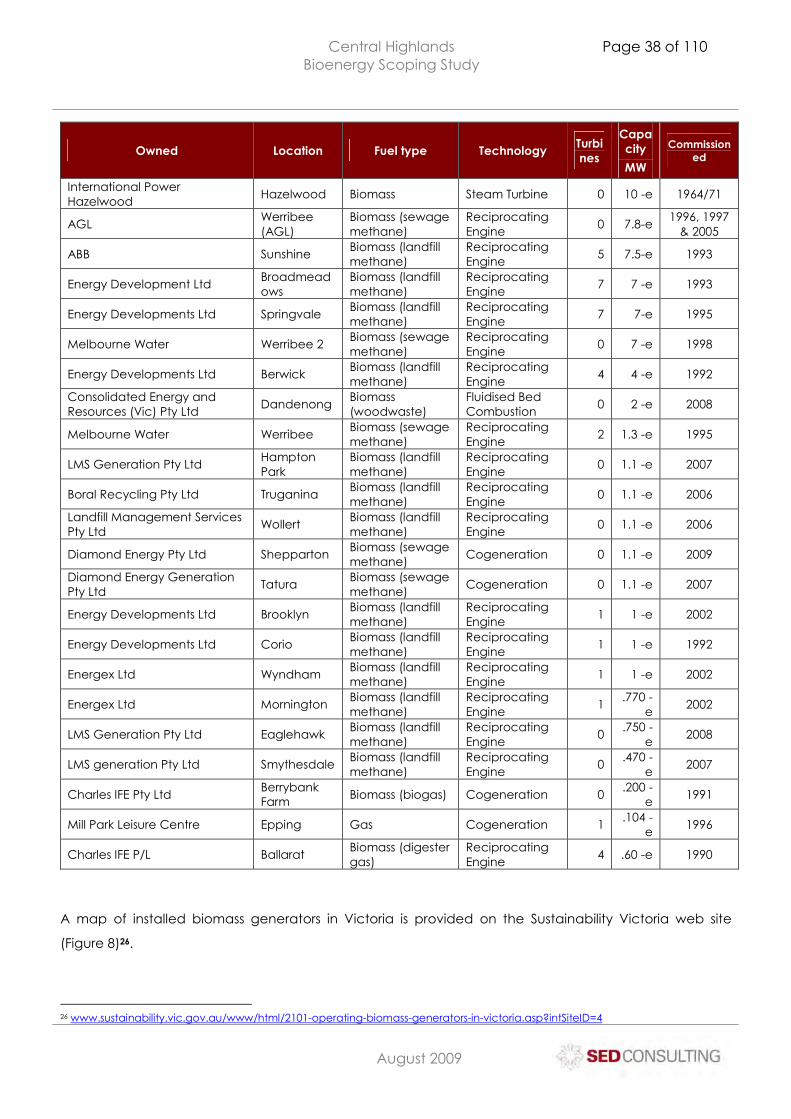
Central Highlands Bioenergy Scoping Study
Page 38 of 110
C:\Documents and Settings\Laurie\My Documents\Laurie\Farm Business\CHAF\Biodiesel and Bioenergy\Bioenergy\Bioenergy Working Group\Working Group Business plan\Business Plan Project\Stage 2 report\LN_CHAF Bioenergy scoping study FINAL.doc
August 2009
Owned Location Fuel type Technology Turbines
Capacity
MW
Commissioned
International Power Hazelwood
Hazelwood Biomass Steam Turbine 0 10 -e 1964/71
AGL Werribee (AGL)
Biomass (sewage methane)
Reciprocating Engine
0 7.8-e 1996, 1997 & 2005
ABB Sunshine Biomass (landfill methane)
Reciprocating Engine
5 7.5-e 1993
Energy Development Ltd Broadmeadows
Biomass (landfill methane)
Reciprocating Engine
7 7 -e 1993
Energy Developments Ltd Springvale Biomass (landfill methane)
Reciprocating Engine
7 7-e 1995
Melbourne Water Werribee 2 Biomass (sewage methane)
Reciprocating Engine
0 7 -e 1998
Energy Developments Ltd Berwick Biomass (landfill methane)
Reciprocating Engine
4 4 -e 1992
Consolidated Energy and Resources (Vic) Pty Ltd
Dandenong Biomass (woodwaste)
Fluidised Bed Combustion
0 2 -e 2008
Melbourne Water Werribee Biomass (sewage methane)
Reciprocating Engine
2 1.3 -e 1995
LMS Generation Pty Ltd Hampton Park
Biomass (landfill methane)
Reciprocating Engine
0 1.1 -e 2007
Boral Recycling Pty Ltd Truganina Biomass (landfill methane)
Reciprocating Engine
0 1.1 -e 2006
Landfill Management Services Pty Ltd
Wollert Biomass (landfill methane)
Reciprocating Engine
0 1.1 -e 2006
Diamond Energy Pty Ltd Shepparton Biomass (sewage methane)
Cogeneration 0 1.1 -e 2009
Diamond Energy Generation Pty Ltd
Tatura Biomass (sewage methane)
Cogeneration 0 1.1 -e 2007
Energy Developments Ltd Brooklyn Biomass (landfill methane)
Reciprocating Engine
1 1 -e 2002
Energy Developments Ltd Corio Biomass (landfill methane)
Reciprocating Engine
1 1 -e 1992
Energex Ltd Wyndham Biomass (landfill methane)
Reciprocating Engine
1 1 -e 2002
Energex Ltd Mornington Biomass (landfill methane)
Reciprocating Engine
1 .770 -
e 2002
LMS Generation Pty Ltd Eaglehawk Biomass (landfill methane)
Reciprocating Engine
0 .750 -
e 2008
LMS generation Pty Ltd Smythesdale Biomass (landfill methane)
Reciprocating Engine
0 .470 -
e 2007
Charles IFE Pty Ltd Berrybank Farm
Biomass (biogas) Cogeneration 0 .200 -
e 1991
Mill Park Leisure Centre Epping Gas Cogeneration 1 .104 -
e 1996
Charles IFE P/L Ballarat Biomass (digester gas)
Reciprocating Engine
4 .60 -e 1990
A map of installed biomass generators in Victoria is provided on the Sustainability Victoria web site
(Figure 8)26.
26 www.sustainability.vic.gov.au/www/html/2101-operating-biomass-generators-in-victoria.asp?intSiteID=4
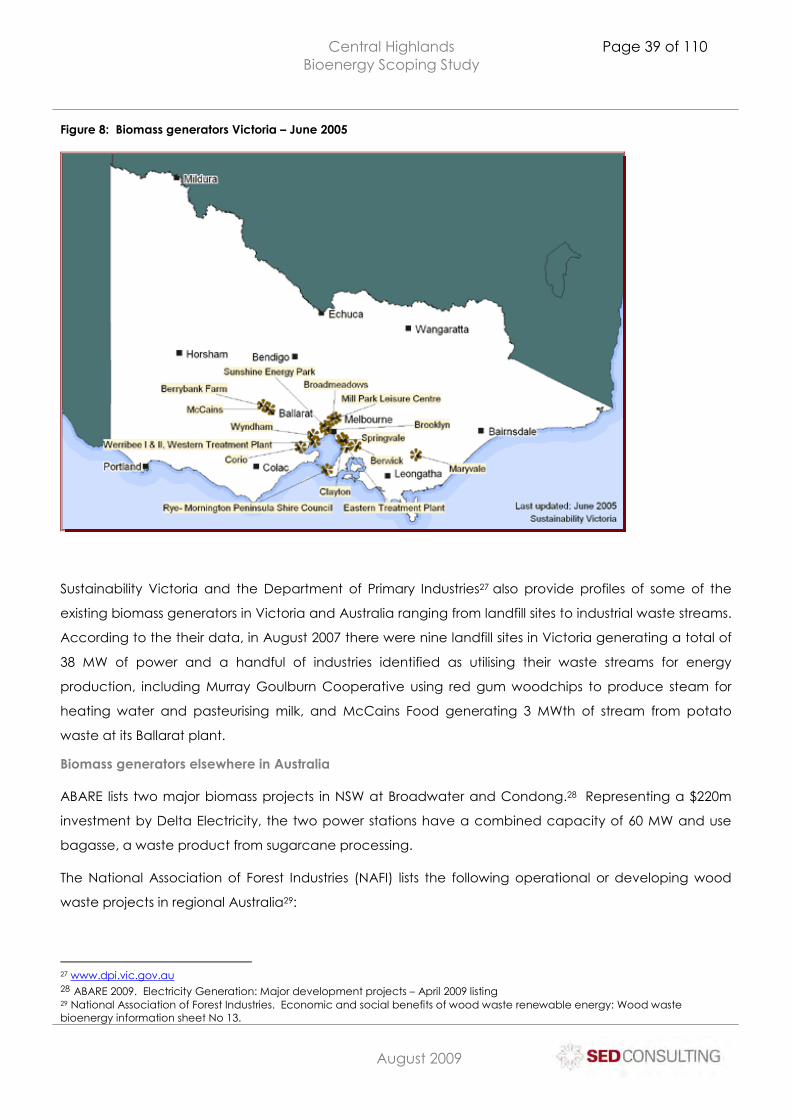
Central Highlands Bioenergy Scoping Study
Page 39 of 110
C:\Documents and Settings\Laurie\My Documents\Laurie\Farm Business\CHAF\Biodiesel and Bioenergy\Bioenergy\Bioenergy Working Group\Working Group Business plan\Business Plan Project\Stage 2 report\LN_CHAF Bioenergy scoping study FINAL.doc
August 2009
Figure 8: Biomass generators Victoria – June 2005
Sustainability Victoria and the Department of Primary Industries27 also provide profiles of some of the
existing biomass generators in Victoria and Australia ranging from landfill sites to industrial waste streams.
According to the their data, in August 2007 there were nine landfill sites in Victoria generating a total of
38 MW of power and a handful of industries identified as utilising their waste streams for energy
production, including Murray Goulburn Cooperative using red gum woodchips to produce steam for
heating water and pasteurising milk, and McCains Food generating 3 MWth of stream from potato
waste at its Ballarat plant.
Biomass generators elsewhere in Australia
ABARE lists two major biomass projects in NSW at Broadwater and Condong.28 Representing a $220m
investment by Delta Electricity, the two power stations have a combined capacity of 60 MW and use
bagasse, a waste product from sugarcane processing.
The National Association of Forest Industries (NAFI) lists the following operational or developing wood
waste projects in regional Australia29:
27 www.dpi.vic.gov.au 28 ABARE 2009. Electricity Generation: Major development projects – April 2009 listing 29 National Association of Forest Industries. Economic and social benefits of wood waste renewable energy: Wood waste bioenergy information sheet No 13.
Central Highlands Bioenergy Scoping Study
Page 40 of 110
C:\Documents and Settings\Laurie\My Documents\Laurie\Farm Business\CHAF\Biodiesel and Bioenergy\Bioenergy\Bioenergy Working Group\Working Group Business plan\Business Plan Project\Stage 2 report\LN_CHAF Bioenergy scoping study FINAL.doc
August 2009
� Rocky Point biomass cogeneration project, using bagasse supplemented with other forms of
biomass ;
� Northern NSW Camphor Laurel project where weed camphor laurel creates biomass for power
generation;
� Narrogin Oil Mallee project, an integrated power generation, activated carbon and eucalyptus oil
production venture;
� Staplyton Green Waste to Energy project; and
� The Southwood Project in southern Tasmania.
The NAFI estimates that there are currently five additional sites where large scale renewable energy
projects could be commissioned to generate electricity.
Biomass to energy: feedstocks and technologies
As described above, biomass is material from animals or plants, or by-product from the processing of
plant matter or animals – including green leaf, dry straw, black liquor from wood pulp processing,
chipped thinnings or harvest waste including stumps, sewage and manure, food processing waste and
slaughterhouse waste. A range of technologies is available to capture the energy embedded in these
substances and convert it to a form we can use.
The Clean Energy Council’s 2008 Biomass Resource Appraisal undertook a national audit of bioenergy
feedstocks, confining its study to those forms of biomass that can be matched to current power
generation technologies and systems. Table 13 summarises the findings of the Appraisal.
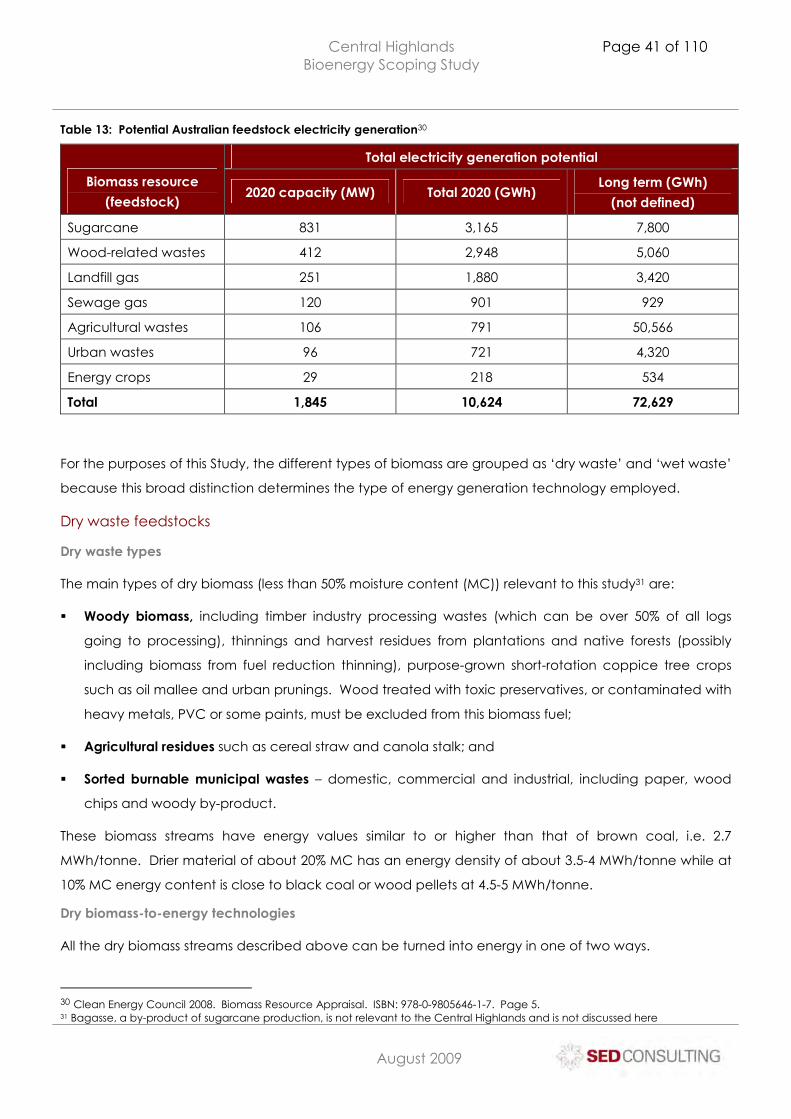
Central Highlands Bioenergy Scoping Study
Page 41 of 110
C:\Documents and Settings\Laurie\My Documents\Laurie\Farm Business\CHAF\Biodiesel and Bioenergy\Bioenergy\Bioenergy Working Group\Working Group Business plan\Business Plan Project\Stage 2 report\LN_CHAF Bioenergy scoping study FINAL.doc
August 2009
Table 13: Potential Australian feedstock electricity generation30
Total electricity generation potential
Biomass resource
(feedstock) 2020 capacity (MW) Total 2020 (GWh)
Long term (GWh)
(not defined)
Sugarcane 831 3,165 7,800
Wood-related wastes 412 2,948 5,060
Landfill gas 251 1,880 3,420
Sewage gas 120 901 929
Agricultural wastes 106 791 50,566
Urban wastes 96 721 4,320
Energy crops 29 218 534
Total 1,845 10,624 72,629
For the purposes of this Study, the different types of biomass are grouped as ‘dry waste’ and ‘wet waste’
because this broad distinction determines the type of energy generation technology employed.
Dry waste feedstocks
Dry waste types
The main types of dry biomass (less than 50% moisture content (MC)) relevant to this study31 are:
� Woody biomass, including timber industry processing wastes (which can be over 50% of all logs
going to processing), thinnings and harvest residues from plantations and native forests (possibly
including biomass from fuel reduction thinning), purpose-grown short-rotation coppice tree crops
such as oil mallee and urban prunings. Wood treated with toxic preservatives, or contaminated with
heavy metals, PVC or some paints, must be excluded from this biomass fuel;
� Agricultural residues such as cereal straw and canola stalk; and
� Sorted burnable municipal wastes – domestic, commercial and industrial, including paper, wood
chips and woody by-product.
These biomass streams have energy values similar to or higher than that of brown coal, i.e. 2.7
MWh/tonne. Drier material of about 20% MC has an energy density of about 3.5-4 MWh/tonne while at
10% MC energy content is close to black coal or wood pellets at 4.5-5 MWh/tonne.
Dry biomass-to-energy technologies
All the dry biomass streams described above can be turned into energy in one of two ways.
30 Clean Energy Council 2008. Biomass Resource Appraisal. ISBN: 978-0-9805646-1-7. Page 5. 31 Bagasse, a by-product of sugarcane production, is not relevant to the Central Highlands and is not discussed here
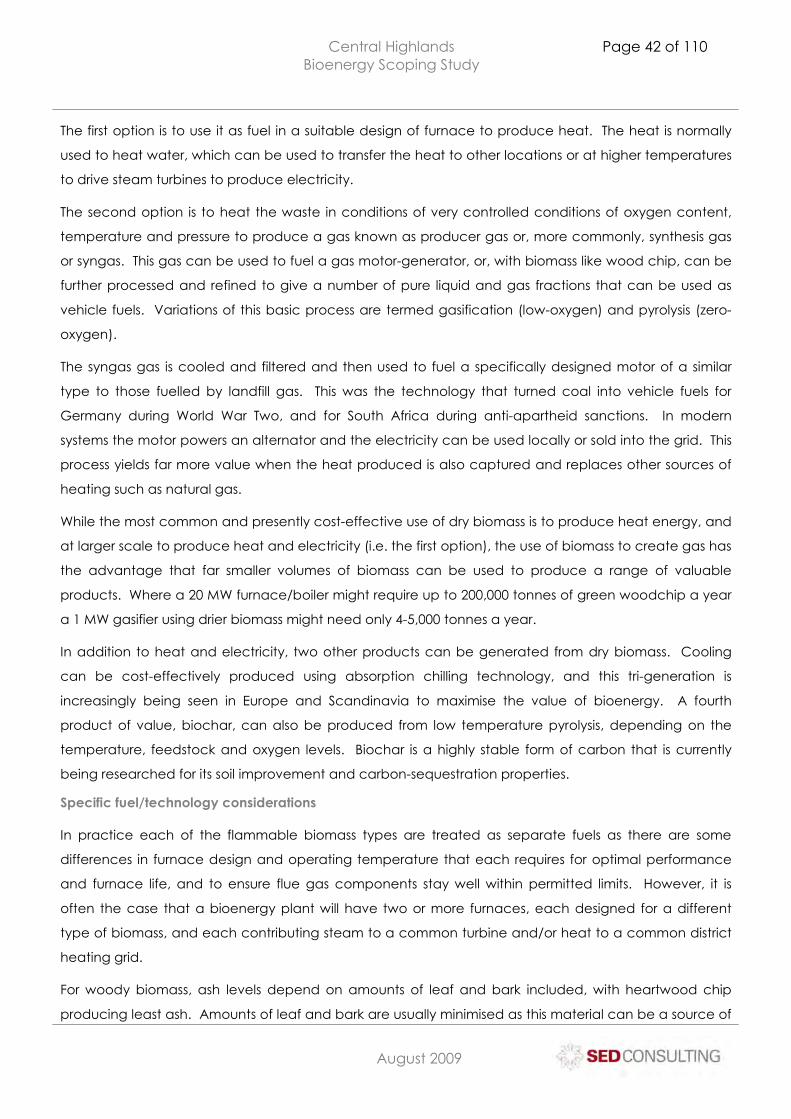
Central Highlands Bioenergy Scoping Study
Page 42 of 110
C:\Documents and Settings\Laurie\My Documents\Laurie\Farm Business\CHAF\Biodiesel and Bioenergy\Bioenergy\Bioenergy Working Group\Working Group Business plan\Business Plan Project\Stage 2 report\LN_CHAF Bioenergy scoping study FINAL.doc
August 2009
The first option is to use it as fuel in a suitable design of furnace to produce heat. The heat is normally
used to heat water, which can be used to transfer the heat to other locations or at higher temperatures
to drive steam turbines to produce electricity.
The second option is to heat the waste in conditions of very controlled conditions of oxygen content,
temperature and pressure to produce a gas known as producer gas or, more commonly, synthesis gas
or syngas. This gas can be used to fuel a gas motor-generator, or, with biomass like wood chip, can be
further processed and refined to give a number of pure liquid and gas fractions that can be used as
vehicle fuels. Variations of this basic process are termed gasification (low-oxygen) and pyrolysis (zero-
oxygen).
The syngas gas is cooled and filtered and then used to fuel a specifically designed motor of a similar
type to those fuelled by landfill gas. This was the technology that turned coal into vehicle fuels for
Germany during World War Two, and for South Africa during anti-apartheid sanctions. In modern
systems the motor powers an alternator and the electricity can be used locally or sold into the grid. This
process yields far more value when the heat produced is also captured and replaces other sources of
heating such as natural gas.
While the most common and presently cost-effective use of dry biomass is to produce heat energy, and
at larger scale to produce heat and electricity (i.e. the first option), the use of biomass to create gas has
the advantage that far smaller volumes of biomass can be used to produce a range of valuable
products. Where a 20 MW furnace/boiler might require up to 200,000 tonnes of green woodchip a year
a 1 MW gasifier using drier biomass might need only 4-5,000 tonnes a year.
In addition to heat and electricity, two other products can be generated from dry biomass. Cooling
can be cost-effectively produced using absorption chilling technology, and this tri-generation is
increasingly being seen in Europe and Scandinavia to maximise the value of bioenergy. A fourth
product of value, biochar, can also be produced from low temperature pyrolysis, depending on the
temperature, feedstock and oxygen levels. Biochar is a highly stable form of carbon that is currently
being researched for its soil improvement and carbon-sequestration properties.
Specific fuel/technology considerations
In practice each of the flammable biomass types are treated as separate fuels as there are some
differences in furnace design and operating temperature that each requires for optimal performance
and furnace life, and to ensure flue gas components stay well within permitted limits. However, it is
often the case that a bioenergy plant will have two or more furnaces, each designed for a different
type of biomass, and each contributing steam to a common turbine and/or heat to a common district
heating grid.
For woody biomass, ash levels depend on amounts of leaf and bark included, with heartwood chip
producing least ash. Amounts of leaf and bark are usually minimised as this material can be a source of
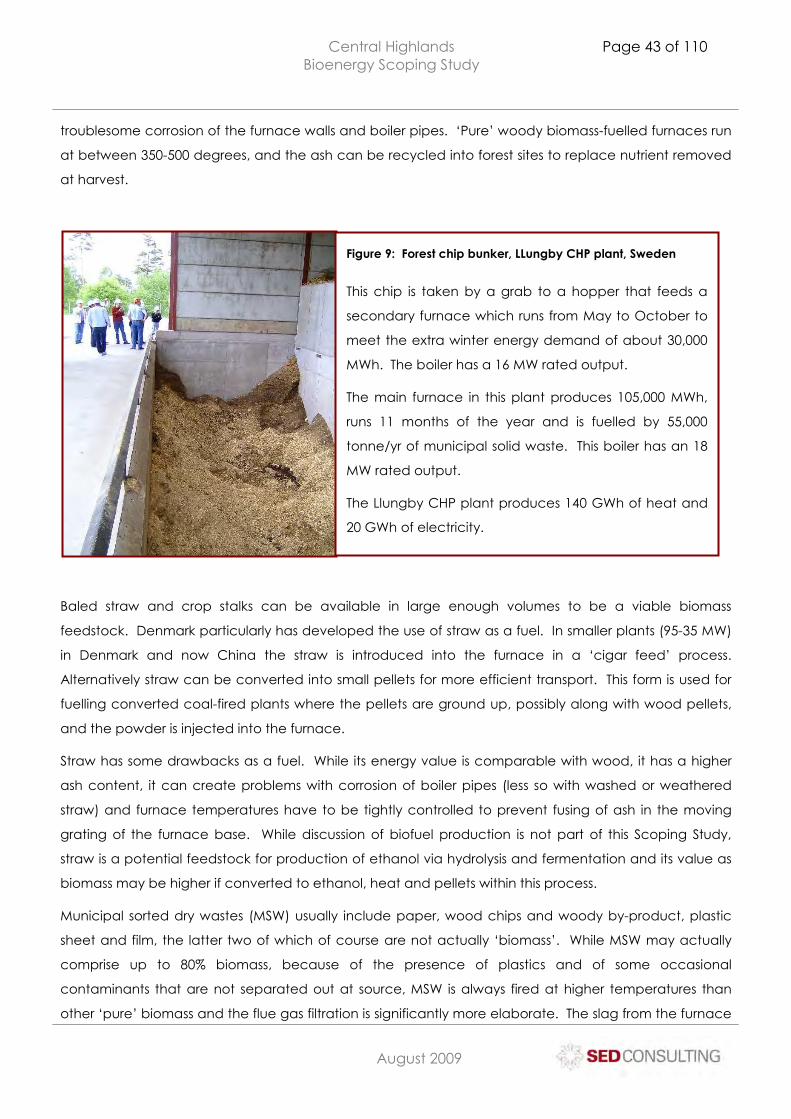
Central Highlands Bioenergy Scoping Study
Page 43 of 110
C:\Documents and Settings\Laurie\My Documents\Laurie\Farm Business\CHAF\Biodiesel and Bioenergy\Bioenergy\Bioenergy Working Group\Working Group Business plan\Business Plan Project\Stage 2 report\LN_CHAF Bioenergy scoping study FINAL.doc
August 2009
troublesome corrosion of the furnace walls and boiler pipes. ‘Pure’ woody biomass-fuelled furnaces run
at between 350-500 degrees, and the ash can be recycled into forest sites to replace nutrient removed
at harvest.
Baled straw and crop stalks can be available in large enough volumes to be a viable biomass
feedstock. Denmark particularly has developed the use of straw as a fuel. In smaller plants (95-35 MW)
in Denmark and now China the straw is introduced into the furnace in a ‘cigar feed’ process.
Alternatively straw can be converted into small pellets for more efficient transport. This form is used for
fuelling converted coal-fired plants where the pellets are ground up, possibly along with wood pellets,
and the powder is injected into the furnace.
Straw has some drawbacks as a fuel. While its energy value is comparable with wood, it has a higher
ash content, it can create problems with corrosion of boiler pipes (less so with washed or weathered
straw) and furnace temperatures have to be tightly controlled to prevent fusing of ash in the moving
grating of the furnace base. While discussion of biofuel production is not part of this Scoping Study,
straw is a potential feedstock for production of ethanol via hydrolysis and fermentation and its value as
biomass may be higher if converted to ethanol, heat and pellets within this process.
Municipal sorted dry wastes (MSW) usually include paper, wood chips and woody by-product, plastic
sheet and film, the latter two of which of course are not actually ‘biomass’. While MSW may actually
comprise up to 80% biomass, because of the presence of plastics and of some occasional
contaminants that are not separated out at source, MSW is always fired at higher temperatures than
other ‘pure’ biomass and the flue gas filtration is significantly more elaborate. The slag from the furnace
Figure 9: Forest chip bunker, LLungby CHP plant, Sweden
This chip is taken by a grab to a hopper that feeds a
secondary furnace which runs from May to October to
meet the extra winter energy demand of about 30,000
MWh. The boiler has a 16 MW rated output.
The main furnace in this plant produces 105,000 MWh,
runs 11 months of the year and is fuelled by 55,000
tonne/yr of municipal solid waste. This boiler has an 18
MW rated output.
The Llungby CHP plant produces 140 GWh of heat and
20 GWh of electricity.
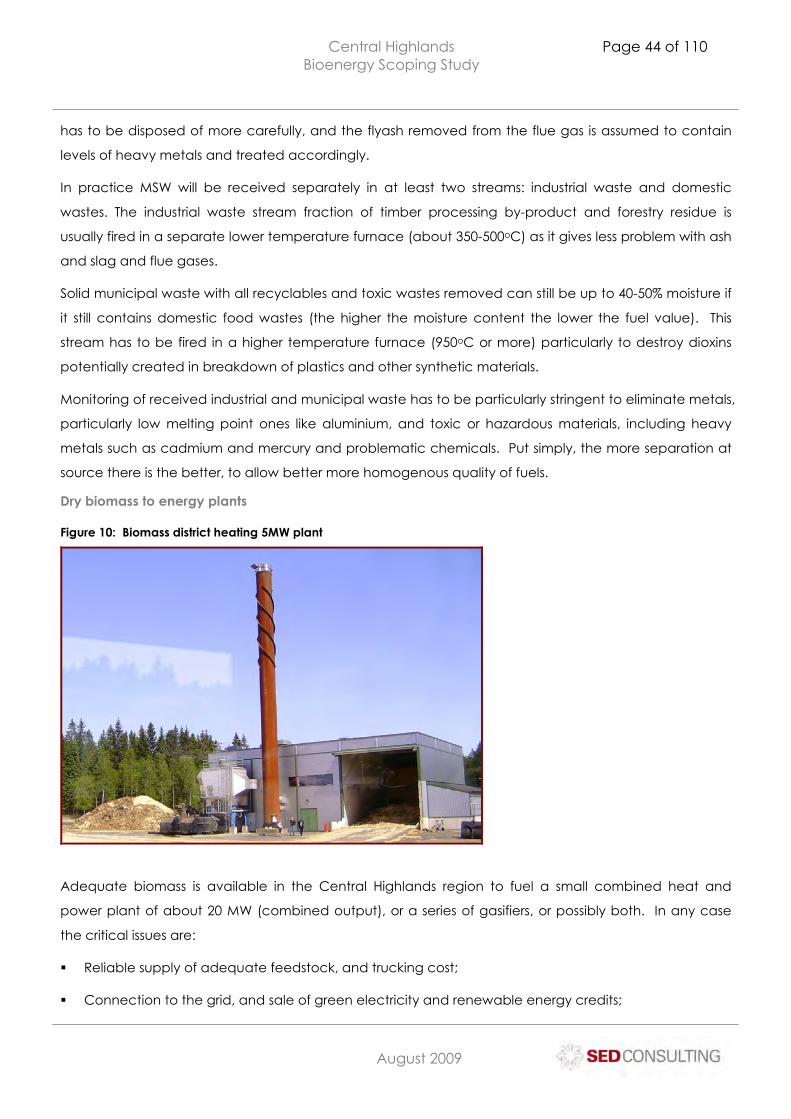
Central Highlands Bioenergy Scoping Study
Page 44 of 110
C:\Documents and Settings\Laurie\My Documents\Laurie\Farm Business\CHAF\Biodiesel and Bioenergy\Bioenergy\Bioenergy Working Group\Working Group Business plan\Business Plan Project\Stage 2 report\LN_CHAF Bioenergy scoping study FINAL.doc
August 2009
has to be disposed of more carefully, and the flyash removed from the flue gas is assumed to contain
levels of heavy metals and treated accordingly.
In practice MSW will be received separately in at least two streams: industrial waste and domestic
wastes. The industrial waste stream fraction of timber processing by-product and forestry residue is
usually fired in a separate lower temperature furnace (about 350-500oC) as it gives less problem with ash
and slag and flue gases.
Solid municipal waste with all recyclables and toxic wastes removed can still be up to 40-50% moisture if
it still contains domestic food wastes (the higher the moisture content the lower the fuel value). This
stream has to be fired in a higher temperature furnace (950oC or more) particularly to destroy dioxins
potentially created in breakdown of plastics and other synthetic materials.
Monitoring of received industrial and municipal waste has to be particularly stringent to eliminate metals,
particularly low melting point ones like aluminium, and toxic or hazardous materials, including heavy
metals such as cadmium and mercury and problematic chemicals. Put simply, the more separation at
source there is the better, to allow better more homogenous quality of fuels.
Dry biomass to energy plants
Figure 10: Biomass district heating 5MW plant
Adequate biomass is available in the Central Highlands region to fuel a small combined heat and
power plant of about 20 MW (combined output), or a series of gasifiers, or possibly both. In any case
the critical issues are:
� Reliable supply of adequate feedstock, and trucking cost;
� Connection to the grid, and sale of green electricity and renewable energy credits;
Central Highlands Bioenergy Scoping Study
Page 45 of 110
C:\Documents and Settings\Laurie\My Documents\Laurie\Farm Business\CHAF\Biodiesel and Bioenergy\Bioenergy\Bioenergy Working Group\Working Group Business plan\Business Plan Project\Stage 2 report\LN_CHAF Bioenergy scoping study FINAL.doc
August 2009
� Sale of heat to nearby users; and
� Community acceptance of regional bioenergy plants.
For a conventional CHP plant of this size the area required is about 4-5 ha. It will contain a receival
bunker, a furnace boiler building also containing the turbine and alternator, a connected filter building,
a chimney, and an accumulator (a hot water tank like an oversize drink vacuum flask). Within the
complex will be a control room and administrative offices.
For a 1 MW gasifier or series of gasifiers the plant footprint is significantly smaller (depending on fuel
receival and storage, probably less than a hectare), and the need for elaborate flue gas filtration is
dramatically reduced. The need for chimney height, control room and administrative offices is similarly
minimal.
Approximate capital costs for a smaller furnace boiler heating plant of 0.5-2 MW are about $2500/kW
(some Indian-made plant can be $1500/kW). Similarly, larger district heating plants of up to 10MW can
be assumed to be about $2 million per MW-th capacity (not including heat distribution).
Larger CHP plants fired with woody biomass cost up to $3-4 million per MW (total thermal and electric)
not including heat distribution grid. This is hard to price accurately as some plants, such as those now
being built in China, can some in at closer to $2 million/MW.
Larger MSW-fuelled CHP plants cost around $5 million per MW(th & e) capacity, not including the heat
distribution grid.
Biomass is a relatively low energy density fuel, as is brown coal. Its cost of transport and of conversion to
a suitable form to serve as a fuel can make this initially low cost renewable energy fuel less competitive.
To offset economic handicaps to bioenergy the ideal is to cost-effectively extract as many products of
value as possible from the operation. The site and scale of the plant is usually critical to this. Biomass-
fuelled plants commonly utilise surplus heat energy to enable some other industrial processes. These
can include:
� Drying pellet feedstock down to the required 8-10% moisture;
� Supplying steam, heating or drying for other adjacent industrial processes, including food processing,
laundering, timber kiln drying;
� Supplying heat to the ligno-cellulose to ethanol process; and
� Producing cooling via absorption chilling technology for cooling or refrigeration, including to ice
rinks or cool stores.
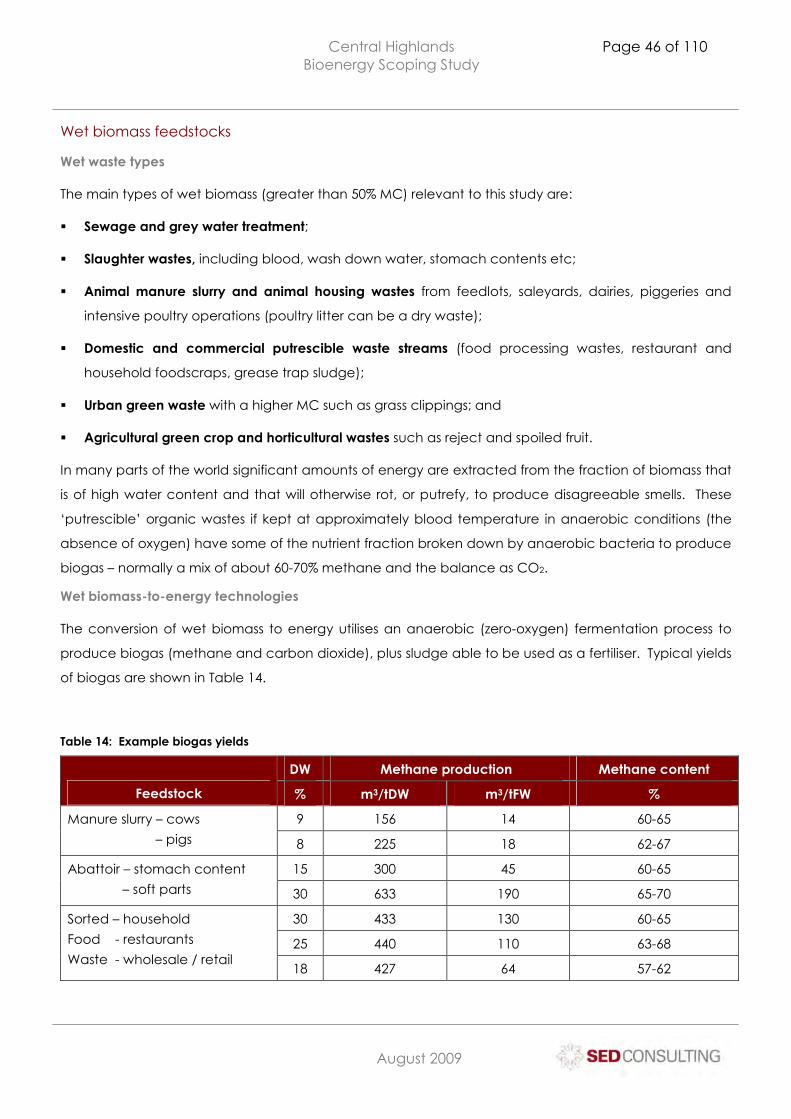
Central Highlands Bioenergy Scoping Study
Page 46 of 110
C:\Documents and Settings\Laurie\My Documents\Laurie\Farm Business\CHAF\Biodiesel and Bioenergy\Bioenergy\Bioenergy Working Group\Working Group Business plan\Business Plan Project\Stage 2 report\LN_CHAF Bioenergy scoping study FINAL.doc
August 2009
Wet biomass feedstocks
Wet waste types
The main types of wet biomass (greater than 50% MC) relevant to this study are:
� Sewage and grey water treatment;
� Slaughter wastes, including blood, wash down water, stomach contents etc;
� Animal manure slurry and animal housing wastes from feedlots, saleyards, dairies, piggeries and
intensive poultry operations (poultry litter can be a dry waste);
� Domestic and commercial putrescible waste streams (food processing wastes, restaurant and
household foodscraps, grease trap sludge);
� Urban green waste with a higher MC such as grass clippings; and
� Agricultural green crop and horticultural wastes such as reject and spoiled fruit.
In many parts of the world significant amounts of energy are extracted from the fraction of biomass that
is of high water content and that will otherwise rot, or putrefy, to produce disagreeable smells. These
‘putrescible’ organic wastes if kept at approximately blood temperature in anaerobic conditions (the
absence of oxygen) have some of the nutrient fraction broken down by anaerobic bacteria to produce
biogas – normally a mix of about 60-70% methane and the balance as CO2.
Wet biomass-to-energy technologies
The conversion of wet biomass to energy utilises an anaerobic (zero-oxygen) fermentation process to
produce biogas (methane and carbon dioxide), plus sludge able to be used as a fertiliser. Typical yields
of biogas are shown in Table 14.
Table 14: Example biogas yields
DW Methane production Methane content
Feedstock % m3/tDW m3/tFW %
9 156 14 60-65 Manure slurry – cows
– pigs 8 225 18 62-67
15 300 45 60-65 Abattoir – stomach content
– soft parts 30 633 190 65-70
30 433 130 60-65
25 440 110 63-68
Sorted – household
Food - restaurants
Waste - wholesale / retail 18 427 64 57-62
Central Highlands Bioenergy Scoping Study
Page 47 of 110
C:\Documents and Settings\Laurie\My Documents\Laurie\Farm Business\CHAF\Biodiesel and Bioenergy\Bioenergy\Bioenergy Working Group\Working Group Business plan\Business Plan Project\Stage 2 report\LN_CHAF Bioenergy scoping study FINAL.doc
August 2009
Biogas is typically 60-70% methane and has a fuel value of 6-7 kWH/standard cubic metre (Nm3). It is
used in a range of applications:
� Heat – where the gas fires the boiler of a hydronic heating system, or used for cooking. The heat
may also be fed back into the fermentation process;
� Heat/power – where the gas is used to fuel stationary engines, usually diesels or gas turbines. About
a third of the energy goes to producing electricity and two thirds to producing heat; and
� Vehicle fuel – here the gas has to be upgraded to biomethane, typically comprising about 98%
methane and 2% water vapour. This entails the removal of hydrogen sulphide, water and carbon
dioxide. Water scrubbing, chemical absorption and pressure swing adsorption (PSA) are the most
common techniques. The gas then has to be odorised and pressurised to about 200 bar before use.
For heavy vehicles like municipal truck and bus fleets it may be boosted in power by addition of
about 9% by volume of propane.
Commercial biogas production plants in Australia and Europe are generally on a large scale, using
about 30,000m3 of solid material a year or more. Various types of putrescible biomass are often
combined to give the necessary volume and percentage of dry matter. In Sweden it is common for
sewage and food waste to be combined. Other Swedish municipal biogas plants use a mix of abattoir
waste, food industry waste, grease trap waste, and fresh leafy crop material (similar to fresh silage).
Anaerobic fermentation can also be done with smaller volumes of waste per year at a farm scale for
dairies and piggeries. Germany is a leader in this approach with over 3,000 of such farm digesters
producing ‘green’ energy. This is especially economic in countries in Europe where green energy feed-
in tariffs apply, animals are intensively housed and the disposal of manure slurry is increasingly regulated
and costly. The biogas produced can still be used for heat production or for fuelling a gas motor, but it
would not be economic to upgrade the biogas. Work is being done to develop an Australian system
that would take effluent from 400-cow herds via a farm anaerobic fermenter to cost-effectively
produce heat, electricity and possibly milk cooling.
At larger scale drier (below 60% MC) organic material like straw animal bedding or drier manure and
leafy garden waste can be heaped to fill a garage-sized airtight container, wetted and kept warm.
After the production of biogas over the following weeks the rotted-down material can then be removed
and, if free of contaminants, spread or sold as agricultural fertiliser or even dewatered to below 50% MC
and added to a dry biomass fuel stream. The biogas produced from this process usually fuels a gas
motor to produce electricity, with much of the heat from the motor being used to accelerate the
biogas production in the next batch being processed.
Note that the process of composting to convert ‘green’ waste of 50-80% MC into a more stable, less
odorous and possibly saleable form is aerobic fermentation. Here fungi and bacteria utilise the
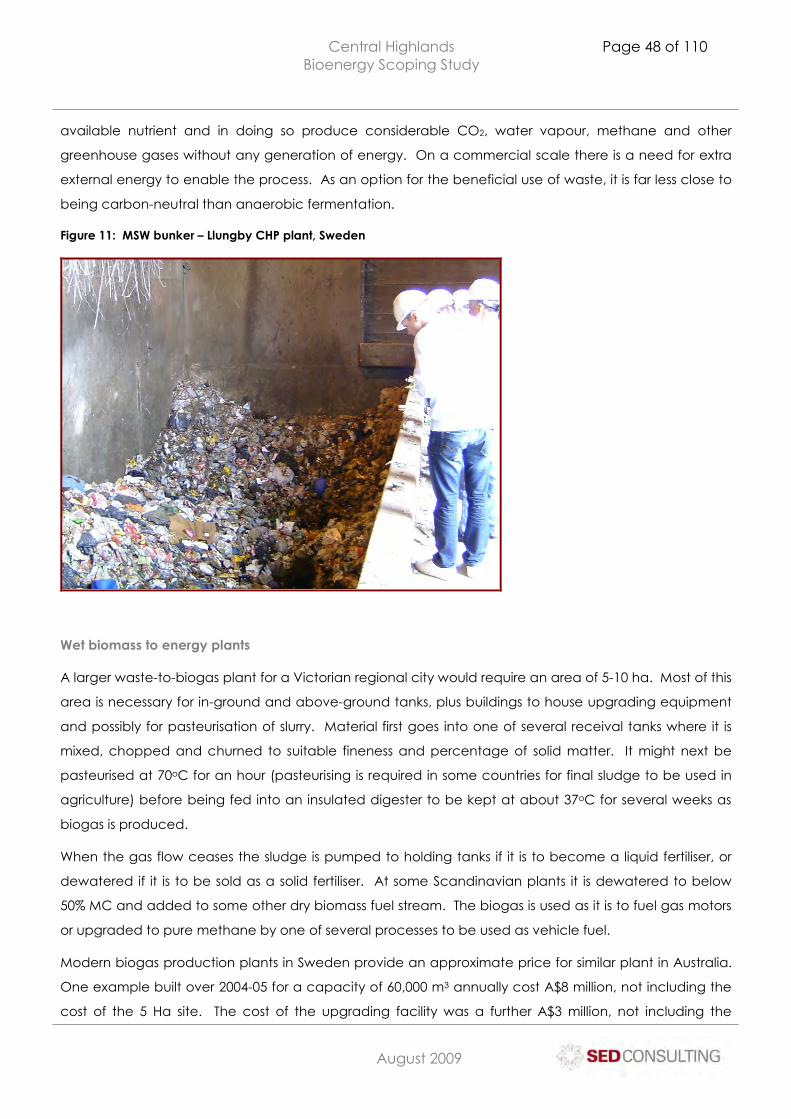
Central Highlands Bioenergy Scoping Study
Page 48 of 110
C:\Documents and Settings\Laurie\My Documents\Laurie\Farm Business\CHAF\Biodiesel and Bioenergy\Bioenergy\Bioenergy Working Group\Working Group Business plan\Business Plan Project\Stage 2 report\LN_CHAF Bioenergy scoping study FINAL.doc
August 2009
available nutrient and in doing so produce considerable CO2, water vapour, methane and other
greenhouse gases without any generation of energy. On a commercial scale there is a need for extra
external energy to enable the process. As an option for the beneficial use of waste, it is far less close to
being carbon-neutral than anaerobic fermentation.
Figure 11: MSW bunker – Llungby CHP plant, Sweden
Wet biomass to energy plants
A larger waste-to-biogas plant for a Victorian regional city would require an area of 5-10 ha. Most of this
area is necessary for in-ground and above-ground tanks, plus buildings to house upgrading equipment
and possibly for pasteurisation of slurry. Material first goes into one of several receival tanks where it is
mixed, chopped and churned to suitable fineness and percentage of solid matter. It might next be
pasteurised at 70oC for an hour (pasteurising is required in some countries for final sludge to be used in
agriculture) before being fed into an insulated digester to be kept at about 37oC for several weeks as
biogas is produced.
When the gas flow ceases the sludge is pumped to holding tanks if it is to become a liquid fertiliser, or
dewatered if it is to be sold as a solid fertiliser. At some Scandinavian plants it is dewatered to below
50% MC and added to some other dry biomass fuel stream. The biogas is used as it is to fuel gas motors
or upgraded to pure methane by one of several processes to be used as vehicle fuel.
Modern biogas production plants in Sweden provide an approximate price for similar plant in Australia.
One example built over 2004-05 for a capacity of 60,000 m3 annually cost A$8 million, not including the
cost of the 5 Ha site. The cost of the upgrading facility was a further A$3 million, not including the
Central Highlands Bioenergy Scoping Study
Page 49 of 110
C:\Documents and Settings\Laurie\My Documents\Laurie\Farm Business\CHAF\Biodiesel and Bioenergy\Bioenergy\Bioenergy Working Group\Working Group Business plan\Business Plan Project\Stage 2 report\LN_CHAF Bioenergy scoping study FINAL.doc
August 2009
connecting pipeline to the natural gas grid. The feedstock is 4000 m3 of pig manure from a piggery
turning off 6000 animals a year, 30,000 m3 of material by pipeline from a food processing industry 2.5 km
distant, and about 8,000 m3 of abattoir waste.
By 1.5 years this plant was operating in the black and is expected to have recovered all outlays within
10 years. The plant makes extensive use of components in modules, so the pump house for slurry and
gas, and the upgrading equipment, are within original containers. (For further detail see Wrams
Gunnerstorp plant in Appendix 5: Scandinavian bioenergy options in practice).
A second example is the Filbona plant in Sweden near Helsingborg, owned and developed by a
syndicate formed by the six surrounding municipalities. Having recently had major extensions and
equipment upgrades including a gas upgrading process at a cost of about A$7 million, the plant now
annually produces about 3.2 million Nm3 of methane annually from 60,000 m3 of organic material. This
methane supplies the bus and truck fleets of the municipalities from the new upgrade line, with private
cars being fuelled with methane from the original upgrade line.
Central Highlands biomass audit
General references
There are a number of sources of information on the availability of feedstock for bioenergy, although
none of them quantify all of the possible feedstocks available in the Central Highlands region
specifically. The sources of information include:
� The Clean Energy Council’s Biomass Resource Appraisal, produced in 2008. The Appraisal
accompanies the Bioenergy Roadmap produced by the CEC to set out a strategy by which Australia
could develop a sustainable bioenergy industry.
� The Bioenergy Atlas of Australia, produced by the Joint Venture Agroforestry Program32, an online
resource33 that allows existing and potential biomass resources to be mapped using GIS technology.
The Atlas is based on data available in 2002 when it was produced and these underlying data can be
viewed. A hard copy guide on its use is available.
� The Energy Millenium: Bioenergy in Victoria, a report prepared by the Agriculture Development
Division of the Department of Primary Industries in Victoria. The report examines the opportunities to
develop bioenergy across the state and includes some quantification of biomass resources.
� Community Renewable Energy: A Research Guide, produced by the National Centre for
Sustainability at the University of Ballarat. The Guide was ‘prepared to assist regional communities to
32 Rural Industries Research and Development Corporation, Forest and Wood Products Research and Development Corporation, Land and Water Australia and the Murray-Darling Basin Commission 33 www.brs.gov.au/bioenergy_atlas/
Central Highlands Bioenergy Scoping Study
Page 50 of 110
C:\Documents and Settings\Laurie\My Documents\Laurie\Farm Business\CHAF\Biodiesel and Bioenergy\Bioenergy\Bioenergy Working Group\Working Group Business plan\Business Plan Project\Stage 2 report\LN_CHAF Bioenergy scoping study FINAL.doc
August 2009
research local renewable resources for electricity generation’. It includes all forms of renewable energy
and has as a specific appendix in bioenergy.
� Sustainability Victoria’s Bioenergy Resource in Victoria web page34. The page has maps showing
some of the potential sources of biomass across the state.
Other references more specific to particular resources are described below.
Overview
The specific dry wastes examined here are:
� Forestry residues and short-rotation coppice;
� Agricultural residues such as crop stubbles;
� Poultry litter;
� Municipal solid waste – sorted flammable waste and green organics (such as tree clippings, <50%
moisture);
� Commercial and industrial waste; and
� Construction and demolition waste.
The specific wet wastes are:
� Sewage;
� Animal effluents (dairy cattle, pigs, livestock through saleyards);
� Municipal putrescible waste (household scraps); and
� Commercial and industrial wastes (including grease trap sludge, abattoir and food processing
waste).
Almost all of these potential sources of energy have alternative uses – for example, as fertilisers – so they
will only be available as bioenergy feedstocks at the right price. This section attempts to show the value
of these resources under current economic settings. However, these parameters are expected to
change significantly with the introduction of carbon pricing. It is impossible predict these dynamics in
advance. Any specific business plan would need to undertake a more detailed analysis dependent on
the specific technology under consideration, the feedstocks available to supply it and the location of
the facility.
It should also be noted that there are preferred alternatives to recovery of energy from a purely
environmental perspective. EcoRecycle Victoria’s report Towards zero waste: A materials efficiency
strategy for Victoria presents the following waste management hierarchy:
34 www.sustainability.vic.gov.au/www/html/2113-bioenergy.asp
Central Highlands Bioenergy Scoping Study
Page 51 of 110
C:\Documents and Settings\Laurie\My Documents\Laurie\Farm Business\CHAF\Biodiesel and Bioenergy\Bioenergy\Bioenergy Working Group\Working Group Business plan\Business Plan Project\Stage 2 report\LN_CHAF Bioenergy scoping study FINAL.doc
August 2009
1. Avoidance;
2. Reuse;
3. Recycling;
4. Recovery of energy;
5. Treatment;
6. Containment; and
7. Disposal.
This economics of feedstock availability would be expected to approximate this hierarchy with the
introduction of a carbon price.
Dry wastes
Woody waste
A comprehensive audit of forestry residues has been conducted for the Bioenergy Working Group by
the University of Melbourne (Stewart 2008). The audit considered the supply of woody biomass within
50km and 100km radii of Ballarat, Colac and Ararat, which in aggregate covers a large area of Victoria
from west of Hamilton and Horsham, east to Romsey and Heathcote, south to the coast and around
20km north of St Arnaud. The report describes four forms of biofuels arising from forestry residues:
� ‘Slash’ made available following harvesting of pine and blue gum plantations. This is considered to
be the most likely source of an ongoing supply of biomass;
� ‘Slash’ from harvesting of native forests which, the report concludes, is a minor source of material
and difficult to obtain for political reasons;
� Fine fuel (litter) from native forests, which is also unlikely to yield a high volume of feedstock; and
� Downstream processing residues (bark, sawdust, ‘wings from edges of logs’ and ‘wood docked out
during machining and dressing’).
The key table from the report is reproduced here as Table 15, which shows the expected volumes of
woody biomass available over the next five years from pine and blue gum plantations. Longer
timeframes were not considered simply because of uncertainties about future planting intentions. The
figures in the table take account of the age cohorts of current stands of trees.
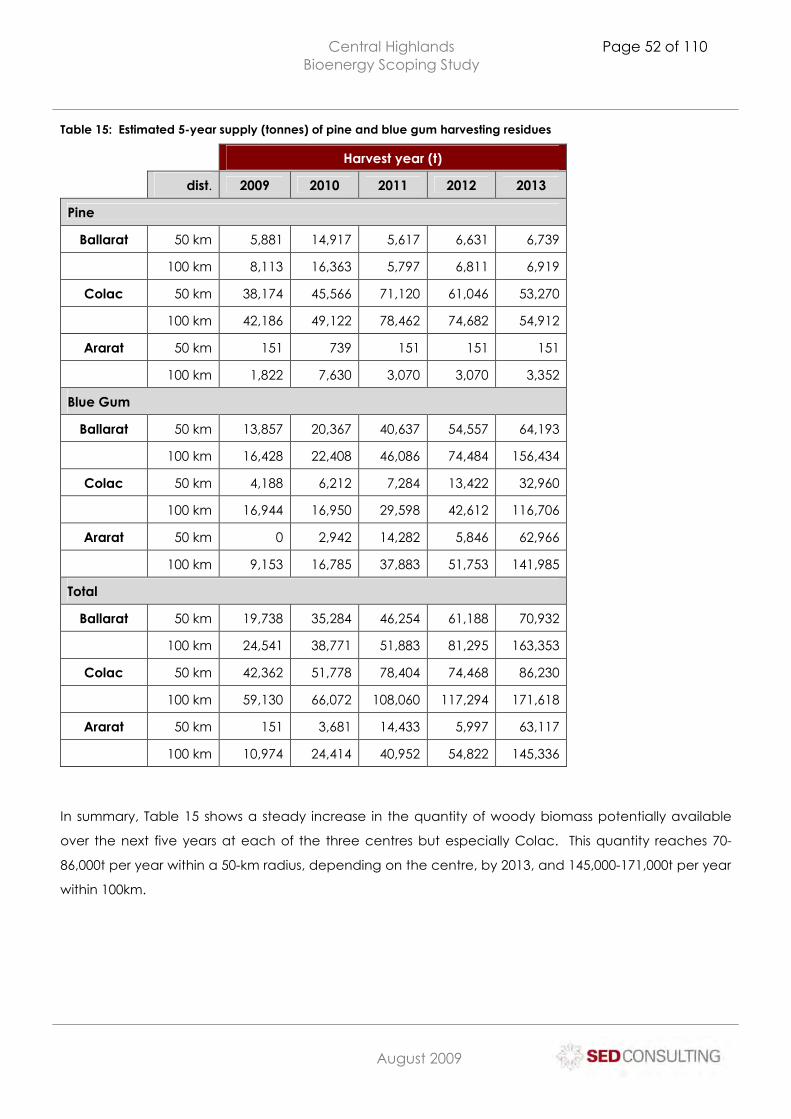
Central Highlands Bioenergy Scoping Study
Page 52 of 110
C:\Documents and Settings\Laurie\My Documents\Laurie\Farm Business\CHAF\Biodiesel and Bioenergy\Bioenergy\Bioenergy Working Group\Working Group Business plan\Business Plan Project\Stage 2 report\LN_CHAF Bioenergy scoping study FINAL.doc
August 2009
Table 15: Estimated 5-year supply (tonnes) of pine and blue gum harvesting residues
Harvest year (t)
dist. 2009 2010 2011 2012 2013
Pine
Ballarat 50 km 5,881 14,917 5,617 6,631 6,739
100 km 8,113 16,363 5,797 6,811 6,919
Colac 50 km 38,174 45,566 71,120 61,046 53,270
100 km 42,186 49,122 78,462 74,682 54,912
Ararat 50 km 151 739 151 151 151
100 km 1,822 7,630 3,070 3,070 3,352
Blue Gum
Ballarat 50 km 13,857 20,367 40,637 54,557 64,193
100 km 16,428 22,408 46,086 74,484 156,434
Colac 50 km 4,188 6,212 7,284 13,422 32,960
100 km 16,944 16,950 29,598 42,612 116,706
Ararat 50 km 0 2,942 14,282 5,846 62,966
100 km 9,153 16,785 37,883 51,753 141,985
Total
Ballarat 50 km 19,738 35,284 46,254 61,188 70,932
100 km 24,541 38,771 51,883 81,295 163,353
Colac 50 km 42,362 51,778 78,404 74,468 86,230
100 km 59,130 66,072 108,060 117,294 171,618
Ararat 50 km 151 3,681 14,433 5,997 63,117
100 km 10,974 24,414 40,952 54,822 145,336
In summary, Table 15 shows a steady increase in the quantity of woody biomass potentially available
over the next five years at each of the three centres but especially Colac. This quantity reaches 70-
86,000t per year within a 50-km radius, depending on the centre, by 2013, and 145,000-171,000t per year
within 100km.
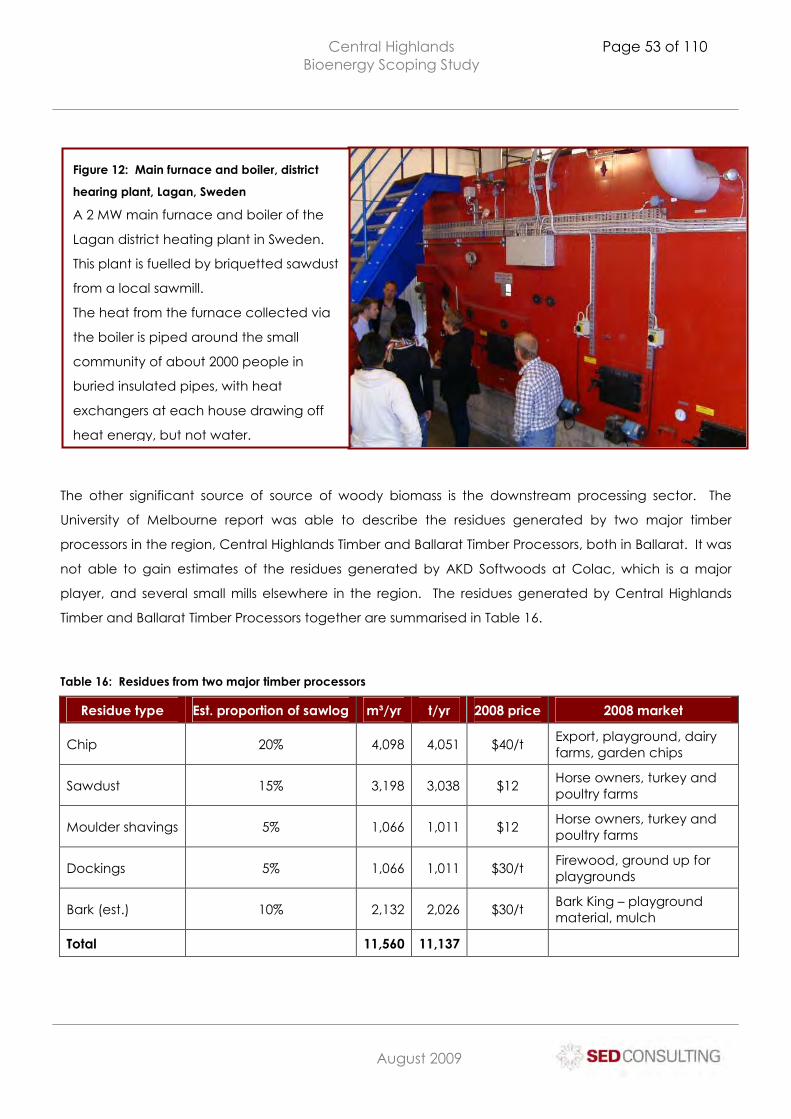
Central Highlands Bioenergy Scoping Study
Page 53 of 110
C:\Documents and Settings\Laurie\My Documents\Laurie\Farm Business\CHAF\Biodiesel and Bioenergy\Bioenergy\Bioenergy Working Group\Working Group Business plan\Business Plan Project\Stage 2 report\LN_CHAF Bioenergy scoping study FINAL.doc
August 2009
The other significant source of source of woody biomass is the downstream processing sector. The
University of Melbourne report was able to describe the residues generated by two major timber
processors in the region, Central Highlands Timber and Ballarat Timber Processors, both in Ballarat. It was
not able to gain estimates of the residues generated by AKD Softwoods at Colac, which is a major
player, and several small mills elsewhere in the region. The residues generated by Central Highlands
Timber and Ballarat Timber Processors together are summarised in Table 16.
Table 16: Residues from two major timber processors
Residue type Est. proportion of sawlog m³/yr t/yr 2008 price 2008 market
Chip 20% 4,098 4,051 $40/t Export, playground, dairy farms, garden chips
Sawdust 15% 3,198 3,038 $12 Horse owners, turkey and poultry farms
Moulder shavings 5% 1,066 1,011 $12 Horse owners, turkey and poultry farms
Dockings 5% 1,066 1,011 $30/t Firewood, ground up for playgrounds
Bark (est.) 10% 2,132 2,026 $30/t Bark King – playground material, mulch
Total 11,560 11,137
Figure 12: Main furnace and boiler, district
hearing plant, Lagan, Sweden
A 2 MW main furnace and boiler of the
Lagan district heating plant in Sweden.
This plant is fuelled by briquetted sawdust
from a local sawmill.
The heat from the furnace collected via
the boiler is piped around the small
community of about 2000 people in
buried insulated pipes, with heat
exchangers at each house drawing off
heat energy, but not water.
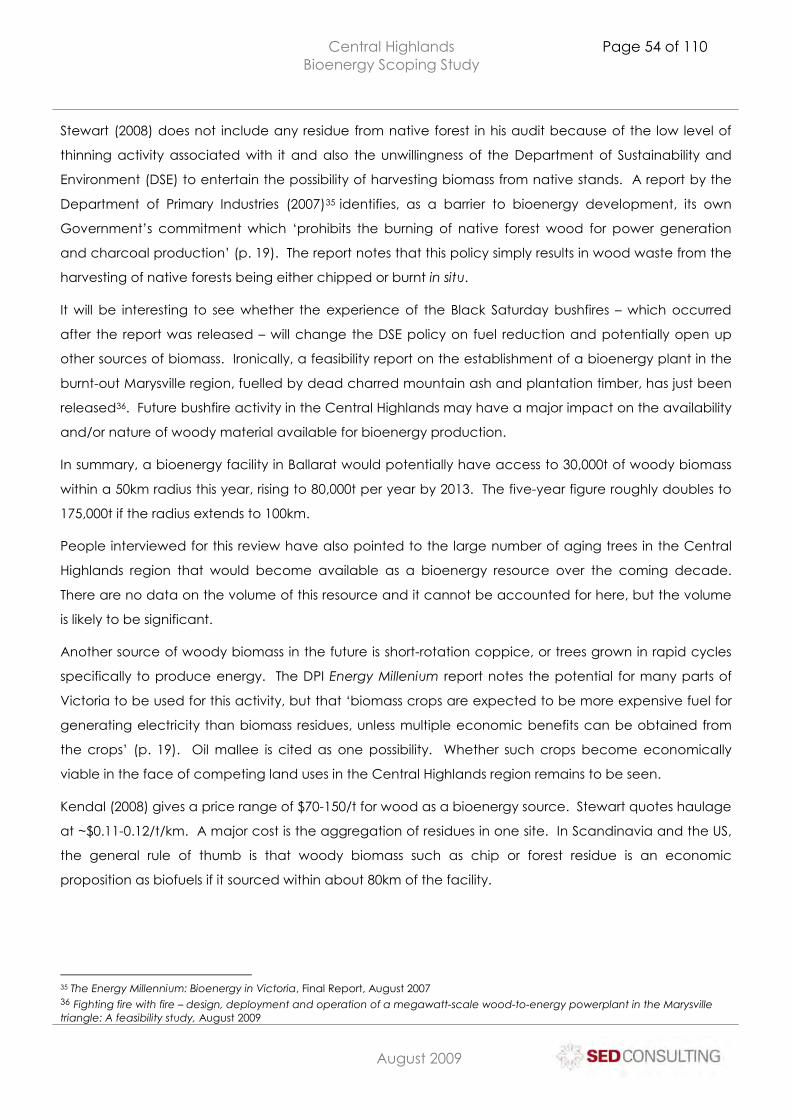
Central Highlands Bioenergy Scoping Study
Page 54 of 110
C:\Documents and Settings\Laurie\My Documents\Laurie\Farm Business\CHAF\Biodiesel and Bioenergy\Bioenergy\Bioenergy Working Group\Working Group Business plan\Business Plan Project\Stage 2 report\LN_CHAF Bioenergy scoping study FINAL.doc
August 2009
Stewart (2008) does not include any residue from native forest in his audit because of the low level of
thinning activity associated with it and also the unwillingness of the Department of Sustainability and
Environment (DSE) to entertain the possibility of harvesting biomass from native stands. A report by the
Department of Primary Industries (2007)35 identifies, as a barrier to bioenergy development, its own
Government’s commitment which ‘prohibits the burning of native forest wood for power generation
and charcoal production’ (p. 19). The report notes that this policy simply results in wood waste from the
harvesting of native forests being either chipped or burnt in situ.
It will be interesting to see whether the experience of the Black Saturday bushfires – which occurred
after the report was released – will change the DSE policy on fuel reduction and potentially open up
other sources of biomass. Ironically, a feasibility report on the establishment of a bioenergy plant in the
burnt-out Marysville region, fuelled by dead charred mountain ash and plantation timber, has just been
released36. Future bushfire activity in the Central Highlands may have a major impact on the availability
and/or nature of woody material available for bioenergy production.
In summary, a bioenergy facility in Ballarat would potentially have access to 30,000t of woody biomass
within a 50km radius this year, rising to 80,000t per year by 2013. The five-year figure roughly doubles to
175,000t if the radius extends to 100km.
People interviewed for this review have also pointed to the large number of aging trees in the Central
Highlands region that would become available as a bioenergy resource over the coming decade.
There are no data on the volume of this resource and it cannot be accounted for here, but the volume
is likely to be significant.
Another source of woody biomass in the future is short-rotation coppice, or trees grown in rapid cycles
specifically to produce energy. The DPI Energy Millenium report notes the potential for many parts of
Victoria to be used for this activity, but that ‘biomass crops are expected to be more expensive fuel for
generating electricity than biomass residues, unless multiple economic benefits can be obtained from
the crops’ (p. 19). Oil mallee is cited as one possibility. Whether such crops become economically
viable in the face of competing land uses in the Central Highlands region remains to be seen.
Kendal (2008) gives a price range of $70-150/t for wood as a bioenergy source. Stewart quotes haulage
at ~$0.11-0.12/t/km. A major cost is the aggregation of residues in one site. In Scandinavia and the US,
the general rule of thumb is that woody biomass such as chip or forest residue is an economic
proposition as biofuels if it sourced within about 80km of the facility.
35 The Energy Millennium: Bioenergy in Victoria, Final Report, August 2007 36 Fighting fire with fire – design, deployment and operation of a megawatt-scale wood-to-energy powerplant in the Marysville triangle: A feasibility study, August 2009
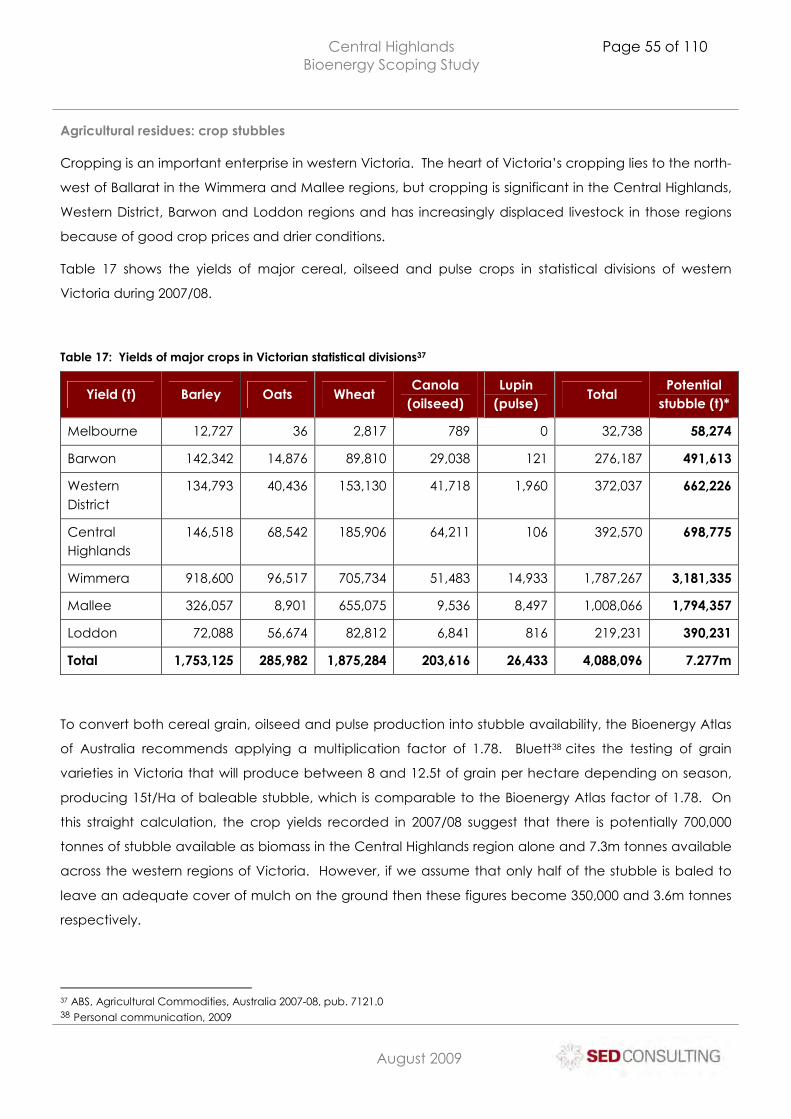
Central Highlands Bioenergy Scoping Study
Page 55 of 110
C:\Documents and Settings\Laurie\My Documents\Laurie\Farm Business\CHAF\Biodiesel and Bioenergy\Bioenergy\Bioenergy Working Group\Working Group Business plan\Business Plan Project\Stage 2 report\LN_CHAF Bioenergy scoping study FINAL.doc
August 2009
Agricultural residues: crop stubbles
Cropping is an important enterprise in western Victoria. The heart of Victoria’s cropping lies to the north-
west of Ballarat in the Wimmera and Mallee regions, but cropping is significant in the Central Highlands,
Western District, Barwon and Loddon regions and has increasingly displaced livestock in those regions
because of good crop prices and drier conditions.
Table 17 shows the yields of major cereal, oilseed and pulse crops in statistical divisions of western
Victoria during 2007/08.
Table 17: Yields of major crops in Victorian statistical divisions37
Yield (t) Barley Oats Wheat Canola
(oilseed) Lupin
(pulse) Total
Potential stubble (t)*
Melbourne 12,727 36 2,817 789 0 32,738 58,274
Barwon 142,342 14,876 89,810 29,038 121 276,187 491,613
Western District
134,793 40,436 153,130 41,718 1,960 372,037 662,226
Central Highlands
146,518 68,542 185,906 64,211 106 392,570 698,775
Wimmera 918,600 96,517 705,734 51,483 14,933 1,787,267 3,181,335
Mallee 326,057 8,901 655,075 9,536 8,497 1,008,066 1,794,357
Loddon 72,088 56,674 82,812 6,841 816 219,231 390,231
Total 1,753,125 285,982 1,875,284 203,616 26,433 4,088,096 7.277m
To convert both cereal grain, oilseed and pulse production into stubble availability, the Bioenergy Atlas
of Australia recommends applying a multiplication factor of 1.78. Bluett38 cites the testing of grain
varieties in Victoria that will produce between 8 and 12.5t of grain per hectare depending on season,
producing 15t/Ha of baleable stubble, which is comparable to the Bioenergy Atlas factor of 1.78. On
this straight calculation, the crop yields recorded in 2007/08 suggest that there is potentially 700,000
tonnes of stubble available as biomass in the Central Highlands region alone and 7.3m tonnes available
across the western regions of Victoria. However, if we assume that only half of the stubble is baled to
leave an adequate cover of mulch on the ground then these figures become 350,000 and 3.6m tonnes
respectively.
37 ABS, Agricultural Commodities, Australia 2007-08, pub. 7121.0 38 Personal communication, 2009
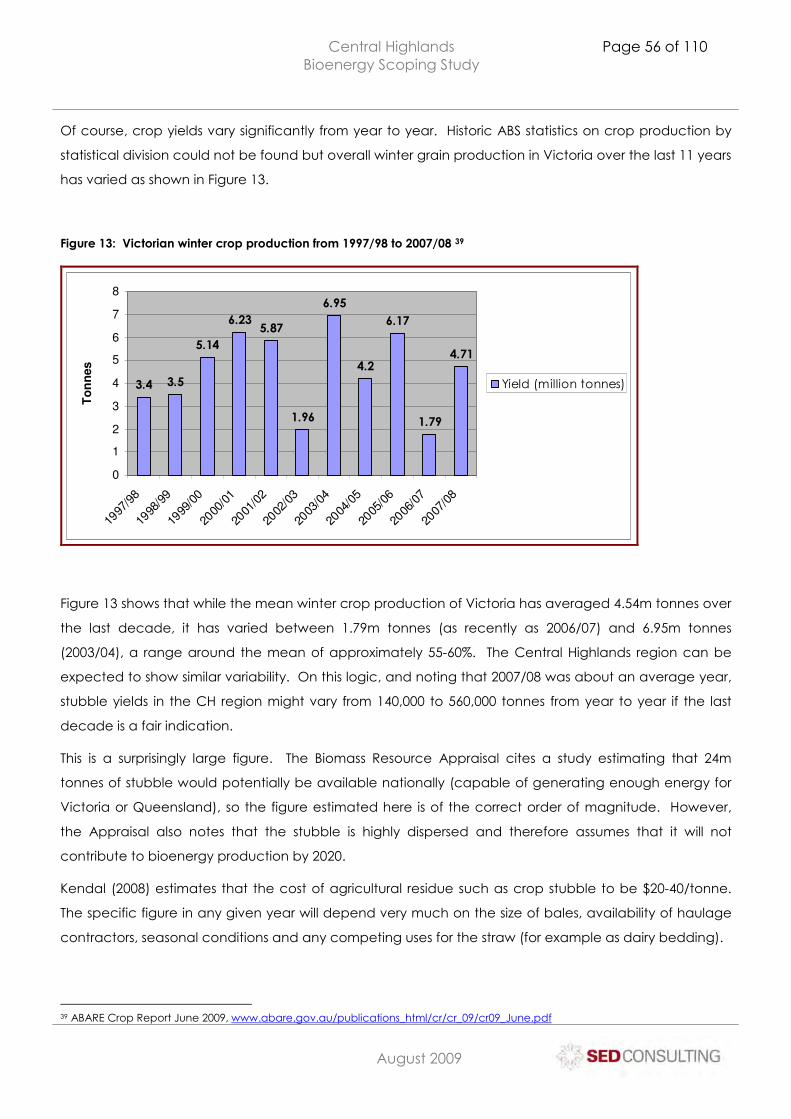
Central Highlands Bioenergy Scoping Study
Page 56 of 110
C:\Documents and Settings\Laurie\My Documents\Laurie\Farm Business\CHAF\Biodiesel and Bioenergy\Bioenergy\Bioenergy Working Group\Working Group Business plan\Business Plan Project\Stage 2 report\LN_CHAF Bioenergy scoping study FINAL.doc
August 2009
Of course, crop yields vary significantly from year to year. Historic ABS statistics on crop production by
statistical division could not be found but overall winter grain production in Victoria over the last 11 years
has varied as shown in Figure 13.
Figure 13: Victorian winter crop production from 1997/98 to 2007/08 39
3.4 3.5
5.14
6.235.87
1.96
6.95
4.2
6.17
1.79
4.71
0
1
2
3
4
5
6
7
8
1997
/98
1998
/99
1999
/00
2000
/01
2001
/02
2002
/03
2003
/04
2004
/05
2005
/06
2006
/07
2007
/08
To
nn
es
Yield (million tonnes)
Figure 13 shows that while the mean winter crop production of Victoria has averaged 4.54m tonnes over
the last decade, it has varied between 1.79m tonnes (as recently as 2006/07) and 6.95m tonnes
(2003/04), a range around the mean of approximately 55-60%. The Central Highlands region can be
expected to show similar variability. On this logic, and noting that 2007/08 was about an average year,
stubble yields in the CH region might vary from 140,000 to 560,000 tonnes from year to year if the last
decade is a fair indication.
This is a surprisingly large figure. The Biomass Resource Appraisal cites a study estimating that 24m
tonnes of stubble would potentially be available nationally (capable of generating enough energy for
Victoria or Queensland), so the figure estimated here is of the correct order of magnitude. However,
the Appraisal also notes that the stubble is highly dispersed and therefore assumes that it will not
contribute to bioenergy production by 2020.
Kendal (2008) estimates that the cost of agricultural residue such as crop stubble to be $20-40/tonne.
The specific figure in any given year will depend very much on the size of bales, availability of haulage
contractors, seasonal conditions and any competing uses for the straw (for example as dairy bedding).
39 ABARE Crop Report June 2009, www.abare.gov.au/publications_html/cr/cr_09/cr09_June.pdf
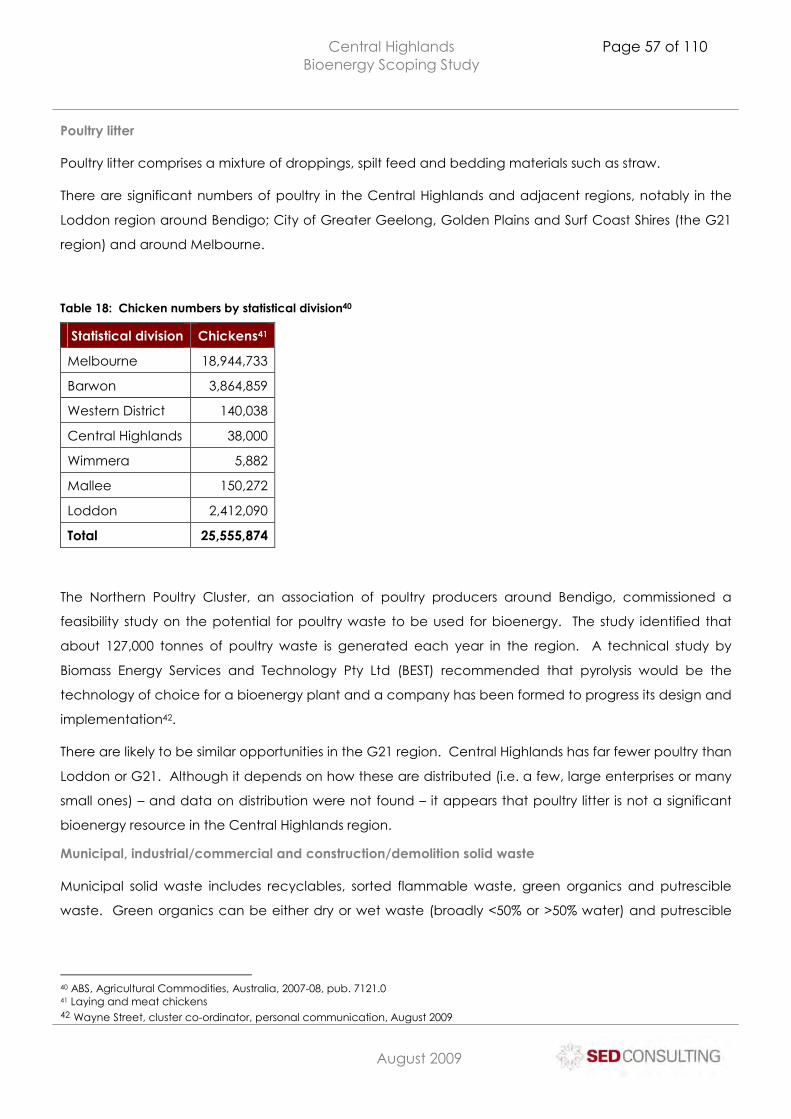
Central Highlands Bioenergy Scoping Study
Page 57 of 110
C:\Documents and Settings\Laurie\My Documents\Laurie\Farm Business\CHAF\Biodiesel and Bioenergy\Bioenergy\Bioenergy Working Group\Working Group Business plan\Business Plan Project\Stage 2 report\LN_CHAF Bioenergy scoping study FINAL.doc
August 2009
Poultry litter
Poultry litter comprises a mixture of droppings, spilt feed and bedding materials such as straw.
There are significant numbers of poultry in the Central Highlands and adjacent regions, notably in the
Loddon region around Bendigo; City of Greater Geelong, Golden Plains and Surf Coast Shires (the G21
region) and around Melbourne.
Table 18: Chicken numbers by statistical division40
Statistical division Chickens41
Melbourne 18,944,733
Barwon 3,864,859
Western District 140,038
Central Highlands 38,000
Wimmera 5,882
Mallee 150,272
Loddon 2,412,090
Total 25,555,874
The Northern Poultry Cluster, an association of poultry producers around Bendigo, commissioned a
feasibility study on the potential for poultry waste to be used for bioenergy. The study identified that
about 127,000 tonnes of poultry waste is generated each year in the region. A technical study by
Biomass Energy Services and Technology Pty Ltd (BEST) recommended that pyrolysis would be the
technology of choice for a bioenergy plant and a company has been formed to progress its design and
implementation42.
There are likely to be similar opportunities in the G21 region. Central Highlands has far fewer poultry than
Loddon or G21. Although it depends on how these are distributed (i.e. a few, large enterprises or many
small ones) – and data on distribution were not found – it appears that poultry litter is not a significant
bioenergy resource in the Central Highlands region.
Municipal, industrial/commercial and construction/demolition solid waste
Municipal solid waste includes recyclables, sorted flammable waste, green organics and putrescible
waste. Green organics can be either dry or wet waste (broadly <50% or >50% water) and putrescible
40 ABS, Agricultural Commodities, Australia, 2007-08, pub. 7121.0 41 Laying and meat chickens 42 Wayne Street, cluster co-ordinator, personal communication, August 2009
Central Highlands Bioenergy Scoping Study
Page 58 of 110
C:\Documents and Settings\Laurie\My Documents\Laurie\Farm Business\CHAF\Biodiesel and Bioenergy\Bioenergy\Bioenergy Working Group\Working Group Business plan\Business Plan Project\Stage 2 report\LN_CHAF Bioenergy scoping study FINAL.doc
August 2009
material such as food scraps is wet waste. The wet waste fractions of municipal waste are considered
separately below because energy recovery from them generally requires different technologies.
A study for the Highlands Regional Waste Management Group (HRWMG)43 estimated that there is
c17,000t of garden waste going to landfill from the domestic sector and a further c12,000t from the
commercial and industrial sector (the latter includes 200t of paper waste from various businesses
including McPhersons Printers in Maryborough).
The extent to which this material can be diverted from landfill is another issue. In other municipalities in
Victoria where green waste bins have been provided to households, participation rates are as low as
20% but averaged 63% in one study. Participation tends to increase over time.
Garden waste is also used to produce mulch and compost which will provide competition with its
channelling down a waste-to-energy path. Indeed, the focus of the HRWMG report is on the potential
for organic waste to be captured and composted (or anaerobically digested). The processing of
organics through thermal processes such as pyrolysis and gasification is largely dismissed as
commercially unproven.
The other major source of biomass is from construction and demolition. A study by Organic Recyclers
and the HRWMG in 200044 found that, on 11 construction sites sampled in Ballarat, 15% of waste (around
1.5m3 per site) was timber. At one demolition site, 42% of the non-reused component was timber and a
further 21% was green waste. Another site provided 30% timber described as suitable for chipping.
Overall, Organic Recyclers estimated that ‘hundreds of tonnes’ of timber would be available for
conversion to woodchip from demolition activity in Ballarat each year but that central sorting would be
required because of difficulties in doing so on-site.
This figure is probably conservative. According to the City of Ballarat45, the Smythesdale landfill accepts
13,000t of construction and demolition waste annually. If 30% of this amount is timber or green waste
then around 3,900t might be available for energy recovery. Smythesdale is used by Ballarat but also
Golden Plains and Pyrenees Shire Councils and will soon be used by Hepburn and Central Goldfields
Shires as well.
Wet wastes
Sewage
Sewage from the region is managed by Central Highlands Water (CHW). CHW has 11 wastewater
treatment plants across the region.
The volume and treatment of the raw sewage varies across sites. Ballarat South produces
approximately 1800-2000 dry weight tonnes of biosolids annually. The biosolids are digested and 43 All Environmental Concepts, Organics waste reduction and recovery scoping study, April 2009 44 Ballarat construction and demolition waste market development: Final public report, July 2000 45 www.ballarat.vic.gov.au/Waste_and_Recycling/Landfill/Landfill_-_Opening_Hours_and_Location/print.aspx?printView=true
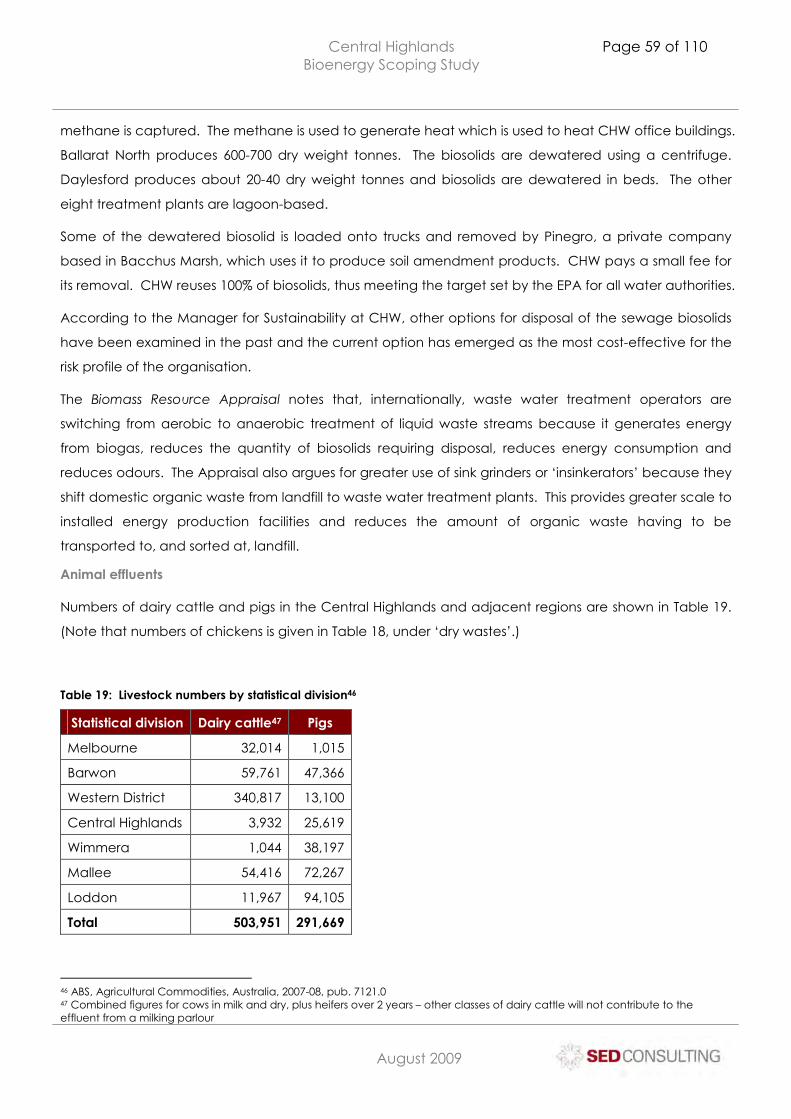
Central Highlands Bioenergy Scoping Study
Page 59 of 110
C:\Documents and Settings\Laurie\My Documents\Laurie\Farm Business\CHAF\Biodiesel and Bioenergy\Bioenergy\Bioenergy Working Group\Working Group Business plan\Business Plan Project\Stage 2 report\LN_CHAF Bioenergy scoping study FINAL.doc
August 2009
methane is captured. The methane is used to generate heat which is used to heat CHW office buildings.
Ballarat North produces 600-700 dry weight tonnes. The biosolids are dewatered using a centrifuge.
Daylesford produces about 20-40 dry weight tonnes and biosolids are dewatered in beds. The other
eight treatment plants are lagoon-based.
Some of the dewatered biosolid is loaded onto trucks and removed by Pinegro, a private company
based in Bacchus Marsh, which uses it to produce soil amendment products. CHW pays a small fee for
its removal. CHW reuses 100% of biosolids, thus meeting the target set by the EPA for all water authorities.
According to the Manager for Sustainability at CHW, other options for disposal of the sewage biosolids
have been examined in the past and the current option has emerged as the most cost-effective for the
risk profile of the organisation.
The Biomass Resource Appraisal notes that, internationally, waste water treatment operators are
switching from aerobic to anaerobic treatment of liquid waste streams because it generates energy
from biogas, reduces the quantity of biosolids requiring disposal, reduces energy consumption and
reduces odours. The Appraisal also argues for greater use of sink grinders or ‘insinkerators’ because they
shift domestic organic waste from landfill to waste water treatment plants. This provides greater scale to
installed energy production facilities and reduces the amount of organic waste having to be
transported to, and sorted at, landfill.
Animal effluents
Numbers of dairy cattle and pigs in the Central Highlands and adjacent regions are shown in Table 19.
(Note that numbers of chickens is given in Table 18, under ‘dry wastes’.)
Table 19: Livestock numbers by statistical division46
Statistical division Dairy cattle47 Pigs
Melbourne 32,014 1,015
Barwon 59,761 47,366
Western District 340,817 13,100
Central Highlands 3,932 25,619
Wimmera 1,044 38,197
Mallee 54,416 72,267
Loddon 11,967 94,105
Total 503,951 291,669
46 ABS, Agricultural Commodities, Australia, 2007-08, pub. 7121.0 47 Combined figures for cows in milk and dry, plus heifers over 2 years – other classes of dairy cattle will not contribute to the effluent from a milking parlour
Central Highlands Bioenergy Scoping Study
Page 60 of 110
C:\Documents and Settings\Laurie\My Documents\Laurie\Farm Business\CHAF\Biodiesel and Bioenergy\Bioenergy\Bioenergy Working Group\Working Group Business plan\Business Plan Project\Stage 2 report\LN_CHAF Bioenergy scoping study FINAL.doc
August 2009
According to the Department of Primary Industries (2007), a 500-cow milking herd will produce as much
effluent as a town of 2,500 people. The effluent is captured because the cows are concentrated in the
milking shed (as distinct from beef cattle operations, for example). However, a system to capture and
convert this waste to energy is most economically located on the farm itself because of the high cost to
transport effluent, which is about 98% water48. Such systems are currently being evaluated in the dairy
industry.
For this reason, and because the dairy industry is concentrated some distance from the Central
Highlands region to the south-west, dairy effluent does not offer a viable feedstock source for a
centralised bioenergy plant.
Pigs present similar story. Ballarat is home to one of the best-known Australian examples of a piggery
bioenergy system, the Berrybank Farm Piggery at Windermere. The 15,000-pig operation generates
180kW/h of electricity over a 16-hour day, enough to power 400 households. The piggery uses 60% of
the electricity it generates and sells the remainder into the grid49.
Municipal and industrial / commercial putrescible waste
The study by All Environmental Concepts (2009) for HRWMG estimated that households in the Central
Highlands region produce around 7,133t of food waste annually. For the commercial and industrial
sector the figure is around 23,782t. This latter figure appears to include tens of thousands of poultry
carcases disposed of to a landfill operated by Bamganie Environmental Solutions at Lethbridge. It also
includes waste from several major food processors in the region including:
� McCain: according to Sustainability Victoria50, McCain uses at least some of its potato waste to
generate heat which is presumably used on-site. The All Environmental Concepts (2009) report was
unable to provide any detail on McCain waste management but ‘understood significant volumes of
dough materials containing meat and vegetable products are currently sent to Smythesdale landfill’.
� Mars: detail is not available on any putrescible waste produced by Mars. However, some waste
confectionary is understood to be used by the Berrybank Piggery to feed to pigs.
These figures indicate a total of around 31,000t of putrescible material currently going to landfill in the
region. As noted above, however, the proportion of this resource that would be recoverable will
depend on systems put in place to capture it and willingness of producers to participate. A number of
the companies interviewed for the All Environmental Concepts (2009) report were not prepared to
discuss their waste management practices by the authors.
48 Dairying for Tomorrow factsheet, www.dairyingfortomorrow.com/uploads/documents/file/effluent%20docs/Capturing%20Methane%20for%20Bio-energy%20-%20amended%2008-10-23.pdf 49 University of Ballarat case study 2004 50 Sustainability Victoria, www.sustainability.vic.gov.au/www/html/2101-operating-biomass-generators-in-victoria.asp
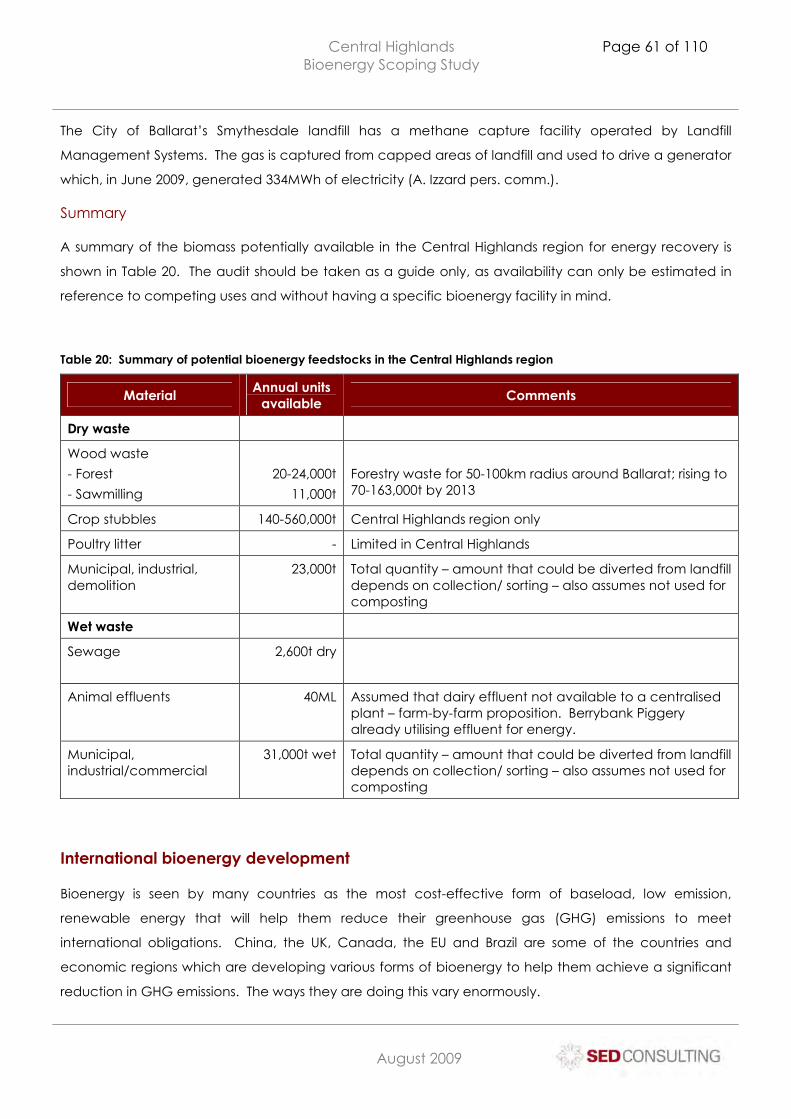
Central Highlands Bioenergy Scoping Study
Page 61 of 110
C:\Documents and Settings\Laurie\My Documents\Laurie\Farm Business\CHAF\Biodiesel and Bioenergy\Bioenergy\Bioenergy Working Group\Working Group Business plan\Business Plan Project\Stage 2 report\LN_CHAF Bioenergy scoping study FINAL.doc
August 2009
The City of Ballarat’s Smythesdale landfill has a methane capture facility operated by Landfill
Management Systems. The gas is captured from capped areas of landfill and used to drive a generator
which, in June 2009, generated 334MWh of electricity (A. Izzard pers. comm.).
Summary
A summary of the biomass potentially available in the Central Highlands region for energy recovery is
shown in Table 20. The audit should be taken as a guide only, as availability can only be estimated in
reference to competing uses and without having a specific bioenergy facility in mind.
Table 20: Summary of potential bioenergy feedstocks in the Central Highlands region
Material Annual units
available Comments
Dry waste
Wood waste
- Forest
- Sawmilling
20-24,000t
11,000t
Forestry waste for 50-100km radius around Ballarat; rising to 70-163,000t by 2013
Crop stubbles 140-560,000t Central Highlands region only
Poultry litter - Limited in Central Highlands
Municipal, industrial, demolition
23,000t Total quantity – amount that could be diverted from landfill depends on collection/ sorting – also assumes not used for composting
Wet waste
Sewage 2,600t dry
Animal effluents 40ML Assumed that dairy effluent not available to a centralised plant – farm-by-farm proposition. Berrybank Piggery already utilising effluent for energy.
Municipal, industrial/commercial
31,000t wet Total quantity – amount that could be diverted from landfill depends on collection/ sorting – also assumes not used for composting
International bioenergy development
Bioenergy is seen by many countries as the most cost-effective form of baseload, low emission,
renewable energy that will help them reduce their greenhouse gas (GHG) emissions to meet
international obligations. China, the UK, Canada, the EU and Brazil are some of the countries and
economic regions which are developing various forms of bioenergy to help them achieve a significant
reduction in GHG emissions. The ways they are doing this vary enormously.
Central Highlands Bioenergy Scoping Study
Page 62 of 110
C:\Documents and Settings\Laurie\My Documents\Laurie\Farm Business\CHAF\Biodiesel and Bioenergy\Bioenergy\Bioenergy Working Group\Working Group Business plan\Business Plan Project\Stage 2 report\LN_CHAF Bioenergy scoping study FINAL.doc
August 2009
Brazil
Brazil has focussed on biofuels production. It has diversified and expanded its sugar gum cane industry
to become the second largest producer of ethanol and largest exporter. It is producing about 4% of its
national electricity needs from bagasse (the residue from cane processing) and aims to increase this to
14% by making use of the harvest residue presently burned in the field before and after harvest. Now
about 54% of all fuel for light vehicles is raw ethanol, and Brazil claims to have reduced its GHG emissions
by 90% on the 1990 national figure. Brazil grows cane mainly in the south-east over about 3.4 million ha
(or 1% of its area) and has capacity to expand by putting some of over 20 million ha of degraded
pasture land in that region under sugar cane. Already Brazil produces 3% of its electricity from sugar
cane bagasse and could intends to increase this to 14% by utilising the remainder of harvest residues.
China
China has drawn on Danish straw-fired furnace designs and technology since 2003 to develop its own
bioenergy plants mainly fuelled by baled straw. By mid-2009 it has about 19 plants being fuelled by
about 5 million tonnes of dry agricultural residue annually. By the end of 2010 this will have expanded to
40 plants (mostly about 25-30 MW-e) and will be using about 10 million tonnes of the available 300
million tonnes that is presently being simply burned by farmers in the fields. The aim is to dramatically
expand bioenergy capacity to provide up to 20% of China’s energy. The estimated billion tonnes a
year of forestry residue and timber industry waste will also be able to be used to fuel bioenergy plants
and for biofuel production feedstock.
China is rapidly developing a ligno-cellulosic biomass to ethanol capacity, again in partnership with
Danish and Swedish companies. Spare heat from bioenergy plants will be able to be used in this
process.
Sweden
Sweden has gone along the road of using woody biomass for energy to replace not just coal and oil
fuelling of power plant furnaces, but also most recently to begin to allow the decommissioning of
nuclear plants as they come to the end of their effective life. Bioenergy now produces about 28% of
Sweden’s national energy requirements. It is mainly fuelled by forestry thinnings, residues and timber
industry by-product, but also by gas from anaerobic fermentation of putrescible organic waste.
Municipal solid waste (MSW) is presently seen by the Swedes as being in the same green category as
biomass as a fuel, and some larger CHP plants use MSW as their exclusive fuel; for example Malmö in
southern Sweden generates heat and electricity from about 500,000 tonnes a year of MSW.
Swedish case study 1 – Torsvik plant
In Sweden municipal solid waste – MSW, is classed as a ‘green’ fuel, regarded as carbon neutral and in
the statistics is combined with biomass. Electricity made using this fuel qualifies for saleable Green
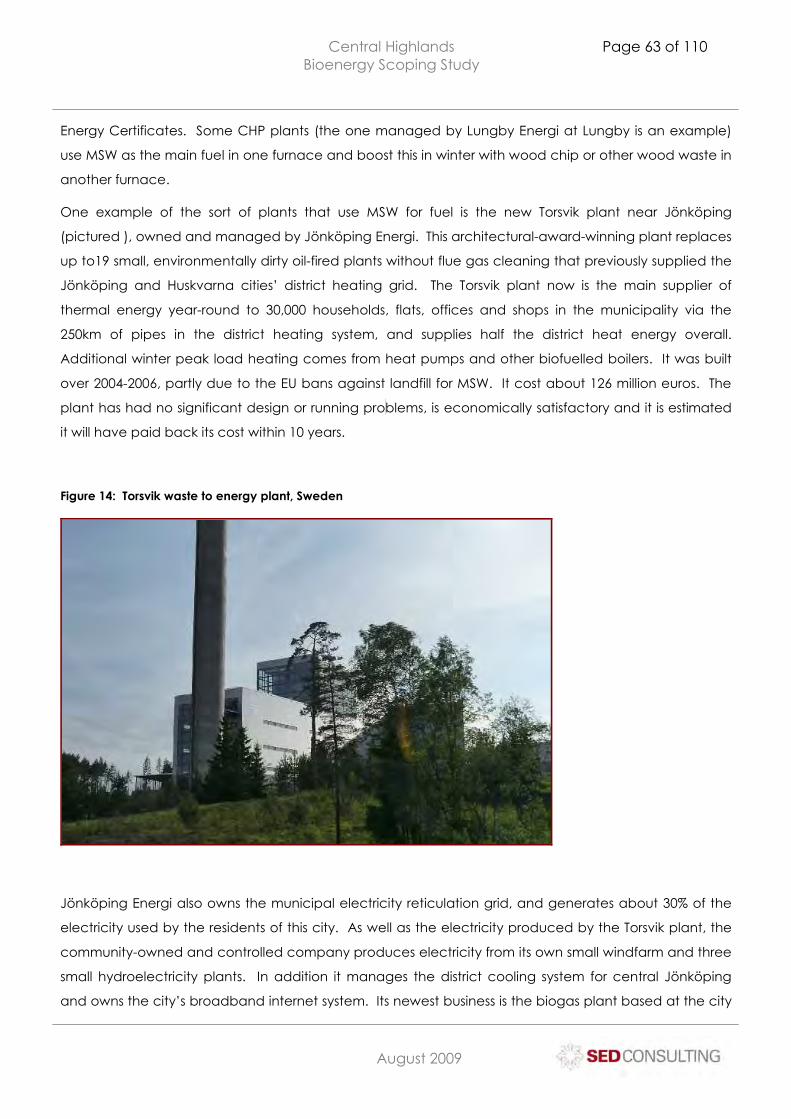
Central Highlands Bioenergy Scoping Study
Page 63 of 110
C:\Documents and Settings\Laurie\My Documents\Laurie\Farm Business\CHAF\Biodiesel and Bioenergy\Bioenergy\Bioenergy Working Group\Working Group Business plan\Business Plan Project\Stage 2 report\LN_CHAF Bioenergy scoping study FINAL.doc
August 2009
Energy Certificates. Some CHP plants (the one managed by Lungby Energi at Lungby is an example)
use MSW as the main fuel in one furnace and boost this in winter with wood chip or other wood waste in
another furnace.
One example of the sort of plants that use MSW for fuel is the new Torsvik plant near Jönköping
(pictured ), owned and managed by Jönköping Energi. This architectural-award-winning plant replaces
up to19 small, environmentally dirty oil-fired plants without flue gas cleaning that previously supplied the
Jönköping and Huskvarna cities’ district heating grid. The Torsvik plant now is the main supplier of
thermal energy year-round to 30,000 households, flats, offices and shops in the municipality via the
250km of pipes in the district heating system, and supplies half the district heat energy overall.
Additional winter peak load heating comes from heat pumps and other biofuelled boilers. It was built
over 2004-2006, partly due to the EU bans against landfill for MSW. It cost about 126 million euros. The
plant has had no significant design or running pro blems, is economically satisfactory and it is estimated
it will have paid back its cost within 10 years.
Figure 14: Torsvik waste to energy plant, Sweden
Jönköping Energi also owns the municipal electricity reticulation grid, and generates about 30% of the
electricity used by the residents of this city. As well as the electricity produced by the Torsvik plant, the
community-owned and controlled company produces electricity from its own small windfarm and three
small hydroelectricity plants. In addition it manages the district cooling system for central Jönköping
and owns the city’s broadband internet system. Its newest business is the biogas plant based at the city
Central Highlands Bioenergy Scoping Study
Page 64 of 110
C:\Documents and Settings\Laurie\My Documents\Laurie\Farm Business\CHAF\Biodiesel and Bioenergy\Bioenergy\Bioenergy Working Group\Working Group Business plan\Business Plan Project\Stage 2 report\LN_CHAF Bioenergy scoping study FINAL.doc
August 2009
sewage treatment plant. This produces and sells biogas upgraded to 97% methane for the municipal
fleet (including diesel garbage trucks and buses) and private cars.
40-50 loads daily of waste from all industrial and domestic sources come to the plant in collection trucks
from the city and more distant urban centres. Each truck is weighed in and out and 40 euros/tonne
charged on the waste. Spot checks are made on the waste to detect and penalise for contaminants.
The trucks tip into a 16m deep 17,000m3 bunker, and two computer-controlled travelling 6m3 grabs
constantly mix it and regularly feed the furnace. Moisture content of the waste is high at 40-50% (this will
fall as more organic household waste diverts to the biogas plant). Constant mixing evens the moisture
content and prevents development of hot spots and odour. The plant is entirely run from the control
room and it has from 3-10 people working at any time.
The plant uses about 20 tonne of MSW an hour (160,000 t/yr) to feed the reciprocating grate-type
furnace with its 64m2 floor area. MSW has an energy value of 2.6-5.6 megawatt hours per tonne (MWh/t)
(wood chip is about 2.5 MWh/t, black coal is 7MWh/t, brown coal is about 2.5MWh/t).
The furnace has a rating of 61 MW. It has several oil-fired burners to bring the furnace temperature up
to operation level after annual maintenance shut-down and to cut in if furnace temperature drops
toward the minimum operating figure of about 850C. Normal temperature in the furnace is about
1000C, meaning that problem organic compounds such as dioxins are not formed.
Steam temperature is 380C and pressure is 41 bar. The pressure and steam flow of 22kg/s drives an
intermediate pressure turbine coupled to a 16.2 MW 18,000 kVA generator. The design of the whole
plant ensures its high efficiency of about 92%.
The plant puts100GWh/year of electricity into the national grid, and 340GWh/yr of thermal energy into
the district heat grid. About 100km of pipes collects heat within the furnace and flue gas system. This
collection and utilisation of heat means that there is no need for any other water cooling system for the
plant, and gives the high overall efficiency. A large amount of heat is also collected at the steam
condenser.
An important part of the district heating system is the accumulator tank. These are found at almost all
CHP or DH plants and are designed to store energy as hot water for peak load periods and to even out
heat supply. The accumulator at this plant was 5,800m3 capacity and could store up to 75MW. Within
the district heating grid heat is drawn via heat exchangers, with the volume of water staying constant.
The average unit volume of water leaves the plant 13km from the city centre at about 98C, takes about
2 hours to pass around the grid and returns at about 50C.
The furnace slag is sent to a specialist recycler who recovers the metal and can sell the residue to
Denmark for use as road base. The plant produces about 2-3 tonne of slag an hour or 17-20,000 tonne
per year. MSW generally produces up to 15% of its dry weight as slag.
Central Highlands Bioenergy Scoping Study
Page 65 of 110
C:\Documents and Settings\Laurie\My Documents\Laurie\Farm Business\CHAF\Biodiesel and Bioenergy\Bioenergy\Bioenergy Working Group\Working Group Business plan\Business Plan Project\Stage 2 report\LN_CHAF Bioenergy scoping study FINAL.doc
August 2009
The flue gas is treated with slaked lime to remove problem gases and is passed through activated
carbon to remove mercury and heavy metals. Capture of the acidic fly ash is done by sucking the flue
gas through layers of coated fabric filters with a total surface area of 3371m2. The fly ash captured here
is less than 5% of the fuel dry weight, or under one tonne/hour. Flue gas then passes through a two-step
acid/neutral scrubber. About 7 m3/hour of condensate water is then recaptured. The remaining heat in
the flue gas before it goes out the plant’s 120 m high stack is largely recovered by using it to pre-heat
the returning district heating water from 40C to about 70C. The collected condensate is treated by
precipitation to be purer than drinking water. The fly ash is stabilised and sent to landfill in Norway.
The flue gases are continually tested. Torsvik lets out only 2.7kg of heavy metals a year, substantially less
than its permit allows (by contrast in a few hours on each midsummer night across Sweden about 300
tonne of heavy metals are liberated into the atmosphere as the colouring of fireworks). Further details
of flue gas analysis are available from the company’s website www.jonkopingenergi.se.
WTE plants are also all through Sweden. Stockholm, Göteborg, Malmö and Umeå are some of the larger
cities with large waste-fired CHP plants. Some other regional mid to large plants are at Hässleholm
www.hfab.nu, and Halmstad.
Swedish case study 2 – Filbona plant
NSR Atervining is a regional waste treatment and recycling company that runs the Filborna landfill and
recycling station near Helsingborg. It is owned by six surrounding municipalities. Here, in addition to an
extensive recycling and sorting facility, biogas is produced in several ways. Firstly landfill gas is tapped
from capped old landfill pits. Secondly, biogas is produced from ‘pure’ organic waste supplied by food
processors and restaurants in a large reactor (see info following). Thirdly, organic domestic waste and
sorted industrial waste is treated in bio-cells to produce gas. Most of the biogas produced in the first
and third situation goes to two electrical power plants. In the older one two Jenbacker gas motors and
a gas-fired boiler produce 1.17 MW-e, plus 1.6 MW-th for the Helsingborg district heating system to which
the gas boiler adds 4MW-th.
The new plant is a small combined system with a 650kW-e Volvo Aero gas turbine and a 160kW-e steam
turbine. Together their heat output to the district heating system is an additional 1.5 MW.
The main biogas reactor at Filbona takes in about 60,000m3 of food processing waste and
slaughterhouse waste annually into several 1000m3 holding tanks. It chops and churns the waste to a
fine even soup of about 10% solids at about 4m3 per hour. This is then pasteurised at 70C for an hour
(this allows the final sludge to be marketed as suited for all agricultural fertiliser application), and then
fermented for several weeks at about 37C to produce about 6 million Nm3 of raw biogas (about 70%
methane) plus 60,000 tonne of sludge. The sludge is held until it can be pumped 1.5 km to 4 distribution
tanks in the surrounding countryside to be sold as bio-fertiliser.
Central Highlands Bioenergy Scoping Study
Page 66 of 110
C:\Documents and Settings\Laurie\My Documents\Laurie\Farm Business\CHAF\Biodiesel and Bioenergy\Bioenergy\Bioenergy Working Group\Working Group Business plan\Business Plan Project\Stage 2 report\LN_CHAF Bioenergy scoping study FINAL.doc
August 2009
The raw biogas is upgraded to give about 3.2 million Nm3 of biomethane (the equivalent of 3.5 million
litres of petrol) that goes to three filling stations. There are two lines to remove the CO2 and water. The
older one uses the pressure swing adsorbtion (PSA) process, producing about 350 Nm3 of biomethane
from about 600Nm3 of biogas. This process uses the differential adsorption of CO2 under pressure onto
activated charcoal, which is then released by a vacuum cycle and vented. This purified biomethane
goes to a nearby filling station for private cars. The newer line uses the water scrubber process. This uses
the fact that CO2 dissolves 27 times more readily in water when under pressure than methane does. The
small amount of methane that does dissolve is retrieved. Smell is added to this gas, it is fortified with
propane and used to fuel the bus fleets of the municipalities.
The original cost of this whole plant was about 37 million Swedish Kroner (about A$7 million) and it returns
a healthy annual profit. All material coming to the site is charged for and the sale of gas for fuel, of
organic-rated bio-fertiliser, of electricity and heat energy makes the whole plant a good example of
how the combining of the waste resources of the six municipalities benefits everyone, particularly when
fossil fuel prices are rising so dramatically. The plant is at present expanding its receiving area to take
other organic materials.
Denmark
With only about 12% of forest cover, Denmark has focussed much of its bioenergy efforts on developing
the use of straw as a fuel. By 2009 Denmark was committed to burning about a million tonnes of straw a
year – or about a quarter of all straw produced. Some bioenergy plants are entirely fuelled by straw as
large bales. Some previously coal-fired plants have been retrofitted to use a mix of straw and wood
pellets, crushed and injected into the furnace as the coal was. At least 400,000 tonnes of wood chip
and wood pellets are used as fuel, and as Denmark expands its forest cover from 12 to 20% over the
coming 100 years this figure will be able to double.
With its 5.3 million inhabitants in 2.4 million households and high standard of living Denmark generates
about 13 million tonnes of waste a year. As much as possible – in 2005 about 67% - of this total is
recycled and the Danish authorities are constantly striving to reduce the volumes of waste and increase
the fraction recycled.
After recycling comes incineration with energy recovery. About 27% of Denmark’s waste fuels waste-to
-energy plants. Third and last is landfill, generally in specially constructed sites. 6% of waste goes to
landfill and much of this is ash frm WTE plants.
Renewable energy produces over 18% of Denmark’s gross energy. Of this about 40% is from bioenergy,
30% from waste and 20% from wind.
Central Highlands Bioenergy Scoping Study
Page 67 of 110
C:\Documents and Settings\Laurie\My Documents\Laurie\Farm Business\CHAF\Biodiesel and Bioenergy\Bioenergy\Bioenergy Working Group\Working Group Business plan\Business Plan Project\Stage 2 report\LN_CHAF Bioenergy scoping study FINAL.doc
August 2009
There are over 30 WTE plants of various sizes around Copenhagen alone, with the largest,
Westforbraending, using 700,000 tonnes of waste per year and supplying district heat to Copenhagen,
and electricity into the national grid. The first of Denmark’s WTE plants was built in the early 1970’s.
The municipalities in Denmark have the main responsibility of managing the collection and
management of waste. Some combine with neighbouring municipalities to run plants. An example of
such a plant is the AVV plant in NW Jutland near Hørring, which takes waste from six municipalities.
Responsibility for waste separation is placed squarely back on the residents or industry at the source.
Denmark is also a leader in using animal manures to produce biogas. A syndicate of farmers,
government and business has recently built the world’s largest biogas plant at Hostelbro in Jutland. This
will take in about 250,000 m3 of manure slurry from surrounding dairy and pig farms, mostly pumped to
the plant. The biogas produced will mostly be upgraded to biomethane to be used for vehicle fuels
and the excess sold into the EU natural gas reticulation system.
Austria
Austria is a leader in the use of wood pellets for household and commercial space heating. Pellet
heating is increasingly found in conjunction with passive solar house design. The state of Upper Austria
has shown that being in the forefront in environmental development can pay off in attracting industry
and professionals. Upper Austria with its 1.4 million population has a target of having all electricity and
space heating to be produced from renewable energy sources by 2030. It now is the base of seven of
the leading 12 pellet heater manufacturers in the EU, and is a centre for environmental engineering and
architectural design in central Europe.
European Union
The European Union (EU) has set targets for 2020 for all the member countries for 20% reduction of
greenhouse gas emissions. In generally working toward achieving this target they are using one or more
of these above options. They are also working on reducing energy consumption per person by more
recycling, improving public transport and bicycle facilities, improved household energy efficiency, and
development of more cost-effective systems and machinery to gather and process forest and
agricultural residues. More commercially viable processes are being developed for producing vehicle
fuels from ligno-cellulosic material. Fuels like methanol and dimethyl ether (DME) are being trialled in
petrol and diesel vehicles.
Sweden is a leader in this and has a target of ceasing import of fossil fuels by as early as 2025 and
certainly by 2050. Already some of Sweden’s larger cities have much of their bus and car fleets
powered by biomethane or raw ethanol. The methane is produced from sewage and other organic
waste, and the ethanol comes from sugar beet or is imported from Brazil. Stockholm is close to realising
its aim of having its entire bus fleet powered by one or other biofuel.
Central Highlands Bioenergy Scoping Study
Page 68 of 110
C:\Documents and Settings\Laurie\My Documents\Laurie\Farm Business\CHAF\Biodiesel and Bioenergy\Bioenergy\Bioenergy Working Group\Working Group Business plan\Business Plan Project\Stage 2 report\LN_CHAF Bioenergy scoping study FINAL.doc
August 2009
The business case framework
This section Scoping Study is intended to provide a framework for business, industry and municipalities to
consider in moving towards more detailed, individual business case development and project
implementation. Any and each potential bioenergy project will need to be considered on a case-by-
case basis, but the following provides an overview of the components that should comprise that
business case and implementation plan.
The opportunity
Each business case will need to identify the individual opportunity that is considered to exist. This
rationale will vary to some extent between a commercial entity and a local government authority. For
a commercial entity the opportunity may revolve around operational cost reduction, business activity
value-add and/or technology research and development and commercialisation. For a local council
the rationale may be an environmental policy statement or strategy, meeting waste management
targets, cost reduction or taking a leadership stance on climate change. Both commercial and
municipal initiatives may be highly localised, that is within a particular activity site (landfill, factory or
business unit) or may have wider applicability and usage – for example, a municipality-wide bioenergy
plant or a business feeding excess power into external grids. These differentials do not limit or exclude
the potential for project partnerships between the private and public sectors.
Environmental scanning
The business case will need to take into account a range of environmental factors. Sometimes referred
to as a PEST analysis (political, environmental, social and technological), this will incorporate:
� Any political and statutory considerations, some of which have been presented in the Scoping Study;
� Actual environmental issues including impacts, benefits and sustainability of key project components;
� Social and community perceptions, awareness and readiness to adopt proposed projects; and
� Project readiness and applicability of any technological requirements of the project.
Some of these factors may need to be subjected to scenario-setting and cross-benefit analysis
processes to ensure that project risks are identified and mitigation strategies developed to support the
sustainability and viability of the project.
The value chain
An important component of the project planning will be the identification of the value chain, that is, the
interlinking activities that create the project whole. This has increased importance when the scale of
the project is large. These activities can be classed as ‘primary’ and ‘support’. Primary activities would
include:
Central Highlands Bioenergy Scoping Study
Page 69 of 110
C:\Documents and Settings\Laurie\My Documents\Laurie\Farm Business\CHAF\Biodiesel and Bioenergy\Bioenergy\Bioenergy Working Group\Working Group Business plan\Business Plan Project\Stage 2 report\LN_CHAF Bioenergy scoping study FINAL.doc
August 2009
� Logistics;
� Production;
� Distribution; and
� Marketing, sales and service.
Support activities would include:
� Human resources;
� Finance;
� Strategic planning;
� Administration and procurement; and
� Research and development.
The value chain analysis will also help to identify key project partners and their role, contribution and/or
benefit they will derive from the project and specified activities.
Market analysis
The market analysis will more broadly assess the supply and demand components of the project. For a
bioenergy project this may include:
� Input (biomass/feedstocks);
� Potential end-users and market size for the power generated or potential co-products and by-
products;
� Price sensitivities;
� Assessment of the bioenergy project against other forms of renewable energy systems; and
� Analysis of the environmental scan outcomes.
Investment and funding environment
The Global Trends in Sustainable Energy Investment Report (2009) notes that overall global investment in
sustainable energy in 2008 was US$155 billion, a 5% increase over 2007 despite the global recession.
Investment in renewable energy generation projects grew by 13% in 2008 to US$117 billion. The key
components of the investment mix are presented in Figure 15.
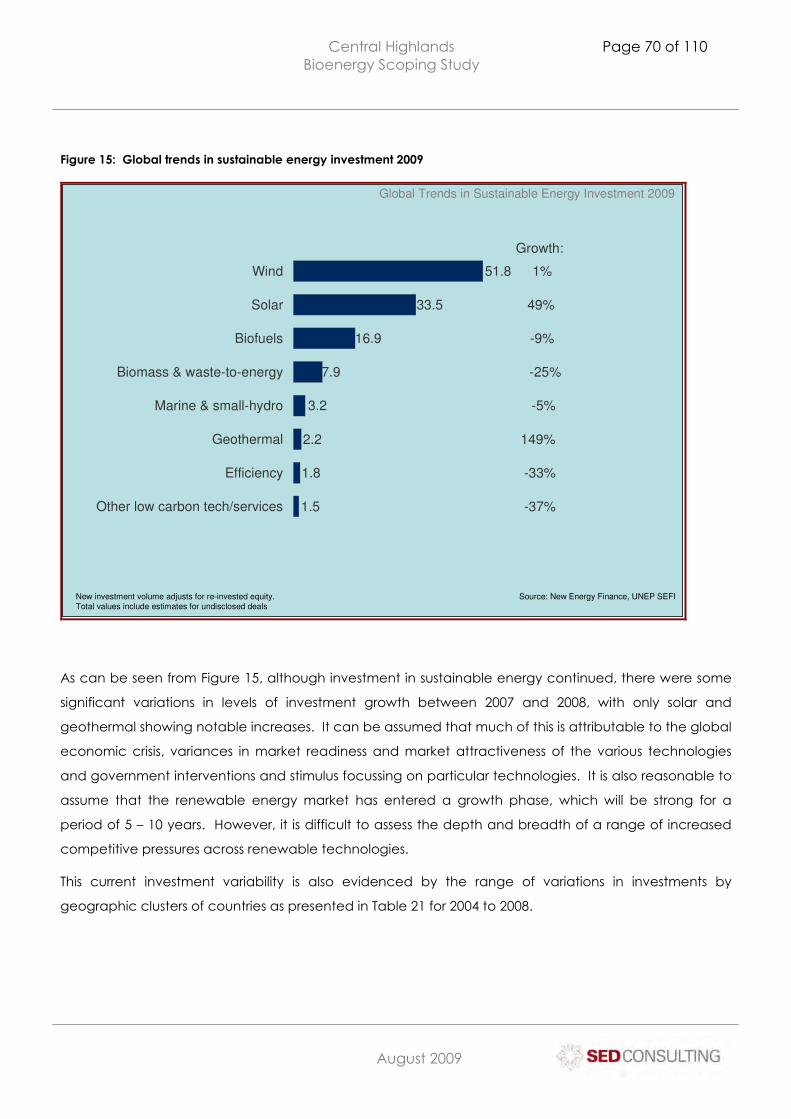
Central Highlands Bioenergy Scoping Study
Page 70 of 110
C:\Documents and Settings\Laurie\My Documents\Laurie\Farm Business\CHAF\Biodiesel and Bioenergy\Bioenergy\Bioenergy Working Group\Working Group Business plan\Business Plan Project\Stage 2 report\LN_CHAF Bioenergy scoping study FINAL.doc
August 2009
Figure 15: Global trends in sustainable energy investment 2009
Global Trends in Sustainable Energy Investment 2009
New investment volume adjusts for re-invested equity. Total values include estimates for undisclosed deals
Source: New Energy Finance, UNEP SEFI
51.8
33.5
16.9
7.9
3.2
2.2
1.8
1.5
1%
49%
-9%
-25%
-5%
149%
-33%
-37%Other low carbon tech/services
Efficiency
Geothermal
Marine & small-hydro
Biomass & waste-to-energy
Biofuels
Solar
Wind
Growth:
As can be seen from Figure 15, although investment in sustainable energy continued, there were some
significant variations in levels of investment growth between 2007 and 2008, with only solar and
geothermal showing notable increases. It can be assumed that much of this is attributable to the global
economic crisis, variances in market readiness and market attractiveness of the various technologies
and government interventions and stimulus focussing on particular technologies. It is also reasonable to
assume that the renewable energy market has entered a growth phase, which will be strong for a
period of 5 – 10 years. However, it is difficult to assess the depth and breadth of a range of increased
competitive pressures across renewable technologies.
This current investment variability is also evidenced by the range of variations in investments by
geographic clusters of countries as presented in Table 21 for 2004 to 2008.
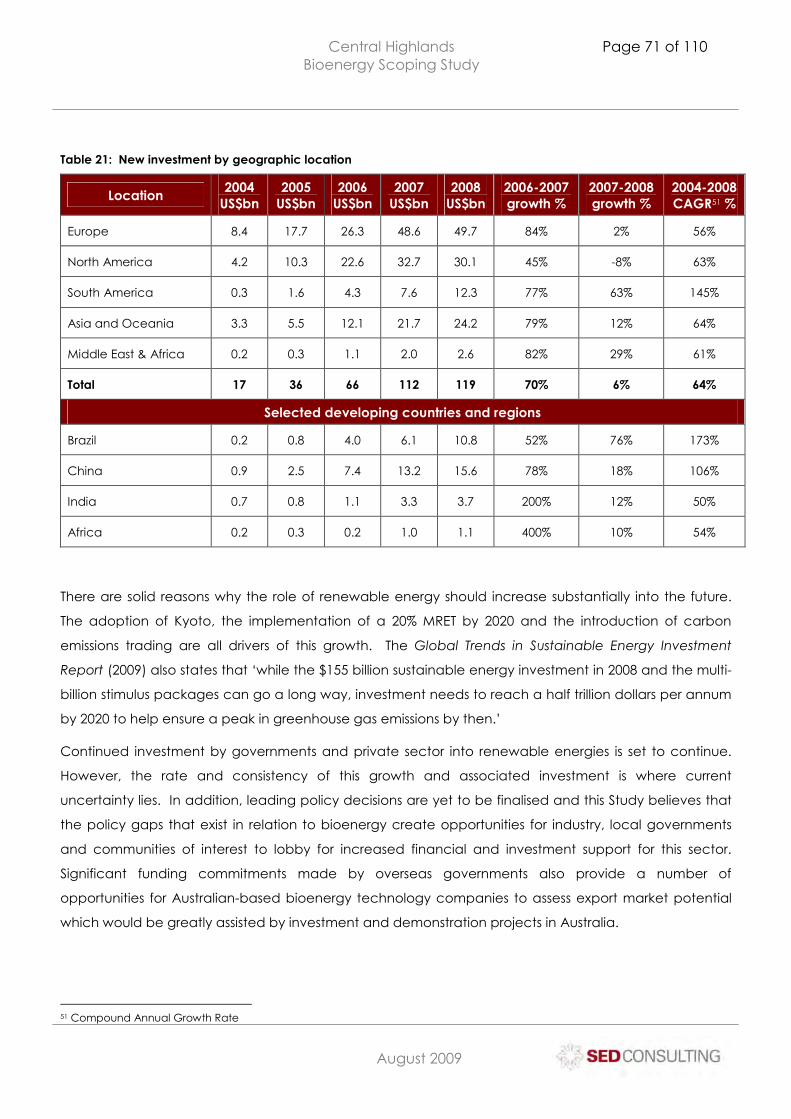
Central Highlands Bioenergy Scoping Study
Page 71 of 110
C:\Documents and Settings\Laurie\My Documents\Laurie\Farm Business\CHAF\Biodiesel and Bioenergy\Bioenergy\Bioenergy Working Group\Working Group Business plan\Business Plan Project\Stage 2 report\LN_CHAF Bioenergy scoping study FINAL.doc
August 2009
Table 21: New investment by geographic location
Location 2004
US$bn 2005
US$bn 2006
US$bn 2007
US$bn 2008
US$bn 2006-2007 growth %
2007-2008 growth %
2004-2008 CAGR51 %
Europe 8.4 17.7 26.3 48.6 49.7 84% 2% 56%
North America 4.2 10.3 22.6 32.7 30.1 45% -8% 63%
South America 0.3 1.6 4.3 7.6 12.3 77% 63% 145%
Asia and Oceania 3.3 5.5 12.1 21.7 24.2 79% 12% 64%
Middle East & Africa 0.2 0.3 1.1 2.0 2.6 82% 29% 61%
Total 17 36 66 112 119 70% 6% 64%
Selected developing countries and regions
Brazil 0.2 0.8 4.0 6.1 10.8 52% 76% 173%
China 0.9 2.5 7.4 13.2 15.6 78% 18% 106%
India 0.7 0.8 1.1 3.3 3.7 200% 12% 50%
Africa 0.2 0.3 0.2 1.0 1.1 400% 10% 54%
There are solid reasons why the role of renewable energy should increase substantially into the future.
The adoption of Kyoto, the implementation of a 20% MRET by 2020 and the introduction of carbon
emissions trading are all drivers of this growth. The Global Trends in Sustainable Energy Investment
Report (2009) also states that ‘while the $155 billion sustainable energy investment in 2008 and the multi-
billion stimulus packages can go a long way, investment needs to reach a half trillion dollars per annum
by 2020 to help ensure a peak in greenhouse gas emissions by then.’
Continued investment by governments and private sector into renewable energies is set to continue.
However, the rate and consistency of this growth and associated investment is where current
uncertainty lies. In addition, leading policy decisions are yet to be finalised and this Study believes that
the policy gaps that exist in relation to bioenergy create opportunities for industry, local governments
and communities of interest to lobby for increased financial and investment support for this sector.
Significant funding commitments made by overseas governments also provide a number of
opportunities for Australian-based bioenergy technology companies to assess export market potential
which would be greatly assisted by investment and demonstration projects in Australia.
51 Compound Annual Growth Rate
Central Highlands Bioenergy Scoping Study
Page 72 of 110
C:\Documents and Settings\Laurie\My Documents\Laurie\Farm Business\CHAF\Biodiesel and Bioenergy\Bioenergy\Bioenergy Working Group\Working Group Business plan\Business Plan Project\Stage 2 report\LN_CHAF Bioenergy scoping study FINAL.doc
August 2009
Funds and grants from Australian governments
The Australian and Victorian Governments have established a number of programs to advance the
renewable energy industry through innovation, commercialisation and deployment. These include and
have included:
� Mandatory Renewable Energy Target and Renewable Energy Certificates – Federal (ORER);
� Low Emissions Technology and Abatement initiative – Federal (DEWHA);
� Renewable Remote Power Generation Programme – Federal (DEWHA);
� Renewable Energy Commercialisation Program – Federal (DEWHA);
� Clean Business Australia including Climate Ready, Re-Tooling for Climate Change and the Green
Building Fund – Federal (AusIndustry);
� Clean Energy Program – Federal (DRET);
� Renewable Energy Demonstration Program – Federal (DRET);
� Commercialising Emerging Technologies (COMET) – Federal (AusIndustry);
� Green Loans – Federal (DEWHA);
� Green Precincts Fund – Federal (DEWHA);
� Renewable Energy Equity Fund – Federal (AusIndustry);
� FarmReady Industry Grants – Federal (DAFF);
� Green Power – Federal (administered by Sustainability Victoria);
� Innovation Investment Fund (IIF) – Federal (AusIndustry);
� Forest Industries Development Fund – Federal (DAFF);
� Climate Change Research Program – Federal (DAFF);
� Energy Grants Credi Scheme – Federal (ATO);
� Renewable Energy Industry Development Program – Federal (DEWHA);
� Victorian Renewable Energy Target and Victorain Renewable Energy Credits;
� Energy Technology Innovation Strategy – VIC – (DPI);
� Sustainability Fund – VIC (SV);
� Regional Towards Zero Waste Support Program – VIC (SV); and
� Water and Energy Efficiency (RIDF) – VIC (RDV).
Central Highlands Bioenergy Scoping Study
Page 73 of 110
C:\Documents and Settings\Laurie\My Documents\Laurie\Farm Business\CHAF\Biodiesel and Bioenergy\Bioenergy\Bioenergy Working Group\Working Group Business plan\Business Plan Project\Stage 2 report\LN_CHAF Bioenergy scoping study FINAL.doc
August 2009
On investigation, most of these programs are or were designed to assist in the development of new
renewable technologies or, for example, to support small communities in installing renewable energy
remote power facilities. The timing of the project/funding application, facility type, the technology
employed and the profile of the funding applicant will determine the fund, grant or rebate scheme that
will apply to a particular project.
Financials
Capital costs
Central Highlands Bioenergy Scoping Study
Page 74 of 110
C:\Documents and Settings\Laurie\My Documents\Laurie\Farm Business\CHAF\Biodiesel and Bioenergy\Bioenergy\Bioenergy Working Group\Working Group Business plan\Business Plan Project\Stage 2 report\LN_CHAF Bioenergy scoping study FINAL.doc
August 2009
Table 22 provides a profile of various example bioenergy plants, their energy supply capabilities and
required feedstocks. Facility size and type will be almost solely dictated by assessment of
feedstocks/biomass. This would need to include assessments of the location, type and quantity of
feedstocks in the following example areas:
� Cost efficiencies in relation to transport, distribution and storage of feedstocks;
� Limiting environment impacts caused by transportation of feedstocks; and
� Sustainability of feedstock supplies.
Feedstock supplies can vary quite considerably from region to region. Once this assessment has been
completed, then the process of identifying the most appropriate facility type and technologies can be
made.
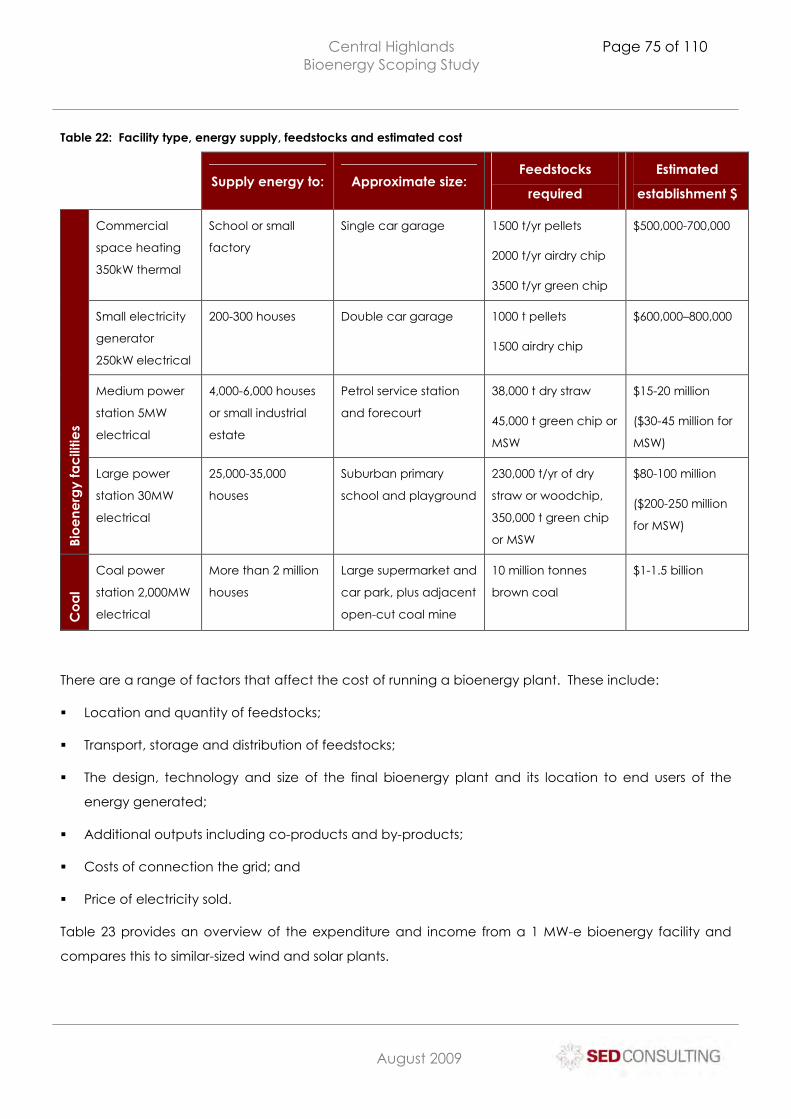
Central Highlands Bioenergy Scoping Study
Page 75 of 110
C:\Documents and Settings\Laurie\My Documents\Laurie\Farm Business\CHAF\Biodiesel and Bioenergy\Bioenergy\Bioenergy Working Group\Working Group Business plan\Business Plan Project\Stage 2 report\LN_CHAF Bioenergy scoping study FINAL.doc
August 2009
Table 22: Facility type, energy supply, feedstocks and estimated cost
Supply energy to: Approximate size: Feedstocks
required
Estimated
establishment $
Commercial
space heating
350kW thermal
School or small
factory
Single car garage 1500 t/yr pellets
2000 t/yr airdry chip
3500 t/yr green chip
$500,000-700,000
Small electricity
generator
250kW electrical
200-300 houses Double car garage 1000 t pellets
1500 airdry chip
$600,000–800,000
Medium power
station 5MW
electrical
4,000-6,000 houses
or small industrial
estate
Petrol service station
and forecourt
38,000 t dry straw
45,000 t green chip or
MSW
$15-20 million
($30-45 million for
MSW)
Bio
en
erg
y fa
cili
ties
Large power
station 30MW
electrical
25,000-35,000
houses
Suburban primary
school and playground
230,000 t/yr of dry
straw or woodchip,
350,000 t green chip
or MSW
$80-100 million
($200-250 million
for MSW)
Co
al
Coal power
station 2,000MW
electrical
More than 2 million
houses
Large supermarket and
car park, plus adjacent
open-cut coal mine
10 million tonnes
brown coal
$1-1.5 billion
There are a range of factors that affect the cost of running a bioenergy plant. These include:
� Location and quantity of feedstocks;
� Transport, storage and distribution of feedstocks;
� The design, technology and size of the final bioenergy plant and its location to end users of the
energy generated;
� Additional outputs including co-products and by-products;
� Costs of connection the grid; and
� Price of electricity sold.
Table 23 provides an overview of the expenditure and income from a 1 MW-e bioenergy facility and
compares this to similar-sized wind and solar plants.
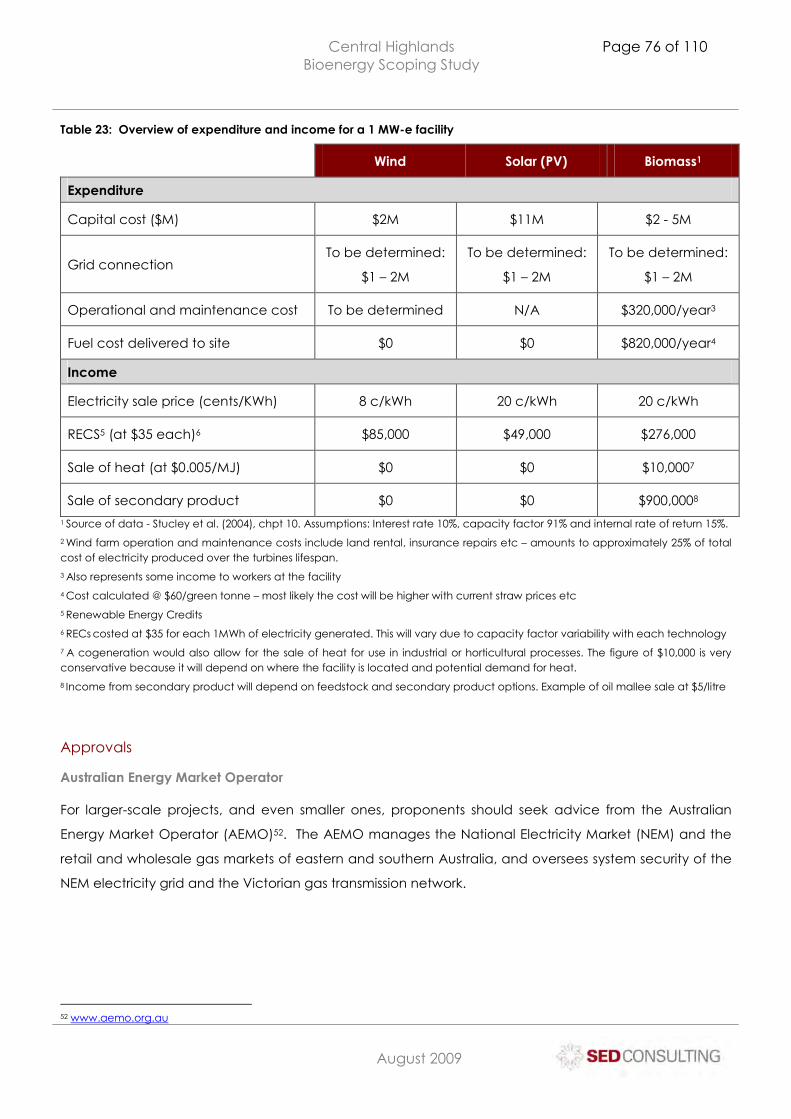
Central Highlands Bioenergy Scoping Study
Page 76 of 110
C:\Documents and Settings\Laurie\My Documents\Laurie\Farm Business\CHAF\Biodiesel and Bioenergy\Bioenergy\Bioenergy Working Group\Working Group Business plan\Business Plan Project\Stage 2 report\LN_CHAF Bioenergy scoping study FINAL.doc
August 2009
Table 23: Overview of expenditure and income for a 1 MW-e facility
Wind Solar (PV) Biomass1
Expenditure
Capital cost ($M) $2M $11M $2 - 5M
Grid connection To be determined:
$1 – 2M
To be determined:
$1 – 2M
To be determined:
$1 – 2M
Operational and maintenance cost To be determined N/A $320,000/year3
Fuel cost delivered to site $0 $0 $820,000/year4
Income
Electricity sale price (cents/KWh) 8 c/kWh 20 c/kWh 20 c/kWh
RECS5 (at $35 each)6 $85,000 $49,000 $276,000
Sale of heat (at $0.005/MJ) $0 $0 $10,0007
Sale of secondary product $0 $0 $900,0008
1 Source of data - Stucley et al. (2004), chpt 10. Assumptions: Interest rate 10%, capacity factor 91% and internal rate of return 15%.
2 Wind farm operation and maintenance costs include land rental, insurance repairs etc – amounts to approximately 25% of total cost of electricity produced over the turbines lifespan.
3 Also represents some income to workers at the facility
4 Cost calculated @ $60/green tonne – most likely the cost will be higher with current straw prices etc
5 Renewable Energy Credits
6 RECs costed at $35 for each 1MWh of electricity generated. This will vary due to capacity factor variability with each technology
7 A cogeneration would also allow for the sale of heat for use in industrial or horticultural processes. The figure of $10,000 is very conservative because it will depend on where the facility is located and potential demand for heat.
8 Income from secondary product will depend on feedstock and secondary product options. Example of oil mallee sale at $5/litre
Approvals
Australian Energy Market Operator
For larger-scale projects, and even smaller ones, proponents should seek advice from the Australian
Energy Market Operator (AEMO)52. The AEMO manages the National Electricity Market (NEM) and the
retail and wholesale gas markets of eastern and southern Australia, and oversees system security of the
NEM electricity grid and the Victorian gas transmission network.
52 www.aemo.org.au
Central Highlands Bioenergy Scoping Study
Page 77 of 110
C:\Documents and Settings\Laurie\My Documents\Laurie\Farm Business\CHAF\Biodiesel and Bioenergy\Bioenergy\Bioenergy Working Group\Working Group Business plan\Business Plan Project\Stage 2 report\LN_CHAF Bioenergy scoping study FINAL.doc
August 2009
Environmental approvals
The Environment Protection Authority Victoria (EPAV) is established under the Environment Protection
Act 1970. It is an independent statutory authority which reports to the Minister for Water, Environment
and Climate Change. The EPAV administers a range of environmental legislation including the:
� Environment Protection Act 1970;
� Pollution of Waters by Oils and Noxious Substances Act 1986; and
� National Environment Protection Council (Victoria) Act 1995.
The EPAV also administers a range of State environment protection policies (SEPPs) and waste
management policies (WMPs) and a number of regulations that relate to that are primarily used to deal
with matters in detail. Regulations are also made to control discharges to the environment that are not
readily licensed. These regulations include:
� Environment Protection (Environment and Resource Efficiency Plans) Regulations 2007;
� Environment Protection (Fees) Regulations 2001;
� Environment Protection (Scheduled Premises and Exemptions) Regulations 2007;
� Environment Protection (Distribution of Landfill Levy) Regulations 2002;
� Environment Protection (Industrial Waste Resource) Regulations 2009;
� Environment Protection (Residential Noise) Regulations 1997;
� Environnent Protection (Vehicle Emissions) Regulations 2003;
� Pollution of Waters by Oil and Noxious Substances Regulations 2002; and
� Environment Protection (Ships' Ballast Water) Regulations 2006.
Of particular relevance to the establishment of bioenergy plants the Environment Protection (Scheduled
Premises and Exemptions) Regulations 2007 where ‘Energy from Waste’ was added as a new category
requiring an EPAV licence and works approval for ‘premises which recover energy from water at rated
capacity of at least 1MW’. Project proponents are advised to contact the EPAV to discuss their
bioenergy project and any associated statutory requirements.
Local government planning approvals
Project proponents will need to discuss their proposals with the local government authority where the
facility is to be located. Local councils administer and approve planning permit applications under their
individual local planning schemes. In broad terms, planning permits assess whether the use of the land
where the development is to occur fits under the zoning and local scheme conditions applied to the
land. The process will also consider any particular planning overlays for example, vegetation protection,
Central Highlands Bioenergy Scoping Study
Page 78 of 110
C:\Documents and Settings\Laurie\My Documents\Laurie\Farm Business\CHAF\Biodiesel and Bioenergy\Bioenergy\Bioenergy Working Group\Working Group Business plan\Business Plan Project\Stage 2 report\LN_CHAF Bioenergy scoping study FINAL.doc
August 2009
design and development and environmental and landscape. A planning permit applies to the use of
the land. A separate building permit may need to be applied for once a planning permit (if required)
has been approved.
Information on all planning schemes in Victoria can be accessed online via the Department of Planning
and Community Development website53, and a list of councils in Victoria and across Australia from the
Australian Local Government Association site54. Most council websites will also provide details on their
planning and building permit processes and required documentation.
Other considerations
Connecting to the grid
Devices connected to the grid must meet Australian official standards and some areas of the power
network may require line upgrades or transformers to support increased load. The Clean Energy
Council’s (CEC) website55 provides information on relevant Australian standards for the design and
installation of Stand-alone Power Supply (SPS) systems, Approved Grid Connect Inverters and PV
modules suitable for installation under the government rebate programs and Renewable Energy
Certificate (REC) schemes, and links to safety authorities and safety information for states. The CEC has
also produced a basic checklist for connection to the power grids in each state56 with the following
being presented without prejudice as the outline process for connecting in Victoria:
� Customer to undertake their own research (which we assume to mean that electricity providers and
retailers do not or will not provide relevant research information per customer);
� Contact an Australian Business Council of Sustainable Energy accredited installer;
� Apply for any applicable rebates;
� Installer/customer to contact the electricity retailer;
� Customer to contact retailer to determine what FITs are available. The installer may be able to
provide this, however the customer is responsible for selecting a retailer and suitable tariff;
� Obtain Network Connection Requirements from the electricity distributor to be used for the design
which is normally the responsibility of the system installer;
� Send Network Connection Requirements to the distributor;
� System may be designed;
� Distributor to approve application to connect to the network which may be known by another title;
53 www.dse.vic.gov.au/planningschemes/index.html 54 www.alga.asn.au/links/obc.php 55 www.bcse.org.au/default.asp?id=7 56 http://cleanenergycouncil.org.au/info/removingimpediments/index.php
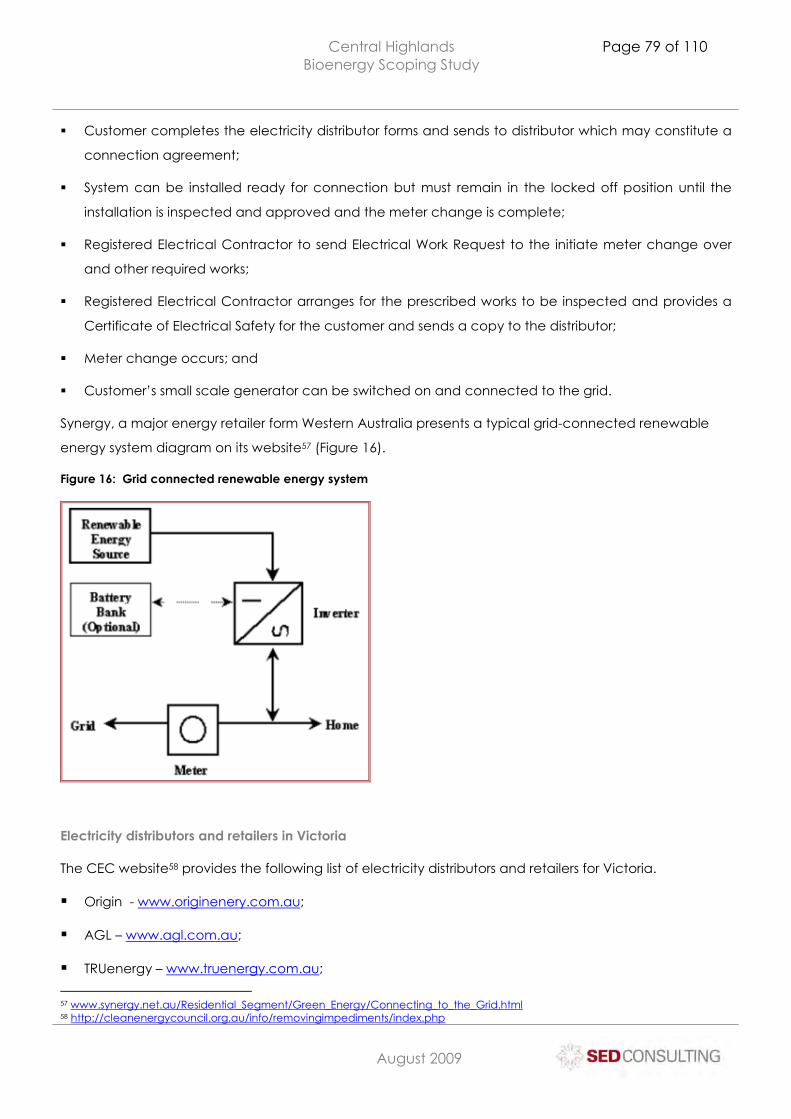
Central Highlands Bioenergy Scoping Study
Page 79 of 110
C:\Documents and Settings\Laurie\My Documents\Laurie\Farm Business\CHAF\Biodiesel and Bioenergy\Bioenergy\Bioenergy Working Group\Working Group Business plan\Business Plan Project\Stage 2 report\LN_CHAF Bioenergy scoping study FINAL.doc
August 2009
� Customer completes the electricity distributor forms and sends to distributor which may constitute a
connection agreement;
� System can be installed ready for connection but must remain in the locked off position until the
installation is inspected and approved and the meter change is complete;
� Registered Electrical Contractor to send Electrical Work Request to the initiate meter change over
and other required works;
� Registered Electrical Contractor arranges for the prescribed works to be inspected and provides a
Certificate of Electrical Safety for the customer and sends a copy to the distributor;
� Meter change occurs; and
� Customer’s small scale generator can be switched on and connected to the grid.
Synergy, a major energy retailer form Western Australia presents a typical grid-connected renewable
energy system diagram on its website57 (Figure 16).
Figure 16: Grid connected renewable energy system
Electricity distributors and retailers in Victoria
The CEC website58 provides the following list of electricity distributors and retailers for Victoria.
� Origin - www.originenery.com.au;
� AGL – www.agl.com.au;
� TRUenergy – www.truenergy.com.au;
57 www.synergy.net.au/Residential_Segment/Green_Energy/Connecting_to_the_Grid.html 58 http://cleanenergycouncil.org.au/info/removingimpediments/index.php
Central Highlands Bioenergy Scoping Study
Page 80 of 110
C:\Documents and Settings\Laurie\My Documents\Laurie\Farm Business\CHAF\Biodiesel and Bioenergy\Bioenergy\Bioenergy Working Group\Working Group Business plan\Business Plan Project\Stage 2 report\LN_CHAF Bioenergy scoping study FINAL.doc
August 2009
� Jemena Electricity Network – www.jemena.com.au;
� United Energy Distribution – www.ue.com.au;
� SP-Aus-net – www.sp-ausnet.com.au;
� CitiPower and Powercor Australia – www.powercor.com.au; and
� Victoria Electricity – www.victoriaelectricity.com.au.
Community awareness and acceptance
As the effects of climate change are increasingly evident and the political responses gain more profile
and momentum, the understanding and awareness of the importance of considering alternative,
renewable energy sources is firmly established within community and individual thinking. Households
and communities are increasingly looking at ways in they can individually and collectively limit their
impact on the environment.
Wind and solar technologies are familiar to most people in Australia. Household solar hot water systems
and energy and resource saving devices are found in nearly every home. In regional and rural areas
the physical landscape is being transformed with the establishment of wind farms. But these changes
have presented the renewable energy sector with many challenges. It has required a paradigm shift in
behaviours and attitudes either through consistent messaging or financial interventions and rewards.
There continue to be divisions of opinions and feelings about the establishment and value of larger
scale renewable energy projects.
Although there is a significant amount of information available on bioenergy and a number of peak
bodies and advocacy groups, the profile and awareness of this energy system within general
populations would be very low. Embarking upon a community information and engagement process to
introduce the topic to the market will be an important process for business and local governments when
moving towards the possible establishment of a facility. A study undertaken in Europe in 2004, Improving
The Public Perception of Bioenergy in the EU: Final Report by Rohracher and others undertook an
analysis of data available about perceptions and identified strategies to building community awareness
and acceptance. Key findings from the report include:
� Like many industrial-scale developments, larger-scale bioenergy projects are highly susceptible to
local influences and influencers around perception;
� The major issues creating local conflicts and oppositions include:
− Siting – where will the plant be located, disposal of by-products, location of biomass and
proximity to residential areas;
− Emission and health hazards – gas and water vapour emissions from the plant, odour, noise
and light, traffic movements and fear of general health hazards;
Central Highlands Bioenergy Scoping Study
Page 81 of 110
C:\Documents and Settings\Laurie\My Documents\Laurie\Farm Business\CHAF\Biodiesel and Bioenergy\Bioenergy\Bioenergy Working Group\Working Group Business plan\Business Plan Project\Stage 2 report\LN_CHAF Bioenergy scoping study FINAL.doc
August 2009
− Traffic – increased traffic movements, truck routes and potential accidents and vehicle noise;
− Environmental/ecological impacts – impacts on flora and fauna, ecosystems, development
buffer zones and dust;
− Landscape and agriculture – changes to the landscape and agricultural production, visual
impacts of the plant and impacts on cultural and heritage landscapes; and
− Economic concerns – low economic benefits to the community versus environmental and
social costs, effects on tourism, compensation issues, effects on property values and low level,
local employment;
� Communities will also be resistant when:
− The development is imposed;
− The technology has not been explained;
− They have not been part of the decision-making process; and
− They believe corporate benefit is greater than community benefit from the project;
� Communities also need to acquire a trust of the project proponent which is particularly important
when it is a private initiative;
� Success factors include:
− Garnering support from a range of local organisations;
− Presenting a sound business and financial strategy;
− Explaining the technology;
− Ensuring the use of local knowledge, partnership and labour; and
− Delivering benefits directly to the community.
� Training, education and knowledge transfer can also be critical success factors and contribute
toward improving community confidence. This should take on many levels including:
− Within the bioenergy community itself;
− Groups of producers, contractors, suppliers and distributors;
− Between governments.
Many of these issues, interventions and solutions are not unique to bioenergy. Many developments
within communities that are new or present a perception of a major change to a community will evoke
similar reactions. The wind energy sector has employed comparable strategies and responses with
broadly positive outcomes for all parties. One potential community acceptance advantage for
Central Highlands Bioenergy Scoping Study
Page 82 of 110
C:\Documents and Settings\Laurie\My Documents\Laurie\Farm Business\CHAF\Biodiesel and Bioenergy\Bioenergy\Bioenergy Working Group\Working Group Business plan\Business Plan Project\Stage 2 report\LN_CHAF Bioenergy scoping study FINAL.doc
August 2009
bioenergy is that energy generation occurs on a relatively small site. The challenge for bioenergy will be
setting the right context around a widely unknown technology.
Bioenergy potential in the Central Highlands region
Technology options for the Central Highlands region
Energy can be derived from biomass using one or more of a number of processes. Some processes are
relatively simple and relatively cheap and can be done on a range of economic scales. This might
include anaerobic fermentation of dairy effluent producing biogas that fuels a gas motor driving an
alternator, and that also produces heat – or the use of woodchip fuel in a furnace to produce hot water
for a hospital’s heating system and laundry needs.
Some plants are complex, involve high-cost equipment, require highly trained technicians and will
normally only be done at a large scale of feedstock availability. Examples of this are the use of sorted
dry municipal waste as a fuel in a combined heat and power plant, or its conversion to ethanol, or to
synthesis gas for energy or biofuels production by other pathways.
Low-moisture-content biomass available in the Ballarat region can be the feedstock for one or more
processes including:
� As a simple furnace fuel substituting for coal, oil or natural gas;
� By heating in absence of oxygen to produce a hydrogen-rich synthesis gas;
� By fast pyrolysis to produce a bio-oil, with similarities to heavy fuel oil; and
� By hydrolysis and fermentation to produce ethanol- for blending with petrol.
Some of the material will be suitable for conversion to pellets. The residues from the fermentation can
also be pelleted or used as solid fuel. Some of these processes could yield a useful grade of biochar.
High-moisture-content biomass, including putrescible municipal waste and agricultural material, can be
mixed, pasteurised and anaerobically fermented to yield about 65% methane content biogas. This can
be upgraded by removal of carbon dioxide and used as a vehicle fuel for petrol and diesel vehicle
motors, and stationary motors driving alternators.
After the fermentation process the resulting sludge can be applied in some way as a liquid manure, or
have its liquid content reduced to the point where it can be sold as a moist spreadable fertiliser, or used
as another feedstock with the other flammable biomass fractions.
Cost and practicality of bioenergy options
� With flammable biomass (other than biomass containing significant amounts of simple sugars) the
most common bioenergy technologies in use at present in the world use it as a fuel in specifically
Central Highlands Bioenergy Scoping Study
Page 83 of 110
C:\Documents and Settings\Laurie\My Documents\Laurie\Farm Business\CHAF\Biodiesel and Bioenergy\Bioenergy\Bioenergy Working Group\Working Group Business plan\Business Plan Project\Stage 2 report\LN_CHAF Bioenergy scoping study FINAL.doc
August 2009
designed furnaces to heat water. This heat energy is then distributed to industrial and domestic
users, and for larger plants (usually over 10MW-th at least) steam is generated to drive electricity
production.
� With biomass that contains significant percentages of simple carbohydrates (sugars and starches),
such as cereal grains or sugar cane, the carbohydrates are fermented to produce ethanol for
blending with petrol for use as a vehicle fuel, or for use as raw ethanol fuel. The developing of
technology for converting the complex carbohydrates of straw and wood into simple
carbohydrates will soon mean that agricultural and forestry residue can be the feedstock for
ethanol production. This route to energy recovery has not been examined in this Study.
� With putrescible biomass the most common approach is to use a batch fermentation process
(usually with several fermenters on the same site, so one is producing biogas while the other is being
filled) to generate biogas (60-70% methane). This biogas can be used to fuel gas motors, or can be
upgraded to 98% methane and used as a vehicle fuel or to be mixed with natural gas.
In the Ballarat region there are adequate volumes of both flammable and putrescible biomass
(including MSW) for the necessary economies of scale for both main types of bioenergy plant. This
assumes that there are adequate returns for the products of heat, electricity and or bio-methane. The
economics may be presently more influenced by the alternate costs of disposal or treatment of
municipal wastes.
Likely outputs and usage potential
With the biomass volumes available in the Ballarat region a number of viable scenarios could be
explored that can be found in other parts of the world in similar sized communities, and with similar cost
structures, and the sort of energy and carbon values that may apply after the CPRS takes effect (2010).
The biomass audit in this Scoping Study shows specific figures for the availability of various biomass
fractions. However biomass volumes can change in response to changed economics and other factors
and it is certain that over the coming years there will be sizeable moves in market signals that will cause
such changes, just as there have been in Sweden and other countries as a carbon price was
implemented and other legislation took effect.
For dry biomass: Assume about 50,000 tonne/yr for sorted flammable municipal waste with an energy
value of about 2.5 MWh per tonne. Assume 80,000 tonne/yr of plantation harvest waste and thinnings,
plus urban waste wood and other woody weeds (pine wildlings, willows, gorse). Chipped green woody
biomass has an energy value of approximately 2.7 MWh/tonne.
Scenario one
This MSW volume could fire a moving grate furnace and 12 MW capacity boiler, and the woody
biomass volume could fire a fluidised circulating bed furnace and 25 MW capacity boiler. The
Central Highlands Bioenergy Scoping Study
Page 84 of 110
C:\Documents and Settings\Laurie\My Documents\Laurie\Farm Business\CHAF\Biodiesel and Bioenergy\Bioenergy\Bioenergy Working Group\Working Group Business plan\Business Plan Project\Stage 2 report\LN_CHAF Bioenergy scoping study FINAL.doc
August 2009
combined boiler output is able to generate 8-12 MW electricity depending on steam temperature and
pressure. About 25-28 MW of heat energy is available for industrial heat and for conversion to cooling.
A CHP plant within Ballarat near industries and institutions requiring substantial heat, steam and cooling
would use woody biomass and sorted MSW in these two separate furnace/boiler systems to produce this
electricity and heat energy. Having the two separate furnaces allows some flexibility in output and
means that at any one time one boiler can be operating to maintain heat or steam supply to industrial
customers. The heat and steam would be piped in insulated pipes above or underground. In the case
of both heat and steam the delivery pipe system is paired, with cooled water and condensed steam
returning. This utilisation of heat and steam reduces or removes the need for wet or dry cooling towers
and significantly improves the revenue from the plant.
While some furnace designs allow co-firing of straw and wood chip this is not normal practice. In the
situation where the straw volumes are adequate and reliable the second furnace could be specifically
designed for straw firing, with some wood able to be introduced as available. Normally furnace feed
systems, operating temperatures, and furnace bases are different for these two feedstocks.
Scenario two
Since optimising the economics of biomass-to-energy requires utilising of the heat energy, and the most
cost-effective energy to produce from biomass is generally the heat energy, this scenario accepts that
at least initially there will not be the requirement on one site for 25-30 MW of heat energy. The cost of
installing a reticulation system for heat energy is high and this effectively precludes piping heat more
than to the immediate neighbourhood of the plant. However across the municipality of Ballarat there
are many institutions, businesses and industries that require heat or the cooling that can be cost-
effectively produced from heat. These heat energy users include two universities on various campuses,
four boarding schools, two hospitals and various large businesses and industries. Examples of other
significant heat and cooling users include supermarkets, swimming pools, ice skating rinks, cool stores.
Scenario two is to have a number of smaller and larger heating plants of up to 1 MWth sited close to
heat energy demand, plus several small gasification plants of about the 1 MWe size that generate both
electricity and heat. These would all be supplied with chipped wood or pellets by contractors.
It may be feasible to have one small CHP plant producing 5 MW of electricity and 9 MW of heat energy
sited in a new industrial ‘green park’ development, possibly fuelled by MSW (approx 45,000 tonne/yr).
This would serve to attract new green industry including those that require heat and wish to be part of a
leading ‘green’ development. Examples of these include wood and straw pellet producers, industrial
laundries, wood kiln driers and processors, high-value greenhouse fruit and vegetable producers,
recyclers (compact fluorescent globes, drycell batteries), and producers of ethanol from straw and
woody biomass.
Central Highlands Bioenergy Scoping Study
Page 85 of 110
C:\Documents and Settings\Laurie\My Documents\Laurie\Farm Business\CHAF\Biodiesel and Bioenergy\Bioenergy\Bioenergy Working Group\Working Group Business plan\Business Plan Project\Stage 2 report\LN_CHAF Bioenergy scoping study FINAL.doc
August 2009
For putrescible biomass
Putrescible biomass for the region includes sewage, grey water, restaurant and domestic food waste,
and food processing waste. While presently the sewage treatment is separate to disposal of other
putrescible waste streams a change in separation and collection systems could allow for collective
treatment with a greater production of biogas. Construction of such a treatment plant for about 30,000
m3 of material would have a capital cost of in the order of $10 million.
This volume of solids could produce 3 million m3 of biogas with an energy value of about 18,000 MWh. If
purified to 98% methane the upgraded gas would have a fuel value equivalent to about 1.8 million litres
of petrol and could fuel municipal fleet vehicles or substitute for LPG or natural gas in other uses.
Equipment for upgrading biogas to pure methane would cost up to $3 million.
Other products from this plant would include sludge with dry weight equivalent to the feed-in material
dry weight. In Denmark this material is often used as a valuable high nutrient agricultural fertiliser,
provided levels of heavy metals, arsenic and so on are within permitted limits. In Sweden this is used to
fertilise the short rotation willow coppice crops providing biomass for bioenergy plants. It can also be
dewatered to below 50% to become a biomass fuel fraction for bioenergy plants, with the ash still
potentially having applications as a component of fertiliser.
Benefits of bioenergy for the region from wood waste
The National Association of Forest Industries (NAFI) has identified a range of direct and indirect benefits
to regional and rural communities from investment in bioenergy projects using wood waste.59 Direct
benefits include:
� Provision of localised, low cost and environmentally friendly power replacing conventional electricity
sourced external to the region;
� Generating long-term employment opportunities through harvesting, transportation and conversion
of wood wastes. Overseas studies show that there is up to a 20-fold difference in the number of
people employed in biomass–based energy production compared to employment numbers in coal-
based generation industries;
� Increased use of existing equipment and labour providing improved commercial returns for forest
based operations; and
� Retention of investment and salaries within local communities and increased local spend capacity
through reduced power costs.
Indirect benefits include:
59 National Association of Forest Industries. Economic and social benefits of wood waste renewable energy: Wood waste bioenergy information sheet No 13.
Central Highlands Bioenergy Scoping Study
Page 86 of 110
C:\Documents and Settings\Laurie\My Documents\Laurie\Farm Business\CHAF\Biodiesel and Bioenergy\Bioenergy\Bioenergy Working Group\Working Group Business plan\Business Plan Project\Stage 2 report\LN_CHAF Bioenergy scoping study FINAL.doc
August 2009
� Increased acceptance and adoption of renewable energy principles and practices;
� Flow-on employment from new investment;
� Reduction of bush and wild fire risk in rural areas and less burning off requirements;
� Development of new skills required by the industry; and
� Reduced environmental impacts and risks associated with distribution and transportation of
traditional fuels into regional and rural areas.
NAFI estimates that if the available wood wastes in Australia were used to generate bioenergy, this
would equate to approximately $800m of new investment and the creation of 2,300 new jobs in regional
Australia.
Ballarat region employment benefits
Significant development of bioenergy that draws on farm forestry biomass production stimulated by
CPRS and ETS legislation could create up to 1000 new permanent jobs. These arise from:
� Plantation forestry (including farm forestry) and management of native forestry. The CPRS and the
impact of GHG emissions taxation on the agricultural sector is likely to result in greater plantings on
farms as a source of revenue or GHG offset. These plantings will also be sited and configured to
mitigate salinity and provide farm and environmental benefits. In the management of farm wood
lots and other plantations there will be a considerable amount of biomass created and available to
be supplied to a regional CHP plant – possibly one that already is mainly fuelled by MSW. An active
bioenergy sector in the region will draw in woody biomass from plantation forestry within an
economic cartage radius of up to 80 km.
� Research work directed by Forest and Wood Products Australia and the Bureau of Rural Sciences
shows that about 1.5 new jobs per 100 ha of forestry are created in the management and
processing of sawlogs and other value-added product. Where the forestry is directed only at short
rotation woodchip product the job creation is about 1 per 100 ha.
� The circle of 80km radius centred on Ballarat contains about 2 million ha. If half of this is arable farm
land and 5% could be planted to farm forestry then this equates to 50,000 Ha of woodlots. By the
end of the first rotation at 30 years the biomass available from this aggregated estate would
approach 200,000 tonnes a year. Establishment and management, harvest and processing of this
area over time should create about 750 new jobs, with up to half this number being involved after
first ten years.
� Scandinavian research over decades has given some figures for the job creation in a region when
fossil fuel energy is converted to bioenergy. The figures range around 300 direct jobs created per
Central Highlands Bioenergy Scoping Study
Page 87 of 110
C:\Documents and Settings\Laurie\My Documents\Laurie\Farm Business\CHAF\Biodiesel and Bioenergy\Bioenergy\Bioenergy Working Group\Working Group Business plan\Business Plan Project\Stage 2 report\LN_CHAF Bioenergy scoping study FINAL.doc
August 2009
terawatt-hour of fossil energy converted to bioenergy. This figure can be translated to 300 jobs for a
114 MW-e&th CHP plant fuelled by biomass.
� This indicates that for a plant of about 50MW total output of heat and electricity about 160 jobs
would be created. These are partly at the plant but mainly with contractors and businesses along
the supply lines. At 90% efficiency such a plant could be using about 200,000 to 300,000 tonnes a
year of drier forestry chip and MSW. Its 35 MW of heat output would provide space and water
heating for industry and institutions and many thousands of households. The 15 MW of electricity
going into the grid would be enough for about 11,000 households (or for 18,000 energy-efficient
houses with water and space heating from solar or bioenergy).
� As the Ballarat Region develops its bioenergy and other renewable energy options there will be a
natural movement of manufacturing and design businesses to the area. This will be more obviously
the case if there is a coherent development plan for the region in all related aspects of creating a
low-emission environment. This would include public transport, energy efficient housing, tertiary
specialist courses, water efficiency, recycling and so on.
� In cities in the EU where the same thing has happened there is this significant movement of
manufacturing and design businesses and of skilled employees. An outstanding example is Växjö in
Sweden. The decision to reduce emissions has meant that this city of about the size of Ballarat has
positively benefited in many ways60.
Likely or possible spin-off benefits
Other possible benefits include:
� Jobs in manufacturing and bioenergy, environmental design and engineering;
� Tertiary speciality courses in environmental engineering and other fields;
� Reduced GHG emissions;
� Reduced energy costs to institutions and involved businesses over time;
� Improved recycling;
� New ‘green’ industries;
� Greater regional energy self sufficiency; and
� Municipal income stream from MSW and putrescible waste to energy.
Comparable overseas examples for the Ballarat region
Two examples from Sweden are noted as being directly comparable to the Ballarat situation.
60 www.vaxjo.se
Central Highlands Bioenergy Scoping Study
Page 88 of 110
C:\Documents and Settings\Laurie\My Documents\Laurie\Farm Business\CHAF\Biodiesel and Bioenergy\Bioenergy\Bioenergy Working Group\Working Group Business plan\Business Plan Project\Stage 2 report\LN_CHAF Bioenergy scoping study FINAL.doc
August 2009
� Växjö in Sweden uses woody biomass from forestry residues and timber processing wastes to
generate electricity to the national grid and heat that is reticulated around the city to industry,
institutions and households. Sewage is anaerobically fermented to produce biogas, which is
upgraded to pure methane for vehicle fuels. With all other measures this city generates about 95%
of its heating and electricity needs.
� Jönköping municipality (125,000 residents) in Sweden gets 30% of its electricity and 50% of its heat
needs from a waste-to-energy plant fuelled by 160,000 tonnes a year of sorted municipal waste. The
municipality’s sewage is combined with all other putrescible wastes to produce biogas which is
upgraded to pure methane for the municipal fleet with excess sold for private cars.
For further examples in more detail see Appendix 5: Scandinavian bioenergy options in practice.
Observations and recommendations
This Scoping Study presents a number of recommendations for project partners and stakeholders to
consider based on the research, findings and observation. These are:
� Although there is significant information, resources and working examples relating to bioenergy,
there appear to be notable policy gaps (at national, state and local government levels) in relation
to the this renewable energy system. Many policies make significant reference to and provide
assistance for energy systems such as coal, wind and solar, but in many cases offer little clarity or
policy direction for bioenergy. Not only does this create uncertainties for and barriers to bioenergy
investment and development, but may very well impact upon Australia achieving its stated targets
for the contribution bioenergy is to make to our energy system. There is potentially a strategic role
for the Central Highlands Bioenergy Working Group in partnership with other stakeholders to lobby
and advocate for improved policy direction and support for the development of bioenergy.
� In addition, local governments should consider the contribution that bioenergy could make within
local and regional sustainability and environmental strategies. There are generally strong references
to renewable energy within these strategic documents, but like government policy statements, very
little reference or clarity is given to bioenergy.
� The importance of raising awareness and understanding of bioenergy within the community will be
an important step in progressing bioenergy projects in the region. The experiences of the wind farm
sector when confronting community perceptions and divisions in relation to the establishment of
wind farms may not only be similar for bioenergy, but potentially more problematic due to the low
awareness and knowledge about this system. The development of knowledge and information
campaigns needs to be seriously considered by project partners and stakeholders contemplating or
progressing bioenergy projects.
Central Highlands Bioenergy Scoping Study
Page 89 of 110
C:\Documents and Settings\Laurie\My Documents\Laurie\Farm Business\CHAF\Biodiesel and Bioenergy\Bioenergy\Bioenergy Working Group\Working Group Business plan\Business Plan Project\Stage 2 report\LN_CHAF Bioenergy scoping study FINAL.doc
August 2009
� Within the region, this Scoping Study finds that there are potential industry-based and local
government projects that would be suitable for further detailed investigation in relation to bioenergy
initiatives. Business and industry projects include companies operating regional saleyards, abattoirs,
recycling and green waste, timber and the wider agricultural sector. Larger-scale municipal or
region-wide projects could be incorporated under existing and planned development zones
including the Ballarat Airport Precinct Employment Zone Development or the Ararat Renewable
Energy Park. These development zones could accommodate bioenergy facilities such as municipal
combined heat and power plants and/or development zone specific plants to service the electricity
and heat requirements of existing or potential co-located industries. These projects would not only
assist with establishing ground-breaking eco-industrial park development within the region, but could
also provide nearby residential development with renewable energy supplies.
� Local governments within the Central Highlands region supported by peak bodies, industry groups
and the wider community could not only take a leading step towards bioenergy initiatives and
investment attraction, but make sustainable statements about their commitment to reducing their
contribution to climate change.
The Scoping Study has a role in advocating, supporting and facilitating the progression of these
recommendations within industry, local, State and Federal government, utilising the partnerships and
networks that exist within the region.
Conclusion
The Scoping Study has undertaken an extensive environmental scan in order to establish the viability,
processes and broad outcomes of establishing bioenergy facilities within the Central Highlands region.
The timing of the report is important, as state, national and global governments move towards
establishing significant policy statements and actions to tackle climate change and to reduce the
world’s reliance on diminishing stocks of fossil fuels.
The Study has established that there are sufficiently strong grounds for industry, local governments and
wider communities of interest to seriously consider options for bioenergy. For many, this will represent a
significant leap of faith.
However, there is sufficient evidence of working models both in Australia and overseas to demonstrate
that bioenergy technologies and systems do provide wide ranging benefits from commercial,
economic and environmental perspectives. Through focussed strategic planning, community
engagement and directional leadership, increasing the use of bioenergy and delivering sustainable
benefits within the region is highly achievable.
Central Highlands Bioenergy Scoping Study
Page 90 of 110
C:\Documents and Settings\Laurie\My Documents\Laurie\Farm Business\CHAF\Biodiesel and Bioenergy\Bioenergy\Bioenergy Working Group\Working Group Business plan\Business Plan Project\Stage 2 report\LN_CHAF Bioenergy scoping study FINAL.doc
August 2009
Acknowledgements
The SED project team would like to the support and information supplied for the Scoping Study from the
following groups and individuals:
� Andrew Lang
� City of Ballarat
� Central Highlands Agribusiness Forum, in particular Laurie Norman
� Central Highlands Bioenergy Working Group
� Central Highlands Water
� Farm Services Victoria: Department of Primary Victoria
� Highlands Regional Waste Management Group
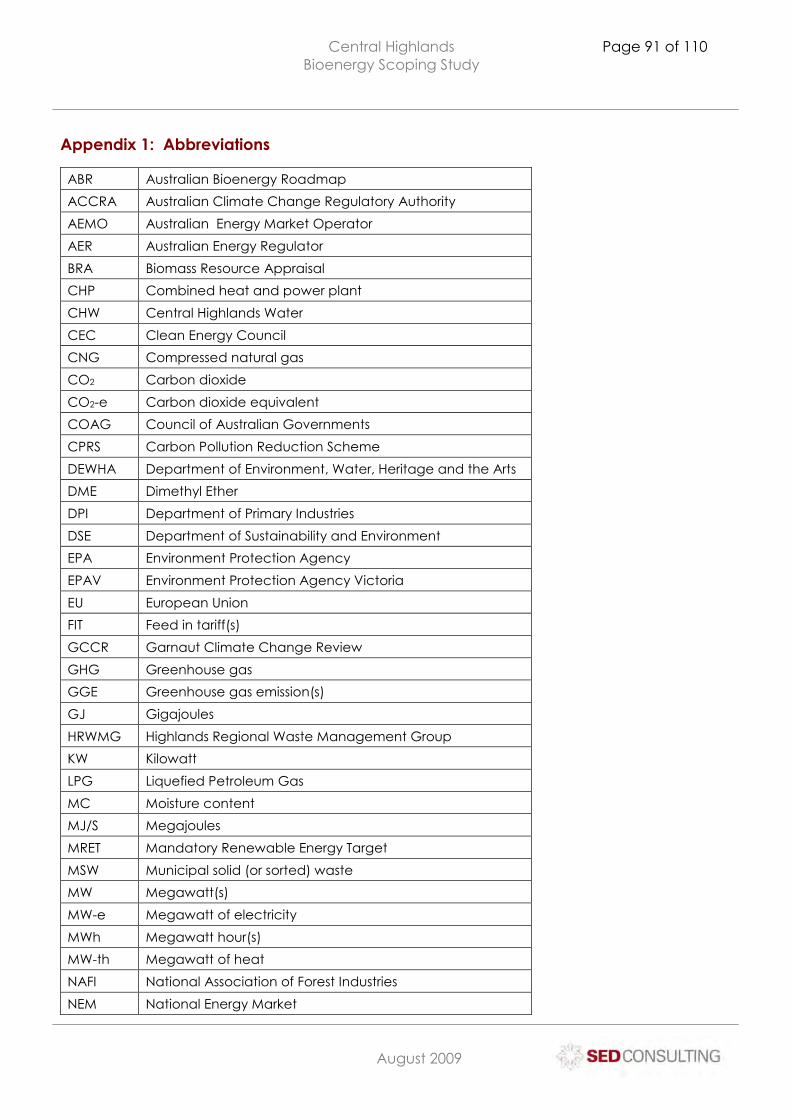
Central Highlands Bioenergy Scoping Study
Page 91 of 110
C:\Documents and Settings\Laurie\My Documents\Laurie\Farm Business\CHAF\Biodiesel and Bioenergy\Bioenergy\Bioenergy Working Group\Working Group Business plan\Business Plan Project\Stage 2 report\LN_CHAF Bioenergy scoping study FINAL.doc
August 2009
Appendix 1: Abbreviations
ABR Australian Bioenergy Roadmap
ACCRA Australian Climate Change Regulatory Authority
AEMO Australian Energy Market Operator
AER Australian Energy Regulator
BRA Biomass Resource Appraisal
CHP Combined heat and power plant
CHW Central Highlands Water
CEC Clean Energy Council
CNG Compressed natural gas
CO2 Carbon dioxide
CO2-e Carbon dioxide equivalent
COAG Council of Australian Governments
CPRS Carbon Pollution Reduction Scheme
DEWHA Department of Environment, Water, Heritage and the Arts
DME Dimethyl Ether
DPI Department of Primary Industries
DSE Department of Sustainability and Environment
EPA Environment Protection Agency
EPAV Environment Protection Agency Victoria
EU European Union
FIT Feed in tariff(s)
GCCR Garnaut Climate Change Review
GHG Greenhouse gas
GGE Greenhouse gas emission(s)
GJ Gigajoules
HRWMG Highlands Regional Waste Management Group
KW Kilowatt
LPG Liquefied Petroleum Gas
MC Moisture content
MJ/S Megajoules
MRET Mandatory Renewable Energy Target
MSW Municipal solid (or sorted) waste
MW Megawatt(s)
MW-e Megawatt of electricity
MWh Megawatt hour(s)
MW-th Megawatt of heat
NAFI National Association of Forest Industries
NEM National Energy Market
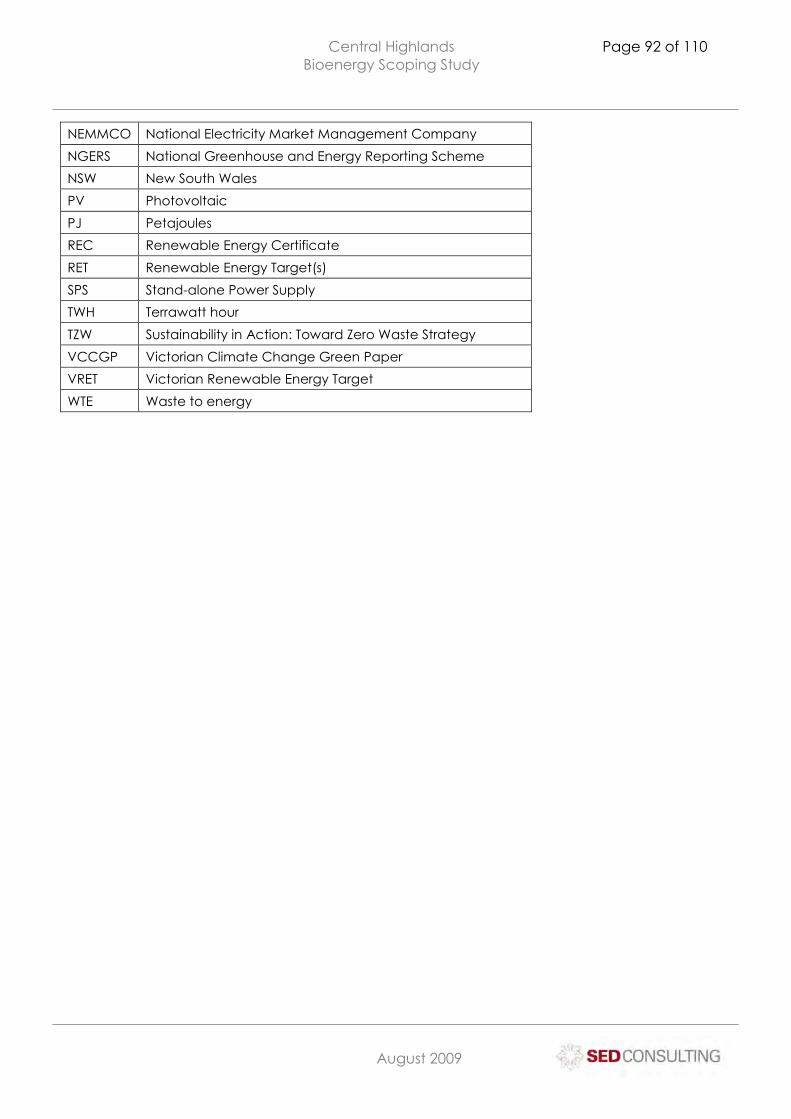
Central Highlands Bioenergy Scoping Study
Page 92 of 110
C:\Documents and Settings\Laurie\My Documents\Laurie\Farm Business\CHAF\Biodiesel and Bioenergy\Bioenergy\Bioenergy Working Group\Working Group Business plan\Business Plan Project\Stage 2 report\LN_CHAF Bioenergy scoping study FINAL.doc
August 2009
NEMMCO National Electricity Market Management Company
NGERS National Greenhouse and Energy Reporting Scheme
NSW New South Wales
PV Photovoltaic
PJ Petajoules
REC Renewable Energy Certificate
RET Renewable Energy Target(s)
SPS Stand-alone Power Supply
TWH Terrawatt hour
TZW Sustainability in Action: Toward Zero Waste Strategy
VCCGP Victorian Climate Change Green Paper
VRET Victorian Renewable Energy Target
WTE Waste to energy
Central Highlands Bioenergy Scoping Study
Page 93 of 110
C:\Documents and Settings\Laurie\My Documents\Laurie\Farm Business\CHAF\Biodiesel and Bioenergy\Bioenergy\Bioenergy Working Group\Working Group Business plan\Business Plan Project\Stage 2 report\LN_CHAF Bioenergy scoping study FINAL.doc
August 2009
Appendix 2: Glossary
� Bioenergy - according to the Clean Energy Council’s 2008 Australian Bioenergy Roadmap 61
(Roadmap), bioenergy has been defined as ‘renewable energy derived from organic matter known
as biomass. It utilises the solar energy that is stored in biomass by converting it to a different from of
energy, such as electricity and thermal energy’.
� Biogas (sewage gas) – the gaseous product of fermenting organic matter in absence of oxygen
(about 60-70% methane, balance mainly is CO2)
� Biomass – material from animals or plants, or by-product from the processing of plant matter or
animals – may be as green leaf, dry straw, black liquor from wood pulp processing, chipped
thinnings or harvest waste including stumps, sewage and manure, food processing waste and
slaughterhouse waste.
� Biosolids – nutrient rich organic materials derived from wastewater solids (sewage sludge) which
have been stabilised through processing.
� CO2-e – greenhouse gases expressed as equivalent volumes of carbon dioxide
� Combined heat and power (CHP) plants (or co-generation plants) - these plants have an efficiency
of 85-90%, with 20-30% produced as electricity and 55-70% as heat. These plants can now be scaled
down so that heat output is only 5-10MW or less.
� Condensing power plants - designed for production of electricity only. Up to 40-45% of energy is
recovered as electricity with the rest of the energy lost in cooling water and flue gases. These plants
are usually too inefficient for using biofuels, and are not discussed here.
� Composting – bacterial and fungal decomposition of organic matter, with free release of mainly
CO2 and some methane and other gases.
� District heating - a system of buried insulated pipes that carries thermal energy, as hot water, around
a community and/or industrial area, where the heat is drawn off through heat exchangers and the
volume of water remains constant.
� District heating (DH) plants - produce only heat with 85-88% of energy contained in the fuel
converted to thermal energy. These plants are usually less than 10MW.
� Domestic waste – the mix of dry and wet material produced by a household, usually after
recyclables are removed.
61 Clean Energy Council 2008. Australian Bioenergy Roadmap: Setting the direction for biomass in stationery energy to 2020 and beyond. ISBN: 978-0-9805646-1-7
Central Highlands Bioenergy Scoping Study
Page 94 of 110
C:\Documents and Settings\Laurie\My Documents\Laurie\Farm Business\CHAF\Biodiesel and Bioenergy\Bioenergy\Bioenergy Working Group\Working Group Business plan\Business Plan Project\Stage 2 report\LN_CHAF Bioenergy scoping study FINAL.doc
August 2009
� Dry agricultural residues. This includes dry cereal straw, stem of broadleaf crops like canola, shells
and hulls, seed seconds, dry poultry litter.
� Energy – its various forms include heat, electricity, mechanical work, visible light.
� Fly ash – the fine particulates in exhaust gases, caught by filters and scrubbers.
� Fugitive emissions - greenhouse gases that are released in the course of oil and gas extraction and
processing; through leaks from gas pipelines; and as waste methane from black coal mining.
� Gasification – advanced thermal technology which converts organic material into combustible
gases by partial oxidation under the application of heat, leaving an inert residue.
� Green waste – one term for leafy vegetable matter like lawn clippings.
� Industrial waste – a vague term for waste from industrial processes or businesses.
� Landfill – a site for the disposal of waste.
� Landfill gas – product of land fill, usually about 40% methane.
� Municipal solid (or sorted) waste (MSW) – domestic and industrial waste that is roughly sorted to
remove recyclables, and toxic and hazardous material. Usually below 50% MC. Similar to Refuse
Derived Fuel (RDF), Solid Recovered Fuel (SRF). Sorted and under 50% moisture content. This can be
assumed to be of over 75% biomass content dry weight. It is a mix of household and commercial
and industrial flammable waste. Toxic and hazardous materials, metals and recyclable material
should be removed.
� Organics – plant or animal matter originating from domestic or industrial source for example grass
clippings, tree prunings and food wastes.
� Putrescible waste – high moisture content organic matter (over 60%) that if left to its own devices will
rot with release of unpleasant smells.
� Pyrolysis – advanced thermal technology involving the thermal decomposition of organic
compounds in the complete absence of oxygen and under pressure and at elevated temperature.
� Recyclables – generally use in reference to the recyclable containers and paper/cardboard
component of kerbside waste but can apply to all materials which can be recycled.
� Slag – the non-flammable material that is left over in a furnace after combustion.
� Solid waste – non-hazardous, non prescribed, solid waste materials ranging from municipal garbage
to industrial waste.
� Separation – segregating materials into discrete materials streams.

Central Highlands Bioenergy Scoping Study
Page 95 of 110
C:\Documents and Settings\Laurie\My Documents\Laurie\Farm Business\CHAF\Biodiesel and Bioenergy\Bioenergy\Bioenergy Working Group\Working Group Business plan\Business Plan Project\Stage 2 report\LN_CHAF Bioenergy scoping study FINAL.doc
August 2009
� Woody biomass. This includes chipped forestry, plantation and farm forestry thinnings and harvest
residue, timber industry waste, urban prunings and stumps, and urban demolition waste wood. This
last may include plywood, masonite and MDF but does not include preserved timbers or composite
timbers made with noxious adhesives such as waterproof chipboard.
Central Highlands Bioenergy Scoping Study
Page 96 of 110
C:\Documents and Settings\Laurie\My Documents\Laurie\Farm Business\CHAF\Biodiesel and Bioenergy\Bioenergy\Bioenergy Working Group\Working Group Business plan\Business Plan Project\Stage 2 report\LN_CHAF Bioenergy scoping study FINAL.doc
August 2009
Appendix 3: Units and conversions
Conversions
� 1 megawatt-hour (MWh) = 3.6 gigajoules (GJ). 1 gigajoule = 0.28 MWh.
� 1 megawatt (MW) = 1 megajoule per second (MJ/s) energy
� 1 megawatt output = 24x365 MWh = 8800 MWh/yr
� 1 terawatt-hour (TWH) = 3.6 petajoules (PJ), and a PJ = 0.28 TWh
What do we mean by energy?
Energy (particularly in mechanical work) used to be measured in basic units of Horsepower (a 1
horsepower engine could do in one hour the amount of work one draught horse could do in one hour).
These days, one basic decimal unit of energy is the watt, more often expressed in kilowatts or
megawatts. There are other units used in talking about energy on various scales. The other main unit
used with bioenergy is the joule. This is directly related to the watt, where one watt equals 3.6 thousand
joules (3.6 kilojoules). Energy in heat, electricity and fuels is measured using one or both of these units. –
The output of a bioenergy plant
This is usually first given as an energy capacity figure, being the rated boiler output in MW. Where it is a
combined heat and power (CHP) plant, the electricity production will be given as the measured total
turbine output of electricity as MW-e, and the heat supplied into the district heating system will be either
expressed as as megajoules per second (MJ/s) (where I MJ/s = 3.6 GJ/hr = I MWh), or as megawatts of
thermal energy (MW-th). These values are usually the output when the plant is operating at its designed
optimal efficiency, such as at peak demand in wintertime. Annual peak load times for CHP plants are
about 6000 hours/year in Finland, and peak load times for district heating plants about 4500 hrs. (TEKES
2004). Other figures can also be used for CHP plants, including steam pressure and temperature, steam
flow in kg/sec, and efficiency of conversion of feed fuel compared to energy output of the boiler.
8760 MWh equates to the output of 1 Megawatt over a year. So in theory to generate a MW of energy
over a year requires fuel with an energy value of 8760 MWh. In reality there is a loss of 10-20% of energy
at the plant so about 10,000 MWh of fuel energy is needed to produce a MW of heat energy in a
conventional furnace/boiler arrangement. So about 3,700 tonne of green woodchip, or 2-3,000 tonne
of municipal solid waste (depending on moisture content) fed in over the year. In less efficient smaller-
scale furnace/boilers up to 10,000 tonnes of fuel is needed per MW of energy produced.
General rules of thumb for energy
� A DH plant requires approximately 10,000 tonnes of 40% MC chip per MW capacity. More efficient
CHP plants with dry fuel including pellets can use down to about 1,500 tonnes/MW;
Central Highlands Bioenergy Scoping Study
Page 97 of 110
C:\Documents and Settings\Laurie\My Documents\Laurie\Farm Business\CHAF\Biodiesel and Bioenergy\Bioenergy\Bioenergy Working Group\Working Group Business plan\Business Plan Project\Stage 2 report\LN_CHAF Bioenergy scoping study FINAL.doc
August 2009
� For a DH plant, cost of installing the distribution network is about half the overall capital cost;
� A MW of electricity will supply 500-750 Australian electricity-dependent homes for a year;
� An average Australian family uses about 13,000 KWh/yr of electricity (a Danish household uses 6-
7000 KWh/yr energy overall). In winter up to half of power consumption in an electricity-dependent
house can be used for space and water heating; and
� Australian industry and households consume up to 45,000 MW of electricity/yr (with over 70,000 MW
of unused thermal energy annually being generated).
Units of wood chip biomass – cubic content/weight
For Norway Spruce with a specific gravity of 400kg/m3 solid wood, and at 40% MC .
� A solid m3 weighs about 400kg and produces about 2.8 m3 of loose chip;
� A m3 of loose chip weighs 140kg and contains about 0.35 m3 of solid content;
� A tonne of woodchip fills approx. 4 m3; and
� A tonne of chipped spruce contains approx. 2.4 m3 of solid wood.
Units of calorific value
Using the same 40% MC chipped Norway Spruce)
� A loose cubic metre of chip contains approx. 2.6 GJ or 0.72 MWh energy;
� Fuel consumption (for boiler efficiency of 80-90%) is about 1.48 loose m3/MWh of this chip. (Biomass
fuel supply chains 2007);
� A m3 of green solid wood yields about 7.3 GJ;
� A tonne of green woodchip yields about 10.4 GJ;
� MSW (50% MC) yields about 2.6 MWh/tonne (figure from Llungby Energi);
� A tonne of sawdust pellets or briquettes (10%mc) yields 4.5 -5 MWh;
� One litre of fuel oil = 36 MJ = 10kW;
� Calorific value of 1000 l of fuel oil = approx. 14m3 woodchips;
� 1000 litres fuel oil = 36 GJ;
� Calorific value of 1000 Nm3 of natural gas = 15m3 woodchips;
� 1000 Nm3 natural gas = 11 MWh = 39.7 GJ;
� Energy of 1 Nm3 of natural gas and 1.1 litres of 95 octane petrol are approximately equal;
Central Highlands Bioenergy Scoping Study
Page 98 of 110
C:\Documents and Settings\Laurie\My Documents\Laurie\Farm Business\CHAF\Biodiesel and Bioenergy\Bioenergy\Bioenergy Working Group\Working Group Business plan\Business Plan Project\Stage 2 report\LN_CHAF Bioenergy scoping study FINAL.doc
August 2009
� 1 tonne fuel oil = 42.7 GJ;
� I tonne crude oil equivalent (toe) = 11.63 MWh = 40.868 GJ;
� A million tonnes crude oil equivalent (mtoe) = 40.868 petajoules (PJ); and
� A terawatt hour (TWh) = 3.6 PJ.
(1 Nm3 natural gas is a cubic metre of gas at standard temperature and pressure).
Prefixes for energy units (Energy in Sweden 2007)
1. Kilo 10³, Mega 106, Giga 109, Tera 1012, Peta 1015
2. So a megawatt (MW) is 1,000,000 watts, and a gigajoule (GJ) is 1,000,000,000 joules.
Some units for biogas
� Volume – usually normal cubic metres (nm3). 1 cubic metre of natural gas or 97% biomethane at
standard temperature and pressure (1Nm3) = 40 megajoules (40MJ), or roughly the energy value of
1.1 litres of 91 octane petrol.
� Power/electricity output – usually expressed in multiples of watts. A terrawatt-hour is a thousand
gigawatt-hours (GWh). A GWh is a thousand megawatt-hours.
� Heat energy output – usually expressed as joules. So a TWh equals 3.6 petajoules (PJ). One kilowatt-
hour = 3.6 megajoules (MJ). 1 megajoule per second (MJ/sec) of heat energy = 1 MW.
Central Highlands Bioenergy Scoping Study
Page 99 of 110
C:\Documents and Settings\Laurie\My Documents\Laurie\Farm Business\CHAF\Biodiesel and Bioenergy\Bioenergy\Bioenergy Working Group\Working Group Business plan\Business Plan Project\Stage 2 report\LN_CHAF Bioenergy scoping study FINAL.doc
August 2009
Appendix 4: Waste-to-energy in Sweden and Denmark
Denmark and Sweden both use municipal solid waste (MSW) to generate both thermal energy and
electricity. In both countries the process of waste separation and recycling is thorough and starts at the
household or other source. The waste-to-energy (WTE) plants are usually within or close to towns or cities
that generate the waste. The plants (or municipalities) charge for taking waste and sell the energy
generated. The thorough filtering and treatment of the flue gases, and their constant analysis, results in
very low levels of emissions of problem compounds. Enforcement on emissions is by government
authorities, and severe penalties apply for emissions violation or reporting fault.
Sweden
Sweden has a population of a little over 9 million. It is the fifth largest country in the EU and one of the
least densely settled. Most of the population lives in the third of the country below Stockholm. In Sweden
putting organic waste into landfill, or otherwise disposing of it without processing for its energy content, is
now banned. Industries, municipalities and waste collection businesses have had to invest in innovative
and collaborative ways to process this waste.
By the end of 2006 Sweden was producing over 1.3 terrawatt-hours (TWh.) of biogas by energy value at
over 230 facilities. Sewage treatment plants contribute most to this production. 139 plants were
producing 0.56 TWh/year from sewage. Capped landfill gas plants yielded 0.46 TWh/year. Co-digestion
plants are the area of growth and were then producing about 0.16 TWh/year. Farm digesters and
industrial wastewater digesters produced the balance (Germany is far more advanced with farm-
produced biogas). To put this all in some perspective, in 2006 Sweden produced 115 TWh from biomass
and peat, and used 101 TWh of fuels in the transport sector, of which 46.4 TWh was petrol, 0.3 was
natural gas and LPG, and 1.3 TWh was bioethanol.
The theoretical biogas production for Sweden is 14TWh/year, which assumes 10% of Swedish farmland
growing crops as feedstock for biogas plants thus providing half this total. Other principal potential
sources of biogas that are not yet being fully utilised are animal manure, food waste, garden waste,
sewage treatment sludge, and agricultural crop residues.
Biogas at about 23 MJ/Nm3 has about half the calorific value of natural gas at 40 MJ/Nm3. Landfill gas
is lower still at about 16 MJ/Nm3. The difference in energy value is due to the level of CO2 in each gas.
Natural gas has 0.9%, biogas has about 35%, and landfill gas has about 40%. The energy content of the
gases is directly related to the methane content. A Nm3 of methane has a calorific value of 10kWh,
while CO2 has no calorific value. So if biogas from a particular source is 60% methane it will have a
calorific value of 6 kWh.
Central Highlands Bioenergy Scoping Study
Page 100 of 110
C:\Documents and Settings\Laurie\My Documents\Laurie\Farm Business\CHAF\Biodiesel and Bioenergy\Bioenergy\Bioenergy Working Group\Working Group Business plan\Business Plan Project\Stage 2 report\LN_CHAF Bioenergy scoping study FINAL.doc
August 2009
Denmark
Waste is burnt for energy when it can’t be recycled and when furnace residues would not cause
environmental problems (that is heavy metals). In Denmark putting waste suitable for energy recovery
into landfill was made illegal before 2000. There is a general state tax on waste. This is highest for landfill
waste, and recycled waste material is exempt. The result is that most of Denmark’s non-recyclable
waste becomes fuel in one of the many district heating plants or combined heat and power plants in
the country (a further fraction is organic waste, which is increasingly anaerobically digested to produce
biogas). There are over 30 WTE plants of various sizes around Copenhagen alone, with the largest,
Westforbraending, using 700,000 tonnes of waste per year and supplying district heat to Copenhagen,
and electricity into the national grid. The first of Denmark’s WTE plants was built in the early 1970’s.
The municipalities in Denmark have the main responsibility of managing the collection and
management of waste. Some combine with neighbouring municipalities to run plants. An example of
such a plant is the AVV plant in NW Jutland near Hørring, which takes waste from six municipalities.
Responsibility for waste separation is placed squarely back on the residents or industry at the source.
Waste from industry makes up about a fifth of all waste in Denmark. About a quarter of Denmark’s
waste volume comes from wastewater treatment and energy generation. A total of about 3 million
tonnes of waste comes from this sector.
Even the incineration of waste generates residues of furnace slag and fly ash from flue gas treatment. By
1997 this volume amounted to about 550,000 tonnes. Over 80% of the slag is recycled in building and
construction works such as for road base material. Flue gas from waste incineration is classed as
hazardous waste as it contains heavy metals and other environmental contaminants that are a threat
to the groundwater purity (in Denmark groundwater is the source of almost all drinking water). This ash is
stabilised and put in specially constructed sealed landfill sites. Similarly the slag, fly ash and gypsum
produced by coal-fueled plants is 90% recycled.
Some larger waste-fueled combined heat and power (CHP) plants in Denmark are those at Århus,
Odense, Madevj, Westforbraending, Amagervorbraending, and Nordvorbraending. Sizes of these CHP
plants range from 35MW down to less than 5MW. In addition there are hundreds of smaller district
heating plants and CHP plants that use waste for fuel.
For details of Denmark’s waste-to-energy program www.ens.dk, www.miljoe.dk, or www.mst.dk. For
more detail on Danish WTE plants see www.industcards.com/wte-denmark. www.dongenergy.dk,
www.wattenfalls.dk, and www.cowi.com.
Central Highlands Bioenergy Scoping Study
Page 101 of 110
C:\Documents and Settings\Laurie\My Documents\Laurie\Farm Business\CHAF\Biodiesel and Bioenergy\Bioenergy\Bioenergy Working Group\Working Group Business plan\Business Plan Project\Stage 2 report\LN_CHAF Bioenergy scoping study FINAL.doc
August 2009
Appendix 5: Scandinavian bioenergy options in practice
In practice in Scandinavia the following uses of bioenergy are found.
Dry wastes
� Small heating plants in apartment blocks and institutions of up to 0.5 MW are fuelled by chip or
pellets. Specifications for chip size are tight. Only better quality chip or pellets can be used in order
to keep ash percentage low (ie no leaf and bark content). Containerised heating plants are
available off-the-shelf. Smoke and emissions are negligible. Expertise to run and maintain are low.
� District heating plants in towns and suburbs of 2-10 MW boiler rating are fuelled by a wide variety of
woody waste including chip, sawdust briquettes, sawdust and bark. These plants are able to fit into
an industrial estate and require a truck access and turning area. Smoke and emissions are negligible.
Chimney stack usually of 10-15m. Expertise requirement is more specialised.
� Gasifiers fit into a category of their own. When the gas is fuelling a gas motor they are very similar to
the situation of landfill gas engines/generators. Effective utilisation of heat is often not seen as a
requirement for viability. Sizes can be below a MW total output (electricity plus heat). Exhaust
emissions (from use of wood gas) are less noxious than the exhaust emissions of a petrol-fuelled
engine, provided the engine is working efficiently and there is no leakage. Gasification can produce
a higher proportion of energy as electricity than a small furnace/boiler/turbine set up.
� District heating plants and combined heat and power plants of 10-20 MW are fuelled by either
municipal waste, straw or chip. Where MSW is used the flue gas treatment and filtration is far more
extensive. Generally the plant is significantly more expensive to build and run. Smoke and emissions
are negligible though a higher chimney stack is usually used (20-25m). Space requirement of up to 5
ha.
� Combined heat and power plants of 20-500MW may be fuelled by several fuel types in separate
furnaces and boilers and a common steam system and turbine, to allow flexibility in heat energy
output between summer and winter. So a continuous-use furnace may be fuelled by MSW, and one
or more other smaller capacity biomass-fuelled furnaces my only be used in peak heat demand
periods over winter. As in point 3 the filtration and fluegas monitoring and treatment is more
demanding where MSW is used. Also the handling and disposal of the slag, and fly ash from the
furnace exhaust, has different and more costly requirements. Site area requirement of 10-20 ha
depending on outside storage of chipped biomass. Chimney 30m or more.
Wet wastes
� Small (1000-20,000 m3 manure slurry volume) farm anaerobic digesters convert manure slurry from
intensive housed animals into biogas. This can be used to fuel a gas motor/genset, or for heating.
Central Highlands Bioenergy Scoping Study
Page 102 of 110
C:\Documents and Settings\Laurie\My Documents\Laurie\Farm Business\CHAF\Biodiesel and Bioenergy\Bioenergy\Bioenergy Working Group\Working Group Business plan\Business Plan Project\Stage 2 report\LN_CHAF Bioenergy scoping study FINAL.doc
August 2009
The equipment is often modular and part may be containerised. The resulting sludge can be spread
without issues of smell and nitrogenous runoff. Main site requirement is for space for sludge holding
tanks.
� Larger farm-based or industrial site anaerobic digesters that may bring manure slurry together with
piped or trucked town sewage, food processing waste, and slaughterhouse wastes. In some
instances this plant will be a joint venture between two or more municipalities. Volumes may be of
the order of 30- 60,000m3 slurry volume per year. Larger cooperative type plants are up to 250,000
m3 per year. Product will be as biogas to gas motor driven gensets and as upgraded biomethane
to be vehicle fuel for municipal fleets or sold into the natural gas grid. Site requirement may be
about 2-10 ha. General appearance is of industrial buildings of up to 5m in height. One
holding/mixing tank in ground. Above-ground reactor tanks and sludge tanks.
� Sewage treatment plants for large towns and cities, where the sewage is the base volume and
other organic waste may be added. Treatment of the sewage is the main aim and a fraction of the
biogas will be used to provide heat and power the process. Upgrading of biogas to methane is on
economic scales with the methane used for buses, cars and trucks. The resulting sludge may be
used as fertiliser (including for short rotation coppice willow plantations), or part dried and used as
fuel, with the ash able to be used for fertiliser.
District heating plants in Sweden
� Lagan plant. Lagan. Built in 2000. Cost then about A$2.5 million, now probably A$4 million, not
including 10 km grid of insulated pipes. 2MW boiler with furnace fuelled by sawdust briquettes (4.8
MWh/tonne), supplying average of 9000 MWh (and max output in winter 13,000 MWh) of heat
energy to about 2000 population and some businesses and schools through grid of buried insulated
pipes.
Combined heat and power (CHP) plants recently built in Sweden
� Gärstadsverkaert, Linköping. This new plant has a main fuel stream of sorted municipal waste, 50-
75% of biological origin, but can use fuels as diverse as old tyres and plastics. It began operating in
2005 to supply a university town of about 140,000 population. This new boiler can produce 19 MW
electricity and 83 MW of heat energy. Cost of the furnace/boiler was about $180 million. There are
two other old boilers at the plant due for renewal. In addition to this CHP plant there are two other
CHP plants supplying Linköping.
� Torsvik plant, Jönköping. Fuel is municipal solid waste (mix of domestic and industrial) from city (pop
over 100,000) and surrounding municipalities brought in by 40-50 trucks a day. City trucks are
standard garbage trucks. Distance cartage is by larger trucks and truck-and-dog-trailer units.
Receival charge is about $80/tonne.
Central Highlands Bioenergy Scoping Study
Page 103 of 110
C:\Documents and Settings\Laurie\My Documents\Laurie\Farm Business\CHAF\Biodiesel and Bioenergy\Bioenergy\Bioenergy Working Group\Working Group Business plan\Business Plan Project\Stage 2 report\LN_CHAF Bioenergy scoping study FINAL.doc
August 2009
� Commissioned in 2006 at total cost of about A$250 million (including 13km two-way large diameter
supply pipes to the Jönköping grid. The 250 km grid was already in place). Building cost was about
$70 million, infrastructure was $60 million, and processing equipment was most of balance.
� Furnace feed at full output is 40 t/hr, and total use is 160,00 tonnes/yr. Booster burners get furnace
temperature rapidly up to over 950C, and cut in automatically. Boiler capacity is about 61 MW. The
plant produces 340 GWh/yr of heat (over half the peak winter demand and supply to 30,000
households) and 100 GWh/yr of electricity (about 30% of average city demand).
� The plant produces about 17,000-20,000t of slag a year (mostly sand, gravel and metal) and about
4000 t of flyash is recovered from the exhaust gases (this goes to secure landfill). Slag goes to a
recycling plant to recover metals and then sold as road base.
� Llungby plant, LLlungby. Main fuel is 55,000 tonnes a year of MSW to produce 18MW total energy.
Waste furnace and feed handling, filter improvements etc., installed in 2000 at cost of about A$80-
100 million. This plant regarded as only just economic in scale. It makes about $6 million a year,
mainly as receival charges on waste. Their waste was rated at 2.7 MWh/tonne. Overall the plant
produces about 140 GWh of heat and 20 GWh of electricity. The ratio is relatively low as the steam
temperature and pressure were lower than in higher efficiency plants.
� It has a wintertime-use 16 MW furnace/boiler fuelled by wood chip installed in 2005 at a cost of
about A$20 million. It produces about 30,000 MWh.
Wet wastes plants in Sweden
� Wrams-Gunnarstop. Feedstock: pig manure, food processing waste (mostly carrot and pea residue)
and slaughter house waste. Total volume 60,000m3. Construction cost over 2005/06 about A$8
million, and the upgrading plant to producing fuel grade methane cost another $2.5 million. Other
costs were for a 3.5 km pipeline to connect to the natural gas grid, and a 2 km food waste supply
pipeline. The product of 21-24 GWh of energy as biomethane is sold into the natural gas pipeline.
The other product is sludge enough to fertilise about 2000 ha of cropping land. The plant is in the
black after 1.5 years and without subsidy for construction, and has scope for expansion.
� NSR Återvinning plant, Helsingborg is a joint venture between six neighbouring municipalities
handling all waste streams. On the site are recycling facilities, a small district heating plant fuelled
by waste wood, landfill gas to gas motors, and a biogas plant processing about 60,000 m3 of
organic waste a year. Feed is a mix of slaughterhouse waste, gully trap waste from restaurants, and
household food waste. Cost of the main biogas plant in the early 2000s was about A$7 million, and
it produces a running profit of about $1 million a year from sale of gas and from waste receival
charges. It produces about 6 million nm3 of biogas and this is upgraded to about 3.2 million nm3 of
97% biomethane (1 nm3 of methane is equivalent to about 1.1 litres of 95 octane petrol).
Central Highlands Bioenergy Scoping Study
Page 104 of 110
C:\Documents and Settings\Laurie\My Documents\Laurie\Farm Business\CHAF\Biodiesel and Bioenergy\Bioenergy\Bioenergy Working Group\Working Group Business plan\Business Plan Project\Stage 2 report\LN_CHAF Bioenergy scoping study FINAL.doc
August 2009
Woody biomass for CHP plants in Denmark, Sweden and Finland
Bioenergy is a significant source of primary energy in Denmark, Sweden and Finland (also in many other
countries not in this study). There are some differences between countries in the choice of feedstocks,
largely due to the respective scale of their forest industries. But basic similarities lie in the way renewable
energy sources, and particularly for this study bioenergy, have been fostered and encouraged by taxes,
incentives and legislation since at least 1980. The efficient use of biomass for fuel has been made easier
by the fact that in many communities there were already small fossil fuel-fired district heating (DH) plants
or combined heat and power (CHP) plants, and the necessary infrastructure existed for distribution of
centrally-generated heat energy to households, businesses and institutions.
So in essence the use of woody biomass in these countries is now increasingly economic – due to taxes
on alternatives, and incentives for its use efficient – due to the design of the plants and the use of both
heat and electricity environmentally sound – with C-neutral fuels - by-products of sustainable forestry
and agriculture- steadily replacing fossil fuels (and in Sweden- nuclear power).
In Australia the contribution of biomass to the national electricity supply is well under 1% and mostly from
sugar cane waste (bagasse). Bioenergy overall may be closer to 5% with most of it being from domestic
heating by firewood. This is slowly falling. By comparison in Denmark the contribution from bioenergy is
about 10%, and this is mainly as straw and woody biomass. The figure is rising steadily and the target is to
at least double this by 2020. In Sweden it is over 25% (and climbing toward 40%) and far exceeds any
other form of renewable energy including hydro power. In Finland overall it is about 28% and in central
and eastern Finland is closer to 50% (figures for Sweden and Finland include peat. For Denmark and
Sweden they include municipal solid waste which is about 80% biomass, being mostly paper and
packaging).
It must be kept in mind that the national primary energy requirement for these three countries splits
roughly to 50% as heat, 25% as electricity and 25% as transport fuels. Finland is remarkable in that almost
20% of the nation’s electricity is presently generated from woody biomass including timber processing
by-product (including black liquor) in combined heat and power (CHP) plants of up to 500MW.
In these three countries the district heat is generated to a significant degree from bioenergy and waste-
to-energy plants (Finland is the lowest at nearly 50%). These may be small DH plants at 5MW or less, or
may be CHP plants on a far larger scale, as in the following examples. These following examples of
industrial-scale energy plants fuelled by biomass show how in Australia, as carbon pricing and the
energy requirement and capital cost of implementing carbon capture and storage impact on energy
production cost from coal, it is quite feasible that similar bioenergy plants could play an increasingly
significant role, fuelled by what are presently the largely valueless and discarded or burnt waste
products and residues of the agriculture and forestry industries.
Central Highlands Bioenergy Scoping Study
Page 105 of 110
C:\Documents and Settings\Laurie\My Documents\Laurie\Farm Business\CHAF\Biodiesel and Bioenergy\Bioenergy\Bioenergy Working Group\Working Group Business plan\Business Plan Project\Stage 2 report\LN_CHAF Bioenergy scoping study FINAL.doc
August 2009
Averdøre multi-fuel power plant, Denmark
The 570MW-th Averdøre-2 plant, which began operating in 2002, is designed to be fueled by either
straw, wood pellets or natural gas. When first planned in 1994 it was assumed that natural gas would
supply 85% of the fuel needs, but a leap in gas price meant that in early 2001 biofuels were decided
upon as the main fuel source.
Denmark had a policy (see policy report) to stop the use of coal as the primary fuel for energy and
Averdøre-2 was designed to replace three coal fired plants and thereby reduce net emissions of CO2 by
10%, nitrous oxide by 20% and sulphur dioxide by 30%. It uses a unique combination of gas turbines, fossil
fuel boiler and biomass boiler. In co-generation mode the new plant is a world leader for efficiency, in
converting up to 95% of the fuel into useable energy.
Electricity output from the plant is about 485 MW, and supplies about 20% of the demand for eastern
Denmark, or enough electricity for about 800,000 households. It generates 570MW thermal energy
supply for the district heating needs for about 180,000 homes in Greater Copenhagen. This energy is
mainly from about 150,000 tonnes of straw and 300,000 tonnes of wood pellets annually.
The straw boiler is equipped with a vibrating grate which is divided into three air zones for each of the
four feed lines. The capacity of straw storage is nearly 3000 big bales, and up to 12 trucks an hour can
be unloaded. The straw is fed though straw shredders. The shredded straw is then feed into the boiler via
screw stokers
The plant combines steam from both biomass and fossil fuel boilers. The ultra supercritical steam turbine
operates at temperature of about 580C and 300 bar pressure, and at the time was the most advanced
steam turbine anywhere in the world. The efficiency of the biomass plant is 45% and of the fossil fuel
steam cycle is 48.2%. Boiler feedwater is partly heated by the exhaust flue gas from the gas turbines and
is fed into the boilers at 310C.
Note: It is this near-total recovery and use of heat energy (particularly through district heating) at every
part of the cycle that help make the Scandinavian and Finnish CHP plants so efficient. Another source
of efficiency is the relatively short transmission distances possible when the countryside has CHP and DH
plants in or near almost every urban centre. Another aspect is that the Averdøre-2 plant has the gross
baseload energy output of nearly 500 2MW wind turbines at full output, each requiring a massive
cement base pad. And even in the windiest coastal parts of Denmark wind turbines are producing full
power less than 50% of the year.
Herning CHP plant
Herningverkaert was built in 1984 as a coal and oil-fired CHP plant, supplying the city of Herning (pop
about 50,000, and district population about 150,000) in northern Jutland with heat, and the national grid
with electricity. In 2000 the plant was converted to natural gas, and in 2002 it was converted to be co-
Central Highlands Bioenergy Scoping Study
Page 106 of 110
C:\Documents and Settings\Laurie\My Documents\Laurie\Farm Business\CHAF\Biodiesel and Bioenergy\Bioenergy\Bioenergy Working Group\Working Group Business plan\Business Plan Project\Stage 2 report\LN_CHAF Bioenergy scoping study FINAL.doc
August 2009
fired with natural gas and woodchip. This required the bottom part of the boiler to be refitted with a
90m2 vibrating grate, and facilities for handling and storage of chip to be installed. The decision to
replace coal with natural gas and then woodchip was largely due to the tightening environmental
requirements for power plants. At Herning the availability of woodchip was determined to be adequate,
and the economics were judged to be workable, compared to the costs of installing a desulphurisation
plant and when the financial incentives for producing ‘green’ energy were included.
Now with its use of 250,000 tonnes of woodchip a year the Herning plant is the largest consumer of
woodchip as fuel in the country. Boiler rated output is 288MW. Steam temperature is 525C and steam
pressure 115 bar and volume of 118kg/second. An electricity efficiency of 30% means production of
89MW-e. District heating output is 174 MJ/sec (174 MW-th).
The undercover chip storage is about 13,000 m3-loose and is equivalent to about 75 hours of full load
operation (so 173.3 m3/hour). The plant has also installed a full-log chipper and has outside storage. It is
supplied by several larger contractors and a number of smaller ones. Each has a supply contract
running for some years in advance, with price negotiated annually.
One supplier is the 970-member regional forest owners association based 100km away at Veile. This
cooperative supplies about 25,000 m3 annually to the Herning plant. Delivery price is negotiated for
each season starting on July 1st based on a group of 10 factors, only one of which is inflation. One key
factor is oil price. For the coming 2008/09 year the association has gained a 15% increase on the
previous year’s price of 91 Danish kroner per m3-loose delivered (about A$20/m3). The association has
to pay all costs of chipping and transport, usually pay a royalty, and still make a margin. They are
actually paid by the gigajoule of actual chip energy content, and each truck load is weighed and a
moisture check made.
The wood from denser hardwoods works out at about 100-125kr/m3-loose. Most of the chip delivered is
from softwood thinnings and harvest waste. Generally the timber to go into chip is felled in winter or
spring and left to dry over summer. Generally the delivered cost of the chip to the association over 2007
was about 82Dk/m3-loose, compared with the payment of 91Dk/m3. The cost of oil, and hence the
chipping and transport cost, has to be very carefully judged in order to make the necessary margin.
Timber is chipped by contractors with larger capacity self-propelled or truck-mounted chippers. It is then
carted by a mobile forwarder bin to truck containers by the roadside and collected for transport two at
a time (two bins might contain up to 160 m3-loose). About 80% of the contract volume is processed on
site in the forest, and the balance is stacked on an all-weather access site to be drawn on in case of
prolonged wet spells. Often thinnings are stacked on site under a waterproof cover that has vents to let
out moisture and heat. After needle fall (carrying about 80% of nutrient) the stack is chipped and carted.
The chip by then is usually 30-50% MC.
Central Highlands Bioenergy Scoping Study
Page 107 of 110
C:\Documents and Settings\Laurie\My Documents\Laurie\Farm Business\CHAF\Biodiesel and Bioenergy\Bioenergy\Bioenergy Working Group\Working Group Business plan\Business Plan Project\Stage 2 report\LN_CHAF Bioenergy scoping study FINAL.doc
August 2009
A larger supplier to the Herning plant is HedeDanemark, a large private company that has many
subsidiary businesses including forests management, heavy forest machinery contracting, and
management of municipal trees and gardens. Chip for the Herning contract comes from all these
sections within economic transport range of the plant. Separate agreements are made with forest
owners, municipalities and landowners, always with the tight margins in view. HedeDanemark has to
balance its contract obligation with the Herning CHP with the fact that chip-for-papermaking delivered
in Sweden may net more than chip-for-energy delivered to nearby Herning. For further information see
www.dongenergy.dk or www.vattenfall.dk.
Wrams Gunnarstorp
There are three partners in the biogas plant at the Gunnarstorp farm. Rudolf Tornerhjelm the farmer
owns 24.5%, Bigadan A/S a Danish producer of biogas plants owns 24.5%, and E.on (E.on Gas Sverige
AB), a Swedish energy company, owns 51%. Together they formed a company to run the project.
Construction began in February 2005 and the plant was ready to commence production in Nov 2006.
The final plant cost 40 million SEK and the upgrading plant cost 15 million SEK (total about A$11 million).
Other infrastructure in this cost were a 2.5 km long pipeline from the Findus plant to convey 25-30,000m3
year of food processing waste and sludge, a 3.5 km gas pipe to connect to the natural gas grid, a gas
tank for vehicle gas storage, and several holding tanks for sludge with a combined volume of 25,000
m3 – enough to fertilise 2000-2500ha of surrounding farmland.
The plant is on the 785 ha cropping farm that also annually turns off 6000 pigs. The disposal of 3-4000 m3
a year of pig manure was one incentive to look at biogas options. The Findus plant was keen to have a
local receiver for its waste, and the SLP slaughterhouse in nearby Helsingborg annually had 8000m3 of
waste.
The farmer now turns all his odorous manure into odour-free sludge, and saves about $200,000 a year on
nitrogenous fertiliser. The energy company sells a steady supply of upgraded biomethane into the
natural gas grid at rising prices. The Danish biogas company has the contract to run the plant as it
annually turns up to 65,000m3 of waste into 21-24 GWh of energy in the form of upgraded biogas, plus
sludge. This annual gas volume would fuel 1500 gas vehicles and equals 2.5 million litres of petrol.
The plant was built without subsidy. By May 2008 the plant had been running 1.5 years and was already
in the black, and is expected to have payback by 10 years.
Central Highlands Bioenergy Scoping Study
Page 108 of 110
C:\Documents and Settings\Laurie\My Documents\Laurie\Farm Business\CHAF\Biodiesel and Bioenergy\Bioenergy\Bioenergy Working Group\Working Group Business plan\Business Plan Project\Stage 2 report\LN_CHAF Bioenergy scoping study FINAL.doc
August 2009
Appendix 6: Reference material
Key reports and documents
ABARE 2006. Australian energy: National and state projection to 2029-2030.
ABARE 2008. Energy Update 2008. ABARE project 1646.
ABARE 2009. Electricity Generation: Major development projects – April 2009 listing.
Australian Government, Rural Industries Research and Development Corporation 2007. Biofuels in Australia: Issues and prospects. ISBN 1 74151 4681.
Australian Government, Rural Industries Research and Development Corporation 2008. Carbon Trading and Renewable Energy: A discussion paper on carbon credits and bioenergy developments for forestry and agriculture. ISBN 1 74151 773 7.
Australian Government 2009. Carbon Pollution Reduction Scheme: Australia’s Low Pollution Future. White Paper. ISBN 978 1 921298 30 1.
Australian Local Government Association 2009. Briefing Paper on Carbon Pollution Reduction Scheme Bill 2009 and associated legislation.
Ballarat Timber Processes 2009. Ballarat Timber Processes Feasibility Study.
Central Highlands Agribusiness Forum Bioenergy Working Group 2008. Forest-based Bioenergy Resources.
Clean Energy Council 2008. Australian Bioenergy Roadmap: Setting the direction for biomass in stationary energy to 2020 and beyond. ISBN 978 0 9805646 0 0 (print). ISBN 978 0 9805646 1 7 (pdf).
Clean Energy Council 2008. Biomass Resource Appraisal.
Commonwealth of Australia 2008. The Garnaut Climate Change Review: Final Report. ISBN 978052174447 (pbk.).
CSIRO Sustainable Ecosystems Division. Exploring broader physical system impacts of three alternative electricity generation technology scenarios for Victoria.
Department of Primary Industries 2009. Feed-in tariffs in Victoria: Frequently Asked Questions.
Department of Primary Industries, Farm Services Victoria (undated). Incentives, Funding and other Opportunities for Bioenergy Projects, Developments and Research in Victoria (draft).
Harald Rohracher, Thomas Bogner, Philipp Späth, Florian Faber 2004. The Public Perception of Bioenergy in the EU: Final Report.
Highlands Regional Waste Management Group 2000. Ballarat construction and demolition waste market development: Final public report.
Highlands Regional Waste Management Group 2009. All Environmental Concepts, Organics waste reduction and recovery scoping study.
National Association of Forest Industries 2005. Report 1 – Global and Australian initiatives and impediments to the production of renewable energy from wood in Australia.
National Association of Forest Industries 2005. Report 2 – The potential for wood in a sustainable and competitive Australian renewable energy industry.
National Association of Forest Industries 2005. Report 4 – Converting Wood Energy Conversion Technologies.
National Association of Forest Industries. Economic and social benefits of wood waste renewable energy: Wood waste bioenergy information sheet No 13.
Central Highlands Bioenergy Scoping Study
Page 109 of 110
C:\Documents and Settings\Laurie\My Documents\Laurie\Farm Business\CHAF\Biodiesel and Bioenergy\Bioenergy\Bioenergy Working Group\Working Group Business plan\Business Plan Project\Stage 2 report\LN_CHAF Bioenergy scoping study FINAL.doc
August 2009
National Association of Forest Industries 2008. Forest for renewable energy: Why some critics can’t see the wood waste for the trees. Dr John Raison, CSIRO.
The National Centre for Sustainability 2008. Hopetoun Community Sustainable Energy Initiative: Pre-feasibility report.
The National Centre for Sustainability 2008. Community Renewable Energy: A Research Guide.
John Sanderson, Melissa, Supangat and Tony Richardson 2009. Fighting fire with fire – design, deployment and operation of a megawatt-scale wood-to-energy powerplant in the Marysville triangle: A feasibility study.
Senator Christine Milne 2009. Biomass energy and the Mandatory Renewal Energy Target: Briefing paper prepared by Dr Jane Growns.
Sustainability Victoria 2007. Victorian Local Government Annual Survey 2006-2007.
Sustainability Victoria 200). Wind Energy: Myths and Facts.
Sustainability Victoria 2007. Understanding the Business Case for Distributed Energy Generation in Victoria.
Sustainability Victoria (2008). Biomass Technology Review: Processing for Energy and Materials.
The State of Victoria, Department of Natural Resources and Environment, 2002. Energy for Victoria: A Statement by the Minister for Energy and Resources. ISBN 1 74106 298 5.
The State Government of Victoria, Department of Natural Resources and Environment 2002. Moving Towards Sustainable Biosolids Management: A cooperative venture.
The State Government of Victoria 2005. Sustainability in Action: Towards Zero Waste Strategy.
The State Government of Victoria 2007. The Energy Millennium: Bioenergy in Victoria. Final Report.
The State Government of Victoria, Department of Primary Industries 2008. Firewood and Woody Biomass and their Role in Greenhouse Gas Reduction. ISSN 1329-8062.
The State Government of Victoria, Commissioner Environmental Sustainability Victoria 2008. Victoria 2008: State of the Environment Summary. ISBN 978 921147 12 8.
The State Government of Victoria 2008. Victoria 2008: State of the Environment Summary.
The State Government of Victoria 2009. Victorian Climate Change: Green Paper. ISBN 978 921337 51 2.
United Nations Environment Program 2009. Global Trends in Sustainable Energy Investment in 2009: Analysis of Trends and Issues in the Financing of Renewable Energy and Energy Efficiency.
Victorian Association of Forest Industries 2009. Inquiry into Environmental Regulation in Victoria submission number: DR 113.
Key websites
ABARE: www abareconomics.com
Australian Energy Market Commission: www.aemo.com.au
Australian Government: www.climatechange.gov.au
Bioenergy Atlas of Australia: www.brs.gov.au/bioenergy_atlas/
Clean Energy Council: www.cleanenergycouncil.org.au
Department of Primary Industries: www.dpi.vic.gov.au
National Association of Forest Industries: www.nafi.com.au
Research Institute for Sustainable Energy: www.rise.org.au

Central Highlands Bioenergy Scoping Study
Page 110 of 110
C:\Documents and Settings\Laurie\My Documents\Laurie\Farm Business\CHAF\Biodiesel and Bioenergy\Bioenergy\Bioenergy Working Group\Working Group Business plan\Business Plan Project\Stage 2 report\LN_CHAF Bioenergy scoping study FINAL.doc
August 2009
Sustainability Victoria: www.sustainbility.vic.gov,.au