Embed Size (px)
Citation preview
CENTRAL ELECTRICITY REGULATORY COMMISSION
Notification
New Delhi, the 10th July, 2000
No. L-7/20(1)/99-CERC - In exercise of powers conferred under Regulation
74 read with Regulation 94 read with Regulation 110 of the Central Electricity
Regulatory Commission (Conduct of Business) Regulations, 1999 and all other
powers enabling in this behalf, the Central Electricity Regulatory Commission hereby
makes the following order:-
1. Short title and commencement i. This order shall be called the Central Electricity Regulatory
Commission (Filing of Annual Report by Transmission Utility) Order
1999.
ii. This order shall come into force with immediate effect.
iii. This words and expressions used in this order shall have the same
meaning as defined in the ERC Act, 1999, the Indian Electricity Act,
1910 and the Electricity (Supply) Act, 1948.
2. Annual Report to be filed by the Transmission Utility
Every Transmission Utility shall file with the Secretary, Central Electricity
Regulatory Commission seven copies of Annual Report in respect of all the power
system under its control for the preceding financial year on before 31st October,
containing the particulars in the manner and form as specified in the Schedule.
Provided that the first Annual Report shall be accompanied by the Annual
Reports for a period of four years immediately preceding the financial year for which
the first Annual Report is filed.
Sd/-
SANJEEV S. AHLUWALIA, Secy
SCHEDULE
Instructions for completing Annual Report
PART-I
Section – I:
1. The Annual Report shall be filed as per the instructions provided herein and
the requisite date shall be furnished as per the scheduled attached. All forms
prescribed and accompanying the Annual Report shall be complete in all
respects. The Commission, however, may require the Transmission Utility to
submit additional information/supporting documents/data as it may deem
necessary.
2. Only Arabic numerals shall be used for completing the forms/Schedules. All
figures are to be rounded off to two decimal places, except where otherwise
specified.
3. The negative amounts and figures shall be represented with a bracket sign
around them.
4. Unless otherwise specified in any particular form, all the details as prescribed
by the Commission shall be completed by the Transmission Utility while filing
the Annual Report even where such details had been furnished while filing the
Annual Report on any earlier occasion.
5. Where the details required under any head are not applicable to the
Transmission Utility it shall be stated in full words as NOT APPLICABLE.
6. The format to be followed for indicating the dates shall be Date/Month/Year.
7. When the Transmission Utility seeks to make amendments to Annual Report
filed, only the pages that have been changed from the Annual Report shall be
resubmitted. Seven copies of the pages with the amendments shall be filed,
each page identified by a red stamp indicating whether it is the 1st, 2nd etc.
revision. All such pages resubmitted shall indicate the date of resubmission,
and shall be given the same page number as in the original Annual Report
followed by alphabetical suffixes, as required. A list identifying the re-
submitted pages and specifying the total number of pages re-submitted shall
also be provided along with covering letter indicating the nature of the revision
and the reason therefor. The Commission, however, reserves the right to
direct the Transmission Utility to re-submit the Annual Report in full wherever
it deems appropriate.
8. The Commission except under special circumstances, shall not allow
deviations from prescribed formats. In case, if for some reasons, the
Transmission Utility needs to deviate from the prescribed formats, the reasons
for such deviations shall be clearly spelt out along with detailed justification,
for proper appreciation of the Commission.
9. The data information, supporting documents and evidence provided by the
Transmission Utility in the annual filing report shall be specific, consistent and
precise. Inter-relationships, if any, between information/data in various forms
on the one hand and the supporting evidence on the other shall be
established by the Transmission Utility, to provide clear and unambiguous
understanding of the information provided. Detailed workings and
calculations, wherever specifically required, or otherwise desirable, to support
the details contained in the various forms may be appended as Annexures.
10. All Financial data and information, including those contained in the
Annexures, shall be authenticated, as being based on the books of accounts
and other records maintained and certified to be true by the company’s
statutory auditors. All data and information relating to costs, etc including
methods of allocation and apportionment thereof shall be certified by a
practicing cost accountant as true and correct and the methods of allocation
of costs, etc are fair and reasonable.
11. Though, individual forms require data, information to be stated, in full and
distinctly, on items, such as allocation methods and amounts thereof of
common corporate (including the Head Office) expenses, other common
expenses of construction and operation projects, details of foreign exchange
variations, inter system/regional transfers, capitalized interest during
construction etc. this instruction may be observed as a general rule, in all the
forms, wherever, relevant and applicable or as warranted.
12. Explanation shall be provided or wherever significant variations, or as may be
stipulated, are observed between the current Annual Report and the previous
one for the same region (for different system within the same region and the
reasons therefor. Steps initiated to control, nullify, offset or neutralize any
adverse performance or cost deterioration shall also be described.
13. Specific instructions contained in the individual forms shall be strictly
observed. Most commonly used units of measurement or forms of expression
of items related and connected with power sector may be used, if not provided
for specifically under this order.
Section – II:
Supporting Documents to be submitted
In addition to the forms prescribed, the annual filing report shall be accompanied by
the following documents, unless the same have already been submitted in any
previous Annual Report and details contained therein remain unchanged.
1. A Copy of Techno-Economic Clearance (TEC) for the original cost as well as
revised cost along with a copy of Detailed Project Report (DPR)
2. A Copy of duly signed contacts for the engineering, procurement and
construction, and Transmission service agreements together with
amendments thereof.
3. A copy each, of clearances along with amendments, if any, obtained from the
nodal Ministries/Departments in support of the project environmental
clearance and approved scheme of finance including the rupee and foreign
currency loans.
4. A copy of any notification, standard, norm or any other document to which
reference is made in the annual filing.
5. A copy of the complete set of the audited balance sheets and profit and loss
account with all major working details along with notes to accounts and
auditor’s certificate in respect of each power system/region and company as a
whole.
6. Copy of the guaranteed as per both the contract specifications and the test
reports for all works or projects commissioned.
Section – III:.
Abbreviations used
a) °C - degree Celsius
b) Hz - Hertz or cycles per second
c) g - gram
d) kg - Kilogram
e) kW - Kilo Watt
f) kWh - Kilo Watt hour
g) ltr - litre
h) FY - Financial Year ending 31st March
i) MU - Million Units
j) MW - Mega Watt
k) MT - Metric Tonne
l) Rs - Rupees
m) Rs./Crs - Rupees in Crores
n) Avg. - Average
o) Wgt. Avg. - Weighted Average
Average Outage Duration: It represents the ratio of the estimated total energy unsupplied (in MW-minutes) divided by the total of load (MW) lost.
Circuit: It is a component of a power system consisting of an overhead line (OH), cable or underground cable (UG), power transformer (TFR2) for two windings transformer; TFR3 for three windings transformer), or a combination of these items, terminated by circuit breakers.
Circuit Availability: In relation to a specified period of time, it is defined by the ration of the total hours a circuit is available divided by the number of hours in the period.
Connection Points: As per the Indian Electricity Grid Code, connection point is a point at which the transmission utility’s plant and or apparatus connects to the Inter-State Transmission system. The connection points are classified further into the following categories for the purpose of data reporting.
Type A Connection Point: Busbar that is operated as part of a radial Power System, such that an outage of type A busbar result in an interruption of the bulk power supply or delivery,
Type B – Connection Pont: Busbar that is operated as part of a meshed grid/power system, such that an outage of a Type B busbar does not necessarily result in an interruption of the bulk power supply deliver, but may result in a partial bulk power supply or delivery.
Type G - Generator Connection Pont: Busbar associated with each connection point, on the high voltage side, on the grid/power system of a generating station.
Type I – Interconnector Connection Pont: Busbar associated physically to the transfer of bulk supply power between two regions (or grids/power systems).
Type U – User Delivery Point: Busbar associated to the consumer connection point where the bulk power supply is physically delivered to the consumer’s load.
Forced Outage (or Unplanned Non availability) hours: In relation to the period under consideration, it is the actual number of hours of outage of a Transmission Utility due to fault or other reasons which has not been planned.
Interruption Duration: In relation to a specified period of time, it represents the total duration expressed in minutes during which a delivery point is interrupted, until the restoration of the power supply.
Interruption Frequency: It represents the number of interruption events of occurrence per circuit (or delivery point) during a specified period of time.
Line: It is a circuit constituted by one overhead line circuit (), cable circuit (), or a combination of these circuits.
Petition means the includes all petitions, applications, complaints, appeals, replies, rejoinders, supplemental, pleadings, other papers and documents;
Planned Outage (or Non availability) Hours - In relation to the period under consideration, it is the actual number of hours during which a circuit is out of service or when there is an interruption of the delivery of the bulk power supply due to an outage, with prior notice. There are three categories of Planned Unavailability:
1) Outages planned by Transmission Utility for Maintenance: are the outages planned in for a definite period of time in advance for the purpose of the maintenance of the grid or power system.
2) Construction outages planned by Transmission Utility: are the outages planned in advance for the purpose of the construction or modification of the grid or power system, and which are not provided for the exclusive benefit of the specific Bulk Power Supply Consumers.
3) User Connection Outage: are the outages planned in advance for the purpose of the construction or medications of the generating station substation or consumer’s power system, or which are provided to facilitate connection for the exclusive benefit of specific Bulk Power Supply Generating station or consumers.
Power System Availability: is defined by the ratio of the total hours each of the circuits of the power system considered as available divided by the product of the number of circuits in that the power system by the number of hours during a specified period of time.
Power System Average Interruption Frequency Index (SAIFI): In relation to a particular system, it represents the ratio of the total number of delivery point interruptions during a specified period of time divided by the number of delivery points associated
Power System Average Interruption and Duration Index (SAIDI): In relation to a particular system, it represents the ratio of the total duration of delivery point interruptions during a specified period of time divided by the number of delivery points associated to the system considered. Note: this could be applied to a particular type of delivery points.
Power System Average Restoration Index (SARI): In relation to a particular system, it represents the total duration of the delivery point interruptions divided by the total number of delivery point interruptions related to the system considered. Note: this could be applied to a particular Type of delivery points.
Restoration Time: It represents the time in minutes to restore the bulk power supply to a delivery point following a single interruption.
Unsupplied Energy: It represents the total energy unsupplied due to all interruptions during a specified period of time at Type G or U Delivery Points, and is expressed in MW-min.
System Interruption Severity Index (SISI): In relation to a particular system, it represents the ratio of the total unsupplied energy (in MW-minutes) at the delivery points divided by the maximum peak load (MW) recorded on the system considered.
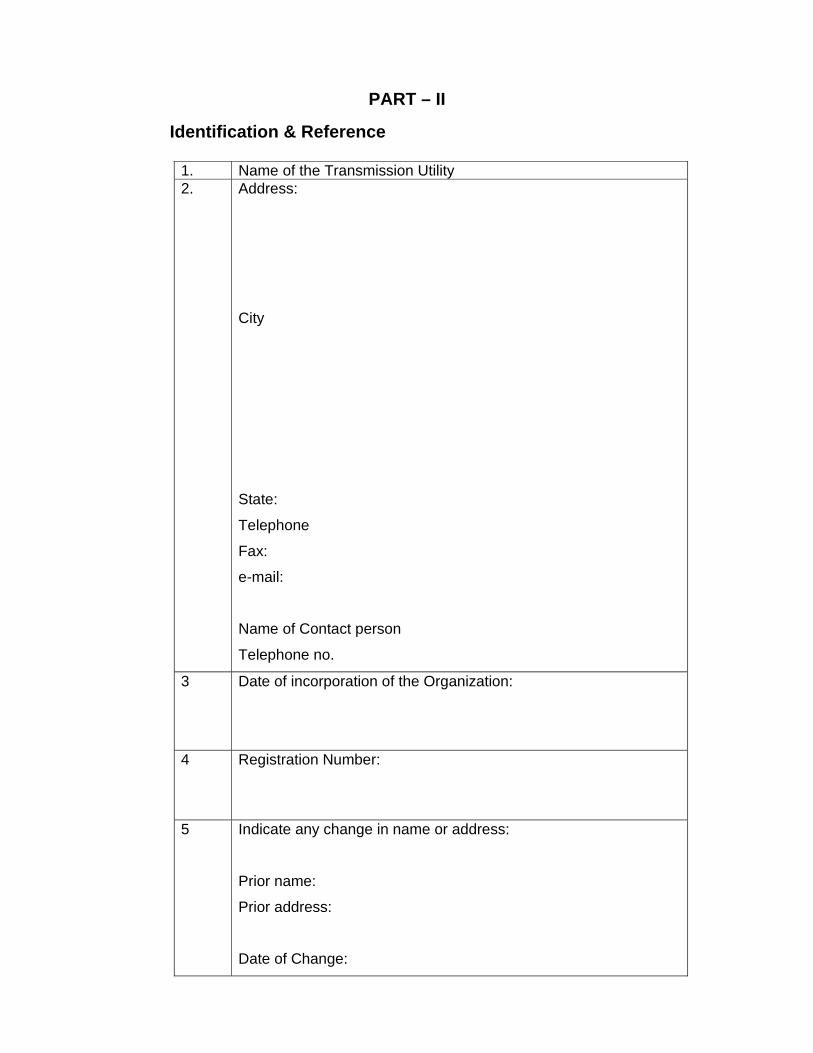
PART – II
Identification & Reference
1. Name of the Transmission Utility 2. Address:
City
State:
Telephone
Fax:
e-mail:
Name of Contact person
Telephone no.
3 Date of incorporation of the Organization:
4 Registration Number:
5 Indicate any change in name or address:
Prior name:
Prior address:
Date of Change:
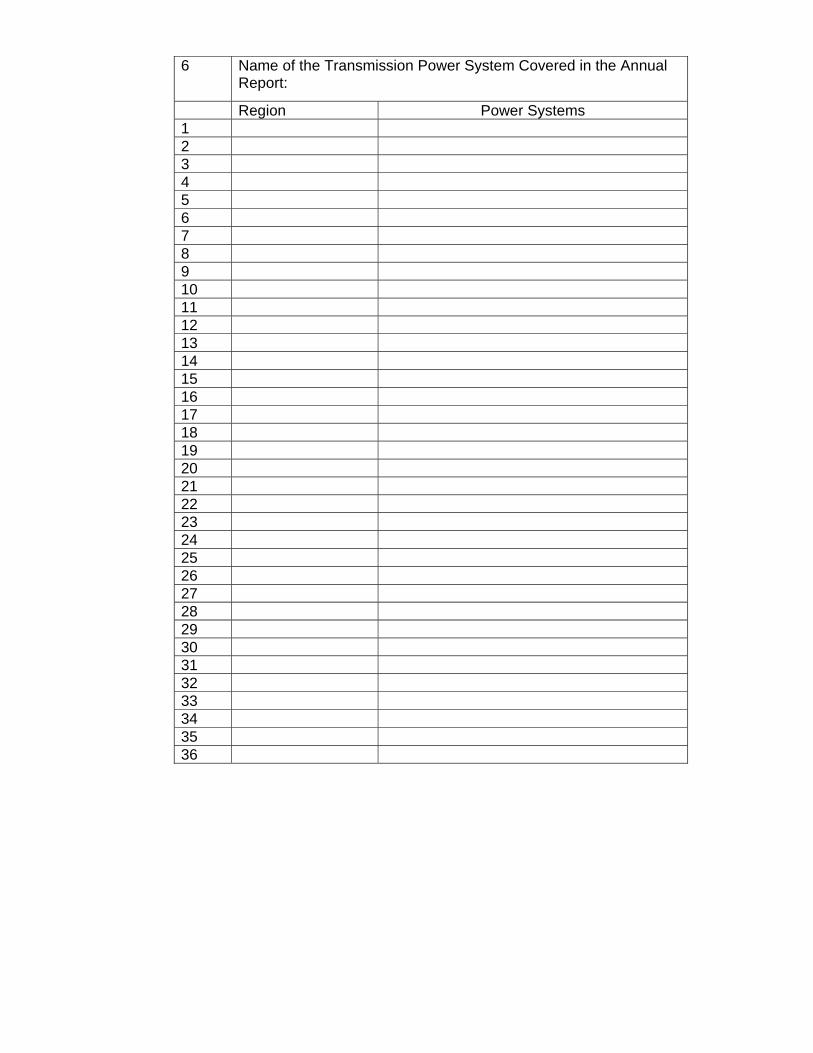
6 Name of the Transmission Power System Covered in the Annual Report:
Region Power Systems 1 2 3 4 5 6 7 8 9 10 11 12 13 14 15 16 17 18 19 20 21 22 23 24 25 26 27 28 29 30 31 32 33 34 35 36
PART – III CORPORATE FINANCIAL AND OPERATIONAL DATA
FINANCIAL YEAR:
Name of the Transmission Utility
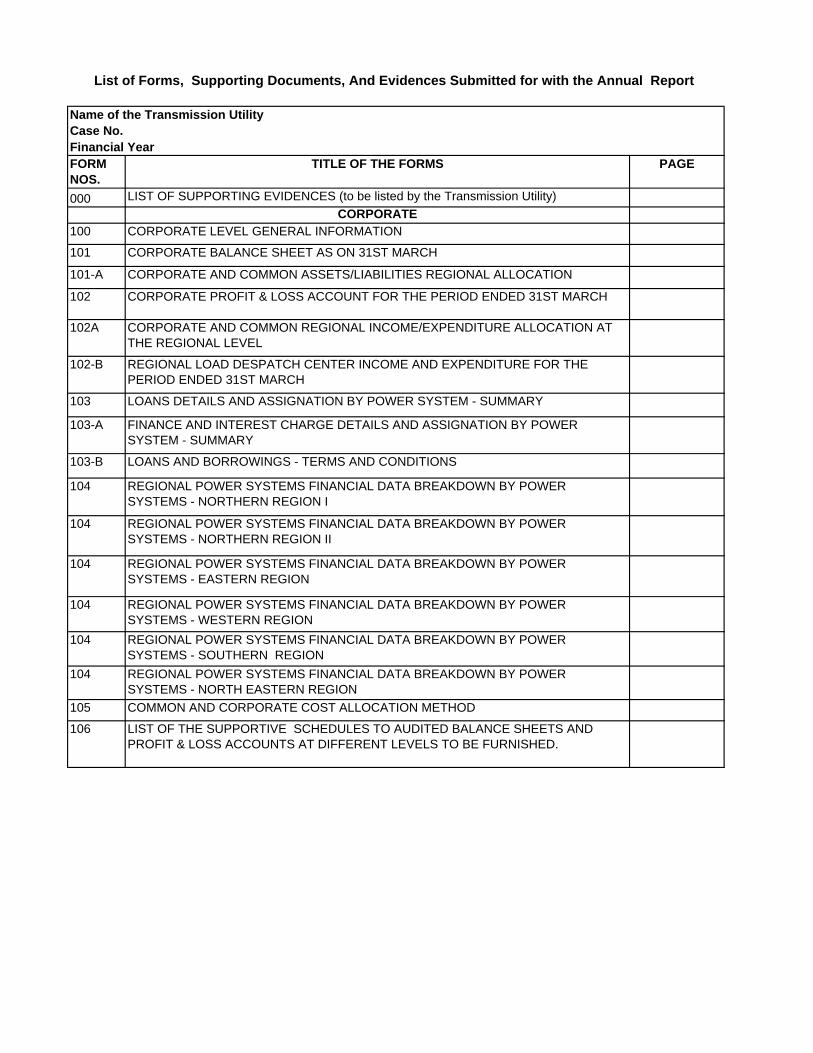
Case No.Financial Year FORM NOS.
TITLE OF THE FORMS PAGE
000 LIST OF SUPPORTING EVIDENCES (to be listed by the Transmission Utility)CORPORATE
100 CORPORATE LEVEL GENERAL INFORMATION
101 CORPORATE BALANCE SHEET AS ON 31ST MARCH
101-A CORPORATE AND COMMON ASSETS/LIABILITIES REGIONAL ALLOCATION
102 CORPORATE PROFIT & LOSS ACCOUNT FOR THE PERIOD ENDED 31ST MARCH
102A CORPORATE AND COMMON REGIONAL INCOME/EXPENDITURE ALLOCATION AT THE REGIONAL LEVEL
102-B REGIONAL LOAD DESPATCH CENTER INCOME AND EXPENDITURE FOR THE PERIOD ENDED 31ST MARCH
103 LOANS DETAILS AND ASSIGNATION BY POWER SYSTEM - SUMMARY
103-A FINANCE AND INTEREST CHARGE DETAILS AND ASSIGNATION BY POWER SYSTEM - SUMMARY
103-B LOANS AND BORROWINGS - TERMS AND CONDITIONS
104 REGIONAL POWER SYSTEMS FINANCIAL DATA BREAKDOWN BY POWER SYSTEMS - NORTHERN REGION I
104 REGIONAL POWER SYSTEMS FINANCIAL DATA BREAKDOWN BY POWER SYSTEMS - NORTHERN REGION II
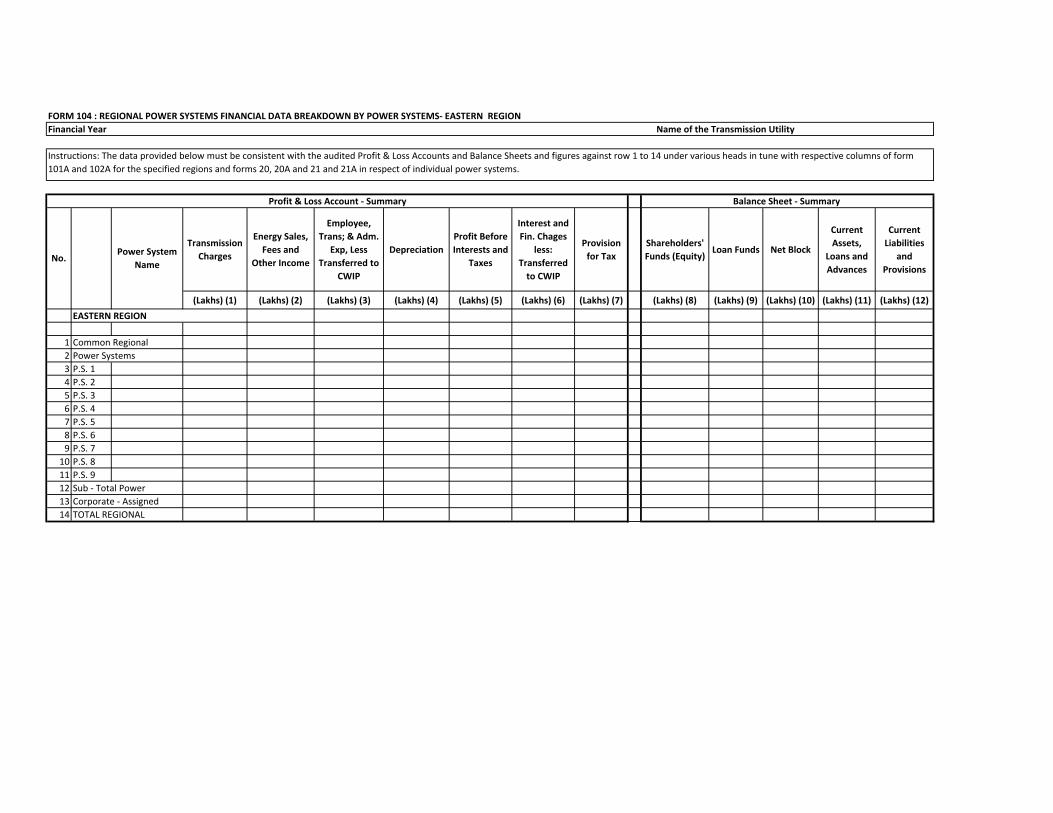
104 REGIONAL POWER SYSTEMS FINANCIAL DATA BREAKDOWN BY POWER SYSTEMS - EASTERN REGION
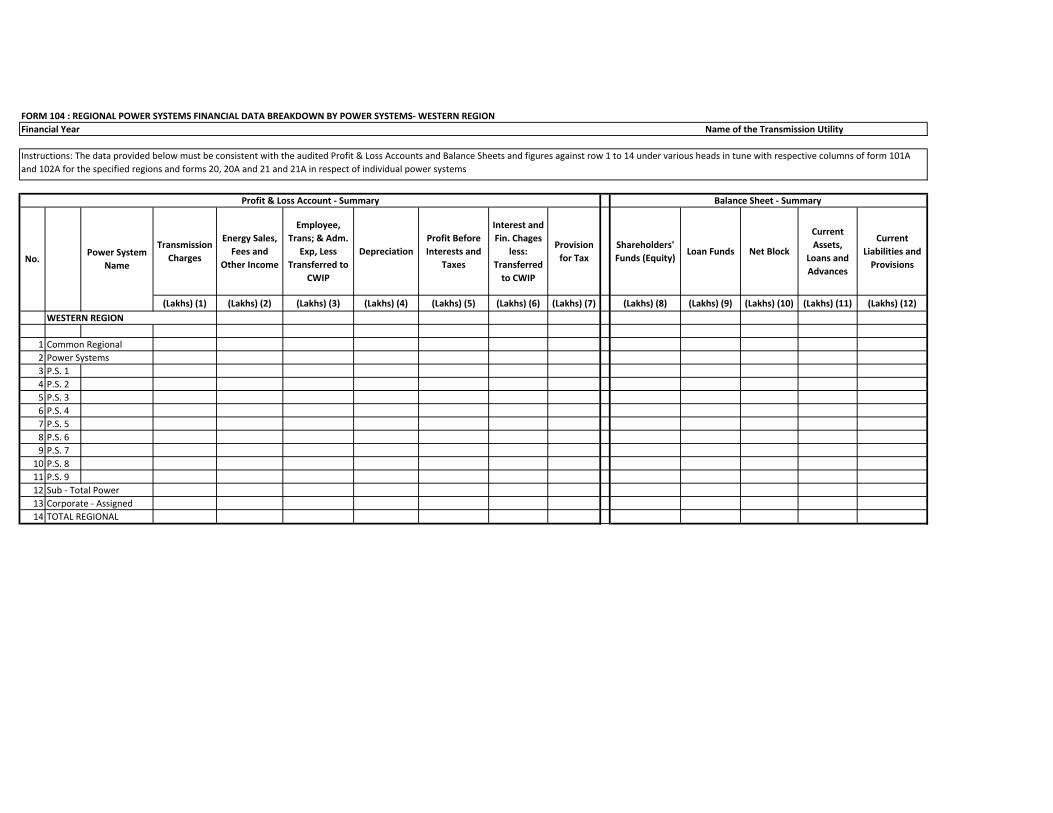
104 REGIONAL POWER SYSTEMS FINANCIAL DATA BREAKDOWN BY POWER SYSTEMS - WESTERN REGION
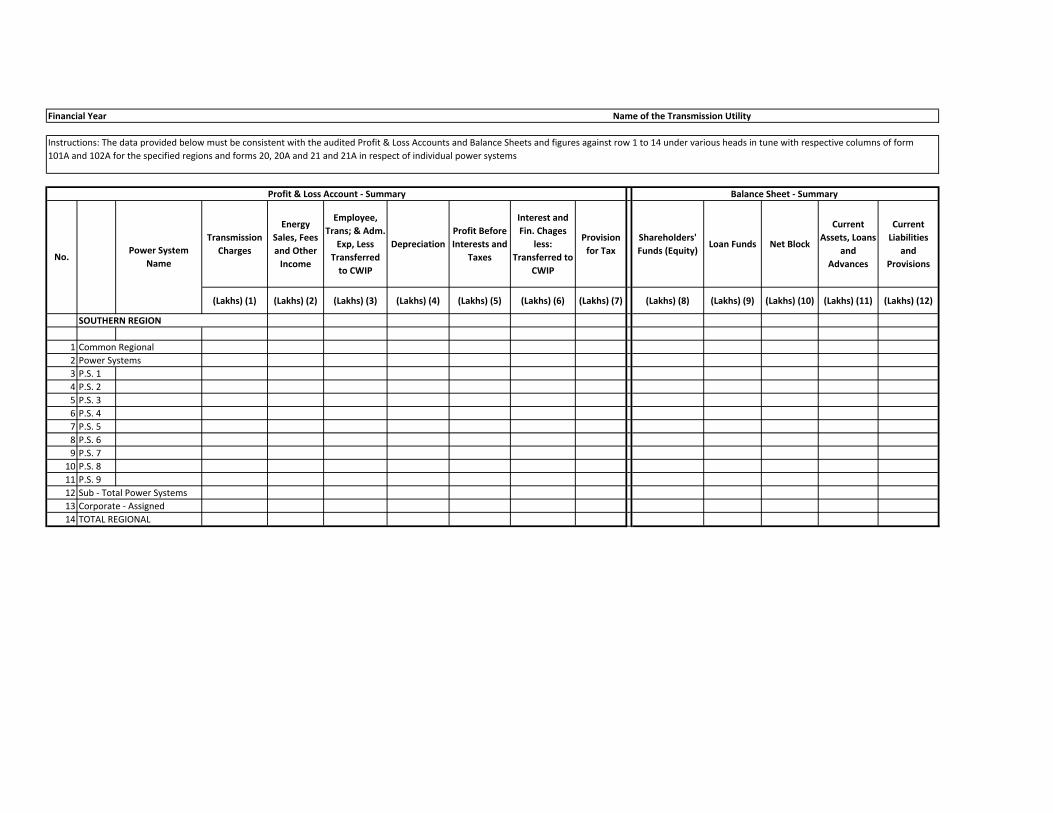
104 REGIONAL POWER SYSTEMS FINANCIAL DATA BREAKDOWN BY POWER SYSTEMS - SOUTHERN REGION
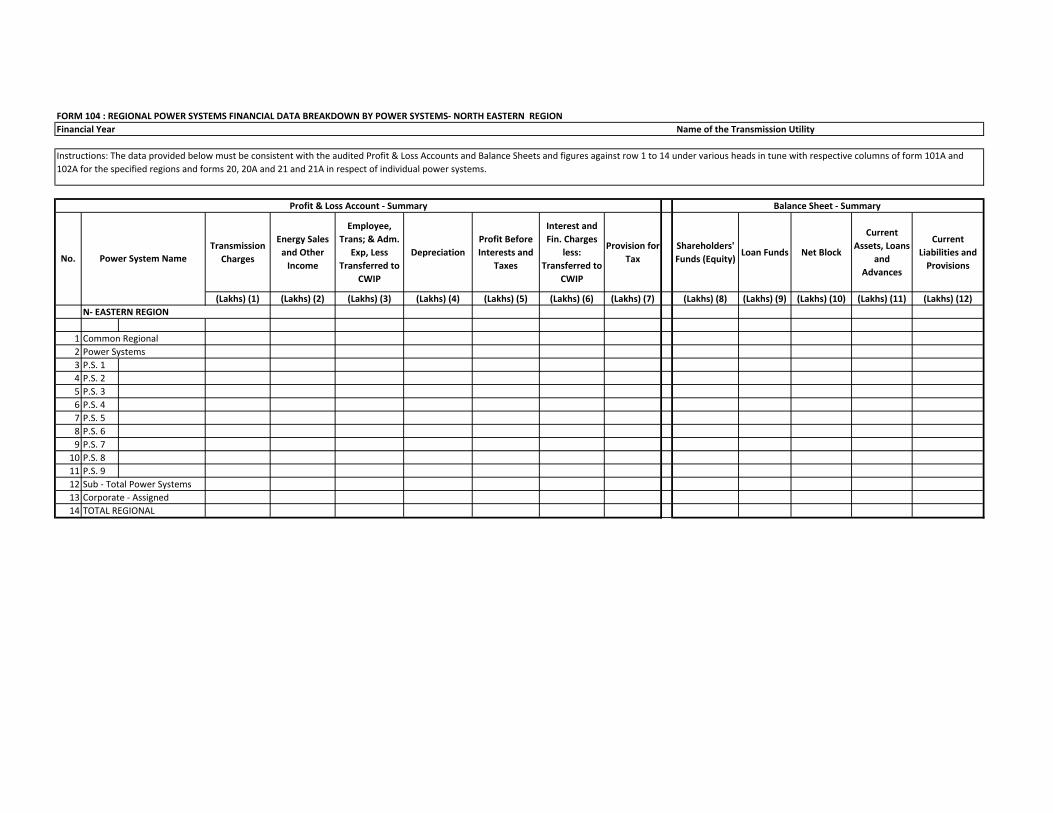
104 REGIONAL POWER SYSTEMS FINANCIAL DATA BREAKDOWN BY POWER SYSTEMS - NORTH EASTERN REGION
105 COMMON AND CORPORATE COST ALLOCATION METHOD
106 LIST OF THE SUPPORTIVE SCHEDULES TO AUDITED BALANCE SHEETS AND PROFIT & LOSS ACCOUNTS AT DIFFERENT LEVELS TO BE FURNISHED.
Name of the Transmission Utility
List of Forms, Supporting Documents, And Evidences Submitted for with the Annual Report
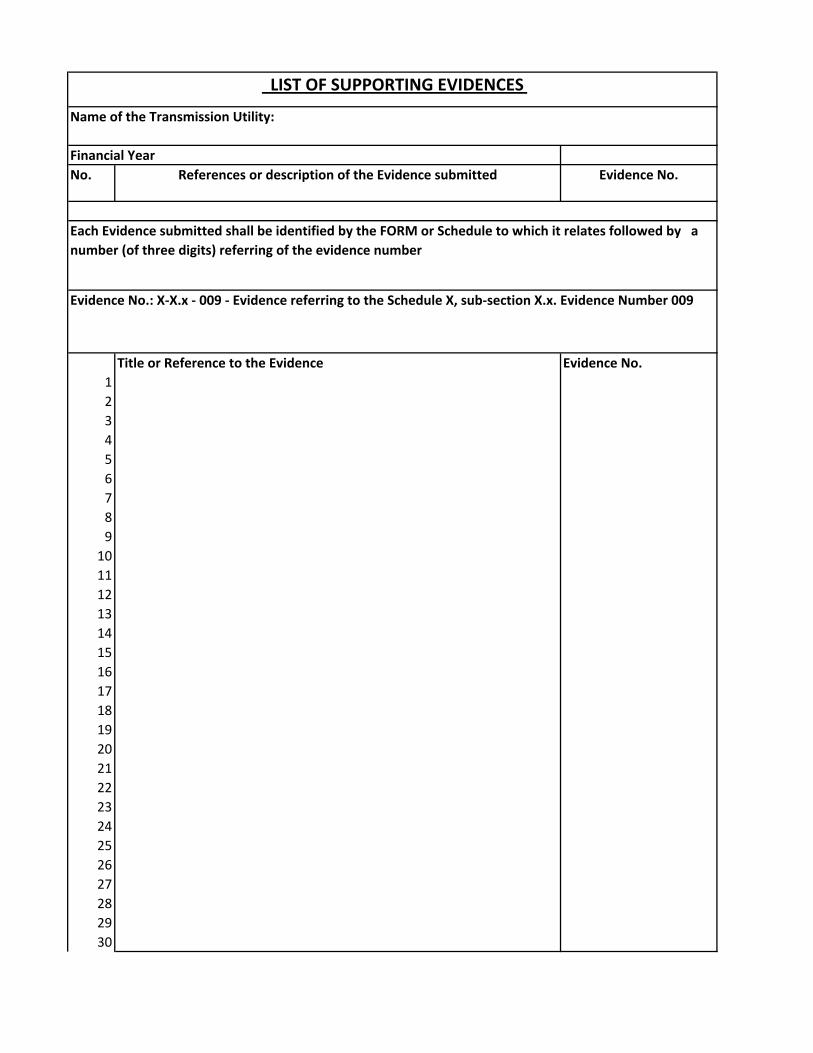
No. References or description of the Evidence submitted Evidence No.
Title or Reference to the Evidence Evidence No.123456789
101112131415161718192021222324252627282930
Evidence No.: X‐X.x ‐ 009 ‐ Evidence referring to the Schedule X, sub‐section X.x. Evidence Number 009
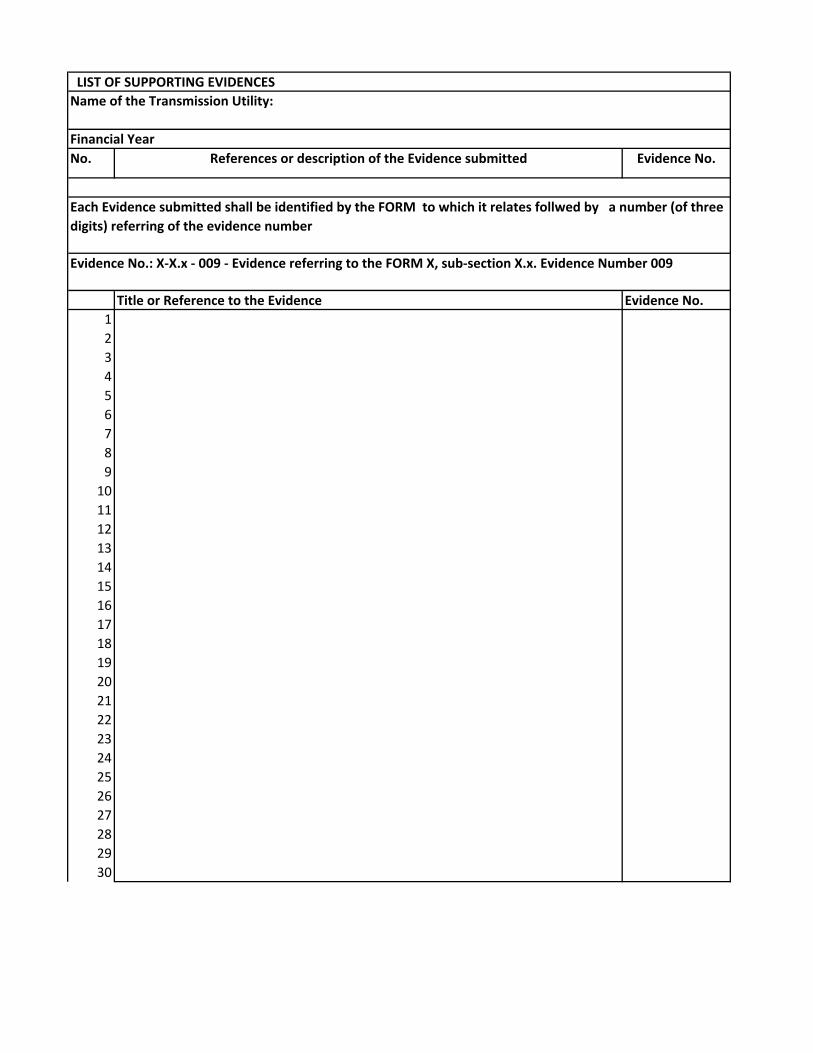
LIST OF SUPPORTING EVIDENCES
Financial Year
Name of the Transmission Utility:
Each Evidence submitted shall be identified by the FORM or Schedule to which it relates followed by a number (of three digits) referring of the evidence number
Name of the Transmission Utility Evidence No.
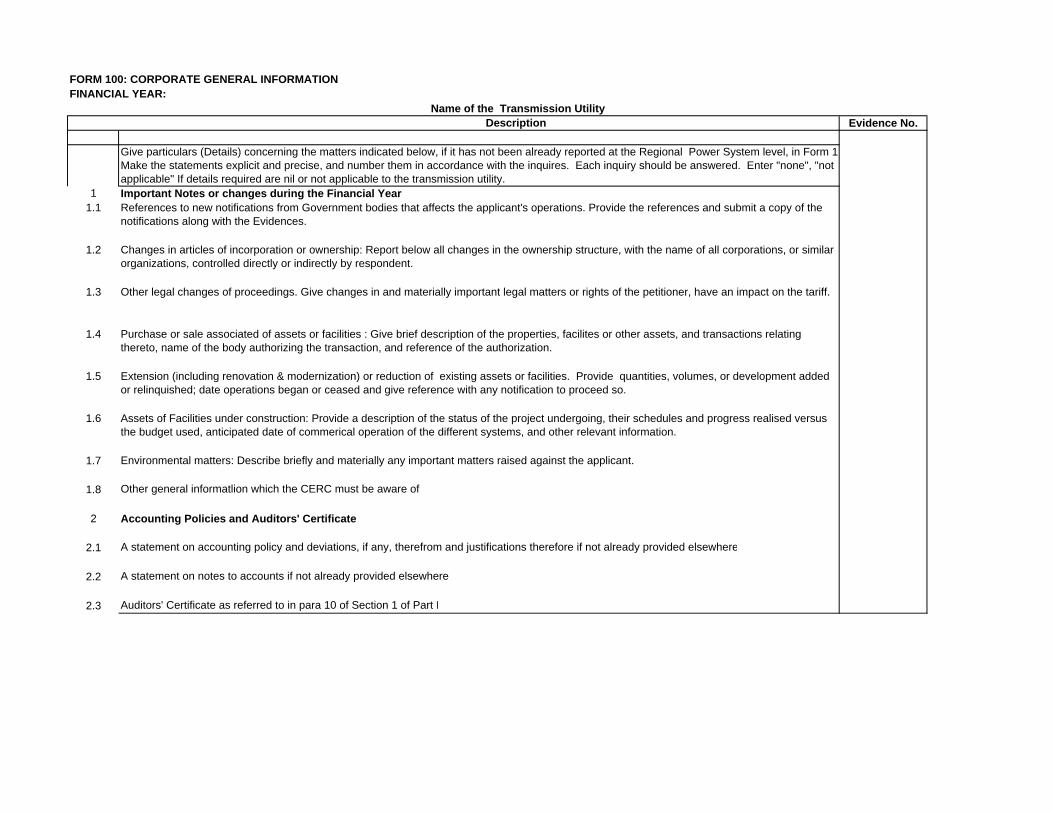
Give particulars (Details) concerning the matters indicated below, if it has not been already reported at the Regional Power System level, in Form 1Make the statements explicit and precise, and number them in accordance with the inquires. Each inquiry should be answered. Enter "none", "not applicable" If details required are nil or not applicable to the transmission utility.
1 Important Notes or changes during the Financial Year1.1 References to new notifications from Government bodies that affects the applicant's operations. Provide the references and submit a copy of the
notifications along with the Evidences.
1.2 Changes in articles of incorporation or ownership: Report below all changes in the ownership structure, with the name of all corporations, or similar organizations, controlled directly or indirectly by respondent.
1.3 Other legal changes of proceedings. Give changes in and materially important legal matters or rights of the petitioner, have an impact on the tariff.
1.4 Purchase or sale associated of assets or facilities : Give brief description of the properties, facilites or other assets, and transactions relating thereto, name of the body authorizing the transaction, and reference of the authorization.
1.5 Extension (including renovation & modernization) or reduction of existing assets or facilities. Provide quantities, volumes, or development added or relinquished; date operations began or ceased and give reference with any notification to proceed so.
1.6 Assets of Facilities under construction: Provide a description of the status of the project undergoing, their schedules and progress realised versus the budget used, anticipated date of commerical operation of the different systems, and other relevant information.
1.7 Environmental matters: Describe briefly and materially any important matters raised against the applicant.
1.8 Other general informatlion which the CERC must be aware of.
2 Accounting Policies and Auditors' Certificate
2.1 A statement on accounting policy and deviations, if any, therefrom and justifications therefore if not already provided elsewhere
2.2 A statement on notes to accounts if not already provided elsewhere
2.3 Auditors' Certificate as referred to in para 10 of Section 1 of Part I
FORM 100: CORPORATE GENERAL INFORMATIONFINANCIAL YEAR:
Description
I.II.
ParticularsAll power systems Assets/Liabilities
Direct
Regional Common Assets
/Liabilities
Corporate Common Assets and Liabilites
Sub total(1+2+3)
Assets/Liabilities Unallocated (Joint‐Ventures or other
Businesses)
RLDCGRAND TOTAL(4+5+6)
(Lakhs) (1) (Lakhs) (2) (Lakhs) (3) (Lakhs) (Lakhs) (5) (Lakhs) (Lakhs) (7)
SOURCES OF FUNDS 1 Shareholders' Funds
Capital DepositReserves and Surplus
2 Loan Fundsa) Secured Loans
b) Unsecured Loans
3A a) Income Received on Account of Advance Against Depreciation, if any
3B Inter Unit AccountAPPLICATION OF FUNDS
4 Fixed Capital Expenditurea) Gross Blockb) Accumulated Depreciationc) Net Blockd) Capital Work‐in‐progresse) Construction Stores and Advancesf) Investments5 Current Assets; Loans and Advances
a) Inventoriesb) Sundry Debtorsc) Cash & Bank Balancesd) Other Current Assetse) Loans & Advances6 Less: Current Liabilities & Provisions
a) Liabilitiesb) Provisions7 Net Current Assets8 Miscellaneous Expenditure (to extent
not written off or adjusted)9 Contingent Liabilities
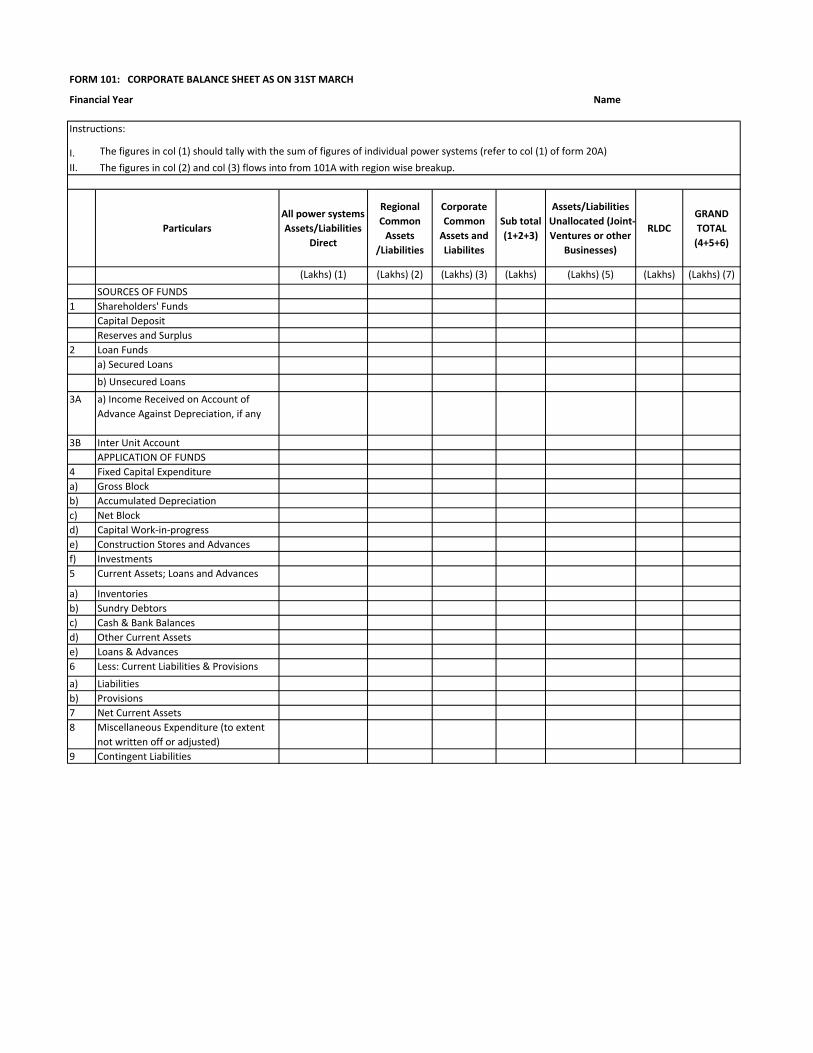
FORM 101: CORPORATE BALANCE SHEET AS ON 31ST MARCH
Financial Year Name
The figures in col (1) should tally with the sum of figures of individual power systems (refer to col (1) of form 20A)
The figures in col (2) and col (3) flows into from 101A with region wise breakup.
Instructions:
1
NORTHERN REGION ‐I
NORTHERN REGION ‐ ii
EASTERN REGION
WESTERN REGION
SOUTHERN REGION
N‐EASTERN REGION
NORTHERN REGION ‐I
NORTHERN REGION ‐ ii
EASTERN REGION
WESTERN REGION
SOUTHERN REGION
N‐EASTERN REGION
(Lakhs) (Lakhs) (Lakhs) (Lakhs) (Lakhs) (Lakhs) (Lakhs) (Lakhs) (Lakhs) (Lakhs) (Lakhs) (Lakhs)SOURCES OF FUNDS
1 Shareholders' FundsCapital DepositReserves and Surplus
2 Loan Fundsa) Secured Loansb) Unsecured Loans3A a) Income Received on Account of
Advance Against Depreciation, if any
3B Inter Unit AccountAPPLICATION OF FUNDS
4 Fixed Capital Expenditurea) Gross Blockb) Accumulated Depreciationc) Net Blockd) Capital Work‐in‐progresse) Construction Stores and Advancesf) Investments5 Current Assets; Loans and Advancesa) Inventoriesb) Sundry Debtorsc) Cash & Bank Balancesd) Other Current Assetse) Loans & Advances6 Less: Current Liabilities & Provisionsa) Liabilitiesb) Provisions7 Net Current Assets8 Miscellaneous Expenditure (to extent not
written off or adjusted)9 Contingent Liabilities
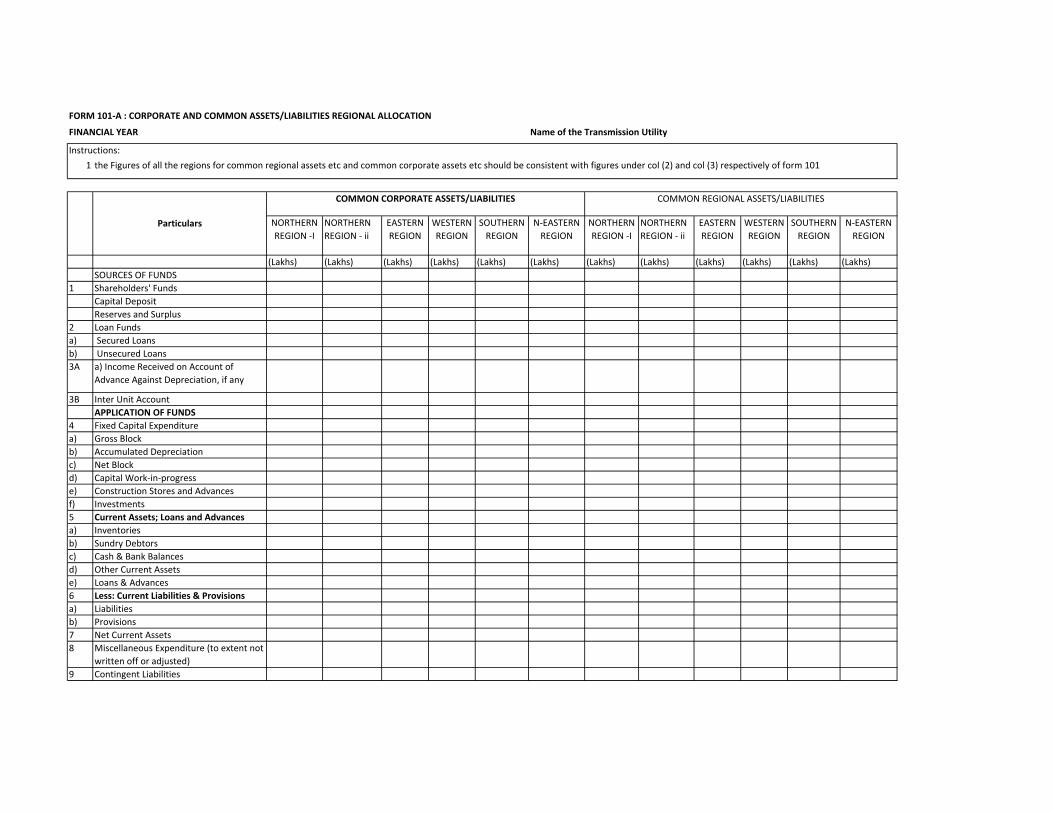
FORM 101‐A : CORPORATE AND COMMON ASSETS/LIABILITIES REGIONAL ALLOCATION
Name of the Transmission Utility FINANCIAL YEAR
COMMON CORPORATE ASSETS/LIABILITIES COMMON REGIONAL ASSETS/LIABILITIES
Particulars
Instructions:
the Figures of all the regions for common regional assets etc and common corporate assets etc should be consistent with figures under col (2) and col (3) respectively of form 101
I.II.
III
All power systems
Income and Exp. Direct
Regional Common
Income and Exp.
Corporate Common
Income and Exp.
Sub total(1+2+3)
Income and Exp. Unallocated
(Joint‐Ventures or other
Businesses)
Income and Exp of
RLDC
GRAND TOTAL(4+5+6)
(Lakhs) (1) (Lakhs) (2) (Lakhs) (3) (Lakhs) (4) (Lakhs) (5) (Lakhs) (6) (Lakhs) (7)
INCOME1 Transmission Charges2 (Tax Recovery)3 RLDC Fees etc.4 Sale of Electric Power5 Consultancy, PM and Supervision fees6 Other Income (to be specified if significant)7 Total (1‐6)EXPENDITURE
8 Purchase of Electric Power, if any9 Transmission, Admin & Other Expenses
10 Depreciation11 Prior Period Adjustment (Net)
12Others (not included above and to be specified)
13 Sub Total (8 to 12)14 Less: Incidental Exp. During Construction ‐ Expenses
Transferred to Capital‐Work‐in‐Prog.
15 Sub Total (13 ‐ 14)16 Deferred Revenue Expenditure Written Off17 Provision18 Loss on Fixed Assets discarded19 C.C. Expenses charges to Revenue20 R.O./ED Office Exps charged to Revenue21 R.L.D.C. Expenses charged to Revenue22 Total (15+16 to 21)23 Profit for the Year (before interest & Fin. Charges )
(7‐22)24 Interest and Finance Charges25 Less: Interest & Finance Charges transferred to
CWIP26 Sub Total (24‐25)27 Profit for the Year (before TAX ) (22‐26)28 Provision for Taxation29 Profit After Tax (27‐28)30 Balance Profit from last Year's Account31 Proposed Dividend32 Tax on Proposed Dividend33 Transfer to Bonds Redemption Reserve34 Transfer to Self Insurance Reserve35 Transfer to General Reserve36 Balance to Profit carried over to Balance Sheet
(29+30‐(31 to 35))
Particulars
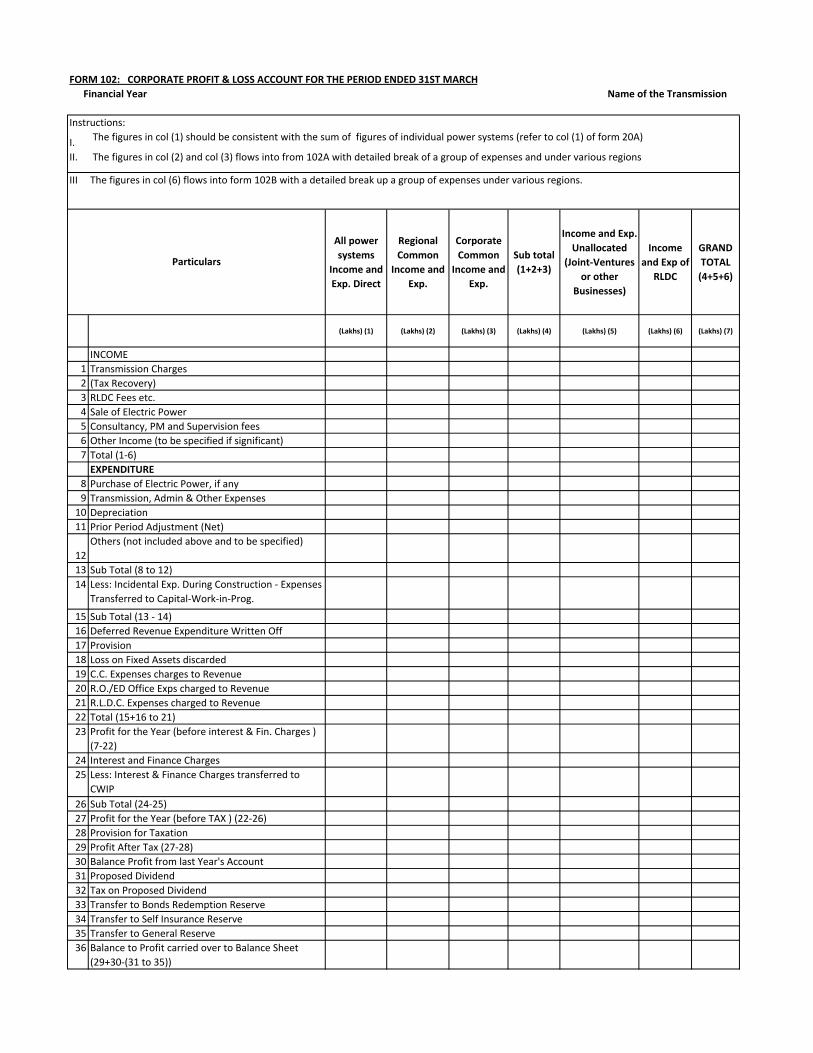
FORM 102: CORPORATE PROFIT & LOSS ACCOUNT FOR THE PERIOD ENDED 31ST MARCH
Instructions: The figures in col (1) should be consistent with the sum of figures of individual power systems (refer to col (1) of form 20A)
The figures in col (2) and col (3) flows into from 102A with detailed break of a group of expenses and under various regions
The figures in col (6) flows into form 102B with a detailed break up a group of expenses under various regions.
Financial Year Name of the Transmission
1
NORTHERN REGION ‐I
NORTHERN REGION ‐ II
EASTERN REGION
WESTERN REGION
SOUTHERN REGION
N‐EASTERN REGION
NORTHERN REGION ‐I
NORTHERN REGION ‐ II
EASTERN REGION
WESTERN REGION
SOUTHERN REGION
N‐EASTERN REGION
(Lakhs) (Lakhs) (Lakhs) (Lakhs) (Lakhs) (Lakhs) (Lakhs) (Lakhs) (Lakhs) (Lakhs) (Lakhs) (Lakhs)
INCOME
1 Transmission Charges2 (Tax Recovery)3 Sale of Electric Power4 Consultancy, PM and Supervision fees5 Other Income (to be specified if significant)
6 Total (1‐5)EXPENDITURE
7 Purchase of Electric PowerTransmission, Admin & Other Expenses
8 Employee CostsTransmission Expenses
9 Repairs & Maintenance10 Power Charges (net)11 Stores & Spares Consumed 12 Water Charges13 Wheeling Charges14 Others (not included above and to be
specified)15 Sub Total (8 to 14)
ADMINISTRATION EXPENSES16 Training & Recruit Exp.17 Legal Expenses18 Professional Charges19 Consultancy Expenses20 Communication Expenses21 Travelling Expenses22 Tender Expenses23 Auditors Exp.24 Advertisement and Publicity25 Printing and Stationery26 EDP Hire and Other Charges
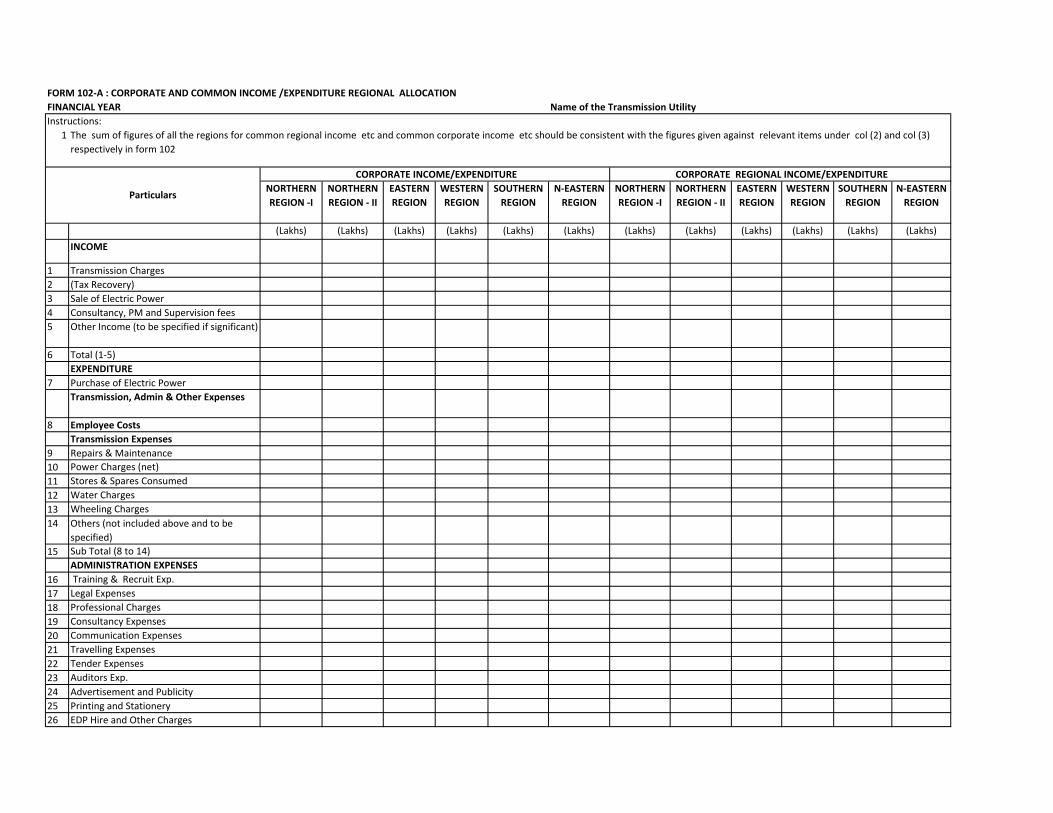
CORPORATE INCOME/EXPENDITURE CORPORATE REGIONAL INCOME/EXPENDITURE
Particulars
FORM 102‐A : CORPORATE AND COMMON INCOME /EXPENDITURE REGIONAL ALLOCATION FINANCIAL YEAR Name of the Transmission Utility Instructions:
The sum of figures of all the regions for common regional income etc and common corporate income etc should be consistent with the figures given against relevant items under col (2) and col (3) respectively in form 102
1
NORTHERN REGION ‐I
NORTHERN REGION ‐ II
EASTERN REGION
WESTERN REGION
SOUTHERN REGION
N‐EASTERN REGION
NORTHERN REGION ‐I
NORTHERN REGION ‐ II
EASTERN REGION
WESTERN REGION
SOUTHERN REGION
N‐EASTERN REGION
CORPORATE INCOME/EXPENDITURE CORPORATE REGIONAL INCOME/EXPENDITURE
Particulars
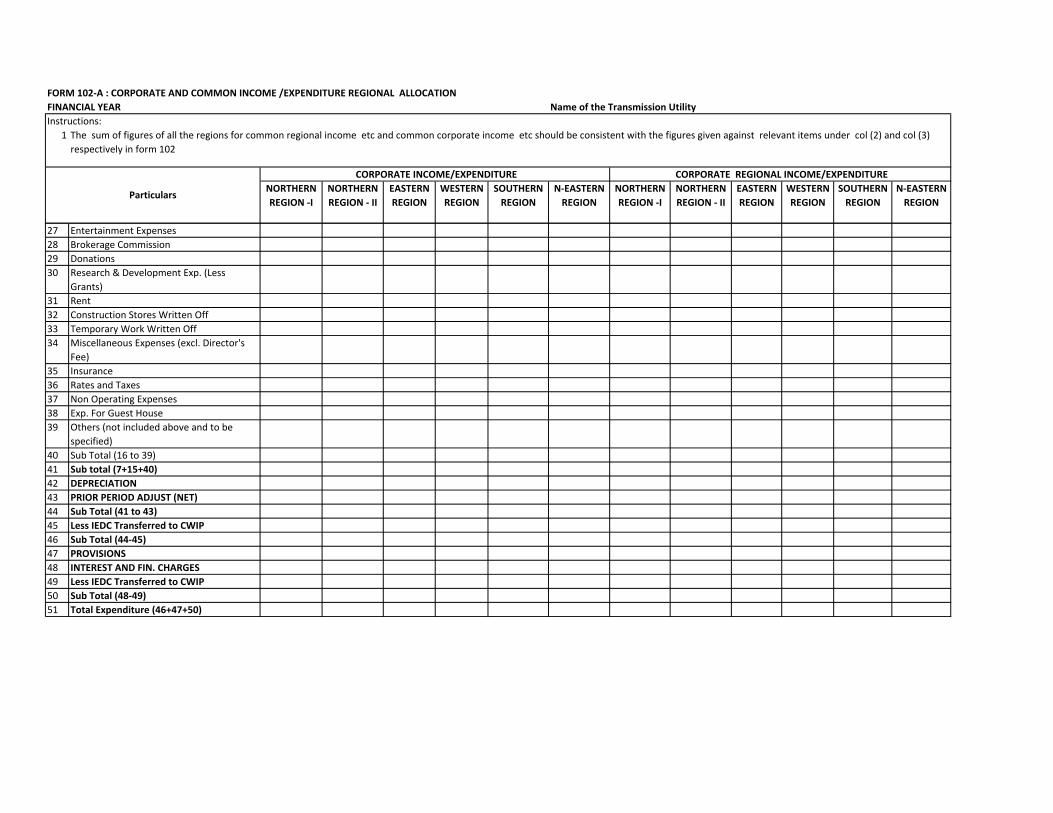
FORM 102‐A : CORPORATE AND COMMON INCOME /EXPENDITURE REGIONAL ALLOCATION FINANCIAL YEAR Name of the Transmission Utility Instructions:
The sum of figures of all the regions for common regional income etc and common corporate income etc should be consistent with the figures given against relevant items under col (2) and col (3) respectively in form 102
27 Entertainment Expenses28 Brokerage Commission29 Donations30 Research & Development Exp. (Less
Grants)31 Rent32 Construction Stores Written Off33 Temporary Work Written Off34 Miscellaneous Expenses (excl. Director's
Fee)35 Insurance36 Rates and Taxes37 Non Operating Expenses38 Exp. For Guest House39 Others (not included above and to be
specified)40 Sub Total (16 to 39)41 Sub total (7+15+40)42 DEPRECIATION43 PRIOR PERIOD ADJUST (NET)44 Sub Total (41 to 43)45 Less IEDC Transferred to CWIP46 Sub Total (44‐45)47 PROVISIONS48 INTEREST AND FIN. CHARGES49 Less IEDC Transferred to CWIP50 Sub Total (48‐49)51 Total Expenditure (46+47+50)
TOTAL RLDCNORTHERN REGION
EASTERN REGION
WESTERN REGION
SOUTHERN REGION
N‐EASTERN REGION
(Lakhs) (Lakhs) (Lakhs) (Lakhs) (Lakhs) (Lakhs)INCOME
1 Transmission Charges2 (Tax Recovery)3 RLDC fees etc4 Consultancy, PM and Supervision fees5 Other Income (to be specified if significant)6 Total (1‐5)
EXPENDITURE7 Purchase of Electric Power
Transmission, Admin & Other Expenses8 Employee Costs
Transmission Expenses9 Repairs & Maintenance
10 Power Charges (net)11 Stores & Spares Consumed 12 Water Charges13 Wheeling Charges14 Others (not included above and to be specified)
15 Sub Total (8 to 14)ADMINISTRATION EXPENSES
16 Training & Recruit Exp.17 Legal Expenses18 Professional Charges19 Consultancy Expenses20 Communication Expenses21 Travelling Expenses22 Tender Expenses23 Auditors Exp.24 Advertisement and Publicity25 Printing and Stationery26 EDP Hire and Other Charges27 Entertainment Expenses28 Brokerage Commission29 Donations30 Research & Development Exp. (Less Grants)31 Rent32 Construction Stores Written Off33 Temporary Work Written Off34 Miscellaneous Expenses (excl. Director's Fee)
35 Insurance36 Rates and Taxes37 Non Operating Expenses38 Exp. For Guest House39 Others (not included above and to be specified)40 Sub Total (16 to 39)41 Sub total (7+15+40)42 DEPRECIATION43 PRIOR PERIOD ADJUST (NET)44 Sub Total (41 to 43)45 Less IEDC Transferred to CWIP46 Sub Total (44‐45)47 PROVISIONS48 INTEREST AND FIN. CHARGES49 Less IEDC Transferred to CWIP50 Sub Total (48‐49)51 Total Expenditure (46+47+50)
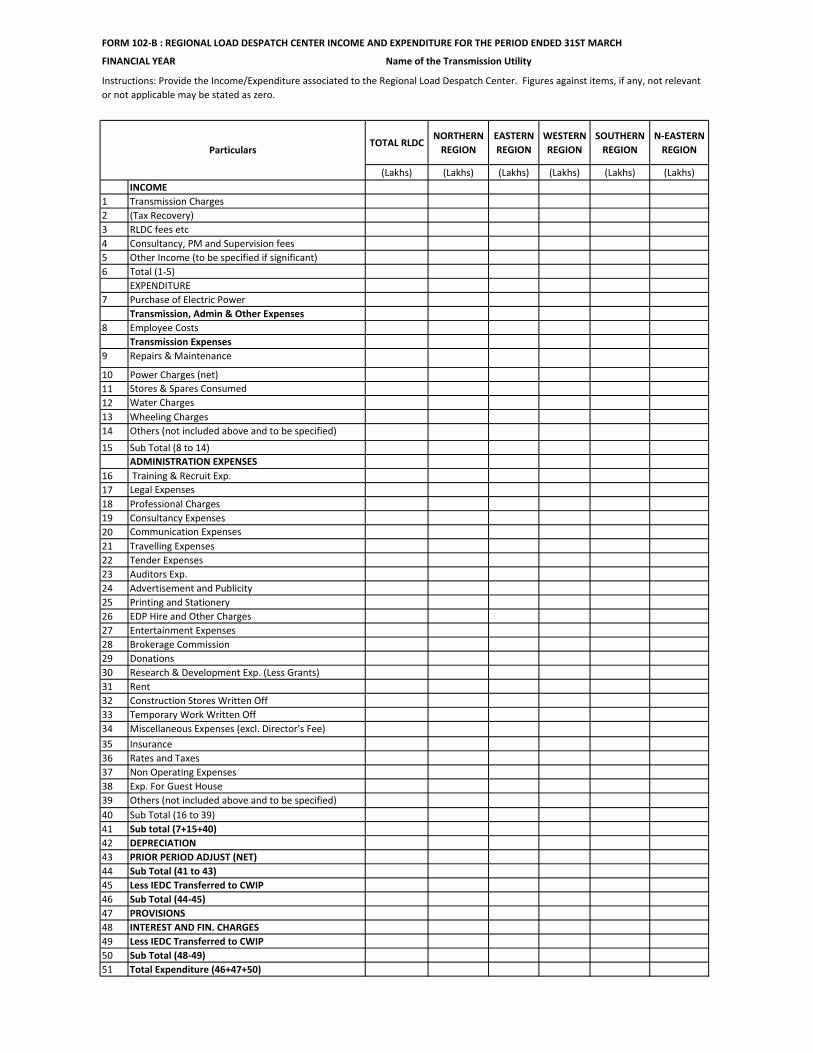
FORM 102‐B : REGIONAL LOAD DESPATCH CENTER INCOME AND EXPENDITURE FOR THE PERIOD ENDED 31ST MARCH
FINANCIAL YEAR Name of the Transmission Utility
Instructions: Provide the Income/Expenditure associated to the Regional Load Despatch Center. Figures against items, if any, not relevant or not applicable may be stated as zero.
Particulars
No. Loan/Bond ‐1 Loan/Bond ‐2 Loan/Bond ‐3 Loan/Bond ‐4 Loan/Bond ‐5 Loan/Bond ‐6 Grand Total
123456 (Rs. Lakhs)7 (Rs. Lakhs)8 (Rs. Lakhs)9 (Rs. Lakhs)10 (Rs. Lakhs)11 (Rs. Lakhs)
REGION PERTAINING TONORTHERN ‐ I RLDC (Rs. Lakhs)
COMMON (Rs. Lakhs)POWER SYSTEMS (Rs. Lakhs)CONSTRUCTION SCHEMES (Rs. Lakhs)
NORTHERN ‐ II RLDC (Rs. Lakhs)COMMON (Rs. Lakhs)POWER SYSTEMS (Rs. Lakhs)CONSTRUCTION SCHEMES (Rs. Lakhs)
EASTERN RLDC (Rs. Lakhs)COMMON (Rs. Lakhs)POWER SYSTEMS (Rs. Lakhs)CONSTRUCTION SCHEMES (Rs. Lakhs)
WESTERN RLDC (Rs. Lakhs)COMMON (Rs. Lakhs)POWER SYSTEMS (Rs. Lakhs)CONSTRUCTION SCHEMES (Rs. Lakhs)
SOUTHERN RLDC (Rs. Lakhs)COMMON (Rs. Lakhs)POWER SYSTEMS (Rs. Lakhs)CONSTRUCTION SCHEMES (Rs. Lakhs)
N‐EASTERN RLDC (Rs. Lakhs)COMMON (Rs. Lakhs)POWER SYSTEMS (Rs. Lakhs)CONSTRUCTION SCHEMES (Rs. Lakhs)
(Rs. Lakhs) TOTAL ‐ Loans Assigned
Principal Repay/Buy Back during the FY (Forex)Total at the end of the FY (Forex)Total at the BeginPrincipal Repay/Buy Back during the FY (Forex)
Balance Adj on Loan Pertaining to Working Assets TOTAL LOANS ASSIGNATION (Amount at Line 8 Above)
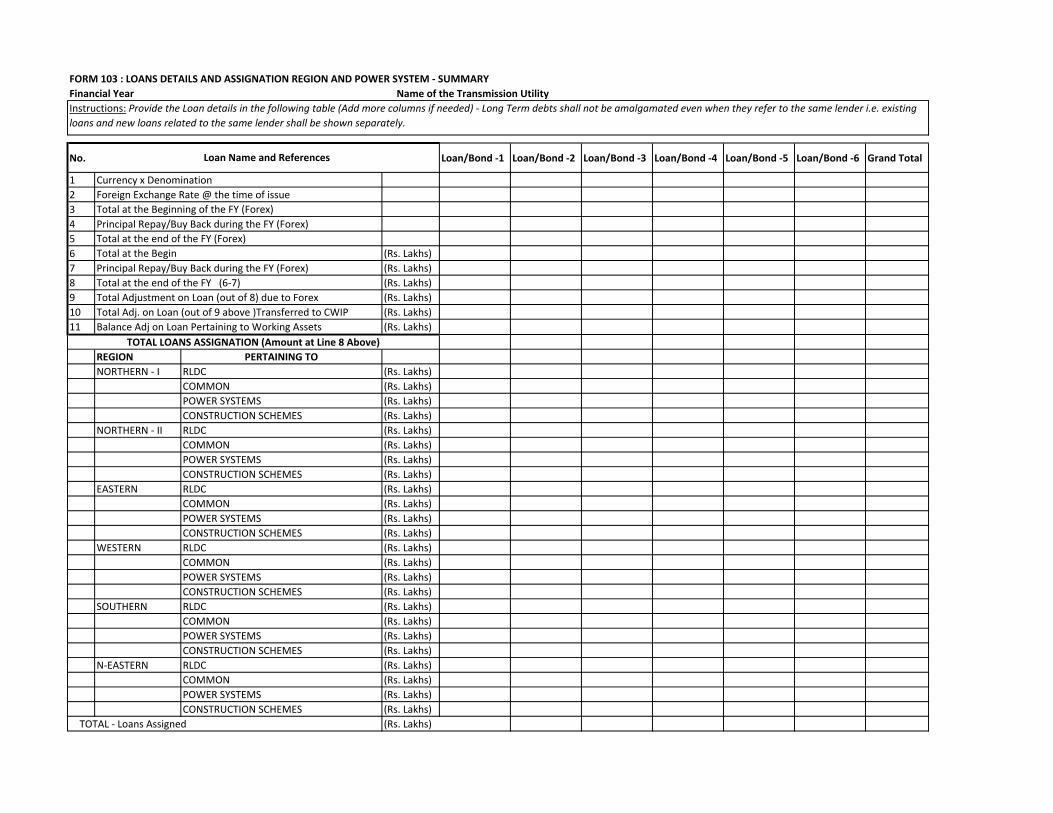
FORM 103 : LOANS DETAILS AND ASSIGNATION REGION AND POWER SYSTEM ‐ SUMMARY Financial Year Name of the Transmission Utility Instructions: Provide the Loan details in the following table (Add more columns if needed) ‐ Long Term debts shall not be amalgamated even when they refer to the same lender i.e. existing loans and new loans related to the same lender shall be shown separately.
Currency x Denomination
Loan Name and References
Foreign Exchange Rate @ the time of issueTotal at the Beginning of the FY (Forex)
Total at the end of the FY (6‐7)Total Adjustment on Loan (out of 8) due to ForexTotal Adj. on Loan (out of 9 above )Transferred to CWIP
No. Loan/Bond ‐1 Loan/Bond ‐2 Loan/Bond ‐3 Loan/Bond ‐4 Loan/Bond ‐5 Loan/Bond ‐6 Grand Total
1 (Rs. Lakhs)2 (Rs. Lakhs)3 (Rs. Lakhs)
4 (Rs. Lakhs)5 (Rs. Lakhs)6 (Rs. Lakhs)
REGION PERTAINING TONORTHERN ‐ I RLDC (Rs. Lakhs)
COMMON (Rs. Lakhs)POWER SYSTEMS (Rs. Lakhs)CONSTRUCTION SCHEMES (Rs. Lakhs)
NORTHERN ‐ II RLDC (Rs. Lakhs)COMMON (Rs. Lakhs)POWER SYSTEMS (Rs. Lakhs)CONSTRUCTION SCHEMES (Rs. Lakhs)
EASTERN RLDC (Rs. Lakhs)COMMON (Rs. Lakhs)POWER SYSTEMS (Rs. Lakhs)CONSTRUCTION SCHEMES (Rs. Lakhs)
WESTERN RLDC (Rs. Lakhs)COMMON (Rs. Lakhs)POWER SYSTEMS (Rs. Lakhs)CONSTRUCTION SCHEMES (Rs. Lakhs)
SOUTHERN RLDC (Rs. Lakhs)COMMON (Rs. Lakhs)POWER SYSTEMS (Rs. Lakhs)CONSTRUCTION SCHEMES (Rs. Lakhs)
N‐EASTERN RLDC (Rs. Lakhs)COMMON (Rs. Lakhs)POWER SYSTEMS (Rs. Lakhs)CONSTRUCTION SCHEMES (Rs. Lakhs)
(Rs. Lakhs)
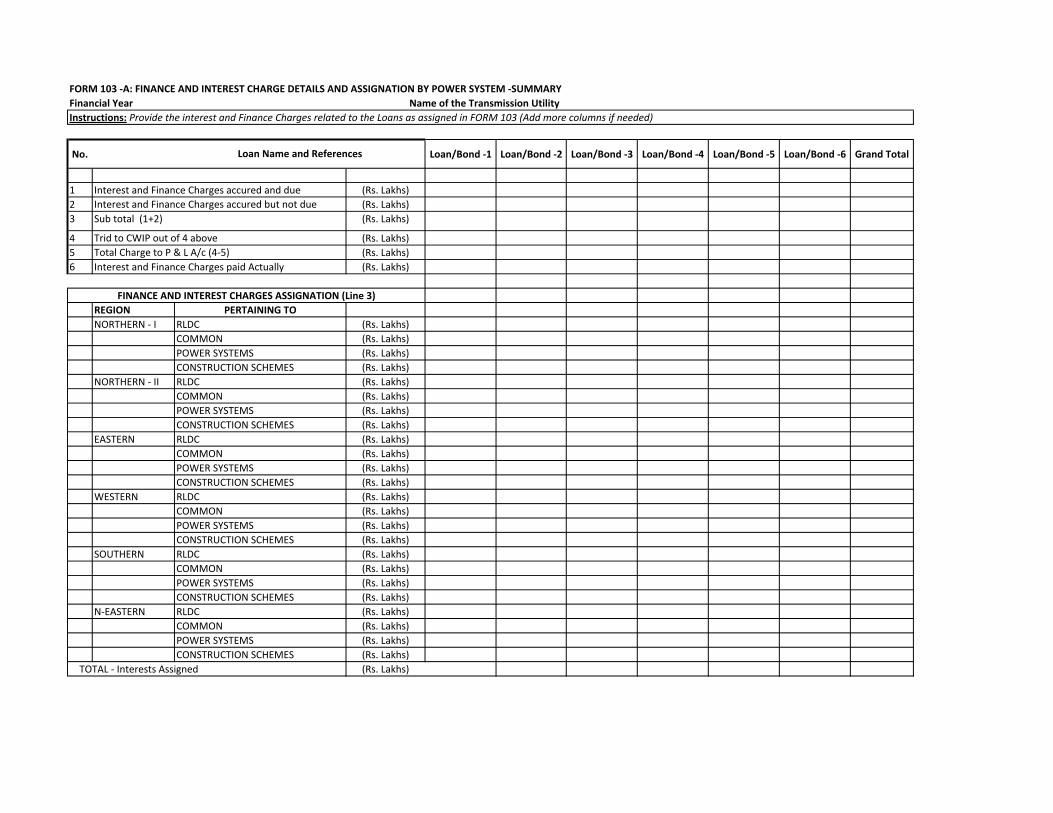
FINANCE AND INTEREST CHARGES ASSIGNATION (Line 3)
TOTAL ‐ Interests Assigned
FORM 103 ‐A: FINANCE AND INTEREST CHARGE DETAILS AND ASSIGNATION BY POWER SYSTEM ‐SUMMARYFinancial Year Name of the Transmission Utility Instructions: Provide the interest and Finance Charges related to the Loans as assigned in FORM 103 (Add more columns if needed)
Loan Name and References
Interest and Finance Charges accured and dueInterest and Finance Charges accured but not dueSub total (1+2)
Trid to CWIP out of 4 aboveTotal Charge to P & L A/c (4‐5)Interest and Finance Charges paid Actually
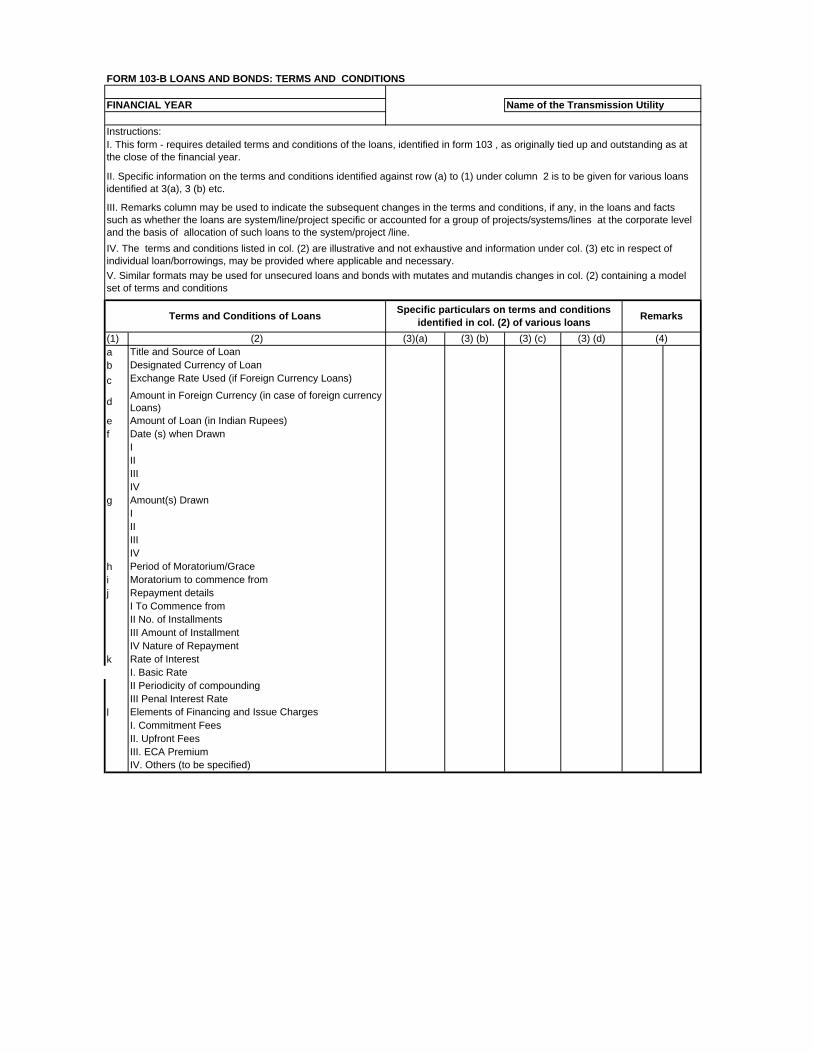
(1) (2) (3)(a) (3) (b) (3) (c) (3) (d)a Title and Source of Loanb Designated Currency of Loanc Exchange Rate Used (if Foreign Currency Loans)
d Amount in Foreign Currency (in case of foreign currency Loans)
e Amount of Loan (in Indian Rupees)f Date (s) when Drawn
IIIIIIIV
g Amount(s) DrawnIIIIIIIV
h Period of Moratorium/Gracei Moratorium to commence fromj Repayment details
I To Commence from II No. of InstallmentsIII Amount of InstallmentIV Nature of Repayment
k Rate of InterestI. Basic RateII Periodicity of compoundingIII Penal Interest Rate
l Elements of Financing and Issue ChargesI. Commitment FeesII. Upfront FeesIII. ECA PremiumIV. Others (to be specified)
Terms and Conditions of Loans Specific particulars on terms and conditions identified in col. (2) of various loans Remarks
(4)
Instructions:I. This form - requires detailed terms and conditions of the loans, identified in form 103 , as originally tied up and outstanding as at the close of the financial year.
II. Specific information on the terms and conditions identified against row (a) to (1) under column 2 is to be given for various loans identified at 3(a), 3 (b) etc.
III. Remarks column may be used to indicate the subsequent changes in the terms and conditions, if any, in the loans and facts such as whether the loans are system/line/project specific or accounted for a group of projects/systems/lines at the corporate level and the basis of allocation of such loans to the system/project /line.IV. The terms and conditions listed in col. (2) are illustrative and not exhaustive and information under col. (3) etc in respect of individual loan/borrowings, may be provided where applicable and necessary.V. Similar formats may be used for unsecured loans and bonds with mutates and mutandis changes in col. (2) containing a model set of terms and conditions
FORM 103-B LOANS AND BONDS: TERMS AND CONDITIONS
FINANCIAL YEAR Name of the Transmission Utility
Transmission Charges
Energy Sales, Fees and Other Income
Employee, Trans; & Adm.
Exp, Less Transferred to
CWIP
DepreciationProfit Before Interests and
Taxes
Interest and Fin. Chages
less: Transferred to CWIP
Provision for Tax
Shareholders' Funds (Equity)
Loan Funds Net BlockCurrent
Assets, Loans and Advances
Current Liabilities
and Provisions
(Lakhs) (1) (Lakhs) (2) (Lakhs) (3) (Lakhs) (4) (Lakhs) (5) (Lakhs) (6) (Lakhs) (7) (Lakhs) (8) (Lakhs) (9) (Lakhs) (10) (Lakhs) (11) (Lakhs) (12)
123 P.S. 14 P.S. 25 P.S. 36 P.S. 47 P.S. 58 P.S. 69 P.S. 7
10 P.S. 811 P.S. 9121314
Profit & Loss Account ‐ Summary Balance Sheet ‐ Summary
NORTHERN REGION ‐ I
Common Regional Power Systems
Sub ‐ Total Power Corporate ‐ AssignedTOTAL REGIONAL
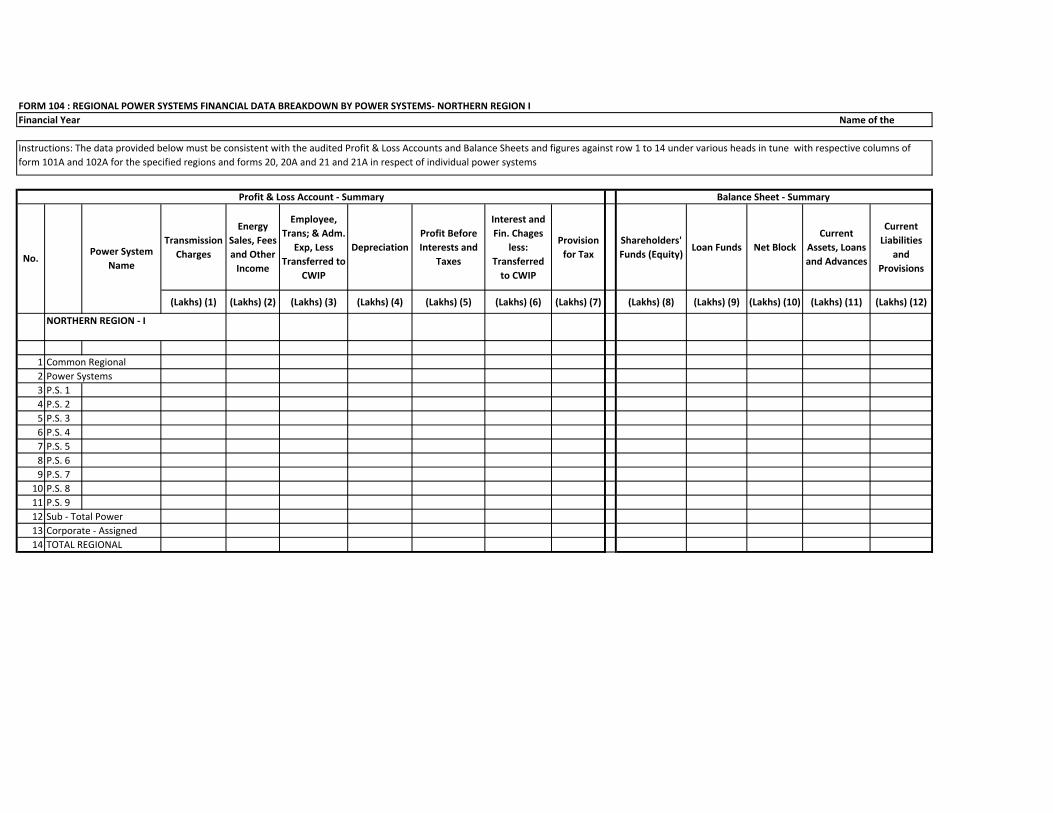
Instructions: The data provided below must be consistent with the audited Profit & Loss Accounts and Balance Sheets and figures against row 1 to 14 under various heads in tune with respective columns of form 101A and 102A for the specified regions and forms 20, 20A and 21 and 21A in respect of individual power systems
FORM 104 : REGIONAL POWER SYSTEMS FINANCIAL DATA BREAKDOWN BY POWER SYSTEMS‐ NORTHERN REGION IFinancial Year Name of the
No. Power System
Name
Transmission Charges
Energy Sales, Fees and
Other Income
Employee, Trans; & Adm.
Exp, Less Transferred to
CWIP
DepreciationProfit Before Interests and
Taxes
Interest and Fin. Chages
less: Transferred to
CWIP
Provision for Tax
Shareholders' Funds (Equity)
Loan Funds Net Block
Current Assets,
Loans and Advances
Current Liabilities
and Provisions
(Lakhs) (1) (Lakhs) (2) (Lakhs) (3) (Lakhs) (4) (Lakhs) (5) (Lakhs) (6) (Lakhs) (7) (Lakhs) (8) (Lakhs) (9) (Lakhs) (10) (Lakhs) (11) (Lakhs) (12)
123 P.S. 14 P.S. 25 P.S. 36 P.S. 47 P.S. 58 P.S. 69 P.S. 710 P.S. 811 P.S. 9121314
NORTHERN REGION ‐ II
Common Regional Power Systems
Sub ‐ Total Power Corporate ‐ AssignedTOTAL REGIONAL
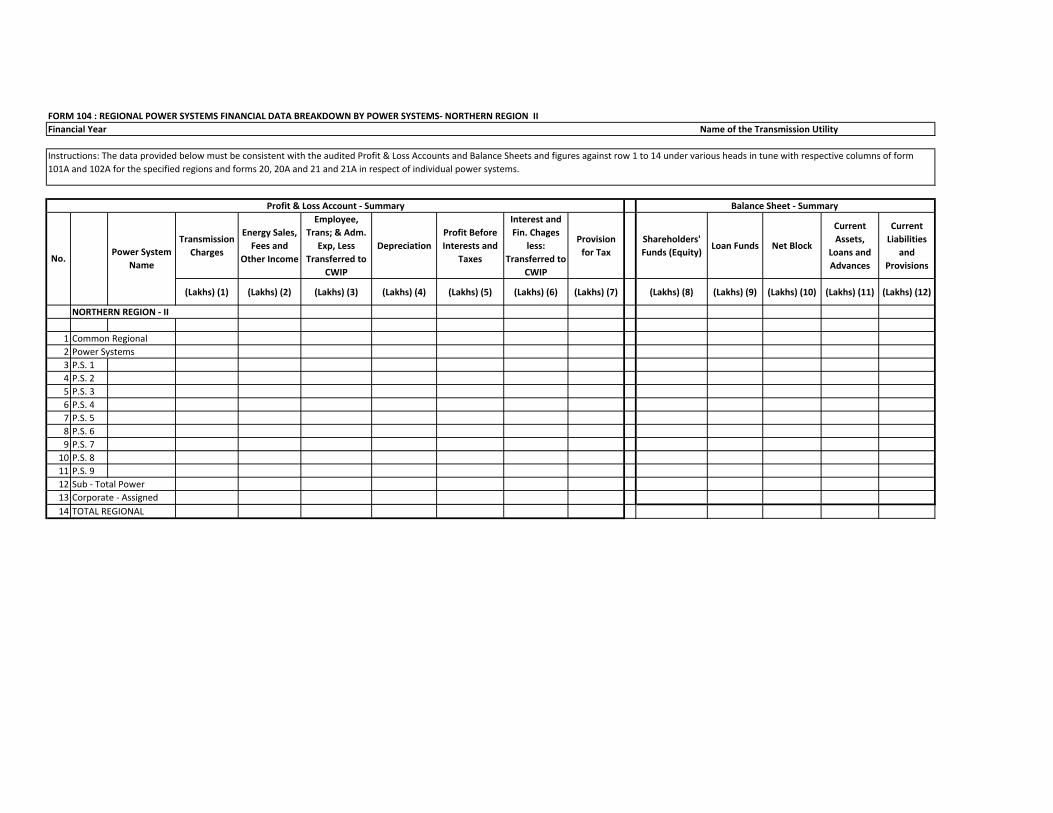
No. Power System
Name
FORM 104 : REGIONAL POWER SYSTEMS FINANCIAL DATA BREAKDOWN BY POWER SYSTEMS‐ NORTHERN REGION IIFinancial Year Name of the Transmission Utility
Instructions: The data provided below must be consistent with the audited Profit & Loss Accounts and Balance Sheets and figures against row 1 to 14 under various heads in tune with respective columns of form 101A and 102A for the specified regions and forms 20, 20A and 21 and 21A in respect of individual power systems.
Profit & Loss Account ‐ Summary Balance Sheet ‐ Summary
Transmission Charges
Energy Sales, Fees and
Other Income
Employee, Trans; & Adm.
Exp, Less Transferred to
CWIP
DepreciationProfit Before Interests and
Taxes
Interest and Fin. Chages
less: Transferred to CWIP
Provision for Tax
Shareholders' Funds (Equity)
Loan Funds Net Block
Current Assets,
Loans and Advances
Current Liabilities
and Provisions
(Lakhs) (1) (Lakhs) (2) (Lakhs) (3) (Lakhs) (4) (Lakhs) (5) (Lakhs) (6) (Lakhs) (7) (Lakhs) (8) (Lakhs) (9) (Lakhs) (10) (Lakhs) (11) (Lakhs) (12)
123 P.S. 14 P.S. 25 P.S. 36 P.S. 47 P.S. 58 P.S. 69 P.S. 710 P.S. 811 P.S. 9121314
EASTERN REGION
Common Regional Power Systems
Sub ‐ Total Power Corporate ‐ AssignedTOTAL REGIONAL
No. Power System
Name
FORM 104 : REGIONAL POWER SYSTEMS FINANCIAL DATA BREAKDOWN BY POWER SYSTEMS‐ EASTERN REGION Financial Year Name of the Transmission Utility
Instructions: The data provided below must be consistent with the audited Profit & Loss Accounts and Balance Sheets and figures against row 1 to 14 under various heads in tune with respective columns of form 101A and 102A for the specified regions and forms 20, 20A and 21 and 21A in respect of individual power systems.
Profit & Loss Account ‐ Summary Balance Sheet ‐ Summary
Transmission Charges
Energy Sales, Fees and
Other Income
Employee, Trans; & Adm.
Exp, Less Transferred to
CWIP
DepreciationProfit Before Interests and
Taxes
Interest and Fin. Chages
less: Transferred to CWIP
Provision for Tax
Shareholders' Funds (Equity)
Loan Funds Net Block
Current Assets,
Loans and Advances
Current Liabilities and Provisions
(Lakhs) (1) (Lakhs) (2) (Lakhs) (3) (Lakhs) (4) (Lakhs) (5) (Lakhs) (6) (Lakhs) (7) (Lakhs) (8) (Lakhs) (9) (Lakhs) (10) (Lakhs) (11) (Lakhs) (12)
123 P.S. 14 P.S. 25 P.S. 36 P.S. 47 P.S. 58 P.S. 69 P.S. 710 P.S. 811 P.S. 9121314 TOTAL REGIONAL
FORM 104 : REGIONAL POWER SYSTEMS FINANCIAL DATA BREAKDOWN BY POWER SYSTEMS‐ WESTERN REGION Financial Year Name of the Transmission Utility
Instructions: The data provided below must be consistent with the audited Profit & Loss Accounts and Balance Sheets and figures against row 1 to 14 under various heads in tune with respective columns of form 101A and 102A for the specified regions and forms 20, 20A and 21 and 21A in respect of individual power systems
Profit & Loss Account ‐ Summary Balance Sheet ‐ Summary
No. Power System
Name
WESTERN REGION
Common Regional Power Systems
Sub ‐ Total Power Corporate ‐ Assigned
Transmission Charges
Energy Sales, Fees and Other Income
Employee, Trans; & Adm.
Exp, Less Transferred to CWIP
DepreciationProfit Before Interests and
Taxes
Interest and Fin. Chages
less: Transferred to
CWIP
Provision for Tax
Shareholders' Funds (Equity)
Loan Funds Net Block
Current Assets, Loans
and Advances
Current Liabilities
and Provisions
(Lakhs) (1) (Lakhs) (2) (Lakhs) (3) (Lakhs) (4) (Lakhs) (5) (Lakhs) (6) (Lakhs) (7) (Lakhs) (8) (Lakhs) (9) (Lakhs) (10) (Lakhs) (11) (Lakhs) (12)
123 P.S. 14 P.S. 25 P.S. 36 P.S. 47 P.S. 58 P.S. 69 P.S. 710 P.S. 811 P.S. 9121314 TOTAL REGIONAL
Financial Year Name of the Transmission Utility
Instructions: The data provided below must be consistent with the audited Profit & Loss Accounts and Balance Sheets and figures against row 1 to 14 under various heads in tune with respective columns of form 101A and 102A for the specified regions and forms 20, 20A and 21 and 21A in respect of individual power systems
Profit & Loss Account ‐ Summary Balance Sheet ‐ Summary
No. Power System
Name
SOUTHERN REGION
Common Regional Power Systems
Sub ‐ Total Power SystemsCorporate ‐ Assigned
Transmission Charges
Energy Sales and Other Income
Employee, Trans; & Adm.
Exp, Less Transferred to
CWIP
DepreciationProfit Before Interests and
Taxes
Interest and Fin. Charges
less: Transferred to
CWIP
Provision for Tax
Shareholders' Funds (Equity)
Loan Funds Net Block
Current Assets, Loans
and Advances
Current Liabilities and Provisions
(Lakhs) (1) (Lakhs) (2) (Lakhs) (3) (Lakhs) (4) (Lakhs) (5) (Lakhs) (6) (Lakhs) (7) (Lakhs) (8) (Lakhs) (9) (Lakhs) (10) (Lakhs) (11) (Lakhs) (12)
123 P.S. 14 P.S. 25 P.S. 36 P.S. 47 P.S. 58 P.S. 69 P.S. 710 P.S. 811 P.S. 9121314 TOTAL REGIONAL
FORM 104 : REGIONAL POWER SYSTEMS FINANCIAL DATA BREAKDOWN BY POWER SYSTEMS‐ NORTH EASTERN REGION Financial Year Name of the Transmission Utility
Instructions: The data provided below must be consistent with the audited Profit & Loss Accounts and Balance Sheets and figures against row 1 to 14 under various heads in tune with respective columns of form 101A and 102A for the specified regions and forms 20, 20A and 21 and 21A in respect of individual power systems.
Profit & Loss Account ‐ Summary Balance Sheet ‐ Summary
No.
N‐ EASTERN REGION
Common Regional Power Systems
Sub ‐ Total Power SystemsCorporate ‐ Assigned
Power System Name
Financial Year: Name of the Transmission Utility
Description of the Allocation Method and Allocation Factors:
System System System System Schemes Schemes Schemes
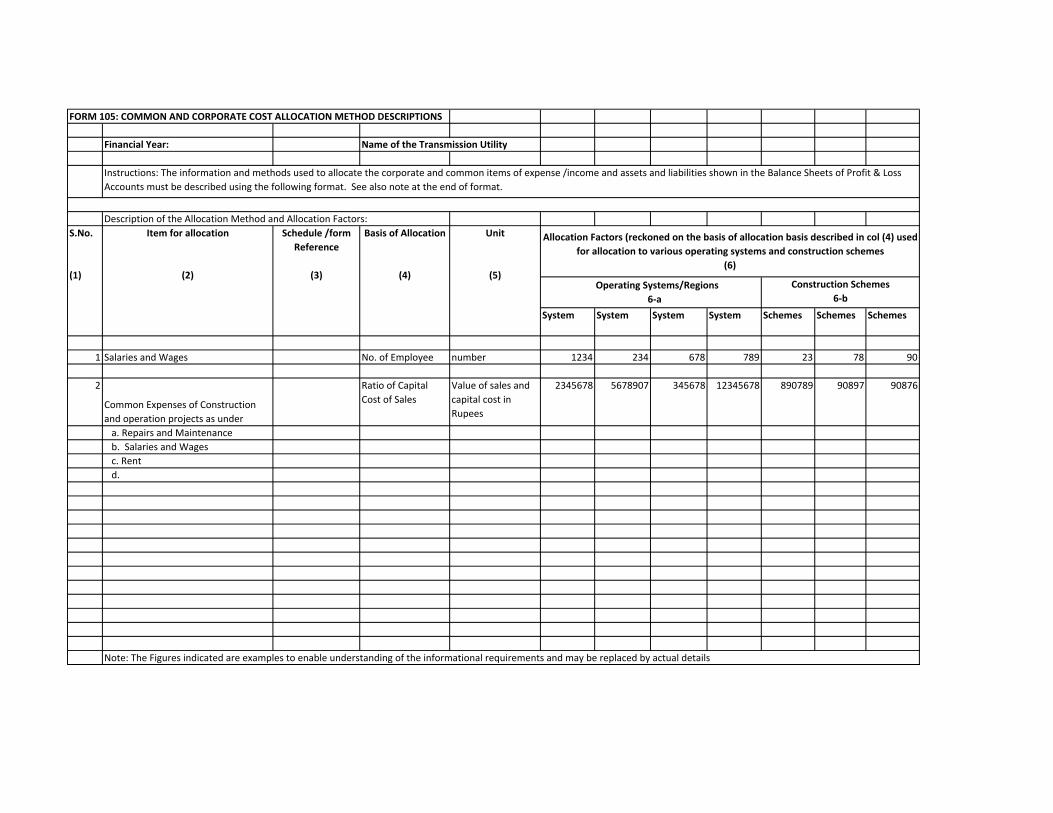
1 Salaries and Wages No. of Employee number 1234 234 678 789 23 78 90
2
Common Expenses of Construction and operation projects as under
Ratio of Capital Cost of Sales
Value of sales and capital cost in Rupees
2345678 5678907 345678 12345678 890789 90897 90876
a. Repairs and Maintenance b. Salaries and Wages c. Rent d.
Note: The Figures indicated are examples to enable understanding of the informational requirements and may be replaced by actual details
FORM 105: COMMON AND CORPORATE COST ALLOCATION METHOD DESCRIPTIONS
Instructions: The information and methods used to allocate the corporate and common items of expense /income and assets and liabilities shown in the Balance Sheets of Profit & Loss Accounts must be described using the following format. See also note at the end of format.
S.No.
(1)
Item for allocation
(2)
Schedule /form Reference
(3)
Basis of Allocation
(4)
Unit
(5)
Allocation Factors (reckoned on the basis of allocation basis described in col (4) used for allocation to various operating systems and construction schemes
(6)
Operating Systems/Regions 6‐a
Construction Schemes6‐b
S. no.(1)
Schedules of P&L A/c and Balance Sheet relating to
(2)
Corporate Level(3)
Regional Level (4)
Power System Level (5)
Remarks
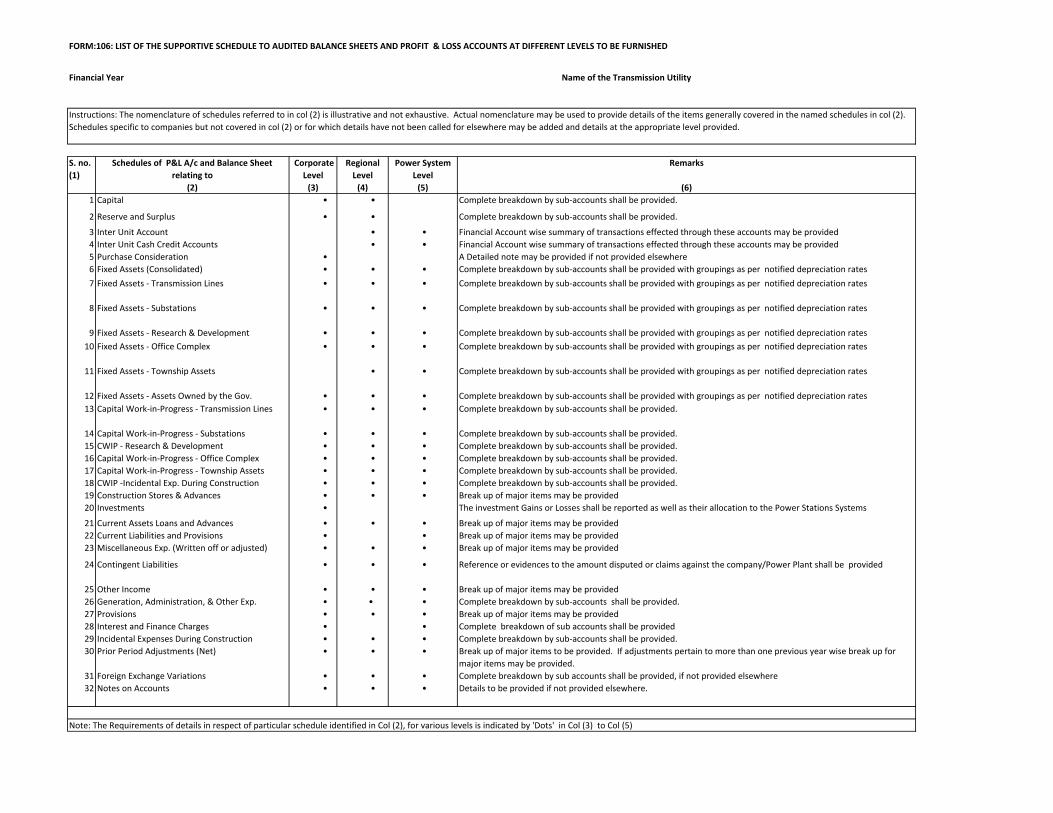
(6)1 Capital • • Complete breakdown by sub‐accounts shall be provided.
2 Reserve and Surplus • • Complete breakdown by sub‐accounts shall be provided.
3 Inter Unit Account • • Financial Account wise summary of transactions effected through these accounts may be provided 4 Inter Unit Cash Credit Accounts • • Financial Account wise summary of transactions effected through these accounts may be provided5 Purchase Consideration • A Detailed note may be provided if not provided elsewhere6 Fixed Assets (Consolidated) • • • Complete breakdown by sub‐accounts shall be provided with groupings as per notified depreciation rates
7 Fixed Assets ‐ Transmission Lines • • • Complete breakdown by sub‐accounts shall be provided with groupings as per notified depreciation rates
8 Fixed Assets ‐ Substations • • • Complete breakdown by sub‐accounts shall be provided with groupings as per notified depreciation rates
9 Fixed Assets ‐ Research & Development • • • Complete breakdown by sub‐accounts shall be provided with groupings as per notified depreciation rates10 Fixed Assets ‐ Office Complex • • • Complete breakdown by sub‐accounts shall be provided with groupings as per notified depreciation rates
11 Fixed Assets ‐ Township Assets • • Complete breakdown by sub‐accounts shall be provided with groupings as per notified depreciation rates
12 Fixed Assets ‐ Assets Owned by the Gov. • • • Complete breakdown by sub‐accounts shall be provided with groupings as per notified depreciation rates13 Capital Work‐in‐Progress ‐ Transmission Lines • • • Complete breakdown by sub‐accounts shall be provided.
14 Capital Work‐in‐Progress ‐ Substations • • • Complete breakdown by sub‐accounts shall be provided.15 CWIP ‐ Research & Development • • • Complete breakdown by sub‐accounts shall be provided.16 Capital Work‐in‐Progress ‐ Office Complex • • • Complete breakdown by sub‐accounts shall be provided.17 Capital Work‐in‐Progress ‐ Township Assets • • • Complete breakdown by sub‐accounts shall be provided.18 CWIP ‐Incidental Exp. During Construction • • • Complete breakdown by sub‐accounts shall be provided.19 Construction Stores & Advances • • • Break up of major items may be provided20 Investments • The investment Gains or Losses shall be reported as well as their allocation to the Power Stations Systems
21 Current Assets Loans and Advances • • • Break up of major items may be provided22 Current Liabilities and Provisions • • Break up of major items may be provided23 Miscellaneous Exp. (Written off or adjusted) • • • Break up of major items may be provided
24 Contingent Liabilities • • • Reference or evidences to the amount disputed or claims against the company/Power Plant shall be provided
25 Other Income • • • Break up of major items may be provided26 Generation, Administration, & Other Exp. • • • Complete breakdown by sub‐accounts shall be provided.27 Provisions • • • Break up of major items may be provided28 Interest and Finance Charges • • Complete breakdown of sub accounts shall be provided29 Incidental Expenses During Construction • • • Complete breakdown by sub‐accounts shall be provided.30 Prior Period Adjustments (Net) • • • Break up of major items to be provided. If adjustments pertain to more than one previous year wise break up for
major items may be provided.31 Foreign Exchange Variations • • • Complete breakdown by sub accounts shall be provided, if not provided elsewhere32 Notes on Accounts • • • Details to be provided if not provided elsewhere.
Instructions: The nomenclature of schedules referred to in col (2) is illustrative and not exhaustive. Actual nomenclature may be used to provide details of the items generally covered in the named schedules in col (2). Schedules specific to companies but not covered in col (2) or for which details have not been called for elsewhere may be added and details at the appropriate level provided.
Note: The Requirements of details in respect of particular schedule identified in Col (2), for various levels is indicated by 'Dots' in Col (3) to Col (5)
FORM:106: LIST OF THE SUPPORTIVE SCHEDULE TO AUDITED BALANCE SHEETS AND PROFIT & LOSS ACCOUNTS AT DIFFERENT LEVELS TO BE FURNISHED
Financial Year Name of the Transmission Utility
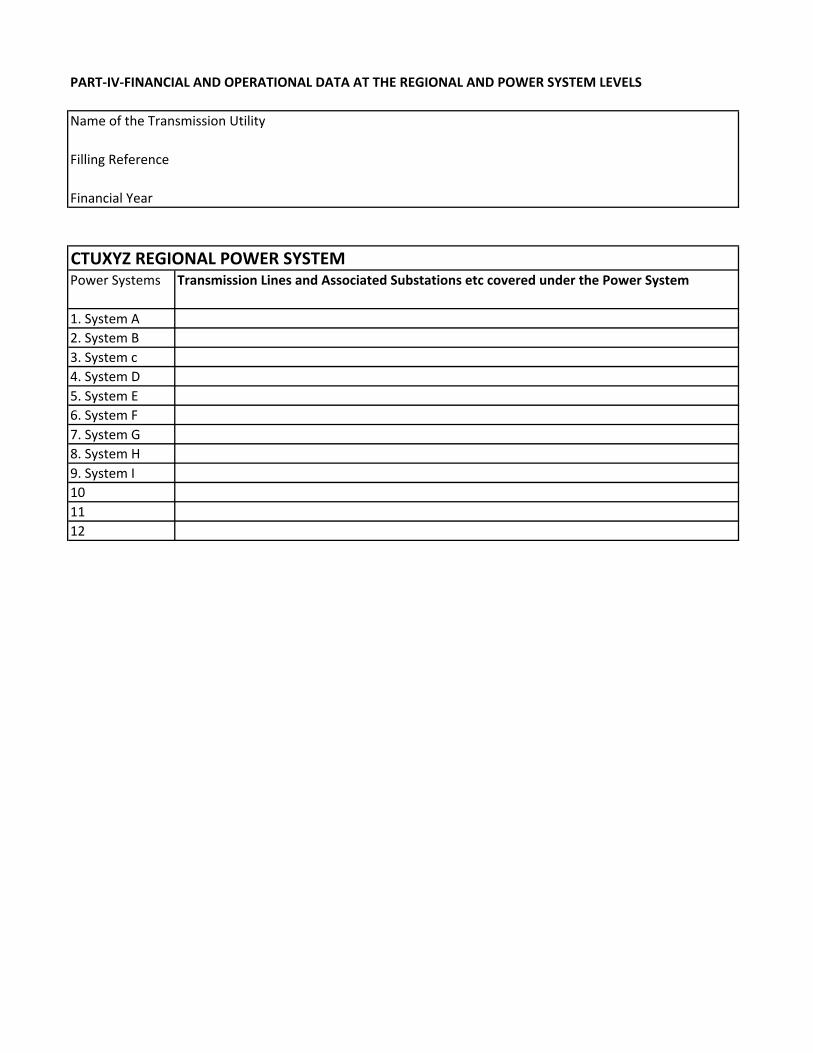
Power Systems Transmission Lines and Associated Substations etc covered under the Power System
1. System A2. System B3. System c4. System D5. System E6. System F7. System G8. System H9. System I101112
CTUXYZ REGIONAL POWER SYSTEM
PART‐IV‐FINANCIAL AND OPERATIONAL DATA AT THE REGIONAL AND POWER SYSTEM LEVELS
Name of the Transmission Utility
Filling Reference
Financial Year
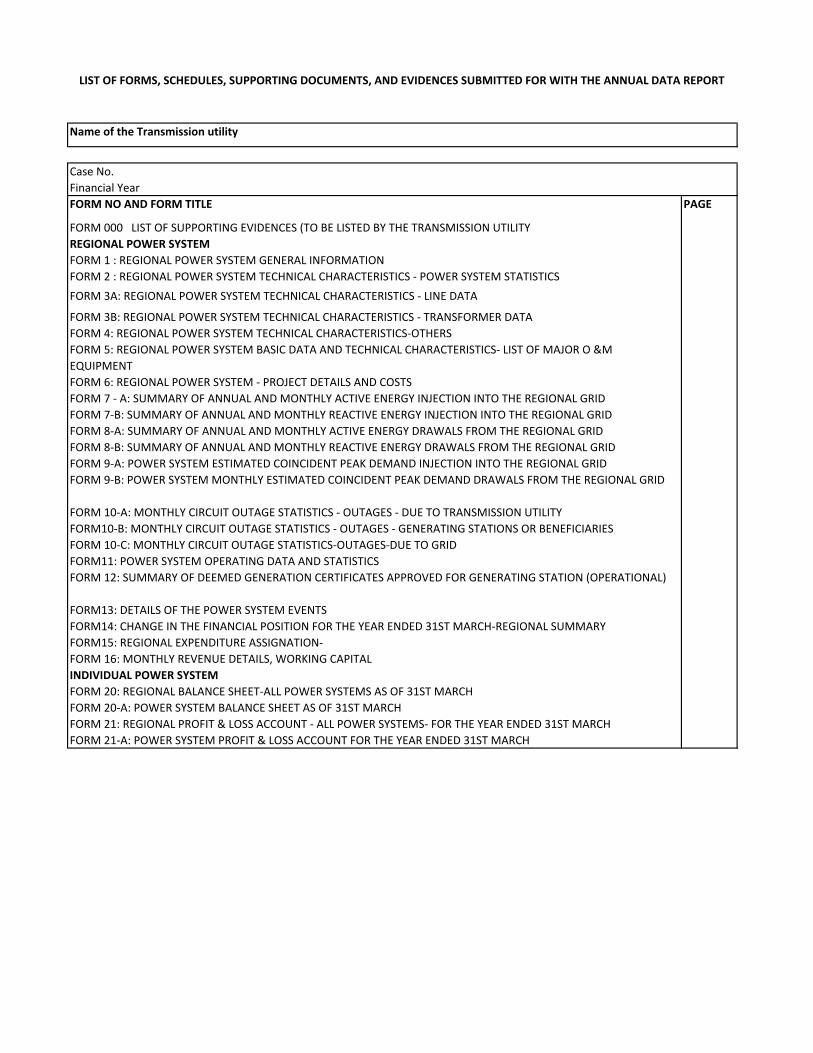
FORM NO AND FORM TITLE PAGE
FORM 000 LIST OF SUPPORTING EVIDENCES (TO BE LISTED BY THE TRANSMISSION UTILITYREGIONAL POWER SYSTEMFORM 1 : REGIONAL POWER SYSTEM GENERAL INFORMATIONFORM 2 : REGIONAL POWER SYSTEM TECHNICAL CHARACTERISTICS ‐ POWER SYSTEM STATISTICS
FORM 3A: REGIONAL POWER SYSTEM TECHNICAL CHARACTERISTICS ‐ LINE DATA
FORM 3B: REGIONAL POWER SYSTEM TECHNICAL CHARACTERISTICS ‐ TRANSFORMER DATAFORM 4: REGIONAL POWER SYSTEM TECHNICAL CHARACTERISTICS‐OTHERSFORM 5: REGIONAL POWER SYSTEM BASIC DATA AND TECHNICAL CHARACTERISTICS‐ LIST OF MAJOR O &M EQUIPMENTFORM 6: REGIONAL POWER SYSTEM ‐ PROJECT DETAILS AND COSTSFORM 7 ‐ A: SUMMARY OF ANNUAL AND MONTHLY ACTIVE ENERGY INJECTION INTO THE REGIONAL GRIDFORM 7‐B: SUMMARY OF ANNUAL AND MONTHLY REACTIVE ENERGY INJECTION INTO THE REGIONAL GRIDFORM 8‐A: SUMMARY OF ANNUAL AND MONTHLY ACTIVE ENERGY DRAWALS FROM THE REGIONAL GRIDFORM 8‐B: SUMMARY OF ANNUAL AND MONTHLY REACTIVE ENERGY DRAWALS FROM THE REGIONAL GRIDFORM 9‐A: POWER SYSTEM ESTIMATED COINCIDENT PEAK DEMAND INJECTION INTO THE REGIONAL GRIDFORM 9‐B: POWER SYSTEM MONTHLY ESTIMATED COINCIDENT PEAK DEMAND DRAWALS FROM THE REGIONAL GRID
FORM 10‐A: MONTHLY CIRCUIT OUTAGE STATISTICS ‐ OUTAGES ‐ DUE TO TRANSMISSION UTILITYFORM10‐B: MONTHLY CIRCUIT OUTAGE STATISTICS ‐ OUTAGES ‐ GENERATING STATIONS OR BENEFICIARIESFORM 10‐C: MONTHLY CIRCUIT OUTAGE STATISTICS‐OUTAGES‐DUE TO GRIDFORM11: POWER SYSTEM OPERATING DATA AND STATISTICSFORM 12: SUMMARY OF DEEMED GENERATION CERTIFICATES APPROVED FOR GENERATING STATION (OPERATIONAL)
FORM13: DETAILS OF THE POWER SYSTEM EVENTSFORM14: CHANGE IN THE FINANCIAL POSITION FOR THE YEAR ENDED 31ST MARCH‐REGIONAL SUMMARYFORM15: REGIONAL EXPENDITURE ASSIGNATION‐FORM 16: MONTHLY REVENUE DETAILS, WORKING CAPITALINDIVIDUAL POWER SYSTEMFORM 20: REGIONAL BALANCE SHEET‐ALL POWER SYSTEMS AS OF 31ST MARCHFORM 20‐A: POWER SYSTEM BALANCE SHEET AS OF 31ST MARCHFORM 21: REGIONAL PROFIT & LOSS ACCOUNT ‐ ALL POWER SYSTEMS‐ FOR THE YEAR ENDED 31ST MARCHFORM 21‐A: POWER SYSTEM PROFIT & LOSS ACCOUNT FOR THE YEAR ENDED 31ST MARCH
LIST OF FORMS, SCHEDULES, SUPPORTING DOCUMENTS, AND EVIDENCES SUBMITTED FOR WITH THE ANNUAL DATA REPORT
Name of the Transmission utility
Case No.Financial Year
No. References or description of the Evidence submitted Evidence No.
Title or Reference to the Evidence Evidence No.123456789
101112131415161718192021222324252627282930
Financial Year
LIST OF SUPPORTING EVIDENCES Name of the Transmission Utility:
Each Evidence submitted shall be identified by the FORM to which it relates follwed by a number (of three digits) referring of the evidence number
Evidence No.: X‐X.x ‐ 009 ‐ Evidence referring to the FORM X, sub‐section X.x. Evidence Number 009
CTUXYZ REGIONAL POWER SYSTEM
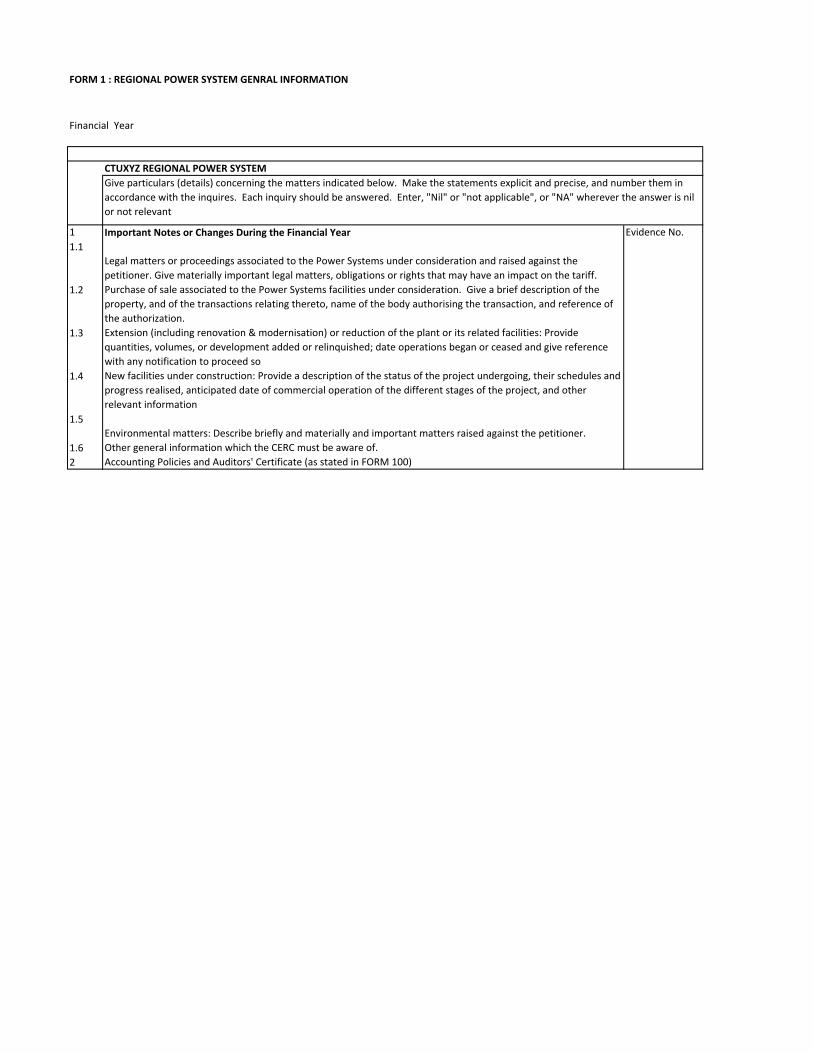
1 Important Notes or Changes During the Financial Year Evidence No. 1.1
Legal matters or proceedings associated to the Power Systems under consideration and raised against the petitioner. Give materially important legal matters, obligations or rights that may have an impact on the tariff.
1.2 Purchase of sale associated to the Power Systems facilities under consideration. Give a brief description of the property, and of the transactions relating thereto, name of the body authorising the transaction, and reference of the authorization.
1.3 Extension (including renovation & modernisation) or reduction of the plant or its related facilities: Provide quantities, volumes, or development added or relinquished; date operations began or ceased and give reference with any notification to proceed so
1.4 New facilities under construction: Provide a description of the status of the project undergoing, their schedules and progress realised, anticipated date of commercial operation of the different stages of the project, and other relevant information
1.5Environmental matters: Describe briefly and materially and important matters raised against the petitioner.
1.6 Other general information which the CERC must be aware of.2 Accounting Policies and Auditors' Certificate (as stated in FORM 100)
Give particulars (details) concerning the matters indicated below. Make the statements explicit and precise, and number them in accordance with the inquires. Each inquiry should be answered. Enter, "Nil" or "not applicable", or "NA" wherever the answer is nil or not relevant
FORM 1 : REGIONAL POWER SYSTEM GENRAL INFORMATION
Financial Year
NORTHERN REGION ‐I
NORTHERN REGION ‐ II
EASTERN REGION
WESTERN REGION
SOUTHERN REGION
N‐EASTERN REGION
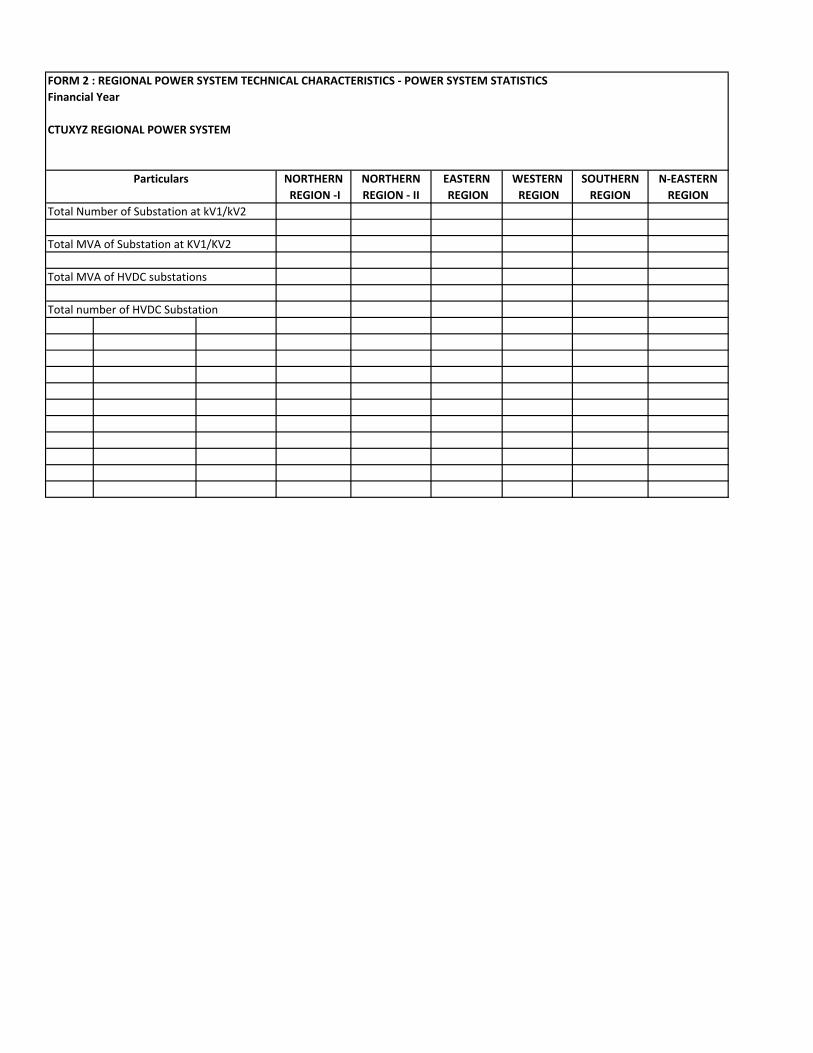
CTUXYZ REGIONAL POWER SYSTEM
FORM 2 : REGIONAL POWER SYSTEM TECHNICAL CHARACTERISTICS ‐ POWER SYSTEM STATISTICSFinancial Year
Particulars
Total Number of Substation at kV1/kV2
Total MVA of Substation at KV1/KV2
Total MVA of HVDC substations
Total number of HVDC Substation
Name or No. Type of Delivery Point Name or No.Type of Delivery
Point
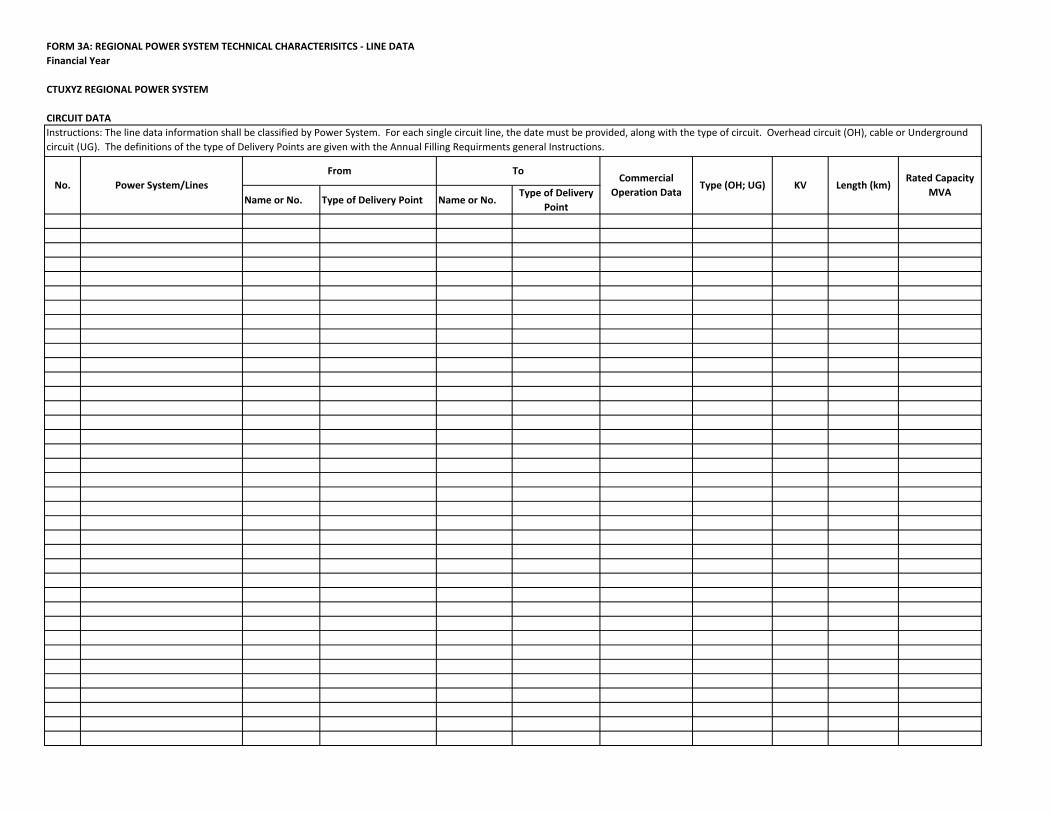
FORM 3A: REGIONAL POWER SYSTEM TECHNICAL CHARACTERISITCS ‐ LINE DATAFinancial Year
CTUXYZ REGIONAL POWER SYSTEM
CIRCUIT DATA
From ToPower System/LinesNo.
Instructions: The line data information shall be classified by Power System. For each single circuit line, the date must be provided, along with the type of circuit. Overhead circuit (OH), cable or Underground circuit (UG). The definitions of the type of Delivery Points are given with the Annual Filling Requirments general Instructions.
KV Length (km)Rated Capacity
MVACommercial
Operation DataType (OH; UG)
No. Power System Location
Name or No.
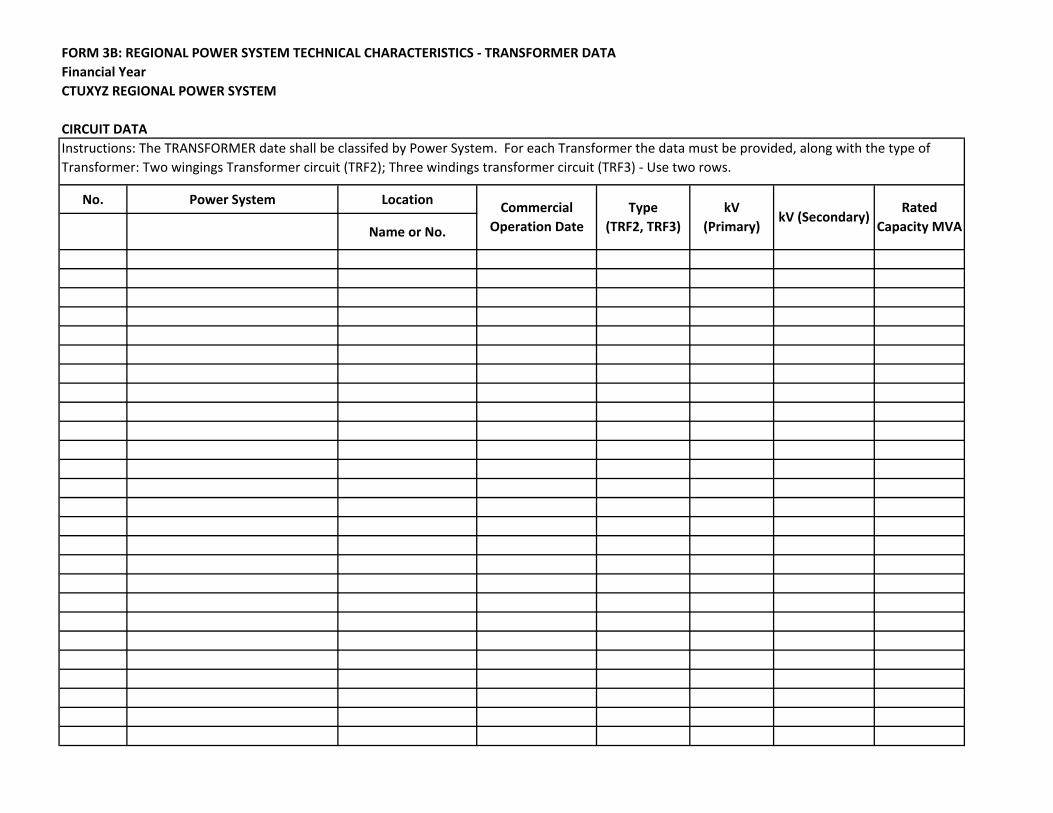
FORM 3B: REGIONAL POWER SYSTEM TECHNICAL CHARACTERISTICS ‐ TRANSFORMER DATAFinancial YearCTUXYZ REGIONAL POWER SYSTEM
CIRCUIT DATA
Commercial Operation Date
Type (TRF2, TRF3)
kV (Primary)
kV (Secondary)Rated
Capacity MVA
Instructions: The TRANSFORMER date shall be classifed by Power System. For each Transformer the data must be provided, along with the type of Transformer: Two wingings Transformer circuit (TRF2); Three windings transformer circuit (TRF3) ‐ Use two rows.
No.Power System
Name
Number MVAR Number MVARType
(Fixed/Switchable)Number MVAR
Type (Fixed/Switchable)
Number MVARType
(Fixed/Switchable)
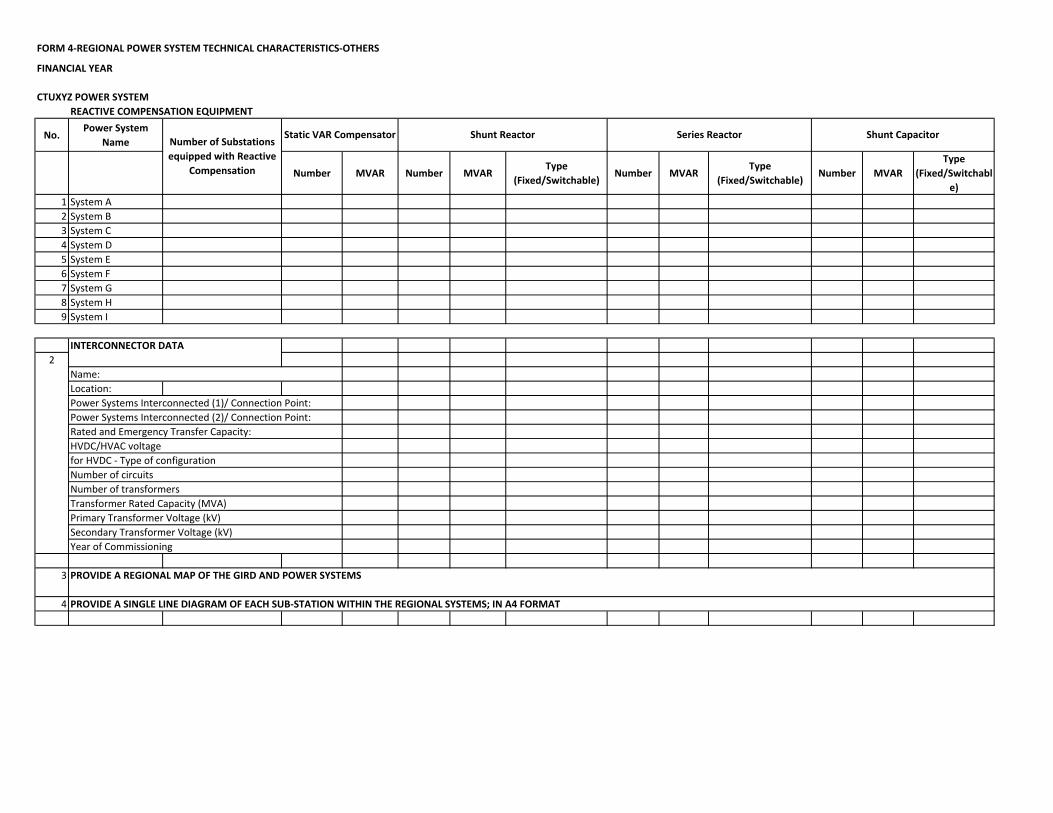
1 System A2 System B3 System C4 System D5 System E6 System F7 System G8 System H9 System I
Location:
3
4
2
PROVIDE A REGIONAL MAP OF THE GIRD AND POWER SYSTEMS
PROVIDE A SINGLE LINE DIAGRAM OF EACH SUB‐STATION WITHIN THE REGIONAL SYSTEMS; IN A4 FORMAT
FORM 4‐REGIONAL POWER SYSTEM TECHNICAL CHARACTERISTICS‐OTHERS
FINANCIAL YEAR
CTUXYZ POWER SYSTEMREACTIVE COMPENSATION EQUIPMENT
Static VAR Compensator Shunt Reactor Series Reactor Shunt CapacitorNumber of Substations equipped with Reactive
Compensation
INTERCONNECTOR DATA
Name:
Power Systems Interconnected (1)/ Connection Point:Power Systems Interconnected (2)/ Connection Point:Rated and Emergency Transfer Capacity:HVDC/HVAC voltagefor HVDC ‐ Type of configuration
Year of Commissioning
Number of circuitsNumber of transformersTransformer Rated Capacity (MVA)Primary Transformer Voltage (kV)Secondary Transformer Voltage (kV)
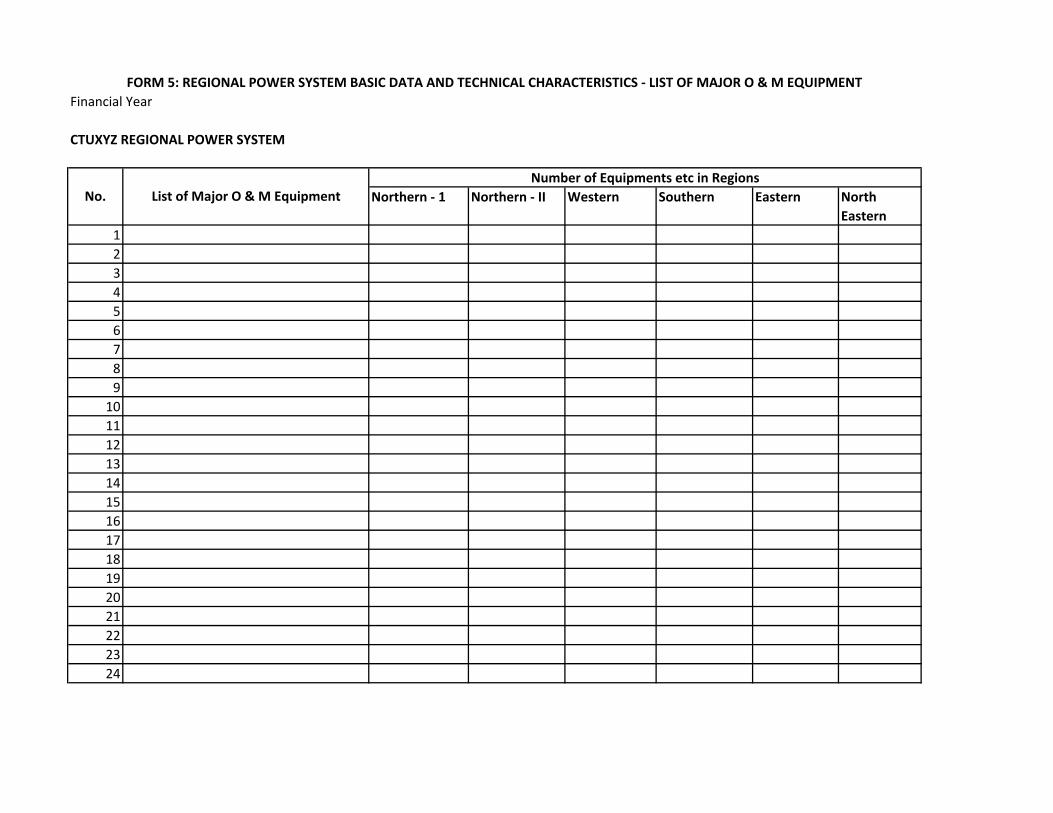
Northern ‐ 1 Northern ‐ II Western Southern Eastern North Eastern
123456789
101112131415161718192021222324
FORM 5: REGIONAL POWER SYSTEM BASIC DATA AND TECHNICAL CHARACTERISTICS ‐ LIST OF MAJOR O & M EQUIPMENT
Number of Equipments etc in Regions
Financial Year
CTUXYZ REGIONAL POWER SYSTEM
List of Major O & M EquipmentNo.
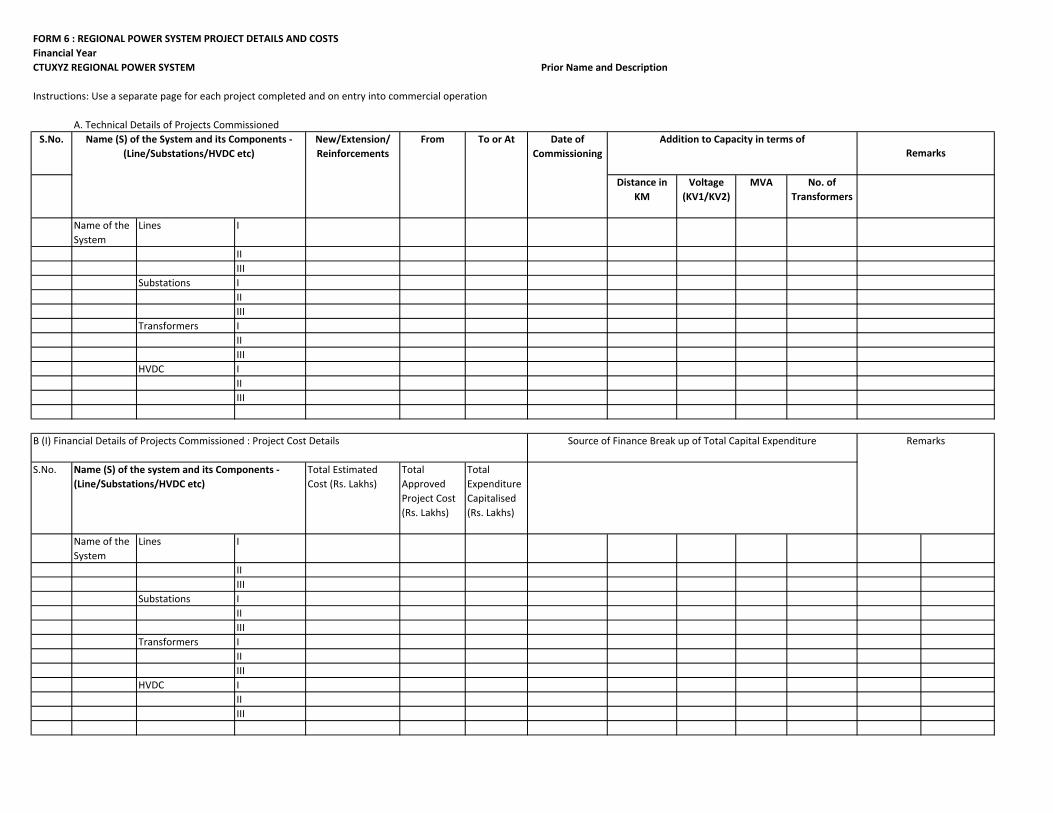
S.No.
Distance in KM
Voltage (KV1/KV2)
MVA No. of Transformers
Name of the System
Lines I
IIIII
Substations IIIIII
Transformers IIIIII
HVDC IIIIII
S.No. Total Estimated Cost (Rs. Lakhs)
Total Approved Project Cost (Rs. Lakhs)
Total Expenditure Capitalised (Rs. Lakhs)
Name of the System
Lines I
IIIII
Substations IIIIII
Transformers IIIIII
HVDC IIIIII
FORM 6 : REGIONAL POWER SYSTEM PROJECT DETAILS AND COSTSFinancial YearCTUXYZ REGIONAL POWER SYSTEM Prior Name and Description
Addition to Capacity in terms of
Instructions: Use a separate page for each project completed and on entry into commercial operation
A. Technical Details of Projects CommissionedName (S) of the System and its Components ‐
(Line/Substations/HVDC etc)New/Extension/ Reinforcements
From To or At Date of Commissioning Remarks
B (I) Financial Details of Projects Commissioned : Project Cost Details Remarks
Name (S) of the system and its Components ‐ (Line/Substations/HVDC etc)
Source of Finance Break up of Total Capital Expenditure
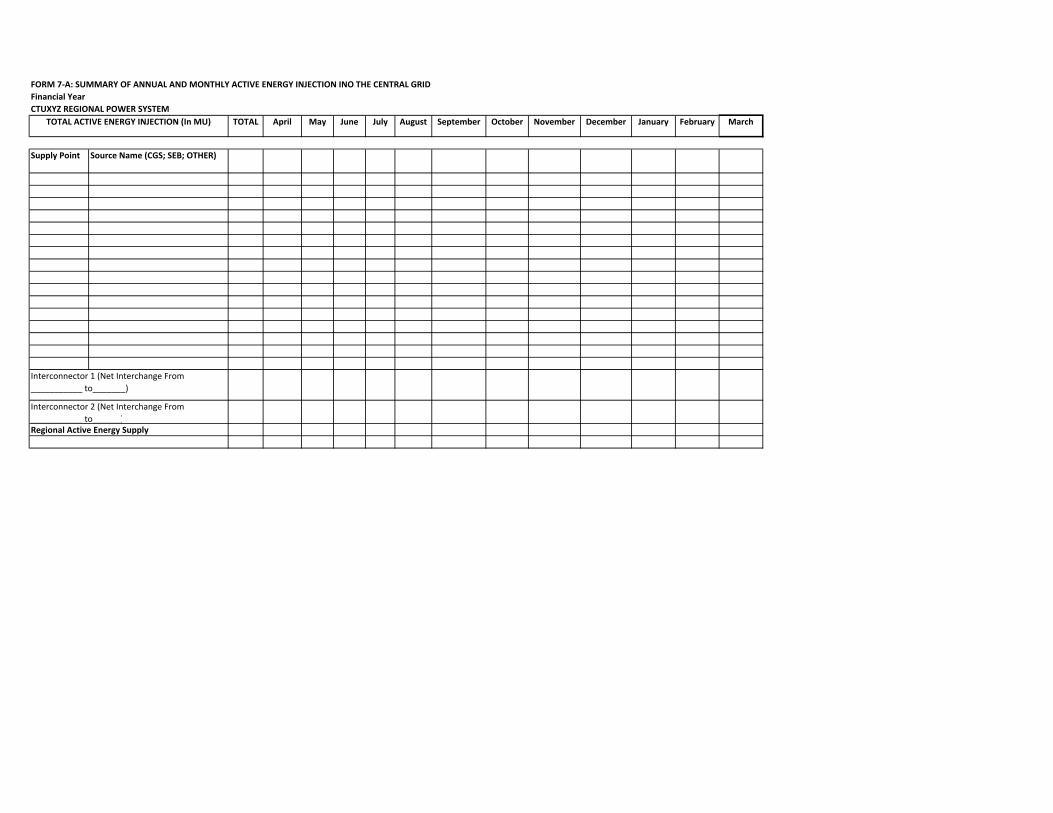
TOTAL April May June July August September October November December January February March
Supply Point Source Name (CGS; SEB; OTHER)
TOTAL ACTIVE ENERGY INJECTION (In MU)
Interconnector 1 (Net Interchange From ___________ to_______)
Interconnector 2 (Net Interchange From ___________ to______)Regional Active Energy Supply
FORM 7‐A: SUMMARY OF ANNUAL AND MONTHLY ACTIVE ENERGY INJECTION INO THE CENTRAL GRIDFinancial YearCTUXYZ REGIONAL POWER SYSTEM
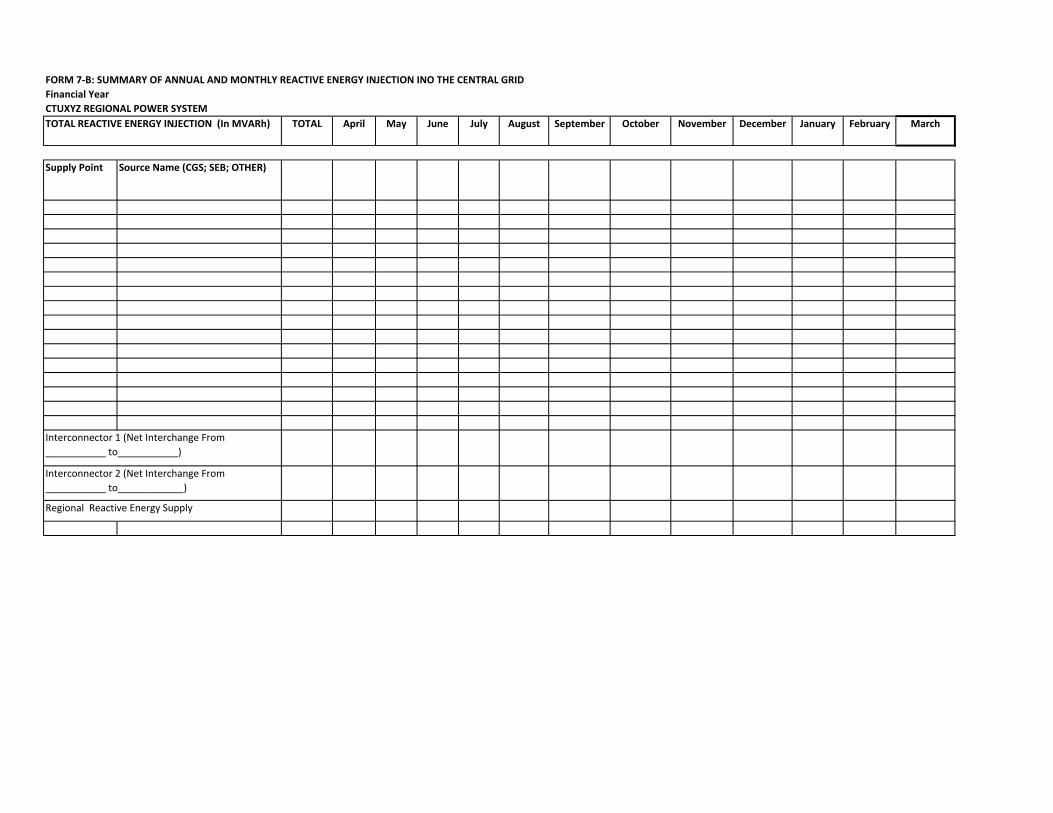
TOTAL April May June July August September October November December January February March
Supply Point Source Name (CGS; SEB; OTHER)
TOTAL REACTIVE ENERGY INJECTION (In MVARh)
Interconnector 1 (Net Interchange From ___________ to___________)
Interconnector 2 (Net Interchange From ___________ to____________)
Regional Reactive Energy Supply
FORM 7‐B: SUMMARY OF ANNUAL AND MONTHLY REACTIVE ENERGY INJECTION INO THE CENTRAL GRIDFinancial YearCTUXYZ REGIONAL POWER SYSTEM
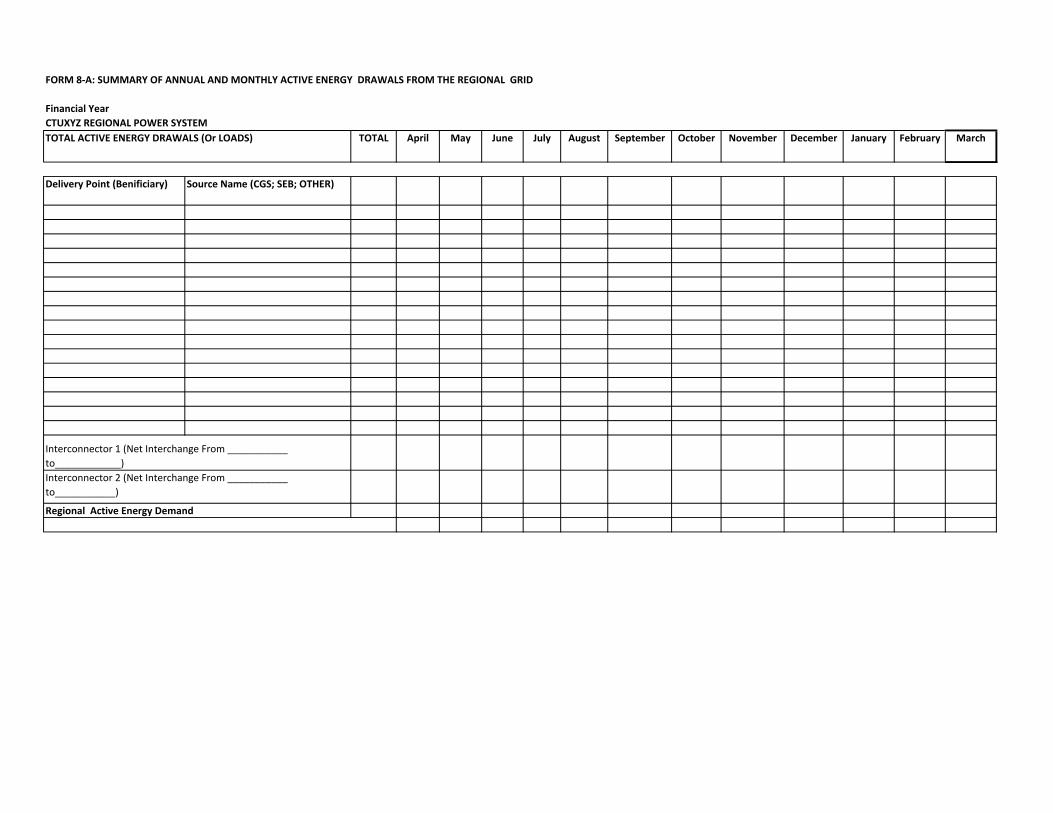
TOTAL April May June July August September October November December January February March
Delivery Point (Benificiary) Source Name (CGS; SEB; OTHER)
TOTAL ACTIVE ENERGY DRAWALS (Or LOADS)
Interconnector 1 (Net Interchange From ___________ to____________)Interconnector 2 (Net Interchange From ___________ to___________)
Regional Active Energy Demand
FORM 8‐A: SUMMARY OF ANNUAL AND MONTHLY ACTIVE ENERGY DRAWALS FROM THE REGIONAL GRID
Financial YearCTUXYZ REGIONAL POWER SYSTEM
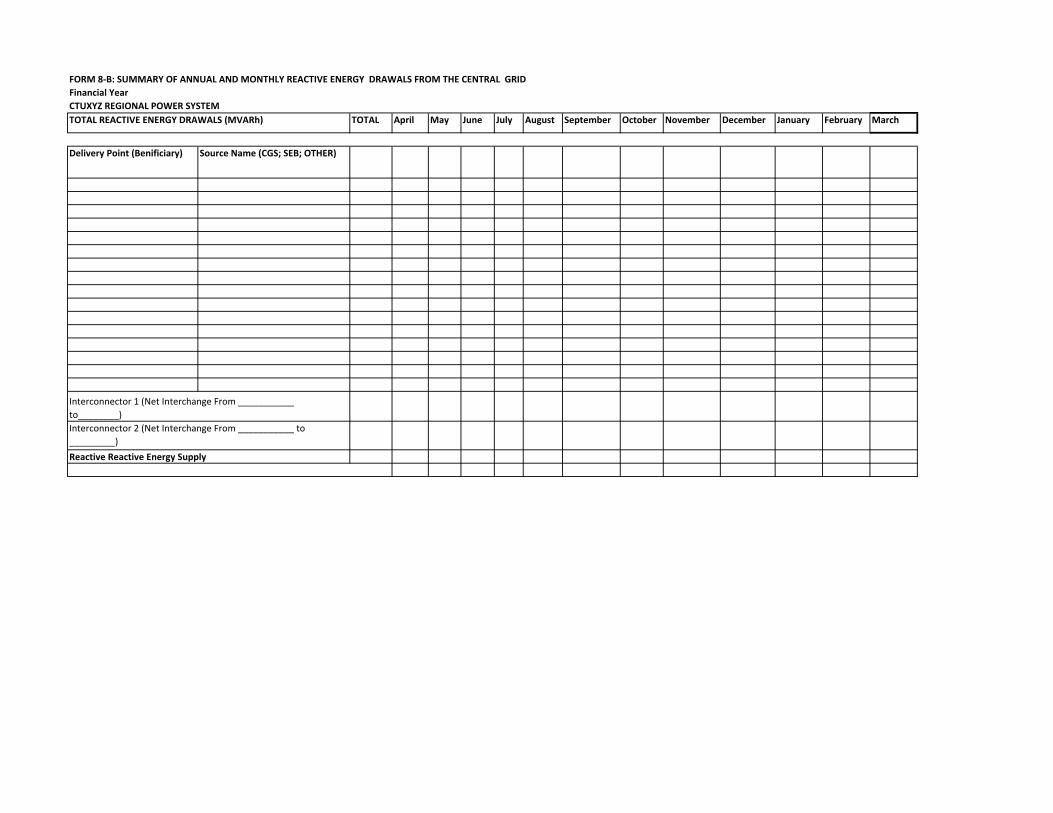
TOTAL April May June July August September October November December January February March
Delivery Point (Benificiary) Source Name (CGS; SEB; OTHER)
FORM 8‐B: SUMMARY OF ANNUAL AND MONTHLY REACTIVE ENERGY DRAWALS FROM THE CENTRAL GRIDFinancial YearCTUXYZ REGIONAL POWER SYSTEMTOTAL REACTIVE ENERGY DRAWALS (MVARh)
Interconnector 1 (Net Interchange From ___________ to________)Interconnector 2 (Net Interchange From ___________ to _________)
Reactive Reactive Energy Supply
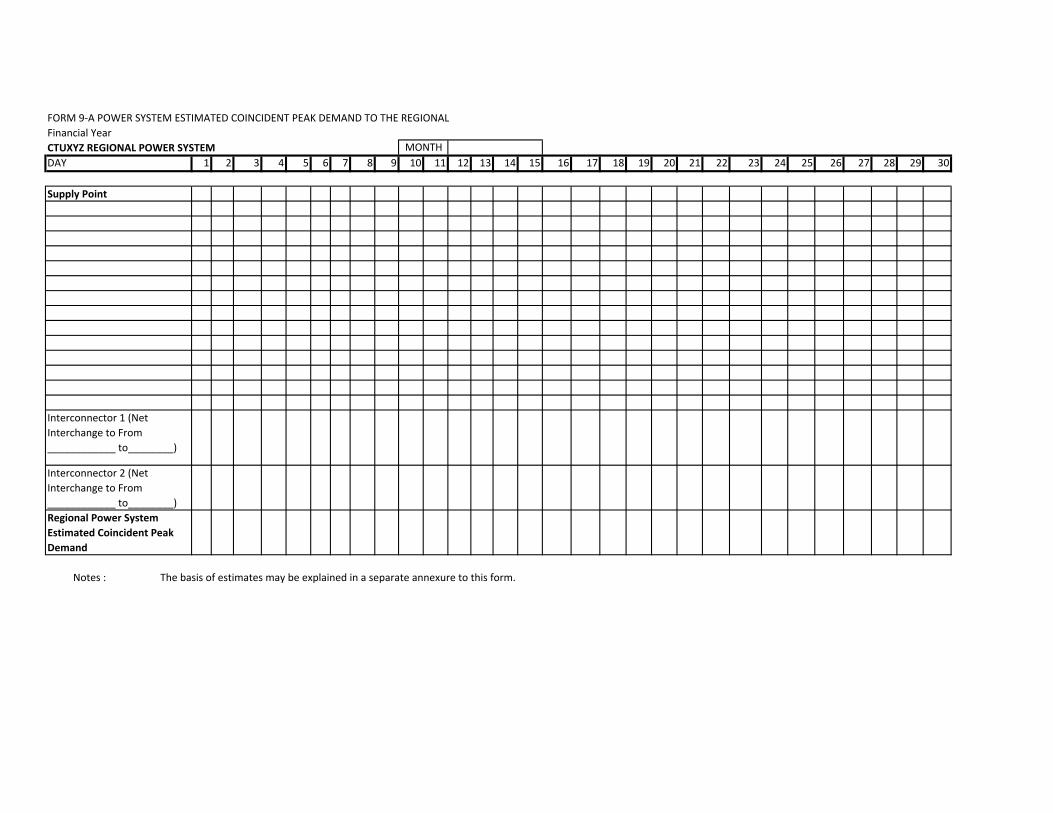
DAY 1 2 3 4 5 6 7 8 9 10 11 12 13 14 15 16 17 18 19 20 21 22 23 24 25 26 27 28 29 30
Supply Point
Interconnector 1 (Net Interchange to From ____________ to________)
Interconnector 2 (Net Interchange to From ____________ to________)Regional Power System Estimated Coincident Peak Demand
Notes : The basis of estimates may be explained in a separate annexure to this form.
FORM 9‐A POWER SYSTEM ESTIMATED COINCIDENT PEAK DEMAND TO THE REGIONAL Financial YearCTUXYZ REGIONAL POWER SYSTEM MONTH
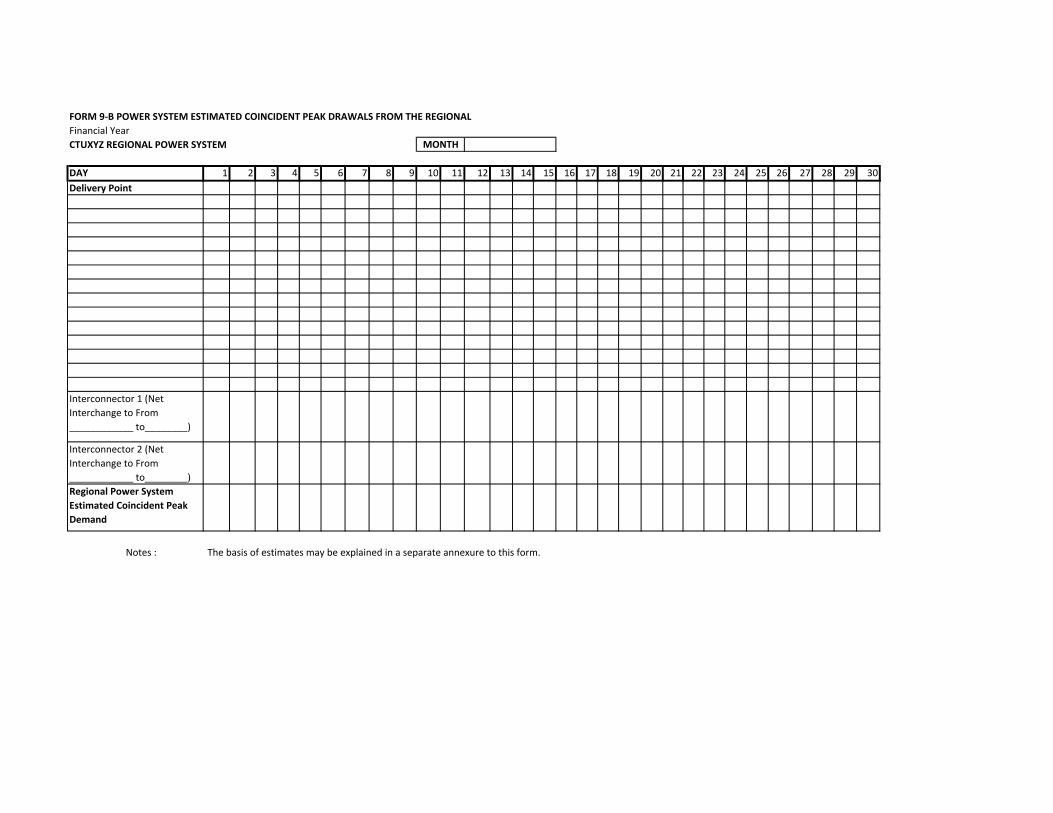
DAY 1 2 3 4 5 6 7 8 9 10 11 12 13 14 15 16 17 18 19 20 21 22 23 24 25 26 27 28 29 30Delivery Point
Interconnector 1 (Net Interchange to From ____________ to________)
Interconnector 2 (Net Interchange to From ____________ to________)Regional Power System Estimated Coincident Peak Demand
Notes : The basis of estimates may be explained in a separate annexure to this form.
FORM 9‐B POWER SYSTEM ESTIMATED COINCIDENT PEAK DRAWALS FROM THE REGIONAL Financial YearCTUXYZ REGIONAL POWER SYSTEM MONTH
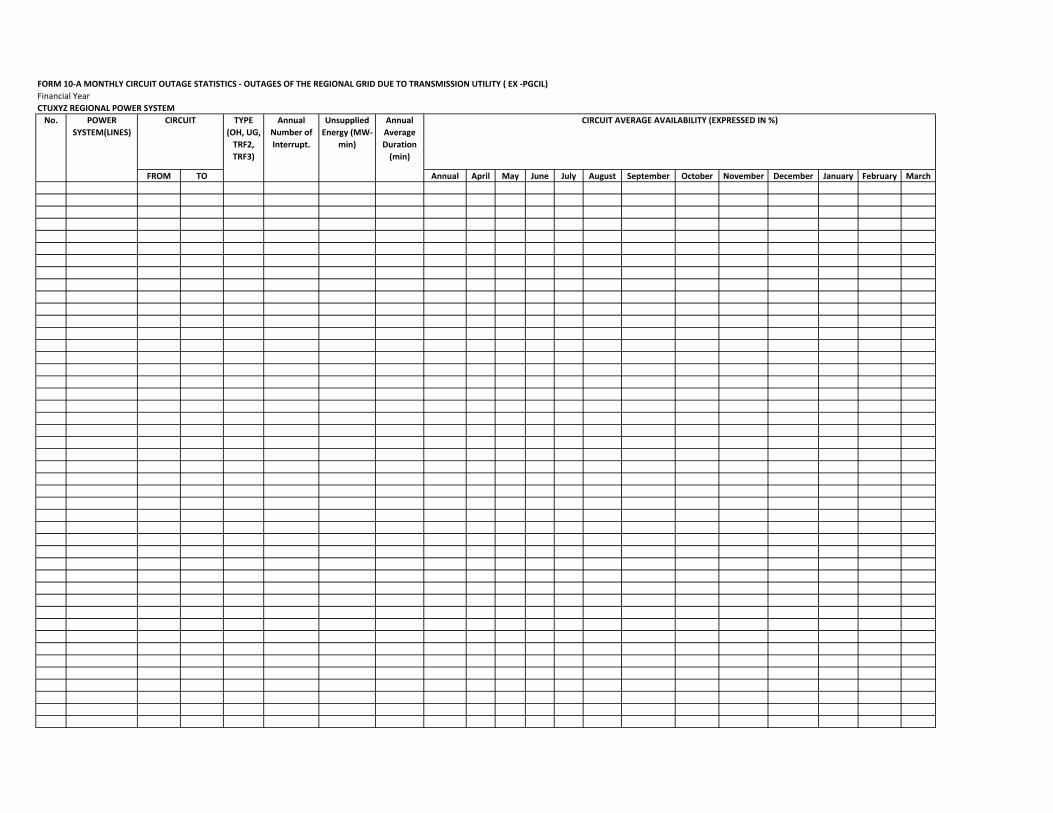
FROM TO Annual April May June July August September October November December January February March
POWER SYSTEM(LINES)
No.CTUXYZ REGIONAL POWER SYSTEM
FORM 10‐A MONTHLY CIRCUIT OUTAGE STATISTICS ‐ OUTAGES OF THE REGIONAL GRID DUE TO TRANSMISSION UTILITY ( EX ‐PGCIL)Financial Year
CIRCUIT TYPE (OH, UG, TRF2, TRF3)
Annual Number of Interrupt.
Unsupplied Energy (MW‐
min)
Annual Average Duration (min)
CIRCUIT AVERAGE AVAILABILITY (EXPRESSED IN %)
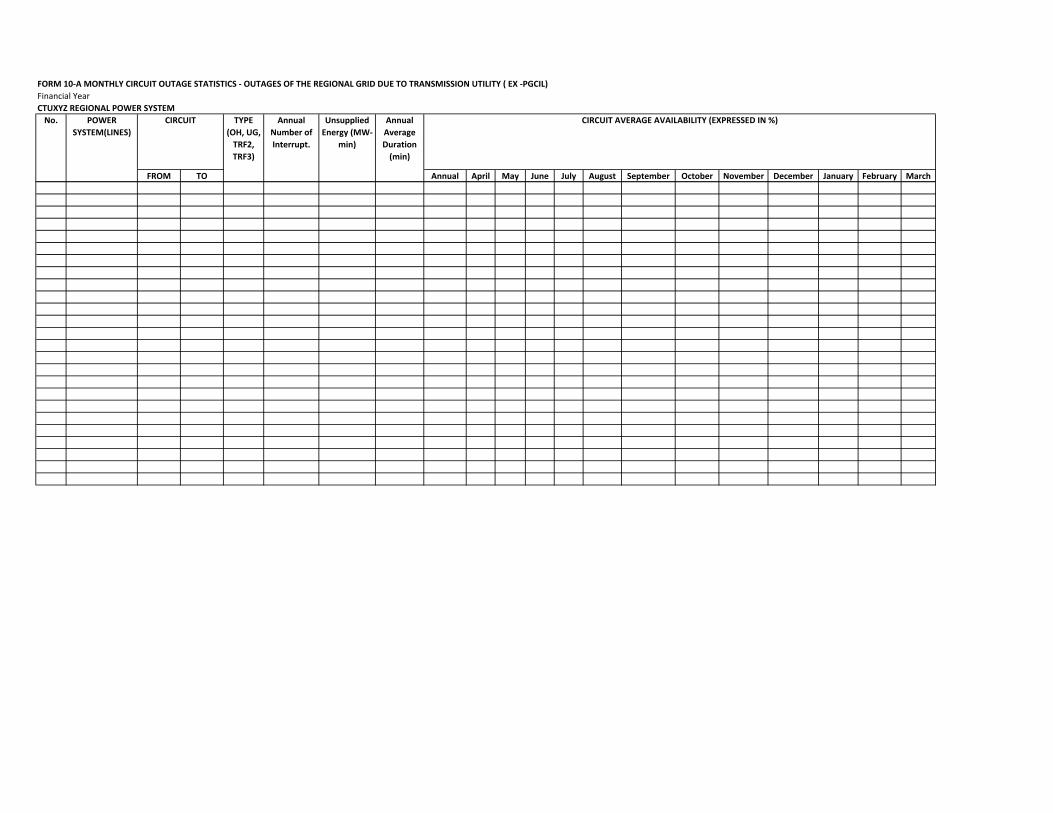
FROM TO Annual April May June July August September October November December January February MarchCIRCUIT AVERAGE AVAILABILITY (EXPRESSED IN %)
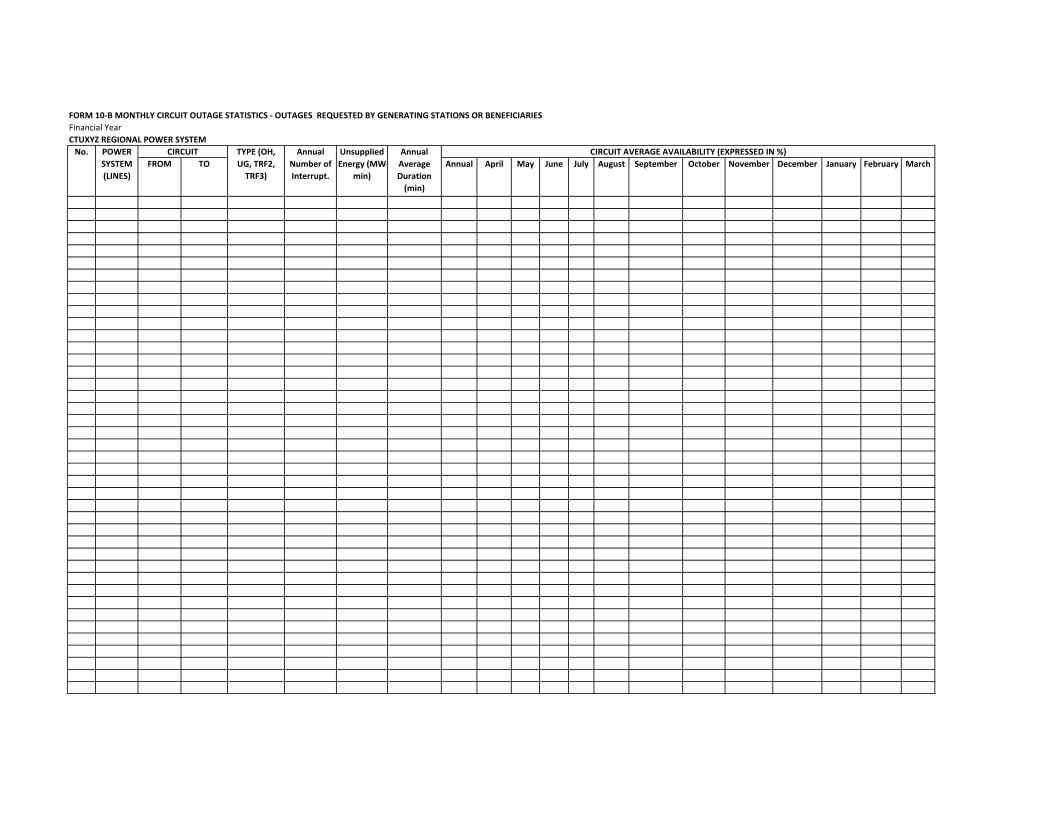
FORM 10‐B MONTHLY CIRCUIT OUTAGE STATISTICS ‐ OUTAGES REQUESTED BY GENERATING STATIONS OR BENEFICIARIES Financial Year CTUXYZ REGIONAL POWER SYSTEMNo. POWER
SYSTEM (LINES)
CIRCUIT TYPE (OH, UG, TRF2, TRF3)
Annual Number of Interrupt.
Unsupplied Energy (MW‐
min)
Annual Average Duration (min)
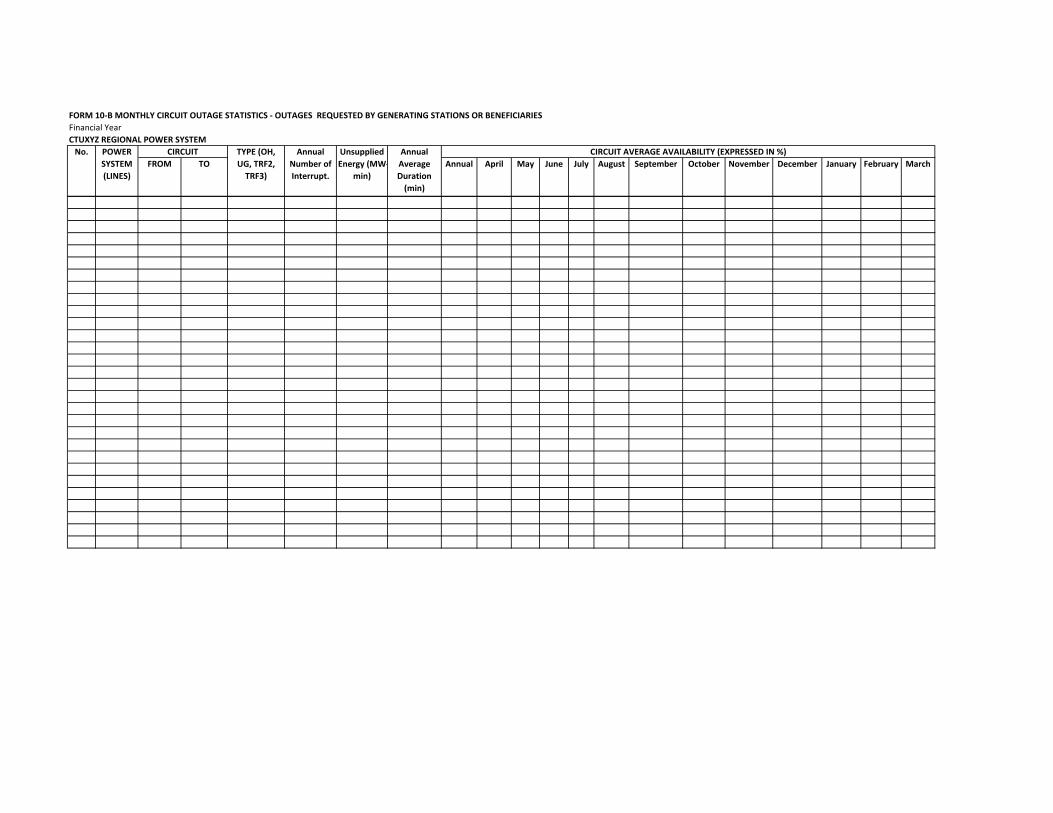
FROM TO Annual April May June July August September October November December January February MarchCIRCUIT AVERAGE AVAILABILITY (EXPRESSED IN %)
FORM 10‐B MONTHLY CIRCUIT OUTAGE STATISTICS ‐ OUTAGES REQUESTED BY GENERATING STATIONS OR BENEFICIARIES Financial Year CTUXYZ REGIONAL POWER SYSTEMNo. POWER
SYSTEM (LINES)
CIRCUIT TYPE (OH, UG, TRF2, TRF3)
Annual Number of Interrupt.
Unsupplied Energy (MW‐
min)
Annual Average Duration (min)
FROM TO Annual April May June July August September October November December January February MarchCIRCUIT AVERAGE AVAILABILITY (EXPRESSED IN %)
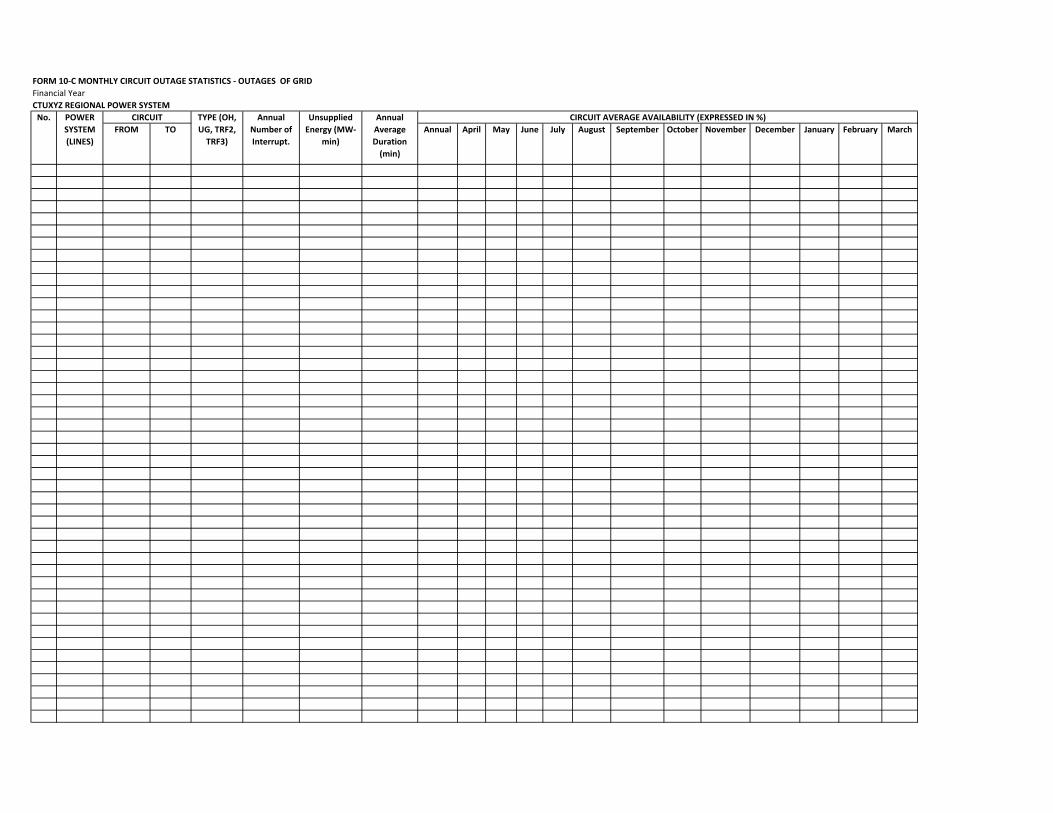
FORM 10‐C MONTHLY CIRCUIT OUTAGE STATISTICS ‐ OUTAGES OF GRIDFinancial Year CTUXYZ REGIONAL POWER SYSTEMNo. POWER
SYSTEM (LINES)
CIRCUIT TYPE (OH, UG, TRF2, TRF3)
Annual Number of Interrupt.
Unsupplied Energy (MW‐
min)
Annual Average Duration (min)
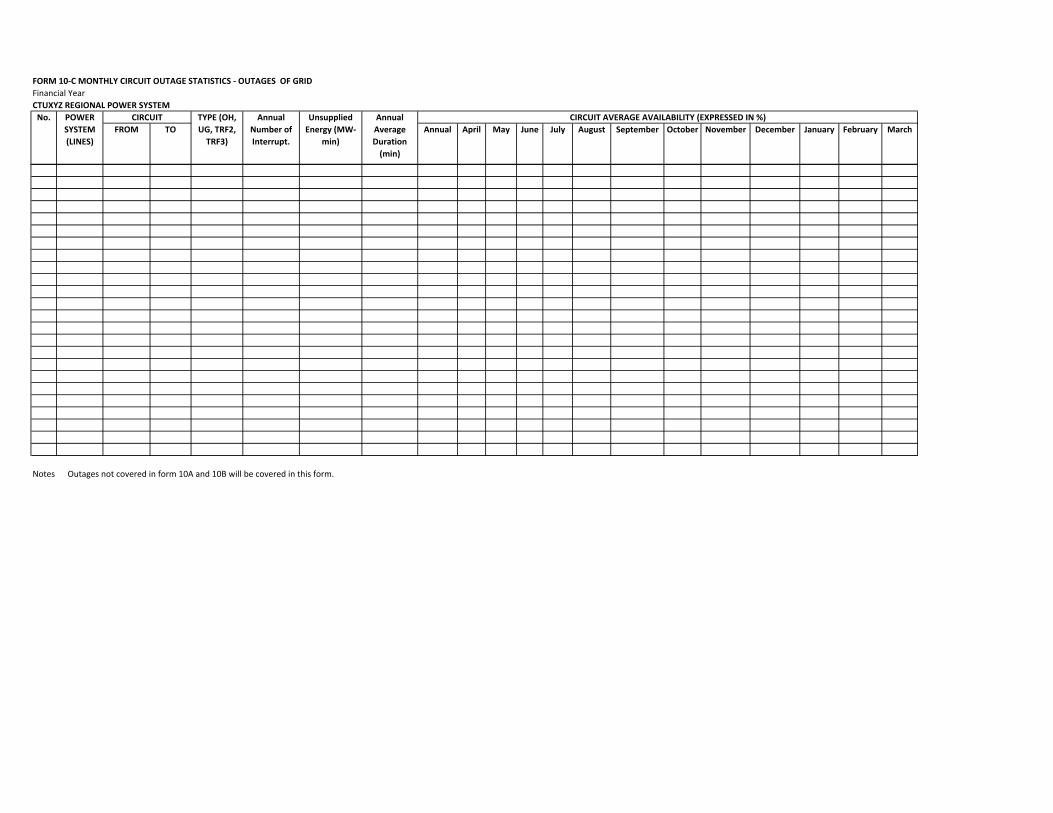
FROM TO Annual April May June July August September October November December January February MarchCIRCUIT AVERAGE AVAILABILITY (EXPRESSED IN %)
FORM 10‐C MONTHLY CIRCUIT OUTAGE STATISTICS ‐ OUTAGES OF GRIDFinancial Year CTUXYZ REGIONAL POWER SYSTEMNo. POWER
SYSTEM (LINES)
CIRCUIT TYPE (OH, UG, TRF2, TRF3)
Annual Number of Interrupt.
Unsupplied Energy (MW‐
min)
Annual Average Duration (min)
Notes Outages not covered in form 10A and 10B will be covered in this form.
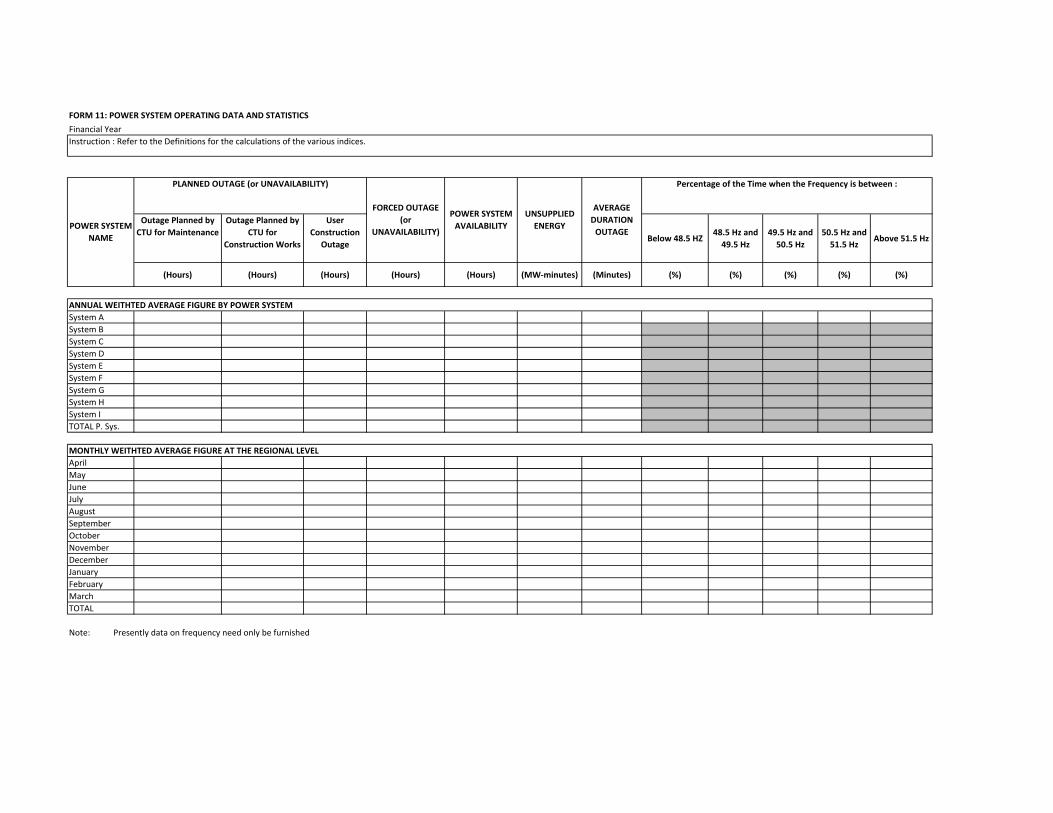
Outage Planned by CTU for Maintenance
Outage Planned by CTU for
Construction Works
User Construction
OutageBelow 48.5 HZ
48.5 Hz and 49.5 Hz
49.5 Hz and 50.5 Hz
50.5 Hz and 51.5 Hz
Above 51.5 Hz
(Hours) (Hours) (Hours) (Hours) (Hours) (MW‐minutes) (Minutes) (%) (%) (%) (%) (%)
System ASystem BSystem CSystem DSystem ESystem FSystem GSystem HSystem ITOTAL P. Sys.
AprilMayJuneJulyAugustSeptemberOctoberNovemberDecemberJanuaryFebruaryMarchTOTAL
MONTHLY WEITHTED AVERAGE FIGURE AT THE REGIONAL LEVEL
Note: Presently data on frequency need only be furnished
FORM 11: POWER SYSTEM OPERATING DATA AND STATISTICS
Financial YearInstruction : Refer to the Definitions for the calculations of the various indices.
POWER SYSTEM NAME
PLANNED OUTAGE (or UNAVAILABILITY)
FORCED OUTAGE (or
UNAVAILABILITY)
POWER SYSTEM AVAILABILITY
UNSUPPLIED ENERGY
AVERAGE DURATION OUTAGE
Percentage of the Time when the Frequency is between :
ANNUAL WEITHTED AVERAGE FIGURE BY POWER SYSTEM
April May June July August September October November December January February March
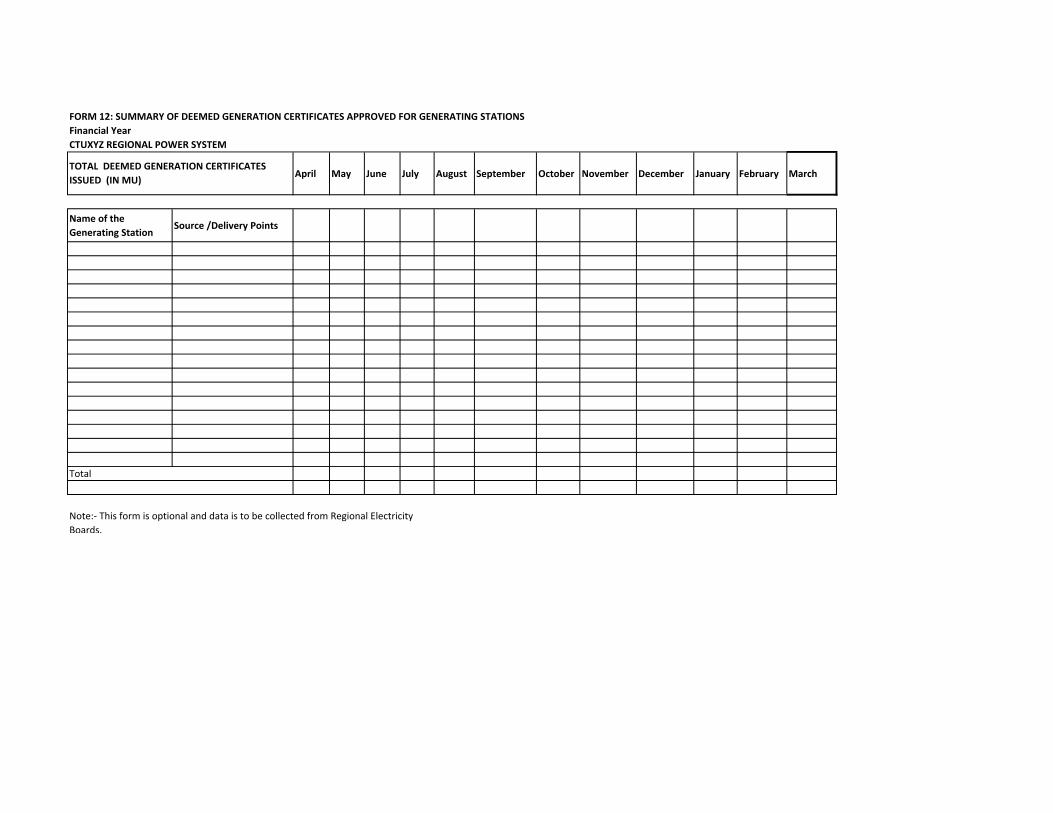
Name of the Generating Station
Source /Delivery Points
Note:‐ This form is optional and data is to be collected from Regional Electricity Boards.
Total
FORM 12: SUMMARY OF DEEMED GENERATION CERTIFICATES APPROVED FOR GENERATING STATIONSFinancial YearCTUXYZ REGIONAL POWER SYSTEM
TOTAL DEEMED GENERATION CERTIFICATES ISSUED (IN MU)
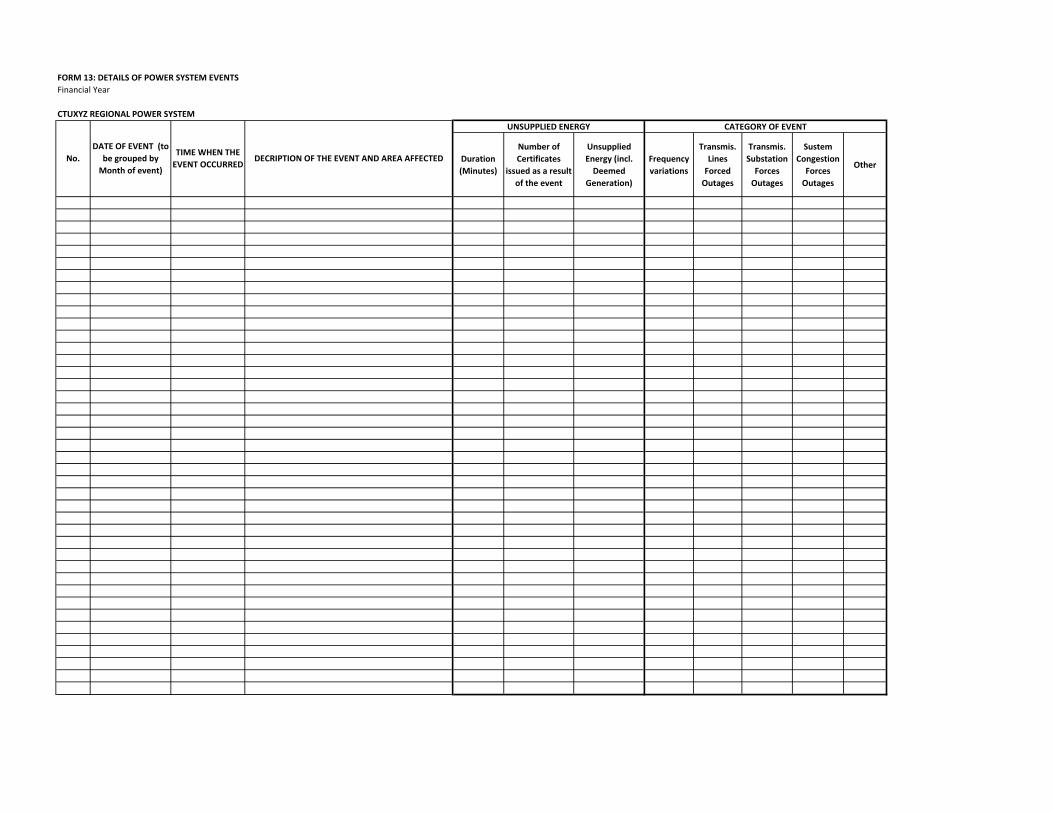
Duration (Minutes)
Number of Certificates
issued as a result of the event
Unsupplied Energy (incl. Deemed
Generation)
Frequency variations
Transmis. Lines Forced Outages
Transmis. Substation Forces Outages
Sustem Congestion Forces Outages
Other
CTUXYZ REGIONAL POWER SYSTEM
FORM 13: DETAILS OF POWER SYSTEM EVENTSFinancial Year
CATEGORY OF EVENTUNSUPPLIED ENERGY
No.DATE OF EVENT (to
be grouped by Month of event)
TIME WHEN THE EVENT OCCURRED
DECRIPTION OF THE EVENT AND AREA AFFECTED
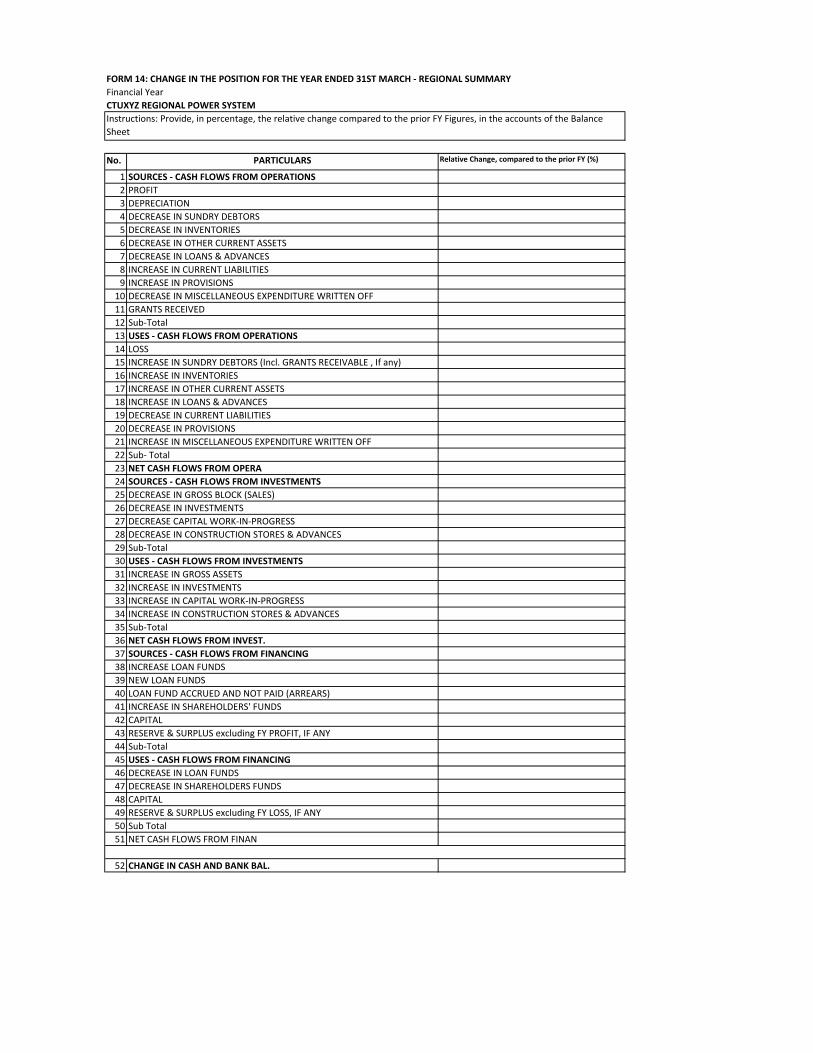
No. PARTICULARS Relative Change, compared to the prior FY (%)
1 SOURCES ‐ CASH FLOWS FROM OPERATIONS2 PROFIT3 DEPRECIATION4 DECREASE IN SUNDRY DEBTORS5 DECREASE IN INVENTORIES6 DECREASE IN OTHER CURRENT ASSETS7 DECREASE IN LOANS & ADVANCES8 INCREASE IN CURRENT LIABILITIES9 INCREASE IN PROVISIONS10 DECREASE IN MISCELLANEOUS EXPENDITURE WRITTEN OFF11 GRANTS RECEIVED12 Sub‐Total13 USES ‐ CASH FLOWS FROM OPERATIONS14 LOSS15 INCREASE IN SUNDRY DEBTORS (Incl. GRANTS RECEIVABLE , If any)16 INCREASE IN INVENTORIES17 INCREASE IN OTHER CURRENT ASSETS18 INCREASE IN LOANS & ADVANCES19 DECREASE IN CURRENT LIABILITIES20 DECREASE IN PROVISIONS21 INCREASE IN MISCELLANEOUS EXPENDITURE WRITTEN OFF22 Sub‐ Total23 NET CASH FLOWS FROM OPERA24 SOURCES ‐ CASH FLOWS FROM INVESTMENTS25 DECREASE IN GROSS BLOCK (SALES)26 DECREASE IN INVESTMENTS27 DECREASE CAPITAL WORK‐IN‐PROGRESS28 DECREASE IN CONSTRUCTION STORES & ADVANCES29 Sub‐Total30 USES ‐ CASH FLOWS FROM INVESTMENTS31 INCREASE IN GROSS ASSETS32 INCREASE IN INVESTMENTS33 INCREASE IN CAPITAL WORK‐IN‐PROGRESS34 INCREASE IN CONSTRUCTION STORES & ADVANCES35 Sub‐Total36 NET CASH FLOWS FROM INVEST.37 SOURCES ‐ CASH FLOWS FROM FINANCING38 INCREASE LOAN FUNDS39 NEW LOAN FUNDS40 LOAN FUND ACCRUED AND NOT PAID (ARREARS)41 INCREASE IN SHAREHOLDERS' FUNDS42 CAPITAL43 RESERVE & SURPLUS excluding FY PROFIT, IF ANY44 Sub‐Total45 USES ‐ CASH FLOWS FROM FINANCING46 DECREASE IN LOAN FUNDS47 DECREASE IN SHAREHOLDERS FUNDS48 CAPITAL49 RESERVE & SURPLUS excluding FY LOSS, IF ANY50 Sub Total51 NET CASH FLOWS FROM FINAN
52 CHANGE IN CASH AND BANK BAL.
Instructions: Provide, in percentage, the relative change compared to the prior FY Figures, in the accounts of the Balance Sheet
FORM 14: CHANGE IN THE POSITION FOR THE YEAR ENDED 31ST MARCH ‐ REGIONAL SUMMARY Financial YearCTUXYZ REGIONAL POWER SYSTEM
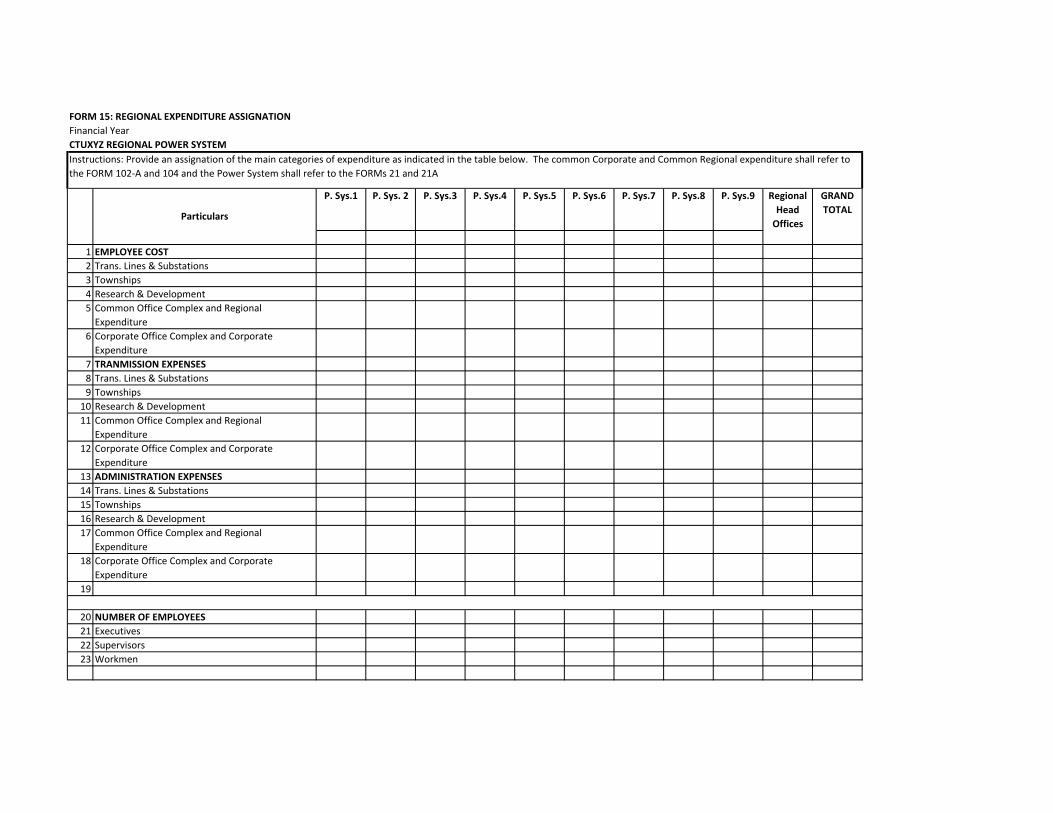
P. Sys.1 P. Sys. 2 P. Sys.3 P. Sys.4 P. Sys.5 P. Sys.6 P. Sys.7 P. Sys.8 P. Sys.9
1 EMPLOYEE COST2 Trans. Lines & Substations3 Townships 4 Research & Development5 Common Office Complex and Regional Expenditure
6 Corporate Office Complex and Corporate Expenditure
7 TRANMISSION EXPENSES8 Trans. Lines & Substations9 Townships
10 Research & Development11 Common Office Complex and Regional
Expenditure12 Corporate Office Complex and Corporate
Expenditure13 ADMINISTRATION EXPENSES14 Trans. Lines & Substations15 Townships 16 Research & Development17 Common Office Complex and Regional
Expenditure18 Corporate Office Complex and Corporate
Expenditure19
20 NUMBER OF EMPLOYEES21 Executives22 Supervisors23 Workmen
Financial YearFORM 15: REGIONAL EXPENDITURE ASSIGNATION
Regional Head Offices
GRAND TOTAL
Particulars
Instructions: Provide an assignation of the main categories of expenditure as indicated in the table below. The common Corporate and Common Regional expenditure shall refer to the FORM 102‐A and 104 and the Power System shall refer to the FORMs 21 and 21A
CTUXYZ REGIONAL POWER SYSTEM
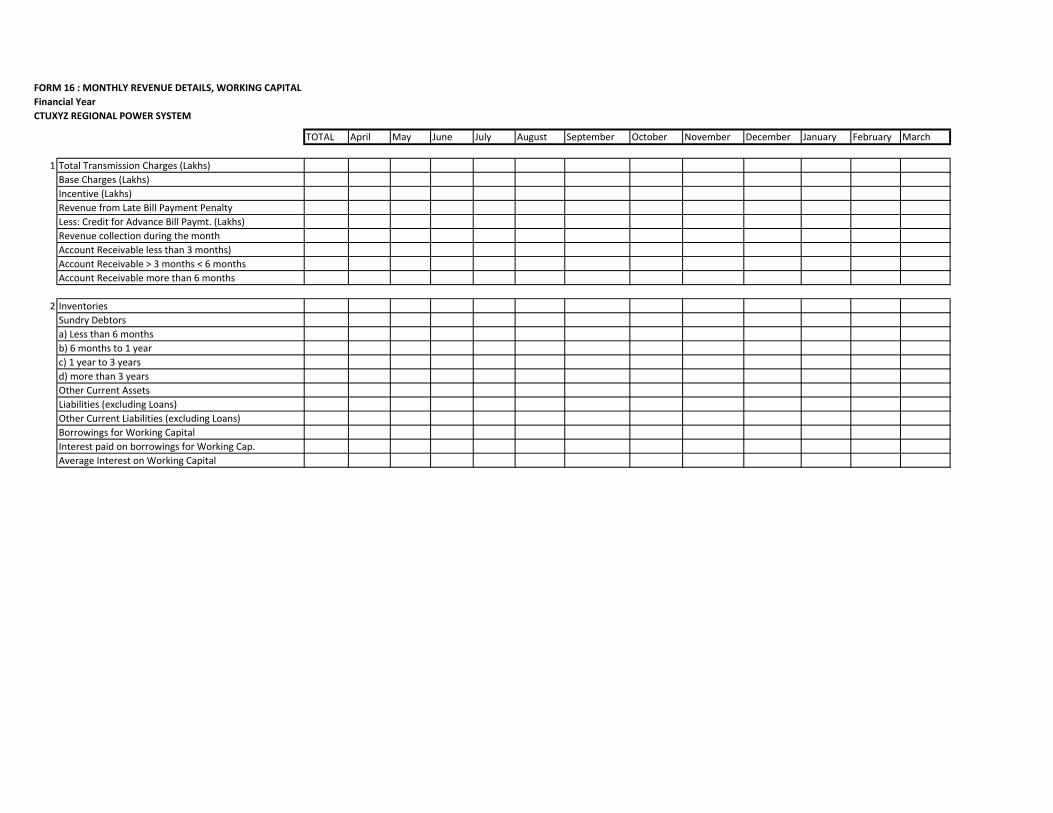
TOTAL April May June July August September October November December January February March
1 Total Transmission Charges (Lakhs)Base Charges (Lakhs)Incentive (Lakhs)Revenue from Late Bill Payment PenaltyLess: Credit for Advance Bill Paymt. (Lakhs)Revenue collection during the monthAccount Receivable less than 3 months)Account Receivable > 3 months < 6 monthsAccount Receivable more than 6 months
2 InventoriesSundry Debtorsa) Less than 6 monthsb) 6 months to 1 yearc) 1 year to 3 yearsd) more than 3 yearsOther Current AssetsLiabilities (excluding Loans)Other Current Liabilities (excluding Loans)Borrowings for Working CapitalInterest paid on borrowings for Working Cap.Average Interest on Working Capital
CTUXYZ REGIONAL POWER SYSTEM
FORM 16 : MONTHLY REVENUE DETAILS, WORKING CAPITALFinancial Year
Instructions1
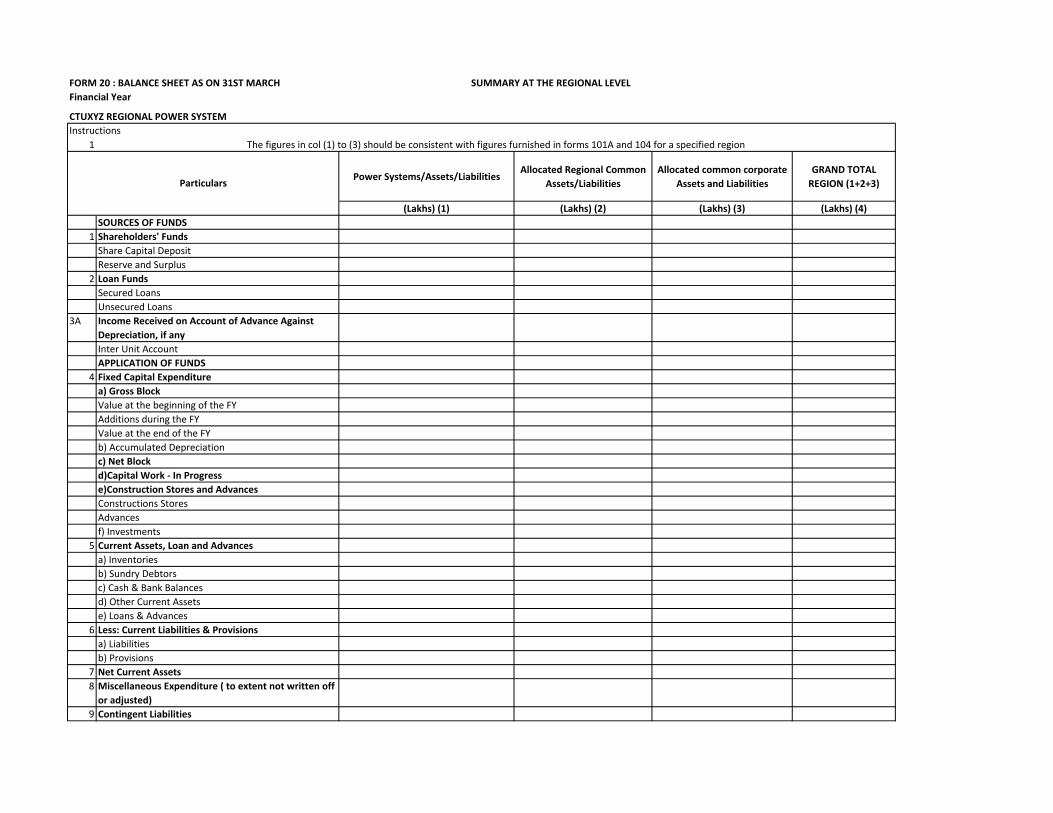
Power Systems/Assets/LiabilitiesAllocated Regional Common
Assets/LiabilitiesAllocated common corporate
Assets and LiabilitiesGRAND TOTAL REGION (1+2+3)
(Lakhs) (1) (Lakhs) (2) (Lakhs) (3) (Lakhs) (4)SOURCES OF FUNDS
1 Shareholders' FundsShare Capital DepositReserve and Surplus
2 Loan FundsSecured LoansUnsecured Loans
3A Income Received on Account of Advance Against Depreciation, if anyInter Unit AccountAPPLICATION OF FUNDS
4 Fixed Capital Expenditurea) Gross BlockValue at the beginning of the FYAdditions during the FYValue at the end of the FYb) Accumulated Depreciationc) Net Blockd)Capital Work ‐ In Progresse)Construction Stores and AdvancesConstructions StoresAdvancesf) Investments
5 Current Assets, Loan and Advancesa) Inventoriesb) Sundry Debtorsc) Cash & Bank Balancesd) Other Current Assetse) Loans & Advances
6 Less: Current Liabilities & Provisionsa) Liabilitiesb) Provisions
7 Net Current Assets8 Miscellaneous Expenditure ( to extent not written off or adjusted)
9 Contingent Liabilities
The figures in col (1) to (3) should be consistent with figures furnished in forms 101A and 104 for a specified region
Financial YearFORM 20 : BALANCE SHEET AS ON 31ST MARCH SUMMARY AT THE REGIONAL LEVEL
CTUXYZ REGIONAL POWER SYSTEM
Particulars
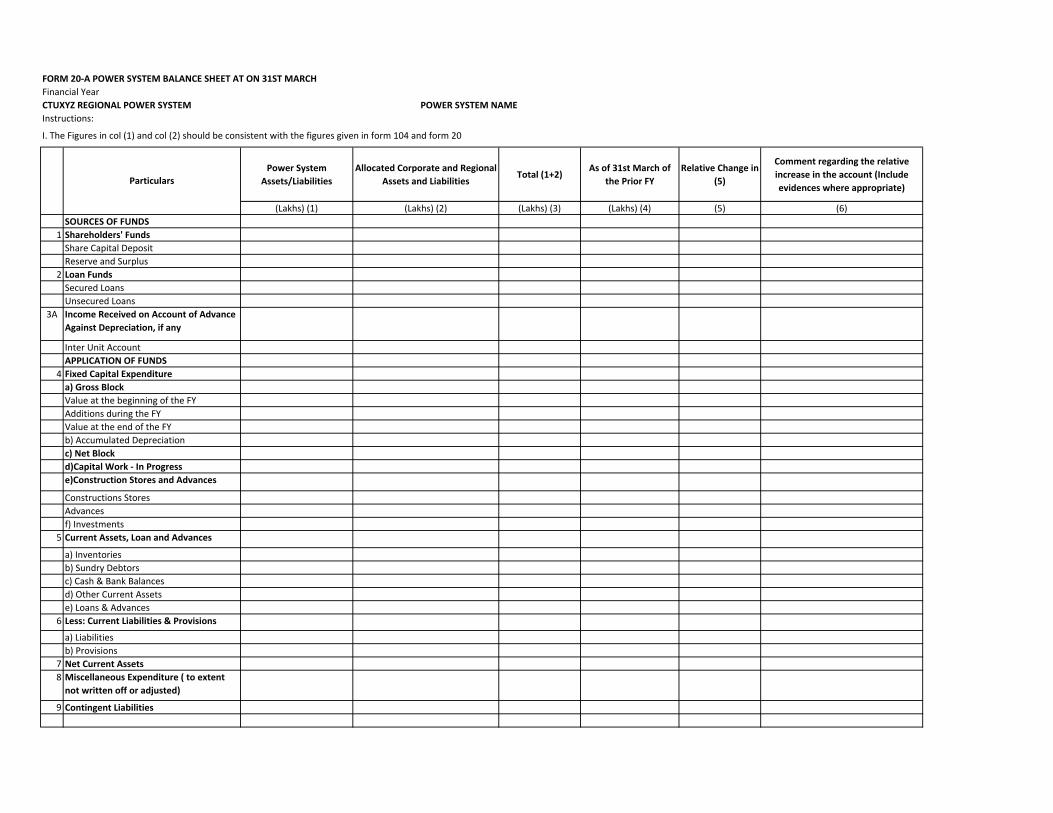
Power System Assets/Liabilities
Allocated Corporate and Regional Assets and Liabilities
Total (1+2)As of 31st March of
the Prior FYRelative Change in
(5)
Comment regarding the relative increase in the account (Include evidences where appropriate)
(Lakhs) (1) (Lakhs) (2) (Lakhs) (3) (Lakhs) (4) (5) (6)SOURCES OF FUNDS
1 Shareholders' FundsShare Capital DepositReserve and Surplus
2 Loan FundsSecured LoansUnsecured Loans
3A Income Received on Account of Advance Against Depreciation, if any
Inter Unit AccountAPPLICATION OF FUNDS
4 Fixed Capital Expenditurea) Gross BlockValue at the beginning of the FYAdditions during the FYValue at the end of the FYb) Accumulated Depreciationc) Net Blockd)Capital Work ‐ In Progresse)Construction Stores and Advances
Constructions StoresAdvancesf) Investments
5 Current Assets, Loan and Advances
a) Inventoriesb) Sundry Debtorsc) Cash & Bank Balancesd) Other Current Assetse) Loans & Advances
6 Less: Current Liabilities & Provisions
a) Liabilitiesb) Provisions
7 Net Current Assets8 Miscellaneous Expenditure ( to extent not written off or adjusted)
9 Contingent Liabilities
FORM 20‐A POWER SYSTEM BALANCE SHEET AT ON 31ST MARCH
Particulars
I. The Figures in col (1) and col (2) should be consistent with the figures given in form 104 and form 20
Instructions:CTUXYZ REGIONAL POWER SYSTEM POWER SYSTEM NAMEFinancial Year
I.
Power System Income and Expenses
Allocated Regional Income and Expenses
Allocated Corporate & Common Income and
Expenses
GRAND TOTAL REGION (1+2+3)
(Lakhs) (1) (Lakhs) (2) (Lakhs) (3) (Lakhs) (4)INCOME
1 Transmission Charges2 (Tax Recovery)3 Sale of Electric Power4 Consultancy, PM and Supervision Fees
5 Other Income (to be specified if significant)
6 TOTAL (1‐5)EXPENDITURE
7 Purchase of Electric PowerTransmission, Admin and Other Expenses
8 Employee CostsTransmission Expenses
9 Repairs & Maintenance10 Power Charges (net)11 Stores & Spares Consumed12 Water Charges13 Wheeling Charges14 Others (not included above and to be
specified)15 Sub total ( 8 to 14)
ADMINISTRATION EXPENSES16 Training & Recruit. Exp.17 Legal Expenses18 Professional Charges19 Consultancy Expenses20 Communication Expenses21 Travelling Expenses 22 Tender Expenses23 Auditors' Exp.24 Advertisement and Publicity25 Printing and Stationery26 EDP Hire and Other Charges27 Enterainment Expenses28 Brokerage Commission29 Donations30 Research & Development Exp. (Less
Grants)31 Rent32 Construction Stores Written Off33 Temporary Work Written Off34 Miscellaneous Expenses (excl.
Director's Fee)35 Insurance36 Rates and Taxes37 Non Operating Expenses38 Exp. For Guest House39 Others (not included above and to be
specified)40 Sub total (16‐39)41 Sub Total (7+15+40)42 DEPRECIATION43 PRIOR PERIOD ADJUST (NET)44 Sub Total (41 to 43)45 Less IEDC transfd to CWIP 46 Sub Total (44‐45)47 PROVISIONS48 INTEREST AND FIN. CHARGES49 Less IEDC transfd to CWIP 50 sub total (48‐49)51 Total Expenditure (46+47+50)
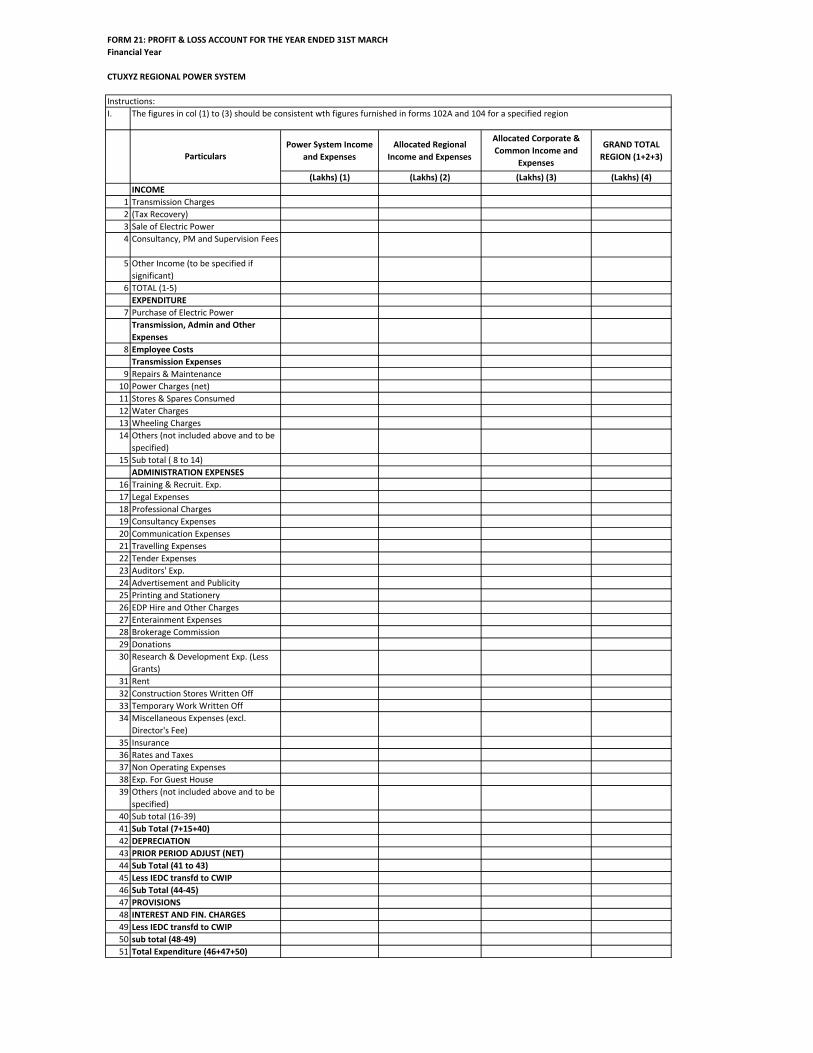
FORM 21: PROFIT & LOSS ACCOUNT FOR THE YEAR ENDED 31ST MARCH
CTUXYZ REGIONAL POWER SYSTEM
Financial Year
Particulars
The figures in col (1) to (3) should be consistent wth figures furnished in forms 102A and 104 for a specified regionInstructions:
I.
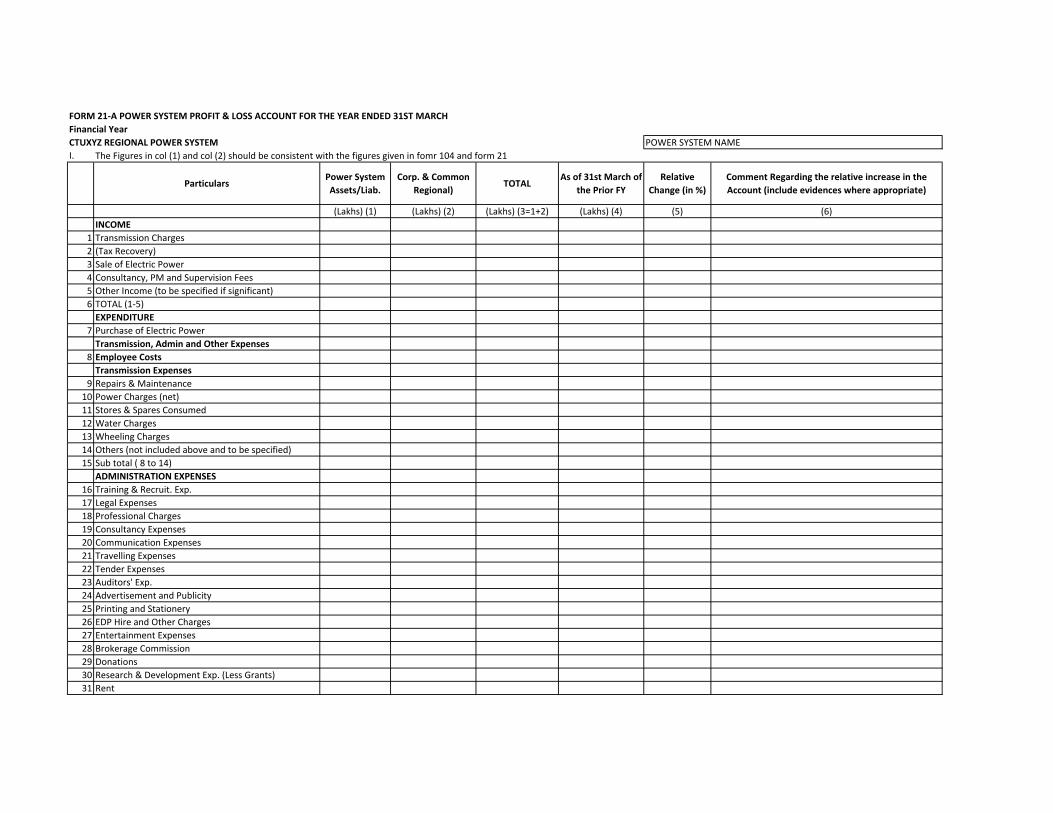
ParticularsPower System Assets/Liab.
Corp. & Common Regional)
TOTALAs of 31st March of
the Prior FYRelative
Change (in %)Comment Regarding the relative increase in the Account (include evidences where appropriate)
(Lakhs) (1) (Lakhs) (2) (Lakhs) (3=1+2) (Lakhs) (4) (5) (6)INCOME
1 Transmission Charges2 (Tax Recovery)3 Sale of Electric Power4 Consultancy, PM and Supervision Fees5 Other Income (to be specified if significant)6 TOTAL (1‐5)EXPENDITURE
7 Purchase of Electric PowerTransmission, Admin and Other Expenses
8 Employee CostsTransmission Expenses
9 Repairs & Maintenance10 Power Charges (net)11 Stores & Spares Consumed12 Water Charges13 Wheeling Charges14 Others (not included above and to be specified)15 Sub total ( 8 to 14)
ADMINISTRATION EXPENSES16 Training & Recruit. Exp.17 Legal Expenses18 Professional Charges19 Consultancy Expenses20 Communication Expenses21 Travelling Expenses 22 Tender Expenses23 Auditors' Exp.24 Advertisement and Publicity25 Printing and Stationery26 EDP Hire and Other Charges27 Entertainment Expenses28 Brokerage Commission29 Donations30 Research & Development Exp. (Less Grants)31 Rent
The Figures in col (1) and col (2) should be consistent with the figures given in fomr 104 and form 21CTUXYZ REGIONAL POWER SYSTEM POWER SYSTEM NAMEFinancial YearFORM 21‐A POWER SYSTEM PROFIT & LOSS ACCOUNT FOR THE YEAR ENDED 31ST MARCH
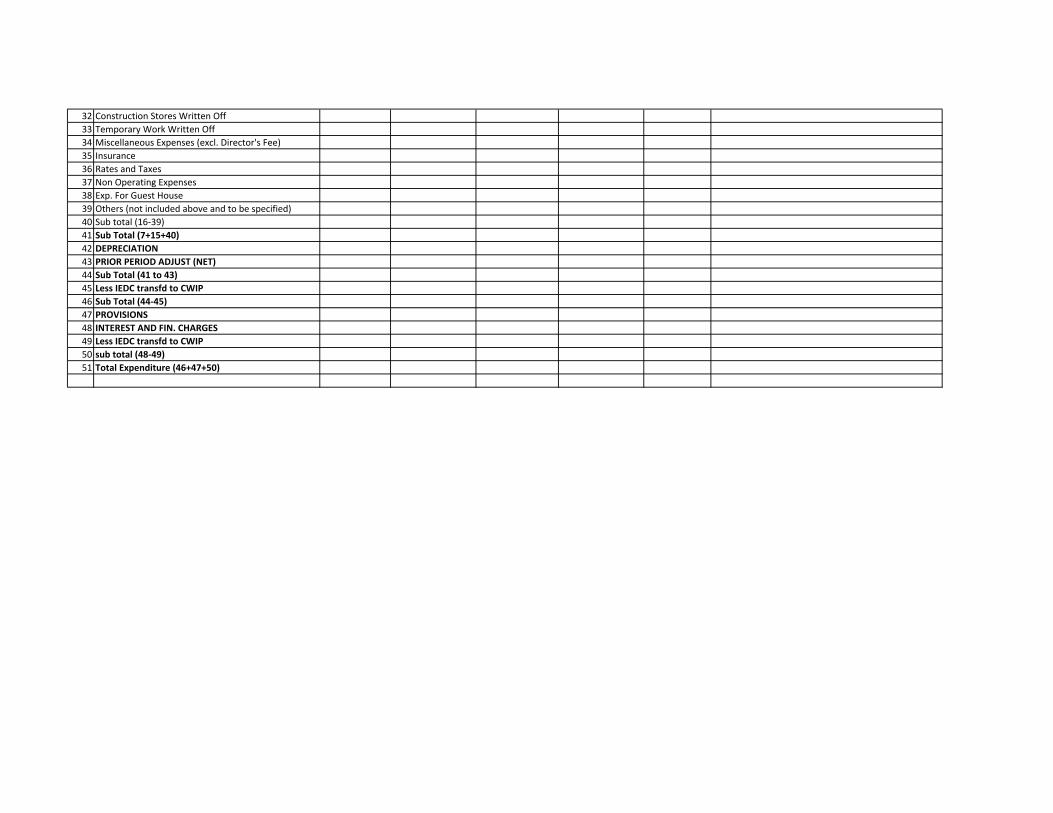
32 Construction Stores Written Off33 Temporary Work Written Off34 Miscellaneous Expenses (excl. Director's Fee)35 Insurance36 Rates and Taxes37 Non Operating Expenses38 Exp. For Guest House39 Others (not included above and to be specified)40 Sub total (16‐39)41 Sub Total (7+15+40)42 DEPRECIATION43 PRIOR PERIOD ADJUST (NET)44 Sub Total (41 to 43)45 Less IEDC transfd to CWIP 46 Sub Total (44‐45)47 PROVISIONS48 INTEREST AND FIN. CHARGES49 Less IEDC transfd to CWIP 50 sub total (48‐49)51 Total Expenditure (46+47+50)