Embed Size (px)
Citation preview
Central Business District Office Market Study
Fourth Quarter 2014
Research Conducted By:
Coleman Group, LLC |710 East Main Street, Suite 130 | Lexington, Kentucky 40502 | (859) 255-8855 | www.ColemanGroup.net
LEXINGTON CENTRAL BUSINESS DISTRICT OFFICE MARKET
(4th Quarter - 2014)
Coleman Group, LLC has prepared the enclosed Central Business District Office Market Study designed to track vacancy and rent levels of Central Business District office space in Lexington, Kentucky. Coleman Group has chosen 25 buildings containing 2,088,430 square feet of office space to represent the Central Business District. An overview of the Lexington area economy and demographics is included here to present the business climate in which these 26 buildings exist. Finally, Coleman Group, LLC has provided a summary of the vacancy and rent levels, as shown in the following table, to be used for comparison purposes for a specific property or properties.
There is approximately 2,088,430 square feet (SF) of rentable class A and B office space in the Central Business District.
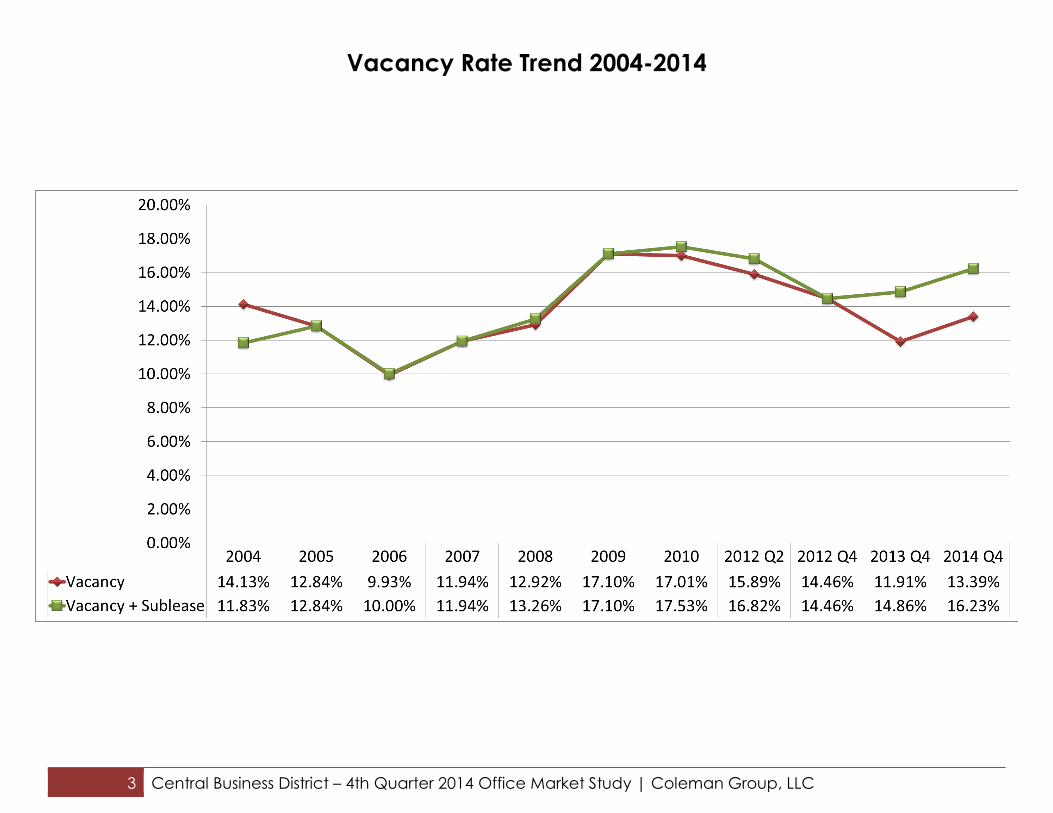
At this time, 279,701 square feet are vacant indicating a vacancy rate of 13.39%.
59,318 square feet are available for sublease, which brings the total available square footage to 339,019. The combined vacancy rate is 16.23%.
Since our last study, compiled in 4th quarter 2012, the vacancy rate has increased from 11.91% to 13.39%. This represents a 1.48% increase in actual vacancy. Including sublease availability, the vacancy rate has increased point 1.37%, from 14.86% in Q4 2013 to 16.23% in Q4 2014.
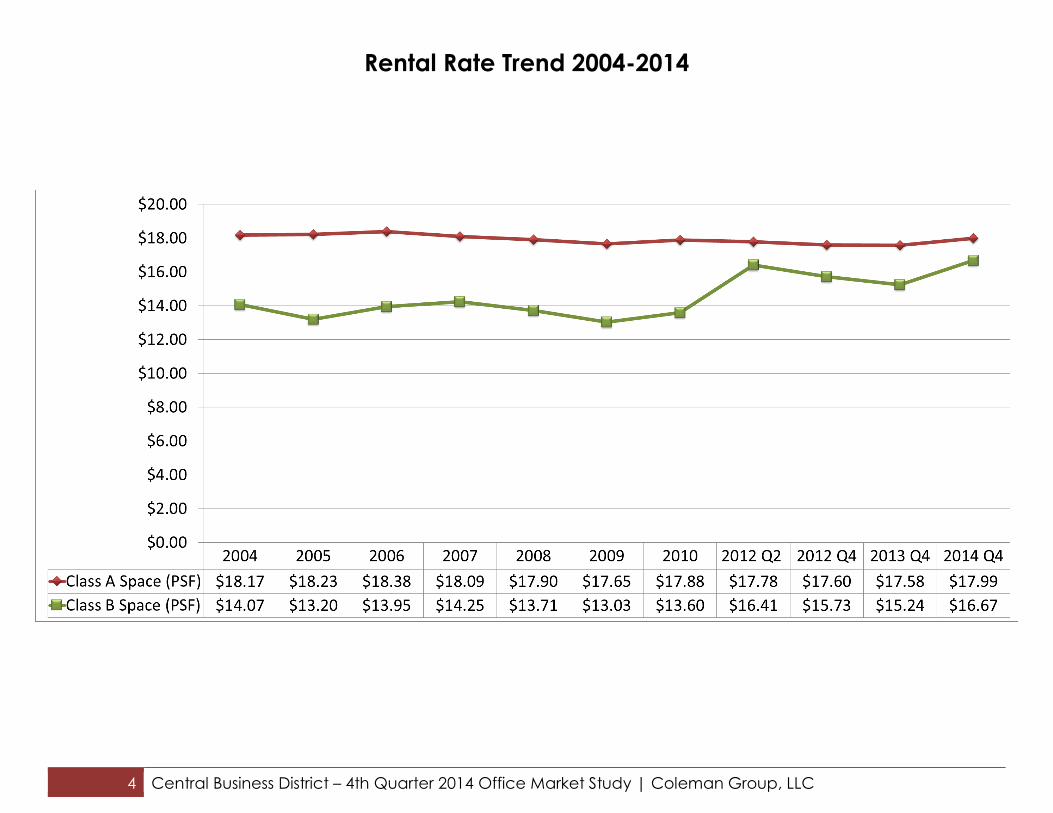
For the purposes of this study, the Central Business District office space surveyed is either class A or Class B. Of the 25 buildings surveyed in the Central Business District, 10 are Class A office buildings. The remaining 15 used in this study are Class B office buildings. The average quoted rent for the Class A office buildings is $17.99, within a range of $15.00 - $20.95 per square foot. The average quoted rent for the Class B office buildings is $16.67, within a range of $12.00 - $24.00 per square foot. Extreme outliers have been excluded from average calculations. As of the end of the fourth quarter 2014, the breakdown between the Class A and Class B space is as follows:
Methods Coleman Group, LLC gathered data for this Market Study via independently developed web-based surveys and telephone interviews of the listing agents, owners, and/or leasing contacts assigned to properties of interest. When the listing agent was unreachable, Coleman Group, LLC drew required data from CoStar.com, “the world leader for commercial real estate intelligence.”
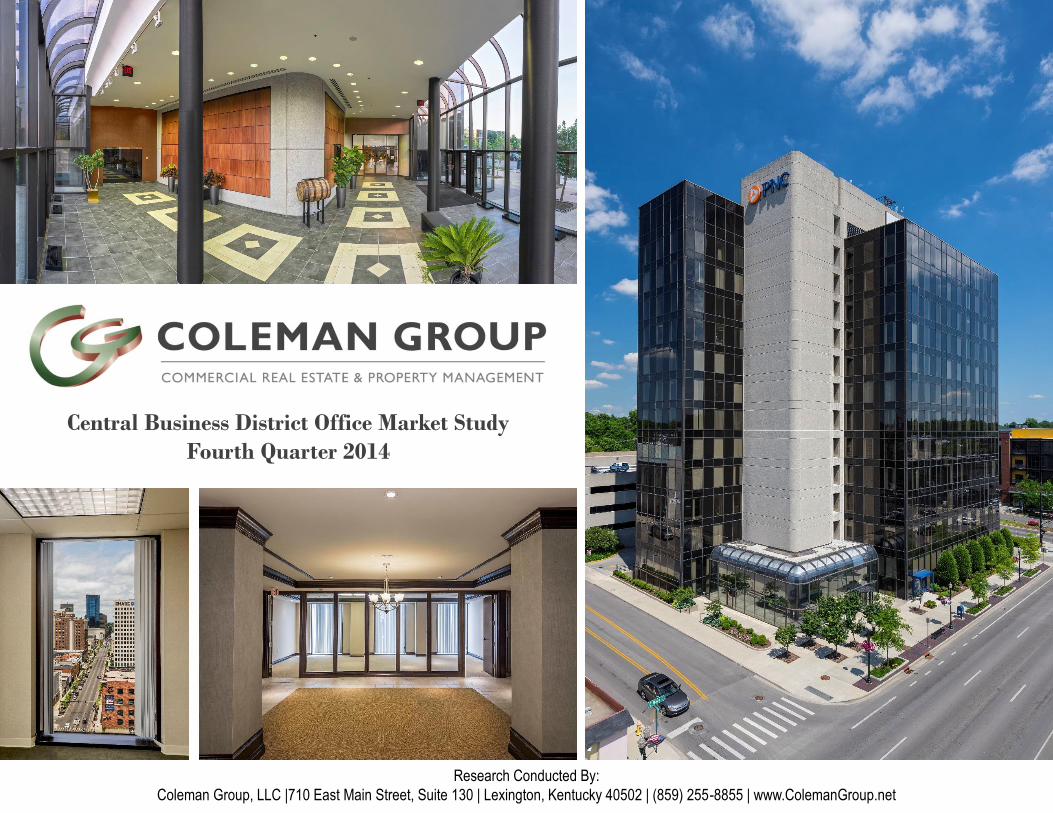
Analysis of Total SQ. FT.
Type Total Sq. Ft. Vacant Sq. Ft. Vacancy Rate
Available 2,088,430 279,701 13.39%
Sublease
Available 59,318 2.84%
TOTAL 2,088,430 339,019 16.23%
Central Business District Class A & B
Type Total Sq. Ft. Vacant Sq. Ft. Vacancy Rate
CLASS A 1,550,435 309,964 19.99%
CLASS B 537,995 29,055 5.40%
TOTAL 2,088,430 339,019 16.23%
2 Central Business District – 4th Quarter 2014 Office Market Study | Coleman Group, LLC
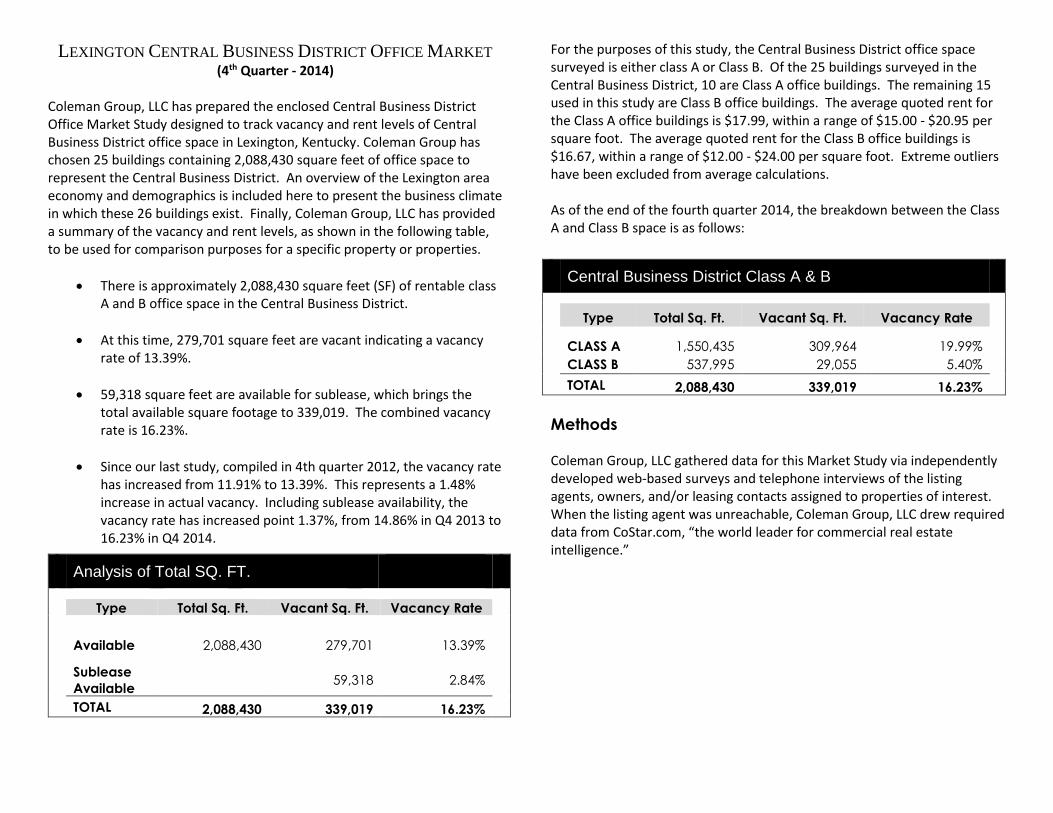
Available Space Trend 2004-2014
3 Central Business District – 4th Quarter 2014 Office Market Study | Coleman Group, LLC
Vacancy Rate Trend 2004-2014
4 Central Business District – 4th Quarter 2014 Office Market Study | Coleman Group, LLC
Rental Rate Trend 2004-2014
5 Central Business District – 4th Quarter 2014 Office Market Study | Coleman Group, LLC
THE LEXINGTON CENTRAL BUSINESS DISTRICT MARKET
The classification of office space is most often related to location, use of land, and description of the property. The Lexington Central Business District office market is office space that is located in the heart of the downtown area with easy connection to the interstate highways and main throughways. These locations rely on the highly populated center of the city with easy access to banks and the financial center of the city. The lack of on-site parking is the major disadvantage of downtown office space compared to suburban office space. Although there is adequate parking to serve the downtown office market, this is an additional expense to the tenant and its employees as well as an inconvenience. With the limited amount of parking available and the added expense of this parking, the abundant parking in the suburban districts can be a determining factor in location decisions. This is especially important if the tenant does not need to be located in the Central Business District to adequately perform business activities. The convenience of being downtown is in many cases more important than the issue of adequate and convenient parking. The Central Business District is typically the major location, as stated before, for service industries such as banks, insurance companies, law firms, accounting firms, etc. that rely on their downtown location for success.
TRANSPORTATION New Circle Road connects to US 421, US 25, US 27, US 60, and US 68. These arteries connect to Interstate 75 and 64, which join in the northeast portion and extend in a general northwest/southeast direction. New Circle Road (State Route 4) is one of the two highway “loop” systems that circle the inner city for easy access to the northern and eastern portions and Man O’ War Boulevard in the southern and southwestern portions. The major airport serving the Lexington area is the Blue Grass Airport. The airport is located in the western portion of the metropolitan area and provides flights for commercial, private, and corporate passengers in addition to cargo shipments. Blue Grass Airport averages 42 daily flights and as such serves as the primary air transportation provider in Central Kentucky. In 2010, the airport served a little over one million passengers with 7 major airlines with non-stop service to 15 major hub cities and connecting service to hundreds of cities worldwide.
6 Central Business District – 4th Quarter 2014 Office Market Study | Coleman Group, LLC
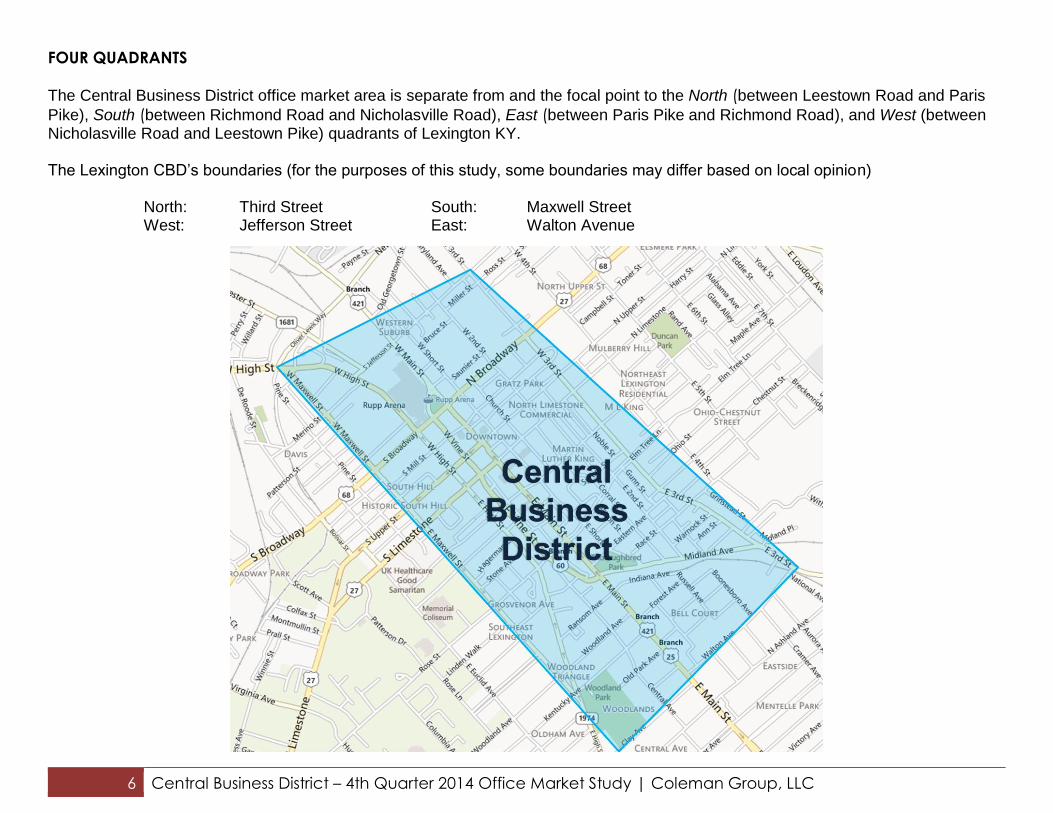
FOUR QUADRANTS
The Central Business District office market area is separate from and the focal point to the North (between Leestown Road and Paris
Pike), South (between Richmond Road and Nicholasville Road), East (between Paris Pike and Richmond Road), and West (between Nicholasville Road and Leestown Pike) quadrants of Lexington KY. The Lexington CBD’s boundaries (for the purposes of this study, some boundaries may differ based on local opinion) North: Third Street South: Maxwell Street West: Jefferson Street East: Walton Avenue
7 Central Business District – 4th Quarter 2014 Office Market Study | Coleman Group, LLC
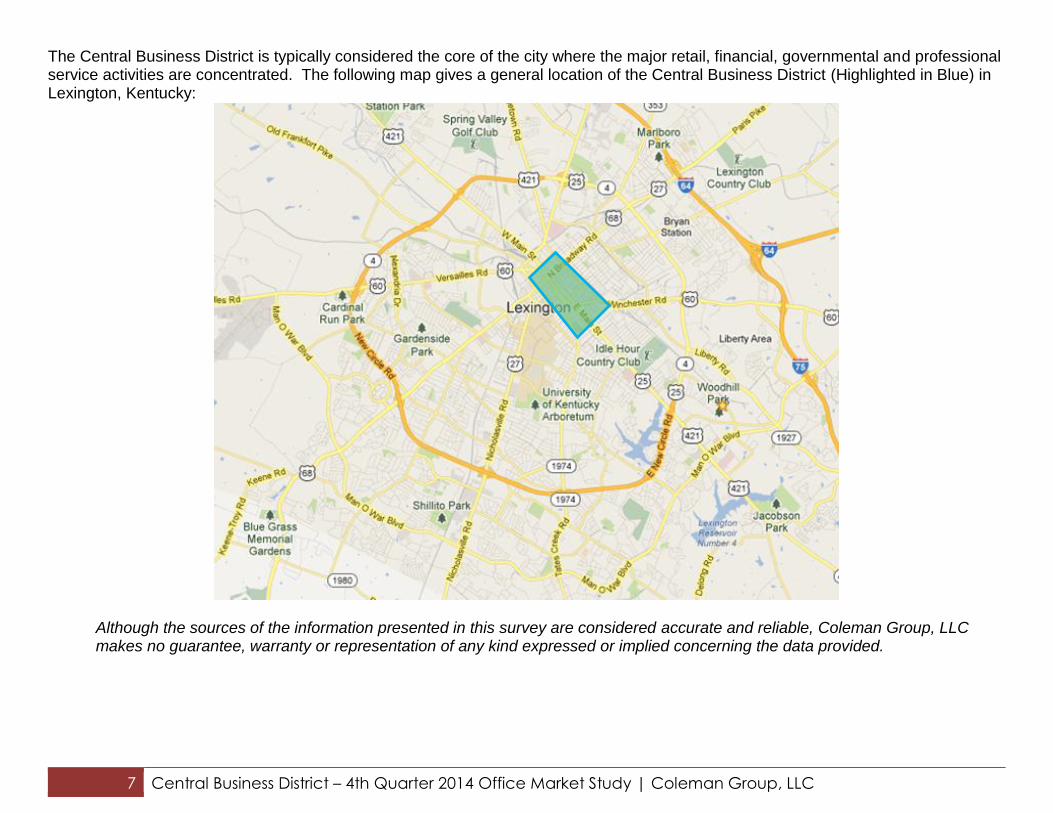
The Central Business District is typically considered the core of the city where the major retail, financial, governmental and professional service activities are concentrated. The following map gives a general location of the Central Business District (Highlighted in Blue) in Lexington, Kentucky:
Although the sources of the information presented in this survey are considered accurate and reliable, Coleman Group, LLC makes no guarantee, warranty or representation of any kind expressed or implied concerning the data provided.
8 Central Business District – 4th Quarter 2014 Office Market Study | Coleman Group, LLC
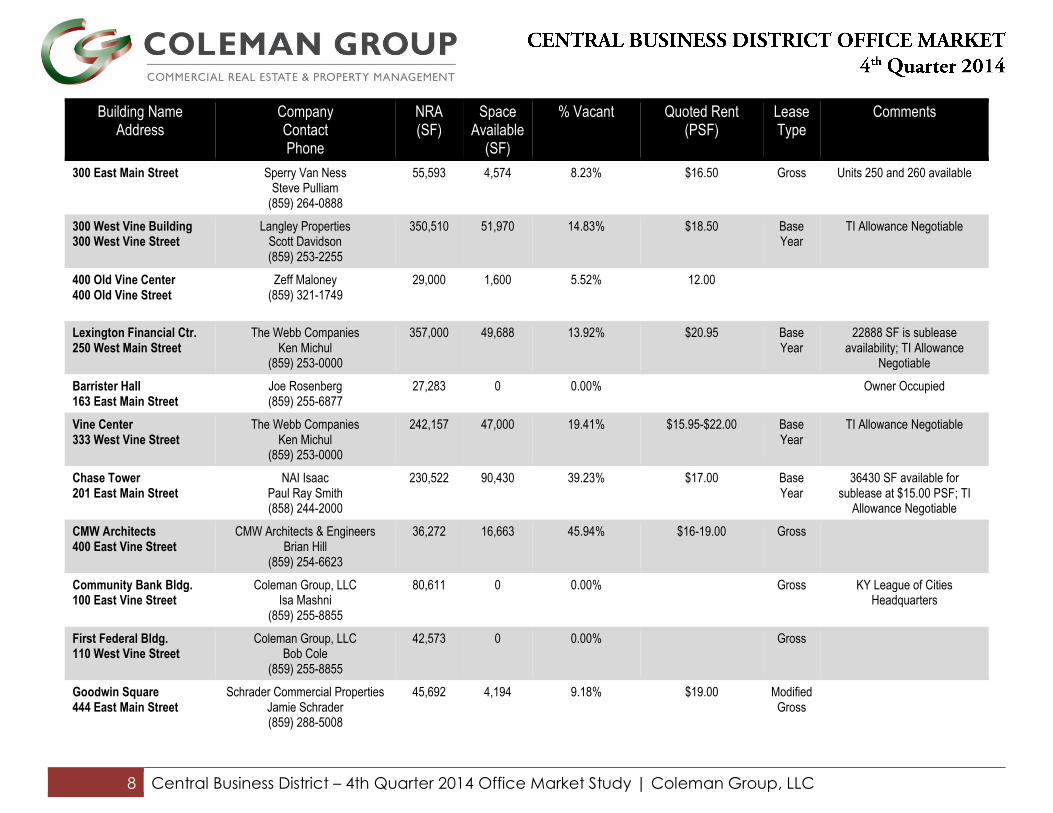
Building Name Address
Company Contact Phone
NRA (SF)
Space Available
(SF)
% Vacant Quoted Rent (PSF)
Lease Type
Comments
300 East Main Street Sperry Van Ness Steve Pulliam
(859) 264-0888
55,593 4,574 8.23% $16.50 Gross Units 250 and 260 available
300 West Vine Building 300 West Vine Street
Langley Properties Scott Davidson (859) 253-2255
350,510 51,970 14.83% $18.50 Base Year
TI Allowance Negotiable
400 Old Vine Center 400 Old Vine Street
Zeff Maloney (859) 321-1749
29,000 1,600 5.52% 12.00
Lexington Financial Ctr. 250 West Main Street
The Webb Companies Ken Michul
(859) 253-0000
357,000 49,688 13.92% $20.95 Base Year
22888 SF is sublease availability; TI Allowance
Negotiable
Barrister Hall 163 East Main Street
Joe Rosenberg (859) 255-6877
27,283 0 0.00% Owner Occupied
Vine Center 333 West Vine Street
The Webb Companies Ken Michul
(859) 253-0000
242,157 47,000 19.41% $15.95-$22.00 Base Year
TI Allowance Negotiable
Chase Tower 201 East Main Street
NAI Isaac Paul Ray Smith (858) 244-2000
230,522 90,430 39.23% $17.00 Base Year
36430 SF available for sublease at $15.00 PSF; TI
Allowance Negotiable
CMW Architects 400 East Vine Street
CMW Architects & Engineers Brian Hill
(859) 254-6623
36,272 16,663 45.94% $16-19.00 Gross
Community Bank Bldg. 100 East Vine Street
Coleman Group, LLC Isa Mashni
(859) 255-8855
80,611 0 0.00% Gross KY League of Cities Headquarters
First Federal Bldg. 110 West Vine Street
Coleman Group, LLC Bob Cole
(859) 255-8855
42,573 0 0.00% Gross
Goodwin Square 444 East Main Street
Schrader Commercial Properties Jamie Schrader (859) 288-5008
45,692 4,194 9.18%
$19.00
Modified Gross
9 Central Business District – 4th Quarter 2014 Office Market Study | Coleman Group, LLC
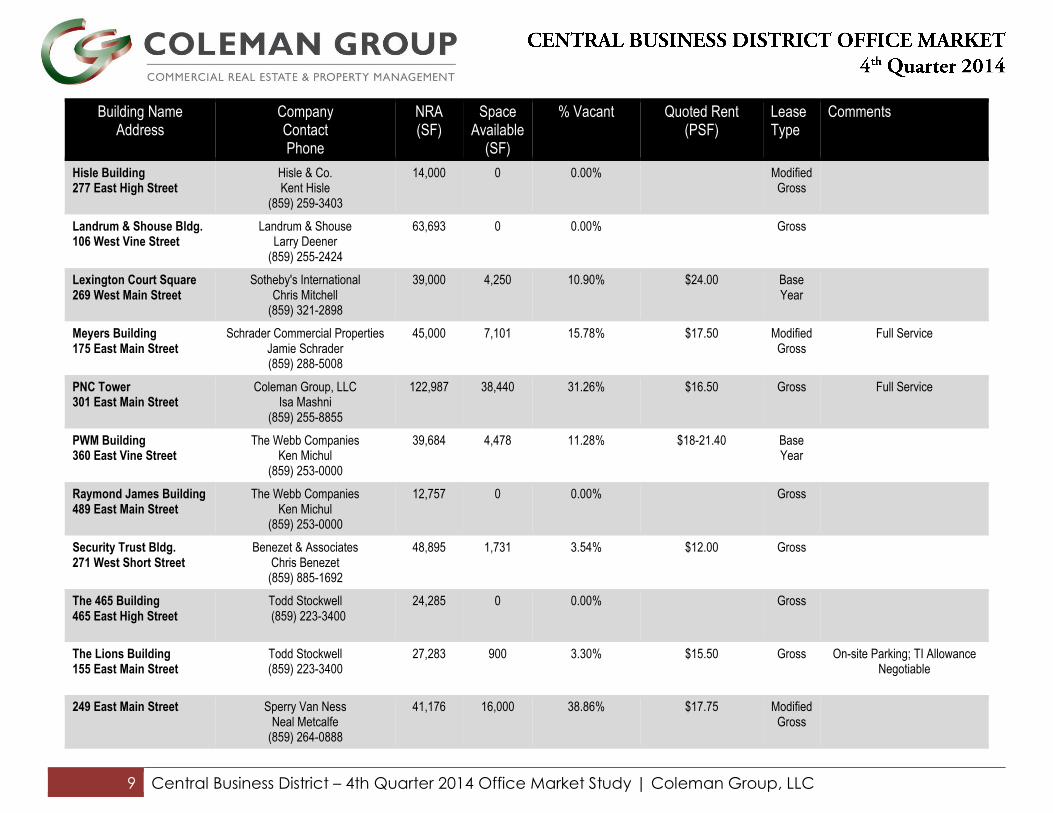
Building Name Address
Company Contact Phone
NRA (SF)
Space Available
(SF)
% Vacant Quoted Rent (PSF)
Lease Type
Comments
Hisle Building 277 East High Street
Hisle & Co. Kent Hisle
(859) 259-3403
14,000 0 0.00% Modified Gross
Landrum & Shouse Bldg. 106 West Vine Street
Landrum & Shouse Larry Deener
(859) 255-2424
63,693 0 0.00% Gross
Lexington Court Square 269 West Main Street
Sotheby's International Chris Mitchell
(859) 321-2898
39,000 4,250 10.90% $24.00 Base Year
Meyers Building 175 East Main Street
Schrader Commercial Properties Jamie Schrader (859) 288-5008
45,000 7,101 15.78% $17.50 Modified Gross
Full Service
PNC Tower 301 East Main Street
Coleman Group, LLC Isa Mashni
(859) 255-8855
122,987 38,440 31.26% $16.50 Gross Full Service
PWM Building 360 East Vine Street
The Webb Companies Ken Michul
(859) 253-0000
39,684 4,478 11.28% $18-21.40 Base Year
Raymond James Building 489 East Main Street
The Webb Companies Ken Michul
(859) 253-0000
12,757 0 0.00% Gross
Security Trust Bldg. 271 West Short Street
Benezet & Associates Chris Benezet
(859) 885-1692
48,895 1,731 3.54% $12.00 Gross
The 465 Building 465 East High Street
Todd Stockwell (859) 223-3400
24,285 0 0.00% Gross
The Lions Building 155 East Main Street
Todd Stockwell (859) 223-3400
27,283 900 3.30% $15.50 Gross On-site Parking; TI Allowance Negotiable
249 East Main Street Sperry Van Ness Neal Metcalfe
(859) 264-0888
41,176 16,000 38.86% $17.75 Modified Gross
10 Central Business District – 4th Quarter 2014 Office Market Study | Coleman Group, LLC
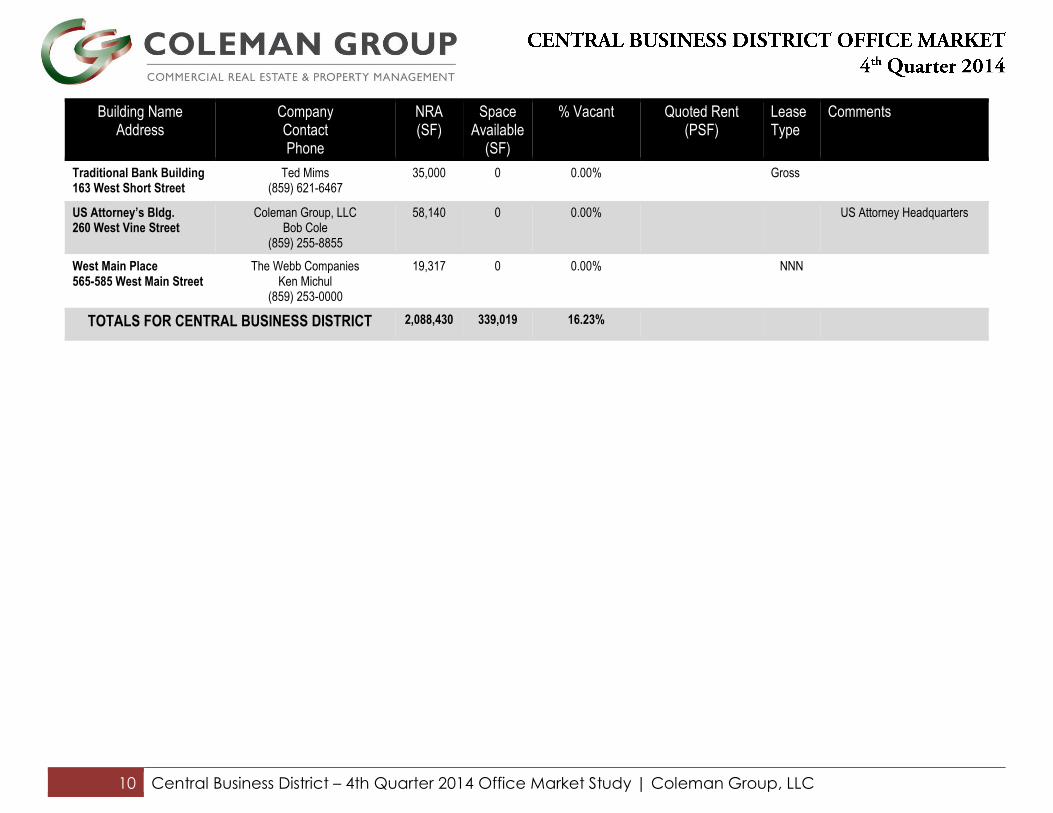
Building Name Address
Company Contact Phone
NRA (SF)
Space Available
(SF)
% Vacant Quoted Rent (PSF)
Lease Type
Comments
Traditional Bank Building 163 West Short Street
Ted Mims (859) 621-6467
35,000 0 0.00% Gross
US Attorney’s Bldg. 260 West Vine Street
Coleman Group, LLC Bob Cole
(859) 255-8855
58,140 0 0.00% US Attorney Headquarters
West Main Place 565-585 West Main Street
The Webb Companies Ken Michul
(859) 253-0000
19,317 0 0.00% NNN
TOTALS FOR CENTRAL BUSINESS DISTRICT 2,088,430 339,019 16.23%