Embed Size (px)
Citation preview

CENTRAL BANK OF NIGERIA
FINANCIAL MARKETS DEPARTMENT
Half Year Activity Report
2016

ii
Vision Statement
To be one of the most effective central bank financial markets franchise in
the world.
Mission Statement
To deepen the Nigerian financial markets by ensuring that they are global,
organized, liquid, diversified and transparent.
Mandate
To intervene effectively in the money and foreign exchange markets in order
to achieve monetary policy objectives
To conduct auctions in government securities, Central Bank of Nigeria
securities and foreign exchange for effective liquidity management
To obtain timely market intelligence reports on the impact of monetary
policy decisions and promote the development of efficient markets
To develop instruments to deepen the financial markets
To monitor activities in the financial markets

iii
Table of Contents
Financial Markets Department Vision, Mission and Mandate i
Contents ii
Foreword vi
Preface vii
1.0 OVERVIEW 1
1.1 Global Economy 1
1.1.1 Outlook for the Second Half of 2016 2
1.2 Domestic Economy 2
1.3 Monetary Policy 4
1.4 Nigerian Financial Markets Operations 4
1.4.1 Money Markets 4
1.4.2 Foreign Exchange Market 5
1.4.3 Capital Market Developments 6
1.5 Federal Government Domestic Debt 6
1.6 Activities of Internal and Inter-Agency Committees 7
1.7 Guidelines and Circulars 7
2.0 DOMESTIC MONEY MARKET OPERATIONS 8
2.1 Liquidity Management 8
2.1.1 Open Market Operations 9
2.1.1.1 Open Market Operations Auctions 10
2.1.1.2 Two-Way Quote Trading in Nigerian Treasury Bills 11
2.1.2 Discount Window Operations 11
2.1.2.1 Repurchase Transactions 11
2.1.2.2 Central Bank of Nigeria Standing Facilities 12
(i) Standing Lending Facility 12
(ii) Standing Deposit Facility 13
2.1.2.3 Rediscounting of Bills 13
2.2 Inter-Bank Funds Market 14
2.3 Interest Rates Movement 14
2.4 Central Bank of Nigeria Promissory Notes 16
3.0 FOREIGN EXCHANGE MARKET OPERATIONS 18
3.1 Official Foreign Exchange Market 19
3.2 Retail Dutch Auction System 20
3.3 Bureaux-de-Change 21
3.4 Foreign Exchange Rate Movement 21
4.0 CAPITAL MARKET DEVELOPMENTS 25
4.1 Nigerian Stock Market 25
4.1.1 All Share Index and Market Capitalisation 25
4.1.2 Market Turnover 27
4.1.3 New and Supplementary Listings and Delisting 27

iv
5.0 FEDERAL GOVERNMENT DOMESTIC DEBT 29
5.1 Nigerian Treasury Bills 29
5.1.1 Structure of Nigerian Treasury Bills Holdings 31
5.2 Federal Republic of Nigeria Treasury Bonds 31
5.3 Federal Government of Nigeria Bonds 31
5.4 Over-the-Counter Transactions 32
5.4.1 Over-the-Counter Transactions in Nigerian Treasury Bills 32
5.4.2 Over-the-Counter Transactions in Federal Government 33
of Nigeria Bonds
5.5 Domestic Debt Charges 33
5.6 Asset Management Corporation of Nigeria Bonds 34
6.0 ACTIVITIES OF INTERNAL AND INTER_AGENCY COMMITTEE 34
6.1 Liquidity Assessment Group 34
6.2 Non-interest Financial Institution Product Development Committee 35
6.3 Fiscal and Liquidity Assessment Committee 35
6.4 Financial Stability Report Committee 36
6.5 Financial Services Regulatory Coordinating committee 36
6.6 Nigerian Inter-bank Offered Rate Committee 37
6.7 Non-Interest Banking 37
7.0 MAJOR DEVELOPMENTS IN THE NIGERIAN FINANCIAL MARKETS 38
7.1 Review of Cash Reserve Ratio 38
7.2 Review of Foreign Currency Trading Position Limit 38
7.3 Adoption of Flexible Exchange Rate Policy 39
7.4 Nigeria’s Debt Management Strategy 41
7.5 Treasury Dealing Room Project 41
7.6 Suspension of Foreign Exchange Sale to BDC 41
7.7 E-Dividend Mandate Management System 42
7.8 NSE Induction of Qualified Clerk 42
7.9 NSE Reviewed Composition of Market Indices 42
7.10 NSE Received Award for Promoting Financial Literacy 43
7.11 NASDAQ Smart Market Surveillance 44
7.12 NSE Admitted to Gold Community of Global Reporting Initiative 44
7.13 NSE and LSE Hold Capital Market Conference 45
7.14 NSE Host Building African Financial Market Seminar 45
APPENDICES Index of Financial Markets Regulatory Circulars/Guidelines 45
Non-Interest Financial Institutions Format for Submission of Request 47

v
List of Tables
Page 2.1 OMO Subscription and Sale 46
2.2 Two-Way Quote Trading in NTBs 47
2.3 Repurchase Transactions 48
2.4 Daily Average Standing Lending Facility (N) 49
2.5 Daily Average Standing Deposit Facility (N) 50
2.6 Inter-Bank Placements and Securities Trading (N’Billion) 51
2.7 Monthly Money Market Rates (Per cent per Annum) 52
2.8 Promissory Notes 53
3.1 Inter-bank, Wholesale/Retail Dutch Auction System (US$’Million) 54
3.2 Average w/rDAS, Inter-bank and BDC Rates (US$) 55
3.3 Average w/rDAS, Inter-bank and BDC Rates (US$) 56
3.4 rDAS, Interbank, BDC and Forward Sales, 57
4.1 The Nigerian Stock Exchange Monthly Opening and Closing Transactions 58
4.2 Quarterly Distribution of Transactions on the Nigerian Stock Exchange 59
4.3 Sectoral Distribution of Transactions on the Nigerian Stock Exchange 60
4.4 Foreign Portfolio Participation in Equity Trading 61
4.5 New Listing, Supplementary Listing and Delisting 62
4.6 GDP (%) of Selected Countries 63
5.1 Nigerian Domestic Debt: Class of Holders 64
5.2 Primary Market: Nigerian Treasury Bills Transactions (N’Billion) 65
5.3 Nigerian Treasury Bills: Class of Holders 66
5.4 Federal Republic of Nigeria Treasury Bonds: Class of Holders 67
5.5 Federal Government of Nigeria Bonds Issue 68
5.6 Federal Government of Nigeria Bonds Outstanding 70
5.7 Federal Government of Nigeria Bonds Outstanding: Class of Holders 71
5.8 Over-the-Counter Transactions in Nigerian Treasury Bills 72
5.9 Over-the-Counter Transactions in Federal Government of Nigeria Bonds 73
5.10 Domestic Debt Charges (N’Billion) 74
List of Figures 2.1 OMO Transactions, January – June 2016 10
2.2 OMO Transactions, January – June 2015 11
2.3 Money Market Rates, January – June 2016 15
2.4 Money Market Rates, January – June 2015 16
3.1 Inter-bank Transactions, January – June 2016 20
3.2 RDAS Transactions, January – June 2015 21
3.3 Inter-Bank and BDC Rates, January – June 2016 22
3.4 RDAS, Inter-Bank and BDC Rates, January – June 2015 23
3.5 Average Rate Premium, January – June 2016 23
3.6 Average Rate Premium from WDAS, January – June 2015 24
5.1 Primary Market Auction, January – June 2016 29
5.2 Primary Market Auction, January – June 2015 29
BOX INFORMATION
The Impact of Brexit on the Nigerian Financial Markets 22

vi
List of Abbreviations
ASI- All Share Index
ASEA – African Securities Exchange Association
AMCON – Asset Management Corporation of Nigeria
BAS – Bond Auction System
BAFM – Building African Financial Markets
BDCs- Bureau-de-Change
BOF- Budget Office of the Federation
BVN- Bank Verification Number
CAC- Corporate Affairs Commission
CBN- Central Bank of Nigeria
CRR- Cash Reserve Ratio
CSCA- CBN Safe Custody Account
DHs- Discount Houses
DMBs- Deposit Money Bank
DMO- Debt Management Office
DVP – Delivery Versus Payment
ETF- Exchange Traded Funds
FAAC – Federation Account Allocation Committee
FIRS- Federal Inland Revenue Service
FLAC- Fiscal and Liquidity Assessment Committee
FMD- Financial Markets Department
FMDA- Financial Markets Dealers Association
FMDQ- Financial Markets Dealers Quotation
FMF- Federal Ministry of Finance
FRNTBs - Federal Republic of Nigeria Treasury Bonds
FSR- Financial Stability Report
FSRCC- Committee, Financial Services Regulation Coordinating Committee
FSS- Financial Markets, Financial System Strategy
FXPDs – Foreign Exchange Primary Dealers
GDP- Gross Domestic Product
GRI – Global Reporting Initiative

vii
ICPC- Independent Corrupt Practices and other offences Commission
ILF- Intraday Liquidity Facility
LAG- Liquidity Assessment Group
LR – Liquidity Ratio
LSEG- London Stock Exchange Group
MC- Market Capitalisation
MPR- Monetary Policy Rate
MPC- Monetary policy Committee
NAICOM- National Insurance Commission
NASDAQ - National Association of Securities Dealers Automated Quotations System’s
NBS- National Bureau of Statistics
NCS- Nigeria Customs Service
NCX- Nigeria Commodity Exchange
NDF – Non- Deliverable Forward
NIBOR- Nigerian Interbank Offered Rate
NIFIPDC- Non-Interest Financial Institutions Products Development Committee
NNPC- Nigerian National Petroleum Corporation
NSE- Nigerian Stock Exchange
NTBs- Nigerian Treasury Bills
OAGF- Office of the Accountant-General of the Federation
OBB – Open Buy Back
OMO- Open Market Operations
OTC- Over-the-Counter
PENCOM- Pension Commission
RDAS- Retail Dutch Auction System
RTGS- Real Time Gross Settlement Real Time Gross Settlement
S4- Scripless Securities Settlement System
SDF- Standing Deposit Facility
SEC- Security Exchange Commission
SLF- Standing Lending Facility
SMEDAN- Small and Medium Enterprises Development Commission
TSA – Treasury Single Account

viii
TRFXTS – Thompson – Reuters Foreign Exchange Trading System
USA- United States of America

ix
FOREWORD
The dwindling price of crude oil and other commodities at the international market
which commenced in 2014, continued in the first half of 2016, and adversely
affected growth in most emerging and commodity exporting countries. The upturn
in economic performance in the United States of America also influenced the flow
of foreign capital from emerging markets, to the US. These resulted in varying
pressures on the currencies of most developing markets as their currencies saw
various levels of depreciation. The Nigerian economy was not spared as it had its
own share of the pressures and depreciation of the local currency, the Naira. The
conduct of the general elections in the review period provided its own challenges
as liquidity injections increased significantly and anxieties over the outcome
constrained investment decisions.
These developments influenced decisions of the monetary authority during the
review period. The retail Dutch auction system (RDAS) was closed in the first
quarter of the year, and, the Bank channeled foreign exchange demand to the
interbank segment of the market. Also, restriction was placed on some import
items from accessing the Nigerian foreign exchange market, to help preserve the
external reserves and enhance domestic production capabilities of small and
medium enterprises. The cash reserve requirement (CRR) ratios on public and
private sector deposits were harmonised, while, the monetary policy rate was
maintained at 13 per cent. Liquidity management and other operations were
equally carried out to ensure monetary and price stability.
Details of activities carried out by the Bank are contained in this half year Activity
Report, which also has a rich compendium of data that would be very useful to
scholars and the general public.
Dr. (Mrs.) Sarah Omotunde Alade
Deputy Governor, Economic Policy

x
PREFACE
In furtherance of efforts to document its activities and enlighten the public in line
with the Bank’s policy on information dissemination and transparency in the
conduct of its operations, the Financial Markets Department, produced the half
year Activity Report, 2016. This is the seventh in the series of publications,
detailing monetary policy objectives, decisions and implementation.
The report has eight chapters. Chapter one provides an overview, while chapter
two examines operations in the domestic money market. Chapter three addresses
transactions in the foreign exchange market, while chapter four focuses on
developments in the capital market. The conduct of Federal Government domestic
debt activities is captured in chapter five; committee activities and stakeholder
collaborations in chapter six; and, major developments in the Nigerian financial
markets in seven. The appendix contains the list of guidelines and circulars issued
in the first half of 2016.
I remain grateful to the Management of the Bank for their continued support and
enablement and the staff of the Department for their steadfastness, commitment
and loyalty.
Dr. Alvan Ikoku Enyinanya
Director, Financial Markets Department
1
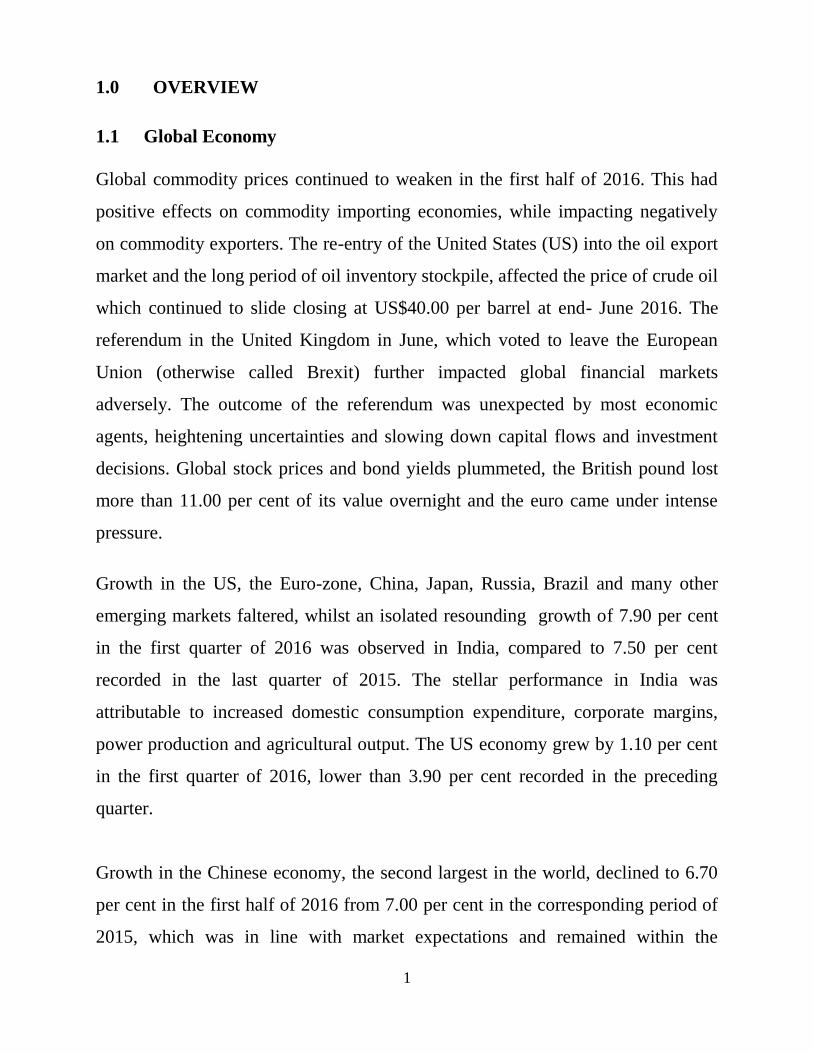
1.0 OVERVIEW
1.1 Global Economy
Global commodity prices continued to weaken in the first half of 2016. This had
positive effects on commodity importing economies, while impacting negatively
on commodity exporters. The re-entry of the United States (US) into the oil export
market and the long period of oil inventory stockpile, affected the price of crude oil
which continued to slide closing at US$40.00 per barrel at end- June 2016. The
referendum in the United Kingdom in June, which voted to leave the European
Union (otherwise called Brexit) further impacted global financial markets
adversely. The outcome of the referendum was unexpected by most economic
agents, heightening uncertainties and slowing down capital flows and investment
decisions. Global stock prices and bond yields plummeted, the British pound lost
more than 11.00 per cent of its value overnight and the euro came under intense
pressure.
Growth in the US, the Euro-zone, China, Japan, Russia, Brazil and many other
emerging markets faltered, whilst an isolated resounding growth of 7.90 per cent
in the first quarter of 2016 was observed in India, compared to 7.50 per cent
recorded in the last quarter of 2015. The stellar performance in India was
attributable to increased domestic consumption expenditure, corporate margins,
power production and agricultural output. The US economy grew by 1.10 per cent
in the first quarter of 2016, lower than 3.90 per cent recorded in the preceding
quarter.
Growth in the Chinese economy, the second largest in the world, declined to 6.70
per cent in the first half of 2016 from 7.00 per cent in the corresponding period of
2015, which was in line with market expectations and remained within the

2
government’s targeted range of between 6.50 and 7.00 per cent for 2016. The
decline was traceable to increase in consumer demand as China tried to reset its
export-led economy to one based on services and domestic consumption. The
contribution of domestic consumption increased from 4.20 to 4.90 per cent during
the period.
The recession in Brazil and Russia continued though both managed to slow down
on the rate of deceleration. The Brazilian economy experienced a contraction in
private sector investment, government expenditure and household consumption,
leading to its eighth consecutive quarterly decline in GDP. The GDP contracted to
minus 5.40 per cent in the first quarter of 2016. In the previous quarter, it stood at
minus 5.90 per cent. The economy experienced high unemployment rate, which led
to political turmoil, amongst others. In the same vein, the Russian economy
receded for the fourth consecutive quarter, with GDP at minus 1.20 per cent in the
first quarter of 2016. Growth contracted by 3.80 per cent in the fourth quarter of
2015. Consumer spending shrank by 4.30 per cent, government expenditure by
1.50 percent and inventory accumulation dropped by 9.90 percent in the first
quarter 0f 2016.
GDP growth in South Africa decelerated in the first quarter of 2016 to minus 1.20
per cent, from 0.40 per cent in the preceding quarter. The deceleration was due to
steep decline in mining and quarrying, and agriculture. Severe drought impacted
negatively on the agricultural sector, while increased political uncertainty, low
commodity prices and sustained volatility in the Rand further constrained
economic growth.

3
1.2 Domestic Economy
Developments in the external and local environment impacted on the Nigerian
economy, leading to negative growth of minus 2.06 per cent in the second quarter
of the year, down from a growth rate of minus 0.36 per cent in the preceding
quarter, and 2.35 per cent in the second quarter of 2015. The contraction in the first
and second quarter, the first since second quarter 2004, was below the 1.70 per
cent growth forecast for the period. In the review period, government revenue
plummeted, petroleum products were scarce, power supply remained epileptic,
demand pressures in the foreign exchange market persisted, foreign reserves
dropped, inflation soared by 6.86 per cent from January to 16.48 per cent in June.
Additionally, disruptions in oil exploitation as a result of restiveness in the Niger
Delta and agricultural activities due to attacks on farming communities by
herdsmen across the country and the insurgency in the northeast constrained
economic performance.
Appropriate measures to rejuvenate the economy included the passage of a
reflationary budget with emphasis on diversification of the economy, infrastructure
development and enhanced security. Other measures included the intensification of
fiscal revenue drive, termination of subsidy on petroleum products, upward review
of electricity tariff as well as the introduction of a flexible exchange rate regime,
which resulted in the movement of the naira exchange rate from N196.95.00/US$
to N280.00/US$ on June 20, 2016.

4
1.2.1 Outlook for the Second Half of 2016
Global oil and commodity prices are projected to rebound gradually, owing to a
combination of factors: Cuts in output and supply as a result of high cost of shale
oil production, disruptions from Nigeria and the Middle East, and increased
demand from China and India, whose economies are projected to accelerate in
output performance. The impact of Brexit would depend on the outcome of the
negotiations between the UK and EU, upon the activation of Article 50 by the
former (See Box Information).
In the meantime, new investment decisions in the EU are likely to remain on hold
while the financial markets would be cautious due to uncertainties. Projections by
the World Bank estimate that the Nigerian economy will decline to minus 1.8 per
cent at end 2016. This was attributable to liquidity concerns in the foreign
exchange market as a result of stifled oil receipts and investor confidence as well
as low power generation, lingering security concerns and restiveness in the Niger
Delta region, amongst others. Nonetheless, with clement weather conditions,
coupled with probable security measures to contain disturbances in farming
communities, agricultural produce and harvest would be favourable. In addition,
the impact of the 2016 reflationary budget is expected to positively affect
economic activities as release of funds to government agencies for the
implementation of both capital projects and the social intervention schemes,
permeate the system.

5
1.3 Monetary Policy
The stance of monetary policy during the period remained restrictive, relying
predominantly on traditional instruments, supported by prudential provisions to
deliver on the Bank’s mandate of price and financial system stability.
Consequently, the Monetary Policy Committee (MPC) revised the Monetary
Policy Rate (MPR) upward from 11.00 to 12.00 per cent, and cash reserve ratio
(CRR) from 20.00 to 22.50 per cent, and adjusted the asymmetric corridor to
+200/-500 basis points, from +200/-700 basis points, for Standing Lending Facility
and Standing Deposit Facility, respectively. The net foreign currency trading
position limit was equally reviewed from a maximum of 0.5 per cent, to an
asymmetric limit of +0.5/-10 per cent of shareholders’ funds unimpaired by losses
during the introduction of a flexible exchange rate regime on June 20, 2016.
1.4 Nigerian Financial Markets Operations
1.4.1 Money Markets
The level of money market transactions and rates during the period reflected the
trend in liquidity flows in the banking system, which was influenced largely by
fiscal injections, reserve ratio adjustments, interventions in the foreign exchange
market and open market operations, amongst others. Consequently, the total value
of transactions in the market stood at N513.11 billion in the first half of 2016,
compared with N2,809.58 billion in the corresponding period of 2015 representing
8.73 per cent decline. The value of the unsecured call transactions in the review
period amounted to N309.57 billion or 60.33 per cent, while open buy back (OBB)
transactions accounted for the balance N203.54 billion.
The movement in money market rates, both the inter-bank call and OBB rates,
were largely stable in the first quarter, but became more volatile in the second
quarter following the upward review of MPR from 11.00 to 12.00 per cent in
March and debits to banks’ accounts due to the foreign exchange rate adjustment
6
and clearance of backlogs in demand of up to US$4.14 billion in both spot and
forwards.
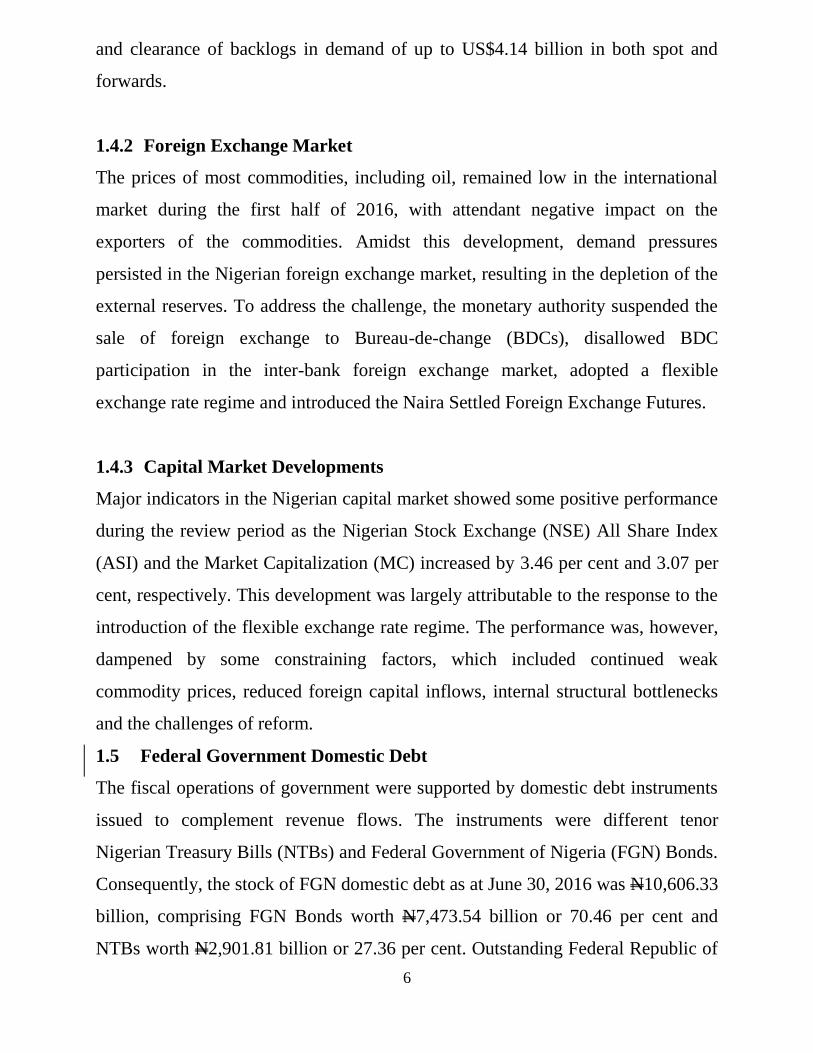
1.4.2 Foreign Exchange Market
The prices of most commodities, including oil, remained low in the international
market during the first half of 2016, with attendant negative impact on the
exporters of the commodities. Amidst this development, demand pressures
persisted in the Nigerian foreign exchange market, resulting in the depletion of the
external reserves. To address the challenge, the monetary authority suspended the
sale of foreign exchange to Bureau-de-change (BDCs), disallowed BDC
participation in the inter-bank foreign exchange market, adopted a flexible
exchange rate regime and introduced the Naira Settled Foreign Exchange Futures.
1.4.3 Capital Market Developments
Major indicators in the Nigerian capital market showed some positive performance
during the review period as the Nigerian Stock Exchange (NSE) All Share Index
(ASI) and the Market Capitalization (MC) increased by 3.46 per cent and 3.07 per
cent, respectively. This development was largely attributable to the response to the
introduction of the flexible exchange rate regime. The performance was, however,
dampened by some constraining factors, which included continued weak
commodity prices, reduced foreign capital inflows, internal structural bottlenecks
and the challenges of reform.
1.5 Federal Government Domestic Debt
The fiscal operations of government were supported by domestic debt instruments
issued to complement revenue flows. The instruments were different tenor
Nigerian Treasury Bills (NTBs) and Federal Government of Nigeria (FGN) Bonds.
Consequently, the stock of FGN domestic debt as at June 30, 2016 was N10,606.33
billion, comprising FGN Bonds worth N7,473.54 billion or 70.46 per cent and
NTBs worth N2,901.81 billion or 27.36 per cent. Outstanding Federal Republic of

7
Nigeria (FRN) Treasury Bonds worth N230.99 billion constituted the remaining
2.18 per cent. In view of the increase in debt stock, the cost of servicing Federal
Government debt also rose by 22.01 per cent to N617.36 billion at end-June 2016,
when compared to N506.00 billion at end-June 2015.
1.6 Committee Activities and Stakeholder Collaboration
During the review period, the Financial Markets Department continued to
collaborate with both internal and external stakeholders to develop the financial
markets infrastructure, ensure effective and efficient implementation of monetary
policy decisions and promote financial system stability. These were anchored by
some work groups and committees, vis-à-vis the Liquidity Assessment Group
(LAG), Scripless Securities Settlement Working Group, Non-Interest Financial
Institutions’ Product Development Committee, Financial Stability Report (FSR)
Committee, Fiscal and Liquidity Assessment Committee (FLAC), Financial
Services Regulation Coordinating Committee (FSRCC), Financial System Strategy
(FSS) 2020 Committee and Treasury Dealing Room Project Committee.
1.7 Other Developments in the Nigerian Financial Markets
Various actions taken by other regulatory authorities impacted the Nigerian
financial markets and influenced the conduct of transactions. These included
policies aimed at developing the payments system, deepening the capital and
commodity markets and effective management of foreign exchange for financial
system stability.

8
1.8 Guidelines and Circulars
Some guidelines and circulars were issued to operators in the markets between
January and June, 2016. A list of these guidelines and circulars are provided in this
report and can be accessed on the CBN website, www.cbn.gov.ng.

9
2.0 DOMESTIC MONEY MARKET OPERATIONS
The activities in the money market supported the liquidity management operations
of the CBN for the purpose of attaining optimal bank reserves levels and
moderating the impact on price stability. They also serve to support the financial
system in maintaining stability, soundness and promoting financial intermediation.
Inter-bank interest rates oscillated in tandem with the interaction of market forces,
the impact of monetary policy decisions and liquidity conditions.
2.1 Liquidity Management
The money market was liquid for the most part of the first half of 2016 as the flow
of funds in the last half of 2015 permeated. Liquidity was bolstered by maturing
CBN Bills and NTBs. Consequently, OMO auctions were conducted on need basis
to reduce the excess liquidity in order to achieve price stability.
The liquidity trend reversed towards the end of June 2016 following the
commencement of the flexible exchange rate regime that was accompanied by the
clearance of the backlog of US$4.14 billion foreign exchange demand. This
culminated in a huge debit to the accounts of the banks for the settlement of the
foreign exchange sold to them by the CBN.
Beside the OMO auctions, statutory reserve ratios, i.e. the Cash Reserve
Requirement (CRR) and Liquidity Ratio (LR), were applied to contain excess
liquidity. The MPC, at its bi-monthly meeting held in March 2016, increased the
CRR by 250 basis points, from 20.00 to 22.50 per cent. This resulted in immediate
withdrawal of N340.11 billion from the banking system. In addition, the MPR was
also revised upward by 100 basis points to 12.00 from 11.00 per cent, and the
corridor of standing facilities was narrowed to +200/ -500 basis points from the
+200 / -700 basis points. During the May 2016 meeting, CRR was retained at

10
22.50 per cent, MPR at 12.00 per cent and the standing facilities corridor at +200/ -
500 basis points. In addition, the meeting announced the introduction of greater
flexibility in managing the foreign exchange rate.
Furthermore, to aid short term liquidity management in the money market, Intraday
Liquidity Facility (ILF) was accessible as a temporary facility to banks to fund
their needs during the business day. SLF and SDF were also available for the
DMBs to square up their positions at the close of business day.
2.1.1 Open Market Operations
OMO remained the major instrument for
liquidity management in the first half of
2016, and was used to moderate excess
liquidity, boost tradable securities, and
deepen secondary market activities.
2.1.1.1 Open Market Operations Auctions
CBN Bills offered at the open market amounted to N1,922.45 billion, while total
public subscription and sale amounted to N3,867.94 billion and N2,329.75 billion,
respectively, compared with N2,080.00 billion, N5,355.00 billion and N4,261.72
billion offered, subscribed to and sold respectively, in the corresponding period of
2015 (Table 2.1; Figure 2.1 and 2.2). The low level of activity was attributable to
the low disbursements to the three tiers of government by the Federation Account
Allocation Committee (FAAC) and the reduced number of auctions during the
period as a result of low oil revenue. Thus, the cost of liquidity management in the
review period dropped to N122.99 billion compared to N323.55 billion in the
corresponding period in the previous year.
The tenors of OMO auction ranged from 143 to 364 days, at stop rates of between
7.60 to 13.50 per cent. In the preceding year, the tenors were between 91 to 301
days at stop rates of between 11.45 and 14.85 per cent.
During the May 2016 meeting,
CRR was retained at 22.50 per
cent, MPR at 12.00 per cent and
the standing facilities corridor at
+200/ -500 basis points. In
addition, the meeting announced
the introduction of greater
flexibility in managing the
exchange rate.

11
Figure 2.1
Open Market Operations, January – June 2016
Figure 2.2
Open Market Operations, January – June 2015
-
100.00
200.00
300.00
400.00
500.00
600.00
700.00
800.00
900.00
1,000.00
January February March April May June
Offer 270.00 200.00 354.86 440.00 201.65 455.94
Subscription 913.26 630.89 706.99 710.30 365.70 540.80
Sales 698.42 509.23 394.63 363.72 64.63 299.12
N'Bi
llion
-
200.00
400.00
600.00
800.00
1,000.00
1,200.00
1,400.00
1,600.00
1,800.00
January February March April May June
Offer 510.00 220.00 360.00 300.00 290.00 400.00
Subscription 1,657.29 318.99 620.84 1,027.45 719.16 1,011.26
Sales 1,295.88 217.33 543.86 933.74 524.54 746.37
N'B
illio
n

12
2.1.1.2 Two-Way Quote Trading in Nigerian Treasury Bills
There was no transaction at the two-way quote trading segment during the review
period, just as in the corresponding period of 2015. Activity at the segment has
been passive since 2011 when a net purchase of N750.00 million was recorded
owing to a shift in the Bank’s operational strategy and the impact it had on
activities in the money market.
2.1.2 Discount Window Operations
2.1.2.1 Repurchase Transactions
There was no request for repo in the review period as the available money market
liquidity was sufficient to meet funding requirements during the period.
In the corresponding period in the previous year, the sum of N54.38 billion was
requested. The interest earned was N441.38 million with rates ranging from 16.00
to 16.50 per cent and tenors ranging from 5 to 43 days (Table 2.3).
2.1.2.2 Central Bank of Nigeria Standing Facilities
All the authorized dealers at the CBN window continued to access the Standing
Facilities to square up their positions either through the SLF or SDF. Transactions
at the window showed high patronage of the SDF until June 20, 2016, following
the settlement of the sale of foreign exchange to the banks under the new exchange
rate regime. The applicable rates for the SLF and SDF varied as the MPR and
associated asymmetric corridor changed within the period.
(i) Standing Lending Facility
The SLF requests were granted to dealers at the window in order to enable them
accommodate temporary liquidity shortages. The average daily request for SLF
amounted to N43.70 billion (inclusive of Intraday Liquidity Facility (ILF) that was
converted to SLF) in the 82 transaction days between January 4 and June 30, 2016,
while the actual daily requests ranged from N0.19 billion to N420.56 billion. The

13
request peaked towards the end of June 2016 due to the liquidity tightness that
accompanied the commencement of the flexible exchange rate regime. Total
interest earned during the period was N3.51 billion, at rates between 13.00 and
14.00 per cent.
In comparison, during the corresponding period of the previous year, average
daily SLF amounted to N29.41 billion during the 89 transaction-days, with N1.86
billion total interest earned at 15.00 per cent (Table 2.4).
(ii) Standing Deposit Facility
The SDF window provided an opportunity for surplus funds to be invested at the
CBN on overnight basis. Thus, the daily average request for SDF stood at N103.34
billion, while total interest paid was N0.14 billion at interest rates of between 4.00
per cent, from January 1 to March 21, 2016, and 7.00 per cent, from March 22 to
June 30, 2016. This compared with the daily average SDF of N79.57 billion, and
total interest payment of N0.23 billion at
11.00 per cent during the first half of 2015
(Table 2.5).
The restriction of N7.5 billion maximum
remunerable SDF per bank remained
during the review period as well as the
corresponding period of 2015.
2.1.2.3 Rediscounting of Nigerian Treasury Bills To relieve the impact of
liquidity squeeze precipitated by the foreign exchange sales at the introduction of
new flexible exchange rate regime CBN Bills worth N35.36 billion were
rediscounted during the period. The tenors of the instruments ranged from 27 to
188 days. Interest income from the transactions amounted to N1.71 million at rates
ranging from 16.25 to 17.15 percent.
In the corresponding period of last year, no rediscounting took place due to the
liquidity surfeit in the system (Table 2.9).
Transactions at the window showed
high patronage at the SDF until June
20, 2016, after which there was a
reversal following the settlement of the
sale of foreign exchange to banks at
the new exchange rate.

14
2.2 Inter-bank Funds Market
The total value of funds traded in the
market stood at N513.11 billion in the first
half of 2016, compared with N2,809.58
billion in the corresponding period of 2015.
The value of the unsecured call transactions
in the review period amounted to N309.57
billion or 60.33 per cent, while open buy back (OBB) transactions accounted for
the balance, N203.54 billion or 39.67 per cent. In the corresponding period of
2015, the unsecured and OBB segments accounted for N956.63 billion or 34.05 per
cent, and N1,852.95 billion or 65.95 per cent, respectively. The low patronage in
the review period when compared with the first half of 2015 was attributable to the
availability of liquidity in the inter-bank market (Table 2.6).
2.3 Interest Rates Movement
The movement in money market rates, both at the inter-bank call and OBB
segments, were largely stable in the first quarter. They became more volatile in the
second quarter, following the upward review of the MPR from 11 to 12 per cent
and the CRR from 20.00 to 22.50 per cent in March. The substantial withdrawals
from the banking system as a result of the settlement of foreign exchange
transactions with the introduction of flexible exchange rates contributed to the
volatility. Thus, the weighted average monthly inter-bank call rates ranged from
2.30 to 29.91 per cent, while the average monthly OBB rates ranged from 2.90 to
21.75 per cent in the first half of 2016.
The total value of funds traded
in the market stood at N513.11
billion in the first half of 2016, compared with N2,809.58 billion in
the corresponding period of 2015.

15
The weighted average monthly rates at the overnight call segment were 2.75, 2.30,
4.32, 4.00, 7.68, and 29.91 per cent in January, February, March, April, May and
June 2016 respectively. On actual basis however, the inter-bank call rates ranged
between 0.50 to 120.00 per cent, with the lowest levels observed in January and
February, while the highest rate was recorded in June.
The weighted average monthly OBB rates were 2.90, 3.18, 3.14, 10.0 and 21.75
per cent, respectively, for January, February, March, May and June 2016. No OBB
rate was recorded in April 2016, because there was no transaction at the segment.
The individual OBB rates had a similar pattern as the call rates, but recorded a high
of 40.00 per cent in June. (Table 2.7; Figure 2.3 and 2.4)
Figure 2.3
Money Markets Rates, January – June 2016
0.00
5.00
10.00
15.00
20.00
25.00
30.00
35.00
January February March April May June
Per
cen
t
Inter-bank Call Inter-Bank Tenored NIBOR (7-Day) NIBOR (30-Day) OBB MPR

16
Figure 2.4
Money Market Rates, January – June 2015
2.4 Central Bank of Nigeria Promissory Notes
No Promissory Notes were issued in the first half of 2016 same as in the
corresponding period of 2015. The non-issuance of Promissory Notes was due to
the effective resolution of outstanding liabilities assumed by healthy deposit
money banks from the banking system consolidation.
0
5
10
15
20
25
30
35
January February March April May June
Perc
ent
Inter-Bank Call Inter-Bank Tenored NIBOR (7-Day) NIBOR (30-Day) OBB MPR

17
Box Information
The Effects of Brexit on the Nigerian Financial Markets Nigeria has always had close ties with the UK. The National Bureau of Statistics (NBS) reported that the UK was one of
Nigeria’s largest trade partners and its largest source of foreign investment in 2015, with assets worth over US$3.6 billion.
Remittances from Nigerians in the UK were approximately US$21 billion, while UK/Nigeria bilateral trade was approximately
US$8.00 billion in 2015. The bilateral trade is projected to grow to US$27.00 billion by 2020 and the exit is likely to exacerbate
this further. If the effects of Brexit are not well managed by Nigeria, the positive expectations may not crystalise.
The Brexit comes at a bad time for Nigeria, which is reeling from the aftermath of plummeted oil prices. Low effective UK
demand could lead to lower demand for oil and further depress prices. In addition, the insurgency in the Niger Delta coupled
with Nigeria’s downgrade by Fitch has increased global risk aversion towards Nigeria.. Thus, while there may be gains for
Nigerian companies that import from the UK on bilateral basis, the risk aversion towards the country may stifle fresh inflows
from the UK.
If Brexit leads to a smaller UK, the country’s appetite for capacity to absorb Nigeria’s export would be highly constrained, with
apparent attendant effects on financial flows. As a member of the British Commonwealth, Nigeria has strong economic and
financial ties with Britain. However, prior to the Brexit, trade between the two countries had been on a decline due to the
general weakness in the global economy. Recent data revealed that the UK accounted for 4.2 per cent (or N284bn) of total
imports to Nigeria in 2015 compared to 6.6 per cent (or N370bn) in 2012. Trade is further expected to decline because of
contraction in UK output.
Uncertainties will likely remain until Britain’s exit from the EU is finalized. If not appropriately handled, this could cause
volatility in global financial markets and the contagion may also affect the Nigerian financial market. On one hand, investment
in Britain may be less attractive as it would no longer offer access to the unified EU market. In addition, without ease of access
via Britain, free trade access may become more challenging for the country. On the other hand, however, a weaker pound could
lend some attraction. Nigeria may benefit, technically from the depreciation of the pound sterling, in terms of settling pounds
sterling obligations. In the long run, the exact long term effects of Brexit cannot be dimensioned fully.
There are also possible indirect negative effects. Brexit would likely further weaken the EU economy, especially as the UK
accounts for approximately 15 per cent of EU’s operational budget. The import of this is that a weaker Europe would not only
reduce trade, but also financial flows to a developing economy like ours with large proportion of its foreign reserves in US
dollars.
For a win-win situation, the Bank should be proactive in developing robust strategies for mitigating the adverse effects of the
exit. A good strategy is to use this opportunity for intensive advocacy to attract foreign investment into the country.

18
3.0 FOREIGN EXCHANGE MARKET OPERATIONS
The fall in global oil price, which continued throughout the first half of the year
had a negative impact on financial markets worldwide. Following the glut in oil
supply at the international market and re-entry of the US into the oil export market,
the price of crude oil witnessed a downward trend from July 2014, closing at
US$40.00 per barrel at end June 2016. Furthermore, developments in the global
and domestic environment had negative impact on the local economy, as demand
pressures in the foreign exchange market persisted, threatening a rapid depletion of
the foreign reserves and depreciation of the local currency.
3.1 Developments in the Foreign Exchange Market
Demand pressures persisted at the foreign exchange market in the face of weak
exports and earnings. This compelled the CBN to introduce new policies to
effectively manage the market and stall the depletion of the foreign reserve. Some
of such policies included the suspension of foreign exchange sale to BDCs,
prevention of BDC participation in the inter-bank foreign exchange market,
adoption of flexible exchange rate regime and introduction of Naira Settled
Foreign exchange Futures.
The Nigerian foreign exchange market witnessed tremendous demand
pressures in the face of dwindling inflows. These posed fundamental
challenges to monetary policy and the achievement of price stability. The
managed float strategy was, therefore, replaced by a flexible exchange rate
mechanism towards the end of the first half of 2016. Furthermore, derivative
products were expanded in the market with the introduction of long tenured
forwards and over-the-counter futures to assuage the spot market and
enhance hedging and risk management capabilities of participants in the
foreign exchange markets. The thrusts were, in addition, geared towards
stimulating expenditure switching in the domestic economy.

19
3.2 Foreign Exchange Market
The CBN continued to intervene at the interbank segment of the market with sales
and purchases for the review period amounting to US$5.73 billion and US$30.00
million, respectively. Sales at the inter-bank forward amounted to US$3.49 billion,
while there was no matured obligation. These resulted in a net sale of US$ 5.70
billion as at June 30, 2016 (Table 3.1). The CBN sold US$1.09 billion via
interventions at the market during the managed float exchange rate regime.
On June 15, 2016, the CBN introduced the flexible exchange rate regime, which
allows the forces of demand and supply to determine the rate of exchange. At the
same time, the CBN introduced Naira Settled Foreign Exchange Futures, which are
Non-Deliverable Forward (NDF) transactions, where counterparties settle the naira
difference between spot rate and forward rate at maturity. The foreign exchange
futures are traded on the FMDQ OTC Securities Exchange platform.
The operationalization of the new regime involved the appointment of foreign
exchange primary dealers (FXPDs) and non-primary dealers. The CBN
reintroduced the two-way quote transaction. The reintroduced transaction involved
standard amounts of US$10.00 million for the spot and US$5.00 million each for
forwards, foreign exchange swaps and OTC FX futures. All demand must be
transaction-based. The conditions for the appointment of FXPDs included the
fulfillment of minimum Shareholders Fund unimpaired by losses of N200.00
billion, N400.00 billion in total foreign currency assets and minimum liquidity
ratio of 40.00 per cent.
3.3 Retail Dutch Auction System/Inter-bank Market Spot During the review
period, there was no sale at the RDAS, as against the US$3.18 billion in the first
half of 2015. This was due to the suspension of the RDAS on 18th February, 2015
and the recourse to inter-bank transactions alone. Consequently, transactions at the

20
inter-bank foreign exchange market during the first half of 2016 compared with the
corresponding levels in 2015, where sales and purchases at the inter-bank
amounted to US$9.42 billion and US$582.03 million, respectively. The foreign
exchange rate at the inter-bank opened at N197.00/US$ in January 4, 2016 and
closed at N283.00.00/US$ on June 30, 2016. On the average, the exchange rate
remained unchanged at N197.00/US$ from January till May, but was N231.76/US$
in June (Table 3.2; Figure 3.1 and 3.2).
Figure 3.1
Inter-bank Transactions, January – June 2016

21
Figure 3.2
RDAS and Inter-bank Transactions, January- June 2015
*Following the closure of the RDAS segment on February 18, 2015, transactions were not consummated from February 19, 2015.
3.4 Bureaux-de-Change
The direct sale of foreign exchange by the CBN to the BDCs was discontinued on
January 11, 2016. However, the Bank continued to monitor the movement of
exchange rate at that segment of the market. The BDC exchange rate opened at
N268.00/US$ and closed at N348.00/US$ at end-June 2016. On the average, the
exchange rate opened at N289.78/US$ in January and closed at N351.82/US$ in
June (Table 3.2).
3.5 Foreign Exchange Rate Movement
The movement in the monthly average of foreign exchange rate at the inter-bank
segment of the market was constant at N197.00/US$ from January 4 to June 19,
2016. The exchange rate depreciated by 29.64 per cent to N280.00/US$ on June
20, 2016 with the commencement of the flexible foreign exchange market, and
closed at N283.00.00/US$ on June 30, 2016.
0
500
1000
1500
2000
2500
3000
3500
4000
4500
5000
January February March April May June
Amount offered (US$'million) 1700 1200
Amount Demanded (US$'million) 4874.63 3773.5
Amount Sold at wDAS (US$'million) 1987.4 1197.14
Amount Sold at the Inter-bank 853.8 2151.02 1866.06 1360.66 1856.64 1448.5
US$
''Illi
on

22
At the BDC segment, the average monthly exchange rate movement was more
volatile. The rate was N289.78/US$ in January and depreciated steadily to
N351.82/US$ in June (Table 3.2; Figure 3.3 and 3.4).
Arising from the variation in exchange rate movements between the inter-bank and
the BDC markets, the premium in exchange rate moved from 92.78 per cent in
January to 132.83 per cent in February, and decelerated to 123.71 per cent in April.
It however, turned up to 139.93 per cent in May and closed at 120.06 per cent in
June (Table 3.2; Figure 3.5 and 3.6).
Figure 3.3
Inter-bank and BDC Rates, January – June 2016
January February March April May June
Inter-Bank 197.00 197.00 197.00 197.00 197.00 231.76
BDC 289.78 329.83 320.93 320.71 336.93 351.82
0.00
50.00
100.00
150.00
200.00
250.00
300.00
350.00
400.00
N/U
S$

23
Figure 3.4
RDAS-SPT, Inter-Bank and BDC Rates, January - June 2015
Following the closure of the RDAS segment on February 18, 2015, transactions were not consummated from February 19,2015
Figure 3.5
Average Rate Premium between BDC and Inter-Bank, January-June 2016
January February March April May June
wDAS-SPT (incl. 1% comm.) 169.68 169.68
Inter-Bank 181.7835 194.48 197.0727273 197 197 196.9159091
BDC 196.125 213.025 222.9318182 210.7 219.5526316 218.9772727
0
50
100
150
200
250
N/U
S$
January February March April May June
Premium b/w BDC and Inter-bank 92.78 132.83 123.93 123.71 139.93 120.06
BDC Premium Percentage (RHS) 47.09 67.43 62.91 62.80 71.03 51.80
0.00
20.00
40.00
60.00
80.00
100.00
120.00
140.00
160.00
N/U
S$

24
Figure 3.6
Average Rate Premium between BDC and RDAS-SPT, and BDC and Inter-bank,
January - June 2015
Following the closure of the RDAS segment on February 18, 2015, transactions were not consummated from February 19, 2015.
January February March April May June
BDC Premium Percentage (RHS) 7.89 9.54 13.12 6.95 11.45 11.20
BDC Premium Percentage (RHS) 14.34 18.55 25.86 13.70 22.55 22.06
0.00
5.00
10.00
15.00
20.00
25.00
30.00N
/US$

25
4.0 CAPITAL MARKET DEVELOPMENTS
4.1 Nigerian Stock Market
The performance of the market during the review period was lackluster during
most of the period as major indicators such as the NSE ASI and MC fell in the first
five months, but increased towards end June. The slowdown was occasioned by
weak domestic economic activities, precipitated by energy crisis, reduced capital
inflows, foreign exchange shortages, delay in the passage of the 2016 Federal
Government (FG) Budget, insurgency and increased cost of doing business. The
low participation of foreign investors during the period also affected the
performance in the market.
4.1.1 All Share Index and Market Capitalisation
The NSE ASI opened at 28,370.32 in January and closed at 29,597.79 in June
2016, representing an increase of 1,227.47 or 4.33 per cent. Similarly, the MC of
the equities increased by N 0.30 trillion or 3.07 per cent, from N9.76 trillion at the
beginning of the year to N10.06 trillion at end-June, 2016. A more detailed
analysis revealed that the ASI opened at 28,370.32 in January and closed at
27,663.16 in May. It further dropped to 26,910.23 at the beginning of June, but
closed higher at 29,597.79 due mainly to the positive response to the
The performance of the Nigerian capital market as reflected by the major
indicators, the Nigerian Stock Exchange (NSE) All Share Index (ASI),
Market Capitalization (MC) and volume of transactions fluctuated in
response to developments in the global and domestic economy in general
and the financial markets in particular. The challenges included weak oil
price, reduced foreign investment, internal structural bottlenecks and
resistance to reforms in the capital market, amongst others. The negative
trend was, however, doused by the salutary initial response to the new
foreign exchange regime at the end of the review period.

26
implementation of flexible exchange rate regime in the third week of the month.
The movement in the MC reflected a similar pattern as the ASI.
In 2015, the ASI fell by 1,200.32 or 3.46 per cent, from 34,657.15 to 33,456.83,
while the MC decreased by N0.07 trillion or 0.61 per cent from N11.49 trillion in
January to N11.42 trillion, between January and end-June.
The value and volume of transactions oscillated during the review period.
However, the value of transactions which opened at N0.07 billion in January
closed at N3.70 billion in June, while the volume of transactions rose from 0.09
billion units to 0.44 billion units during the same period (Tables 4.1).
Foreign investor participation in the market averaged 49.09 per cent, compared
with the 52.78 per cent in the first half of 2015. Arising from this development the
total value of foreign portfolio inflows into the market stood at N158.60 billion as
against N285.40 billion in the corresponding period of 2015. The value of foreign
portfolio outflow stood at N147.92 billion as against N302.59 billion in the
preceding period (Tables 4.4)
4.1.2 Market Turnover
The turnover of transactions on the NSE indicated that 61.49 billion shares valued
at N358.19 billion were traded in 505,613 deals during the first half of 2016. This
compared with the performance during the corresponding period of 2015, which
recorded 49.53 billion shares valued N550.11 billion in 526,848 deals. The
increased volume of transactions during the review period reflected the
comparatively lower value of the equities traded.

27
In the bonds segment of the NSE market, 438,078 units of FGN Bonds valued
N490.14 million were traded in 112
deals. On the Exchange Traded Funds
(ETF) segment, 2.89 million units
were traded at N235.34 million in
826 deals. No trades were recorded in the Corporate and State Government bonds
markets during the review period (Table 4.3).
On quarterly basis, the volume of trades on the Exchange was higher in 2016 when
compared with the corresponding period of 2015, while the contrary applied in
respect of the value of the associated trades. The trend was occasioned by the fall
in prices of the assets traded.
4.1.3 New and Supplementary Listings and Delisting
The NSE admitted the following new securities: two companies, two state
government bonds and two Federal Government of Nigeria (FGN) Bonds in the
first half of 2016. Eight supplementary listings were also recorded comprising
FGN bonds, additional shares and special placement by two companies. In
addition, a bank was delisted from the NSE for non-compliance with regulatory
requirements, while two companies were delisted as a result of mergers (Table
4.5).
No trades were recorded in the Corporate
and State Government bonds market during
the review period

28
5.0 FEDERAL GOVERNMENT DOMESTIC DEBT
5.1 Nigerian Treasury Bills
NTBs issued and allotted during the review period was N2,457.28 billion apiece,
indicating an increase of N223.48 billion or
10.00 per cent over the level in the
corresponding period of 2015. The increase
was attributable to the issuance of new NTBs
to finance fiscal deficit. Total public
subscription, however, stood at N5,057.39
billion in the review period, compared to N5,213.20 billion in the corresponding
period of 2015. The structure of holdings of the instrument indicated that DMBs
(including foreign investors) took up N1,679.69 billion or 68.36 per cent, mandate
and internal funds customers (including CBN branches) N683.38 billion or 27.81
per cent, discount houses N66.22 billion or 2.69 per cent and CBN take-up of
N28.00 billion or 1.14 per cent (Table 5.2; Figures 5.1 and 5.2).
The fiscal operations of government were supported by domestic debt. Nigerian
Treasury Bills and Federal Government of Nigeria Bonds were issued to fund the
fiscal deficit. Consequently, the stock of FGN domestic debt as at June 30, 2016
was N10,606.33 billion comprising FGN Bonds worth N7,473.54 billion or 70.46
per cent, NTBs worth N2,901.81 billion or 27.36 per cent and FGN Treasury
Bonds worth N230.99 billion or 2.18 per cent.
The successful bid rates in the
market ranged from 4.0000 to
9.9948 per cent for the 91-day,
6.9900 to 12.3000 per cent for the
182-day and 8.0500 to 14.9990 per
cent for the 364-day tenors.
29
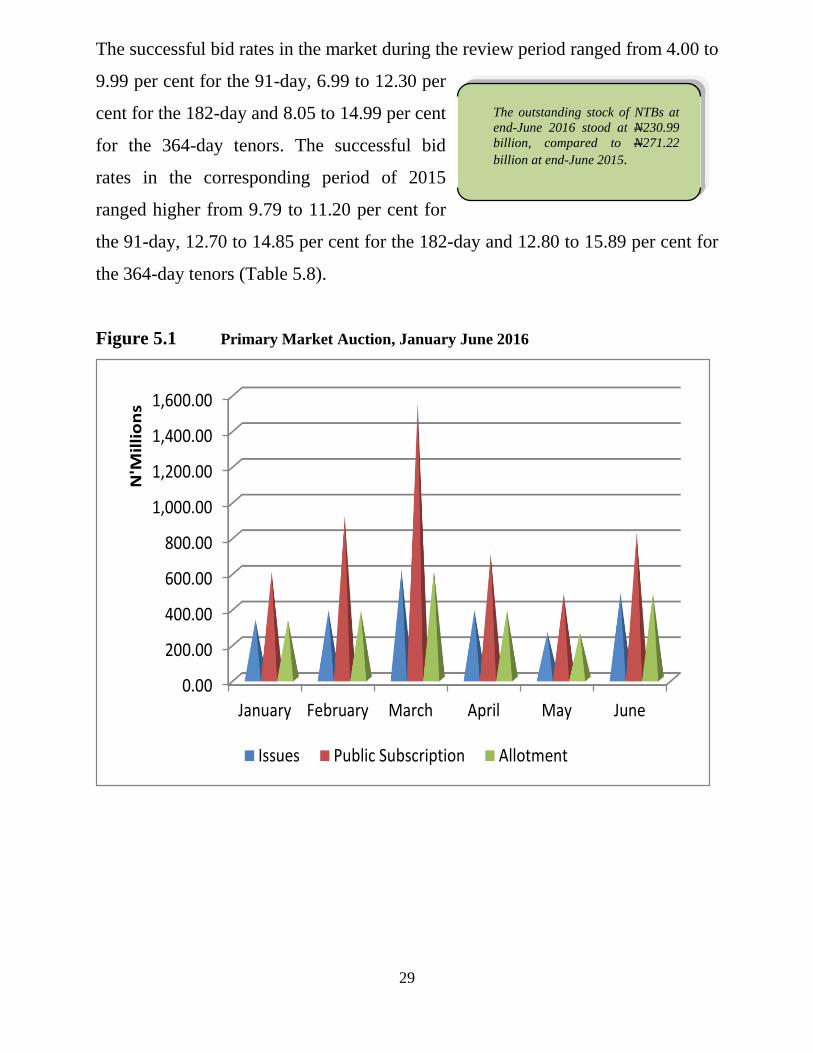
The successful bid rates in the market during the review period ranged from 4.00 to
9.99 per cent for the 91-day, 6.99 to 12.30 per
cent for the 182-day and 8.05 to 14.99 per cent
for the 364-day tenors. The successful bid
rates in the corresponding period of 2015
ranged higher from 9.79 to 11.20 per cent for
the 91-day, 12.70 to 14.85 per cent for the 182-day and 12.80 to 15.89 per cent for
the 364-day tenors (Table 5.8).
Figure 5.1 Primary Market Auction, January June 2016
0.00
200.00
400.00
600.00
800.00
1,000.00
1,200.00
1,400.00
1,600.00
January February March April May June
N'M
illi
on
s
Issues Public Subscription Allotment
The outstanding stock of NTBs at
end-June 2016 stood at N230.99
billion, compared to N271.22
billion at end-June 2015.

30
Figure 5.2
Primary Market Auction, January – June 2015
5.1.1 Structure of Outstanding Nigerian Treasury Bills Holdings
The holdings of NTBs outstanding indicated
that DMBs accounted for 38.41 per cent of the
total at end-June 2016 compared to 36.11 per
cent in 2015.The Mandate and Internal
Account customers (parastatals) accounted for
58.20 per cent, discount houses 2.32 per cent, while the CBN accounted for 1.07
per cent (Table 5.3).
0.00
200.00
400.00
600.00
800.00
1,000.00
1,200.00
January February March April May June
N'M
illi
on
s
Issues Public Subscription Allotment
The total value of FGN Bonds
outstanding at end-June 2016
was N8,153.96
billion,compared to N5,300.42
billion at end-June 2015.

31
5.2 Federal Republic of Nigeria Treasury Bonds
There was no new issue of the Federal Republic of Nigeria Treasury Bonds
(FRNTBs) in the period under
review, as the Federal Government
relied on the issuance of FGN bonds
to raise needed funds. Hence, the
outstanding stock of the instrument at
end-June 2016 stood at N230.99
billion, compared to N271.22 billion
at end-June 2015. The decline in the amount outstanding was due to the
redemption of N40.23 billion bonds as at end 2015. A breakdown of the amount
outstanding showed that the CBN held N81.81 billion, while N149.18 billion was
held in the Sinking Fund (Table 5.4).
5.3 Federal Government of Nigeria Bonds
Total FGN Bonds offered to the public was N590.00 billion, while public
subscription and sale stood at N1,183.83 billion and N529.50 billion, respectively,
during the review period (Table 5.5). The amount offered comprised new issues
and re-openings of FGN Bonds series 1, 2 and 4. The huge subscription in the bond
market was attributable to the level of liquidity in the banking system and
investors’ favourable appetite for long-term instruments.
The total value of FGN Bonds outstanding at end-June 2016 was N8,153.96
billion, compared to N5,300.42 billion at end-June, 2015, indicating an increase of
N2,853.54 billion or 53.84 per cent (Table 5.6). The structure of holdings of the
FGN Bonds showed that N2,884.55 billion or 35.38 per cent was held by DMBs
and DHs, while the non-bank public held the balance N5,269.41 billion (Table
5.7).
The cost of domestic debt
instruments of the FGN stood at
N617.36 billion at end-June
2016, representing an increase
of 22.01 per cent when compared to N506.00 billion at
end-June 2015

32
5.4 Over-the-Counter Transactions
5.4.1 Over-the-Counter Transactions in Nigerian Treasury Bills (OTC)
OTC transactions in NTBs during the first half of 2016 amounted to N18,595.33
billion, indicating a decrease of N2,578.89 billion or 12.18 per cent over the level
of N21,174.23 billion in the same period of 2015. The transactions were executed
on the Financial Market Dealers Quotation OTC platform (Table 5.9).
5.4.2 Over-the-Counter Transactions in Federal Government of Nigeria
Bonds
OTC transactions in FGN Bonds during the first half of 2016 amounted to
N4,974.39 billion, indicating an increase of N631.53 million or 14.54 per cent over
the level of N4,342.86 billion in the same period of 2015 (Table 5.9).
5.5 Domestic Debt Charges
The cost of domestic debt instruments of the FGN stood at N617.36 billion at end-
June 2016, representing an increase of 22.01 per cent when compared to N506.00
billion at end-June 2015. The increase in cost of debt was as a result of the rise in
the stock of the FGN domestic debt from N8,396.59 billion at end-June 2015 to
N10,606.33 billion at end-June 2016 (Table 5.1). A breakdown of the cost showed
that FGN Bonds coupon payments accounted for N381.13 billion or 61.74 per cent,
while interest on NTBs stood at N219.93 billion or 35.62 per cent and FRN
Treasury Bonds, N16.30 billion or 2.64 per cent (Table 5.10).

33
5.6 Asset Management Corporation of Nigeria Bonds
Asset Management Corporation of Nigeria (AMCON) Bonds were fully repaid to
the public in December 2014, in a restructuring exercise that led to the conversion
of N3.8 trillion into 6.00% AMCON Notes for the CBN to hold as sole investor , to
mature in 2023. Thus, CBN remained the only holder of AMCON Bonds within
the period under review.

34
6.0 Activities of Internal and Inter-Agency Committees
6.1 Liquidity Assessment Group
The Liquidity Assessment Group continued to assess the daily liquidity position in
the banking system in order to determine appropriate monetary action to ensure
optimal level of liquidity in the system and smooth functioning of the financial
markets. The membership of the group includes Heads of Division and Office in
the Financial Markets Department.
6.2 Scripless Securities System Project
During the review period, the Scripless Securities Settlement System (S4)
facilitated transactions in government and CBN securities by enhancing Delivery
versus Payment (DvP) and minimizing risks of failed trades.
Currently, the Bank is developing the interface architecture that would enable
FMDQ OTC Plc send and monitor secondary market transactions for settlement on
S4 to improve transparency in the Nigeria Financial Markets. Similarly,
Management has approved the development of interface for DMO’s Bond Auction
System (BAS) with S4. This is to enable them settle auctioned FGN securities on
S4.
The department constituted and participated in various intra- and inter-
department committees in order to facilitate the achievement of the
objectives of monetary policy implementation and ensure financial sector
development and stability. In addition, it collaborated with internal and
external stakeholders to further develop the Nigerian financial markets.

35
6.3 Fiscal and Liquidity Assessment Committee
The Committee met every Thursday and deliberated on the flow of funds in the
economy, assessed the effects on interest, exchange and inflation rates, and
identified actions to keep them at desired levels.
6.4 Financial Stability Report Committee
The Committee reviewed the developments in the Nigerian financial system for the
period, January to June, 2016 and produced the Report that highlighted the
soundness of the financial system, potential risks and efforts made at sustaining its
safety and stability. It also included outlook for the second half of the year on
developments that might impact the Nigerian financial system and likely remedial
action.
6.5 Financial Services Regulation Coordinating Committee (Sub-
Committee on Financial Markets)
Entrenched in the CBN Act, 2007, the Financial Services Regulation Coordinating
Committee (FSRCC) continued to meet and deliberate on issues that will foster a
safe, sound and resilient Nigerian financial system, and to engender harmonious
collaboration among regulators in the Nigerian financial system.
6.6 Nigeria Inter-Bank Offered Rate
The Financial Markets Dealers Quotation (FMDQ) Over-the-Counter Plc, has
continued to facilitate the computation of the Nigeria Inter-bank Offered Rate
(NIBOR) after it assumed function to do so from its promoter, the Financial
Markets Dealers Association (FMDA). The NIBOR rates serve as indicative
benchmarks to guide pricing of funds in the inter-bank market.

36
6.7 Non-Interest Banking
Towards sustaining the development of non-interest banking in Nigeria, the Bank
continued to operationalize its products available to non-interest banks.
Consequently, the CBN Safe Custody Account (CSCA) was utilized during the
period, by the only full-fledged non-interest bank. Based on the features of CSCA,
funds placed in the account at the CBN are for custodial purposes and the Bank is
under no obligation to pay any returns. However, the Bank has the discretion to
offer a gift (or hibah) if it so chooses. As a result, the Bank paid the sum of N41.74
million to a non-interest bank that placed N21.50 billion in the last half of the
preceding year.

37
7.0 Major Developments in the Nigerian Financial Markets
7.1 Review of Cash Reserve Requirement
7.1 Review of Cash Reserve Ratio and Monetary Policy Rate
The CRR, MPR and standing facilities corridor were adjusted once in the review
period by the MPC. The CRR and the MPR were increased to 22.50 per cent and
12.00 per cent with the asymmetric corridor at +200 / -500 around the MPR, from
20.00 per cent, 11.00 per cent and +200 /-700, respectively, in January 2016. The
development was in an attempt to curtail inflationary spiral and attract competitive
investment flows. Secondly, during the review period, the MPC voted unanimously
to adopt greater flexibility in the exchange rate policy to restore the adjustment
properties of the exchange rate.
7.2 Review of Net Foreign Currency Trading Position Limit
The net foreign currency trading position limit was reviewed from 0.5 to +0.5/-10
per cent of shareholders’ funds un-impaired by losses, on June 15, 2016. This was
aimed at checking speculative activities in the foreign exchange market and
moderating the pressures on the exchange rate. The adjustment followed the
implementation of the flexible foreign exchange rate regime.
Various actions taken by other regulatory authorities impacted the
Nigerian financial markets and influenced the conduct of transactions.
These included policies aimed at developing the payments system,
deepening the capital and commodity markets and effective management of
foreign exchange for financial system stability.

38
7.3 Adoption of Flexible Exchange Rate Policy
In view of the dwindling foreign exchange resource flow and the contraction in
external reserve balance, pressures on foreign exchange demand persisted under
the managed float exchange rate regime. As a result, a review of the policy resulted
in the adoption of a flexible exchange rate management regime. Highlights of the
implementation modalities for the new approach include the following:
The application of a single market rate, determined by the forces of demand
and supply, for all spot transactions (private or public) in the inter-bank
market.
All foreign exchange demand must be transaction-backed, executed using
the Thomson-Reuters Foreign Exchange Trading System (TRFXTS), or any
other system approved by the CBN, on a two-way quotes basis.
The CBN would participate in the market through periodic interventions to
either buy or sell foreign exchange as the need arises.
Participants in the market would be appointed by the CBN as Authourised
Dealers (Foreign Exchange Primary Dealers (FXPD) and Non-Primary
Dealers).The FXPDs deal directly with the CBN on large trade sizes, as well
as with other participants in the market.
There will be no predetermined spread on foreign exchange spot transactions
executed through the CBN intervention with primary dealers, while all
foreign exchange spot purchases by the authorized dealers are transferable in
the inter-bank market.
The 41 items previously classified as “Not Valid for Foreign Exchange” by
the CBN circular remain inadmissible in the Nigerian foreign exchange
market.

39
Long-tenored foreign exchange Forwards of up to 12 months were
introduced to enhance liquidity in the market.
Naira-settled Non-Deliverable Over-the-counter (OTC) Futures were
introduced to moderate exchange rate volatility and reduce Spot demand.
The OTC Foreign Exchange Futures shall be in non-standardized amounts
and different fixed tenor.
Proceeds of foreign investment inflows and international money transfers
shall be purchased by authorized dealers at the prevailing inter-bank
exchange rate.
Non-oil export proceeds are to be sold freely in the inter-bank market.
7.4 Other Activities of the Financial Services Regulation Co-ordinating
Committee
The FSRCC carried out other notable actions during the review period, which
include the following:
(a) Examination of Financial Holding Companies
The FSRCC conducted Knowledge of Business and Risk Assessment Summary
working sessions to aid consolidated examination of Financial Holding
Institutions. The institutions were FBN Holding, Stanbic IBTC Holding and
FCMB Group which operate a group structure and are scheduled for annual
examination.
(b) National Road Map on Sustainable Finance
The FSRCC approved the National Sustainable Finance Principles and Roadmap
that was developed by the Harmonisation and Coordination Sub-Committee. The
implementation of the roadmap is expected to span 30 months.
(c) Fight Against Illegal Fund Managers /Wonder Banks

40
Through its Legal and Enforcement Sub-Committee, the FSRCC, resolved all
reported cases against the Illegal Fund Managers (IFMs)/Wonder Banks. The
expeditious resolution of cases was facilitated by the appointment of liquidators
and timely disbursement of escrowed amounts to claimants, with the exception of
IFMs/Wonder Banks that have pending litigations.
(d) Framework For Domestic Systemically Important Financial Institutions
Under the Financial Sector Soundness Sub-Committee, the FSRCC initiated the
development of a framework to designate Domestic Systemically Important
Financial Institutions (D-SIFIs). The significance of this is the promotion of
supervisory processes to upscale their standards.
7.5 Nigeria’s Debt Management Strategy, 2016-2019
The Debt Management Office released a new Debt Management Strategy, 2016 -
2019, to guide borrowing decisions of the federal and state governments’ external
debts, and federal government’s domestic debt and financing needs. The strategy
aims to optimally fund federal government’s primary balance, i.e. the difference
between revenue and expenditure, excluding debt service. Thus, the strategy
provided a new structure in the composition of borrowings at 60 per cent in the
domestic market, down from 84 per cent; and an increase to 40 per cent at the
international market from the previous level of 16 per cent. The strategy further
provided that of the domestic component, a maximum of 25 per cent and minimum
of 75 per cent would be for the short and long terms, respectively, as against 31 per
cent and 69 per cent, in the preceding arrangement. The proposed increase in the
share of external borrowing was attributable to the declining external reserves and
the need to avoid private sector crowding out.
7.6 Treasury Dealing Room Project Committee
The Treasury Dealing Room continued its operations in financial markets and
reserve management. With the commencement of the flexible exchange rate

41
regime, the CBN participates in the market on a two-way quote basis via the
TRFXTS. This has effectively enhanced transactions in the market and availed
market participants with relevant information for decision making, online real-
time.
7.7 Suspension of Foreign Exchange Sale to BDCs
The CBN suspended the sale of foreign exchange to BDCs on January 10, 2016,
owing to the fact that it observed that the operators had abandoned the original
objective of their licensing, which was to serve retail end users who need
US$5,000 or less, thereby creating unnecessary arbitrage in the market. Another
reason for the suspension was to curtail rapid depletion of the reserves. As such,
the CBN refunded the mandatory caution fee of N35.00 million per BDC to them.
7.8 E-Dividend Mandate Management System
The 90-day deadline for cost-free registration for electronic dividend payment by
investors in the Nigerian capital market lapsed in March 2016. Thereafter, a fee of
N100.00 came into effect. This followed the pronouncement of the policy by the
Securities and Exchange Commission on December 14, 2015. The electronic
dividend payment policy was adopted in July 2015 by SEC, in collaboration with
the CBN and NIBSS, and was followed by massive sensitization on the need to
register on the e-Dividend Mandate Management System (E-DMMS). The e-
dividend policy aimed at reducing the quantum of unclaimed dividend and
enhancing compliance with the Direct Cash Settlement.
7.9 Enhancements in the Capital Market
Some operational changes were carried out by the Nigerian Stock Exchange during
the review period, and include the following.
(a) Review of NSE Indexes

42
In line with the biannual review exercise, the NSE examined its indexes and
revised the composition of equities in some cases. The outcome of the review is as
indicated in Table 1 below.
Table 1: Changes in NSE Indexes
Indexes Incoming Exiting
1 NSE 30 index UACN Plc Glaxo Smithkline Consumer (Nig)
Plc
2 NSE Industrial
Index
DN Meyer Plc Avon Crowncaps and Containers
Plc
3 NSE Consumer
Goods Index
No Change No Change
4 NSE Banking Index No Change No Change
5 NSE Insurance
Index
No Change No Change
6 NSE Oil and Gas
Index
No Change No Change
7 NSE Lotus Islamic
Index
No Change No Change
(b) Adoption of NASDAQ Smart Market Surveillance System
The NSE acquired the National Association of Securities Dealers Automated
Quotations System, (NASDAQ), SMARTs Market Surveillance platform to
support its compliance program. The objective was to empower the NSE with
necessary surveillance tools to monitor market manipulation, including spoofing
and layering.

43
(c) Admission to Gold Community of Global Reporting Initiative
The NSE was admitted into the Gold Community by Global Reporting Initiative
(GRI), an international independent organization that helps businesses,
governments and other organizations understand and communicate the impact of
business on critical sustainability issues such as climate change, human rights,
corruption and many others. The membership of the NSE in the organization
would bring about benefits that would complement the efforts of the Bank at
promoting Sustainable Banking Principles and promote a favourable financial
ecosystem.
(d) Collaboration with Other Exchanges
Aimed at providing quoted companies with global visibility and access to deep
capital pools, the NSE, in partnership with the London Stock Exchange Group
(LSEG), organized the 2nd
NSE/LSEG Dual Listings Conference, with the theme:
‘Leveraging Cross-Border Capital Markets for Sustainable Growth’. The
Conference provided companies with the opportunity to explore London/Lagos
dual listing and also strengthened cooperation between the two Exchanges.
Likewise, the NSE collaborated with the African Securities Exchanges Association
(ASEA) and hosted the 5th Building African Financial Markets (BAFM) seminar,
themed: “Addressing Liquidity Concerns in African Capital Market”. Participants
were drawn from stock exchanges, regulatory bodies, stockbroking firms and other
financial market stakeholders from several African countries, to enhance their
capacities.
7.10 Extension of Bank Verification Number Registration
Further to the realization of the objectives of the Bank Verification Number, BVN,
the deadline for registration by Nigerian bank customers in the diaspora was
extended by the Bank to June 30, 2016 due to their low level of registration, from

44
January 31, 2016. The review of the deadline was accompanied by extensive
public enlightenment and engagements of more agents to provide registration
services in Europe and America. For residents in Nigeria, the deadline, however,
lapsed in October 2015, after an extension from end-June 2015. At the end of the
deadlines, bank customers without BVN will have restricted access to their
accounts.
7.11 Adoption of Negotiable Current Account Maintenance Fee Not
Exceeding N1/Mille
The Revised Guide to Bank Charges, which came into effect on April 1, 2013,
provided for a phased elimination of Commission on Turnover (COT) charges in
the Nigerian Banking Industry. Under the guidelines, a zero COT regime was
scheduled to come into effect in January 2016. Consequently, as approved at the
311th Bankers Committee meeting of February 12, 2013, banks were reminded to
effect the new COT-free regime. Nevertheless, in the interest of stability of the
banking system and slowdown in the economy, the CBN in January 2016,
prescribed a Negotiable Current Account Maintenance Fee, not exceeding N1.00
per mille that may be charged in respect of all customer induced debit transactions.
7.12 Guidelines for the Operation of Treasury Single Account by State
Governments in Nigeria
In the first half of 2016, the state governments continued to experience cash flow
pressures, owing to dwindling revenue combined with the need to meet statutory
responsibilities. As a result, some of the state governments adopted financial and
treasury management reforms, including the Treasury Single Account, (TSA). To
provide the needed support, the CBN issued guidelines for the operation of state
governments TSA. The guidelines provide for the implementation of the TSA,
based on standardized banking arrangements, operational processes and
information technology infrastructure.

45
7.13 Cash Deposit into Domiciliary Accounts
In view of the need to ensure stability in the foreign exchange market, the Bank
lifted the restriction imposed in August 2015 on cash lodgments into domiciliary
accounts. Thus, with effect from January 11, 2016 holders of ordinary domiciliary
accounts were allowed to deposit foreign currency cash into their accounts.
7.14 Externalization of Differentials on OTC FX Futures Contracts for
Foreign Portfolio Investors
To facilitate the operationalization of newly introduced OTC FX Futures traded on
the FMDQ OTC Securities Exchange, the Bank released guidelines on the
externalization of settlement (differential between OTC FX Futures and the
Nigerian Inter-Bank Foreign Exchange (NIFEX) in favour of foreign portfolio
investors (FPIs). The guidelines indicated conditions for such operation to include
evidence of Certificate of Capital Importation and the provision of an OTC FX
Futures Settlement Advice issued by FMDQ.

46
INDEX OF FINANCIAL MARKETS REGULATORY CIRCULARS / GUIDELINES ISSUED JAN-JUNE, 2016
S/N DATE
ISSUED
REFERENCE NO. TITLE DEPARTMENT REMARK
1 08-Jan-2016 FPR/DIR/GEN/CIR/01/002 Reduction in Cash Reserve
Requirement (CRR) to Enhance Bank's Liquidity for Real Sector Financing
FPR NEW
2 11-Jan-2016 TED/FEM/FPC/GEN/01/001 Developments in the Foreign Exchange Market, Re: Cash Deposit into Domicilliary Accounts
TED REVISED
3 19-Jan-2016 BPS/DIR/GEN/DCS/02/008 Collection and Remittance of Statutory Charges on Receipts to
Nigeria Postal Service under the Stamp Duties Act
BPS NEW
4 21-Jan-2016 FPR/DIR/GEN/CIR/01/003 Introduction of Negotiable
Current Account Maintenance Fee Not Exceeding N1/Mile
FPR NEW
5 22-Jan-2016 FPR/DIR/GEN/CIR/01/004 Refund of Mandatory Caution Deposit
FPR NEW
6 27-Jan-2016 FPR/DIR/DMB/GEN/01/001 List of Deposit Money Banks and Financial Holding Companies Operating in Nigeria
FPR NEW
7 27-Jan-2016 FPR/DIR/BDC/GEN/01/02 Updated List of confirmed BDCs in Compliance with New Requirement
FPR NEW
8 02-Feb-2016 BPS/DIR/GEN/WEB/01/003 Guidelines for Banking
Operations in the Free Trade Zones in Nigeria
BPS NEW
9 04-Feb-2016 BPS/DIR/GEN/WEB/01/004 Extension of BVN for Nigerian Banks' Customers in Diaspora (Revised)
BPS REVISED
10 09-Feb-2016 BPS/DIR/GEN/CIR/03/002 Guidelines for the Operation of Treasury Single Account (TSA) by State Governments in Nigeria
BPS NEW
11 25-Feb-2016 BPS/DIR/GEN/CIR/16/003 Clarification on Accounts with BVN Related Issues
BPS NEW
12 11-Mar-2016 FPR/DIR/CIR/GEN/01/005 Exposure Draft on the Guide to Charges for Banks and Other
Financial Institutions in Nigeria
FPR NEW
13 18-Mar-2016 FPR/DIR/CIR/GEN/01/006 Exposure Draft of the National Code of Corporate Governance
issued by the Financial Reporting Council of Nigeria (FRCN)
FPR NEW
14 03-May-2016 BPS/DIR/GEN/CIR/01/012 Guidelines on Operations of Electronic Payment Channels in
BPS NEW

47
Nigeria
15 03-May-2016 BPS/DIR/GEN/CIR/01/011 Guidelines on Transaction
Switching in Nigeria
BPS NEW
16 11-May-2016 FPR/DIR/GEN/CIR/01/007 Exposure Draft Guidelines on the Regulation and Supervision of Non Interest (Islamic) Microfinance Banks in Nigeria
FPR NEW
17 27-May-2016 FPR/DIR/GEN/CIR/01/010 Updated List of Confirmed Bureaux De Change in Compliance with New Requirement
FPR NEW
18 14-Jun-2016 FPR/DIR/GEN/CIR/01/009 Updated List of Microfinance
Banks as at June 14, 2016
FPR NEW
19 14-Jun-2016 FPR/DIR/GEN/CIR/01/008 Updated List of Commercial Banks as at June 14, 2016
FPR NEW
20 24-Jun-2016 FMD/DIR/GEN/07/001 Externalisation of Differentials
on OTC FX Futures Contracts for Foreign Portfolio Investors
FMD NEW
21 24-Jun-2016 TED/PFO/FPC/GEN/01/003 Returns On Nigerian's Investments Offshore for the Period 2006 - 2016
TED NEW
22 28-Jun-2016 BSD/DIR/GEN/LAB/09/033 Review of Operational Guidelines for Blacklisting
BSD NEW
23 29-Jun-2016 FPR/DIR/GEN/CIR/06/001 Circular to Banks and Other Financial Institutions-Secured Transactions and National
Collateral Registry for MSME Financing in Nigeria
FPR NEW

48
APPENDIX 2
NIFIs FORMAT FOR SUBMISSION OF REQUEST
Address of the Bank/NIFI The Director, Financial Markets Department, Central Bank of Nigeria, Corporate Headquarters, Central Business District, Abuja, Federal Capital Territory Dear Sir, REQUEST FOR.................... (State Name of Instrument, eg CSCA Deposit) In accordance with the “Guidelines for the Operation of Non-Interest Financial Institutions Instruments by the Central Bank of Nigeria”, we hereby apply for.............. (State Name of Instrument e.g. CSCA Deposit, CNIN or CBN-ABS) as follows: Name of Bank: ................................... Account Number: ................................... Amount: N......................million Tenor: ................... (Days, Years) Effective Date: ...................... (dd/mm/yy) Maturity: ............... (dd/mm/yy) Signatory (1) Official Stamp Signatory (2) Name of Signatory (1) Name of Signatory (2)

49
2015
January510.00 1,657.29 1,295.88 864..05 14.0000 -18.0000 14.2000-14.3000 11 133 - 196
February220.00 319.00 217.33 529.95 13.9000-17.0000 14.5000-14.8400 6 182 - 199
March360.00 620.84 543.86 455.24 14.7500-16.0000 14.8400-14.8500 11 175 - 203
April300.00 1,027.45 933.74 959.56 13.2000-14.8500 14.0000-14.8400 4 177 - 301
May290.00 719.16 524.54 272.56 13.7500-14.0000 13.9500-14.0000 6 170 - 255
June400.00 1,011.26 746.37 527.75 10.5000-13.9000 11.4500-13.8000 11 91 - 181
Total2,080.00 5,355.00 4,261.72 2,745.06 49
2016
January 270.00 913.26 698.42 581.52
7.2500 -10.0000 7.6000 -7.90006 147-220
February 200.00 630.89 509.23 492.38
7.2000 - 8.5000 7.7500 - 7.80004 143-206
March 354.86 706.99 394.63 351.88
7.5000 -11.0000 7.7000 -9.00007 181-280
April 440.00 710.30 363.72 187.78
8.3000 -11.0000 8.8000 -9.5000010 205-237
May 201.65 365.70 64.63 115.85
9.5000 -12.0000 9.5000 -10.00006 212-364
June 455.94 540.80 299.12 406.34
9.5000-13.5000 10.0000-13.50005 206-363
Total1,922.45 3,867.94 2,329.75 2,135.75 38
Repayment
(N’Billion)Period
Range of Tenor
(Days)
No. of
AuctionsStop Rate (%)
Subscription
(N’Billion)
Table 2.1
OMO Subscription and Sale
Offer
(N’Billion)
Sale
(N’Billion)Bid Rate (%)

50
Period Maturity Date Tenor (Days)Range of Bid
Rate (%)
Range of
Offer RAte
(%)
Volume Sold/(Bought)
(N)
Deal Rate
(%)
2015 NIL NIL NIL NIL NIL NIL
NIL NIL NIL NIL NIL NIL NIL
2016 NIL NIL NIL NIL NIL NIL
There w ere no transactions in the f irst half of 2015 and 2016.
Table 2.2
Two-Way Quote Trading in NTBs

51
Period Amount (N’Billion) Interest (N’Billion) Total (N’Billion) Rate (%) Tenor (Days)
2015
January 0.00 0.00 0.00 0.00 N/A
February 0.00 0.00 0.00 0.00 N/A
March 30.79 0.31 31.09 16.00-16.50 5-43
April 23.59 0.13 23.72 16.00 5-20
May 0.00 0.00 0.00 0.00 N/A
June 0.00 0.00 0.00 0.00 N/A
Total 54.38 0.44 54.81
2016
January 0 0 0 Nill N/A
February 0 0 0 Nill N/A
March 0 0 0 Nill N/A
April 0 0 0 Nill N/A
May 0 0 0 Nill N/A
June 0 0 0 Nill N/ATotal - - -
Table 2.3
Repurchase Transactions

52
Period Principal Amount Interest Total
2015
January 9,423,283,200.00 1,948,507.34 9,425,231,707.34
February 65,524,948,097.06 108,370,775.03 65,633,318,872.09
March 28,681,389,636.20 39,642,775.90 28,721,032,412.10
April 43,205,922,902.20 39,416,608.19 43,245,339,510.39
May 15,599,552,493.33 14,424,106.27 15,613,976,599.60
June 13,996,159,979.93 6,251,933.22 14,002,411,913.15
Average 29,405,209,384.79 35,009,117.66 29,440,218,502.45
2016
January 10,172,062,537.50 33,824,954.07 10,205,887,491.57
February 1,371,165,711.96 2,135,942.27 1,373,301,654.23
March 43,210,453,204.55 247,290,479.10 43,457,743,683.64
April 39,420,134,123.81 488,991,602.68 39,909,125,726.49
May 46,528,599,207.50 481,769,438.31 47,010,368,645.81
June 121,502,401,277.51 1,463,917,441.91 122,966,318,719.42
Average 43,700,802,677.00 452,988,309.70 44,153,790,986.70
Table 2.4
Daily Average Standing Lending Facility (N)

53
Period Principal Amount Interest Total
2015
January 128,703,809,994.02 64,364,661.64 128,768,174,655.66
February 48,841,722,222.22 20,965,347.03 48,862,687,569.25
March 62,764,954,545.45 28,247,191.78 62,793,201,737.24
April 53,011,235,294.12 32,920,704.27 53,044,155,998.39
May 104,740,105,263.26 47,775,387.17 104,787,880,650.43
June 79,357,000,000.00 35,065,589.04 79,392,065,589.04
Average 79,569,804,553.18 38,223,146.82 79,608,027,700.00
2016
January 121,776,600,000.00 20,442,426.23 121,797,042,426.23
February 121,611,666,666.67 18,824,522.51 121,630,491,189.18
March 77,370,476,190.48 13,027,166.28 77,383,503,356.75
April 119,203,304,412.38 35,517,790.46 119,238,822,202.85
May 88,002,850,000.00 25,559,056.01 88,028,409,056.01
June 92,087,131,087.43 25,636,986.53 92,112,768,073.96
Average 103,342,004,726.16 23,167,991.34 103,365,172,717.50
Table 2.5
Daily Average Standing Deposit Facility (N)

54
Period Call Tenored Call+Tenored OBB Total
2015
January 122.38 10.00 132.38 413.12 545.50
February 68.20 0.00 68.20 415.74 483.94
March 243.20 1.00 244.20 354.55 598.75
April 93.55 0.00 93.55 241.37 334.92
May 136.50 0.00 136.50 259.19 395.69
June 281.80 0.00 281.80 168.97 450.77
Total 945.63 11.00 956.63 1,852.95 2,809.58
2016
January 69.67 0.00 69.67 122.59 192.26
February 27.60 0.00 27.6 63.95 91.55
March 72.50 0.00 72.5 8.20 80.70
April 24.8 0.00 24.8 0.00 24.80
May 39.00 0.00 39.00 1.80 40.80
June 76.00 0.00 76.00 7.00 83.00
Total 309.57 - 309.57 203.54 513.11
Table 2.6
Inter-Bank Placement and Securities Trading (N'Billion)

55
Item January February March April May June
Inter-Bank Call
Range of Bid Rate7.00-15.75 9.50-95.00 9.57-24.71 14.00-83.33 7.50-30.00
6.75-22.50
Weighted Average Rate6.99 12.37 12.70 24.25 9.55 11.19
Inter-Bank (Tenored)
Range of Bid Rate 15.00-15.00 0 0 0 0 0
Weighted Average Rate 15 0 0 0 0 0
Call NIBOR 10.13 33.04 14.11 21.62 13.13 12.10
30-Day NIBOR
Open-Buy-Back (OBB)
Range of Bid Rate 7.00-15.10 9.09-85.73 9.92-31.20 9.27-60.19 7.28-38.73 7.25-18.51
Weighted Average Rate8.69 27.19 14.31 23.20 11.69 10.64
OMO 0 0 0 0 0 0
Issue Rates (%) 0 0 0 0 0 0
Tenor (days) 0 0 0 0 0 0
0 0 0 0 0 0
NTB Primary Issue Rates (%) 0 0 0 0 0 0
0 0 0 0 0 0
MPR 13.00 13.00 13.00 13.00 13.00 13.00
Table 2.7
Monthly Money Market Rates (Per cent per Annum), 2015

56
Monthly Money Market Rates , 2016
Item January February March April May June
Inter-Bank Call
Range of Bid Rate0.50-7.50 0.50-4.50 2.00-7.00 2.00-7.00 3.50-11.60
1.50-120.00
Weighted Average Rate2.75 2.30 4.32 4.00 7.68 29.91
Inter-Bank (Tenored)
Range of Bid Rate 0 0 0 0 0 0
Weighted Average Rate 0.00 0.00 0.00 0.00 0.00 0.00
Call NIBOR 2.59 2.73 6.51 4.71 7.08 14.42
Open-Buy-Back (OBB)
Range of Bid Rate 0.50-10.77 0.50-6.67 1.83-5.00 0 10.00-10.00 3.50-40.00
Weighted Average Rate2.90 3.18 3.14 0.00 10.00 21.75
OMO
Issue Rates (%)
Tenor (days)
NTB Primary Issue Rates (%)6.708083 7.258000 7.607044 8.566117 9.638167 10.530422
MPR11.00 11.00 12.00 12.00 12.00 12.00
Table 2.7

57
Beneficiary Assumed Bank Tranche Issue DateIssue Amount
(N)Applicable Rate (%)
Redemption
DateInterest Pay Date
2015
NIL NIL NIL NIL NIL NIL NIL
NIL NIL NIL NIL NIL NIL NIL
Total
2016
NIL NIL NIL NIL NIL NIL NIL
NIL NIL NIL NIL NIL NIL NIL
Table 2.8
Promissory Notes

58
PeriodAmount
offered
Amount
Demanded
Amount Sold
at WDAS/RDAS-
SPT
Amount Sold
to BDCs
Amount Sold
at the Inter-
bank Spot
WDAS/RDAS-
FWD
Transaction
Amount Sold
at the
WDAS/RDAS-
FWD
Amount
Purchased at
the Inter-bank
Net Sales
2015
2016
1,393.81
5,701.39
15,117.02
973.57
895.77
1,093.05
727.69
617.50
3,599.06
3,614.82
2,257.69
1,773.17
2,400.66
1,471.62
Table 3.1
Inter-bank, Wholesale/Retail Dutch Auction System (US$ Million)
January 0.00 0.00 0.00 0.00 973.57 0.00 0.00
February 0.00 0.00 0.00 0.00 895.77 0.00 0.00
March 0.00 0.00 0.00 0.00 1,093.05 0.00 0.00
April 0.00 0.00 0.00 0.00 727.69 0.00 0.00
May 0.00 0.00 0.00 0.00 617.50 0.00 0.00
June 0.00 0.00 0.00 0.00 1,423.81 0.00 0.00
Total 0.00 0.00 0.00 0.00 5,731.39 0.00 0.00
1,689.80 1,339.82Total 2,900.00 8,648.13 3,184.54 1,752.98 9,421.70
0.00 311.13
June 0.00 0.00 0.00 369.97 1,448.49 0.00 24.37
May 0.00 0.00 0.00 232.89 1,856.64
0.00 140.00
April 0.00 0.00 0.00 292.52 1,360.65 0.00 120.00
March 0.00 0.00 0.00 301.62 1,866.07
875.00 623.28
February 1,200.00 3,773.50 1,197.14 371.40 2,036.05 814.80 121.04
0.00
0.00
0.00
30.00
January 1,700.00 4,874.63 1,987.40 184.58 853.80
30.00
50.00
110.81
50.00
0.00
0.00
582.02
371.21
0.00
0.00

59
PeriodW/RDAS-SPT
(incl. 1% comm.) Inter-Bank BDC
Premium b/w
W/RDAS-SPT and
Inter-Bank
Premium b/w
W/RDAS-SPT and
BDC
Inter-Bank
Premium
Percentage
(RHS)
BDC Premium
Percentage
(RHS)
Premium b/w Inter-
bank and BDC
Premium btw
inter-bank
and BDC
Percentage
2015
January 169.68 181.78 196.13 12.10 26.45 7.13 15.59 14.34 7.89
February 169.68 194.48 213.03 24.80 43.35 14.62 25.55 18.55 9.54
March 0.00 197.07 222.93 0.00 0.00 0.00 0.00 25.86 13.12
April 0.00 197.00 210.70 0.00 0.00 0.00 0.00 13.70 6.95
May 0.00 197.00 219.55 0.00 0.00 0.00 0.00 22.55 11.45
June 0.00 196.92 218.98 0.00 0.00 0.00 0.00 22.06 11.20
Average 169.68 194.04 213.55 18.45 34.90 10.87 6.86 19.51 10.03
2016
January 0.00 197.00 289.78 0.00 0.00 0.00 0.00 92.78 47.09
February 0.00 197.00 329.83 0.00 0.00 0.00 0.00 132.83 67.43
March 0.00 197.00 320.93 0.00 0.00 0.00 0.00 123.93 62.91
April 0.00 197.00 320.71 0.00 0.00 0.00 0.00 123.71 62.80
May 0.00 197.00 336.93 0.00 0.00 0.00 0.00 139.93 71.03
June 0.00 231.76 351.82 0.00 0.00 0.00 0.00 120.06 51.80
Average 0.00 202.79 325.00 0.00 0.00 0.00 0.00 122.21 60.51N.B Flexible exchange rate regime was introduced in June 2016
Table 3.2
Average W/RDAS-SPT, Inter-Bank and BDC Rates

60
Period
2015 Opening Closing Opening Closing Opening Closing Opening Closing Opening Closing
January 34,657.15 29,562.07 11.49 9.85 5.46 4.75 0.30 0.32 3,803 3,800
February 29,882.28 30,103.81 9.95 10.04 3.25 5.38 0.25 0.40 5,501 3,831
March 30,267.18 31,744.82 10.10 10.72 2.98 5.05 0.26 0.38 3,329 4,611
April 34,380.14 34,708.11 11.62 11.79 10.94 3.75 0.88 0.37 4,611 4,696
May 34,649.28 34,310.37 11.77 11.66 6.42 11.93 0.32 0.71 4,845 4,676
June 34,044.65 33,456.83 11.57 11.42 5.50 4.29 0.34 0.27 4,184 4,808
2016
January 28,370.32 23,916.15 9.76 8.23 0.70 2.00 0.09 0.24 2,307 3,270
February 23,826.76 24,570.73 8.19 8.45 5.09 1.49 0.26 0.47 3,887 2,549
March 24,838.31 25,306.22 8.54 8.70 1.10 1.93 0.16 0.26 3,080 3,298
April 25,507.09 25,062.41 8.77 8.62 1.01 1.50 0.21 0.23 2,377 3,493
May 25,865.50 27,663.16 8.90 9.50 1.50 3.15 0.22 0.34 3,474 4,301
June 26,910.23 29,597.79 9.24 10.06 3.85 3.70 0.35 0.44 5,024 5,565 zx
Nigerian Stock Exchange Monthly Opening and Closing Transactions
Table 4.1
All Share IndexMarket Capitalization
(N'Trillion)Value Traded (N'BN) Volume Traded (BN) Deals

61
Period Volume Traded Value Traded (N) Deals
2015
Quarter 1 25,361,352,351 272,225,558,868.03 253,340
Quarter 2 24,164,402,421 277,883,736,409.97 273,508
Total 49,525,754,772 550,109,295,278.00 526,848
2016
Quarter 1 35,404,413,976 208,969,509,060.85 267,203
Quarter 2 26,081,214,207 149,225,410,503.27 238,410
Total 61,485,628,183 358,194,919,564.12 505,613
Quarterly Distribution of Transactions on the Nigerian Stock Exchange
Source: Nigerian Stock Exchange
Table 4.2

62
Sector Volume ValueNo. of
DealsPercentage
Agriculture 259,805,223 5,265,797,287.14 7,324 0.52
Conglomerates 2,805,522,789 20,038,145,861.98 30,263 5.66
Construction/Real Estate 337,470,127 12,042,810,595.14 5,853 0.68
Consumer Goods 2,630,081,822 129,664,195,774.85 77,923 5.31
Financial Services 38,925,329,082 293,048,480,009.31 319,289 78.59
Healthcare 388,684,603 2,778,598,808.04 7,276 0.78
ICT 597,187,869 1,557,551,698.99 1,616 1.21
Industrial Goods 430,698,498 29,365,385,341.87 20,421 0.87
Natural Resources 200,681,791 341,492,009.88 545 0.41
Oil and Gas 2,120,438,196 53,448,556,075.17 43,350 4.28
Services 829,854,772 2,558,281,815.62 12,987 1.68
Total (Equities) 49,525,754,772 550,109,295,278.00 526,848 99.99
Federal Government of Nigeria Bonds 202,529 203,919,831.26 64 0.00
Exchange Traded Products (ETPs) 6,507,920 151,351,783.63 626 0.01
Grand Total 49,532,465,221 550,464,566,893 527,538 100.00 Source: Nigerian Stock Exchange
Sector Volume ValueNo. of
Deals
Percentage
(Volume)
Agriculture 432,592,684 2,251,307,915.00 6,291 0.80
Conglomerates 2,063,099,685 4,327,526,165.00 19,419 3.79
Construction/Real Estate 55,791,838 823,937,876.00 2,973 0.10
Consumer Goods 4,932,329,245 63,102,088,799.00 67,769 9.07
Financial Services 44,823,680,149 129,752,057,680.00 264,582 82.38
Healthcare 206,320,230 1,347,411,580.00 5,719 0.38
ICT 56,288,522 69,685,985.00 531 0.10
Industrial Goods 259,090,031 11,118,883,659.00 21,077 0.48
Natural Resources 22,121,282 14,852,093.00 230 0.04
Oil and Gas 1,171,276,836 25,076,684,990.00 33,972 2.15
Services 382,856,070 716,988,840.00 6,665 0.70
Total (Equities) 54,405,446,572.00 238,601,425,582.00 429,228 99.99
Federal Government of Nigeria Bonds 438,078 490,138,135.18 112 0.00
Exchange Traded Products (ETPs) 2,886,578 235,341,169.02 826 0.01
Grand Total 54,408,771,228.00 239,326,904,886.20 430,166 100.00 Source: Nigerian Stock Exchange
Table 4.3
Sectoral Distribution of Transactions on the Nigerian Stock Exchange in the First Half of 2016
Sectoral Distribution of Transactions on the Nigerian Stock Exchange in the First Half of 2015
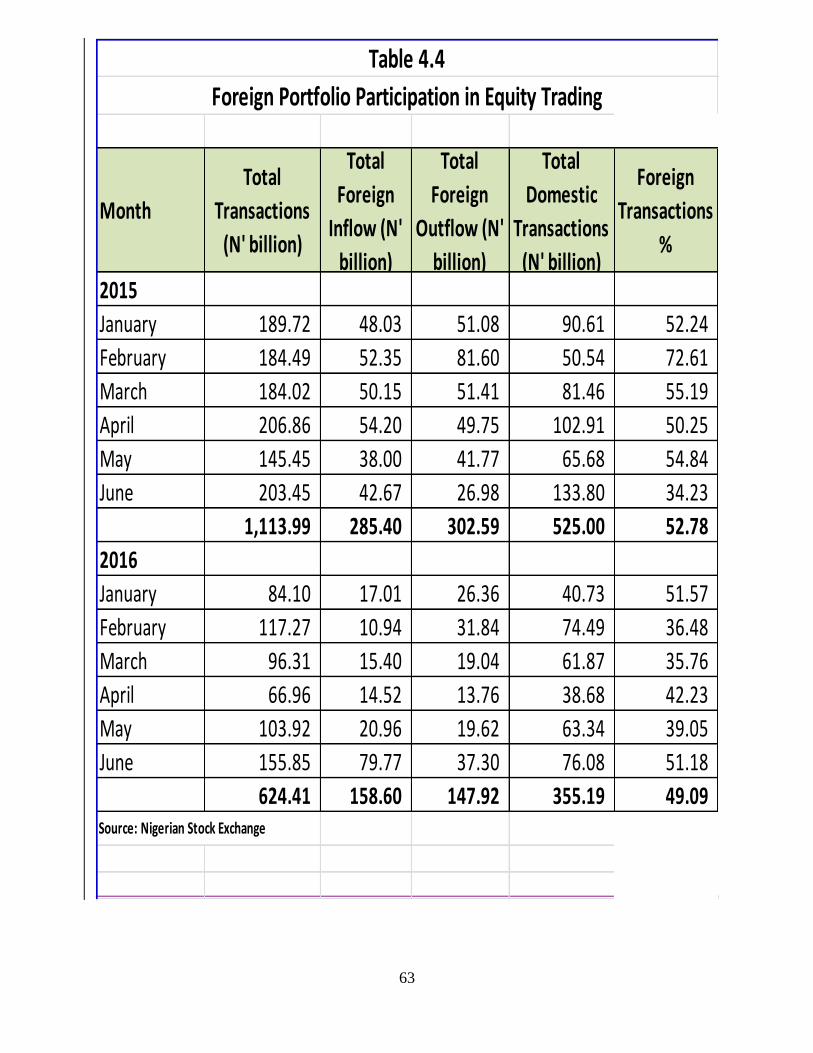
63
Month
Total
Transactions
(N' billion)
Total
Foreign
Inflow (N'
billion)
Total
Foreign
Outflow (N'
billion)
Total
Domestic
Transactions
(N' billion)
Foreign
Transactions
%
2015
January 189.72 48.03 51.08 90.61 52.24
February 184.49 52.35 81.60 50.54 72.61
March 184.02 50.15 51.41 81.46 55.19
April 206.86 54.20 49.75 102.91 50.25
May 145.45 38.00 41.77 65.68 54.84
June 203.45 42.67 26.98 133.80 34.23
1,113.99 285.40 302.59 525.00 52.78
2016
January 84.10 17.01 26.36 40.73 51.57
February 117.27 10.94 31.84 74.49 36.48
March 96.31 15.40 19.04 61.87 35.76
April 66.96 14.52 13.76 38.68 42.23
May 103.92 20.96 19.62 63.34 39.05
June 155.85 79.77 37.30 76.08 51.18
624.41 158.60 147.92 355.19 49.09
Table 4.4
Foreign Portfolio Participation in Equity Trading
Source: Nigerian Stock Exchange

64
Company Amounts/Units Listed Date Listed
Transcorp Hotels Plc
Allan Gray Africa Fund
Fidson Healthcare Plc
Debt Management Office of the
Federal Government of Nigeria
UBA Plc
African Development Bank
Stanbic IBTC Bank Plc.
Stanbic IBTC Bank Plc
FCMB Financing SPV Plc
Gombe State Government of Nigeria
Company Additional Shares Reason
Evans medical Plc 245,874,572 ordinary shares of 50 kobo each Rights Issue
Union Dicon Salt Plc 41,000,000 ordinary shares of 50 kobo each Special Placing by the company.
Mansard Insurance Plc 500,000,000 ordinary shares of 50 kobo eachMansard Share Option Plan for
employees of the company.
FGN BondN480,133,082,000.00; N434,684,128,000.00; and N206,000,000,000.00 were added to the following
bonds: 15.10% FGN APR 2017, 14.20% FGN MAR 2024, and 12.1493% FGN JUL 2034
Sterling Bank Plc 7,197,604,531 ordinary shares of 50 kobo each Special Placing
FGN BondN25,000,000,000.00 and N17,500,000,000.00 were added to the following bonds 14.20% FGN MAR
2024, and 12.1493% FGN JUL 2034
Lafarge S.A group 1,402,575,984 ordinary shares of 50 kobo eachOutstanding shares of
LAFARGE AFRICA PLC
FGN BondN499,684,128,000.00, N254,500,000,000.00 and N54,000,000,000.00 were added to the following
bonds 14.20% FGN MAR 2024, 12.1493% FGN JUL 2034, and 15.54% FGN FEB 2020
Forte Oil Plc 217,080,184 units 1 for 5 bonus
Consolidated Breweries Plc 366,396,456 Ordinary Shares of 50 Kobo Each Merger
Diamond Bank Plc 8,685,145,863 ordinary shares of 50k each at N5.80 per share rights issue
FGN BondN25,000,000,000.00, N25,000,000,000.00 and N119,730,000,000.00 were added to the following
bonds 14.20% FGN MAR 2024, 12.1493% FGN JUL 2034, and 15.54% FGN FEB 2020
FBN HOLDINGS PLC 3,263,208,436 units bonus issue of 1 for 10
GLAXO SMITHKLINE
CONSUMER NIGERIA PLC239,175,298 units bonus issue of 1 for 4
NIGERIAN AVIATION
HANDLING COMPANY PLC
(NAHCO)
147,656,250 units bonus issue of 1 for 10
VITAFOAM NIGERIA PLC
(VITAFOAM)163,800,000 units bonus issue of 1 for 5
SKYE BANK PLC (SKYEBANK) 660,966,734 units bonus issue of 1 for 20
PHARMA DEKO PLC
(PHARMDEKO) 116,819,694 units Rights Issue on the basis
FGN Bond N573,144,128,000.00; N299,500,000,000.00; and N193,730,000,000.00 were added to the following
bonds: 14.20% FGN MAR 2024, 12.1493% FGN JUL 2034, and 15.54% FGN FEB 2020
PRESTIGE ASSURANCE PLC (PRESTIGE) 3,009,978,524 units Rights Issue
Champion Breweries Plc 629,496,464 units Placing exercise
Oando PLC 2949933156 ordinary shares of 50 Kobo each at N16.50 per share Right Issue
International Breweries Plc 31,722,850 ordinary shares 1 for 5 bonus 0f 25 kobo dividend
McNicholas consolidated Plc 68,114,665 ordinary shares of 50kobo each Preference shares
FGN Bond
599,994,124, 324,500,000, and 233,730,000 units were added to the following Federal Government
Bonds - 14.20% FGN MAR 2024, 12.1493% FGN JUL 2034, 15.54% FGN FEB 2020 respectively
on 24th June, 2015
CompanyDeListing
Oasis Insurance Plc voluntary
Cappa & D’Alberto Plc voluntary
IHS Nigerian Plc voluntary
Source: Nigerian Stock Exchange
Company Amounts/Units Listed Date Listed
FGN Bond45,838,333 units belonging to 12.50% FGN Jan 2026 were admitted to trade at the Exchange on Friday
29th January, 2016.trade at the Exchange
Benue State GovernmentA total volume of 4,950,000 units belonging to 16.5% BNU Feb 2022 were admitted to trade at the
Exchange on Thursday 4th February, 2016.trade at the Exchange
Zamfara State Government Bond N7 Billion 17% Fixed Rate Development Bonds due 2022 was trade at the Exchange
admitted to trade at the Exchange on Friday, 19th February, 2016.
Cornerstone Insurance Plc5,909,497,252 ordinary shares of 50 kobo were added to the outstanding shares of Cornerstone to serve
as Purchase Consideration for Acquiring 96.68% Stake in FIN Insurance Plc Company Ltd.trade at the Exchange
Transorp Hotels Plc9,758,000 unit of Transorp Hotels Plc valued at N9,758,000,000 (Series 2) 5 Year 15.50% Fixed Rate
Unsecured Bonds Due 2020trade at the Exchange
FGN Bond of 12.40% Mar 203640,000,000 units valued at N40,000,000,000.00 of 12.40% FGN Mar 2036 were admitted to trading
on 23rd of March, 2016trade at the Exchange
Company Additional Shares Reason
FGN Bond 491,930,000 units were added to 15.54% FGN Feb 2020 on Friday, 28 January 2016. additional
FGN Bond 50,000,000 units were added to 12.50% FGN Jan 2026 bonds on 17th February, 2016. additional
40000000 units were added to 15.54%FGN Feb 2020, 17th February, 2016. additional
Cornerstone Insurance Plc 5,909,497,252 ordinary shares of 50 kobo were added to the outstanding shares of Cornerstone
Insurance Plc.additional
FGN Bond25 million and 60 million units were added to the following Federal Government Bonds: 15.54% FGN
Feb 2020 and 12.50% FGN Jan 2026, respectivelyadditional
FGN Bond20 million, 110.180 million and 40 million units were added to the following bonds: 15.54% FGN Feb
2020, 12.50% FGN Jan 2026 and 12.40% FGN Mar 2036 respectively.additional
Fortis Microfinance Bank Plc
(FORTISMFB)
Ordinary shares of 656,666,668 units of (FORTISMFB) which arose from the conclusion of the Special
Placing exercise by the Bank were admitted to trading on 12th May, 2016.special placement
15.54% FGN Feb 2020, 12.50%
FGN Jan 2026 and 12.40% FGN
Mar 2036 Bond
7,500,000, 20,000,000, and 25,000,000 units were added to the following bonds: 15.54% FGN Feb
2020, 12.50% FGN Jan 2026 and 12.40% FGN Mar 2036 respectively on Tuesday 17th May, 2016.additional
FGN Bond20 million, 40 million and 50 million units were added to the following bonds: 15.54% FGN FEB 2020,
12.50% FGN JAN 2026 and 12.40% FGN MAR 2036 respectively on Tuesday 21st June, 2016additional
Company Reason
Delisting
Intercontinental Bank Plc Non Existence (Now Access Bank)
Wema Bank Plc Non compliance with post-listing requirement
Vono Products Plc Non Existence (as a result of the merger between Vitafoam Nigeria Plc and Vono Products Plc).
Source: Nigerian Stock Exchange
7,600,403,900 ordinary shares of 50k each at N10.00
43,024 units at N34,541.45 per unit
N2billion 5-Year 15.5% Fixed Rate Secured Bonds
N34 Billion 5-Year 15.54% FGN Bond
N45 billion (Series 1) 7 years 16.45% fixed rate
Supplementary Listing
N100 million Series-1 (Tranche A) 10-Year
N26 billion Series-1 7-Year 14.25% fixed rate
N5 Billion 16% Series-1 Fixed Rate 7-Year bond
Reason
New Listings, Supplementary Listing and Delisting in the First Half of 2016
New Listing
Supplementary Listing
N15.44billion Series-1 (Tranche B) 10-Year 13.25%
Table 4.5
New Listings, Supplementary Listing and Delisting in the First Half of 2015
New Listing
N12.95 billion 7-year 11.25% fixed rate

65
Instrument Amount Outstanding Proportion (%)
2015
FGN BONDS 5,300,418,821,000.00 63.13
NIG. TREASURY BILLS 2,824,952,245,000.00 33.64
NIG. FRN TREASURY BONDS 271,220,500,000.00 3.23
TOTAL 8,396,591,566,000.00 100
2016
FGN BONDS 7,473,539,169,592.51 70.46
NIG. TREASURY BILLS 2,901,807,046,000.00 27.36
NIG. TREASURY BONDS 230,988,000,000.00 2.18
TOTAL 10,606,334,215,592.50 100
2,209,742,649,592.51 26.32%
Table 5.1
Nigerian Domestic Debt: Class of Holders (N'Billion)

66
DMBsDisc
Houses
Mandate &
Internal
Customers
CBN
Branches
CBN/MMD
Take-upTotal
2015
January 384.30 1,072.44 384.30 13.43 319.27 6.76 53.55 4.72 0.00 384.30
February 334.83 716.28 334.83 13.15 200.77 15.41 111.43 7.22 0.00 334.83
March 520.00 1,063.50 422.17 13.60 388.93 25.54 99.80 5.72 0.00 520.00
April 353.09 1,092.82 353.09 12.44 269.07 5.98 60.50 17.54 0.00 353.09
May 261.56 572.72 261.56 12.01 155.09 0.55 100.90 5.01 0.00 261.56
June 380.02 695.45 420.59 11.87 212.85 4.86 157.26 5.06 0.00 380.02
Total 2,233.80 5,213.20 2,176.55 1,545.99 59.11 583.43 45.27 0.00 2,233.80
2016
January 332.21 600.57 332.21 6.71 262.08 8.72 56.00 5.41 0.00 332.21
February 384.83 914.57 334.83 7.26 306.28 5.68 66.40 6.47 0.00 384.83
March 611.51 1,546.88 494.60 7.61 328.69 6.94 263.58 12.30 0.00 611.51
April 386.41 699.08 386.41 8.57 348.82 7.22 24.01 6.37 0.00 386.41
May 261.56 478.05 261.56 9.64 157.91 9.09 88.07 6.48 0.00 261.56
June 480.75 818.24 403.75 10.53 275.91 28.56 141.64 6.64 28.00 480.75
Total 2,457.28 5,057.39 2,213.36 1,679.69 66.22 639.71 43.67 28.00 2,457.28
Table 5.2
Primary Market: Nigerian Treasury Bills Transactions (N'Billion)
Period Issues Subscription RepaymentAve.
Rates %
Allotment

67
N'MILLION % N'MILLION % N'MILLION % N'MILLION % N'MILLION % N'MILLION %
BANKS 1,014,620.37 36.04 987,294.09 35.07 1,038,385.89 36.24 1,025,293.89 35.78 1,035,293.89 36.13 1,020,108.60 36.11
DISCOUNT HOUSES 30,247.54 1.07 25,488.77 0.91 22,488.07 0.78 26,230.07 0.92 23,232.81 0.81 24,238.07 0.86
PARASTATALS 1,556,160.68 55.27 1,559,900.10 55.40 1,561,809.00 54.50 1,571,159.00 54.83 1,564,156.26 54.59 1,537,764.78 54.44
CBN 214,495.16 7.62 242,840.80 8.63 242,840.80 8.47 242,840.80 8.47 242,840.80 8.47 242,840.80 8.60
TOTAL 2,815,523.75 100.00 2,815,523.75 100.00 2,865,523.75 100.00 2,865,523.75 100.00 2,865,523.75 100.00 2,824,952.25 100.00
N'MILLION % N'MILLION % N'MILLION % N'MILLION % N'MILLION % N'MILLION %
BANKS 974,842.72 35.16 989,204.52 35.04 1,015,519.73 35.95 1,055,828.54 37.38 1,126,487.81 39.88 1,114,660.95 38.41
DISCOUNT HOUSES 50,466.18 1.82 33,874.40 1.20 48,869.16 1.73 31,920.32 1.13 59,320.95 2.10 67,321.92 2.32
PARASTATALS 1,527,698.37 55.09 1,572,968.35 55.72 1,517,578.41 53.72 1,512,638.42 53.55 1,608,998.32 56.96 1,688,744.10 58.20
CBN 219,859.77 7.93 226,819.76 8.04 242,839.75 8.60 224,419.77 7.94 29,999.97 1.06 31,080.08 1.07
TOTAL 2,772,867.04 100.00 2,822,867.04 100.00 2,824,807.05 100.0 2,824,807.05 100.0 2,824,807.05 100.0 2,901,807.05 100.0
TABLE 5.3
Nigerian Treasury Bills: Class of Holders2015
CUSTOMER CLASSJANUARY FEBRUARY MARCH APRIL MAY JUNE
2016
CUSTOMER CLASSJANUARY FEBRUARY MARCH APRIL MAY JUNE

68
2015
1 5% T/BOND 2016 15,232,500,000 150,000 15,232,350,000
2 5% T/BOND 2017 15,000,000,000 1,267,131,000 13,732,869,000
3 5% T/BOND 2018 15,000,000,000 2,385,984,000 12,614,016,000
4 12.50% T/BOND 2016 25,000,000,000 2,122,153,000 22,877,847,000
5 12.50% T/BOND 2017 25,000,000,000 4,873,304,000 20,126,696,000
6 12.50% T/BOND 2018 25,000,000,000 7,241,195,000 17,758,805,000
7 12.50% T/BOND 2019 25,000,000,000 11,324,284,000 13,675,716,000
8 12.50% T/BOND 2020 25,000,000,000 12,866,195,000 12,133,805,000
9 12.50% T/BOND 2021 25,000,000,000 14,086,380,000 10,913,620,000
10 12.50% T/BOND 2022 25,000,000,000 15,255,780,000 9,744,220,000
11 12.50% T/BOND 2023 25,000,000,000 16,277,960,000 8,722,040,000
12 12.50% T/BOND 2024 25,988,000,000 17,894,888,000 8,093,112,000
Total 271,220,500,000 105,595,404,000 165,625,096,000
2016
1 5% T/BOND 2017 15,000,000,000 1,000 14,999,999,000
2 5% T/BOND 2018 15,000,000,000 1,222,090,000 13,777,910,000
3 12.50% T/BOND 2017 25,000,000,000 1,931,249,000 23,068,751,000
4 12.50% T/BOND 2018 25,000,000,000 4,648,140,000 20,351,860,000
5 12.50% T/BOND 2019 25,000,000,000 6,995,961,000 18,004,039,000
6 12.50% T/BOND 2020 25,000,000,000 9,031,859,000 15,968,141,000
7 12.50% T/BOND 2021 25,000,000,000 12,469,062,000 12,530,938,000
8 12.50% T/BOND 2022 25,000,000,000 13,814,767,000 11,185,233,000
9 12.50% T/BOND 2023 25,000,000,000 14,991,055,000 10,008,945,000
10 12.50% T/BOND 2024 25,988,000,000 16,702,803,000 9,285,197,000
Total 230,988,000,000 81,806,987,000 149,181,013,000
Table 5.4
Federal Republic of Nigeria Treasury Bonds: Class of Holders
S/N Treasury Bond Issue Amount CBN Holdings
FGN Treasury
Bond S/Fund
Holding

69
Tranche Tenor Issue (N'Billion)Subscription
(N'Billion)
Allotment
(N'Billion)
January
15.1.05% FGN APR 2017 5 YEAR 24.00 56.65 24.00
14.20% FGN MAR 2024 10 YEAR 25.00 32.24 20.00
12.1493% FGN JUL 2034 20 YEAR 24.00 40.61 28.00
Sub-Total 73.00 129.50 72.00
February
15.54% FGN FEB 2020 5 YEAR 35.00 60.10 34.00
14.20% FGN MAR 2024 10 YEAR 30.00 35.37 25.00
12.1493% FGN JUL 2034 20 YEAR 25.00 28.14 17.50
Sub-Total 90.00 123.61 76.50
March
15.54% FGN FEB 2020 5 YEAR 35.00 31.61 20.00
14.20% FGN MAR 2024 10 YEAR 30.00 49.01 40.00
12.1493% FGN JUL 2034 20 YEAR 30.00 38.53 31.00
Sub-Total 95.00 119.15 91.00
April
15.54% FGN FEB 2020 5 YEAR 30.00 45.93 20.00
14.20% FGN MAR 2024 10 YEAR 20.00 69.48 25.00
12.1493% FGN JUL 2034 20 YEAR 20.00 70.21 25.00
Sub-Total 70.00 185.62 70.00
May
15.54% FGN FEB 2020 5 YEAR 20.00 42.55 20.00
14.20% FGN MAR 2024 10 YEAR 20.00 81.68 20.00
12.1493% FGN JUL 2034 20 YEAR 20.00 59.14 20.00
Sub-Total 60.00 183.37 60.00
June
15.54% FGN FEB 2020 5 YEAR 40.00 50.55 40.0000
14.20% FGN MAR 2024 10 YEAR 15.22 36.32 15.22
12.1493% FGN JUL 2034 20 YEAR 25.00 44.01 25.00
Sub-Total 80.22 130.87 80.22
Grand Total 468.22 872.12 449.72
FGN Bonds Issued, 2015

70
Tranche Tenor Issue (N'Billion)Subscription
(N'Billion)Allotment (N'Billion)
January
15.54% FGN FEB 2020 5 YEAR 40.00 74.44 40.00
12.50% FGN JAN 2026 10 YEAR 40.00 74.99 35.00
Sub-Total 80.00 149.43 75.00
February
15.54% FGN FEB 2020 5 YEAR 40.00 122.16 40.00
12.50% FGN JAN 2026 10 YEAR 50.00 111.60 50.00
Sub-Total 90.00 233.76 90.00
March
15.54% FGN FEB 2020 5 YEAR 20.00 72.56 20.00
12.50% FGN JAN 2026 10 YEAR 40.00 89.36 40.00
12.40% FGN MAR 2036 20 YEAR 40.00 100.53 40.00
Sub-Total 100.00 262.45 100.00
April
15.54% FGN FEB 2020 5 YEAR 20.00 58.53 20.00
12.50% FGN JAN 2026 10 YEAR 40.00 78.59 40.00
12.40% FGN MAR 2036 20 YEAR 50.00 69.61 40.00
Sub-Total 110.00 206.73 100.00
May
15.54% FGN FEB 2020 5 YEAR 15.00 35.40 7.50
12.50% FGN JAN 2026 10 YEAR 40.00 51.71 20.00
12.40% FGN MAR 2036 20 YEAR 50.00 72.49 25.00
Sub-Total 105.00 159.60 52.50
June
15.54% FGN FEB 2020 5 YEAR 15.00 32.88 22.0000
12.50% FGN JAN 2026 10 YEAR 40.00 66.86 40.00
12.40% FGN MAR 2036 20 YEAR 50.00 72.13 50.00
Sub-Total 105.00 171.87 112.00
Grand Total 590.00 1,183.83 529.50
Table 5.5FGN Bonds Issued, 2016

71
Auction ID Bond Tranche New Nomenclature Interest Rate Issue Date Issue Amount (N)Redemption
DateInterst Pay Date
2015
FGB.2007-000039 4TH FGN BOND 2017 SERIES 8 9.85% FGN JUL 2017 9.85% 27/07/2007 20,000,000,000.00 27/07/2017 27 JAN & 27 JUL.
FGB.2007-000040 4TH FGN BOND 2017 SERIES 9 9.35% FGN AUG 2017 9.35% 31/08/2007 100,000,000,000.00 31/08/2017 29 FEB & 31 AUG.
FGB.2012-000067 5TH FGN BOND 2018 SERIES 2 10.70% FGN MAY 2018 10.70% 30/05/2008 300,000,000,000.00 30/05/2018 30 MAY & 30 NOV.
FGB.2010-000060 5TH FGN BOND 2028 SERIES 5 15.00% FGN NOV 2028 15.00% 28/11/2008 75,000,001,000.00 28/11/2028 28 MAY & 28 NOV.
FGB.2009-000053 6TH FGN BOND 2029 SERIES 3 12.49% FGN MAY 2029 12.49% 22/05/2009 150,000,000,000.00 22/05/2029 22 MAY & 22 NOV.
FGB.2011-000064 6TH FGN BOND 2019 SERIES 4 7.00% FGN OCT 2019 7.00% 23/10/2009 233,896,698,000.00 23/10/2019 23 APR & 23 OCT
FGB.2009-000055 6TH FGN BOND 2029 SERIES 5 8.50% FGN NOV 2029 8.50% 20/11/2009 200,000,000,000.00 20/11/2029 20 MAY & 20 NOV.
FGB.2013-000073 7TH FGN BOND 2030 SERIES 3 10.00% FGN JUL 2030 10.00% 23/07/2010 591,568,208,000.00 23/07/2030 23 JAN & 23 JUL
FGB.2010-000059 4TH FGN BOND 2014 SERIES 11 9.25% FGN SEP 2014 9.25% 28/09/2007 - 28/09/2014 28 SEP & 28 MAR.
FGB.2013-000072 9TH FGN BOND 2022 SERIES 1 16.39% FGN JAN 2022 16.39% 27/01/2012 605,310,000,000.00 27/01/2022 27 JAN & 27 JUL
FGB.2013-000075 9TH FGN BOND 2017 SERIES 2 15.10% FGN APR 2017 15.10% 27/04/2012 480,133,082,000.00 27/04/2017 27 APR & 27 OCT
FGB 2012-000069 9TH FGN BOND 2019 SERIES 3 16.00% FGN JUN 2019 16.00% 29/06/2012 351,300,000,000.00 29/06/2019 29 JUN & 29 DEC
FGB 2013-000076 10TH FGN BOND 2016 SERIES 1 13.05% FGN AUG 2016 13.05% 16/08/2013 581,386,704,000.00 16/08/2016 16 FEB & 16 AUG
NGFB0010Y00058/MN 11TH FGN BOND 2024 SERIES 1 14.20% FGN MAR 2024 14.20% 14/03/2014 599,994,128,000.00 14/03/2024 14 MAR & 14 SEP
NGFB0020Y00060/MN 11TH FGN BOND 2034 SERIES 2 12.1493% FGN JUL 2034 12.15% 18/07/2014 324,500,000,000.00 18/07/2034 18 JAN & 18 JUL
NGFB0005Y00063 12TH FGN BOND 2020 SERIES 1 15.54% FGN FEB 2020 15.54% 13/02/2015 233,730,000,000.00 13/02/2020 13 FEB & 13 AUG
NGFB0010Y00064 12TH FGN BOND 2025 SERIES 2 12.00% FGN MAR 2025 12.00% 3/3/2015 263,600,000,000.00 3/3/2025 3 MAR & 3 SEP
NGFB0010Y00065 12TH FGN BOND 2025 SERIES 3 9.00% FGN MAY 2025 9.00% 22/05/2015 190,000,000,000.00 22/05/2025 22 MAY & 22 NOV.
5,300,418,821,000.00
2016
FGB.2007-000039 4TH FGN BOND 2017 SERIES 8 9.85% FGN JUL 2017 9.85% 27/07/2007 20,000,000,000.00 27/07/2017 27 JAN & 27 JUL.
FGB.2007-000040 4TH FGN BOND 2017 SERIES 9 9.35% FGN AUG 2017 9.35% 31/08/2007 100,000,000,000.00 31/08/2017 29 FEB & 31 AUG.
FGB.2012-000067 5TH FGN BOND 2018 SERIES 2 10.70% FGN MAY 2018 10.70% 30/05/2008 300,000,000,000.00 30/05/2018 30 MAY & 30 NOV.
FGB.2010-000060 5TH FGN BOND 2028 SERIES 5 15.00% FGN NOV 2028 15.00% 28/11/2008 75,000,001,000.00 28/11/2028 28 MAY & 28 NOV.
FGB.2009-000053 6TH FGN BOND 2029 SERIES 3 12.49% FGN MAY 2029 12.49% 22/05/2009 150,000,000,000.00 22/05/2029 22 MAY & 22 NOV.
FGB.2011-000064 6TH FGN BOND 2019 SERIES 4 7.00% FGN OCT 2019 7.00% 23/10/2009 233,896,698,000.00 23/10/2019 23 APR & 23 OCT
FGB.2009-000055 6TH FGN BOND 2029 SERIES 5 8.50% FGN NOV 2029 8.50% 20/11/2009 200,000,000,000.00 20/11/2029 20 MAY & 20 NOV.
FGB.2013-000073 7TH FGN BOND 2030 SERIES 3 10.00% FGN JUL 2030 10.00% 23/07/2010 591,568,208,000.00 23/07/2030 23 JAN & 23 JUL
FGB.2013-000072 9TH FGN BOND 2022 SERIES 1 16.39% FGN JAN 2022 16.39% 27/01/2012 605,310,000,000.00 27/01/2022 27 JAN & 27 JUL
FGB.2013-000075 9TH FGN BOND 2017 SERIES 2 15.10% FGN APR 2017 15.10% 27/04/2012 480,133,082,000.00 27/04/2017 27 APR & 27 OCT
FGB 2012-000069 9TH FGN BOND 2019 SERIES 3 16.00% FGN JUN 2019 16.00% 29/06/2012 351,300,000,000.00 29/06/2019 29 JUN & 29 DEC
FGB 2013-000076 10TH FGN BOND 2016 SERIES 1 13.05% FGN AUG 2016 13.05% 16/08/2013 581,386,704,000.00 16/08/2016 16 FEB & 16 AUG
NGFB0010Y00058/MN 11TH FGN BOND 2024 SERIES 1 14.20% FGN MAR 2024 14.20% 14/03/2014 719,994,128,000.00 14/03/2024 14 MAR & 14 SEP
NGFB0020Y00060/MN 11TH FGN BOND 2034 SERIES 2 12.1493% FGN JUL 2034 12.15% 18/07/2014 1,075,920,115,000.00 18/07/2034 18 JAN & 18 JUL
NGFB0005Y00063/MN 12TH FGN BOND 2020 SERIES 1 15.54% FGN FEB 2020 15.54% 13/02/2015 606,430,000,000.00 13/02/2020 13 FEB & 13 AUG
NGFB0010Y00064/MN 12TH FGN BOND 2025 SERIES 2 12.00% FGN MAR 2025 12.00% 3/3/2015 263,600,000,000.00 3/3/2025 3 MAR & 3 SEP
NGFB0010Y00065/MN 12TH FGN BOND 2025 SERIES 3 9.00% FGN MAY 2025 9.00% 22/05/2015 190,000,000,000.00 22/05/2025 22 MAY & 22 NOV.
NGFB0015Y00066/MN 12TH FGN BOND 2030 SERIES 4 9.00% FGN AUG 2030 9.00% 24/08/2015 98,522,000,000.00 24/08/2030 24 FEB & 24 AUG
NGFB0010Y00067/MN 13TH FGN BOND 2026 SERIES 1 12.50% FGN JAN 2026 12.50% 22/01/2016 326,018,333,000.00 22/01/2026 22 JAN & 22 JUL
NGFB0025Y00067/MN 13TH FGN BOND 2041 SERIES 2 6.00% FGN FEB 2041 6.00% 1/2/2016 402,639,507,796.26 1/2/2041 1 FEB & 1 AUG
NGFB0030Y00068/MN 13TH FGN BOND 2046 SERIES 3 6.00% FGN FEB 2046 6.00% 1/2/2016 402,639,507,796.25 1/2/2046 1 FEB & 1 AUG
NGFB0020Y00068/MN 13TH FGN BOND 2036 SERIES 4 12.40% FGN MAR 2036 12.40% 18/03/2016 155,000,000,000.00 18/03/2036 18 MAR & 18 SEP
NGFB0030Y00069/MN 13TH FGN BOND 2046 SERIES 5 6.00% FGN APR 2046 6.00% 22/04/2016 224,601,000,000.00 22/04/2046 22 APR & 22 OCT
8,153,959,284,592.51
Table 5.6
Federal Government of Nigeria Bonds

72
Table 5.7
Bond Tranche Banks
Discount
House Brokers
Pension
Fund Parastatals
Corporate
Bodies
Insurance
Companies
Trust/Inv./Tax
Fund CBN Individuals Total
4TH FGN BOND 2017 SERIES 8 14.40 0.20 0.00 2.01 0.00 3.39 0.00 0.00 0.00 0.00 20.00
4TH FGN BOND 2017 SERIES 9 73.50 7.23 0.00 7.09 0.00 9.80 0.20 0.00 2.18 0.00 100.00
SUB TOTAL 87.90 7.43 0.00 9.09 0.00 13.19 0.20 0.00 2.18 0.00 120.00
5TH FGN BOND 2018 SERIES 2 150.16 14.48 13.61 99.94 0.00 7.75 0.90 10.26 2.30 0.60 300.00
5TH FGN BOND 2028 SERIES 5 29.34 6.26 0.00 37.46 0.00 1.31 0.00 0.56 0.00 0.07 75.00
SUB TOTAL 179.51 20.74 13.61 137.40 0.00 9.06 0.90 10.82 2.30 0.68 375.00
6TH FGN BOND 2029 SERIES 3 50.42 29.85 6.20 53.71 0.00 2.60 0.00 0.00 7.22 0.00 150.00
6TH FGN BOND 2019 SERIES 4 89.07 17.15 24.80 62.85 0.00 19.27 0.70 11.88 8.15 0.03 233.90
6TH FGN BOND 2029 SERIES 5 109.45 46.44 2.00 12.60 0.00 4.75 0.10 8.10 16.50 0.05 200.00
SUB TOTAL 248.94 93.44 33.00 129.16 0.00 26.62 0.80 19.98 31.87 0.08 583.90
7TH FGN BOND 2030 SERIES 3 169.14 8.62 23.16 255.34 0.00 100.12 8.45 14.46 12.10 0.18 591.57
SUB TOTAL 169.14 8.62 23.16 255.34 0.00 100.12 8.45 14.46 12.10 0.18 591.57
9TH FGN BOND 2022 SERIES 1 195.31 14.01 54.99 99.86 130.61 81.78 12.61 15.93 0.00 0.21 605.31
9TH FGN BOND 2017 SERIES 2 182.16 9.31 46.13 73.94 90.00 64.49 9.93 3.96 0.00 0.23 480.13
9TH FGN BOND 2019 SERIES 3 150.82 7.35 24.89 56.18 38.80 62.96 7.78 1.89 0.00 0.63 351.30
SUB TOTAL 528.28 30.68 126.01 229.97 259.41 209.23 30.31 21.78 0.00 1.07 1,436.74
10TH FGN BOND 2016 SERIES 1 200.47 3.41 54.76 113.31 124.80 63.00 6.23 14.04 0.00 1.37 581.39
SUB TOTAL 200.47 3.41 54.76 113.31 124.80 63.00 6.23 14.04 0.00 1.37 581.39
11TH FGN BOND 2024 SERIES 1 134.02 16.36 93.94 115.47 93.60 107.99 3.76 34.53 0.00 0.34 599.99
11TH FGN BOND 2034 SERIES 2 76.18 9.99 54.36 114.14 0.00 41.88 11.20 16.68 0.00 0.07 324.50
SUB TOTAL 210.20 26.35 148.30 229.61 93.60 149.87 14.96 51.21 0.00 0.40 924.49
12TH FGN BOND 2020 SERIES 1 64.27 1.04 13.34 46.81 99.73 4.64 2.06 1.02 0.00 0.83 233.73
12TH FGN BOND 2025 SERIES 2 0.00 0.00 0.00 0.00 0.00 0.00 0.00 0.00 263.60 0.00 263.60
12TH FGN BOND 2025 SERIES 3 0.00 0.00 0.00 0.00 0.00 0.00 0.00 0.00 190.00 0.00 190.00
SUB TOTAL 64.27 1.04 13.34 46.81 99.73 4.64 2.06 1.02 453.60 0.83 687.33
GRAND TOTAL 1,688.70 191.70 412.18 1,150.70 577.55 575.73 63.89 133.31 502.05 4.61 5,300.42
Federal Government of Nigeria Bond Outstanding: Class of Holders (N'Billion)
January - June 2015
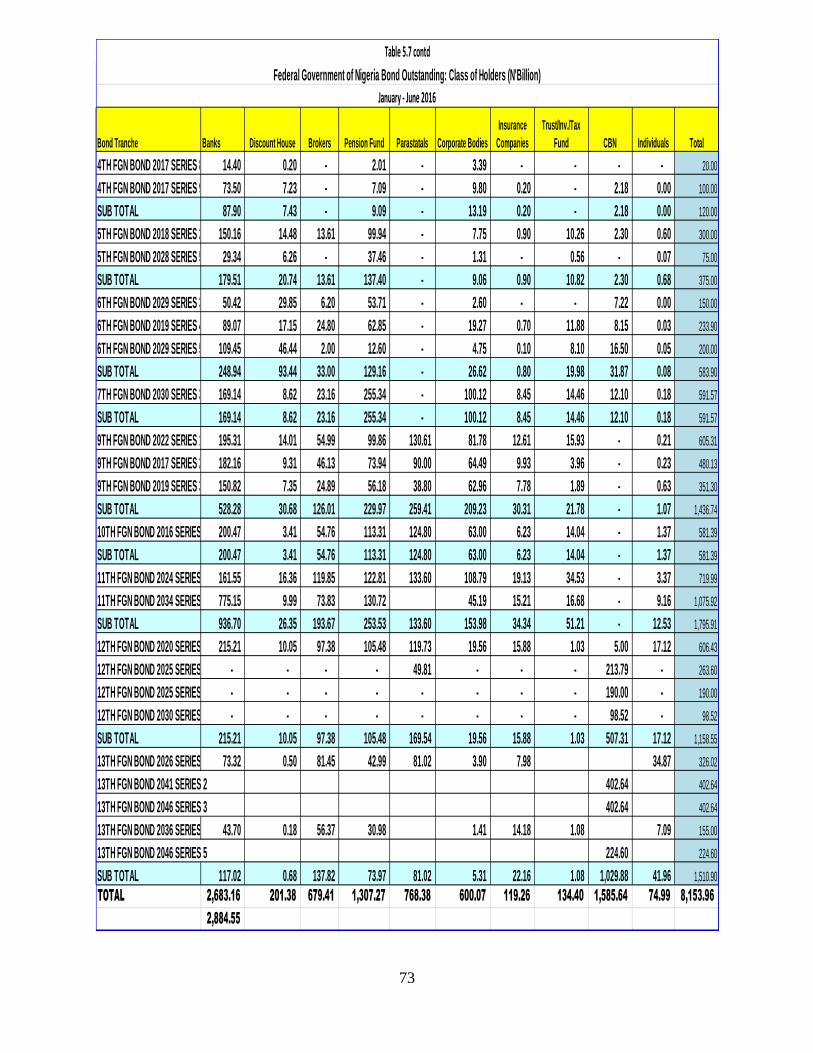
73
Bond Tranche Banks Discount House Brokers Pension Fund Parastatals Corporate Bodies
Insurance
Companies
Trust/Inv./Tax
Fund CBN Individuals Total
4TH FGN BOND 2017 SERIES 8 14.40 0.20 - 2.01 - 3.39 - - - - 20.00
4TH FGN BOND 2017 SERIES 9 73.50 7.23 - 7.09 - 9.80 0.20 - 2.18 0.00 100.00
SUB TOTAL 87.90 7.43 - 9.09 - 13.19 0.20 - 2.18 0.00 120.00
5TH FGN BOND 2018 SERIES 2 150.16 14.48 13.61 99.94 - 7.75 0.90 10.26 2.30 0.60 300.00
5TH FGN BOND 2028 SERIES 5 29.34 6.26 - 37.46 - 1.31 - 0.56 - 0.07 75.00
SUB TOTAL 179.51 20.74 13.61 137.40 - 9.06 0.90 10.82 2.30 0.68 375.00
6TH FGN BOND 2029 SERIES 3 50.42 29.85 6.20 53.71 - 2.60 - - 7.22 0.00 150.00
6TH FGN BOND 2019 SERIES 4 89.07 17.15 24.80 62.85 - 19.27 0.70 11.88 8.15 0.03 233.90
6TH FGN BOND 2029 SERIES 5 109.45 46.44 2.00 12.60 - 4.75 0.10 8.10 16.50 0.05 200.00
SUB TOTAL 248.94 93.44 33.00 129.16 - 26.62 0.80 19.98 31.87 0.08 583.90
7TH FGN BOND 2030 SERIES 3 169.14 8.62 23.16 255.34 - 100.12 8.45 14.46 12.10 0.18 591.57
SUB TOTAL 169.14 8.62 23.16 255.34 - 100.12 8.45 14.46 12.10 0.18 591.57
9TH FGN BOND 2022 SERIES 1 195.31 14.01 54.99 99.86 130.61 81.78 12.61 15.93 - 0.21 605.31
9TH FGN BOND 2017 SERIES 2 182.16 9.31 46.13 73.94 90.00 64.49 9.93 3.96 - 0.23 480.13
9TH FGN BOND 2019 SERIES 3 150.82 7.35 24.89 56.18 38.80 62.96 7.78 1.89 - 0.63 351.30
SUB TOTAL 528.28 30.68 126.01 229.97 259.41 209.23 30.31 21.78 - 1.07 1,436.74
10TH FGN BOND 2016 SERIES 1 200.47 3.41 54.76 113.31 124.80 63.00 6.23 14.04 - 1.37 581.39
SUB TOTAL 200.47 3.41 54.76 113.31 124.80 63.00 6.23 14.04 - 1.37 581.39
11TH FGN BOND 2024 SERIES 1 161.55 16.36 119.85 122.81 133.60 108.79 19.13 34.53 - 3.37 719.99
11TH FGN BOND 2034 SERIES 2 775.15 9.99 73.83 130.72 45.19 15.21 16.68 - 9.16 1,075.92
SUB TOTAL 936.70 26.35 193.67 253.53 133.60 153.98 34.34 51.21 - 12.53 1,795.91
12TH FGN BOND 2020 SERIES 1 215.21 10.05 97.38 105.48 119.73 19.56 15.88 1.03 5.00 17.12 606.43
12TH FGN BOND 2025 SERIES 2 - - - - 49.81 - - - 213.79 - 263.60
12TH FGN BOND 2025 SERIES 3 - - - - - - - - 190.00 - 190.00
12TH FGN BOND 2030 SERIES 4 - - - - - - - - 98.52 - 98.52
SUB TOTAL 215.21 10.05 97.38 105.48 169.54 19.56 15.88 1.03 507.31 17.12 1,158.55
13TH FGN BOND 2026 SERIES 1 73.32 0.50 81.45 42.99 81.02 3.90 7.98 34.87 326.02
13TH FGN BOND 2041 SERIES 2 402.64 402.64
13TH FGN BOND 2046 SERIES 3 402.64 402.64
13TH FGN BOND 2036 SERIES 4 43.70 0.18 56.37 30.98 1.41 14.18 1.08 7.09 155.00
13TH FGN BOND 2046 SERIES 5 224.60 224.60
SUB TOTAL 117.02 0.68 137.82 73.97 81.02 5.31 22.16 1.08 1,029.88 41.96 1,510.90
TOTAL 2,683.16 201.38 679.41 1,307.27 768.38 600.07 119.26 134.40 1,585.64 74.99 8,153.96
2,884.55
Table 5.7 contd
Federal Government of Nigeria Bond Outstanding: Class of Holders (N'Billion)
January - June 2016

74
Range of Bids
Stop
Rates Range of Bids Stop Rates Range of Bids Stop Rates
January
10.0000-14.5000 11.2000 11.0000-16.0000 14.4000 10.9000-19.0000 15.0000
10.0000-13.0900 11.2000 11.0000-14.9915 14.1900 11.2500-16.9980 14.5616
February
9.5000-15.0000 10.9800 9.5000-14.9999 13.9000 13.0000-18.0000 14.3000
9.5000-15.0000 10.7500 10.0000-16.4915 13.7000 12.5000-19.9800 15.2500
March
9.0000-14.5000 10.8000 10.2500-15.6915 14.8500 12.0000-17.6185 15.8990
10.0000-14.5000 10.7900 10.0000-15.8000 14.7000 14.0000-18.9800 15.3500
10.0000-15.6915 10.6999 14.0000-15.6915 14.5000 14.0000-15.6915 14.85
April
9.5000 – 15.0000 10.5000 13.0000 – 15.6915 14.1000 11.0000 – 16.3185 14.1500
9.2000 – 15.0000 10.0900 11.3500 – 15.0000 12.8000 12.0000 – 16.3185 12.9999
May
9.2500-14.0000 10.0900 10.0000-15.0000 12.8900 10.0000-16.3185 13.3990
9.0000-13.6000 9.9500 10.0000-15.4300 12.7500 11.4300-16.5549 13.0000
June
7.5000-15.0000 9.7990 10.0000-14.6432 12.7000 11.0000-16.2832 12.9999
7.5000-15.0000 10.0000 10.0000-14.6432 12.7000 11.4300-16.5549 12.8000
9.0000 – 14.0000 10.0000 12.0000 – 14.6432 12.8000 12.0000 – 16.2832 13.0000
Range of Bids
Stop
Rates Range of Bids Stop Rates Range of Bids Stop Rates
January
3.0000-9.0000 4.0000 5.0000-9.0000 6.9900 6.0000-10.8300 8.0500
3.2500-6.5990 4.2900 4.0000-10.0000 7.5900 6.5000-14.5000 9.3285
February
3.0000-9.0000 4.9500 6.0000-10.0000 7.9780 8.0000-15.0000 9.4900
3.0000-7.0000 4.8500 6.2500-9.5000 7.3000 8.4895-14.0000 8.9800
March
4.0000-7.2000 5.1860 6.1250-12.0000 7.5700 7.7000-10.9800 9.0000
4.5000-11.0000 5.7490 6.0000-11.0000 7.9500 8.0000-13.2521 9.1500
5.0000-10.0000 5.9999 7.0000-10.9365 8.3000 8.5000-14.3584 9.5585
April
5.0000-10.0000 6.1000 7.0000-10.0235 8.6900 8.0000-13.2521 9.4880
5.0000-10.0000 7.8802 6.0100-10.0235 8.9900 8.9900-14.2521 10.2485
May
6.0000-10.0000 7.9990 7.0000-11.5000 9.0000 9.0000-14.2521 11.0500
6.0000-13.0000 8.1000 7.5000-13.3048 9.2000 8.0000-17.1521 12.4800
June
6.0000-12.1250 7.9900 8.0000-10.6905 9.0500 10.1200-14.5521 11.1000
6.7500-10.0000 8.0000 7.5000-13.0948 9.3500 9.0000-13.8027 11.9900
7.5000-13.0000 9.9948 8.5000-17.9988 12.3000 10.5000-21.9456 14.9990
Table 5.8
91 182 364
91 182 364
Marginal Rates and Range of Successful Bids Schedule, June 2015
Marginal Rates and Range of Successful Bids Schedule, June 2016

75
2015 January February March April May June Total
(N'billion) (N'billion) (N'billion) (N'billion) (N'billion) (N'billion) (N'billion)
NTBs 2,588,534,724 3,005,687,222 2,845,252,134 4,124,279,853 4,812,093,845 3,798,377,735 21,174,225,511
FGN Bonds 715,929,460 519,484,907 723,762,992 1,003,081,933 841,244,014 539,359,400 4,342,862,706
3,304,464,184 3,525,172,129 3,569,015,126 5,127,361,786 5,653,337,859 4,337,737,135 25,517,088,217
2016 January February March April May June Total
(N'billion) (N'billion) (N'billion) (N'billion) (N'billion) (N'billion) (N'billion)
NTBs 2,132,932,231 2,394,278,719 3,282,986,205 3,962,618,639 3,253,285,040 3,569,230,153 18,595,330,987
FGN Bonds 1,187,667,364 842,097,871 914,348,177 886,686,435 689,449,710 454,138,740 4,974,388,297
3,320,599,595 3,236,376,590 4,197,334,382 4,849,305,074 3,942,734,750 4,023,368,893 23,569,719,283
Over the Counter Transactions
Table 5.9

76
INTEREST AND JANUARY FEBRUARY MARCH APRIL MAY JUNE TOTAL
SINKING FUND CHARGES
NIGERIA TREASURY BILLS:
{i} 91 1.96 1.90 1.71 1.64 2.10 1.76 11.06
{ii} 182 4.98 3.03 6.79 4.52 2.45 7.34 29.11
{iii} 364 24.56 24.48 35.74 25.86 14.79 25.44 150.88
TREASURY BONDS 3.13 3.13 3.13 3.13 3.13 3.13 18.75
S/ FUND ON TREASURY BONDS 0.56 0.49 0.43 0.37 0.33 0.29 2.46
3RD FGN BONDS 0.00 0.00 0.00 0.00 0.00 0.00 0.00
4TH FGN BONDS 0.99 4.64 0.00 0.00 0.00 0.00 5.63
5TH FGN BONDS 0.00 0.00 0.00 0.00 21.50 0.00 21.50
6TH FGN BONDS 0.00 0.00 0.00 8.16 17.72 0.00 25.88
7TH FGN BONDS 29.82 0.00 0.00 10.67 0.00 0.00 40.49
8TH FGN BONDS 0.00 0.00 0.00 0.00 0.00 0.00 0.00
9TH FGN BONDS 50.01 0.00 0.00 36.15 0.00 28.03 114.19
10TH FGN BONDS 0.00 38.25 0.00 0.00 0.00 0.00 38.25
11TH FGN BONDS 12.62 0.00 35.19 0.00 0.00 0.00 47.80
TOTAL 128.62 75.91 82.98 90.50 62.01 65.98 506.00
CUMMULATIVE TOTAL 128.62 204.53 287.51 378.00 440.02 506.00
Table 5.10Domestic Debt Charges, 2015 (N'Billion)

77
INTEREST AND JANUARY FEBRUARY MARCH APRIL MAY JUNE TOTAL
SINKING FUND CHARGES
NIGERIA TREASURY BILLS:
{i} 91 1.38 1.02 1.45 0.88 0.86 1.32 6.92
{ii} 182 4.02 3.86 5.68 3.75 1.64 2.43 21.39
{iii} 364 29.98 28.27 57.02 30.06 18.01 28.28 191.62
TREASURY BONDS 0.00 1.90 3.13 3.13 3.13 3.13 14.40
S/ FUND ON TREASURY BONDS 0.00 0.49 0.43 0.37 0.33 0.29 1.90
3RD FGN BONDS 0.00 0.00 0.00 0.00 0.00 0.00 0.00
4TH FGN BONDS 0.99 4.66 0.00 0.00 0.00 0.00 5.65
5TH FGN BONDS 0.00 0.00 0.00 0.00 21.57 0.00 21.57
6TH FGN BONDS 0.00 0.00 0.00 8.19 17.78 0.00 25.98
7TH FGN BONDS 29.81 0.00 0.00 0.00 0.00 0.00 29.81
8TH FGN BONDS 0.00 0.00 0.00 0.00 0.00 0.00 0.00
9TH FGN BONDS 49.99 0.00 0.00 36.29 0.00 28.11 114.38
10TH FGN BONDS 0.00 38.22 0.00 0.00 0.00 0.00 38.22
11TH FGN BONDS 24.22 0.00 50.92 0.00 0.00 0.00 75.14
12TH FGN BONDS 0.00 46.11 15.76 0.00 8.51 0.00 70.38
13TH FGN BONDS 0.00 0.00 0.00 0.00 0.00 0.00 0.00
TOTAL 140.39 124.54 134.39 82.67 71.82 63.55 617.36
CUMMULATIVE TOTAL 140.39 264.93 399.32 481.99 553.81 617.36
Table 5.10 contdDomestic Debt Charges, 2016 (N'Billion)


![[PPT]PowerPoint Presentation - ITU: Committed to … · Web viewNIBSS is owned by all the Banks in Nigeria and the Central bank of Nigeria. NIBSS Mandate Provides a shared service/infrastructure](https://img.pdfslide.us/doc/110x75/5aec2a637f8b9ac3619019d3/pptpowerpoint-presentation-itu-committed-to-viewnibss-is-owned-by-all-the.jpg)