Embed Size (px)
Citation preview

CENTRAL BANK OF SWAZILAND | F INANCIAL STABILITY REPORT I ssue No. 1
a© 2017 Central Bank Of Swaziland

FINANCIAL STABILITY REPORT I ssue No. 1 | CENTRAL BANK OF SWAZILAND
b © 2017 Central Bank Of Swaziland

CENTRAL BANK OF SWAZILAND | F INANCIAL STABILITY REPORT I ssue No. 1
i© 2017 Central Bank Of Swaziland
S DW NA AZIL
EMNTSHOLI
June 2017 Issue No. 1
FINANCIAL STABILITY REPORT
CeNtral BaNk Of SwazIlaNd

FINANCIAL STABILITY REPORT I ssue No. 1 | CENTRAL BANK OF SWAZILAND
ii © 2017 Central Bank Of Swaziland
the mission of the Central Bank of Swaziland (the Bank) is to foster a stable financial sector that is conducive to economic development in Swaziland. One of the principal objectives of the Bank - as stipulated in the Central Bank of Swaziland Order, 1974 (as amended) - is to supervise banks, credit financial institutions and other financial institutions to the end of promoting a sound financial structure. In accordance with the Constitution of the Kingdom of Swaziland Act 2005, specifically sections 206 (2) (d) and (f), the Bank shall supervise the operations of financial institutions in the Kingdom, and promote monetary stability and a sound and stable financial
structure in Swaziland. Swaziland’s current financial stability framework is adopted from the Common Market for eastern and Southern Africa (COMESA)1 framework, which includes the responsibility to publish financial stability reports (FSRs).
The FSR 2017 is the first publication of its kind by the Bank. While FSRs are issued with the overarching objective of limiting financial instability by communicating key risks and vulnerabilities to relevant stakeholders, the Bank also views the FSR as a platform for enhancing and further contributing to overall financial system stability, increasing
1http://cmi.comesa.int/wp-content/uploads/2016/03/Shields-Manual-on-Financial-Stability-By-Gift-Chirozva.pdf
FOREWORD BY THE GOVERNOR AND CHAIRMAN OF THE FINANCIAL STABILITY COMMITTEE
MR MAJOZI V. SITHOLEGOVERNOR

CENTRAL BANK OF SWAZILAND | F INANCIAL STABILITY REPORT I ssue No. 1
iii© 2017 Central Bank Of Swaziland
accountability of the financial stability function and strengthening co-operation on financial stability among relevant authorities.
The report presents an assessment of the global, regional and domestic macro-financial developments encompassing the real economy, financial markets, financial institutions, financial system infrastructure, and the legal and policy frameworks. Recognizing the interlinkages between the macro economy and financial system, the FSR 2017 highlights emerging risks and vulnerabilities both in the international context more generally and from the Swaziland perspective specifically. The early detection of possible risks to the financial system is necessary to give policy makers sufficient lead-time to take pre-emptive action to avert a systemic crisis.
One of the most critical functions of the financial system is that it facilitates financial intermediation by connecting savers and investors, thereby channelling surplus funds to productive investments that will stimulate economic activity and — ultimately — economic growth. A sound, stable, safe, effective and efficient financial system pools surplus funds, transfers and minimises risks, while at the same time increasing liquidity and information sharing through financial innovations and technology. In this regard, the financial sector regulators contribute immensely to economic development through provision of a wide range of regulatory services that promote orderly and proportionate growth, development and functioning of financial institutions, financial markets and financial system infrastructure. Regulators continuously monitor and evaluate performance, soundness and stability of regulated financial institutions in order to detect, prevent and isolate system-wide risks.
Financial stability is more difficult to define than price stability, which simply relates to, among other indicators, a stable inflation environment and the internal and external value of the currency. One perspective is that financial
2Systemic risk is the risk that the default of one institution in the system can lead to the default of one or more otherwise sound institutions, thereby threatening the markets and the economy as a whole.
stability may antithetically be defined as the absence of systemic risk,2 while yet another is that financial stability may be defined in terms of what is necessary to achieve it, for example a sound regulatory environment, effective macro-prudential surveillance and public confidence in the financial system.
While Swaziland largely maintained a stable financial system and a resilient economy in 2016, the local currency was somewhat volatile against the United States (US) Dollar. On average, inflation remained stubbornly above the upper end of the Southern African Development Community (SADC) macroeconomic convergence target band of 3%-7%. This FSR highlights some policy interventions that could be taken in order to cushion the economy and financial system, in particular in mitigating any potential vulnerability.
In view of the above, the Central Bank of Swaziland defines financial stability as a condition in which the financial system comprising of financial intermediaries, markets and market infrastructures is capable of withstanding internal and external shocks such that participants have confidence in the system.
Overall, greater public awareness of financial system vulnerabilities in itself may serve to encourage financial institutions to curb activities that might exacerbate systemic risks and help to promote policy reforms to strengthen the resilience of the financial sector. The period covered by this report is from January 2016 to June 2017; however, as this report is also forward-looking, current data and forecasts have been used where appropriate. The Bank intends publishing a financial stability report annually in June.
Majozi V. SitholeGOVERNOR

FINANCIAL STABILITY REPORT I ssue No. 1 | CENTRAL BANK OF SWAZILAND
iv © 2017 Central Bank Of Swaziland
CONTENTSGlossary ........................................................................................................................ 1
1. Introduction ............................................................................................................ 3
2. Swaziland Financial System Cobweb .............................................................................. 42.1 External Environment .......................................................................................... 52.2 Domestic Economy .............................................................................................. 52.3 Household Debt ................................................................................................. 62.4 Corporate Sector ................................................................................................ 62.5 Banking sector ................................................................................................... 62.6 Non-bank Financial Sector ..................................................................................... 72.7 Payments Systems Stability ................................................................................... 7
3. Financial stability developments and trends .................................................................... 83.1 Global Economic Growth and Outlook ....................................................................... 11
3.1.1 Government Fiscal Position ........................................................................ 173.2 Domestic Economic Outlook ................................................................................... 15
3.1.1 Government Debt .................................................................................... 20
4. Developments and Risk Analysis of the Banking System ...................................................... 204.1 Credit and Funding Concentration ........................................................................... 244.2 Banks’ Funding Structure ...................................................................................... 254.3 Liquidity Risk .................................................................................................... 26
5. Developments and Risk Analysis of Non-Bank Financial Institutions ........................................ 285.1 Capital Markets ................................................................................................. 285.2 Insurance Sector ................................................................................................ 295.3 Retirement Funds ............................................................................................... 325.4 Savings and Credit Cooperatives Societies ................................................................. 345.5 Credit Financial Institutions .................................................................................. 36
6. Payment infrastructure and regulatory developments ........................................................ 386.1 Card Transactions ............................................................................................... 396.2 MTN Mobile Phone Money Transfers ......................................................................... 40
7. Regulatory Developments to Improve The Robustness of the Domestic Financial Infrastructure .... 417.1 Review of the Financial Institutions Act, 2005 and Central Bank Order, 1974 ........................ 417.2 Drafting of Financial Stability Bill ........................................................................... 417.3 Policy Implementation: 2015-2016 ........................................................................... 41
7.3.1 National Payments System ......................................................................... 417.3.2 Bank Supervision ..................................................................................... 41
8. Stress-Testing The Swaziland Banking Sector ................................................................... 438.1 Credit risk ........................................................................................................ 43
8.1.1 Default by the largest borrowers ................................................................. 448.2 Liquidity Risk .................................................................................................... 44
8.2.1 Simulated Bank Run ................................................................................. 448.2.2 Sudden withdrawal by systemic largest depositor ............................................. 45
8.3 Scenario Analysis ................................................................................................ 458.4 Worst-case Scenario ............................................................................................ 45
9. Statistical Appendix ................................................................................................... 46

CENTRAL BANK OF SWAZILAND | F INANCIAL STABILITY REPORT I ssue No. 1
v© 2017 Central Bank Of Swaziland
FIGURESFigure 1: Financial System Cobweb ........................................................................ 4
Figure 2: Inflation and Economic Growth.................................................................. 11
Figure 3: Fiscal and Current Account Positions ........................................................... 12
Figure 4: Swaziland’s Fiscal Balance ....................................................................... 12
Figure 5: Debt-to-GDP Ratio ................................................................................. 14
Figure 6: Household Debt by Type of Institutions ........................................................ 16
Figure 7: Corporate Sector Assets .......................................................................... 18
Figure 8: Corporate Debt Composition .................................................................... 19
Figure 9: Banking Sector Assets ............................................................................. 20
Figure 10: Bank Credit Growth Rate ......................................................................... 22
Figure 11: Banks’ Non-Performing Loans .................................................................... 23
Figure 12: Sectorial Distribution of Loans .................................................................. 24
Figure 13: Banks’ Sources of Funding........................................................................ 25
Figure 14: Structure of Deposits ............................................................................. 26
Figure 15: Asset Allocation - Other Long-term Instruments .............................................. 28
Figure 16: Asset Allocation - Money Market ................................................................ 29
Figure 17: Short-term Insurance Asset Distribution as at 31 December 2016 ......................... 30
Figure 18: Premium Income Distribution as at 31 December 2016 ...................................... 30
Figure 19: Long-term Insurance Industry Year-On-Year Indicators ...................................... 31
Figure 20: Long-term Insurance Industry Asset Distribution as at 31 December 2016 ............... 32
Figure 21: Premium Income Distribution as at 31 December 2016 ...................................... 33
Figure 22: Retirement Funds Assets as at 31 December 2016 ........................................... 33
Figure 23: Local Asset Distribution as at 31 December 2016 ............................................ 34
Figure 24: Foreign Asset Distribution as at 31 December 2016 .......................................... 34
Figure 25: SACCOS’ Performance ............................................................................. 35
Figure 26: Total Credit Financial Institutions Loan Book: 2012-2016 ................................... 37
Figure 27: SAECH Cheques Volume and Value .............................................................. 38
Figure 28: SAECH EFT CR & DR Volume and Value ......................................................... 39

FINANCIAL STABILITY REPORT I ssue No. 1 | CENTRAL BANK OF SWAZILAND
vi © 2017 Central Bank Of Swaziland
TABLESTable 1: Economic growth projections for selected countries/regions ............................9
Table 2: SADC Macroeconomic Convergence Indicators ..............................................13
Table 3: Composition of Government’s Domestic Debt by Maturity ................................15
Table 4: Composition of Government Securities by Ownership .....................................15
Table 5: Proportion of Bank Credit by type of Corporate ............................................ 17
Table 6: Selected Indicators for the Corporate Sector ............................................... 19
Table 7: Changes in Banks’ Assets........................................................................21
Table 8: Indicators of Banking Sector Profitability After-tax ........................................ 22
Table 9: Banks’ Credit Concentration Level ............................................................ 24
Table 10: Banks’ Funding Concentration Level ..........................................................25
Table 11: Banking Sector Maturity Analysis as at end December 2016 ..............................26
Table 12: Key Indicators of Bank Liquidity (percentage ratios)....................................... 27
Table 13: SACCOS’ Financial Position .....................................................................35
Table 14: SWIPSS Flows .....................................................................................38
Table 15: Paper Instrument (Cheques) Flows ............................................................39
Table 16: Other Payment Instruments Usage ............................................................ 40
Table 17: MTN Mobile Phone Money Transactions ....................................................... 40
Table 18: Summary of Stress Test Shocks and Breaking Points ........................................43
Table 19: Summary of Stress Test Results for Loans Migration ........................................43
Table 20: Default by the Largest Borrowers ............................................................. 44
Table 21: Summary of Stress Test Results for Bank Run ................................................ 44
Table 22: Sudden Withdrawal By Systemic Largest Depositor ........................................45
Table 23: Selected Quarterly Financial Soundness Indicators for Swaziland .......................46
Table 24: Commercial Banks’ Quarterly Financial Soundness Indicators ............................47
Table 25: Commercial Banks’ Quarterly Balance Sheet ................................................ 49
Table 26: Commercial Banks’ Quarterly Income Statement, year-on-year Figures ................51
BOXES:Box 1: Government Arears ..............................................................................13
Box 2: Calculating Household Disposable Income ................................................... 17

CENTRAL BANK OF SWAZILAND | F INANCIAL STABILITY REPORT I ssue No. 1
1© 2017 Central Bank Of Swaziland
GLOSSARY
ALSI All Shares Index
ATMs Automated Teller Machines
BCBS Basel Committee on Banking Supervision
BIS Bank for International Settlements
BOP Balance of Payments
CBR Central Bank rate
CBS Central Bank of Swaziland
CMA Common Monetary Area
CODAS Co-operative Data Analysis System
CSO Central Statistics Office
DIR Debt Service-to-Income Ratio
DSA Debt Sustainability Analysis
DTS Deposits Taking SACCOs
EMEs Emerging Market Economies
FDI Foreign Direct Investment
FSC Financial Stability Committee
FSI Financial Stability Indicators
FSR Financial Stability Report
FSRA Financial Services Regulatory Authority
FSTC Financial Stability Technical Committee
GDP Gross Domestic Product
IMF International Monetary Fund
IT Information Technology
JSE Johannesburg Stock Exchange
LCR Liquidity Coverage Ratio

FINANCIAL STABILITY REPORT I ssue No. 1 | CENTRAL BANK OF SWAZILAND
2 © 2017 Central Bank Of Swaziland
LHS left Hand Side
MENA Middle East and North Africa
MTDS Medium Term Debt Strategy
NPLs Non-Performing Loans
NSFR Net Stable Funding Ratio
RHS Right Hand Side
ROA return on assets
ROE Return on Equity
SAECH Swaziland Automated Clearing House
SIPS Systemically Important Payment System
SMEs Small and Medium Enterprises
SSA Sub-Saharan Africa
SSX Swaziland Stock Exchange
SWIPSS Swaziland Interbank Payment and Settlement System
TRWA Total Risk-Weighted Assets
USA United States of America
USD United States Dollar
WEO World Economic Outlook
CENTRAL BANK OF SWAZILAND | F INANCIAL STABILITY REPORT I ssue No. 1
3© 2017 Central Bank Of Swaziland
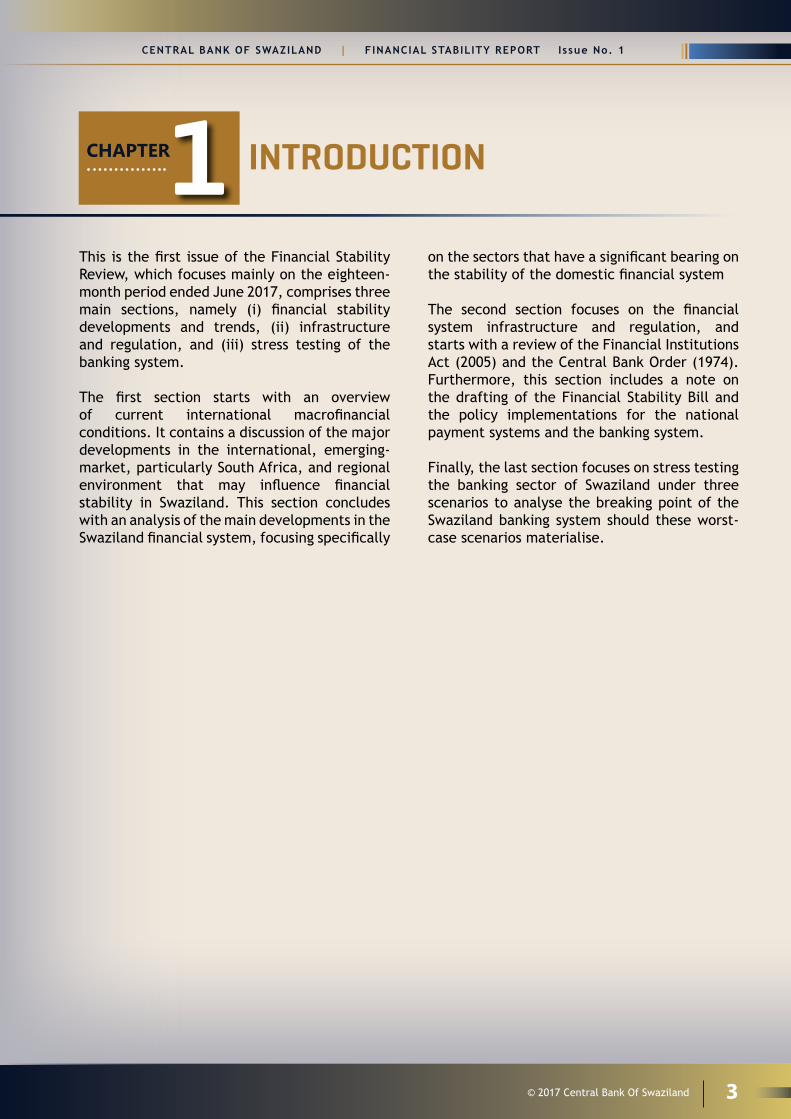
This is the first issue of the Financial Stability Review, which focuses mainly on the eighteen-month period ended June 2017, comprises three main sections, namely (i) financial stability developments and trends, (ii) infrastructure and regulation, and (iii) stress testing of the banking system.
The first section starts with an overview of current international macrofinancial conditions. It contains a discussion of the major developments in the international, emerging-market, particularly South Africa, and regional environment that may influence financial stability in Swaziland. This section concludes with an analysis of the main developments in the Swaziland financial system, focusing specifically
on the sectors that have a significant bearing on the stability of the domestic financial system
The second section focuses on the financial system infrastructure and regulation, and starts with a review of the Financial Institutions Act (2005) and the Central Bank Order (1974). Furthermore, this section includes a note on the drafting of the Financial Stability Bill and the policy implementations for the national payment systems and the banking system.
Finally, the last section focuses on stress testing the banking sector of Swaziland under three scenarios to analyse the breaking point of the Swaziland banking system should these worst-case scenarios materialise.
INTRODUCTIONCHAPTER1

FINANCIAL STABILITY REPORT I ssue No. 1 | CENTRAL BANK OF SWAZILAND
4 © 2017 Central Bank Of Swaziland
Figure 1: Financial System Cobweb
External Environment
Domestic Economy
Household debt
Corporate Sector HealthBanking Sector
Payments System Stability
Baseline Jun-17
NBFIs Sector
3See: http://www.riksbank.se/Documents/Rapporter/Ekonomiska_kommentarer/2012/rap_ek_kom_nr05_121128_eng.pdf
A cobweb3 is used to plot a summary of the assessment of financial stability. The assessment is largely based on the analysis of a range of quantitative indicators and variables. This applies to the assessment of the current situation as well as the assessment of the risks that might affect financial stability in the future. Risks are rated on a scale of 1 to 5, with 5 being the highest/worst risk rating. It is important to note that a large degree of judgement is used.
SWAZILAND FINANCIAL SYSTEM COBWEB
CHAPTER2The Bank has used seven categories for the cobweb to measure financial stability, namely:1. external environment;2. domestic economy;3. household debt;4. corporate sector health;5. banking sector;6. payments system stability; and7. non-bank financial sector.
CENTRAL BANK OF SWAZILAND | F INANCIAL STABILITY REPORT I ssue No. 1
5© 2017 Central Bank Of Swaziland
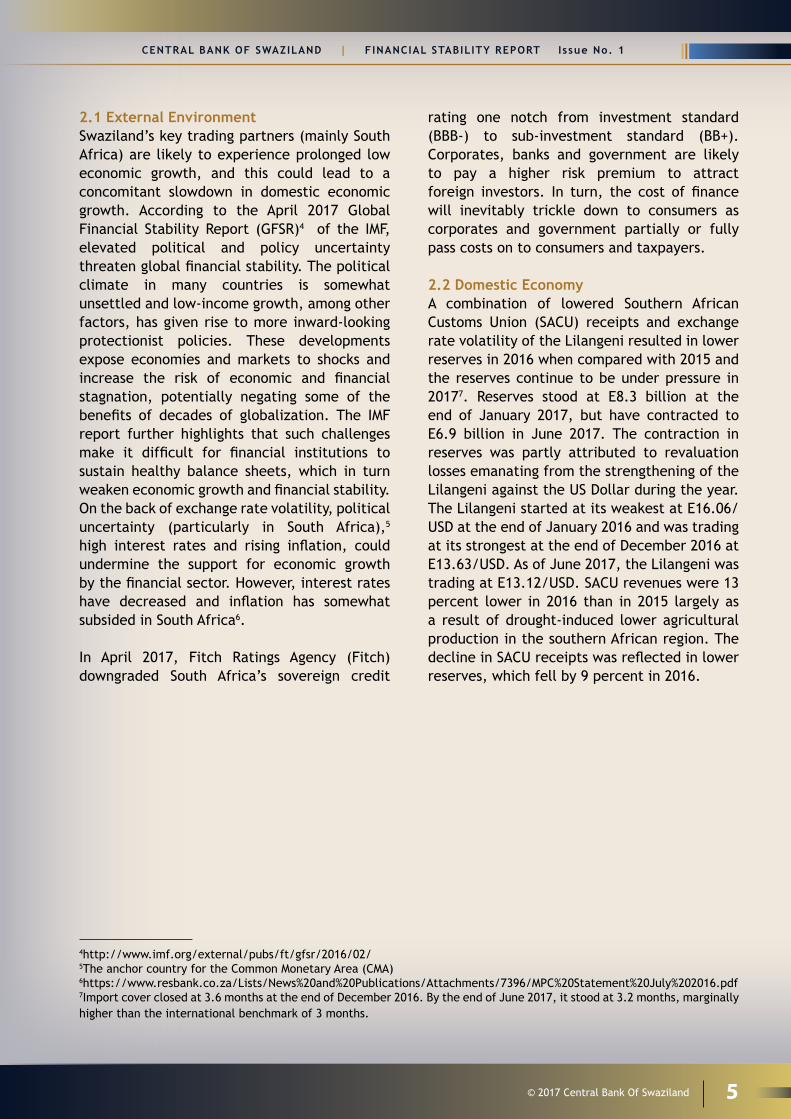
2.1 External EnvironmentSwaziland’s key trading partners (mainly South Africa) are likely to experience prolonged low economic growth, and this could lead to a concomitant slowdown in domestic economic growth. According to the April 2017 Global Financial Stability Report (GFSR)4 of the IMf, elevated political and policy uncertainty threaten global financial stability. The political climate in many countries is somewhat unsettled and low-income growth, among other factors, has given rise to more inward-looking protectionist policies. These developments expose economies and markets to shocks and increase the risk of economic and financial stagnation, potentially negating some of the benefits of decades of globalization. The IMF report further highlights that such challenges make it difficult for financial institutions to sustain healthy balance sheets, which in turn weaken economic growth and financial stability. On the back of exchange rate volatility, political uncertainty (particularly in South Africa),5 high interest rates and rising inflation, could undermine the support for economic growth by the financial sector. However, interest rates have decreased and inflation has somewhat subsided in South Africa6.
In April 2017, Fitch Ratings Agency (Fitch) downgraded South Africa’s sovereign credit
4http://www.imf.org/external/pubs/ft/gfsr/2016/02/ 5The anchor country for the Common Monetary Area (CMA)6https://www.resbank.co.za/Lists/News%20and%20Publications/Attachments/7396/MPC%20Statement%20July%202016.pdf7Import cover closed at 3.6 months at the end of December 2016. By the end of June 2017, it stood at 3.2 months, marginally higher than the international benchmark of 3 months.
rating one notch from investment standard (BBB-) to sub-investment standard (BB+). Corporates, banks and government are likely to pay a higher risk premium to attract foreign investors. In turn, the cost of finance will inevitably trickle down to consumers as corporates and government partially or fully pass costs on to consumers and taxpayers.
2.2 Domestic EconomyA combination of lowered Southern African Customs Union (SACU) receipts and exchange rate volatility of the Lilangeni resulted in lower reserves in 2016 when compared with 2015 and the reserves continue to be under pressure in 20177. Reserves stood at E8.3 billion at the end of January 2017, but have contracted to E6.9 billion in June 2017. The contraction in reserves was partly attributed to revaluation losses emanating from the strengthening of the Lilangeni against the US Dollar during the year. The Lilangeni started at its weakest at E16.06/USD at the end of January 2016 and was trading at its strongest at the end of December 2016 at E13.63/USD. As of June 2017, the Lilangeni was trading at E13.12/USD. SACU revenues were 13 percent lower in 2016 than in 2015 largely as a result of drought-induced lower agricultural production in the southern African region. The decline in SACU receipts was reflected in lower reserves, which fell by 9 percent in 2016.

FINANCIAL STABILITY REPORT I ssue No. 1 | CENTRAL BANK OF SWAZILAND
6 © 2017 Central Bank Of Swaziland
SACU revenues make up a significant portion of total government revenue (including grants). In 2016, SACU revenues amounted to 36.6 percent of total government revenue. The concentration of government revenue raises concerns from a financial stability viewpoint. Government has the largest workforce and largely supports small and medium enterprises (SMEs). In 2016, 34 percent of total government expenditure was projected to be spent on salaries and wages. Against a backdrop of highly indebted household and corporate sectors, adverse shocks to SACU revenues could have far-reaching effects across the economy transmitted through the financial sector.
Government has had trouble with servicing its obligations to domestic suppliers. Government arrears stood at e1.4 billion at the end of June 2017. At the cost of increasing domestic government debt, a supplier’s bond was issued in the last quarter of 2016 to support measures of reducing government arrears, prevent unsustainable drawdowns in reserves and ultimately support financial stability. Government arrears have since contracted to E434 million as at August 2017. However, the risk to financial stability remains as government expenditure growth outpaces the growth of government revenue. As a result, government’s budget deficit was projected to amount to 12.3 percent of GDP in the year 2016/17.
The outlook on government revenue is, however, positive as SACU receipts increased significantly to E7.2 billion in 2017 from the E5.2 billion received in 2016. Even though SACU receipts have increased, government expenditure and arrears remain, which could outweigh the benefits of the higher customs revenue.
2.3 Household DebtAt the end of 2016, credit extended to households by banks and non-bank financial institutions (NBFIs) amounted to 45.8 percent and 51 percent of total credit extension respectively. For the same period, 44.6 percent of household loans came from banks while 55.4 percent was from NBfIs. Households hold loans from both
banks and NBFIs at the same point in time as a result of information asymmetry between banks and non-banks. This situation poses a threat to financial stability since it is possible that when lending to the same household, neither creditor is aware of the true level of the particular household’s indebtedness. To this end, close monitoring of the household debt trend is required to enact policies that will support the Bank in its endeavours to maintain financial stability.
2.4 Corporate SectorThe corporate sector, especially the primary and secondary sub-sectors, experienced lowered production due to the drought experienced in 2016. Improved weather conditions as expected in 2017 have boosted production in the primary and secondary sector. Corporate sector profitability is threatened by the volatile exchange rate of the Lilangeni against major trading currencies. Corporate debt as a share of gross domestic product (GDP) is high, having hovered above 80 percent of GDP since 2013 before peaking at 90 percent in 2015. However, the risks arising from this situation depend on the corporate sector’s ability to reduce its indebtedness and debt management strategies. Failure to reduce corporate sector indebtedness could result in shrinking corporate sector profitability, which may translate to reduced private investments and consequently lower economic growth. The level of corporate sector indebtedness could also be an indication of other areas that macro and micro-prudential policies should focus on.
2.5 Banking SectorAlthough banks experienced growth during the period under review, maintaining their soundness and stability will remain a challenge. The levels of non-performing loans (NPLs) and banks’ cost-to-income ratios remain relatively high. Deteriorating asset quality and weakening profitability may further pose a challenge to the long-term health of the banking sector. This becomes even more crucial because of Swaziland’s highly concentrated banking sector, both from a funding as well as a

CENTRAL BANK OF SWAZILAND | F INANCIAL STABILITY REPORT I ssue No. 1
7© 2017 Central Bank Of Swaziland
8Out of 67 SACCOs
lending perspective. Therefore, banks need to continue paying close attention to credit risk management, ensuring that necessary controls are in place to protect themselves. In addition, the future economic outlook does not look particularly promising in terms of the operating environment for banks.
2.6 Non-bank Financial SectorThe non-banking financial sector continues to make progress in complying with the relevant legislation and capital adequacy requirements under the regulation and supervision of the Financial Services Regulatory Authority (FSRA). This promotes financial soundness of non-bank entities, thereby creating public confidence in the sector in order to protect the investing community. Full compliance with the recent legislated 50 percent local asset requirement may drive economic growth in the country even though it may take a while for investors to identify suitable local business partners.
Concentration risk is evident in the Savings and Credit Cooperatives (SACCOs) industry, with the top five8 which are government employee run SACCOs controlling 95 percent of the sector’s total assets, 66.3 percent of the industry’s loan book and 67.6 percent of the total deposits and savings. In effect, this means that should government experience cash flow challenges this sector may be under threat due to the high
levels of concentration as members rely on their salaries to make deposits/savings into the cooperatives and repay loans. Over-indebtedness to the credit financial institutions (CFIs) by individuals and households continues to be a precarious factor among these institutions. Total loans issued by credit institutions increase year after year, yet salary growth remains relatively low. The lack of an official credit bureau remains a challenge for the CFIs in assessing accurate and concise credit history information of borrowers. The country’s building society’s credit portfolio continues to deteriorate, with non-performing loans as a percentage of total loans increasing from 10.6 percent in 2014 to 12.5 percent in 2016. Tighter credit management practices have to be employed within the institution to reverse this trend.
2.7 Payments Systems StabilityThe national payment and settlement system operated smoothly throughout 2016, despite an overall increase in values and volumes transacted. The Swaziland Automated Electronic Clearing House (SEACH) and Swaziland Inter-Bank Payment and Settlement System (SWIPSS), which supports daily inter-bank dealings, are the two systemically important payment systems. Therefore, they remain one of the Bank’s main focus areas for the purposes of financial system stability assessment.

FINANCIAL STABILITY REPORT I ssue No. 1 | CENTRAL BANK OF SWAZILAND
8 © 2017 Central Bank Of Swaziland
3.1 Global Economic Growth and OutlookDuring 2017/18, global economic growth is projected to continue to improve on account of emerging markets’ and developing economies’ economic performance, particularly China’s, while advanced economies are expected to grow moderately. Global economic growth is expected to increase from 3.1 percent in 2016 to 3.5 percent in 2017 (Table 1)9. Emerging markets and developing economies (EMDEs) are projected to reach growth of 4.5 percent and 4.8 percent in 2017 and 2018, respectively. This growth forecast is largely attributed to China, whose economy is projected to expand by 6.5 percent in 2017, based on expectations of policy support. However, China’s reliance on policy stimulus measures, coupled with rapid growth in credit and slow progress in addressing substantial corporate debt levels and governance issues, poses a sharp downside risk to China’s long-term economic growth. According to April 2017 World Economic Outlook (WEO) Update, advanced economies are projected to grow moderately by 1.9 percent in 2017 and 2.0 percent in 2018, thus gradually converging to their long-term potential output growth.
Inflation in advanced economies and emerging markets is likely to increase in 2017, while inflation in EMDEs is projected to average 4.7 percent.10 Advanced economies, particularly the US, are registering important reductions in unemployment rates and a gradual recovery of output and income, with inflation rates gradually returning to within targeted levels.
9International Monetary Fund, World Economic Outlook Update, April 2017. http://www.imf.org/en/Publications/WEO/Issues/2017/04/04/world-economic-outlook-april-201710World Economic Outlook Database, April 2017.
Inflation rates in advanced economies and emerging markets may also increase following an expected significant uptick in oil prices as forecasted by the WEO.
The WEO Update views risks to global growth outlook as skewed to the downside. the report bases this observation on recent political developments in advanced economies that could threaten progress with cross-border economic integration, including calls for protectionist measures to be addressed. Increasing restrictions on global free trade and migration could affect productivity and income growth, as pressures around the implementation of inward-looking policies in advanced economies mount. As already noted, there are uncertainties about the lasting effectiveness of policy-induced growth in China against the background of structural weaknesses. Should these policies turn out unsuccessful, China could weigh down economic growth in EMDEs.
Growth in sub-Saharan Africa (SSA) has been declining in recent years, but it is projected to rebound somewhat in the period ahead. Regional growth is anticipated to reach 2.6 percent and 3.5 percent in 2017 and 2018, respectively; more than double the growth rate recorded in 2016 (Table 1). The more robust growth in SSA is expected to be driven by increases in commodity prices, and fuel and non-fuel commodity prices against the backdrop of stronger growth in global trade and GDP than in 2016.
GLOBAL ECONOMIC GROWTH AND OUTLOOK
CHAPTER3
CENTRAL BANK OF SWAZILAND | F INANCIAL STABILITY REPORT I ssue No. 1
9© 2017 Central Bank Of Swaziland
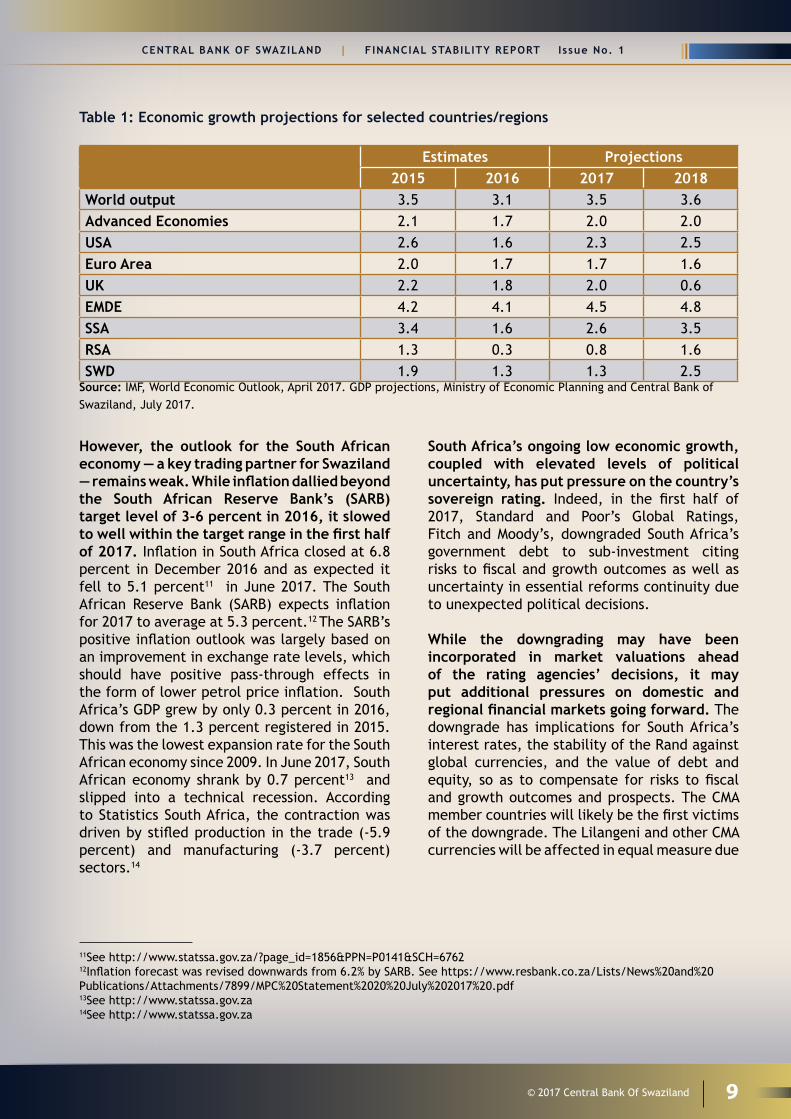
However, the outlook for the South African economy — a key trading partner for Swaziland — remains weak. While inflation dallied beyond the South African Reserve Bank’s (SARB) target level of 3-6 percent in 2016, it slowed to well within the target range in the first half of 2017. Inflation in South Africa closed at 6.8 percent in December 2016 and as expected it fell to 5.1 percent11 in June 2017. the South African Reserve Bank (SARB) expects inflation for 2017 to average at 5.3 percent.12 The SARB’s positive inflation outlook was largely based on an improvement in exchange rate levels, which should have positive pass-through effects in the form of lower petrol price inflation. South Africa’s GDP grew by only 0.3 percent in 2016, down from the 1.3 percent registered in 2015. This was the lowest expansion rate for the South African economy since 2009. In June 2017, South African economy shrank by 0.7 percent13 and slipped into a technical recession. According to Statistics South Africa, the contraction was driven by stifled production in the trade (-5.9 percent) and manufacturing (-3.7 percent) sectors.14
11See http://www.statssa.gov.za/?page_id=1856&PPN=P0141&SCH=676212Inflation forecast was revised downwards from 6.2% by SARB. See https://www.resbank.co.za/Lists/News%20and%20Publications/Attachments/7899/MPC%20Statement%2020%20July%202017%20.pdf13See http://www.statssa.gov.za14See http://www.statssa.gov.za
Table 1: Economic growth projections for selected countries/regions
Estimates Projections2015 2016 2017 2018
World output 3.5 3.1 3.5 3.6Advanced Economies 2.1 1.7 2.0 2.0USA 2.6 1.6 2.3 2.5Euro Area 2.0 1.7 1.7 1.6UK 2.2 1.8 2.0 0.6EMDE 4.2 4.1 4.5 4.8SSA 3.4 1.6 2.6 3.5RSA 1.3 0.3 0.8 1.6SWD 1.9 1.3 1.3 2.5
Source: IMF, World Economic Outlook, April 2017. GDP projections, Ministry of Economic Planning and Central Bank of Swaziland, July 2017.
South Africa’s ongoing low economic growth, coupled with elevated levels of political uncertainty, has put pressure on the country’s sovereign rating. Indeed, in the first half of 2017, Standard and Poor’s Global Ratings, Fitch and Moody’s, downgraded South Africa’s government debt to sub-investment citing risks to fiscal and growth outcomes as well as uncertainty in essential reforms continuity due to unexpected political decisions.
While the downgrading may have been incorporated in market valuations ahead of the rating agencies’ decisions, it may put additional pressures on domestic and regional financial markets going forward. the downgrade has implications for South Africa’s interest rates, the stability of the Rand against global currencies, and the value of debt and equity, so as to compensate for risks to fiscal and growth outcomes and prospects. The CMA member countries will likely be the first victims of the downgrade. The Lilangeni and other CMA currencies will be affected in equal measure due

FINANCIAL STABILITY REPORT I ssue No. 1 | CENTRAL BANK OF SWAZILAND
10 © 2017 Central Bank Of Swaziland
to their peg to the rand. In addition, domestic credit institutions are unlikely to have a rating higher than the sovereign rating; hence the effects of the downgrade will be transmitted across the CMA through interlinkages in the financial system.
In April 2017, the effects of the developments in South Africa were evident in Swaziland’s bond market. A five-year E150 million bond was offered but bids to the value of only E78.25 million were received. The Auction Committee rejected all bids on the grounds that the tendered yields were deemed to be extraordinarily above market rates. Investor feedback revealed that the tendered yields reflected expectations based on the recent downgrade of South African debt.
The Swazi government’s dependence on SACU revenues is a contributor to government’s widening fiscal deficit. As a percentage of total government revenue, 36.6 percent was SACU receipts in 2016/17. The SACU receipts however, were projected to make up 42.1 percent of government’s revenue in 2017/18. The dependence on SACU has important spillover effects to the domestic economy which have manifested, in particular, in the accumulation of government payments arrears to its suppliers, as well as rising NPLs reported by banks. SACU revenue sharing amounts have been affected by South Africa’s lasting weak economic performance and have put pressure on SACU member
15Central Bank of Swaziland Quarterly Report, March 2017.16Financial Markets Data & Research Data, June 2017.17Central Bank of Swaziland Quarterly Report, December 2016
countries’ government finances, particularly Swaziland. The enduring weak performance of the South African economy, including droughts experienced in the Eastern and Southern Africa regions, has reduced SACU revenue inflows for other SACU member countries, as specified in the SACU revenue-sharing formula. In the case of Swaziland, SACU revenue declined from around 16.1 percent of GDP in 2013/14 to 12.2 percent of GDP in 2016/17.16
3.2 Domestic Economic Outlook A decline in economic growth and relatively high inflation were observed during 2016 in the Swazi economy. Swaziland’s economy is estimated to have grown by 1.3 percent in 2016 (Table 1), from a revised estimate of 1.9 percent17 growth in 2015. The drought affecting output in agriculture and agro-processing, as well as power generation and water supply, mainly contributed to the lower growth in 2016. Limited agricultural production was realized, in turn leading to relatively high food price inflation, which is likely to have significantly affected low-income families across the country. Partly to address the ensuing inflationary pressures, the Bank tightened monetary policy by raising the discount rate by a cumulative 100 basis points during 2016.
Inflation figures indicate a gradual decline in inflation in the second quarter of 2017: Inflation declined from 8.7 percent at the end of December 2016 to 6.9 percent at the end of June 2017 but it has remained sticky.

CENTRAL BANK OF SWAZILAND | F INANCIAL STABILITY REPORT I ssue No. 1
11© 2017 Central Bank Of Swaziland
Figure 2: Inflation and Economic Growth
2010 2011 2012
Average Inflation Economic Growth
2013 2014 2015 2016 Jun-2017*
109
8
7
6
5
4
3
2
1
0
Source: Central Bank of Swaziland Quarterly Review, March 2017. GDP Projections, Central Bank of Swaziland & Ministry of Economic Development and Economic Planning, August 2016. *Projection
18GDP Projections, Central Bank of Swaziland and Central Statistics Office, August 201619Ministry of Finance Budget Speech 2017, Presented 24 February 2017, Honourable Minister Martin Dlamini.
Going forward, a more benign combination of inflation and output growth is expected than in the recent past. Projections by the Ministry of Economic Planning and Development and the Bank depict a marginal rebound in economic activity supported by improved output from the agriculture and primary sectors in 201718. A firm monetary policy stance should also support a gradual reduction in the inflation rate in 2017. Downside risks to the projection, however, include a slower recovery of main trading partners than indicated above, as well as a slow rebound of the domestic secondary sector during the year. On the inflation front, there is still a delicate balance from an increased food supply that should put downward pressure on food prices and underlying threats of further droughts in particular areas of the country, which would counter a decline in the prices of main staples.
3.3.1 Government Fiscal Position19 Analysis of the county’s fiscal position reflects significant widening deficits from 2015/16 to 2016/17 (figure 3), including an increase in government’s payment arrears, which the government intends to address during the current fiscal year. The deficit for the 2016/17 financial year was estimated to be 12.3 percent of GDP, almost three times as high as the 2015/16 budget deficit . Increased government recurrent expenditure in the context of severely diminished SACU revenue largely explains the deterioration in the fiscal balance. The widening deficit poses risks to sound public debt management and government’s ability to meet its statutory obligations. Against this background, the government intends to reduce the fiscal deficit to 8.2 percent of GDP in 2017/18, by reigning in government expenditure and lowering reliance on SACU revenue.

FINANCIAL STABILITY REPORT I ssue No. 1 | CENTRAL BANK OF SWAZILAND
12 © 2017 Central Bank Of Swaziland
Figure 3: Fiscal and Current Account Positions
-4 000
-3 000
-2 000
-1 000
-
1 000
2 000
3 000
4 000
5 000
6 000
E'BI
LLIO
N
Fiscal A/C Surplus/Deficit Current A/C Surplus/Deficit
6,000
2009/10 2010/11 2011/12 2012/13 2013/14 2014/15 2015/16*
5,000
4,000
3,000
2,000
1,000
--1,000
-2,000
-3,000
-4,000
Fiscal A/C Surplus/Deficit Current A/C Surplus/Deficit
E’Bi
llion
Source: Central Bank of Swaziland Quarterly Review, December 2016
Figure 4: Swaziland’s Fiscal Balance
2009/10
SADC MECI Deficit/GDP
Surp
lus/
Defi
cit
as %
of
GD
P
Surplus/Deficit as % of GDP
2010/11 2011/12 2012/13 2013/14 2014/15 2015/16 2016/17**
6.05.04.03.02.01.00.0
-1.0-2.0-3.0-4.0-5.0-6.0-7.0-8.0-9.0
-10.0-11.0-12.0-13.0-14.0-15.0
Source: Central Bank of Swaziland Quarterly Review, December 2016*estimated Outturn**Budget
The deterioration in the government’s financial position has set back efforts towards nominal convergence within SADC. Figure 4 shows that the country was within the SADC Macroeconomic Convergence Indicators (MECI) target in 2014/15, when the fiscal deficit was 1.2 percent of GDP. However, since 2015/16,
the government’s budget deficit has widened significantly, thus moving away from the SADC recommended target. The Government of Swaziland is mindful of the SADC target for member states to achieve a fiscal deficit of less than 3 percent by 2018 (Table 2).

CENTRAL BANK OF SWAZILAND | F INANCIAL STABILITY REPORT I ssue No. 1
13© 2017 Central Bank Of Swaziland
Table 2: SADC Macroeconomic Convergence Indicators
2008 2012 2018Primary MECI Annual Inflation Rate <9.5% <5% <3%
Fiscal deficit/GDP <5% <3% <3%
Public debt/GDP <60% <60% <60%
Current account/GDP <9% <9% <3%
Secondary MECIEconomic growth (%) 7% 7% 7%
External reserves (import cover, months) 3 Months 6 Months 7 Months
Central Bank credit to government (% of Revenues) 10% 5% 5%
Domestic savings (% of GDP) 25% 30% 35%
Domestic investment (% of GDP) 30% 30% 30%Source: SADC Macroeconomic Surveillance and Performance Unit: Guidelines for preparation of country assessments and national macroeconomic convergence programs, 2013
Box 1 – Government ArrearsAn accumulation of government arrears indicates that government is behind on its payment obligations to its suppliers and creditors. The accumulation of government arrears could be caused by cash-flow problems, unrealistic budgets, inadequate provision for multi-year commitments, weak cash management perpetuated by inadequate monthly cash limits, corruption, selective payments and administrative delays.
Arrears increase the cost of service provision, as government suppliers protect themselves against delayed payments by raising their prices. These also reduce and interrupt public service delivery, as government is forced to reduce the amount of supplies purchased on the volume of public services provided. Government expenditure arrears may also perpetuate corruption, as rent-seeking behavior may increase. Chronic delays in payments may hike incentives for collusion between some government employees and suppliers, as the latter seek to accelerate payment by all means, including circumventing policies and procedures for public procurement and settlement of obligations.
Private sector confidence in government’s ability to pay could also be affected adversely. Consumers and investors may anticipate an increase in tax rates (as the government tries to arrest its difficult cash flow), higher inflation or a worsening of the government’s financial situation over the medium term. Due to the reach of government’s activities across the economy, arrear accumulation may spread to other sectors of the economy with severe consequences to financial stability and, therefore, prospects for economic growth.
Source: Adapted from Suzanne Flynn and Mario Pessoa, Prevention and Management of Government Expenditure Arrears (The Effects of Good Government on the City Life, Fresco, Palazo Pubblica, Sienna, Italy). Regional Course on Financial Programming and Policies, Pretoria South Africa (February 23-March 6, 2015), IMF Institute for Capacity Building
3.3.2 Government Debt
Over the years, government has refocused its source of debt finance from foreign to domestic debt. Government incurs foreign
debt primarily to finance large capital projects, while domestic debt is undertaken to meet government’s current domestic financial obligations. While the foreign debt-to-GDP ratio has increased at a slow rate since 2010, the

FINANCIAL STABILITY REPORT I ssue No. 1 | CENTRAL BANK OF SWAZILAND
14 © 2017 Central Bank Of Swaziland
domestic-debt-to-GDP ratio has increased at a higher pace. The domestic-debt-to-GDP ratio increased from 3.7 percent at the end of 2010 to 10.6 percent at the end of June 2017. On the other hand, the foreign debt-to-GDP ratio increased at a slower rate, from 7.7 percent at the end of December 2010 to 9.2 percent at the end of June 2017. The shift of public debt to mostly domestic debt is explained by the continued issuance of government securities through the Bond Program, Suppliers Bond
Program, as well as the advance by the Bank to government in 2016.
Should such growth in domestic debt be maintained, it could pose a threat to financial stability. High growth in public debt could indicate that government is delaying tax efficiencies and diversification of sources of revenue, thus putting upward pressure on future interest rates, crowding out private sector credit, as well as posing risks related to debt maturity structure and debt roll-over.
Figure 5: Debt-to-GDP Ratio
-
5.0
10.0
15.0
20.0
2010 2011 2012 2013 2014 2015 2016 June-2017
DEB
T-TO
-GD
P RA
TIO
(%)
Foreign Debt to GDP Domestic Debt to GDP Total Debt to GDP
2010
Foreign Debt to GDP
Deb
t-to
-GD
P Ra
tio
(%)
Domestic Debt to GDP Total Debt to GDP
20.0
15.0
10.0
5.0
0.02011 2012 2013 2014 2015 2016 June-2017
Source: Central Bank of Swaziland Quarterly Review, March 2016. Financial Markets Department Data
Government arrears amounted to E1.4 billion at the end of June 2017. By end-February 2017, a total of E535 million had been raised through the bond programme. this amount has already been used to pay some suppliers. Government efforts towards eradicating the arrears aim to minimize the risk of suppliers’ default of their financial obligations with banks. The composition of government’s domestic debt since 2010 reflects an ongoing shift from short-term to longer-term debt financing that accelerated in late 2016 (Table 3). The hike in holdings of government bonds in 2016 was on account of debt issuances to tackle government payment arrears incurred during the year. This uptake was mainly noted in December 2016, when commercial banks and the building society increased their medium-term bond holdings through participation in the suppliers’ bond program, which comprised of short- to medium-
term notes with maturities that range between 12 months and 60 months. The program’s main objective was to reduce government’s payment arrears and address the concomitant negative spillover effects on the rest of the economy.
As a SADC member, Swaziland observes the regional convergence guidelines of a debt-to-GDP ratio that should not exceed 60 percent, although there may be hikes in Swaziland’s external debt ratios going forward. Swaziland’s public-debt-to-GDP stands below 20 percent, which is comfortably below the SADC recommended MECI level of below 60 percent even though a ratio below 60 percent or 20 percent in the case of Swaziland does not imply capacity to repay. The volatility of government debt-to-GDP ratio also looks contained as in 2003, government hedged the bulk of its foreign denominated debt maturing up to the

CENTRAL BANK OF SWAZILAND | F INANCIAL STABILITY REPORT I ssue No. 1
15© 2017 Central Bank Of Swaziland
year 2020. As at February 2017, government had hedged 28.2 percent of its total external debt. An emerging foreign exchange rate risk
may become evident as the old debt matures and as government takes up new unhedged foreign currency denominated debt.
Table 3: Composition of government’s domestic debt by maturity
Treasury Bills
(E’ 000)
Government bonds over 2 to 5 years
(E’ 000)
Government Bonds Over
5 to 10 years(E’ 000)
Total(E’ 000)
2010 772 250 219 1 2422011 720 817 146 1 6842012 1 101 767 146 2 0152013 1 906 814 200 2 9192014 1 752 747 451 2 9502015 1 649 749 725 3 1232016 1 675 2 069 670 4 414Jun-17 1 620 2 393 804 4 817
Source: Central Bank of Swaziland Quarterly Review, June 2017.
Table 4: Composition of government securities by ownership
Central Bank of Swaziland
(E’000)
Banks (E’000)
Non-bank financial institutions
(E’000)
Other (E’000)
2010 710 905 243 300 020 35 7312011 490 1 017 183 541 647 124 3092012 60 592 1 316 633 460 217 177 3772013 60 165 1 745 129 920 546 193 5082014 2 890 1 598 764 985 252 363 4842015 1 200 1 555 599 1 334 136 232 2852016 3 885 2 259 746 1 927 956 222 340 Jun-17 3 565 2 094 692 2 494 230 224 765
Source: Central Bank of Swaziland Quarterly Review, June 2017.
Banks and non-bank financial institutions (NBFIs) are the main holders of government debt (Table 4). As at March 2017, NBFIs held E2.5 billion in government bonds, while banks held E2.1 billion. Growth in holdings of medium-term government securities (2 to 5 years) has outpaced the growth in long-term government securities (5 to 10 years) as shown in Table 4. Market preference for government bonds is generally in the medium-term maturity ranges, where there is stronger bidding by banks than by
NBFIs that tend to favor longer-dated papers to match the long-term nature of their liabilities. The growth in medium-term bond holdings was boosted by the introduction of the suppliers’ bond program mentioned above.
Prudential holding requirements of domestic assets levied on NBFIs have boosted demand for government bonds to date and may raise issues of debt sustainability over the longer run. The holdings of government debt by the

FINANCIAL STABILITY REPORT I ssue No. 1 | CENTRAL BANK OF SWAZILAND
16 © 2017 Central Bank Of Swaziland
financial sector could be attributed to NBFIs’ compliance with the statutory 30 percent local asset requirement as stated in schedule 3 of the Insurance Regulations 2008 and schedule 1A of the Retirement Fund Regulations 2008. Going forward, the financial sector is likely to increase their holdings of government debt following the enforcement of section 71(2) of the Securities Act 2010 by the NBFIs regulator, which requires fund managers to have at least 50 percent local asset holdings in their portfolios. Excessive exposure of the financial sector to government debt increases the risk of destabilizing the financial sector in the event government debt reaches unsustainable levels.
3.3.3 Household Sector The household sector is the largest sector served by commercial banks. As a percentage of total bank credit extended to the private sector as at December 2016, 44.6 percent was to households. Credit extension to households depicted year-on-year growth of 6.1 percent in 2016 when compared to December 2015. Despite holding a high portion of bank credit, households also hold a significant and increasing level of credit from NBFIs.21 Analysis of household credit revealed non-banks’ credit to households has grown from 45.8 percent in 2014 to 51 percent in 2016 (Figure 6).
21Data from NBFIs used is from the four biggest credit financial institutions, SACCOs and the Swaziland Building Society.22Measured as total household debt/gross disposable income.
Figure 6: Household debt by type of institutions
40.0
42.0
44.0
46.0
48.0
50.0
52.0
54.0
56.0
2014 2015 2016
Perc
ent
Banks & Building Society Credit Finance Institutions & SACCOs
Source: data from Central Bank of Swaziland and NBfIs
Household indebtedness22 accelerated from 128 percent in 2015 to 156 percent in 2016. The growth in interest rates has put downward pressure on gross disposable income as defined by the IMF Financial Stability Indicators (FSI) Compilation Guide 2006. The Bank rate is partly
informed by inflation and the base effects of the inflation rate from 2012 and 2013 have potentially distortionary effects on the actual current inflation rate, making it appear to be higher than it actually is. This should be factored in for future interest rate decisions.

CENTRAL BANK OF SWAZILAND | F INANCIAL STABILITY REPORT I ssue No. 1
17© 2017 Central Bank Of Swaziland
On the back of rising inflation and interest rates, household indebtedness should be closely monitored because changes in household behavior caused by a high debt burden can have a significant impact on both the real economy and the wider financial system. A highly indebted household sector is vulnerable to negative economic shocks which may impair households’ repayment capacity. Due diligence by credit providers is therefore encouraged to avoid an excessive burden being placed on disposable income caused by individuals being granted credit by multiple credit providers even after the statutory deductions to disposable income (per person) ratio has been exceeded.
Box 2 - Calculating household disposable income:
Income:Compensation to employeesCompensation by pension funds RemittancesSocial grants
(LESS)Expenses:Taxes= Gross disposable Income
Source: IMF FSI Compilation Manual 2006, paragraph 4.120
3.3.4 Corporate Sector According to the 2015 company survey23
conducted by the Central Bank of Swaziland in partnership with the Ministry for Finance, corporates find that domestic sources of finance are limited. Corporates in sectors such as real estate, utilities, agriculture and construction are primarily impeded by the low borrowing limits. Adding to this challenge are micro-prudential policies such as the single borrower limit that puts a cap on the amount of exposure that individual banks have to any single borrower. The average ratio of bank financing of corporates has been at around 10.5 percent of GDP during 2010-2016, with a marginal decline in the ratio being observed recently (see Table 5).
As can be seen from Table 5, corporate debt sourced from commercial banks is mostly skewed towards private non-financial corporates. As at June 2017, private sector corporates accounted for 82.5 percent of corporate debt in the banking sector. The proportion of bank credit extended to private non-financial corporates reflects a downward trend (Table 5). The share of bank credit to other financial corporates (non-bank private and public financial institutions) in total bank credit increased to 11.0 percent at the end of June 2017.
23Company Survey Summary Report 2015, Ministry for Finance and Central Bank of Swaziland, 2015. The survey focuses on significant entities in each sector of the economy.
Table 5: Proportion of bank credit by type of corporate
Other Financial Corporates
Public Non-Financial Corporates
Private Non-Financial Corporates
2010 13.2 3.9 82.92011 4.8 3.9 91.32012 4.5 2.9 92.62013 4.6 3.2 92.12014 7.5 3.1 89.42015 8.8 3.6 87.62016 12.5 3.9 83.6Jun-2017 11.0 6.4 82.5
Source: Central Bank of Swaziland Quarterly Review, June 2017.

FINANCIAL STABILITY REPORT I ssue No. 1 | CENTRAL BANK OF SWAZILAND
18 © 2017 Central Bank Of Swaziland
Total corporate sector assets grew from E55 billion in 2013 to E74.7 billion in 2016. this growth of 35.9 percent indicates a healthy corporate sector, as corporates are able to utilise growing assets to generate more sales and profits thereafter. As at 2016, corporate sector assets amounted to E74.7 billion — a
0.5 per cent decline from the previous year. As shown in figure 7, the largest three sectors are manufacturing, mining, quarrying, and industrial sector (39 percent), wholesale and retail trade, transportation and storage, accommodation and food service activities sector (19 percent), and the Real estate sector (12 percent).
Figure 7: Corporate Sector Assets
Agriculture, forestry and fishing Construction
Information and Communication
Manufacturing, Mining and Quarrying and Other Industrial
Other Service Activities
Professional, Scientific, Technical, Administrative and Support Service Activities
Public Administration and Defence, Education, Human Health and Social Work Activities
Real Estate Activities
Wholesale and Retail Trade, Transportation andStorage, Accommodation and Food Service Activities
10 4 3 39 3 8 2 12 19
1
2
3
4
5
6
7
8
9
19%10%
4%
3%
12%
2%
3%
8% 39%
Source: Swaziland Revenue Authority
Total corporate debt24 for non-financial and non-public corporates grew by 21 percent since 2013. However, it declined by 5 percent in 2016. In 2016, most corporates did not perform well and therefore relied more on credit to finance their operations. Total corporate debt amounted to E28.1 billion in 2016. Highly indebted corporates were mainly in the finance
and insurance sector, and the manufacturing and wholesale sector as at 2016 (Figure 8).
Corporate debt to GDP peaked at 56 percent in 2015 before declining to 51 percent in 2016. High corporate debt-to-GDP ratios were observed in the finance and insurance, and manufacturing and wholesale sectors.
24Corporate debt consists of long-term loans, director/ shareholder loans, associated company loans, trade payables, other payables, bank overdrafts, short-term loans and other loans.

CENTRAL BANK OF SWAZILAND | F INANCIAL STABILITY REPORT I ssue No. 1
19© 2017 Central Bank Of Swaziland
Figure 8: Corporate Debt Composition
Agriculture, forestry and fishing Construction
Information and Communication
Manufacturing, Mining and Quarrying and Other Industrial
Other Service Activities
Professional, Scientific, Technical, Administrative and Support Service Activities
Public Administration and Defence, Education, Human Health and Social Work Activities
Real Estate Activities
Wholesale and Retail Trade, Transportation andStorage, Accommodation and Food Service Activities
7 5 2 39 3 11 1 12 20
1
2
3
4
5
6
7
8
9
20%
7%5%
2%
12%
1%
3%
11%
39%
Source: Swaziland Revenue Authority
The high levels of corporate debt could be an indication that corporates have other sources of finance besides banks, for example, multi-national corporates are able to finance themselves through intra-company loans and local pension funds.
The overall performance of the corporate sector, measured by the return-on-equity (ROE) and return-on-assets (ROA) ratios, increased from 2015 to 2016 (Table 6). the agricultural sector - the worst performing sector in 2015 - improved in 2016 with ROE and ROA ratios of 9 percent and 5 percent respectively,
up from 2 percent and 1 percent respectively in 2015. At the end of 2016, the manufacturing sector outperformed the rest of the sectors, reporting ROE and ROA ratios of 47 percent and 20 percent respectively.
While credit extension is a driver of economic growth, close monitoring of credit extended to corporates is imperative to ensure that prudent lending is still practiced. Due diligence by banks should be exercised to minimize the risk of corporates defaulting on their contractual obligations.
Table 6: Selected indicators for the corporate sector
2013 2014 2015 2016Total debt to equity (%) 54 44 43 41Return on equity (ROE) (%) 37 29 27 28Profit after tax (E ‘billion) 4.6 5.0 5.8 5.5Return on assets (ROA) (%) 13 12 11 11Total assets (E ‘billion) 35.7 41.3 51.0 48.1Debt-To-GDP (%) 52 49 56 51
Source: Swaziland Revenue Authority

FINANCIAL STABILITY REPORT I ssue No. 1 | CENTRAL BANK OF SWAZILAND
20 © 2017 Central Bank Of Swaziland
DEVELOPMENTS AND RISK ANALYSIS OF THE BANKING SYSTEM25
CHAPTER4The Swaziland banking sector, comprising four commercial banks (one of which is a government-owned bank), recorded strong annual growth during 2017. The increase reflected an expansion in almost all types of bank assets, particularly loans and overdrafts, investments and other securities, due from banks abroad, and holdings of government securities. Investments and other securities increased by 145.0 percent, while holdings with banks abroad increased by 48.8 percent. Holdings of securities, which increased by
13.3 percent, included banks’ participation in regular government Treasury bills (TBs) and bond auctions, as well as banks’ holdings of government paper under the supplier’s bond programme launched by the government from November, 2016 to March, 2017. During the year to June 2017, loans and overdrafts grew by 8.7 percent compared to 8.4 percent in June, 2016. On the liability side, the balance sheet’s expansion reflected the traditional increase in private sector deposits, mainly demand and term deposits.
Figure 9: Banking Sector Assets
Dec
-14
0.9
18.0
Loans & Overdrafts (Gross) due from Banks abroad
Investments and Other Securities due from Banks in Swaziland
Government Securities Asset Growth
20.0
10.0
16.0 15.0
8.0-
14.0 10.0
6.0(5.0)
2.0 (15.0)
12.05.0
4.0 (10.0)
- (20.0)
(5.0)
6.5
10.2
2.5
(1.5)
4.2 3.6
11.9
16.4
14.3
Mar
-15
E’Bi
llion
Perc
ent
Jun-
15
Sep-
15
Dec
-15
Mar
-16
Jun-
16
Sep-
16
Dec
-16
Mar
-17
Jun-
17
Source: Central Bank of Swaziland
25Also see the Note on “Stress-testing the Swaziland banking sector” in this publication

CENTRAL BANK OF SWAZILAND | F INANCIAL STABILITY REPORT I ssue No. 1
21© 2017 Central Bank Of Swaziland
Table 7: Changes in banks’ assets
Dec-14 Dec-15 Jun-16 Dec-16 Jun-17AssetsVolumes (E. Billion) 13.4 15.4 15.8 18.3 18.3
Annual growth (%) - 14.3 16.0 19.2 15.8
Loans and advancesVolumes (E. Billion) 9.3 9.7 9.9 10.7 10.7
Annual growth (%) - 3.6 4.1 10.5 8.7
Government SecuritiesVolumes (E. Billion) 1.5 1.6 1.8 2.1 2.1
Annual growth (%) - 9.3 25.6 28.9 13.3
due from banks abroad
Volumes (E. Billion) 1.3 2.1 1.9 2.7 2.8
Annual growth (%) - 57.7 46.2 26.3 48.8Source: Central Bank of Swaziland
Capital AdequacyBanks remained well capitalised during the period under review, with developments in 2017 resulting in increases in paid-up capital and reserves. all banks met the minimum capital adequacy requirements of 4.0 percent for tier 1 capital, 8.0 percent for total capital, and E15.0 million for minimum paid-up capital. The aggregate industry-wide regulatory tier 1 capital adequacy ratio and total capital adequacy ratios were at 21.0 percent and 23.5 percent respectively, thus showing the banks’ strong solvency positions. Total shareholder capital increased by 11.9 percent from E2.3 billion in June 2016 to E2.6 billion in June 2017, aided by growth in retained earnings. Banks also increased reserves appropriations, likely reflecting their precautionary stance in an uncertain economic environment.
The ratio of NPLs (net of specific provisions) to capital worsened from 20.7 percent reported in June, 2016 to 28.0 percent in
June 2017, showing increased credit risk and a future drain on capital. The leverage ratio,26 which is also an indicator of the adequacy of capital, increased marginally to 11.3 percent in June 2017 from 11.1 percent at the end of June 2016.
ProfitabilityBank profitability weakened somewhat in 2017 due to the on-going challenging economic environment. The average ROA and ROE ratios declined from 3.2 percent and 22.4 percent respectively at the end of June 2016, to 2.2 percent and 15.7 percent by June 2017 respectively. By international standards, however, the ROA and ROE ratios remained at relatively high levels. Year-on-year net after-tax earnings were E399.0 million, a decrease from E510.3 million in June 2016. The weakened profitability is as a result of the aforementioned increase in NPLs and the increased inflation, which hiked operating costs.
26The leverage ratio is the ratio of regulatory tier 1 capital to total assets, plus off-balance sheet items.
FINANCIAL STABILITY REPORT I ssue No. 1 | CENTRAL BANK OF SWAZILAND
22 © 2017 Central Bank Of Swaziland
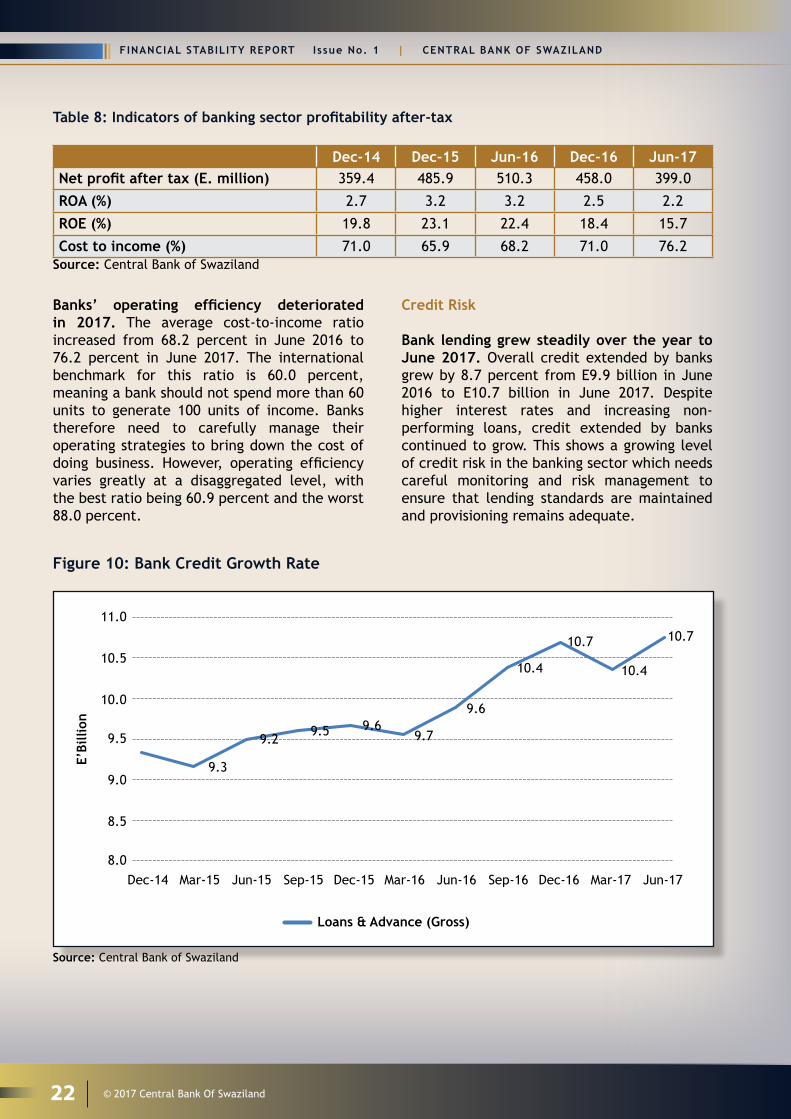
Table 8: Indicators of banking sector profitability after-tax
Dec-14 Dec-15 Jun-16 Dec-16 Jun-17Net profit after tax (E. million) 359.4 485.9 510.3 458.0 399.0
ROA (%) 2.7 3.2 3.2 2.5 2.2
ROE (%) 19.8 23.1 22.4 18.4 15.7
Cost to income (%) 71.0 65.9 68.2 71.0 76.2Source: Central Bank of Swaziland
Banks’ operating efficiency deteriorated in 2017. The average cost-to-income ratio increased from 68.2 percent in June 2016 to 76.2 percent in June 2017. The international benchmark for this ratio is 60.0 percent, meaning a bank should not spend more than 60 units to generate 100 units of income. Banks therefore need to carefully manage their operating strategies to bring down the cost of doing business. However, operating efficiency varies greatly at a disaggregated level, with the best ratio being 60.9 percent and the worst 88.0 percent.
Credit Risk
Bank lending grew steadily over the year to June 2017. Overall credit extended by banks grew by 8.7 percent from E9.9 billion in June 2016 to E10.7 billion in June 2017. Despite higher interest rates and increasing non-performing loans, credit extended by banks continued to grow. This shows a growing level of credit risk in the banking sector which needs careful monitoring and risk management to ensure that lending standards are maintained and provisioning remains adequate.
Figure 10: Bank Credit Growth Rate
Dec-14
11.0
9.3
9.29.5 9.6
9.7
9.6
10.4
10.7
10.4
10.7
10.5
10.0
9.5
9.0
8.5
8.0Mar-15 Jun-15
Loans & Advance (Gross)
E’Bi
llion
Sep-15 Dec-15 Mar-16 Jun-16 Sep-16 Dec-16 Mar-17 Jun-17
Source: Central Bank of Swaziland

CENTRAL BANK OF SWAZILAND | F INANCIAL STABILITY REPORT I ssue No. 1
23© 2017 Central Bank Of Swaziland
Banks’ asset quality deteriorated during the year under review. The ratio of banks’ aggregate non-performing loans to total gross loans increased to 8.2 percent (E878.4 million) in June 2017 from 7.8 percent (E773.3 million) in June 2016. During 2016, Swaziland struggled with inflation triggered by both the drought and the falling exchange rate. The rise in inflation contributed to an increase in the lending rate,
which hampered customers’ repayment ability. The end result was an increase in the loan default rate as shown by the 13.6 percent hike in NPLs during 2017. Nevertheless, specific provisions to NPLs dropped by 20.2 percentage points from 39.1 percent to 18.9 percent over the same period, suggesting that banks are not providing sufficiently given the rate at which loan books are deteriorating.
Figure 11: Banks’ Non-performing Loans
0.0
2.0
4.0
6.0
8.0
10.0
12.0
0.0
200.0
400.0
600.0
800.0
1,000.0
1,200.0
Mar
-14
Jun-
14
Sep-
14
Dec
-14
Mar
-15
Jun-
15
Sep-
15
Dec
-15
Mar
-16
Jun-
16
Sep-
16
Dec
-16
Mar
-17
Jun-
17
E’M
illio
n
Perc
ent
1,200.0 12.0
10.0
8.0
6.0
4.0
2.0
0.0
4.3 4.43.8 3.7 3.7
3.64.6
6.47.6
7.89.1
9.2 9.9
8.2
1,000.0
800.0
600.0
Non-performing Loans NPLs to Total Gross Loans
400.0
200.0
Mar
-14
Jun-
14
Sep-
14
Dec
-14
Mar
-15
Jun-
15
Sep-
15
Dec
-15
Mar
-16
Jun-
16
Sep-
16
Dec
-16
Mar
-17
Jun-
170.0
Source: Central Bank of Swaziland
Lending for consumption and real estate-related purposes, as well as selected economic sectors, represents banks’ main business. The household sector accounted for the largest share of total banking sector loans at 42.6 percent, decreasing by 2.8 percentage points compared to June 2016. The financial wellbeing of households is therefore crucial for the future health of the banking sector. Unsecured household loans - usually a more expensive category of loans used mainly as a source for distressed lending - represented
12.3 percent of total banking sector loans and 28.8 percent of total household loans as at end June 2017. This suggests that households are significantly reliant on this type of credit. For households making use of this type of credit, an increase in interest rates could have serious implications. Distribution and tourism sector loans accounted for 12.5 percent of total loans followed by the real estate sector loans, which include both residential and commercial loans at 11.8 percent. The agriculture and forestry sector, which suffered as a result of the drought, accounted for 7.5 percent of total loans.

FINANCIAL STABILITY REPORT I ssue No. 1 | CENTRAL BANK OF SWAZILAND
24 © 2017 Central Bank Of Swaziland
Figure 12: Sectorial Distribution of Loans
0.0
20.0
40.0
60.0
80.0
100.0
120.0 De
c-14
Mar
-15
Jun-
15
Sep-
15
Dec-
15
Mar
-16
Jun-
16
Sep-
16
Dec-
16
Mar
-17
Jun-
17
Perc
ent
Agriculture and forestry Mining and quarrying
Construction Distribution and tourism
Transport and communications Community social and personal services
Real estate Other businesses (not elsewhere included)
Personal and household loans Manufacturing
Other
Source: Central Bank of Swaziland
4.1 Credit and Funding ConcentrationConcentration risk remained relatively high for banks in Swaziland from both a funding and lending perspective.
Table 9: Banks’ Credit Concentration Level
Description Dec-14 Dec-15 Dec-16 Jun-17Average top 20 to Loans 46.7% 50.6% 44.6% 47.3%Average top 10 to Loans 39.2% 41.5% 36.2% 38.9%Average top 5 to Loans 31.0% 31.2% 25.8% 29.2%
Source: Central Bank of Swaziland
On average, the top 20 largest borrowers accounted for 47.3 percent of the loan book. These exposures should be carefully managed since a default by any of these borrowers could have dire consequences both for individual
banks and the banking sector as a whole. Also, 45.8 percent of total deposits are held by the top 20 largest depositors, which means that funding concentration is also fairly high.

CENTRAL BANK OF SWAZILAND | F INANCIAL STABILITY REPORT I ssue No. 1
25© 2017 Central Bank Of Swaziland
4.2 Banks’ Funding StructureCustomer deposits - the main source of funding for banks - grew by 23.9 percent in June 2017 compared to the year before, and represented 78.1 percent of total assets as at the end of June 2017. In absolute terms, total deposits
amounted to E14.3 billion. Total shareholders’ funds represented 14.0 percent of total assets and were the second largest source of funding. Funding from foreign financial institutions accounted for 1.5 percent of total assets as at June 2017.
Figure 13: Banks’ Sources of Funding
Due to Financial Institutions Abroad
Deposits
Total Shareholder’s Funds
Other
6.4 1.5 78.1 14
1
2
3
4
78.1%
14.0%6.4% 1.5%
Source: Central Bank of Swaziland
The increase in deposits was spread mainly between demand and term deposits. demand deposits grew by 35.4 percent to E5.0 billion while term deposits grew by 19.3 percent to E8.3 billion in June 2017. Savings deposits increased
by 10.9 percent to reach E917.9 million in June 2017. The interest paid on deposits increased from 2.5 percent to 3.0 percent in the year to June 2017.
Table 10: Banks’ Funding Concentration Level
Description Dec-14 Dec-15 Dec-16 Jun-17Average top 20 to total deposits 39.3% 36.6% 43.2% 45.8%Average top 10 to total deposits 29.1% 26.7% 34.0% 28.0%Average top 5 to total deposits 20.0% 17.8% 25.9% 19.7%
Source: Central Bank of Swaziland

FINANCIAL STABILITY REPORT I ssue No. 1 | CENTRAL BANK OF SWAZILAND
26 © 2017 Central Bank Of Swaziland
Figure 14: Structure of Deposits
-
1 000.0
2 000.0
3 000.0
4 000.0
5 000.0
6 000.0
7 000.0
8 000.0
9 000.0
-
1 000.0
2 000.0
3 000.0
4 000.0
5 000.0
6 000.0
Dec
-14
Mar
-15
Jun-
15
Sep-
15
Dec
-15
Mar
-16
Jun-
16
Sep-
16
Dec
-16
Mar
-17
Jun-
17
E. Million
Demand Deposits Savings Deposits Time Deposits
Dec
-14
Dem
and
Dep
osit
s, E
’Bill
ion
Savi
ngs,
Tim
e
6.0 9.0
8.0
7.0
6.0
5.0
4.0
3.0
2.0
1.0
-
5.0
4.0
3.0
2.0
Demand Deposits Savings Deposits Time Deposits
1.0
-
Mar
-15
Jun-
15
Sep-
15
Dec
-15
Mar
-16
Jun-
16
Sep-
16
Dec
-16
Mar
-17
Jun-
17
Source: Central Bank of Swaziland
4.3 Liquidity RiskThe banks maintained an acceptable level of liquid assets. The ratio of liquid assets to total deposits decreased by 2.1 percentage points from 27.4 percent in June 2016 to 25.3 percent in June 2017. the ratio was at a bare minimum of the regulatory minimum requirement of 25.0 percent. The short-term gap, which expresses
liquid assets as a percentage of short-term liabilities, stood at 28.3 percent in June 2017 compared to 32.0 percent in June 2016, showing the banking sector’s reliance on short-term funds to fund long-term assets (Table 12). This asset-liability mismatch, however, is a risk inherent to banking and should be managed accordingly.
Table 11: Banking sector maturity analysis as at end December 2016
Maturing in less than 1 month
1 month less than 3 months
3 months less than 6 months
6 months less than 1 year
Maturing over
1 year Total Assets 8 640 231 634 699 529 757 1 350 138 7 834 412 Total Liabilities 11 970 370 1 897 522 534 254 2 097 635 1 070 686 Gap (3 330 138) (1 262 824) (4 497) (747 498) 6 763 726 Cumulative Gap (3 330 138) (4 592 962) (4 597 459) (5 344 957) 1 418 769
Source: Central Bank of Swaziland

CENTRAL BANK OF SWAZILAND | F INANCIAL STABILITY REPORT I ssue No. 1
27© 2017 Central Bank Of Swaziland
Table 12: Key indicators of bank liquidity (percentage ratios)
Dec-14 Dec-15 Jun-16 Dec-16 Jun-17
Total loans to total deposits (%) 92.9 83.0 85.8 74.0 75.3
Liquid assets to total deposits (%) 23.9 27.7 27.4 28.6 25.3
Liquid assets to total assets (%) 17.9 21.0 20.0 22.6 19.7
Liquid assets to short-term liabilities (Short-term gap) (%)
29.2 29.8 32.0 32.4 28.3
Source: Central Bank of Swaziland
The ratio of total loans to total deposits decreased by 10.5 percentage points from 85.8 percent in June 2016 to 75.3 percent in June 2017. This could indicate conservativeness by
banks in light of higher interest rates coupled with deteriorating credit worthiness of borrowers as shown by the increase in NPLs.

FINANCIAL STABILITY REPORT I ssue No. 1 | CENTRAL BANK OF SWAZILAND
28 © 2017 Central Bank Of Swaziland
DEVELOPMENTS AND RISK ANALYSIS OF NON-BANK FINANCIAL INSTITUTIONS
CHAPTER55.1 Capital MarketsCapital markets in Swaziland are still relatively nascent and therefore data collection is still in its early stages. The participants in the capital markets mainly consist of (a) institutional investors, contributing approximately 78 percent of assets under management, (b) retail investors, contributing about 9 percent, and (c) companies, who control around 8 percent of the E23.9 billion total managed assets. In an attempt to attract listings on the Swaziland Stock Exchange (SSX) and deepen participation, the SSX has embarked on an initiative to automate its operations, a project that will also see the introduction of an automated Central Security Depository (CSD) with an equity settlement module. The securities exchange licence application for the SSX will be finalised
by the end of June 2017, paving the way for the SSX to be a full self-regulatory organisation like other regional exchanges. The capital markets industry in Swaziland has two types of intermediaries, which are the investment advisors and the collective investment schemes.
The main investment activities for long-term instruments include collective investment undertakings in associated entities (Figure 15), with listed securities (debt) holding a larger proportion at 40.3 percent, followed by corporate bonds at 31.8 percent. For short-term instruments, main investment activities include money market instruments, with call deposits holding the largest share at 42.2 percent and commercial paper as the second largest at 17.4 percent (Figure 16).
Figure 15: Asset Allocation - Other Long-Term Instruments3 2 5 0.5 4.46 6.23 0.5 40.3 31.83 8.71
1
2
3
4
5
6
7
8
9
10
Corporate Bonds Bonds/Debentures
Equity with Primary lisiting
Equity with Secondary lisiting Equity index-linked securities Listed Securities: Debt
Unlisted Securities: Equity
Unlisted Securities: Debt
Property Shares
Property - Land
Property - Buildings
Collective Investment Undertakings
Collective Investment Undertakings (in associated entity)
Other Portfolio Assets
8.71%
4.46
%
6.23%
31.83%
40.30%
Source: fSra

CENTRAL BANK OF SWAZILAND | F INANCIAL STABILITY REPORT I ssue No. 1
29© 2017 Central Bank Of Swaziland
Figure 16: Asset Allocation - Money Market7.3 3.4 17.35 29.78 42.16
1
2
3
4
5
treasury Bills
Negotiable Certificate of Deposit
Commercial Paper
Commercial Banks Call Deposits
Other Money Market Instrument
7.30
%3.
40%
17.35%
42.16%
29.78%
Source: fSra
The following risks can be highlighted given the manner in which the capital markets are currently functioning in Swaziland: y A large portion of instruments is invested
in unlisted equity portfolios as individual investment institutions invest in unlisted equity to meet the 50 percent local requirement.
y Low turnover of shares on the SSX is leading to increased demand for unlisted instruments.
y Asset management firms buying unlisted debt issued by related parties
All the above are as a result of the institutions breaching legislation and regulation as they exceed permissible limits on unlisted securities, loans and lending to related parties. Currently, the capital market in Swaziland is growing and performing well but it is important to monitor any risks emanating therefrom to ensure the continued stability of the financial system.
The recent review of the South African sovereign rating to sub-investment grade status has caused uncertainties in the equity markets. The equities listed on the Johannesburg Stock Exchange (JSE) will likely lose some of their value, which will in turn affect
asset allocation by domestic asset managers still heavily invested in JSE listed securities.
5.2 Insurance SectorThe insurance industry consists of short- and long-term insurers, sharing 45 percent and 55 percent respectively of the total industry. Assets of the total industry amounted to E3.7 billion as at December 2016 with gross written premiums of E1.3 billion. The risk retention of short-term insurance firms is about 60 percent, which means that insurers are retaining a higher portion of the risks than they are reinsuring. The lack of reinsurance facilities in the country means that all reinsurance premiums are being transferred to foreign markets, especially South Africa. The reinsurance arrangements have, however, helped limit the insurers’ exposure to excessive losses as a result of large claims, thus limiting the volatility of their underwriting results and enabling insurers to increase their underwriting capacity. The net claims ratio for the short-industry was acceptable at around 32 per cent, while the expense ratio was 29 per cent. This led to a combined ratio of 61 per cent, meaning that the industry was able to manage its losses and expenses and remain profitable, therefore supporting the continued health of insurance companies.

FINANCIAL STABILITY REPORT I ssue No. 1 | CENTRAL BANK OF SWAZILAND
30 © 2017 Central Bank Of Swaziland
Total gross written premiums of the short-term insurance industry increased by 5 percent year on year in 2016 to E595 million. The industry remained profitable with average ROA and ROE ratios of 4.5 percent and 11 percent respectively for the year ended in December 2016. Based on these indicators, it appears that the short-term insurance sector remained profitable and sufficiently robust to absorb any potential shocks.
Figures 17 and 18 shows that one insurance company dominates the short-term industry in terms of premiums written and assets held. Based on its size, this company has been classified as a systemically important entity within both the long- and short-term insurance industries. As at 31 December 2016, the insurer was considered to have adequate capital in relation to its liabilities.
Figure 17: Short-term insurance asset distribution as at 31 December 20161 3 3 77 16
1
2
3
4
5
Company A
Company B
Company C
Company d
Company e
1% 3%3%
16%
77%
Source: fSra
Figure 18: Premium income distribution as at 31 December 20161 3 3 77 16
1
2
3
4
5
Company A
Company B
Company C
Company d
Company e
1% 3%3%
16%
77%
Source: fSra

CENTRAL BANK OF SWAZILAND | F INANCIAL STABILITY REPORT I ssue No. 1
31© 2017 Central Bank Of Swaziland
Figure 19: Long-term insurance industry year-on-year indicators
-30.0%
-20.0%
-10.0%
0.0%
10.0%
20.0%
30.0%
40.0%
50.0%
60.0%
Gross Premiums Total Assets Policy Liabilities Capital and Reserves
31/12/2016
31/12/2015
Source: fSra
Figure 20: Long-term insurance industry asset distribution as at 31 December 2016
40%
24%
19%
16% 0% 1%
Company A_LT Company B_LT
Company C_LT
Company d_LT
Company e_LT
Source: fSra
The long-term insurance industry continued to play an important role in the economy through the mobilisation of savings from households and corporates. As at December 2016, there was a reduction of 21 percent in the premiums written by the long-term insurance industry, which was due to the reduction in new business. However, the industry remained profitable despite the reduction in new business.
Figure 19 also shows that the industry’s assets grew by 17 percent; this growth was mainly due to the increase in investment assets, which insurers have placed with various asset managers
and the banking sector, therefore contributing directly to the liquidity of the financial system. Although the policy liabilities grew at a higher rate than the assets as indicated in Figure 15, the insurers continued to maintain adequate assets to cover their liabilities as each insurer maintained a solvency ratio higher than the set minimum requirements.
Despite the asset growth realised by the industry, it is still faced with a lack of long-term investment instruments needed in order to ensure an effective matching of their assets to the liabilities they have underwritten.

FINANCIAL STABILITY REPORT I ssue No. 1 | CENTRAL BANK OF SWAZILAND
32 © 2017 Central Bank Of Swaziland
Figures 20 and 21 show that one domestic and one foreign insurance company have a dominant combined market share of over 50 percent in terms of assets held and premiums written. Although the insurance industry continues to maintain its profitability, interconnectedness in the financial sector, especially the increased participation of banks, savings and credit cooperatives, and pension funds in the insurance space has led to insurers being heavily reliant on the credit life business and the group life assurance business for pension funds. The lack of product diversification in the industry has led to a limited growth in the country’s insurance penetration ratio.
5.3 Retirement Funds Pension funds are categorised as systemically important NBFIs in Swaziland. the retirement funds industry plays a significant role in the country’s financial system as measured by the ratio of their assets to GDP, which stood at 48.2 percent as at 31 December 2016 - the highest when compared to all the other sectors within the financial system. The retirement funds industry comprises 70 stand-alone funds, 9
umbrella funds with 127 participating employers and 5 benefit administrators. The industry is dominated by the Public Service Pensions Fund, which constitutes 76.9 percent of total assets, followed by the Swaziland National Provident Fund with 7.7 percent (E2 billion).
The retirement funds industry remained well capitalised and relatively well diversified in terms of asset allocation, consistent with the maturity profile of their liabilities. On the latter, the industry complies with the 30 percent local asset holdings requirement, with 36.8 percent of total assets invested in the local market, and the difference invested mainly within the CMA (i.e. predominantly South Africa). Figure 24 shows that in the foreign markets, retirement funds assets are heavily invested in equity instruments (68 percent) through the JSE, unlike in the local market (Figure 23) where the majority of funds are invested in the money markets and in debt maturing within 12 months (31 percent). Overall, Figure 22 shows that pension funds’ preferred investment instruments are equity (51 percent), debt maturing after 12 months (19 percent), and the money market and debt maturing within 12 months (13 percent).
Figure 21: Premium income distribution as at 31 December 2016
2 6 39 26 11 16
1
2
3
4
5
6
16%
6%2%
39%
11%
26%
Company A_LT Company B_LT
Company C_LT
Company d_LT
Company e_LT
Company f_LT
Source: fSra

CENTRAL BANK OF SWAZILAND | F INANCIAL STABILITY REPORT I ssue No. 1
33© 2017 Central Bank Of Swaziland
Figure 22: Retirement funds assets as at 31 December 20168 1 8 13 19 51
1
2
3
4
5
6
8%
8%
1%
13%51%
19%
Cash Money Market and Debt maturing within 12 months
Debt maturing after 12 months
Equity
Property Investments
Insurance Policies and Other Investments
Source: fSra
Figure 23: Local Asset Distribution as at 31 December 201613 3 4 31 27 22
1
2
3
4
5
6
22% 3%
13%
4%
27% 31%
Cash and Cash equivalents Money Market and Debt maturing within 12 months
Debt maturing after 12 months
Equity
Property Investments
Insurance Policies and Other Investments
Source: fSra
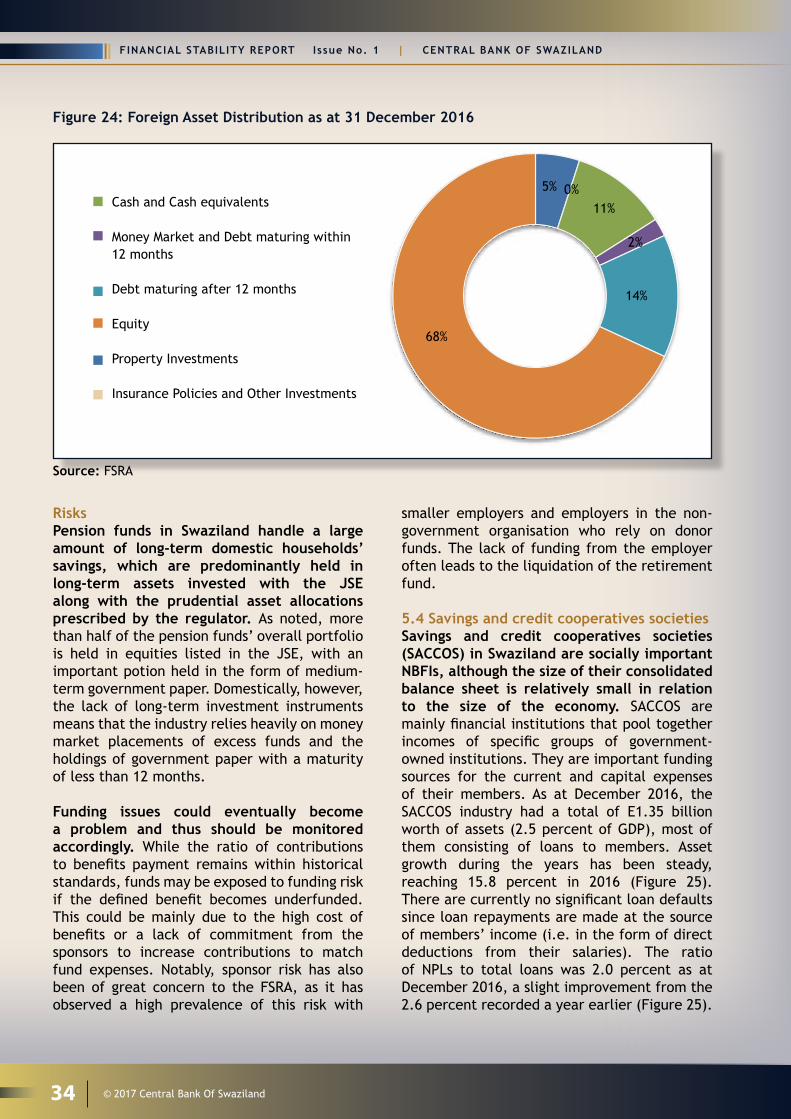
FINANCIAL STABILITY REPORT I ssue No. 1 | CENTRAL BANK OF SWAZILAND
34 © 2017 Central Bank Of Swaziland
Figure 24: Foreign Asset Distribution as at 31 December 2016 5 0 11 2 14 68
1
2
3
4
5
6
5% 0%
2%
11%
68%
14%
Cash and Cash equivalents Money Market and Debt maturing within 12 months
Debt maturing after 12 months
Equity
Property Investments
Insurance Policies and Other Investments
Source: fSra
RisksPension funds in Swaziland handle a large amount of long-term domestic households’ savings, which are predominantly held in long-term assets invested with the JSE along with the prudential asset allocations prescribed by the regulator. as noted, more than half of the pension funds’ overall portfolio is held in equities listed in the JSE, with an important potion held in the form of medium-term government paper. Domestically, however, the lack of long-term investment instruments means that the industry relies heavily on money market placements of excess funds and the holdings of government paper with a maturity of less than 12 months. Funding issues could eventually become a problem and thus should be monitored accordingly. While the ratio of contributions to benefits payment remains within historical standards, funds may be exposed to funding risk if the defined benefit becomes underfunded. This could be mainly due to the high cost of benefits or a lack of commitment from the sponsors to increase contributions to match fund expenses. Notably, sponsor risk has also been of great concern to the FSRA, as it has observed a high prevalence of this risk with
smaller employers and employers in the non-government organisation who rely on donor funds. The lack of funding from the employer often leads to the liquidation of the retirement fund.
5.4 Savings and credit cooperatives societies Savings and credit cooperatives societies (SACCOS) in Swaziland are socially important NBFIs, although the size of their consolidated balance sheet is relatively small in relation to the size of the economy. SaCCOS are mainly financial institutions that pool together incomes of specific groups of government-owned institutions. They are important funding sources for the current and capital expenses of their members. As at December 2016, the SACCOS industry had a total of E1.35 billion worth of assets (2.5 percent of GDP), most of them consisting of loans to members. Asset growth during the years has been steady, reaching 15.8 percent in 2016 (Figure 25). There are currently no significant loan defaults since loan repayments are made at the source of members’ income (i.e. in the form of direct deductions from their salaries). The ratio of NPLs to total loans was 2.0 percent as at December 2016, a slight improvement from the 2.6 percent recorded a year earlier (Figure 25).

CENTRAL BANK OF SWAZILAND | F INANCIAL STABILITY REPORT I ssue No. 1
35© 2017 Central Bank Of Swaziland
The five largest SACCOs control 67.6 percent of the entire sector’s total deposits and savings, and 66.3 percent of the entire industry’s loan book, resulting in a highly concentrated SACCOS sector.
SACCOS are gradually improving their financial management. Until recently, SACCOS had no form of supervision and regulation and relied on
the Ministry of Commerce, Industry and Trade to assist them with guidelines of their financial operations. The FSRA Act came into force in 2010, paving the way for the establishment of the FSRA, which began putting in place controls to regulate and supervise these societies. The supervised entities were required to develop risk management policies to ensure proper governance of members’ funds.
Table 13: SACCOS’ Financial Position
Details ‘0002013
‘0002014
‘0002015
‘0002016
Financial income from loans portfolios 120 491 130 357 143 927 160 409
Financial expenses 71 084 91 614 113 887 127 203
Net income/loss 49 406 38 744 30 040 33 205
Total assets 916 657 1 039 534 1 165 312 1 349 932
Total deposits/savings 749 993 843 457 980 091 1 037 645
Total loans 548 837 698 788 781 158 897 901
Total equity 115 125 142 071 155 715 200 469
Top 5 SACCOS loans 359 395 454 306 538 253 595 131
Top 5 loans/total loans 65.5% 65.0% 68.9% 66.3%
Top 5 SACCOS deposits/savings 505 294 569 736 653 672 701 148
Top 5 deposits/total deposits 67.4% 67.5% 66.7% 67.6%
NPLs/total loans 1.7% 2.0% 2.6% 2.0%
Total Members 39 508 40 585 43 356 47 542Source: COdaS
Figure 25: SACCOS’ Performance
3.0
2.5
2.0
1.5
0.5
3.0
0.0
1.6
1.0
0.4
1.4
0.8
0.2
1.2
0.6
0.0Dec-13
total assets Total Depots/Savings total loans
Total Equity Net Income/Loss NPLs/Total Loans (RHS)
Dec-14
Perc
ent
E’Bi
llion
s
Dec-15 Dec-16
Source: COdaS

FINANCIAL STABILITY REPORT I ssue No. 1 | CENTRAL BANK OF SWAZILAND
36 © 2017 Central Bank Of Swaziland
SACCOS’ profits have been on a downward trend in recent years. As at the end of December 2013, the industry’s profits were E49.4 million - this is significantly higher than the E33.2 million recorded for the year ended December 2016 (representing a 32.8 percent decrease over three years). The societies might need to reassess their cost-to-income ratios if they are to remain profitable in the coming years.
SACCOS’ operations are threatened by two main risk areas:
• Credit risk: There continues to be insufficient tools and resources to aid in the assessment of a member’s affordability. Loans may therefore be issued to non-qualifying members, thus resulting in higher NPLs, although the relative amount of NPLs remains small and has been declining in the recent past.
• Concentration risk: The five largest government employees-run SACCOS, which control 95 percent of the sector’s total assets, 66.3 percent of the industry’s loan book and 67.6 percent of the total deposits/savings, may pose threats to the entire industry in the event of a shock to the government’s finances. Cash flow challenges affecting the government may risk the sector’s sustainability as members rely on a
timely payment of wages and other income to make deposits and loan repayments.
5.5 Credit Financial Institutions
CFIs have experienced steady growth in recent years, but their consolidated portfolio remains relatively small relative to the size of the economy. Loans grew by over 76.6 percent over the last five years. As at December 2016, CFIs’ loan book stood at E1.8 billion (Figure 24), equivalent to 3.3 percent of GDP. The recent adoption of the Consumer Credit Bill by Parliament will hopefully address issues, such as the cost of credit, which have been inhibiting the growth of these types of institutions in recent years.
CFIs’ NPLs peaked during the year ended December 2013 to about 16 percent of gross loans, but have since declined to just below 10 percent at the end of 2016 as reflected on Figure 26. The peak in NPLs reflected post-financial crisis effects within the sector as some customers were unable to service their debts, a condition which has since improved as evidenced below. The establishment of the office of the Ombudsman of Financial Services and Appeals Tribunal within the FSRA has brought relief to consumers by providing a mechanism for the resolution of disputes between these CFIs and other financial institutions and their customers.

CENTRAL BANK OF SWAZILAND | F INANCIAL STABILITY REPORT I ssue No. 1
37© 2017 Central Bank Of Swaziland
Figure 26: Total credit financial institutions loan book: 2012-2016
2.0 18
1.8 16
1.6 141.4 121.2
10
E’Bi
llion
s
Perc
ent
1.0
0.8 8
0.6 6
0.4 4
0.2
Dec-12
Total Loan Book Total Non-performing Loans NPL to Total Loan Book
Dec-13 Dec-14 Dec-15 Dec-16
2
0 0
Source: fSra
As in the case of SACCOs, CFIs face important challenges in terms of credit risk.
Credit bureaus’ information does not contain or give a clear picture of consumers’ creditworthiness. The norm is for most
consumers not to be honest with their credit information, meaning it is relatively easy for one consumer to get access to credit from more than one credit institution even if his/her financial situation does not allow it.

FINANCIAL STABILITY REPORT I ssue No. 1 | CENTRAL BANK OF SWAZILAND
38 © 2017 Central Bank Of Swaziland
PAYMENT INFRASTRUCTURE AND REGULATORY DEVELOPMENTS
CHAPTER6The national payment and settlement system operated smoothly throughout 2016, despite an overall increase in values and volumes transacted. The Swaziland Automated Electronic Clearing House (SAECH) and Swaziland Inter-Bank Payment and Settlement System (SWIPSS) which supports daily inter-bank dealings are the two systemically important payment systems. Therefore, they remain one of the Bank’s main focus areas for the purposes of financial system stability assessment.
Real Time Gross Settlement (RTGS) System: Swaziland Inter-Bank Payment And Settlement System (SWIPSS)
SWIPSS processed 28,940 transaction messages worth E114.7 billion in 2015, which increased to 38,767 transaction messages worth E139.2 billion in 2016. This represents an increase of 34.0 percent in volume and an increase of 21.4 percent in value. The higher volume and value reflect increased usage of SWIPSS by the public, which may be interpreted as the system being perceived as both secure and fast.
Table 14: SWIPSS Flows Year Total Values Transferred Number of Messages
(E ‘000) Annual Percentage Change
Volume Annual Percentage Change
2013 109 477 431 0 29 011 02014 118 938 892 8.6 28 981 -0.102015 114 696 906 -3.6 28 940 -0.142016 139 241 265 21.4 38 767 34.0
Swaziland Automated Electronic Clearing House (SAECH)
Figure 27: SAECH Cheques Volume and Value
-
2 000.0
4 000.0
6 000.0
8 000.0
10 000.0
12 000.0
- 100 000 200 000 300 000 400 000 500 000 600 000 700 000 800 000
2011 2012 2013 2014 2015 2016
Cheques Volumes
2011
800,00010,917.9
10,128.6 10,312.1 9,878.9
6,969.9
4,830.5
12,000.0
10,000.0
8,000.0
6,000.0
4,000.0
2,000.0
-
700,000600,000500,000400,000300,000200,000100,000
-2012 2013 2014 2015 2016
Cheques Values
Volu
me
E’M
illio
ns
Source: Central Bank of Swaziland

CENTRAL BANK OF SWAZILAND | F INANCIAL STABILITY REPORT I ssue No. 1
39© 2017 Central Bank Of Swaziland
Figure 28: SAECH EFT CR & DR Volume and Value
-
2 000.0
4 000.0
6 000.0
8 000.0
10 000.0
12 000.0
14 000.0
-
100 000
200 000
300 000
400 000
500 000
600 000
700 000
800 000
900 000
1 000 000
2011 2012 2013 2014 2015 2016
Volu
me
EFT
Valu
e in
(E’
Mill
ions
)
14,000.01,000,000
900,000
800,000
700,000
600,000
500,000
400,000
300,000
200,000
100,000
-
12,000.0
10,000.0
8,000.0
6,000.0
4,000.0
2,000.0
-2011 2012 2013 2014 2015 2016
CR EFT Volume 498,412 544,631 583,445 775,580 816,311 883,429
DR EFT Volume 237,984 217,828 187,225 244,997 267,029 296,496
CR EFT Value 5,104.8 6,082.0 7,971.9 9,616.1 10,812.7 12,614.1
DR EFT Value 384.4 378.7 340.0 349.9 368.2 417.7
Source: Central Bank of Swaziland
In 2016, the usage of the (SAECH) decreased significantly in terms of both value (28.3 percent) and volume (6.4 percent) for cheques and electronic funds transfers (EFTs) (Table 19).
Table 15: Paper Instrument (Cheques) Flows
Year Total Values Transferred Number of Messages(E ‘000) Annual
Percentage ChangeVolumes Annual
Percentage Change
2013 10 313 269 - 677 800 -2014 9 962 163 -3.4 629 202 -7.22015 8 359 359 -16.1 564 003 -10.42016 5 990 436 -28.3 599 931 -6.4
Source: Central Bank of Swaziland
The decrease in value and volume is attributable to the implementation of SWIPSS which shifted considerable value and volume from SAECH to SWIPSS as a result of the improved efficiency and cost effectiveness associated with the SWIPSS. 6.1 Card TransactionsCard usage for payments grew strongly in terms of automated teller machines (ATMs) cards, credit and debit cards, and point of sale (POS)
terminals from December 2015 to December 2016. The number of ATM transactions and equivalent value increased from 12.2 million transactions worth E13.0 billion in December 2015 to 27.4 million transactions worth E14.9 billion in December 2016. While, the number of POS transactions and equivalent value increased from 1.9 million transactions worth E1.6 billion in December 2015 to 2.6 million transactions worth E2.0 billion in December 2016 (Table 20).

FINANCIAL STABILITY REPORT I ssue No. 1 | CENTRAL BANK OF SWAZILAND
40 © 2017 Central Bank Of Swaziland
Table 16: Other Payment Instruments Usage
Measure 2011 2012 2013 2014 2015 2016 Change (%)
Number of cards 187 179 155 639 381 591 425 752 384 487 414 273 7.7
Number of ATMs 160 182 189 230 255 251 -1.6
ATMs transactions volume (’000) 8 020 8 527 9 665 10 106 12 221 27 437 124.5
ATMs transactions value (E’000) 5 958 494 7 055 980 8 374 737 9 719 883 13 002 528 14 879 931 14.4
Commercial banks 4 4 4 4 4 4 0.0
Bank branches 42 42 44 42 61 65 6.6
Point of sale terminals number 601 629 793 1350 1704 2958 73.6
Point of sale transactions volume (’000) 1 014 946 1 203 1 651 1 997 2 556 28.0
Point of sale transactions value (E’000) 566 480 717 183 984 322 1 203 541 1 589 012 1 966 446 23.8Source: Central Bank of Swaziland
The uptake in usage of cards for payment - including debit, credit and charge cards - has grown significantly, as users now embrace initiatives by the Bank and the Swaziland Bankers Association (SBA) to adopt so-called “plastic” money as well as the growing acceptance of cards as a safe and convenient mode of payment. Increased usage of cards for payment has also raised risk profiles, prompting the Bank and SBA to devise mitigation measures, including the adoption of Maestro, MasterCard and Visa credit cards, among others, that have global security standards.
6.2 MTN Mobile Phone Money TransfersMTN Mobile Phone Money Transfer services maintained its growth momentum in 2016, with agents and users recording 149.8 percent and 28.4 percent growth rates respectively. These increases are attributed to adoption of mobile money transfer services by different institutions comprising of both financial and non-financial including banks, pensions, SACCOs, merchants, like microfinance institutions (MFIs), credit financial institutions (CFIs), NGOs, insurance, government agencies, among others for cash disbursement and repayment of loans and salary payments as well as purchases of goods and services (Table 17).
Table 17: MTN Mobile Phone Money Transactions
Dec-13 Dec-14 Dec-15 Dec-16
MtN Mobile Money
Total number of agents (RHS) (cumulative) 385 587 814 2 033
Total Mobile Active Customers (cumulative) 192 618 256 056 333 393 427 927
In and out of MtN Mobile Money Services
No. Deposit transactions 444 307 978 027 2 094 745 4 281 178
No. Withdrawals transactions 233 040 519 872 1 220 435 2 760 377
Total customer deposits (SZL) 125 965 523 290 440 139 630 947 920 1 325 513 817
total Customer withdrawals (Szl) 82 551 096 202 458 990 433 594 403 973 656 507
Value in trust account 43 414 427 87 981 149 197 353 517 351 857 310
within the mobile money services platform
No. Person to Person transactions 137 565 430 423 1 178 731 2 880 058
No. Person to Business transactions 894 526 2 889 572 7 050 503 14 795 913
No. Business to Person 1 733 4 395 10 500 106 155
Person to Person Transactions (SZL) 49 215 022 148 612 865 434 802 503 945 894 614
Person to Business Transactions (SZL) 23 014 715 61 867 713 137 157 997 284 335 231
Business to Person Transactions (SZL) 885 005 2 290 700 10 939 405 79 570 689
Source: Central Bank of Swaziland
The increase and more diversified use of the national payments system is a sign of a high level of confidence and supportive of domestic financial stability.

CENTRAL BANK OF SWAZILAND | F INANCIAL STABILITY REPORT I ssue No. 1
41© 2017 Central Bank Of Swaziland
REGULATORY DEVELOPMENTS TO IMPROVE THE ROBUSTNESS OF THE DOMESTIC FINANCIAL INFRASTRUCTURE
CHAPTER77.1 Review of the Financial Institutions Act, 2005 and Central Bank Order, 1974A review of the Central Bank Order, 197427
and the Financial Institutions Act, 200528 has commenced and it is anticipated that the process will be finalised during 2018. Required consultation with internal stakeholders has been conducted, as well as with the IMF. Consultations with other external stakeholders will be conducted before the draft Bills are tabled before Parliament and eventually assented to by the King.
7.2 Drafting of Financial Stability Bill The Bank has, in addition to its primary objective in the enabling legislation (Central Bank Order, 1974) included a secondary objective, that of “… maintaining, promoting and enhancing financial stability…” the Bank intends to exercise its powers as conferred, in terms of legislation, in a way that will best maintain, promote and enhance financial stability in the country. When fulfilling its financial stability function, the Bank must act within a legislative framework agreed between the Minister of Finance and the Governor of the Bank. Therefore, if a systemic event occurred or is imminent, the Bank is responsible for implementing corrective measures to ensure financial stability is maintained in the Kingdom.
The Bank, with the assistance of the IMF, is in the process of drafting a Financial Stability Bill which will define the financial stability mandate of the Bank and guide the process of macroprudential surveillance and institutional arrangements.
7.3 Policy implementation: 2015-2016
7.3.1. National payments system The advent of electronic money transfers is a welcome development in the financial system. However, it remains important to safeguard public interest and to mitigate associated risk in the financial system. Among other risk mitigation measures, the Bank has introduced maximum transaction limits of E4, 000 per day and E25, 000 per month for each registered subscriber. These limits are in line with the prevailing anti-money laundering and countering the financing of terrorism initiatives in the region.
In an effort to continuously manage financial risk in the retail payment stream in Swaziland and to reduce risks associated with cheque payments, the Bank, in collaboration with Swaziland Bankers Association, has revised the cheque limit from E500, 000 to E100, 000. This new upper limit came into effect on 1 October 2015.
The National Clearing and Settlement Systems Act of 2011 provides for the recognition, operation, regulation and supervision of systems for the clearing of transfer instructions between financial institutions. The Bank continues to monitor activity and emerging technological developments to ensure adequacy of the legal framework.
7.3.2 Bank supervision Following increasing public concern around the level of banking fees and charges, the Bank issued Legal Notice No. 62, 2016 (the Legal
27Available www.centralbank.org.sz. 28Available www.centralbank.org.sz.

FINANCIAL STABILITY REPORT I ssue No. 1 | CENTRAL BANK OF SWAZILAND
42 © 2017 Central Bank Of Swaziland
Notice) which came into effect on 1 July 2016. The Legal Notice prescribes, among other things, caps of zero percent on cash deposit fees, caps of E100 on penalties for dishonoured payments and compelling banks to make their banking fees and charges sufficiently public.
In line with the Bank’s mandate of promoting a sound and safe banking system and maintaining confidence in the domestic banking sector, the Bank increased the minimum liquidity requirement for banks, effective 1 July 2016. For development banks the liquidity ratio was adjusted to 22 percent, while for all other banks the ratio was adjusted to 25 percent. The banking sector remains compliant with the new requirements and maintains sufficient buffers to protect themselves in times of financial distress.
The Bank, through its Bank Supervision Department (BSD), models its regulatory and supervisory framework on highly regarded and internationally recognised key supervisory standards such as the Core Principles for Effective Banking Supervision (the Core Principles) as recommended by the Basel Committee on Banking Supervision (BCBS). The Bank has also taken the strategic decision to migrate to Basel II29 and is currently doing preparatory work for full implementation of Basel II scheduled for 1 January 2018. The Bank has finalised a draft guideline on Pillar 1 (minimum capital computation). Furthermore, the Bank is currently meeting with various strategic stakeholders, including banks, to discuss in detail the fundamental aspects of Basel II implementation in Swaziland.
29http://www.bis.org/publ/bcbs107.pdf

CENTRAL BANK OF SWAZILAND | F INANCIAL STABILITY REPORT I ssue No. 1
43© 2017 Central Bank Of Swaziland
STRESS-TESTING THE SWAZILAND BANKING SECTOR
CHAPTER8To assess the resilience of the Swaziland banking sector to any systemic risks, the Bank performs stress tests30 on the sector from a top-down perspective. The shocks that are applied correspond to exceptional but plausible events.
The main objectives of the tests include:• the identification of structural
vulnerabilities, overall risk exposure and potential interactions between different
risk types that could cause disruption to the financial system; and
• the development of risk mitigation and contingency plans across the financial sector.
The stress tests focused on two main potential sources of vulnerabilities for the Swaziland banking sector, namely credit and liquidity risks.
30Stress testing is a risk management technique used to evaluate the potential effect of a set of specified changes in risk factors on a financial system’s condition.
Table 18: Summary of stress test shocks and breaking points
Risk Type Shock Breaking Point Credit Assesses the effect of a migration of the
banks’ existing total performing loans to NPLs.
The first bank fails because of the gradual increase in NPLs.
Liquidity A simulated bank run test which models the number of days’ banks would be able to survive a systemic liquidity drain without resorting to liquidity from external sources.
The first bank’s liquid assets are depleted following sudden withdrawal of deposits.
8.1 Credit Risk Credit shocks were conducted to assess the effect that a continued deterioration in asset quality would have on banks’ capital. The test applied a uniform shock to the baseline level of performing loans such that a proportion of
the performing loans become non-performing. The results show that 9.1 percent of performing loans would have to migrate to non-performing status for the first bank’s capital adequacy ratio to fall below the 8.0 percent minimum regulatory requirement.
Table 19: Summary of stress test results for loans migration
CAR (%)
Tier 1 capital (E’billion)
NPL ratio (%)
Number of undercapitalized
banksBaseline scenario 21.3 2.5 10.2 0

FINANCIAL STABILITY REPORT I ssue No. 1 | CENTRAL BANK OF SWAZILAND
44 © 2017 Central Bank Of Swaziland
The capital adequacy and NPL ratios for the banking sector following the shock are 18.1% and 19.3% respectively. The resilience of the banking sector to this shock could be attributed to the already high levels of capital held by banks.
8.1.1 Default by the largest borrowers Assuming default by the largest borrowers and a 100 percent provisioning requirement (the ‘loss’ category for loans), the results showed that the 8 percent minimum regulatory capital adequacy requirement is breached by the first bank after default by the top three largest borrowers.
Table 20: Default by the largest borrowers Key Indicators Dec-2015 Dec-2016CAR (%) 18.0 15.0NPL ratio 7.3 19.3Tier 1 capital (E billion) 1.8 1.6No. of undercapitalised banks 1 1
8.2 Liquidity RiskAlthough indicators show that overall liquidity for banks improved marginally in the year to December 2016, uncertainty remains about the potential to have adequate liquid assets to fund short- to medium-term funding activities during a period of stress.
8.2.1 Simulated Bank RunThe Bank conducted a stress test for liquidity,
in which a simple bank run was simulated. The resilience of banks to such a risk from a liquidity perspective was assessed by the number of days banking institutions would be able to withstand a drain on its liquidity without having to resort to external support. The results revealed that liquid assets of the four banks would be depleted after eight days of distress, assuming a daily withdrawal rate of 5% on demand and savings deposits and 2.5 percent on term deposits.
Table 21: Summary of stress test results for bank run
Key Indicators Dec-2015 Dec-2016Pre-shock
Dec-2016Post-shock
Liquid assets to total deposits (%) 25.9 28.6 18.5
Reduction in total deposits (%) 30.2
No. of days to deplete liquid assets 8
No. of banks breaching the regulatory liquidity ratio 4
Shock Key Indicators Dec-2015 Dec-2016Reduction in performing loans that causes the first bank to fail
Change in NPL ratio that causes the first bank to fail (%)
7.5 9.1
CAR (%) 16.5 18.1NPL ratio (%) 13.3 19.3Tier 1 capital (E billion) 1.6 2.1No. of undercapitalised banks 1 1
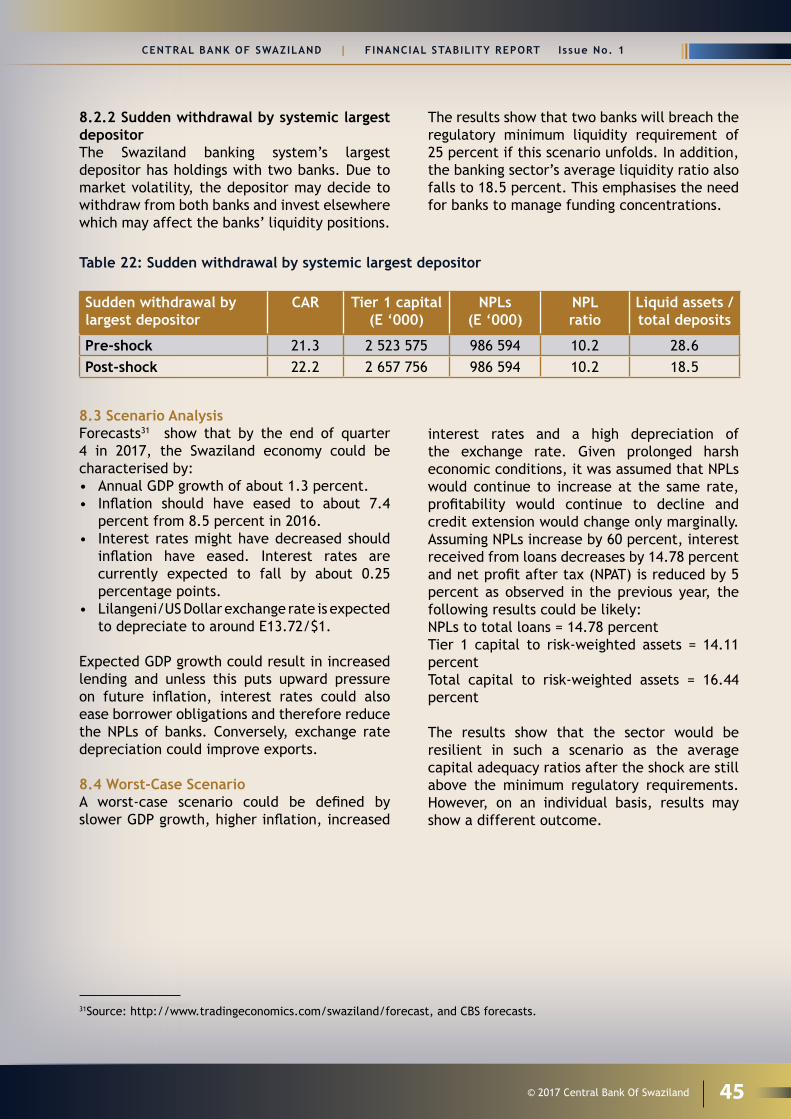
CENTRAL BANK OF SWAZILAND | F INANCIAL STABILITY REPORT I ssue No. 1
45© 2017 Central Bank Of Swaziland
8.2.2 Sudden withdrawal by systemic largest depositor The Swaziland banking system’s largest depositor has holdings with two banks. Due to market volatility, the depositor may decide to withdraw from both banks and invest elsewhere which may affect the banks’ liquidity positions.
The results show that two banks will breach the regulatory minimum liquidity requirement of 25 percent if this scenario unfolds. In addition, the banking sector’s average liquidity ratio also falls to 18.5 percent. This emphasises the need for banks to manage funding concentrations.
Table 22: Sudden withdrawal by systemic largest depositor
Sudden withdrawal by largest depositor
CAR Tier 1 capital (E ‘000)
NPLs(E ‘000)
NPL ratio
Liquid assets /total deposits
Pre-shock 21.3 2 523 575 986 594 10.2 28.6Post-shock 22.2 2 657 756 986 594 10.2 18.5
8.3 Scenario AnalysisForecasts31 show that by the end of quarter 4 in 2017, the Swaziland economy could be characterised by: • Annual GDP growth of about 1.3 percent.• Inflation should have eased to about 7.4
percent from 8.5 percent in 2016. • Interest rates might have decreased should
inflation have eased. Interest rates are currently expected to fall by about 0.25 percentage points.
• Lilangeni/US Dollar exchange rate is expected to depreciate to around E13.72/$1.
Expected GDP growth could result in increased lending and unless this puts upward pressure on future inflation, interest rates could also ease borrower obligations and therefore reduce the NPLs of banks. Conversely, exchange rate depreciation could improve exports.
8.4 Worst-Case ScenarioA worst-case scenario could be defined by slower GDP growth, higher inflation, increased
interest rates and a high depreciation of the exchange rate. Given prolonged harsh economic conditions, it was assumed that NPLs would continue to increase at the same rate, profitability would continue to decline and credit extension would change only marginally. Assuming NPLs increase by 60 percent, interest received from loans decreases by 14.78 percent and net profit after tax (NPAT) is reduced by 5 percent as observed in the previous year, the following results could be likely:NPLs to total loans = 14.78 percentTier 1 capital to risk-weighted assets = 14.11 percentTotal capital to risk-weighted assets = 16.44 percent
The results show that the sector would be resilient in such a scenario as the average capital adequacy ratios after the shock are still above the minimum regulatory requirements. However, on an individual basis, results may show a different outcome.
31Source: http://www.tradingeconomics.com/swaziland/forecast, and CBS forecasts.

FINANCIAL STABILITY REPORT I ssue No. 1 | CENTRAL BANK OF SWAZILAND
46 © 2017 Central Bank Of Swaziland
Table 23: Selected quarterly financial soundness indicators for Swaziland
Mar-15 Jun-15 Sep-15 Dec-15 Mar-16 Jun-16 Sep-16 Dec-16 Mar-17 Jun-17
Regulatory Capital to Risk-Weighted Assets 19.0 18.9 19.5 22.5 22.8 22.1 22.2 22.2 23.5 23.5
Regulatory Tier 1 Capital to Risk-Weighted Assets 16.6 16.6 17.3 20.0 20.4 19.8 20.0 20.0 21.2 21.0
NPLs to Total Gross Loans 3.7 3.6 4.6 6.4 7.6 7.8 9.1 9.2 10.0 8.2
return on assets (rOa) 3.2 3.2 3.0 3.2 3.2 3.2 2.9 2.5 0.8 2.2
Return on Equity (ROE) 21.1 22.3 21.6 23.1 21.7 22.4 20.1 18.4 3.5 15.7Source: Central Bank of Swaziland
STATISTICAL APPENDIX
CHAPTER 9

CENTRAL BANK OF SWAZILAND | F INANCIAL STABILITY REPORT I ssue No. 1
47© 2017 Central Bank Of Swaziland
Tab
le 2
4: C
omm
erci
al b
anks
’ qu
arte
rly
finan
cial
sou
ndne
ss in
dica
tors
Mar
-15
Jun-
15Se
p-15
Dec
-15
Mar
-16
Jun-
16Se
p-16
Dec
-16
Mar
-17
Jun-
17
Capi
tal A
dequ
acy
Regu
lato
ry c
apit
al t
o ri
sk-
wei
ghte
d as
sets
19.0
18.9
19.5
22.5
22.8
22.1
22.2
22.2
23.5
23.5
Regu
lato
ry t
ier
1 ca
pita
l to
risk
-wei
ghte
d as
sets
16.6
16.6
17.3
20.0
20.4
19.8
20.0
20.0
21.2
21.0
Leve
rage
rat
io8.
07.
67.
710
.210
.811
.111
.311
.213
.011
.3A
sset
qua
lity
NPL
s to
tot
al g
ross
loan
s3.
73.
64.
66.
47.
67.
89.
19.
29.
98.
2N
PLs
to t
otal
dep
osit
s3.
53.
43.
85.
36.
66.
77.
66.
88.
66.
2Se
ctor
al d
istr
ibut
ion
of g
ross
loan
s (%
)Ag
ricu
ltur
e an
d fo
rest
ry9.
68.
86.
36.
46.
86.
36.
56.
57.
87.
5M
inin
g an
d qu
arry
ing
1.6
1.3
1.2
0.2
0.7
0.7
0.7
0.6
0.6
0.6
Man
ufac
turi
ng7.
511
.69.
29.
05.
65.
44.
04.
32.
92.
6Co
nstr
ucti
ond
istr
ibut
ion
and
tour
ism
8.8
8.2
9.5
7.4
8.8
9.6
10.3
10.5
11.6
12.5
Tran
spor
t an
d co
mm
unic
atio
ns6.
45.
34.
84.
94.
94.
94.
94.
64.
74.
3Co
mm
unit
y so
cial
and
per
sona
l se
rvic
es7.
06.
25.
14.
63.
94.
13.
97.
06.
16.
3
Real
est
ate
Oth
er b
usin
esse
s (n
ot e
lsew
here
in
clud
ed)
3.
33.
74.
0
Pers
onal
and
hou
seho
ld lo
ans
39.8
39.6
42.1
38.5
45.9
45.4
45.6
44.6
43.8
42.6
Oth
er3.
74.
13.
24.
75.
13.
13.
63.
44.
04.
2
La
rge
expo
sure
s to
tot
al c
apit
al94
.391
.895
.711
4.3
100.
281
.983
.372
.778
.998
.4

FINANCIAL STABILITY REPORT I ssue No. 1 | CENTRAL BANK OF SWAZILAND
48 © 2017 Central Bank Of Swaziland
Tab
le 2
4: C
omm
erci
al b
anks
’ qu
arte
rly
finan
cial
sou
ndne
ss in
dica
tors
Mar
-15
Jun-
15Se
p-15
Dec
-15
Mar
-16
Jun-
16Se
p-16
Dec
-16
Mar
-17
Jun-
17
Earn
ings
& p
rofit
abili
ty
retu
rn o
n as
sets
3.2
3.2
3.0
3.2
3.2
3.2
2.9
2.5
2.3
2.2
Retu
rn o
n eq
uity
21.1
22.2
21.6
23.1
21.7
22.4
20.1
18.4
14.0
15.7
Net
inte
rest
mar
gin
8.1
7.5
7.5
6.1
6.4
6.7
6.6
5.9
7.6
6.6
Cost
of
depo
sits
-2.7
-2.7
-2.5
-2.6
-2.9
-2.9
-2.8
-2.5
-3.4
-3.0
Cost
to
inco
me
-68.
4-6
7.2
-67.
3-6
5.9
-68.
5-6
8.2
-70.
2-7
1.0
-78.
4-7
6.2
Ove
rhea
ds t
o in
com
e-4
6.9
-48.
0-4
7.8
-45.
4-4
7.3
-45.
7-4
7.0
-47.
8-5
0.1
-50.
2
Liqu
idit
y
Liqu
id a
sset
s to
tot
al d
epos
its
21.4
20.9
19.6
27.7
26.9
27.4
30.3
28.6
28.4
25.3
Tota
l loa
ns t
o to
tal d
epos
its
95.6
93.0
83.3
83.0
87.0
85.8
83.8
74.0
86.0
75.3
Mar
ket
Sens
itiv
ity
Fore
ign
curr
ency
exp
osur
e to
re
gula
tory
tie
r 1
capi
tal
-151
.0-1
60.4
-131
.1-6
49.8
-102
.1-8
7.5
-79.
6-9
2.8
-37.
1-6
2.2
Fore
ign
curr
ency
loan
s to
for
eign
cu
rren
cy d
epos
its
0.0
0.0
0.0
0.0
0.0
0.0
1.0
2.0
3.0
4.0
Fore
ign
curr
ency
ass
ets
to f
orei
gn
curr
ency
liab
iliti
es9.
08.
212
.115
2.1
14.6
20.2
17.1
22.9
42.3
29.1

CENTRAL BANK OF SWAZILAND | F INANCIAL STABILITY REPORT I ssue No. 1
49© 2017 Central Bank Of Swaziland
Tab
le 2
5: C
omm
erci
al b
anks
’ qu
arte
rly
bala
nce
shee
t
Mar
-15
Jun-
15Se
p-15
Dec
-15
Mar
-16
Jun-
16Se
p-16
Dec
-16
Mar
-17
Jun-
17A
SSET
S (E
. Bi
llion
)
Cash
& c
ash
asse
ts32
8,42
3 29
8,34
9 30
2,83
7 44
2,74
5 33
7,74
5 39
2,51
4 36
3,00
3 44
1,98
2 32
1,18
1 31
4,32
7
Bala
nces
wit
h CB
S71
1,04
3 77
5,09
9 91
4,09
8 1,
195,
984
1,05
9,99
3 96
6,81
3 1,
224,
309
1,6
38,5
46
987,
190
1,24
1,42
5
due
fro
m b
anks
in S
waz
iland
20,0
00
50,0
00
- -
- -
- 60
,499
41
,474
52
,497
due
fro
m b
anks
abr
oad
1,22
2,96
3 1,
279,
393
2,55
7,35
1 2,
128,
067
2,25
7,45
4 1,
869,
878
1,57
1,04
0 2,
687,
900
1,15
4,88
4 2,
782,
930
Gov
ernm
ent
secu
riti
es1,
372,
480
1,44
2,85
2 1,
459,
533
1,59
7,61
1 1,
565,
902
1,81
2,73
8 2,
168,
932
2,05
9,81
4 2,
123,
627
2,05
3,30
7
Tota
l gro
ss lo
ans
& a
dvan
ces
9,16
0,13
6 9,
498,
283
9,60
3,35
0 9,
671,
077
9,55
0,90
1 9,
883,
365
10,3
81,4
35
10,6
91,1
60
10,3
52,8
40
603,
553
LESS
: Pr
ovis
ions
725,
072
698,
803
740,
755
660,
148
686,
727
759,
634
798,
688
789,
195
749,
903
10,7
45,6
34
Net
loan
s &
adv
ance
s8,
435,
064
8,79
9,48
0 8,
862,
595
9,01
0,93
0 8,
864,
175
9,12
3,73
1 9,
582,
746
9,90
1,96
5 9,
602,
937
734,
389
Net
fixe
d as
sets
272,
019
270,
158
269,
009
282,
735
280,
685
298,
557
311,
798
320,
632
347,
440
10,0
11,2
45
Oth
er a
sset
s28
5,77
6 30
4,00
3
530,
993
467,
725
315,
867
8
34,3
88
574,
800
1,06
5,89
375
6,87
3 81
8,09
5
TOTA
L A
SSET
S12
,770
,591
13
,598
,362
14
,981
,938
15
,359
,010
15
,136
,142
15
,776
,456
16
,350
,359
18
,302
,140
15
,691
,036
1
8,27
1,69
8
LIA
BILI
TIES
(E.
Bill
ion)
Dep
osit
s
9,58
4,51
7 10
,210
,653
11
,522
,123
11
,648
,926
10
,972
,211
11
,520
,413
12
,384
,520
14
,458
,085
14
,269
,865
due
fro
m b
anks
in S
waz
iland
111,
312
105,
130
93,0
48
126,
595
99,6
97
33,9
62
35,6
29
50,1
08
70,2
36
127,
210
due
fro
m b
anks
abr
oad
326,
295
615,
532
147,
631
653,
092
1,02
0,55
8 1,
038,
904
401,
042
461,
270
240,
276
282,
520
adm
inis
tere
d fu
nds
-
-
- -
- -
- -
- -
Oth
er li
abili
ties
709,
664
584,
374
777,
646
772,
447
745,
499
836,
311
1,08
0,67
8 78
5,73
9 72
6,61
8 92
9,75
6
TOTA
L LI
ABI
LITI
ES10
,739
,998
11
,529
,685
12
,556
,756
13
,205
,888
12
,843
,019
13
,436
,375
13
,913
,502
15
,767
,156
13
,101
,428
15
,672
,271
CAPI
TAL
(E.
Billi
on)
Paid
-up
capi
tal
82,3
78
82,3
78
27,5
78
27,5
78
82,3
78
82,3
78
82,7
52
82,7
52
82,7
52
82,7
52
Shar
e pr
emiu
m37
,219
37
,219
37
,219
37
,219
37
,219
37
,219
39
,337
39
,337
39
,337
39
,337
Reta
ined
res
erve
s1,
186,
636
1,16
3,74
0 1,
147,
234
1,14
1,76
7 1,
441,
616
1,38
3,14
8 1,
380,
423
1,38
5,94
0 1,
776,
468
1,74
0,03
8
Oth
er r
eser
ves/
subo
rdin
ated
de
bt39
7,36
8 39
7,36
8 40
3,51
3 55
2,33
2 58
9,29
0 58
0,05
7 57
4,92
3 58
8,36
1 58
8,36
164
4,12
2
Profi
t-Lo
ss (
cur
rent
yea
r)10
0,72
1 15
6,14
4 29
3,19
1 30
3,05
6 11
6,61
7 18
6,33
3 30
3,01
2 40
1,84
3 51
,419
43
,002
TOTA
L SH
ARE
HO
LDER
S’
FUN
DS
1,92
7,44
119
71,8
482,
092,
390
2,10
2,93
22,
230,
161
2,27
8,36
82,
385,
581
2,48
4,79
52,
538,
336
2,54
9,25
0
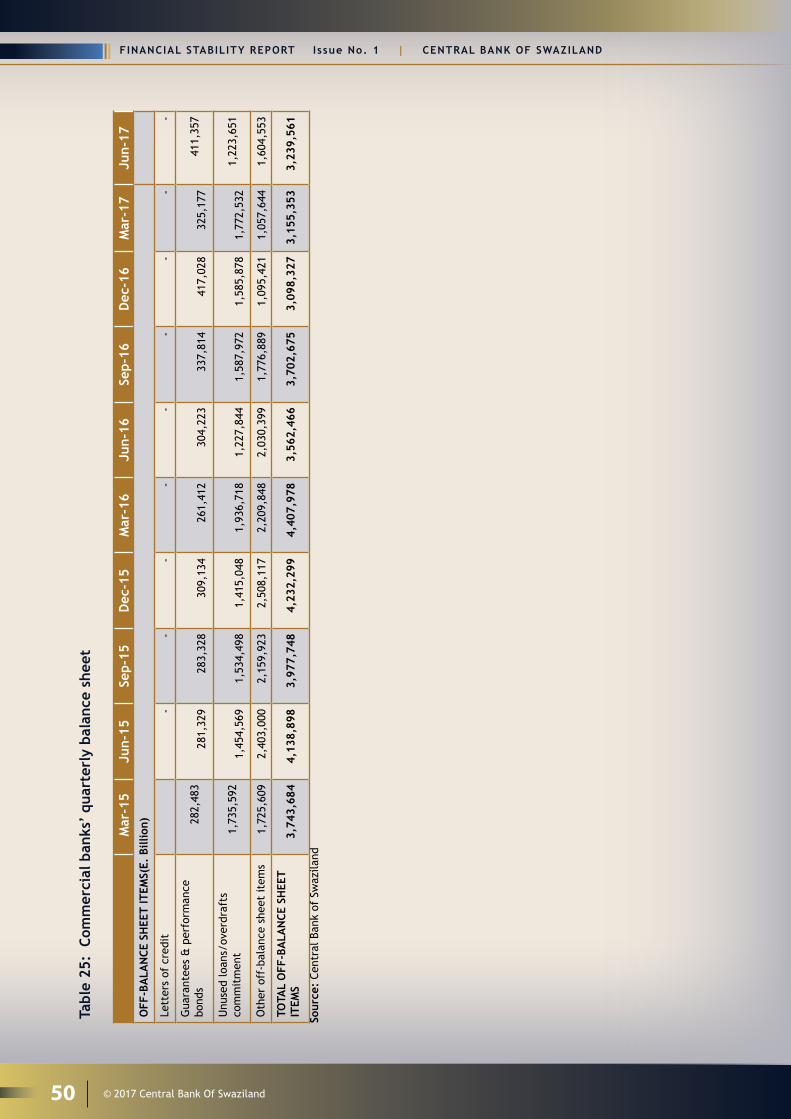
FINANCIAL STABILITY REPORT I ssue No. 1 | CENTRAL BANK OF SWAZILAND
50 © 2017 Central Bank Of Swaziland
Tab
le 2
5: C
omm
erci
al b
anks
’ qu
arte
rly
bala
nce
shee
t
Mar
-15
Jun-
15Se
p-15
Dec
-15
Mar
-16
Jun-
16Se
p-16
Dec
-16
Mar
-17
Jun-
17O
FF-B
ALA
NCE
SH
EET
ITEM
S(E.
Bill
ion)
Lett
ers
of c
redi
t
-
- -
- -
- -
- -
Gua
rant
ees
& p
erfo
rman
ce
bond
s
2
82,4
83
28
1,32
9
283,
328
30
9,13
4
261,
412
30
4,22
3
337,
814
41
7,02
8
325,
177
411,
357
Unu
sed
loan
s/ov
erdr
afts
co
mm
itm
ent
1
,735
,592
1,45
4,56
9
1,
534,
498
1,41
5,04
8
1,
936,
718
1,22
7,84
4
1,
587,
972
1,58
5,87
8
1,
772,
532
1,22
3,65
1
Oth
er o
ff-b
alan
ce s
heet
item
s1,
725,
609
2,40
3,00
0 2,
159,
923
2,50
8,11
7 2,
209,
848
2,03
0,39
9 1,
776,
889
1,09
5,42
1 1,
057,
644
1,60
4,55
3
TOTA
L O
FF-B
ALA
NCE
SH
EET
ITEM
S3,
743,
684
4,13
8,89
8 3,
977,
748
4,23
2,29
9 4,
407,
978
3,56
2,46
6 3,
702,
675
3,09
8,32
7 3,
155,
353
3,23
9,56
1
Sour
ce:
Cent
ral B
ank
of S
waz
iland

CENTRAL BANK OF SWAZILAND | F INANCIAL STABILITY REPORT I ssue No. 1
51© 2017 Central Bank Of Swaziland
Tab
le 2
5: C
omm
erci
al b
anks
’ qu
arte
rly
bala
nce
shee
t
Mar
-15
Jun-
15Se
p-15
Dec
-15
Mar
-16
Jun-
16Se
p-16
Dec
-16
Mar
-17
Jun-
17O
FF-B
ALA
NCE
SH
EET
ITEM
S(E.
Bill
ion)
Lett
ers
of c
redi
t
-
- -
- -
- -
- -
Gua
rant
ees
& p
erfo
rman
ce
bond
s
2
82,4
83
28
1,32
9
283,
328
30
9,13
4
261,
412
30
4,22
3
337,
814
41
7,02
8
325,
177
411,
357
Unu
sed
loan
s/ov
erdr
afts
co
mm
itm
ent
1
,735
,592
1,45
4,56
9
1,
534,
498
1,41
5,04
8
1,
936,
718
1,22
7,84
4
1,
587,
972
1,58
5,87
8
1,
772,
532
1,22
3,65
1
Oth
er o
ff-b
alan
ce s
heet
item
s1,
725,
609
2,40
3,00
0 2,
159,
923
2,50
8,11
7 2,
209,
848
2,03
0,39
9 1,
776,
889
1,09
5,42
1 1,
057,
644
1,60
4,55
3
TOTA
L O
FF-B
ALA
NCE
SH
EET
ITEM
S3,
743,
684
4,13
8,89
8 3,
977,
748
4,23
2,29
9 4,
407,
978
3,56
2,46
6 3,
702,
675
3,09
8,32
7 3,
155,
353
3,23
9,56
1
Sour
ce:
Cent
ral B
ank
of S
waz
iland
Tabl
e 26
: Co
mm
erci
al b
anks
’ qu
arte
rly
inco
me
stat
emen
t, y
ear-
on-y
ear
figur
es
Mar
-15
Jun-
15Se
p-15
Dec
-15
Mar
-16
Jun-
16Se
p-16
Dec
-16
Mar
-17
Jun-
17IN
COM
E (E
. Bi
llion
)In
tere
st in
com
e on
ad
vanc
es82
8,06
286
3,43
191
0,05
492
5,53
41,
019,
324
1,07
2,21
21,
127,
920
1,15
9,67
21,
260,
488
1,26
9,19
6
Inte
rest
inco
me
on
Gov
ernm
ent
secu
riti
es79
,601
79,8
7779
,267
80,7
7380
,644
89,4
9310
5,26
311
1,69
818
2,87
518
2,64
6
Inte
rest
inco
me
on
depo
sits
abr
oad
110,
979
109,
949
92,7
4210
4,20
414
1,17
313
4,99
611
6,06
011
8,55
711
3,83
112
6,30
2
Inte
rest
inco
me
- ot
hers
17,4
8421
,244
21,1
0419
,228
17,5
8819
,200
19,9
1121
,964
--
Char
ges,
fee
s an
d co
mm
issi
ons
581,
873
511,
076
495,
188
675,
342
586,
255
613,
157
676,
845
664,
300
600,
145
621,
071
Fore
ign
exch
ange
in
com
e52
,706
87,5
2787
,652
50,0
4950
,893
62,7
7380
,226
75,4
4250
,473
56,7
61
Oth
er in
com
e19
0,21
821
4,78
724
1,74
410
6,20
122
3,09
020
0,89
710
6,95
010
9,64
210
7,40
011
1,65
2
TOTA
L IN
COM
E
EXPE
NSE
S (E
. Bi
llion
)In
tere
st e
xpen
se o
n de
posi
ts26
2,70
627
2,36
128
8,23
430
3,91
832
1,45
533
3,94
334
7,84
836
0,15
540
9,35
442
2,86
1
Oth
er in
tere
st e
xpen
ses
3,81
15,
182
5,09
95,
643
32,6
5437
,733
42,4
9248
,371
61,2
7659
,907
Prov
isio
ns f
or b
ad d
ebts
134,
512
84,2
8281
,835
92,4
5194
,634
122,
044
128,
423
116,
916
184,
683
133,
702
Sala
ries
, w
ages
, st
aff
cost
s44
9,68
446
3,47
146
8,23
347
1,29
548
4,42
047
5,27
349
2,96
650
5,07
954
4,12
855
8,79
3
Prem
ises
, de
prec
iati
on,
tran
spor
t56
,676
65,3
4367
,496
65,6
8679
,245
71,9
5073
,688
74,4
5676
,043
78,9
06
Oth
er e
xpen
ses
366,
013
377,
475
385,
862
352,
730
439,
649
454,
765
482,
630
501,
429
539,
723
550,
949
TOTA
L EX
PEN
SES
1,27
3,40
01,
268,
113
1,29
6,75
91,
291,
723
1,45
2,05
71,
495,
708
1,56
8,04
61,
606,
406
1,81
5,20
71,
805,
118
ADD
: Ex
trao
rdin
ary
cred
its/
char
ges
--
--
--
--
--
Net
pro
fit b
efor
e ta
x58
7,52
261
9,77
763
0,99
266
9,60
866
6,91
069
7,02
166
5,12
965
4,87
050
0,00
556
2,51
1
LESS
: Co
rpor
atio
n ta
x18
1,36
218
1,09
817
9,93
718
3,75
418
3,48
218
6,74
518
6,28
619
6,90
414
4,33
116
3,50
0
NET
PRO
FIT
AFT
ER T
AX
406,
160
438,
679
451,
056
485,
854
483,
428
510,
276
478,
843
457,
966
355,
674
399,
010
Sour
ce:
Cent
ral B
ank
of S
waz
iland

FINANCIAL STABILITY REPORT I ssue No. 1 | CENTRAL BANK OF SWAZILAND
52 © 2017 Central Bank Of Swaziland
NOTES

CENTRAL BANK OF SWAZILAND | F INANCIAL STABILITY REPORT I ssue No. 1
53© 2017 Central Bank Of Swaziland

![SWAZILAND GOVERNMENT GAZETTE EXTRAORDINARY - Swaziland Competition … Commission Regulations... · SWAZILAND GOVERNMENT GAZETTE EXTRAORDINARY VOL. XLVIII] ... \ THE COMPETITION ACT,](https://img.pdfslide.us/doc/110x75/5ad0acb57f8b9a8b1e8e2be8/swaziland-government-gazette-extraordinary-swaziland-competition-commission.jpg)