Embed Size (px)
Citation preview

������������ ������ �
�
Central Bank of Sudan
����������������������� �Statistics Directorate
������� ���� � ������ ����� ������� �������2016
Foreign Trade Statistical DigestJanuary - March 2016

� ����������� ������ �Central Bank of Sudan
����� �–��!��� �Khartoum – Almogran
"�#$�%#313������� �P. O. Box: 313�
���&�%87056689� 1'249(� �Tel: (249) 187056689�
���)��*�%183781341�'249(� �Fax: (249) 183781341�
+,-,.��/01�23����%http://www.cbos.gov.sd� �Website: http://www.cbos.gov.sd�
�4,5-6 ��7�����% [email protected]� �E. mail: [email protected]���8��9 ��%� �

:;<���� �����=>0 �4?�����������<���� �
Foreign Trade Statistical Digest
Contents ����� Table
����� Page ��������
Introduction 4 ������ Trade Balance during the period 2005 - (January – March) 2016 5 ���� �!" #����� $����
2005- ) %% ���&����' (2016
First Section : Exports ��* +,�� :��.��� Summary of Exports during the period (January – March) 2016 1 8 .��� /� � ���� �!" ��)'��� %% ���&� (2016
Exports by commodities during the period (January – March) 2016 (Monthly) 2 10 �!" 3 ,� 7,� ��.���)%% ���&� ���' (2016
)���9; (Exports by commodities during the period (January – March) 2016 (Quarterly) 3 11 �=��� �!" 3 ,� 7,� ��.���) '��=� %=% ���=&�(
2016 )#�&> 3?�( Exports By commodities during the period (January – March) 2015 and 2016 4 12 ���� �!" 3 ,� 7,� ��.���)'��� %% ���&�(
2015- 2016Exports by country during the period (January – March) 2016 (Monthly) 5 15-13 ���� �!" �@�� 7,� ��.���
) ���&� %% ���' (2016 ) ���9;(Exports by country & commodity during the period (January – March) 2016 6 18-16 ���� �!" �G ,�� �@�� 7,� ��.���
) %% ���&����' (2016Second Section : Imports �H�K� +,�� :�.��� Summary of Imports during the period (January – March) 2016 1 20 ���� �!" �.��� /� �
)'��� %% ���&� (2016Imports by Commodities during the period (January – March ) 2016 (Monthly) 2 24-22 ��� �!" 3 ,� 7,� �.��� �
)'��� %% ���&� (2016 )���9; (Imports by Commodities during the period (January – March ) 2016 Quarterly) 3 27- 25 ���� �!" 3 ,� 7,� �.���
)'��� %% ���&� (2016 ) #�&> 3?�(Imports by Commodities During the period (January – March ) 2015 - 2016 4 30 - 28 ���� �!" 3 ,� 7,� �.���
)'��� %% ���&� (2015 - 2016Imports by Country during the period(January – March ) 2016 ( Monthly) 5 33-31 ���� �!" �@�� 7,� �.���
)'��� %% ���&� (2016 )N���9;(Imports by Country & Commodity during
the period (January – March ) 2016 6 36 - 34 ���� �!" �G ,�� �@�� 7,� �.���)'��� %% ���&� (2016
Government Imports by Commodities during the period (January – March ) 2016 (Monthly)
7 39 - 37 ���� �!" 3 ,��? ����U�� �.���)�&�'��� %% �� (2016 ) N���9; (
Government Imports by Country during the period (January – March ) 2016 (Monthly) 8 41 - 40 ���� �!" �@�� 7,� ����U�� �.���
)'��� %% ���&� (2016 )���9; (
�%%%%%%%%�����
������ ������ ����� � ��������� ���������� ���������� ���� � �������� � ����� ��!��"���� # ���!������ $���%�& '���( )�"����
���*�+,� ����+-�.� ����/�-��0�1�� 2�!"����� � . 4���56& 7����0#$"8-�� ��/9 :6-8 ;( <= ��� ��!��"��# ���!���� '�( .
�!"� �"> ��1�9 ?�6#2 -8 ;�( @�� A���� B���C-�� ��D1�� E�F6������� !GH�� ���I @J9.
K�L& B�( ��!��"�� M�N)P�L ( 7�R= ���F�� 2& A& S"��T"�� ����1�9 '���� 7����U��# V9W����� X�(���5H�� ���D�Y . ���9&
K�L& '�( ��1H9 B�* ���!����)Z"* ((�5H�� ���% 2& A& � V9W��� �D�Y 7�0[7��U�� #.
2& \� ]��0^ @���% 7���0 [ ��������� ��������� ��������� _-��� _�-�`a b���c�L� @�6 �9# ���d0�� ��9a� X �6��e�
X-���f& ����L g���� [ �U��D� ;���h -���J ]�W����� @���% 2& ]��`�("*��� 2�)�9 ��������.
;( ��^��> ����i� A)+-�� j��.� ���6 4�56&���,� �����> A������ 2�)���# ��!��"��# ���!���� . ��+
k8 ;Y������� ������� ��^��> M� ;9� �c� l���..
� �� �� �
� �� �� �

القسم األول
الصــــــــــــــــــــادرات
First Section
EXPORTS

Period
������� ����� Trade
Balance
������Imports
�����
Exports
����� ����������
NonPetroleumExports
����� ��������
PetroleumExports
�����
2006 (2,416,930) 8,073,498 5,656,568 569,357 5,087,211 20062007 103,793 8,775,457 8,879,250 460,722 8,418,528 20072008 2,318,964 9,351,540 11,670,504 576,393 11,094,111 20082009 (1,433,813) 9,690,918 8,257,105 1,020,318 7,236,787 20092010 1,359,510 10,044,770 11,404,280 1,712,018 9,692,262 20102011 957,572 9,235,860 10,193,432 2,294,239 7,899,193 20112012 (5,163,819) 9,230,318 4,066,499 3,111,511 954,988 20122013** (5,128,336) 9,918,068 4,789,732 3,073,187 1,716,545 **20132014** (4,861,090) 9,211,300 4,350,210 3,096,140 1,254,070 **20142015* (6,339,642) 9,508,653 3,169,011 2,541,829 627,182 *20152016* (1,237,804) 1,908,012 670,208 561,954 108,254 *2016 January (277,086) 494,439 217,353 168,413 48,940 ��� February (471,708) 674,233 202,525 178,935 23,590 ���� March (489,010) 739,340 250,330 214,606 35,724 ��*Adjusted data ����� ��� ***Provisional ����� ��� **
( �� - ��� ) 2016- 2006 ����� ��� ����� �������Trade Balance During The Period 2006 - 2016 ( Jan. - Mar. )
( ������ ���� ���!�� )( Value In US.$000'S )

1,0
00
1,2
00
1,4
00
����
� ���
"�
��� �
������
)
���
- �
� (
2016
Trad
e B
alan
ce D
urin
g th
e Pe
riod
( Jan
. -M
ar. )
201
6 �
���
�� ��
����
#�!��
(Val
ues
In U
S$ M
illio
n)
0
20
0
40
0
60
0
80
0
Mar
Feb
Jan
Impo
rtsEx
ports

���%��Quantity
���!��Value
Crude Oil Barrel 3,140,164 96,155 ���� #� ����Benzine M. T. 33,635 12,099 "�� �& �����Kerosene " - - " ��/��%Light Gas " - - " :���& ��F/O& HCGO " - - " ���=�� ��>���Furnace " - - " ����Mixed butagas " - - " &�?�� ��Diesel " - - " ������Others Petroleium Produts Value - - ���> "�� ������ ����Cotton Bale 10,875 12,718 ��� �&>Gum Arabic M.T. 14,734 29,215 "�� �& :�@ R��Sesame " 75,799 65,589 " #/�/Sugar " 25,013 9,072 " %/��Ethanol " - 2,778 " ���W���Groundnuts " 4,119 3,696 " :����/ ���Cake and Meal " 8,615 1,535 " ����Dura (Sorghum) " 50,771 13,932 " �XLivestock Value - 214,263 ���> ��= ����=Meat M.T. 1,861 7,238 "�� �& #�=�Hides & Skins Value - 3,144 ���> ��?�Gold K.G. 3,994 154,377 #�� �?�% YZXOthers Value - 44,397 ���> "�[Total 670,208 \������*Provisional Data ����� ��� *
��=��� ]^^^^^^^?/��
Table No. (1) #> ����* 2016 ( �� - ��� ) ����� ��� ����� _�?�
Summary Of Exports During ( Jan. - Mar. ) 2016*( ������ ���� ���!�� )
( Value in US.$000'S )
Commodities Unit
2016 (�� - ��� )**(Jan. - Mar. ) 2016

154.
421
4.3
1,00
0
����
� ���
����
����
��
���
��)
���
� �
� (
2016
Non
Pet
role
um E
xpor
ts D
urin
g (J
an. �
Mar
.) 20
16 �
���
�� ��
����
���!�
� (V
alue
In U
S$ M
illio
n)
65.6
7.2
12.7
29.2
3.1
75.4
110100
Commodities ���Jan.
����Feb.
��March
\������Total ]?/��
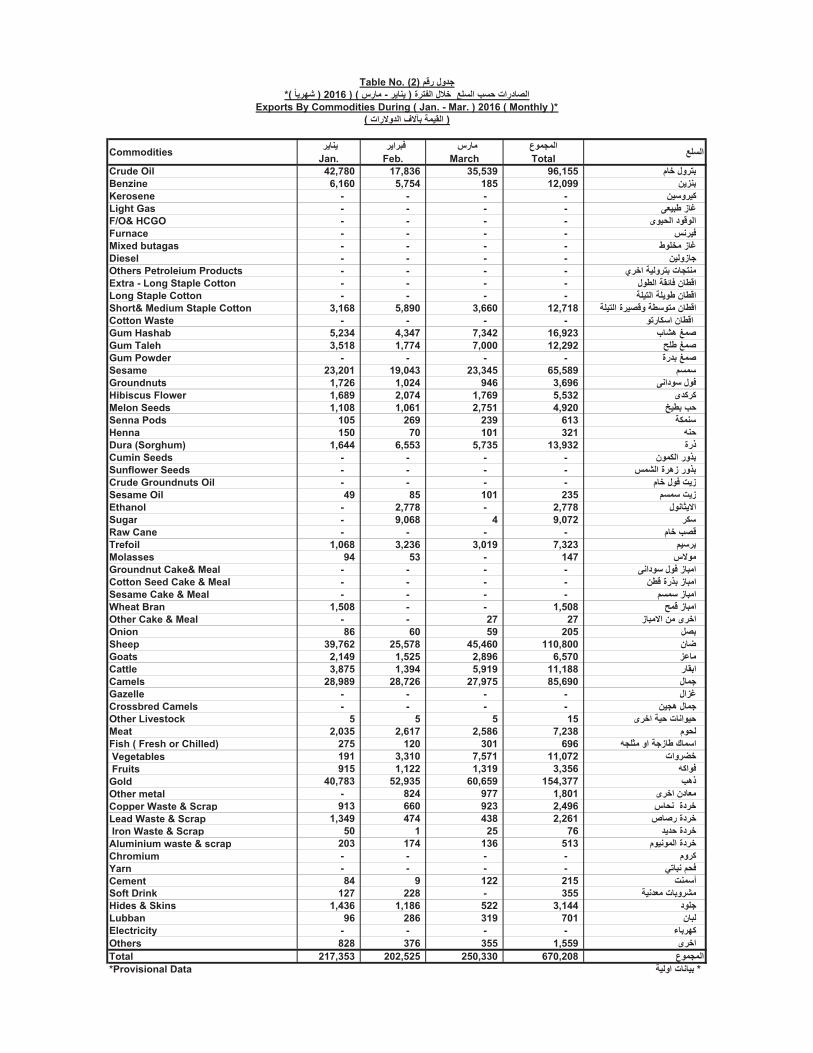
Crude Oil 42,780 17,836 35,539 96,155 #� ����Benzine 6,160 5,754 185 12,099 �����Kerosene - - - - ��/��%Light Gas - - - - :���& ��F/O& HCGO - - - - ���=�� ��>���Furnace - - - - ����Mixed butagas - - - - &�?�� ��Diesel - - - - ������Others Petroleium Products - - - - "�� ������ ����Extra - Long Staple Cotton - - - - ��&�� �!`� �&>�Long Staple Cotton - - - - �?���� �?��& �&>�Short& Medium Staple Cotton 3,168 5,890 3,660 12,718 �?���� ���>� �&/��� �&>�Cotton Waste - - - - ��%/� �&>� Gum Hashab 5,234 4,347 7,342 16,923 YwZ R��Gum Taleh 3,518 1,774 7,000 12,292 {?& R��Gum Powder - - - - ��� R��Sesame 23,201 19,043 23,345 65,589 #/�/Groundnuts 1,726 1,024 946 3,696 :����/ ���Hibiscus Flower 1,689 2,074 1,769 5,532 ��%%Melon Seeds 1,108 1,061 2,751 4,920 }�&� Y=Senna Pods 105 269 239 613 �%��/Henna 150 70 101 321 ~�=Dura (Sorghum) 1,644 6,553 5,735 13,932 �XCumin Seeds - - - - ���%�� �X�Sunflower Seeds - - - - ��w�� �Z� �X�Crude Groundnuts Oil - - - - #� ��� ��Sesame Oil 49 85 101 235 #/�/ ��Ethanol - 2,778 - 2,778 ���W���Sugar - 9,068 4 9,072 %/Raw Cane - - - - #� Y�>Trefoil 1,068 3,236 3,019 7,323 #�/�Molasses 94 53 - 147 ����Groundnut Cake& Meal - - - - :����/ ��� ����Cotton Seed Cake & Meal - - - - �&> �X� ����Sesame Cake & Meal - - - - #/�/ ����Wheat Bran 1,508 - - 1,508 {�> ����Other Cake & Meal - - 27 27 ����� �� ���Onion 86 60 59 205 ���Sheep 39,762 25,578 45,460 110,800 ��Goats 2,149 1,525 2,896 6,570 �@�Cattle 3,875 1,394 5,919 11,188 !��Camels 28,989 28,726 27,975 85,690 ���Gazelle - - - - ����Crossbred Camels - - - - ���Z ���Other Livestock 5 5 5 15 ��� ��= ����=Meat 2,035 2,617 2,586 7,238 #�=�Fish ( Fresh or Chilled) 275 120 301 696 ~�?W� �� ���& ��/� Vegetables 191 3,310 7,571 11,072 ���� Fruits 915 1,122 1,319 3,356 ~%���Gold 40,783 52,935 60,659 154,377 YZXOther metal - 824 977 1,801 ��� ����Copper Waste & Scrap 913 660 923 2,496 �=� ���Lead Waste & Scrap 1,349 474 438 2,261 _� ��� Iron Waste & Scrap 50 1 25 76 ���= ���Aluminium waste & scrap 203 174 136 513 #������� ���Chromium - - - - #�%Yarn - - - - ���� #=�Cement 84 9 122 215 ��/[Soft Drink 127 228 - 355 ������ ��w�Hides & Skins 1,436 1,186 522 3,144 ��?�Lubban 96 286 319 701 ���Electricity - - - - ���%Others 828 376 355 1,559 ���Total 217,353 202,525 250,330 670,208 \������*Provisional Data ����� ��� *
Table No. (2) #> ����*( ���w ) 2016 ) ( �� - ��� ) ����� ��� ]?/�� Y/= �����
Exports By Commodities During ( Jan. - Mar. ) 2016 ( Monthly )*( ������ ���� ���!�� )

���%��Quantity
���!��Value
Crude Oil Barrel 3,140,164 96,155 ���� #� ����Benzine M.T. 33,635 12,099 ��� �& �����Kerosene " " - - " " ��/��%Light Gas " " - - " " :���& ��F/O& HCGO " " - - " " ���=�� ��>���Furnace " " - - " " ����Mixed butagas " " - - " " &�?�� ��Diesel " " - - " " ����Others Petroleium Produts Value - - ���> "�� ������ ����Extra-Long Staple Cotton Bales - - ��� ��&�� �!`� �&>�Long Staple Cotton '' - - '' �?���� �?��& �&>�Short& Medium Staple Cotton " 10,875 12,718 '' �?���� ���>� �&/��� �&>�Cotton Waste " - - '' �&> �?��Gum Hashab M.T. 5,523 16,923 ��� �& YwZ R��Gum Taleh " " 9,211 12,292 " " {?& R��Gum Powder " " - - " " ��� R��Sesame " " 75,799 65,589 " " #/�/Groundnuts " " 4,119 3,696 " " :����/ ���Hibiscus Flower " " 4,853 5,532 " " ��%%Melon Seeds " " 8,632 4,920 " " }�&� Y=Senna Pods " " 595 613 " " �%��/Henna " " 624 321 " " ~�=Dura (Sorghum) " " 50,771 13,932 " " �XCumin Seeds " " - - " " ���%�� �X�Sunflower Seeds " " - - " " ��w�� �Z� �X�Crude Groundnuts Oil " " - - " " #� ��� ��Sesame Oil " " 159 235 " " #/�/ ��Ethanol " " 3,950 2,778 " " ���W���Sugar " " 25,013 9,072 " " %/Raw Cane " " - - " " #� Y�>Trefoil " " 34,101 7,323 " " #�/�Molasses " " 1,277 147 " " ����Groundnut Cake& Meal " " - - " " :����/ ��� ����Cotton Seed Cake & Meal " " - - " " �&> �X� ����Sesame Cake & Meal " " - - " " #/�/ ����Wheat Bran " " 8,315 1,508 " " {�> ����Other Cake & Meal " " 300 27 " " ����� �� ���Onion " " 1,653 205 " " ���Sheep Head 1,363,320 110,800 �� ��Goats " " 98,548 6,570 " " �@�Cattle " " 19,292 11,188 " " !��Camels " " 74,641 85,690 " " ���Gazelle M.T. - - ��� �& ����Crossbred Camels " " - - " " ��=Z ���Other livestock Value - 15 ���> ��� ��= ����=Meat M.T. 1,861 7,238 ��� �& #�=�Fish ( Fresh or Chilled) " " 803 696 " " ~�?W� �� ���& ��/�Vegetables " " - 11,072 " " ����Fruits " " - 3,356 " " ~%���Gold K.G. 3,994 154,377 #�� �?�% YZXOther metal - 1,801 ���> ��� ����Copper Waste & Scrap M.T. 999 2,496 ��� �& �=� ���Lead Waste & Scrap " " 1,550 2,261 " " _� ���Iron Waste & Scrap " " 58 76 " " ���= ���Aluminium waste & scrap " " 630 513 " " #������� ���Chromium " " - - " " #�%Yarn " " - - " " ���� #=�Cement " " 2,526 215 " " ��/[Soft Drink " " 740 355 " " ������ ��w�Hides & Skins Value - 3,144 ���> ��?�Lubban M.T. 662 701 ��� �& ���Electricity - - ���%Others Value - 1,559 ���> ���
Total 670,208 \������*Provisional Data ����� ��� *
( Value in US.$000'S )
UNIT
*2016 (�� - ��� )(Jan. - Mar. ) 2016 * ��=��� ]^^^^^^^^^^^^^^^^^^?/��Commodities
Table No. (3) #> ����*("��/ ]�) 2016 ( �� - ��� ) ����� ��� ]?/�� Y/= �����
Exports By Commodities During ( Jan. - Mar. ) 2016 ( Quarterly )* ( ������ ���� ���!�� )

���%��Quantity
���!��Value
���%��Quantity
���!��Value
Crude Oil Barrel 3,167,204 152,262 3,140,164 96,155 ���� #� ����Benzene M.T. 34,659 25,971 33,635 12,099 ��� �& �����Kerosene " - - - - " " ��/��%Light Gas " - - - - " " :���& ��F/O& HCGO " - - - - " " ���=�� ��>���Furnace " - - - - " " ����Mixbutagas " - - - - " " &�?�� ��Diesel '' - - - - " " ����Others Petroleium Produts Value - - - - ���> "�� ������ ����Cotton Bales 9,375 11,865 10,875 12,718 ��� �&>Gum Arabic M.T. 38,982 25,748 14,734 29,215 ��� �& :�@ R��Sesame " 114,825 166,854 75,799 65,589 " " #/�/Groundnuts " 1,595 1,400 4,119 3,696 " " :����/ ���Hibiscus Flower " 5,444 7,168 4,853 5,532 " " ��%%Melon Seeds " 17,360 9,508 8,632 4,920 " " }�&� Y=Senna Pods " 605 546 595 613 " " �%��/Henna " 3,712 2,231 624 321 " " ~�=Dura (Sorghum) " 23,652 5,971 50,771 13,932 " " �XSunflower Seeds " - - - - " " ��w�� �Z� �X�Crude Groundnuts Oil " 50 94 - - " " :����/ ��� ��Sugar " 80,600 25,449 25,013 9,072 " " %/Molasses " - - 1,277 147 " " ����Cake& Meal " 5,606 1,047 8,615 1,535 " " ����Sheep Head 1,375,718 125,382 1,363,320 110,800 �� ��Goats " 97,837 6,501 98,548 6,570 " " �@�Camels " 38,538 68,006 74,641 85,690 " " ���Other livestock M.T. - 3,895 - 11,203 ���> ��� ��= ����=Meat " 7,673 31,887 1,861 7,238 '' #�=�Vegetables& Fruits " 8,827 5,731 1,653 14,633 '' ����� ~%���Gold K.G. 7,925 307,673 3,994 154,377 #�� �?�% YZXIron & Copper Scraps M.T. 3,135 5,037 3,237 5,346 ��� �& ���Chromium " 7,200 1,435 - - '' #�%Hides & Skins Value - 9,228 - 3,144 ���> ��?�Others " - 26,952 - 15,663 '' ���Total 1,027,841 670,208 \������* Provisional Data ����� ��� * ** Adjusted data ����� ��� **
Commodities Unit
2015 (�� - ��� )****(Jan. - Mar. ) 2015
2016 (�� - ��� )**(Jan. -Mar. ) 2016
��=��� ]^^^^^^^^^^^^^^^^^^?/��
Table No. (4) #> ���� * 2016 - 2015 ( �� - ��� ) ����� ��� ]?/�� Y/= �����
Exports By Commodities During ( Jan. - Mar. ) 2015 - 2016 *( ������ ���� ���!�� )
( Value in US.$000'S )
���Jan.
����Feb.
��March
\������Total
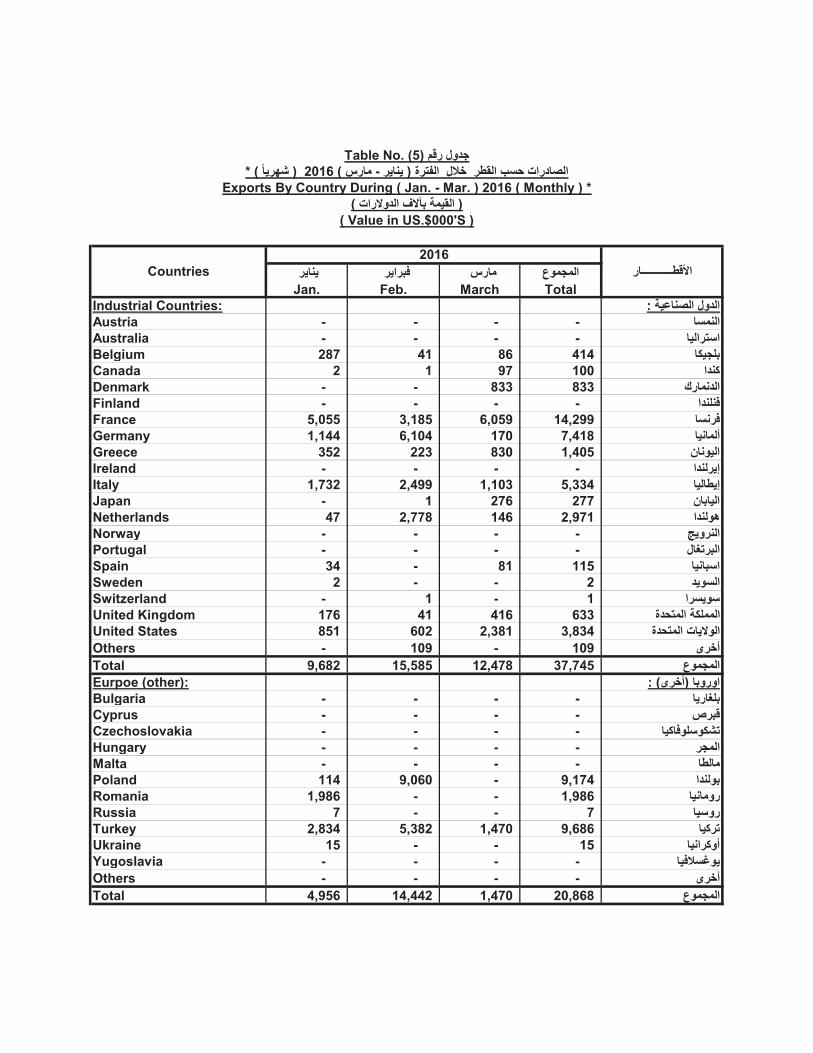
Industrial Countries: : ��@���� �����Austria - - - - /����Australia - - - - ����/�Belgium 287 41 86 414 %��?�Canada 2 1 97 100 ���%Denmark - - 833 833 ������Finland - - - - ���?��France 5,055 3,185 6,059 14,299 /��Germany 1,144 6,104 170 7,418 ����[Greece 352 223 830 1,405 ������Ireland - - - - ������Italy 1,732 2,499 1,103 5,334 ��&��
Countries2016
^^^^^^^^^^^^&>��
Table No. (5) #> ����* ( ���w ) 2016 ( �� - ��� ) ����� ��� &!�� Y/= �����
Exports By Country During ( Jan. - Mar. ) 2016 ( Monthly ) *( ������ ���� ���!�� )
( Value in US.$000'S )
Japan - 1 276 277 �����Netherlands 47 2,778 146 2,971 �����ZNorway - - - - ������Portugal - - - - ������Spain 34 - 81 115 ���/�Sweden 2 - - 2 ���/��Switzerland - 1 - 1 �/��/United Kingdom 176 41 416 633 ��=���� �%?����United States 851 602 2,381 3,834 ��=���� �����Others - 109 - 109 ��[Total 9,682 15,585 12,478 37,745 \������Eurpoe (other): : (��[) ����Bulgaria - - - - ��?�Cyprus - - - - _�>Czechoslovakia - - - - �%��?/�%w�Hungary - - - - ����Malta - - - - &��Poland 114 9,060 - 9,174 ������Romania 1,986 - - 1,986 ����Russia 7 - - 7 �/�Turkey 2,834 5,382 1,470 9,686 �%�Ukraine 15 - - 15 ���%�[Yugoslavia - - - - ���/���Others - - - - ��[Total 4,956 14,442 1,470 20,868 \������

Table No. (5) Cont'd (5) #> ���� ]��
���Jan.
����Feb.
��March
\������Total
Africa: : �!���COMESA Countries: 45,418 46,061 52,112 143,591 /���%�� ���Burundi - - - - "����Comoros - - - - �!�� ��Djibouti - - - - ������Egypt 37,195 35,300 50,472 122,967 ��Eritrea 1,207 4,260 1,455 6,922 ����Ethiopia 6,895 6,242 185 13,322 ����W�Kenya 42 - - 42 ���%Libya 79 252 - 331 ����Madagascar - - - - !w���Malawi - 7 - 7 ����
Countries2016
^^^^^^^^^^^^&>��
a a ��Mauritius - - - - _w���Rwanda - - - - �����Seychelles - - - - �w�/Swaziland - - - - �������/Uganda - - - - ������Congo Democratic - - - - ��&�!����� ���%��Zambia - - - - �����Zimbabwe - - - - ������Other African Countries: 9,161 3,703 1,076 13,940 ��� ��!��� ���Algeria 554 277 179 1,010 `�����Morocco 3,469 1,891 - 5,360 Y����Nigeria - 50 83 133 �����Somalia - - - - ������Tunisia 1,337 1,478 814 3,629 ����South Sudan 28 - - 28 ����/�� Y���Angola - - - - ����[Congo brazzaville - - - - ������� ���%��Namibia - - - - �����Others 3,773 7 - 3,780 ��[Total 54,579 49,764 53,188 157,531 \������

Table No. (5) Cont'd (5) #> ���� ]��
���Jan.
����Feb.
��March
\������Total
Asia: : �/�Bangladesh - - - - �������China 46,847 22,533 45,174 114,554 �����Hong Kong 4 - 1 5 ���% ���ZIndia 876 1,998 1,338 4,212 �����Indonesia 473 60 - 533 �/������Malaysia - 106 2 108 �����Pakistan - - - - ��/%�South Korea 2 - 29 31 �������� ��%Singapore - - - - �����/Taiwan 16 1,360 1 1,377 �����Thailand - 158 14 172 �����Others 69 106 18 193 ��[Total 48,287 26,321 46,577 121,185 \������
Countries2016
^^^^^^^^^^^^&>��
, , , , \Arab Countries :������ �����Bahrain 16 10 12 38 ��=���Iraq 27 16 25 68 �����Jordan 2,195 3,603 2,079 7,877 ����Kuwait 335 180 260 775 ��%��Lebanon 2,674 1,530 1,336 5,540 ����Oman 263 151 95 509 ��@Qatar 578 766 263 1,607 &>Saudi Arabia 50,944 34,344 60,638 145,926 �����/��Syria 586 1,469 573 2,628 ��/United Arab Emirates 38,943 51,555 68,882 159,380 ��=���� ������ ����Yemen 921 996 188 2,105 �����Others - - - - ��[Total 97,482 94,620 134,351 326,453 \������Western Hemisphere: : ����� �%�� ���Brazil 22 34 91 147 �������Mexico 803 937 493 2,233 ��/%���Others 34 822 - 856 ��[Total 859 1,793 584 3,236 \������Other Countries 1,508 - 1,682 3,190 ��[ &>[Grand Total 217,353 202,525 250,330 670,208 �?%�� \������*Provisional Data ����� ��� *

Cou
ntrie
s
��
����
~���
�� �
Pet
oleu
m&
Pet
role
umPr
oduc
ts
�&>
Cot
ton
:�@
R��
Ara
bic
Gum
#/�/
Sesa
me
:����
/ ��
�G
roun
d N
uts
����
Cak
e &
Mea
lYZ
XG
old
��=
����
=Li
vest
ock
#�=�
Mea
t
��?�
Hid
es &
Skin
s
���
othe
r\�
�����
Tota
l^
^^^^^^^^
^^^&>�
�
Indu
stria
l Cou
ntrie
s:-:�
�@��
�� ��
���A
ustr
ia-
-
-
-
-
-
-
-
-
-
-
-
/���
�A
ustr
alia
-
-
-
-
-
-
-
-
-
-
-
-
��
��/�
Bel
gium
-
-
16
0
-
-
-
-
-
-
-
25
4
414
%��?
�C
anad
a-
-
97
-
-
-
-
-
-
-
3
10
0
���
%D
enm
ark
-
-
83
3
-
-
-
-
-
-
-
-
83
3
�
�����
Finl
and
-
-
-
-
-
-
-
-
-
-
-
-
���
?�Fr
ance
-
-
14
,203
-
-
-
-
-
-
-
96
14,2
99
/
��
Ger
man
y-
-
2,07
1
-
-
-
4,
867
-
-
-
48
0
7,41
8
����
�G
reec
e-
-
136
1,
269
-
-
-
-
-
-
-
1,
405
�
�����
Irela
nd-
-
-
-
-
-
-
-
-
-
-
-
�����
�Ita
ly-
-
2,64
2
-
-
-
-
-
-
26
5
2,
427
5,33
4
��&
��Ja
pan
-
-
27
6
-
-
-
-
1
-
-
-
277
���
��N
ethe
rland
s-
-
65
81
-
-
-
-
-
-
2,82
5
2,
971
���
��ZN
orw
ay-
-
-
-
-
-
-
-
-
-
-
-
���
���Po
rtug
al-
-
-
-
-
-
-
-
-
-
-
-
���
���Sp
ain
-
-
-
81
-
-
-
-
-
34
-
11
5
��
�/�
Swed
en-
-
-
-
-
-
-
1
-
-
1
2
���
/��
Switz
erla
nd-
-
-
-
-
-
-
-
-
-
1
1
�/��
/U
nite
d K
ingd
om-
-
576
-
-
-
-
1
-
-
56
63
3
��
=����
�%?�
���U
nite
d St
ates
-
-
3,
819
-
-
-
-
-
-
-
15
3,
834
��
=����
��
���O
ther
-
-
-
-
-
-
-
109
-
-
-
10
9
�
��To
tal
-
-
24
,878
1,43
1
-
-
4,86
7
112
-
299
6,
158
37,7
45
\���
���Eu
rope
(oth
er):
: (�
�[)
���
�B
ulga
ria-
-
-
-
-
-
-
-
-
-
-
-
��?
�C
ypru
s-
-
-
-
-
-
-
-
-
-
-
-
_�
>C
zech
oslo
vaki
a-
-
-
-
-
-
-
-
-
-
-
-
�%��
?/�%
�w�
Hun
gary
-
-
-
-
-
-
-
-
-
-
-
-
�
���M
alta
-
-
-
-
-
-
-
-
-
-
-
-
&
��Po
land
-
-
-
11
4
-
-
-
-
-
-
9,
060
9,17
4
������
Rom
ania
-
-
-
-
-
-
-
-
-
-
1,98
6
1,
986
��
��
Rus
sia
-
-
-
-
-
-
-
-
-
-
7
7
�/
�Tu
rkey
-
5,
286
89
2,
158
52
4
-
892
-
-
46
1
27
6
9,68
6
�%�
Ukr
aine
-
-
-
-
-
-
-
-
-
-
15
15
��
�%��
Yugo
slav
ia-
-
-
-
-
-
-
-
-
-
-
-
���/
���
Oth
ers
-
-
-
-
-
-
-
-
-
-
-
-
�
��To
tal
-
5,
286
89
2,
272
52
4
-
892
-
-
461
11
,344
20,8
68
\���
���
Expo
rts
By
Cou
ntry
& C
omm
oditi
es D
urin
g ( J
an. -
Mar
. ) 2
016
*(
����
�� �
��� �
��!��)
(VA
LUE
IN U
S.$0
00'S
)
Tabl
e N
o. (6
)#>
���
�*(
� ��w
) 20
16(�
�-
���
)��
��� �
�� �
�?/���
&!
�� Y/
= �
��
��

Tabl
e N
o. (6
) Con
t'd(6
) #>
���
� ]�
�
Cou
ntrie
s
��
����
~���
�� �
Pet
oleu
m&
Pet
role
umPr
oduc
ts
�&>
Cot
ton
:�@
R��
Ara
bic
Gum
#/�/
Sesa
me
:����
/ ��
�G
roun
d N
uts
����
Cak
e &
Mea
lYZ
XG
old
��=
����
=Li
vest
ock
#�=�
Mea
t
��?�
Hid
es &
Skin
s
���
othe
r\�
�����
Tota
l^
^^^^^^^^
^^^&>�
�
Afr
ica:
: �!�
��
CO
MES
A C
ount
ries:
12,0
99
5,
141
1,47
6
16
,604
46
2
-
-
87,2
77
4,
781
43
7
15,3
14
14
3,59
1
/
���%��
���
Bur
undi
-
-
-
-
-
-
-
-
-
-
-
-
��
���
Com
oros
-
-
-
-
-
-
-
-
-
-
-
-
�
!��
��D
jibou
ti-
-
-
-
-
-
-
-
-
-
-
-
:���
��Eg
ypt
-
5,
021
298
16
,374
462
-
-
87,2
77
4,
781
160
8,59
4
12
2,96
7
��
Eritr
ea-
-
1,17
1
-
-
-
-
-
-
-
5,75
1
6,
922
�
���
Ethi
opia
12,0
99
12
0
-
-
-
-
-
-
-
277
826
13
,322
����
W�K
enya
-
-
-
-
-
-
-
-
-
-
42
42
��
�%Li
bya
-
-
-
23
0
-
-
-
-
-
-
10
1
331
����
Mad
agas
car
-
-
-
-
-
-
-
-
-
-
-
-
!
w���
Mal
awi
-
-
7
-
-
-
-
-
-
-
-
7
��
��M
aurit
ius
-
-
-
-
-
-
-
-
-
-
-
-
_
w��
�R
wan
da-
-
-
-
-
-
-
-
-
-
-
-
�����
Seyc
helle
s-
-
-
-
-
-
-
-
-
-
-
-
�w�/
Swaz
iland
-
-
-
-
-
-
-
-
-
-
-
-
���
����/
Uga
nda
-
-
-
-
-
-
-
-
-
-
-
-
���
���
Con
go D
emoc
ratic
-
-
-
-
-
-
-
-
-
-
-
-
��&
�!���
�� ��
�%��
Zam
bia
-
-
-
-
-
-
-
-
-
-
-
-
��
���Zi
mba
bwe
-
-
-
-
-
-
-
-
-
-
-
-
"�
����
Oth
er A
fric
an C
ount
ries:
-
-
-
8,39
6
16
-
5,
360
28
-
13
3
7
13,9
40
���
��!�
�� �
��A
lger
ia-
-
-
1,01
0
-
-
-
-
-
-
-
1,01
0
`���
��M
oroc
co-
-
-
-
-
-
5,36
0
-
-
-
-
5,36
0
Y��
��N
iger
ia-
-
-
-
-
-
-
-
-
133
-
133
���
��So
mal
ia-
-
-
-
-
-
-
-
-
-
-
-
����
��Tu
nisi
a-
-
-
3,61
3
16
-
-
-
-
-
-
3,62
9
���
�So
uth
Suda
n-
-
-
-
-
-
-
28
-
-
-
28
��
��/�
� Y��
�A
ngol
a-
-
-
-
-
-
-
-
-
-
-
-
����
[C
ongo
bra
zzav
ille
-
-
-
-
-
-
-
-
-
-
-
-
��
�����
���%
��N
amib
ia-
-
-
-
-
-
-
-
-
-
-
-
����
�O
ther
-
-
-
3,77
3
-
-
-
-
-
-
7
3,78
0
���
Tota
l12
,099
5,14
1
1,
476
25,0
00
478
-
5,
360
87
,305
4,78
1
570
15
,321
157,
531
\���
���

Tabl
e N
o. (6
) Con
t'd(6
) #>
���
� ]�
�
Cou
ntrie
s
��
����
~���
�� �
Pet
oleu
m&
Pet
role
umPr
oduc
ts
�&>
Cot
ton
:�@
R��
Ara
bic
Gum
#/�/
Sesa
me
:����
/ ��
�G
roun
d N
uts
����
Cak
e &
Mea
lYZ
XG
old
��=
����
=Li
vest
ock
#�=�
Mea
t
��?�
Hid
es &
Skin
s
���
othe
r\�
�����
Tota
l^
^^^^^^^^
^^^&>�
�
ASI
A:
-:�/
�B
angl
ades
h-
-
-
-
-
-
-
-
-
-
-
-
����
���C
hina
96,1
55
2,
291
169
13
,345
-
-
-
-
-
87
2,
507
114,
554
��
���
Hon
g K
ong
-
-
-
-
-
-
-
1
-
-
4
5
���%
���
ZIn
dia
-
-
1,
698
294
82
-
-
-
-
49
9
1,
639
4,21
2
�����
Indo
nesi
a-
-
-
-
53
3
-
-
-
-
-
-
53
3
�/
������
Mal
aysi
a-
-
48
-
60
-
-
-
-
-
-
108
����
�Pa
kist
an-
-
-
-
-
-
-
-
-
-
-
-
��/
%�So
uth
Kor
ea-
-
29
-
-
-
-
-
-
-
2
31
�����
���
��%
Sing
apor
e-
-
-
-
-
-
-
-
-
-
-
-
���
��/
Taiw
an-
-
-
-
-
-
-
5
-
-
1,37
2
1,
377
��
���
Thai
land
-
-
17
1
-
-
-
-
1
-
-
-
172
�����
Oth
ers
-
-
-
118
-
-
-
1
-
-
74
193
���
TOTA
L96
,155
2,29
1
2,
115
13,7
57
675
-
-
8
-
586
5,
598
121,
185
\���
���A
rab
Cou
ntrie
s:�
�����
���
��B
ahra
in-
-
12
-
-
-
-
1
-
-
25
38
��=
���Ira
q-
-
41
-
-
-
-
-
-
-
27
68
��
���
Jord
an-
-
15
4,
763
1,
203
-
-
-
-
-
1,
896
7,87
7
���
�K
uwai
t-
-
25
52
4
-
-
-
1
146
-
79
775
��%
��Le
bano
n-
-
-
5,51
9
-
-
-
-
-
-
21
5,54
0
����
Om
an-
-
-
224
29
-
-
-
13
-
243
50
9
�
�@Q
atar
-
-
-
-
209
27
-
-
97
8
-
39
3
1,60
7
&>
Saud
i Ara
bia
-
-
18
6
8,53
5
-
-
-
125,
754
51
7
1,16
6
9,76
8
14
5,92
6
�����
/��
Syria
-
-
-
1,
979
54
0
-
-
1
-
62
46
2,
628
�
�/U
nite
d A
rab
Emira
tes
-
-
37
8
692
-
-
14
3,25
8
1,08
1
80
3
-
13
,168
15
9,38
0
��=�
��� �
�����
�
���
Yem
en-
-
-
787
38
-
-
-
-
-
1,28
0
2,
105
��
���O
ther
-
-
-
-
-
-
-
-
-
-
-
-
�
��To
tal
-
-
65
7
23,0
23
2,01
9
27
14
3,25
8
12
6,83
8
2,45
7
1,22
8
26
,946
326,
453
\���
���W
este
rn H
emis
pher
e:-::
����
�%��
��
�B
razi
l-
-
-
-
-
-
-
-
-
-
14
7
147
����
���M
exic
o-
-
-
-
-
-
-
-
-
-
2,
233
2,23
3
��/%
���O
ther
-
-
-
106
-
-
-
-
-
-
750
85
6
�
��To
tal
-
-
-
106
-
-
-
-
-
-
3,13
0
3,
236
\�
�����
Oth
er C
ount
ries
-
-
-
-
-
1,
508
-
-
-
-
1,
682
3,19
0
-:��
� &
>�G
rand
Tot
al10
8,25
4
12,7
18
29,2
15
65
,589
3,
696
1,
535
15
4,37
7
21
4,26
3
7,23
8
3,14
4
70
,179
670,
208
:?%��
\��
����
*Pro
visi
onal
Dat
a���
��
���*

القسم الثاني
الــــــــــــواردات
Second Section
IMPORTS

Commodity Unit ���%��Quantity
���!��Value
��=��� ]^^^^^^^^^^^^^^?/��
Wheat & Wheat Flour M.T 470,514 188,939 ��� �& {�> ��>�� {�>
Sugar '' 122,588 47,448 '' " %/
Dairy Products '' 5,507 14,600 '' " ����� ����
Vegetables & Veget. Products '' 37,228 26,958 '' " ������� ����
Other Foodsutfs Value - 85,584 ���> ��[ ��`�X� ����
Animal & Vegetable Oils M.T 38,021 34,005 ��� �& ������ ������= ���
Beverages & Tobacco '' - 15,584 '' " R����� ��w���
Petroleum Products '' 368,409 128,317 '' " ������ ����
Other Raw Materials '' 40,265 58,315 '' " ��[ #� ����
Medicines Value - 89,877 ���> �����
Other Chemical Products '' - 131,330 '' " ��[ �����% ����
Manufactured Goods '' - 399,219 '' " ����� ]?/
Machinery and Equipments '' - 412,501 '' " ����� ��
Transport Equipments '' - 195,328 '' " �!� �`/�
Textiles '' - 79,083 '' " ��/��
Others '' - 924 '' " ��[
Total 1,908,012 :?%�� \������
*Provisional Data ����� ��� *
TABLE NO. (1) #> ����
Summary Of Imports By Commodity During (Jan. - Mar.) 2016*
*2016 ( �� - ���) ����� ��� ������ _�?�
( ������ ���� ���!��)
(Value In US.$000'S)

189
399
413
195
200
250
300
350
400
450
��
����
��� �
����
���
- �
�20
16To
tal�I
mpo
rts�D
urin
g�Ja
n.��
Mar
.�201
6Va
lue�
in�U
S$�M
illio
n
189
1527
8647
34
128
5890
131
17
79
-50
100
150
200

Commodity ���Jan.
����Feb.
��March
\������Total ]?^^^^^^^^^^^^^^^/��
Foodstuffs: -:��`�X� ����
Wheat 11,109 54,324 29,485 94,918 {�>
Wheat Flour 30,456 27,807 35,758 94,021 {�> ��>�
Sugar 4,895 18,893 23,660 47,448 %/
Tea 3,286 2,962 2,603 8,851 �w
Coffee 3,986 4,799 5,978 14,763 ��
Dairy Products 5,696 4,643 4,261 14,600 ����� ����
Fish & Canned Fish 519 520 292 1,331 ��/�� �?��� ��/[
Meat & Meat Products - 114 31 145 ������� #�=�
Fruits & Fruit Products 4,228 2,492 2,006 8,726 ������� ~%���
Vegetables & Veget. Products 8,365 8,772 9,821 26,958 ������� ����
Confectionery, Sweets, & Buiscuits 2,033 1,749 2,413 6,195 ��%/�� ��?=
Lentils 3,491 1,000 1 4,492 ��@
Animal & Vegetable Oils 3,976 14,043 15,986 34,005 ������ ������= ���
Spices 1,513 919 747 3,179 ���
Rice 2,645 2,624 2,397 7,666 �[
Others 7,975 15,018 7,243 30,236 ��[
Total 94,173 160,679 142,682 397,534 \������
Beverages & Tobacco: -:R����� ��w���
Soft Drinks 527 2,319 2,172 5,018 ������ ��w�
Cigarettes 57 7 - 64 `�/
Tobacco 2,486 1,545 6,471 10,502 R��
Other - ��[
Total 3,070 3,871 8,643 15,584 \������
Imports By Commodity During (Jan. - Mar.) 2016 (MONTHLY)*
( ������ ���� ���!��)
(Value In US.$000'S)
Table No.(2) #> ����
*( ���w ) 2016 (�� - ���) ����� ��� ]?/�� Y/= ������

Table No. (2) Cont'd (2) #> ���� ]��
Commodity ���Jan.
����Feb.
��March
\������Total ]?^^^^^^^^^^^^^^^/��
Raw Materials: -:#� ����
Petroleum Products 29,166 41,182 57,969 128,317 :������ ����
Jazolin 11,313 24,285 46,678 82,276 �������
BENZINE - ���
ASPHALT 596 541 3 1,140 �� ��
BUTAGAS 11,548 7,303 4,525 23,376 �������
LUBRICATING OIL 5,027 8,807 6,631 20,465 ����� ����
OTHERS 682 246 132 1,060 ����
Crude Plastic 15,815 17,081 18,555 51,451 ���/���� #�
Crude Rubber 117 93 110 320 &&��� #�
Tallow 922 2,100 1,131 4,153 #�=w
Seeds for Sowing 677 600 1,078 2,355 ��!�� �X�
Packing Paper - - ��?�� ��
Other 2 9 25 36 ��[
Total 46,699 61,065 78,868 186,632 \������
Chemicals: -:�����% ����
Medicines 27,814 26,682 35,381 89,877 ����[
Chemical Products 9,844 10,184 13,668 33,696 ���%�� �����% ��@
Fertilizers 12,228 21,958 8,549 42,735 ���/[
Tanning & Dying Materials 7,000 4,603 7,300 18,903 ���?���� ������� ����?� ����
Perfumes & Cosmetics 7,168 6,866 7,408 21,442 ����� ��=�/�� �&@
Explosives 283 1,207 459 1,949 �>��
Insecticides - - 29 29 ��w= �����
Other 4,304 3,670 4,602 12,576 ��[
Total 68,641 75,170 77,396 221,207 \������
Manufactured Goods: -: @����
Medical & Pharmacetical Equipments 6,387 7,659 7,804 21,850 ������� ���& ����
Leather Products 697 1,187 996 2,880 ��?��� @����
Manufactured Rubber 1,078 1,326 1,314 3,718 &&��� @����
Manufactured Plastics 14,285 13,297 15,450 43,032 ���/���� @����
Manufactured Wood & Cork 4,349 4,741 5,318 14,408 ��?�� Yw� @����
Glass & Glassware 7,318 5,936 6,409 19,663 ����� @����
Iron & Steel 21,920 61,489 53,539 136,948 Y?�� ���=
Manufactured Metals 9,357 10,086 9,830 29,273 ������ @����
Footwear 5,935 6,472 5,570 17,977 ��X=[
Jute & Sacks 4,373 3,714 5,694 13,781 ����� ���
Books, Magazines, and Newspapers 1,122 3,275 2,885 7,282 �`��� ���� Y�%
Cement & stony products 1,579 2,067 3,954 7,600 ���= ����� ��/[
Scientific Equipments 3,848 7,027 14,067 24,942 ���?@ ����[
Paper Products 7,580 11,053 9,390 28,023 ���� @����
Ceramic Products 4,389 3,921 4,043 12,353 ����� @����
Toys & Sport Goods 439 415 626 1,480 ���� ���[� ��&� Y��
Other 5,064 3,875 5,070 14,009 ��[
Total 99,720 147,540 151,959 399,219 \������

Table No. (2) Cont'd (2) #> ���� ]��
Commodity ���Jan.
����Feb.
��March
\������Total ]?^^^^^^^^^^^^^^^/��
Machinery & Equipments: -: ����� ��
Non-Electrical Appliances 29,118 39,911 32,289 101,318 ��`��% �� ��
Electrical Appliances 15,247 16,611 38,675 70,533 ��`��% ��
Refrigerators 3,162 2,324 4,685 10,171 ��W
Air Conditioners 2,546 1,463 1,218 5,227 ���Z ��%�
Machiery Spare Parts 34,643 48,652 25,951 109,246 �� �� ]&>
T.V., Radios , Recorders,Tapes, etc. 5,528 5,275 7,206 18,009 �&w�� Z����� �����?����� ������ ��/��
Dry Batteries 312 518 859 1,689 ~�� �&�
Accumulators 2,009 2,756 3,704 8,469 �&�
Tractors 7,150 12,396 21,484 41,030 ���
Ovens 426 616 293 1,335 ���[
Other 13,754 8,344 23,376 45,474 ��[
Total 113,895 138,866 159,740 412,501 \������
Transport Equipments: -:�!� �`/�
Railway Locomotves - - - �&>
Railway Wagons 48 34 120 202 �&> �@
Motor Cars 9,340 16,723 23,059 49,122 ������ �@
Trucks & Lorries 17,466 13,983 35,598 67,047 ���� � �=w
Busses - 2,967 120 3,087 ��
Tyres & Tubes 7,095 6,478 11,204 24,777 �&�� Y���[
Autos Spare Parts 9,451 13,940 13,537 36,928 �@ �� ]&>
Motor-Cycles 607 701 885 2,193 ���� ���
Bicycles 299 507 323 1,129 ���
Aircrafts - - - - �`&
Aircrafts Spare Parts 1,568 2,915 2,691 7,174 �`& �� ]&>
Locomotive Spare Parts 193 1,404 1,852 3,449 �&> �� ]&>
Ferries & Steamers 188 27 5 220 ����� ���� Y%��
Other - - ��[
Total 46,255 59,679 89,394 195,328 \������
Textiles -: ��/��
Yarn 373 570 759 1,702 ���
Sewing Threads 188 287 192 667 ~%�= &���
Woven Synthetic Fabrics 5,534 5,893 8,176 19,603 :@�� �= �� �w�>[
Woven Cotton Fabrics - 22 52 74 �&> �� �w�>[
Woven Flax. Fabrics 3 20 16 39 ��% �� �w�>[
Man-Made Filaments& Staple 4 74 1 79 ����%� ���w �� ��/��
Wadding Of Textile Materials 504 381 678 1,563 ����/� ���� �� �w=
Carpets 347 376 507 1,230 ��/
Special Woven Fabrics 1,661 1,814 4,108 7,583 ��� ��� ��/��
Knitted Or Crocheted Fabrics - 7 7 ����� �w�>[
Ready Made Clothes 12,897 17,467 16,076 46,440 ��Z� /��?�
Other 13 24 59 96 ��[
Total 21,524 26,935 30,624 79,083 \������
Other 462 428 34 924 ��[
Grand Total 494,439 674,233 739,340 1,908,012 :?%�� \������*Provisional Data ����� ��� *

���%��Qty.
���!��Value
Foodstuffs: -:��`�X� ����
Wheat M.T 273,137 94,918 ��� �& {�>
Wheat Flour '' 197,377 94,021 '' {�> ��>�
Sugar '' 122,588 47,448 '' %/
Tea '' 5,185 8,851 '' �w
Coffee '' 12,374 14,763 '' ��
Dairy Products '' 5,507 14,600 '' ����� ����
Fish & Canned Fish '' 714 1,331 '' ��/�� �?��� ��/[
Meat & Meat Products '' 46 145 '' ������� #�=�
Fruits & Fruit Products '' 15,087 8,726 '' ������� ~%���
Vegetables & Vegetables Products '' 37,228 26,958 '' ������� ����
Confectionery, Sweets& Biscuits '' 6,514 6,195 '' ��%/�� ��?=
Lentils '' 4,413 4,492 '' ��@
Animal & Vegetables Oils '' 38,021 34,005 '' ������ ������= ���
Spices '' 2,189 3,179 '' ���
Rice '' 14,864 7,666 '' �[
Other VALUE - 30,236 ���> ��[
Total 397,534 \������
Beverages & Tobacco: -:R����� ��w���
Soft Drinks VALUE - 5,018 ���> ������ ��w�
Cigarettes '' - 64 '' `�/
Tobacco '' - 10,502 '' R��
Other '' - - '' ��[
Total 15,584 \������
( ������ ���� ���!��)
�� - ���Jan. - MarchCommodity Unit ��=���
Table No.(3)#> ����
*2016 (�� - ���) ����� ��� ( ���/ ]� ) ]?/�� Y/= ������
Imports By Commodity (Quarterly) During (Jan.- Mar.) 2016*
(Value In US.$000'S)
]?^^^^^^^^^^^^^^^/��

Table No.(3) Cont'd (3)#> ���� ]��
���%��Qty.
���!��Value
Raw Materials: -:#� ����
Petroleum Products M.T 368,409 128,317 ��� �& ������ ����
Raw Plastic '' 40,265 51,451 '' ���/���� #�
Raw Rubber '' 236 320 '' &&��� #�
Tallow '' 3,397 4,153 '' #�=w
Seeds For Sowing '' 174 2,355 '' ��!�� �X�
Packing Paper '' - - '' ��?�� ��
Other VALUE - 36 ���> ��[
Total 186,632 \������
Chemicals: -:�����% ����
Medicines VALUE - 89,877 ���> ����[
Chemical Products '' - 33,696 '' ���%�� �����% ��@
Fertilizers M.T 109,964 42,735 ��� �& ���/[
Tanning & Dyeing Materials '' 9,856 18,903 '' ���?���� ������� ����?� ����
Perfumes & Cosmetics '' 9,974 21,442 '' ����� ��=�/�� �&@
Explosives '' 2,620 1,949 '' �>��
Insecticides '' - 29 '' ��w= �����
Other VALUE - 12,576 ���> ��[
Total 221,207 \������
Manufactured Goods: -: @����
Medical&Pharmaceutical Equipments VALUE - 21,850 ���> ������� ���& ����
Leather Products M.T 1,826 2,880 ��� �& ��?��� @����
Manufactured Rubber '' 1,286 3,718 '' &&��� @����
Manufactured Plastics '' 18,987 43,032 '' ���/���� @����
Manufactured Wood & Cork '' 29,285 14,408 '' ��?�� Yw� @����
Glass & Glassware '' 23,680 19,663 '' ����� @����
Iron & Steel '' 215,583 136,948 '' Y?�� ���=
Manufactured Metal '' 26,213 29,273 '' ������ @����
Footwear VALUE - 17,977 ���> ��X=[
Jute & Sacks NO. 7,766 13,781 ��@ ����� ���
Books,Magazines and Newspapers M.T 2,320 7,282 ��� �& �`��� ���� Y�%
Cement & stony products '' 34,033 7,600 '' ���= ����� ��/[
Scientific Equipments VALUE - 24,942 ���> ���?@ ����[
Paper Products M.T 28,790 28,023 ��� �& ���� @����
Ceramic Products '' 23,186 12,353 '' ����� @����
Toys & Sport Goods VALUE - 1,480 ���> ���� ����� ��&� Y��
Other '' - 14,009 '' ��[
Total 399,219 \������
�� - ���Jan. - March ]?^^^^^^^^^^^^^^^/��Commodity Unit ��=���

Table No.(3) Cont'd (3)#> ���� ]��
���%��Qty.
���!��Value
Machinery & Equipments: -: ����� ��Non-Electrical Appliances M.T 25,586 101,318 ��� �& ��`��% �� ��Electrical Appliances VALUE - 70,533 ���> ��`��% ��Refrigerators NO. 2,725 10,171 ��@ ��WAir Conditioners '' 802 5,227 '' ���Z ��%�Machinery Spare Parts VALUE - 109,246 ���> �� �� ]&>
T.V., Radios, Recorders & Tapes, etc. '' - 18,009 '' Z����� �����?����� ������ ��/�� �&w��
Dry Batteries NO. 694 1,689 ��@ ~�� �&�Accumulators '' 2,661 8,469 '' �&�Tractors '' 3,866 41,030 '' ���Ovens '' 490 1,335 '' ���[Other VALUE - 45,474 ���> ��[Total 412,501 \������Transport Equipments: -:�!� �`/�Railway Locomotives NO. - - ��@ �&>Railway Wagons '' 203 202 '' �&> �@Motor Cars '' 4,228 49,122 '' ������ �@Trucks & Lorries '' 9,073 67,047 '' ���� � �=wBuses '' 306 3,087 '' ��Tyres & Tubes '' 11,358 24,777 '' �&�� Y���[Auto Spare Parts VALUE - 36,928 ���> �@ �� ]&>Motor-Cycles NO. 440 2,193 ��@ ���� ���Bicycles '' 362 1,129 '' ���Aircrafts '' - - '' �`&Aircraft Spare Parts VALUE - 7,174 ���> �`& �� ]&>Locomotive Spare Parts '' - 3,449 '' �&> �� ]&>Ferries & Steamers NO. 471 220 ��@ ����� ���� Y%��Other VALUE - - ���> ��[Total 195,328 \������Textiles -: ��/��Yarn M.T 1,354 1,702 ��� �& ��� Sewing Threads '' 202 667 '' ~%�= &���Woven Synthetic Fabrics '' 4,967 19,603 '' :@�� �= �� �w�>[Woven Cotton Fabrics '' 38 74 '' �&> �� �w�>[Woven Flax Fabrics '' 44 39 '' ��% �� �w�>[Man - Made Filament & Staple '' 24 79 '' ����%� ���w �� ��/��Wadding Of Textile Materials '' 822 1,563 '' ����/� ���� �� �w=Carpets VALUE - 1,230 ���> ��/Special Woven Fabrics M.T 1,588 7,583 ��� �& ��� ��� ��/��Knitted Or Crocheted Fabrics '' 2 7 '' ���� �w�>[Ready Made Clothes VALUE - 46,440 ���> ��Z� /��?�Other '' - 96 '' ��[Total - 79,083 \������Other '' - 924 '' ��[Grand Total - 1,908,012 :?%�� \������*Provisional Data ����� ��� *
Commodity ]?^^^^^^^^^^^^^^^/��Unit ��=���
�� - ���Jan. - March

���%��Qty.
���!��Value
���%��Qty.
���!��Value
Foodstuffs: -:��`�X� ����
Wheat M.T 340,509 124,531 273,137 94,918 ��� �& {�>
Wheat Flour '' 18,793 9,870 197,377 94,021 '' {�> ��>�
Sugar '' 303,986 127,373 122,588 47,448 '' %/
Tea '' 6,050 10,011 5,185 8,851 '' �w
Coffee '' 8,253 9,978 12,374 14,763 '' ��
Dairy Products '' 5,626 14,765 5,507 14,600 '' ����� ����
Fish & Canned Fish '' 874 957 714 1,331 '' ��/�� �?��� ��/[
Meat & Meat Products '' 22 92 46 145 '' ������� #�=�
Fruits & Fruit Products '' 21,441 6,944 15,087 8,726 '' ������� ~%���
Vegetable & Vegetables Products '' 28,649 20,545 37,228 26,958 '' ������� ����
Confectionery, Sweets & Buiscuits '' 7,352 6,436 6,514 6,195 '' ��%/�� ��?=
Lentils '' 6,810 6,971 4,413 4,492 '' ��@
Animal & Vegetable Oils '' 42,340 39,108 38,021 34,005 '' ������ ������= ���
Spices '' 2,328 2,773 2,189 3,179 '' ���
Rice '' 11,954 6,023 14,864 7,666 '' ��
Others VALUE - 29,463 - 30,236 ���> ��[
Total - 415,840 - 397,534 \������
Beverages & Tobacco: -: R����� ��w���
Soft Drinks VALUE - 5,881 - 5,018 ���> ������ ��w�
Cigarettes '' - 83 - 64 '' `�/
Tobacco '' - 7,538 - 10,502 '' R��
Others '' - - - - '' ��[
Total 13,502 15,584 \������
Table No.(4)#> ����
Impotrs by Commodity During (Jan. - Mar.) 2015 - 2016 *( ������ ���� ���!��)
(Value in US.000's)
2015 (�� - ���)** **(Jan. - March) 2015
* 2016 - 2015 ( �� - ���) ����� ��� ]?/�� Y/= ������
��=��� ]?^^^^^^^^^^^^^^^/��Commodity UNIT
2016 (�� - ���)* *(Jan. - March) 2016

Table No.(4) Cont'd (4) #> ���� ]��
���%��Qty.
���!��Value
���%��Qty.
���!��Value
Raw Materials: -:#� ���� Petroleum Products M.T 344,501 260,704 368,409 128,317 ��� �& ������ ����Raw Plastic '' 36,096 53,407 40,265 51,451 '' ���/���� #�Raw Rubber '' 253 399 236 320 '' &&��� #� Tallow '' 5,007 5,801 3,397 4,153 '' #�=wSeeds For Sowing '' 51 1,201 174 2,355 '' ��!�� �X�Packing Paper '' - - - - '' ��?�� ��Other VALUE - 116 - 36 ���> ��[Total - 321,628 - 186,632 \������Chemicals: -:�����% ����Medical& Pharmaceutical Products VALUE - 97,618 - 89,877 ���> �����Chemicals Products '' - 29,690 - 33,696 '' ���%�� �����% ��@Fertilizers M.T 42,751 18,668 109,964 42,735 ��� �& ���/�Tanning & Dyeing Materials '' 14,366 10,254 9,856 18,903 '' ���?���� ������� ����?� ����Perfumes & Cosmetics '' 11,434 22,365 9,974 21,442 '' ����� ��=�/�� �&@Explosives '' 2,354 8,805 2,620 1,949 '' �>��Insecticides '' - - - 29 '' ��w= �����Others VALUE - 13,245 - 12,576 ���> ��[Total - 200,645 - 221,207 \������Manufactured Goods: -: @����
Medical&Pharmaceutical Equipments VALUE - 22,530 - 21,850 ���> ������� ���& ����Leather Products. M.T 1,823 2,704 1,826 2,880 ��� �& ��?��� @����Manufactured Rubber '' 1,250 3,952 1,286 3,718 '' &&��� @����Manufactured Plastic '' 66,931 42,566 18,987 43,032 '' ���/���� @����Manufactured Wood & Cork '' 32,362 13,688 29,285 14,408 '' ��?���� Yw� @����Glass & Classware '' 27,080 15,668 23,680 19,663 '' ����� @����Iron & Steel '' 305,095 133,914 215,583 136,948 '' Y?�� ���=Manufactured Metal '' 13,367 28,976 26,213 29,273 '' ������ @����Footwear VALUE - 21,476 - 17,977 ���> ��X=[Jute & Sacks NO. 50,824 68,732 7,766 13,781 ��@ ����� ���Books,Magazines,And Newspapers M.T 652 2,548 2,320 7,282 ��� �& �`��� ���� Y�%
Cement & stony products '' 15,115 4,436 34,033 7,600 '' ���= ����� ��/[Scientific Equipments VALUE - 13,204 - 24,942 ���> ���?@ �����Paper Products M.T 34,384 34,594 28,790 28,023 ��� �& ���� @����Ceramic Products '' 25,776 11,547 23,186 12,353 '' ����� @����Toys & Sport Goods VALUE - 1,409 - 1,480 ���> ���� ����� ��&� Y��Other '' - 10,418 - 14,009 '' ��[Total - 432,362 - 399,219 \������
��=��� ]?^^^^^^^^^^^^^^^/��Commodity UNIT
2015 (�� - ���)** **(Jan. - March) 2015
2016 (�� - ���)* *(Jan. - March) 2016

Table No.(4) Cont'd (4) #> ���� ]��
���%��Qty.
���!��Value
���%��Qty.
���!��Value
Machinery & Equipment: -: ����� ��Non-Electrical Appliances M.T 28,876 135,059 25,586 101,318 ��� �& ��`��% �� ��Electrical Appliances VALUE - 59,002 - 70,533 ���> ��`��% ��Refrigerators NO. 1,591 4,067 2,725 10,171 ��@ ��WAir Conditioners '' 992 5,726 802 5,227 '' ���Z ��%�Machinery Spare Parts VALUE - 62,287 - 109,246 ���> �� �� ]&>T.V., Radios, Recorders & Tapes, etc. '' - 14,048 - 18,009 '' ���� ������ ��/�� �&w�� Z����� �����?�Dry Batteries NO. 1,311 1,804 694 1,689 ��@ ~�� �&�Accumulators '' 2,661 8,040 2,661 8,469 '' �&�Tractors '' 6,996 36,909 3,866 41,030 '' ���Ovens '' 243 754 490 1,335 '' ����Other VALUE - 51,208 - 45,474 ���> ��[Total 0 378,904 - 412,501 \������Transport Equipment: -:�!� �`/�Railway Locomotives NO. 715 16,479 - - ��@ �&>Railway Wagons '' 417 2,044 203 202 '' �&> �@Motor Cars '' 3,736 41,767 4,228 49,122 '' ������ �@Trucks & Lorries '' 9,322 47,889 9,073 67,047 '' ���� � �=wBuses '' 162 1,428 306 3,087 '' ��Tyres & Tubes '' 31,250 33,192 11,358 24,777 '' �&�� Y����Auto-Spare Parts VALUE - 29,289 - 36,928 ���> �@ �� ]&>Motor-Cycles NO. 872 4,033 440 2,193 ��@ ���� ���Bicycles '' 365 1,210 362 1,129 '' ���Aircrafts '' - - - - '' �`&Aircraft Spare Parts VALUE - 7,035 - 7,174 ���> �`& �� ]&>Locomotive Spare Parts '' - 1,269 - 3,449 '' �&> �� ]&>Ferries & Steamers NO. 4 23 471 220 ��@ ����� ���� Y%��Other VALUE - - - - ���> ��[Total - 185,658 - 195,328 \������Textiles: -: ��/��Yarn M.T 984 1,273 1,354 1,702 ��� �& ��� Sewing Threads '' 142 531 202 667 '' ~%�= &���Woven Synthetic Fabric '' 4,705 21,998 4,967 19,603 '' :@�� �= �� �w�>�Woven Cotton Fabrics '' 32 75 38 74 '' �&> �� �w�>�Woven Flax Fabrics '' 8 7 44 39 '' ��% �� �w�>�Man-Made Filament & Staple '' 54 157 24 79 '' ����%� ���w �� ��/��Waddig Of Textile Materials '' 772 1,310 822 1,563 '' ����/� ���� �� �w=Carpets VALUE - 926 - 1,230 ���> ��/Special Woven Fabrics M.T 1,350 7,765 1,588 7,583 ��� �& ��� ��� ��/��Knitted Or Crocheted Fabrics '' - 4 2 7 '' ���� �w�>�Ready Made Clothes VALUE - 51,907 - 46,440 ���> ��Z� /��?�Other '' - 28 - 96 '' ��[Total 85,981 79,083 \������
Other '' - 12,746 - 924 '' ��[
Grand Total 2,047,266 1,908,012 :?%�� \������*Provisional Data**Adjusted Data
]?^^^^^^^^^^^^^^^/����=���Commodity UNIT
2016 (�� - ���)* *(Jan. - March) 2016
2015 (�� - ���)** **(Jan. - March) 2015

Countries ���Jan.
����Feb.
��March
\������Total ^^^^^^^^^^^^&>��
Industrial Countries : ��@���� ����� :
Austria 709 47 525 1,281 /����
Australia 1,141 6,793 11,093 19,027 ����/�
Belgium 1,742 2,145 2,226 6,113 %��?�
Canada 1,036 29,226 548 30,810 ���%
Switzerland 1,601 1,928 7,210 10,739 �/��/
Denmark 126 445 872 1,443 ��� ���
Germany 22,377 15,540 42,019 79,936 �����
Spain 1,540 1,955 3,007 6,502 ���/�
Finland 270 175 194 639 ���?��
France 3,371 4,376 6,855 14,602 /��
United Kingdom 7,090 6,005 8,959 22,054 ��=���� �%?����
Greece 87 99 295 481 ������
Ireland 226 337 376 939 ������
Italy 7,813 15,949 10,690 34,452 ��&��
Japan 21,777 17,016 26,285 65,078 �����
Netherland 6,622 3,479 4,532 14,633 �����Z
Norway 546 349 247 1,142 ������
Portugal 68 612 242 922 ������
New Zealand 2,518 2,940 2,437 7,895 ���������
Sweden 2,962 2,985 2,533 8,480 ���/��
United States 2,323 1,526 2,622 6,471 ��=���� �����
Total 85,945 113,927 133,767 333,639 \������
Europe (Others) : ���(��[ ) :
Bulgaria 53 154 5 212 ��?�
Cheq Republic 241 113 144 498 ��w���
Slovakia - - - - �%��?/
Cyprus 798 594 1,051 2,443 _�>
Hungary 3 4 6 13 ����
Poland 116 135 640 891 ������
Romania - - - - ����
Russia 2,729 32,842 6,128 41,699 �/�
Turkey 44,310 48,022 50,184 142,516 �%�
Ukraine 318 11,461 3,998 15,777 ���%�[
Croatia - - - - ����%
Malta - 17 - 17 &��Total 48,568 93,342 62,156 204,066 \������
( Value In US$.000'S)
Table No.(5) #> ����*( ���w) 2016 (�� - ���) ����� ��� &!�� Y/= ������
Imports By Country During (Jan.- Mar.) 2016 (Monthly)*
( ������ ���� ���!��)

Table No.(5)Cont'd #> ���� ]��(5)
Countries ���Jan.
����Feb.
��March
\������Total ^^^^^^^^^^^^&>��
Africa : �!��� :
COMESA Countries:- 52,658 51,034 64,444 168,136 /���%�� ���:
Djibouti 11 11 :�����
Ethiopia 3,842 2,615 1,586 8,043 ����W�
Kenya 3,507 3,093 5,239 11,839 ���%
Uganda 4,010 4,551 5,364 13,925 ������
Zimbabwe 2,099 1,508 4,527 8,134 ������
Egypt 37,891 38,693 45,283 121,867 ��
Zambia - - - - �����
Rwanda 83 35 30 148 �����
Burundi 43 39 115 197 �����
Seychelles 8 - 4 12 �w�/
Eritrea - - - - ����
Malawi - - - - ����
Mauritius - - - - _w���
Angola - - - - �����
Libya 58 40 93 191 ����
Comoros - - - - �!�� ��
Madagascar - - - - !w���
Swaziland 1,056 366 1,850 3,272 �������/
Congo - - - - ���%��
Zaire ( Congo ) - - - - �`��
Namibia 61 83 353 497 �����
Others African Countries 1,983 25,082 3,194 30,259 ��[ ��!��� ���:
Nigeria 381 449 923 1,753 �����
Morocco 61 20,197 60 20,318 Y����
Tunisia 7 334 672 1,013 ����
Algeria - - - `�����
SENEGAL 51 - 47 98 ���/��
SIERRALEONE - - - ������/
SOMALIA 11 - 18 29 ������
Tanzania - 8 8 ������
SOUTH AFRICA - 3,610 890 4,500 �!��� Y���Other 1,472 484 584 2,540 ��[Total 54,641 76,116 67,638 198,395 \������

Table No.(5)Cont'd #> ���� ]��(5)
Countries ���Jan.
����Feb.
��March
\������Total ^^^^^^^^^^^^&>��
Asia : �/� :
Bangladesh 261 244 2,899 3,404 �������
China 136,996 184,498 214,270 535,764 �����
Hong Kong 647 1,052 1,313 3,012 ���% ���Z
Indonesia 5,685 8,122 5,632 19,439 �/������
India 28,835 56,075 65,199 150,109 �����
Iran 1,208 733 1,922 3,863 ����
North Korea - - - - ����w�� ��%
South Korea 8,335 10,331 17,116 35,782 �������� ��%
Malaysia 1,329 2,943 1,673 5,945 �����
Pakistan 5,041 5,067 4,220 14,328 ��/%�
Singapore 465 - 54 519 �����/
Thailand 4,282 7,454 9,541 21,277 �����
Taiwan 1,427 2,466 4,468 8,361 �����
SRI LANKA 133 114 46 293 %���/
VIET NAM 345 2,996 143 3,484 #����
PHILIPPINES 44 286 2 332 ���?���
Total 195,033 282,381 328,498 805,912 \������
Middle East : &/��� �w�� :
United Arab Emirates 39,227 26,755 38,642 104,624 ��=���� ������ ����
Bahrain 235 42 562 839 ��=���
Iraq - - - - �����
Jordan 8,265 3,641 4,493 16,399 ����
Kuwait 1,491 1,165 991 3,647 ��%��
Lebanon 2,127 1,326 914 4,367 ����
Oman 630 925 795 2,350 ��@
Qatar 493 35 123 651 &>
Saudi Arabia 25,638 30,114 35,230 90,982 �����/��
Syria 525 484 644 1,653 ��/
Yemen - - - - �����
Others - - - - ��[
Total 78,631 64,487 82,394 225,512 \������
Western Hemisphere : :���� �%�� ��� :
Argentina 748 360 220 1,328 �������
Brazil 1,680 996 3,007 5,683 �������
Ecuador 391 966 670 2,027 ����%��
Mexico 1 14 - 15 ��/%���
Panama - - - - ���
Jamaica - - 56 56 %���Others 4,437 5,176 8,636 18,249 ��[Total 7,257 7,512 12,589 27,358 \������Other Countries 24,364 36,468 52,298 113,130 ��[ &>�Grand Total 494,439 674,233 739,340 1,908,012 :?%�� \������*Provisional Data ����� ��� *

Cou
ntrie
s �
�C
offe
e �
wTe
a
��>�
� {�
> {
�>W
heat
&W
heat
Flo
ur
��`�X
� ���
� �
�[O
ther
Fo
odSt
uffs
��
w�
R���
Bev
erag
es&
Tob
acco
����
��
����
Petr
oleu
mPr
oduc
ts
�
�[ #
� ��
��O
ther
raw
Mat
eria
ls
��
��%��
Che
mic
als
@
���
�M
anuf
.G
oods
���
��
��M
achi
nery
& E
quip
.
�!�
�`/
�Tr
ansp
ort
Equi
p.
�
�/���
�Te
xtile
s �
�[ O
ther
\��
����
Tota
l^
^^^^^^^^
^^^&>�
�
IND
UST
RIA
L C
OU
NTR
IES:
��@��
�� ��
���:-
AU
STR
IA-
-
-
23
-
-
-
51
2
746
-
-
-
-
1,28
1
/
����
AU
STR
ALI
A-
-
16
,133
14
19
82
310
805
29
0
647
72
6
1
-
19
,027
��
��/�
BEL
GIU
M-
-
-
2,56
2
43
149
-
1,
467
443
73
5
30
-
684
6,
113
%��?
�C
AN
AD
A-
-
28
,804
686
-
-
-
19
9
64
1,
057
-
-
-
30,8
10
���%
SWIT
ZER
LAN
D-
-
-
46
-
-
1
9,
256
239
37
6
604
217
-
10,7
39
�/��
/D
ENM
AR
K-
-
-
66
-
-
-
1,
308
25
44
-
-
-
1,44
3
�
�� ��
�G
ERM
AN
Y-
-
28
,319
669
44
7
143
242
6,19
4
9,
807
31,6
62
2,
377
76
-
79
,936
��
���
SPA
IN-
-
33
454
21
-
24
2,
491
976
2,
458
45
-
-
6,50
2
��
�/�
FIN
LAN
D-
-
-
-
-
-
-
-
537
10
2
-
-
-
639
���
?��FR
AN
CE
-
-
-
49
7
223
13
12
7
5,
778
543
7,
161
260
-
-
14
,602
/
��U
NIT
ED K
ING
DO
M-
1
-
5,
478
90
4,
425
27
3,
334
1,59
2
6,
695
382
30
-
22,0
54
��=�
��� �%
?����
GR
EEC
E-
-
-
100
-
-
29
263
64
25
-
-
-
48
1
���
���IR
ELA
ND
-
-
-
22
0
-
-
-
704
-
7
8
-
-
939
���
���
ITA
LY-
-
-
3,18
1
-
80
18
5
3,
237
13,3
60
13
,966
443
-
-
34
,452
��
&��
JAPA
N-
-
-
1
-
1
14
10
7
805
11
,435
51,4
15
1,
300
-
65
,078
�
����
NET
HER
LAN
DS
-
-
-
7,
789
260
-
95
977
66
8
4,43
8
40
6
-
-
14,6
33
�����Z
NO
RW
AY
-
-
-
-
-
-
54
7
1,
081
-
-
-
-
1,
142
���
���PO
RTU
GA
L-
-
-
36
5
-
-
2
867
12
-
-
-
922
��
����
NEW
ZEA
LAN
D-
-
-
7,10
4
-
-
165
575
-
30
21
-
-
7,89
5
���
?����
�SW
EDEN
-
-
-
18
3
-
-
18
4
1,
073
3,99
3
3,
037
4
6
-
8,48
0
���
/��
UN
ITED
STA
TES
-
-
-
13
2
-
110
1,19
2
600
21
2
3,98
4
23
3
8
-
6,
471
��=�
���
�����
TOTA
L-
1
73,2
89
29
,241
1,10
8
5,
003
2,
649
38
,889
36,3
12
87
,871
56,9
54
1,
638
68
4
333,
639
\���
���Eu
rope
( O
ther
) :-
��
[(��
[ ):-
BU
LGA
RIA
-
-
-
17
0
-
-
-
23
13
6
-
-
-
212
�
�?�
CZE
CH
-
-
-
-
-
-
2
82
99
110
20
5
-
-
498
��
w���
SLO
VAK
IA-
-
-
-
-
-
-
-
-
-
-
-
-
-
�%
��?/
CYP
RU
S-
-
-
-
-
-
-
1,
796
221
39
2
34
-
-
2,44
3
_
�>
HU
NG
AR
Y-
-
-
4
-
-
-
-
2
7
-
-
-
13
�
���PO
LAN
D-
-
-
161
-
-
22
235
13
460
-
-
-
89
1
������
RO
MA
NIA
-
-
-
-
-
-
-
-
-
-
-
-
-
-
����
R
USS
IA-
-
17
,349
22,0
38
3
1,25
1
1
10
1
793
15
4
9
-
-
41
,699
�/
�TU
RK
EY-
-
93
,934
13,3
24
48
83
1,69
5
1,96
5
11
,682
13,1
48
1,
585
5,
052
-
14
2,51
6
�%
�U
KR
AIN
E-
-
-
5,22
6
-
-
-
-
10,0
73
83
395
-
-
15
,777
��
�%�
Mal
ta-
-
-
17
-
-
-
-
-
-
-
-
-
17
&��
TOTA
L-
-
11
1,28
3
40,9
40
51
1,33
4
1,72
0
4,20
2
22
,896
14,3
60
2,
228
5,
052
-
20
4,06
6
\�
�����
( Val
ue In
US$
.000
'S)
( ��
����
��
� ���!
��)IM
POR
TS B
Y C
OU
NTR
Y &
CO
MM
OD
ITY
DU
RIN
G (
Janu
ary
- Mar
ch) 2
016*
2016
(��
-
���)
���
]?/�
�� &
>�� Y
/=
�����
�* TA
BLE
NO
.(6) #
> �
���

TAB
LE N
O. (
6) C
ON
T'D
#>
����
]��
(6)
��
Cof
fee
�w
Tea
��>�
� {�
> {
�>W
heat
&W
heat
Flo
ur
��`�X
� ���
� �
�[O
ther
Fo
odSt
uffs
��
w�
R���
Bev
erag
es&
Tob
acco
����
��
����
Petr
oleu
mPr
oduc
ts
�
�[ #
� ��
��O
ther
raw
Mat
eria
ls
��
��%��
Che
mic
als
@
���
�M
anuf
.G
oods
���
��
��M
achi
nery
& E
quip
.
�!�
�`/
�Tr
ansp
ort
Equi
p.
�
�/���
�Te
xtile
s �
�[ O
ther
\��
����
Tota
l^
^^^^^^^^
^^^&>�
�
AFR
ICA
:�!
��� :
CO
MES
A C
ount
ries:
-14
,216
8,74
9
50
30
,096
11,6
22
58
4
7,
152
19
,700
53,2
30
11
,883
6,14
3
4,70
3
8
16
8,13
6
/
���%��
���
:D
JIB
UTI
-
-
-
-
-
-
-
-
-
11
-
-
-
11
:�
����
ETH
IOPI
A71
6
-
-
6,
749
1
-
-
56
513
-
-
8
-
8,
043
����
W�K
ENYA
-
8,
051
-
260
1,
900
-
-
688
69
9
171
5
65
-
11
,839
��
�%U
GA
ND
A13
,486
438
-
-
-
-
-
1
-
-
-
-
-
13
,925
���
���
ZIM
BA
BW
E-
-
-
-
8,
134
-
-
-
-
-
-
-
-
8,13
4
��
����
EGYP
T14
38
50
22
,487
1,30
9
58
4
7,
064
16
,729
51,5
37
11
,614
6,00
3
4,43
0
8
12
1,86
7
�
�ZA
MB
IA-
-
-
-
-
-
-
-
-
-
-
-
-
-
��
���R
WA
ND
A-
148
-
-
-
-
-
-
-
-
-
-
-
148
���
��B
UR
UN
DI
-
74
-
117
-
-
-
-
-
6
-
-
-
197
��
���
SEYC
HEL
LES
-
-
-
-
-
-
-
-
12
-
-
-
-
12
�w�/
ERIT
RIA
-
-
-
-
-
-
-
-
-
-
-
-
-
-
���
�M
ALA
WI
-
-
-
-
-
-
-
-
-
-
-
-
-
-
����
MA
UR
ITIU
S-
-
-
-
-
-
-
-
-
-
-
-
-
-
_
w��
�A
NG
OLA
-
-
-
-
-
-
-
-
-
-
-
-
-
-
����
�Li
bya
-
-
-
-
-
-
-
1
16
41
132
1
-
191
��
��C
OM
OR
OS
-
-
-
-
-
-
-
-
-
-
-
-
-
-
�!��
��
MA
DA
GA
SCA
R-
-
-
-
-
-
-
-
-
-
-
-
-
-
�
w���
SWA
ZILA
ND
-
-
-
48
3
278
-
-
2,
147
287
7
-
70
-
3,27
2
���
����/
CO
NG
O-
-
-
-
-
-
-
-
-
-
-
-
-
-
��
�%��
Zaire
( C
ongo
)-
-
-
-
-
-
-
-
-
-
-
-
-
-
�`
��N
amib
ia-
-
-
-
-
-
88
78
16
6
33
3
12
9
-
49
7
����
�O
ther
s A
fric
an C
ount
ries:
-54
1
8
89
1,87
8
11
7
16
91
21,2
41
2,
651
3,32
4
27
0
4
29
30
,259
�
�[ ��
!���
���:
NIG
ERIA
3
-
-
1,28
7
-
8
-
39
5
43
4
13
-
-
1,
753
���
��M
OR
OC
CO
-
-
-
54
-
-
-
20,1
84
60
-
20
-
-
20
,318
Y
����
TUN
ISIA
-
-
-
41
-
-
-
5
956
10
-
1
-
1,
013
���
�A
LGER
IA-
-
-
-
-
-
-
-
-
-
-
-
-
-
`�
����
SEN
EGA
L-
-
-
-
-
-
-
98
-
-
-
-
-
98
���/
��SI
ERR
ALE
ON
E-
-
-
-
-
-
-
-
-
-
-
-
-
-
��
����/
SOM
ALI
A-
-
-
-
-
-
-
-
-
-
-
-
29
29
����
��Ta
nzan
ia-
8
-
-
-
-
-
-
-
-
-
-
-
8
��
����
SOU
TH A
FRIC
A-
-
89
334
-
-
40
412
15
5
3,27
8
19
2
-
-
4,50
0
�!
��� Y
���
othe
r 53
8
-
-
16
2
117
8
51
147
1,
437
32
45
3
-
2,54
0
�
�[TO
TAL
14,7
57
8,
757
13
9
31,9
74
11
,739
600
7,24
3
40,9
41
55
,881
15,2
07
6,
413
4,
707
37
19
8,39
5
\�
�����

TAB
LE N
O. (
6) C
ON
T'D
#>
����
]��
(6)
��
Cof
fee
�w
Tea
��>�
� {�
> {
�>W
heat
&W
heat
Flo
ur
��`�X
� ���
� �
�[O
ther
Fo
odSt
uffs
��
w�
R���
Bev
erag
es&
Tob
acco
����
��
����
Petr
oleu
mPr
oduc
ts
�
�[ #
� ��
��O
ther
raw
Mat
eria
ls
��
��%��
Che
mic
als
@
���
�M
anuf
.G
oods
���
��
��M
achi
nery
& E
quip
.
�!�
�`/
�Tr
ansp
ort
Equi
p.
�
�/���
�Te
xtile
s �
�[ O
ther
\��
����
Tota
l^
^^^^^^^^
^^^&>�
�
ASI
A:
�/�:-
BA
NG
LAD
ESH
-
-
-
5
-
-
-
76
3,24
3
-
-
80
-
3,
404
����
���C
HIN
A2
28
-
5,80
0
91
490
3,00
0
26,3
46
16
7,45
5
204,
816
77
,346
50,3
90
-
53
5,76
4
��
���
HO
NG
KO
NG
-
-
-
7
-
-
-
20
8
130
2,
663
3
1
-
3,01
2
��
�% �
��Z
IND
ON
ESIA
-
-
-
5,
081
284
4
646
695
2,
006
8,59
8
1,
067
1,
030
28
19
,439
�/
������
IND
IA2
-
-
50
,131
268
51
3
1,
283
26
,624
32,1
26
19
,233
11,2
73
8,
654
2
150,
109
�����
IRA
N-
-
-
937
4
596
-
21
7
297
1,
797
14
-
1
3,
863
����
N.K
OR
EA-
-
-
-
-
-
-
-
-
-
-
-
-
-
���
�w��
��
%S.
KO
REA
-
2
-
42
-
35
2,
779
4,
827
1,14
8
8,
577
18,2
63
10
9
-
35
,782
���
����
� ��
%M
ALA
YSIA
-
-
-
1,
224
-
-
2,
373
63
6
998
69
1
23
-
-
5,94
5
��
���
PAK
ISTA
N-
-
-
2,67
5
-
-
-
5,
907
1,52
1
1,
507
207
2,51
1
-
14,3
28
��/
%�SI
NG
APO
RE
-
-
-
11
-
25
-
34
6
44
93
-
-
-
519
�
����
/TH
AIL
AN
D-
-
-
1,57
3
-
2
251
991
1,
825
8,12
1
8,
146
36
8
-
21
,277
���
��TA
IWA
N-
-
-
-
-
-
1,68
9
763
4,
106
1,24
6
55
6
1
-
8,
361
����
�SR
I LA
NK
A-
-
-
118
-
-
-
-
175
-
-
-
-
293
%�
��/
VIET
NA
M-
-
-
318
42
-
52
30
2,83
4
35
43
13
0
-
3,
484
#����
PH
ILIP
PIN
ES-
-
-
-
-
-
-
32
7
-
5
-
-
-
332
��
�?���
TOTA
L4
30
-
67,9
22
68
9
1,66
5
12,0
73
67
,993
217,
908
25
7,38
2
116,
941
63
,274
31
805,
912
\���
���M
IDD
LE E
AST
:&/
��� �
w��:
-A
RA
B E
MIR
RA
TES
2
46
4
4,01
1
64
8
7,20
4
10,2
64
31
,859
26,6
57
18
,732
2,55
9
2,62
7
11
104,
624
����
�� �
���
B
AH
RA
IN-
-
-
47
-
-
-
11
3
503
17
6
-
-
-
839
��
=���
IRA
Q-
-
-
-
-
-
-
-
-
-
-
-
-
-
��
���
JOR
DA
N-
-
-
789
13
-
33
1
14
,114
600
25
6
88
48
16
0
16,3
99
���
�K
UW
AIT
-
-
-
75
-
-
2,
484
44
2
39
60
7
-
-
-
3,64
7
�
�%��
LEB
AN
ON
-
-
-
50
6
-
20
44
106
2,
562
917
21
2
-
-
4,36
7
�
���O
MA
N-
-
-
858
-
-
134
530
81
8
10
-
-
-
2,
350
��@
QA
TAR
-
-
-
39
0
-
-
-
199
53
8
-
-
1
65
1
&>
SAU
DI A
RA
BIA
-
16
6
3,
220
17
5,
831
20
,971
18,3
95
28
,677
7,89
8
4,
480
1,
471
-
90
,982
���
��/�
�SY
RIA
-
1
-
999
-
-
-
38
6
156
75
4
32
-
1,65
3
�
�/YE
MEN
-
-
-
-
-
-
-
-
-
-
-
-
-
-
�����
TOTA
L2
63
10
10,8
95
67
8
13,0
55
34
,228
66,1
44
60
,065
28,6
79
7,
343
4,
178
17
2
225,
512
\���
���W
ESTE
RN
HEM
ISPH
ERE:
:��
�� �
%�� �
��:-
AR
GEN
TIN
A-
-
-
349
-
-
-
19
178
73
4
48
-
-
1,32
8
��
����
�B
RA
ZIL
-
-
-
1,
299
-
-
2
521
56
4
3,29
7
-
-
-
5,
683
����
���EC
UA
DO
R-
-
-
575
4
-
2
89
43
2
450
45
9
16
-
2,
027
����
%��
MEX
ICO
-
-
-
14
-
-
-
1
-
-
-
-
-
15
��/%
���PA
NA
MA
-
-
-
-
-
-
-
-
-
-
-
-
-
-
���
Jam
aica
-
-
-
-
-
-
-
-
1
-
55
-
-
56
%��
�O
ther
-
-
-
69
7
1,27
0
1,
008
39
8
2,
342
3,07
9
4,
350
4,88
7
218
-
18,2
49
��[
TOTA
L-
-
-
2,93
4
1,
274
1,00
8
402
2,97
2
4,
254
8,83
1
5,
449
23
4
-
27
,358
\�
�����
OTH
ER C
OU
NTR
IES:
-
-
4,21
8
1,
075
45
10
5,65
2
-
66
1,
903
171
-
-
-
11
3,13
0
�
�[
&>�:
-G
RA
ND
TO
TAL
14,7
63
8,
851
18
8,93
9
184,
981
15
,584
128,
317
58,3
15
22
1,20
7
399,
219
41
2,50
1
195,
328
79
,083
924
1,
908,
012
:?%��
\��
����
*Pro
visi
onal
Dat
a���
��
��� *

Commodity ���Jan.
����Feb.
��March
\������Total
]?^^^^^^^^^^^^^^^/��
Foodstuffs : ��`�X� ���� :Wheat - - - - {�>Wheat Flour - - - - {�> ��>�Sugar - - - - %/Tea - - - - �wCoffee - - - - ��Dairy Products - - - - ����� ����Fish & Canned Fish - - - - ��/�� �?��� ��/[Meat & Meat Products - - - - ������� #�=�Fruits & Fruit Products - - - - ������� ~%���Vegetable & Veget. Products - - 1 1 ������� ����Confectionery, Sweets & Buiscuits - - - ��%/�� ��?=Lentils - - - - ��@Animal & Veget. Oils - - - - ������ ������= ���Spices - - - - ���Rice - - - - �[Other - - 7 7 ��[ Total - - 8 8 \������Beverages & Tobacco : R����� ��w��� :Soft Drinks - - - - ������ ��w�Cigarettes - - - - `�/Tobacco - - - - R��Others - - - - ��[Total - - - - \������Raw Materials : #� ���� : Petroleum Products 22,861 31,588 51,203 105,652 ������ ����Raw Plastic 84 522 606 ���/���� #�Raw Rubber - - - - &&��� #� Tallow - - - - #�=wSeeds For Sowing - - - - ��!�� �X�Packing Paper - - - - ��?�� ��Other - - - - ��[Total 22,861 31,672 51,725 106,258 \������
(Value In US.$000'S)
Table No.(7) #> ���� * ( ��w ) 2016 (�� - ���) ����� ��� ]?/�� ����%=�� ������
Government Imports By Commodity During (Jan. - Mar.) 2016 (Monthly)*( ������ ���� ���!��)

Table No.(7) Cont'd #> ���� ]��(7)
Commodity ���Jan.
����Feb.
��March
\������Total ]?^^^^^^^^^^^^^^^/��
Chemicals : �����% ���� :Medical & Pharmaceutical Products 2,989 6,400 10,361 19,750 ������� ���& ����� �����Chemical Products 680 351 775 1,806 ���%�� �����% ��@Fertilizers 218 218 ���/�Tanning & Dyeing Materials 372 219 1,022 1,613 ���?���� ������� ����?� ����Perfumes & Cosmetics - - - - ����� ��=�/�� �&@Explosives - - - - �>��Insecticides - - 28 28 ��w= �����Others 46 33 266 345 ��[Total 4,087 7,003 12,670 23,760 \������Manufactured Goods : @���� :Medical & Pharmacetical Equipments 210 386 32 628 ������� ���& ����Leather Products - - - - ��?��� @����Manufactured Rubber 1 46 - 47 &&��� @����Manufactured Plastics 21 1 4 26 ���/���� @����Manufactured Wood & Cork - - 359 359 ��?�� Yw� @����Glass & Glassware 5 24 13 42 ����� @����Iron & Steel 54 180 108 342 Y?�� ���=Manufactured Metal 456 194 1,009 1,659 ������ @����Footwear - 26 105 131 ��X=[Jute & Sacks - - - - ����� ���Books,Magazines,And Newspapers - 169 - 169 �`��� ���� Y�%Cement & Asbestos Pipes 2 1 - 3 ��/�/� �/���� ��/[Scientific Equipments 561 1,860 5,260 7,681 ���?@ ����[Paper Products 3 - 8 11 ���� @����Ceramic Products 209 92 2 303 ����� @����Toys & Sport Goods - - - - ���� ���[� ��&� Y��Other - 41 2 43 ��[Total 1,522 3,020 6,902 11,444 \������Machinery & Equipment : ����� ��:-Non-Electrical Appliances 413 502 424 1,339 ��`��% �� ��Electrical Appliances 714 404 8,990 10,108 ��`��% ��Refrigerators - 3 - 3 ��WAir Conditioners - 172 172 ���Z ��%�Machinery Spare Parts 25,689 1,562 2,073 29,324 �� �� ]&>T.V., Radios, Recorders & Tapes, etc. 4 78 25 107 ���� ������ ��/�� �&w�� Z����� �����?�Dry Batteries - - - - ~�� �&�Accumulators - - - - �&�Tractors - - - - ���Ovens 1 - - 1 ����Other 3,405 387 197 ��[Total 30,226 2,936 11,881 45,043 \������

Table No.(7) Cont'd #> ���� ]��(7)
Commodity ���Jan.
����Feb.
��March
\������Total ]?^^^^^^^^^^^^^^^/��
Transport Equipment : �!� �`/� :Railway Locomotives - - - - �&>Railway Wagons - - - - �&> �@Motor Cars 112 426 268 806 ������ �@Trucks & Lorries - - - - ���� � �=wBuses - - - - ��Tyres & Tubes - - - - �&�� Y����Auto Spare Parts 23 523 143 �@ �� ]&>Motor-Cycles - - - - ���� ���Bicycles - - - - ���Aircrafts - - - - �`&Aircraft Spare Parts 31 122 153 �`& �� ]&>Locomotive Spare Parts 54 41 - 95 �&> �� ]&>Ferries & Steamers - - - - ����� ���� Y%��Other - - - - ��[Total 189 1,021 533 1,743 \������Textiles : - ��/�� :Yarn - 35 18 53 ���Sewing Threads 5 - 1 6 ~%�= &���Woven Synthetic Fabric - - 21 21 :@�� �= �� �w�>�Woven Cotton Fabrics - - - - �&> �� �w�>�Woven Flax Fabrics - - - - ��% �� �w�>�Man-Made Filament & Staple - - - ����%� ���w �� ��/��Wadding Of Textile Materials - 5 - ����/� ���� �� �w=Carpets - - - - ��/Special Woven Fabrics - - - ��� ��� ��/��Knitted Or Crocheted Fabrics - - - - ���� �w�>�Ready Made Clothes 40 36 76 ��Z� /��?�Other - - - - ��[Total 45 40 76 161 \������Other - - - - ��[Grand Total 58,930 45,692 83,795 188,417 :?%�� \������*Provisional Data ����� ��� *