Embed Size (px)
Citation preview
CENTRAL BANK OF KENYA
CREDIT OFFICER SURVEY
QUARTER ENDED SEPTEMBER 2012

2
TABLE OF CONTENTS CONTENTS PAGE 1.0 FOREWORD ...................................................................................................................... 3
1.1 KENYAN BANKING SECTOR PERFORMANCE ..............................................................3
1.2 CREDIT OFFICER SURVEY ............................................................................................3
2.0 EXECUTIVE SUMMARY .................................................................................................... 5
2.1 SURVEY METHODOLOGY .............................................................................................5
2.2 KEY FINDINGS ...............................................................................................................5
3.0 DETAILED SURVEY FINDINGS ....................................................................................... 6
3.1 DEMAND FOR CREDIT ...................................................................................................6
3.2 FACTORS AFFECTING DEMAND FOR CREDIT .............................................................8
3.3 CREDIT STANDARDS .....................................................................................................9
3.4 FACTORS AFFECTING CREDIT STANDARDS ............................................................. 10
3.5 INTERNATIONAL TRADE FINANCE ............................................................................. 11
3.6 NON-PERFORMING LOANS (NPLS) ............................................................................ 12
3.7 CREDIT RECOVERY EFFORTS .................................................................................... 14
4.0 ANNEX I (LIST OF RESPONDENTS) ................................................................................ 15

3
1.0 FOREWORD
1.1 KENYAN BANKING SECTOR PERFORMANCE
For the quarter ended 30th September 2012, the Kenyan Banking Sector demonstrated continued growth. Some of the sector’s performance indicators were as follows: The aggregate balance sheet increased by 4.6 percent from Kshs 2.195 trillion in June
2012 to Kshs 2.297 trillion in September 2012. Gross loans expanded by 1.6 percent from Kshs 1.29 trillion in June 2012 to Kshs
1.31 trillion in September 2012. Deposits grew by 3.6 percent from Kshs 1.66 trillion in June 2012 to Kshs 1.72 trillion
in September 2012. Total capital increased by 3.47 percent from Kshs 294.3 billion in June 2012 to Kshs
304.5 billion in September 2012. Gross non-performing loans increased by 5.6 percent from Kshs 57.5 billion in June
2012 to Kshs 60.74 billion in September 2012. Unaudited pre-tax profits stood at Kshs 53.2 billion for the quarter ending 30th June
2012 compared to Kshs 80.8 billion for the quarter ending 30th September 2012, a 51.9% increase.
1.2 CREDIT OFFICER SURVEY
Credit risk is the single largest factor affecting the soundness of financial institutions and the financial system as a whole and lending is the principal business for most banks. The total percentage of loans to total assets for the period ended 30th September 2012 was 56.8%. In order to identify potential risks and enhance understanding of credit risk, the Central Bank of Kenya introduced a quarterly Credit Officer Survey effective March 2012. So far CBK has undertaken three credit officer surveys for the periods ending 31st March 2012, 30th June 2012 and 30th September 2012. For the quarter ended 30th September 2012, CBK received Credit Officer Survey responses from all the 42 operational banks and 1 mortgage finance company. The list of the respondents is attached to this report as Annex I. Charterhouse Bank Ltd which is currently under statutory management was excluded from the survey. Comparison of findings obtained in the quarter ended June 2012 and the quarter ended September 2012 reveals that:- Demand for credit in the quarter ended September 2012 increased in trade as well as
personal and household sectors but reduced for transport and communication as well as energy and water sectors.
4
Credit standards were tightened for the building and real estate sectors in September 2012 while they were eased for the financial services, agriculture, real estate, tourism as well as the restaurant and hotel sectors.
Supply of international trade finance remained unchanged for all the sectors. Banks expect NPLs to remain generally unchanged for all the sectors in the quarter
ended 31st December 2012. Credit recovery efforts are expected to be intensified in real estate, personal/household
and building and construction sectors. CENTRAL BANK OF KENYA OCTOBER 2012

5
2.0 EXECUTIVE SUMMARY
2.1 SURVEY METHODOLOGY
The credit officer survey for the quarter ended September 2012 comprised five questions that focused on:-
Demand for credit. Credit standards. International trade finance. Non-Performing loans Credit recovery efforts. The survey targeted senior credit officers of all 42 operational banks and 1 mortgage finance company. Charterhouse Bank Ltd, which is currently under statutory management, was excluded from the survey. All the forty three institutions responded. The list of the respondents is attached to this report as Annex I.
2.2 KEY FINDINGS The key findings from the survey are detailed below.
2.2.1 Demand for credit
In the third quarter of 2012, demand for credit increased in the personal/household and trade sectors. Demand for credit in the agriculture sector as well as energy and water sectors remained largely unchanged while it decreased in the transport and communication Sector.
The survey indicated that cost of borrowing was the greatest factor that led to a decreased demand for credit.
2.2.2 Credit Standards
Credit standards were tightened for the building and real estate sectors for the quarter ending September 2012. Some banks expect the new land laws to adversely affect the performance of loans under building and construction as well as the real estate sectors. This is due to the envisaged lengthy and more complex credit appraisal procedures. Bank’s cost of funds and balance sheet constraints were reported to have led to tightening of credit standards. Competition from deposit taking microfinance institutions, SACCOs and other non bank credit providers were cited as not having a significant impact on banks credit standards.

6
2.2.3 International Trade Finance
Generally the banks willingness to supply international trade finance to all sectors remained unchanged in the quarter ended 30th September 2012.
2.2.4 Non-Performing Loans
Over the next three months (October-December 2012), banks expect the non-performing loans to generally remain unchanged.
2.2.5 Credit Recovery Efforts
The September 2012 credit survey indicates that seven of the eleven economic sectors will be subjected to intensified credit recovery efforts during the quarter ending December 2012. 3.0 DETAILED SURVEY FINDINGS
3.1 Demand for Credit 3.1.1 Observations The demand for credit in the agriculture, manufacturing, mining and quarrying, tourism, transport, financial services, real estate as well as energy and water sectors remained largely unchanged in the quarter ended September 2012. Demand for credit increased in the personal/households, building &construction and trade sectors. None of the sectors experienced a decrease in demand for credit in the quarter as indicated in Chart 1 below.
57 percent of the respondents reported an increase in the demand for credit in the trade sector as compared to 52 percent of the respondents in the survey for quarter ended June 2012. Further, 54 percent of the respondents of the credit survey under analysis reported an increase in the demand for credit to personal and household sector as compared to 42 percent of the respondents in the June 2012. Generally, there was a notable increase in the demand for credit in the quarter ended September 2012 as compared to the quarter ended June 2012.

7
Table 1: Demand for Credit September 2012 June 2012 Increased Remained
Unchanged Decreased Increased Remained
Unchanged Decreased
Agriculture 18% 63% 20% 18% 58% 25% Manufacturing 29% 54% 17% 40% 29% 31% Building & construction
46% 34% 20% 29% 34% 37%
Mining and Quarrying
19% 62% 19% 10% 68% 23%
Energy and water 24% 63% 13% 31% 59% 10% Trade 57% 31% 12% 52% 33% 14% Tourism, restaurant and Hotels
25% 55% 20% 38% 45% 18%
Transport and Communication
35% 53% 13% 41% 34% 24%
Real Estate 35% 40% 25% 38% 17% 45% Financial Services
24% 57% 19% 38% 38% 25%
Personal/ Household
54% 32% 15% 42% 24% 34%

8
3.2 Factors affecting demand for Credit 3.2.1 Observations The drop in CBR had the most significant impact in increasing demand for credit as shown in Chart 2 and Table 2 below. Issuance of debt securities (77 per cent of the respondents) and issuance of equity (78 per cent of the respondents) as well as loans from non banks were reported to have had the least impact on demand of credit in the quarter.
Table 2: Impact of factors affecting demand for credit
September 2012 June 2012
Increased
Remained Unchanged Decreased Increased
Remained Unchanged Decreased
Internal Financing 13% 56% 31% 9% 46% 46% Loans from other banks
15% 48% 38% 5% 59% 35%
Loans from non banks
3% 69% 28% 3% 52% 45%
Issuance of debt securities 9% 77% 14%
3% 85% 12%
Issuance of equity 6% 78% 17% 3% 79% 18% Cost of borrowing 34% 15% 51% 8% 3% 89% Available investment opportunities
32% 47% 21% 26% 50% 24%
Drop in CBR 72% 28% 0% - - -

9
3.3 Credit Standards 3.3.1 Observations In the quarter ended September 2012, there was generally no major change in credit standards to most of the sectors. However, credit standards for the building and construction, real estate and personal/household sectors were tightened in the quarter just as was done in the quarter ended June 2012. Chart 3 and Table 3 below details the responses on credit standards in the quarter ended September 2012.
Table 3: Credit Standards
September 2012 June 2012
Tightened Remained Unchanged Eased Tightened
Remained Unchanged Eased
Agriculture 17% 76% 7% 17% 66% 17% Manufacturing 19% 70% 12% 24% 53% 24% Building & Construction 41% 49% 10% 39% 21% 39% Mining and Quarrying 18% 72% 10% 20% 61% 20% Energy and water 13% 79% 8% 12% 76% 12% Trade 29% 52% 19% 17% 67% 17% Tourism, restaurant and Hotels 26% 67% 7% 25% 50% 25% Transport and communication 29% 57% 14% 25% 49% 25% Real Estate 42% 51% 7% 39% 22% 39% Financial Services 17% 76% 7% 17% 65% 17% Personal/Household 33% 57% 10% 33% 35% 33%
10
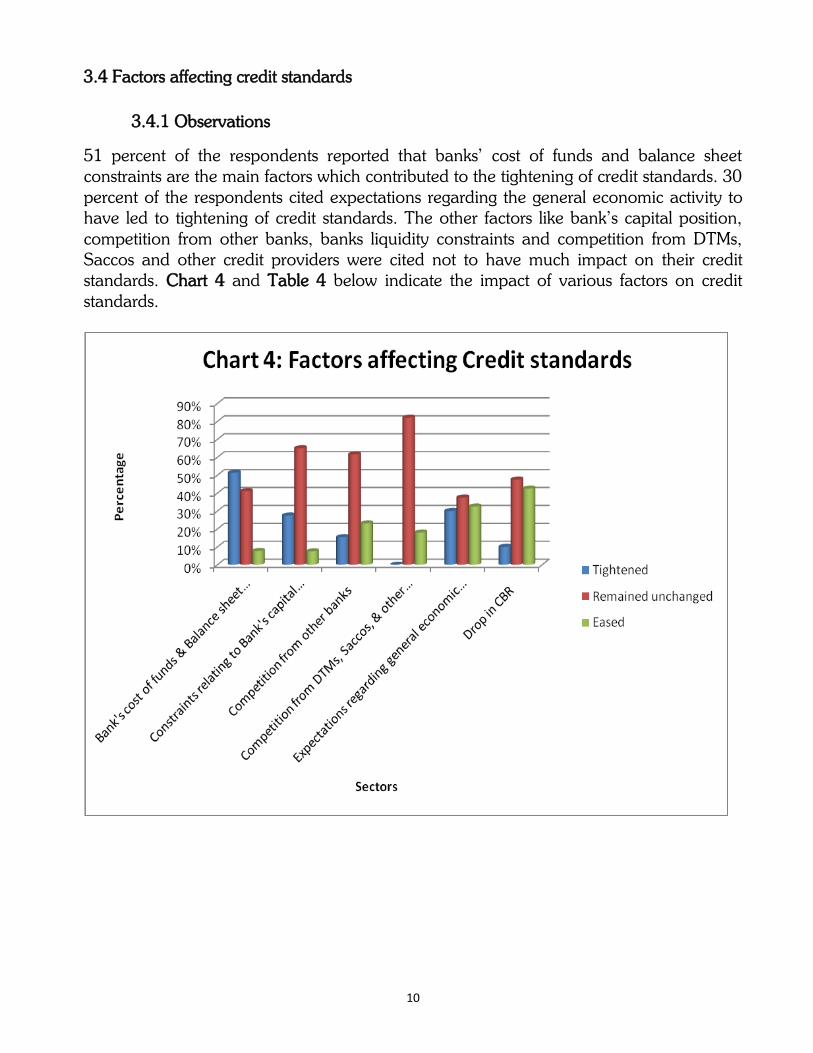
3.4 Factors affecting credit standards 3.4.1 Observations
51 percent of the respondents reported that banks’ cost of funds and balance sheet constraints are the main factors which contributed to the tightening of credit standards. 30 percent of the respondents cited expectations regarding the general economic activity to have led to tightening of credit standards. The other factors like bank’s capital position, competition from other banks, banks liquidity constraints and competition from DTMs, Saccos and other credit providers were cited not to have much impact on their credit standards. Chart 4 and Table 4 below indicate the impact of various factors on credit standards.

11
Table 4: Impact of factors affecting credit standards
September 2012 June 2012
Tightened Remained
Unchanged Eased Tightened Remained
Unchanged Eased
Bank's cost of funds & Balance sheet constraints
51% 41% 8% 71% 29% 0%
Constraints relating to Bank's capital position
28% 65% 8% 28% 67% 6%
Competition from other banks 15% 62% 23% 27% 59% 15% Bank's Liquidity constraints - - - 29% 62% 9% Competition from DTMs, Saccos, & other Credit Providers
0% 82% 18% 3% 82% 15%
Expectations regarding general economic activity
30% 38% 33% 54% 34% 11%
Drop in CBR 10% 48% 43% - - -
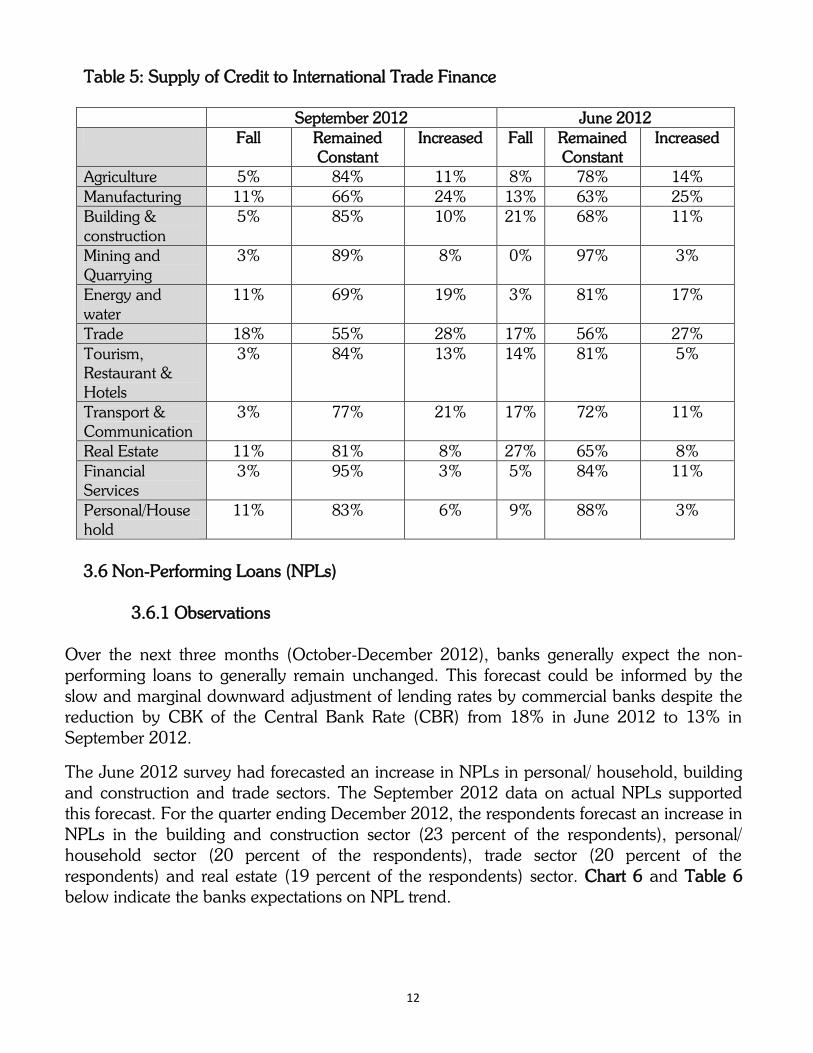
3.5 International Trade Finance 3.5.1 Observations It has been observed that from June to September 2012, the supply of International Trade Finance remained unchanged in all the sectors as was observed for the quarters ended June and March 2012 as indicated in Chart 5 and Table 5 below. 28 percent of the respondents in Trade Sector reported that supply for international finance increased in the quarter ended September 2012 as compared to 27 per cent and 35 per cent reported in the quarters ended June and March 2012 respectively.
12
Table 5: Supply of Credit to International Trade Finance
September 2012 June 2012 Fall Remained
Constant Increased Fall Remained
Constant Increased
Agriculture 5% 84% 11% 8% 78% 14% Manufacturing 11% 66% 24% 13% 63% 25% Building & construction
5% 85% 10% 21% 68% 11%
Mining and Quarrying
3% 89% 8% 0% 97% 3%
Energy and water
11% 69% 19% 3% 81% 17%
Trade 18% 55% 28% 17% 56% 27% Tourism, Restaurant & Hotels
3% 84% 13% 14% 81% 5%
Transport & Communication
3% 77% 21% 17% 72% 11%
Real Estate 11% 81% 8% 27% 65% 8% Financial Services
3% 95% 3% 5% 84% 11%
Personal/Household
11% 83% 6% 9% 88% 3%
3.6 Non-Performing Loans (NPLs)
3.6.1 Observations
Over the next three months (October-December 2012), banks generally expect the non-performing loans to generally remain unchanged. This forecast could be informed by the slow and marginal downward adjustment of lending rates by commercial banks despite the reduction by CBK of the Central Bank Rate (CBR) from 18% in June 2012 to 13% in September 2012.
The June 2012 survey had forecasted an increase in NPLs in personal/ household, building and construction and trade sectors. The September 2012 data on actual NPLs supported this forecast. For the quarter ending December 2012, the respondents forecast an increase in NPLs in the building and construction sector (23 percent of the respondents), personal/ household sector (20 percent of the respondents), trade sector (20 percent of the respondents) and real estate (19 percent of the respondents) sector. Chart 6 and Table 6 below indicate the banks expectations on NPL trend.

13
Table 6: Non Performing Loans Trend
September 2012 June 2012 Rise Remained
Constant Fall Rise Remained
Constant Fall
Agriculture 3% 63% 35% 20% 49% 32% Manufacturing 5% 65% 30% 21% 52% 26% Building & construction 23% 48% 30% 38% 45% 18% Mining and Quarrying 0% 86% 14% 8% 81% 11% Energy and water 3% 76% 22% 5% 79% 16% Trade 20% 56% 24% 37% 34% 29% Tourism, Restaurant & Hotels
15% 49% 36% 23% 55% 23%
Transport & Communication 13% 63% 25% 28% 48% 25% Real Estate 19% 45% 36% 35% 38% 28% Financial Services 3% 76% 21% 16% 66% 18% Personal/Household 20% 41% 39% 39% 42% 18%
14
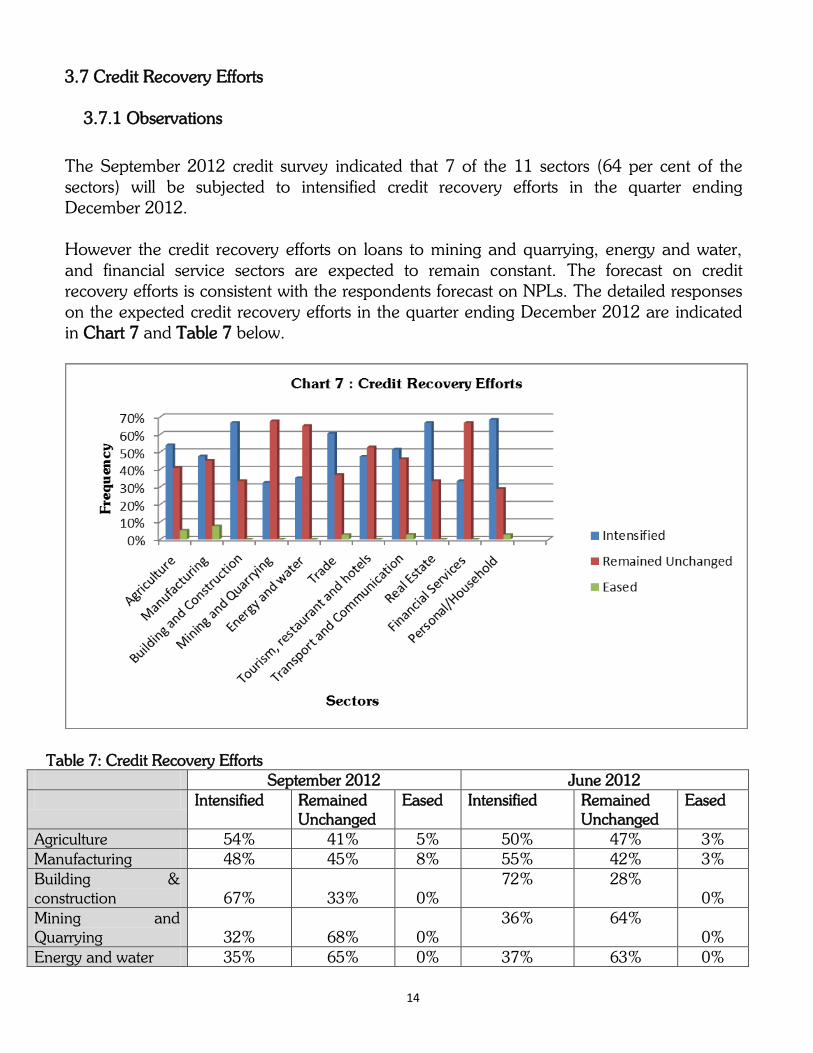
3.7 Credit Recovery Efforts
3.7.1 Observations
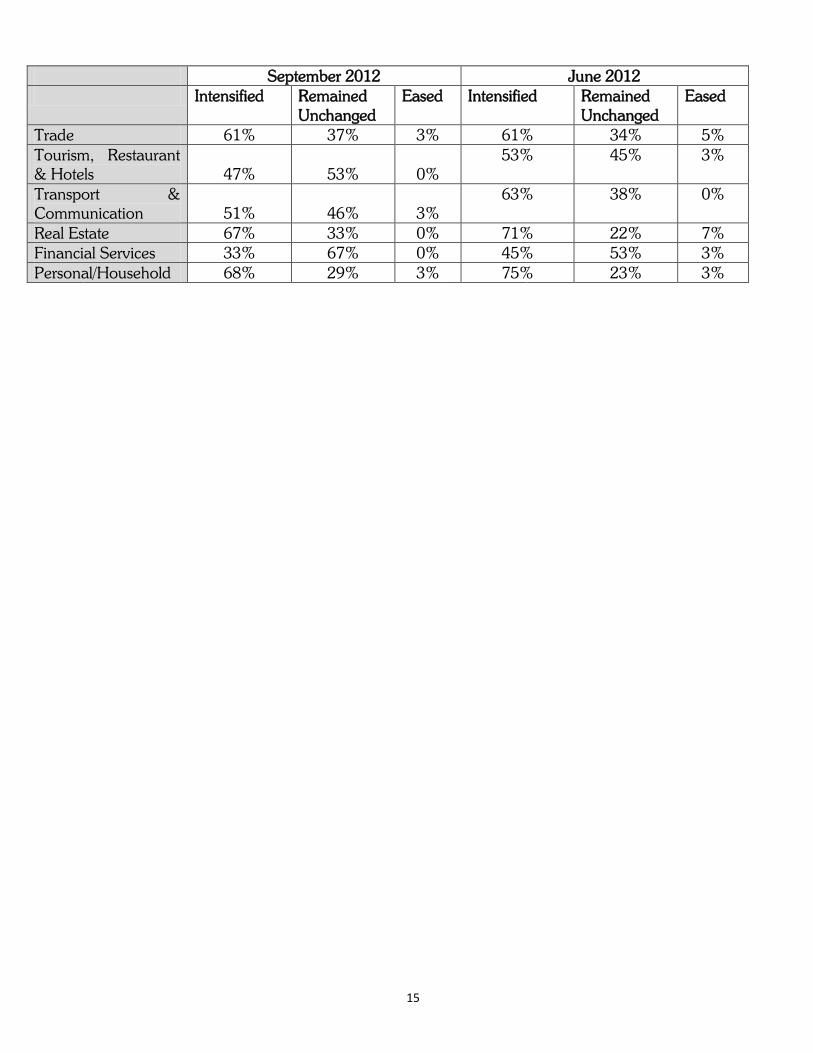
The September 2012 credit survey indicated that 7 of the 11 sectors (64 per cent of the sectors) will be subjected to intensified credit recovery efforts in the quarter ending December 2012. However the credit recovery efforts on loans to mining and quarrying, energy and water, and financial service sectors are expected to remain constant. The forecast on credit recovery efforts is consistent with the respondents forecast on NPLs. The detailed responses on the expected credit recovery efforts in the quarter ending December 2012 are indicated in Chart 7 and Table 7 below.
Table 7: Credit Recovery Efforts September 2012 June 2012 Intensified Remained
Unchanged Eased Intensified Remained
Unchanged Eased
Agriculture 54% 41% 5% 50% 47% 3% Manufacturing 48% 45% 8% 55% 42% 3% Building & construction 67% 33% 0%
72% 28% 0%
Mining and Quarrying 32% 68% 0%
36% 64% 0%
Energy and water 35% 65% 0% 37% 63% 0%
15
September 2012 June 2012 Intensified Remained
Unchanged Eased Intensified Remained
Unchanged Eased
Trade 61% 37% 3% 61% 34% 5% Tourism, Restaurant & Hotels 47% 53% 0%
53% 45% 3%
Transport & Communication 51% 46% 3%
63% 38% 0%
Real Estate 67% 33% 0% 71% 22% 7% Financial Services 33% 67% 0% 45% 53% 3% Personal/Household 68% 29% 3% 75% 23% 3%

16
LIST OF THE RESPONDENTS 1. African Banking Corporation Ltd. 2. Bank of Africa Kenya Ltd. 3. Bank of Baroda 4. Bank of India 5. Barclays Bank of Kenya Ltd. 6. CFC Stanbic Bank Ltd. 7. Chase Bank (K) Ltd. 8. Citibank N.A Kenya. 9. Commercial Bank of Africa Ltd. 10. Consolidated Bank of Kenya Ltd. 11. Co-operative Bank of Kenya Ltd. 12. Credit Bank Ltd. 13. Development Bank of Kenya Ltd. 14. Diamond Trust Bank (K) Ltd. 15. Dubai Bank Kenya Ltd. 16. Ecobank Kenya Ltd. 17. Equatorial Commercial Bank Ltd. 18. Equity Bank Ltd. 19. Family Bank Ltd. 20. Fidelity Commercial Bank Ltd. 21. Fina Bank Ltd. 22. First Community Bank Limited. 23. Giro Commercial Bank Ltd. 24. Guardian Bank Ltd. 25. Gulf African Bank Limited. 26. Habib Bank A.G Zurich. 27. Habib Bank Ltd. 28. I & M Bank Ltd. 29. Imperial Bank Ltd. 30. Jamii Bora Bank Ltd. 31. Kenya Commercial Bank Ltd. 32. K-Rep Bank Ltd. 33. Middle East Bank (K) Ltd.
34. National Bank of Kenya Ltd. 35. NIC Bank Ltd. 36. Oriental Commercial Bank Ltd. 37. Paramount Universal Bank Ltd. 38. Prime Bank Ltd. 39. Standard Chartered Bank (K) Ltd. 40. Trans-National Bank Ltd. 41. Victoria Commercial Bank Ltd. 42. UBA Kenya Bank Ltd. 43. Housing Finance Ltd.
4.0 Annex I (List of Respondents)