Embed Size (px)
Citation preview

Central AfricaEconomicOutlook2018Macroeconomic developments and poverty, inequality,and employment
Managing forestry’s potential
Central AfricaEconomicOutlook2018

The opinions expressed and arguments employed herein do not necessarily reflect the official views of the African Development Bank, its Boards of Directors, or the countries they represent. This document, as well as any data and maps included, are without prejudice to the status of or sovereignty over any territory, to the delimitation of international frontiers and boundaries, and to the name of any territory, city, or area.
Cover design by the African Development Bank based on images from Shutterstock.com
© African Development Bank 2018
ISBN 978-9938-882-64-3 (print) ISBN 978-9938-882-65-0 (electronic)
You may copy, download, or print this material for your own use, and you may include excerpts from this publication in your own documents, presentations, blogs, websites, and teaching materials, as long as the African Development Bank is suitably acknowledged as the source and copyright owner.

Abbreviations v
Executive summary 1
Part I The Central African economy 3Economic performance and outlook 3Macroeconomic stability 7Poverty, inequality, and employment 11Key policy recommendations 15
Part II Realizing the forest sector’s potential for sustainable and inclusive development 19Forestry and the High 5s 19Processing wood to promote competitiveness and economic diversification 21Policy recommendations for the forestry and wood sector 23
Appendix 1. Methodology for employment elasticity estimate 26
Notes 27
References 27
Figures1 Countries’ contribution to regional GDP in Central Africa, 2017 42 Real GDP growth rates for the Central Africa region, 2016–19 43 Real GDP growth rates for Central African countries, 2016–19 54 Average sectoral contribution to regional GDP in Central Africa, 2012–16 55 Demand decomposition of GDP in Central Africa, 2008 and 2015 66 Inflation in Central African countries, 2014–19 77 Terms of trade in Central African countries, 2010–16 88 Fiscal balances in Central African countries, 2014–19 89 Government expenditure in Central African countries, 2016–19 910 Current account balances in Central African countries, 2014–19 1011 Gross national savings in Central African countries, 2015–19 1012 Government revenues in Central African countries, 2016–19 11
CONTENTS
iii

iv C o N T E N T S
13 Gross public debt in Central African countries, 2014–19 1214 Trends in poverty in Central Africa: Poverty headcount and poverty gap, 1981–2013 1215 Contribution of manufacturing to GDP in Central Africa, 2012–17 1416 Sectoral distribution of employment in Central Africa, 1991–2016 1417 Elasticity of employment to growth in Central Africa and other African regions, 2008–14 1518 Decomposition of labor productivity growth in Central Africa, 2005–16 16
Table1 Trends in income inequality in Central African countries, available years, 1992–2014 13
AfDB African Development BankCFA Coopération Financière en Afrique centraleCEMAC Central African Economic and Monetary Community (includes Cameroon,
Chad, Central African Republic, Congo, Equatorial Guinea, and Gabon)DRC Democratic Republic of CongoECCAS Economic Community of Central African States (includes Burundi, Cameroon,
the Central African Republic, Chad, Congo, Democratic Republic of Congo, Equatorial Guinea, Gabon, Rwanda, and São Tomé and Príncipe)
EU European UnionFDI Foreign direct investmentGDP Gross domestic productILO International Labour organizationIMF International Monetary FundPPP Public–private partnershipUS United States of America
ABBREVIATIONS
v


Economic growth in the region was slug-gish from 2016 to 2017. Estimated average growth for the region in 2017 is 0.9 per-cent, barely up from 0.1 percent in 2016 and noticeably below the estimated African aver-age of 3.6 percent. Low commodity prices accounted for much of the sluggishness of growth. The outlook for the region is positive, however, as commodity prices trend upward and domestic demand grows. Sound macro-economic management and an improved institutional environment are expected to help maintain Central Africa’s growth resilience in 2018–19.
Growth is estimated to have reached 0.9 percent for 2017 and is projected to increase considerably in coming years, to 2.4 percent in 2018 and 3.4 percent in 2019. Growth in 2017 was driven mainly by increased infrastructure investment, resilient service sectors, and a recovering agricultural
sector, particularly in economies that depend less on extractive (oil and mining) sectors. The positive economic outlook for 2018–19 is driven by the same factors.
Domestic demand has continued to boost growth in many countries in the region. Exter-nal demand has remained subdued, more notably from advanced economies but also from emerging economies. The export values of primary commodities were depressed as a result of lower prices. However, Central African exports are expected to strengthen in 2018 and 2019 as the world economy improves.
Inflation in the Central Africa region is estimated at 10.1 percent for 2017, up from 2.6 percent in 2016. It is expected to edge up to 10.4 percent in 2018 and then to dip slightly to 9.1 percent in 2019.
As the euro zone continues its gradual recovery in 2018, the euro is expected to
T his Central Africa Economic Outlook analyzes the recent economic situation and
prospects for the region. Part I focuses on the evolution of key macroeconomic
indicators, including GDP growth, inflation, fiscal and current account balances, terms of
trade, employment, and inequality. It also assesses short- and medium-term economic
prospects based on key economic fundamentals, including structural and policy factors. In
addition, it investigates employment generation, looking in particular at whether growth has
created jobs and reduced poverty and inequality. Part II focuses on development of the huge
forest and timber resources in the Congo Basin, which could be an important driver of
diversification, economic resilience, and green growth for the six countries in the basin.
Inclusive and sustainable development of the sector can also reduce the vulnerability to
external shocks linked to commodity price volatility that results from Central African countries’
heavy reliance on nonrenewable oil and mineral resources.
EXECUTIVE SUMMARY
1
2 E x E C U T I v E S U M M A R Y
Much remains to be done to
unlock the full economic potential
of the countries of Central Africa
strengthen against the US dollar. This will lead to appreciation of the CFA franc, which is likely to generate disinflationary pressures in Central Africa.
Fiscal deficits in the Central Africa region fell from about 4.4 percent of GDP in 2016 to an esti-mated 2.1 percent in 2017. The deficit position is expected to continue to improve in 2018 and 2019. Most countries in the region are expected to have fairly low deficits, except Equatorial Guinea.
Gross national savings in the Central Africa region increased considerably, from 5 percent of GDP in 2016 to 12.4 percent in 2017, and is pro-jected to rise to 16.3 percent in 2018 and 17.3 per-cent in 2019.
on average, government revenues seem to match expenditures in the Central Africa region. The average revenue to GDP ratio was about 19 percent in 2016, against public spending of about 22 percent of GDP, and is estimated to have
increased slightly to about 20 percent in 2017, against public spending of almost 21 percent of GDP.
Much remains to be done to unlock the full economic potential of the countries of Central Africa. The negative consequences of the oil price decline for African economies highlight the need to accelerate and deepen structural reforms in order to create more jobs for youth and build more resilient economies. Despite the steps already taken and an abundance of natural resources, unemployment and economic exclusion remain high. Economic development has been held back by limited diversification and a sluggish private sector. Some countries are trying to redistribute oil wealth through a system of social benefits, includ-ing public employment and social safety nets. Countries can take several measures to advance the goal of more rapid and inclusive economic development.

PART ITHE CENTRAL AFRICAN ECONOMY
Economic growth in the region was sluggish from 2016 to 2017. Estimated average growth for the region in 2017 is 0.9 percent, barely up from 0.1 percent in 2016 and noticeably below the estimated African average of 3.6 percent. Low commodity prices accounted for much of the sluggishness of growth. The outlook for the region is positive, however, as commodity prices trend upward and domestic demand grows. Sound macroeconomic management and an improved institutional environment are expected to help maintain Central Africa’s growth resilience in 2018–19.
In 2016, continuing low commodity prices and security threats in many Central African countries stalled economic growth in the region, which stood at 0.1 percent (figure 2).Growth is estimated to have reached 0.9 per-cent for 2017 and is projected to increase considerably in coming years, to 2.4 percent in 2018 and 3.4 percent in 2019. Growth in 2017 was driven mainly by increased infra-structure investment, resilient service sec-tors, and a recovering agricultural sector,
particularly in economies that depend less on extractive (oil and mining) sectors. The pos-itive economic outlook for 2018–19 is driven by the same factors.
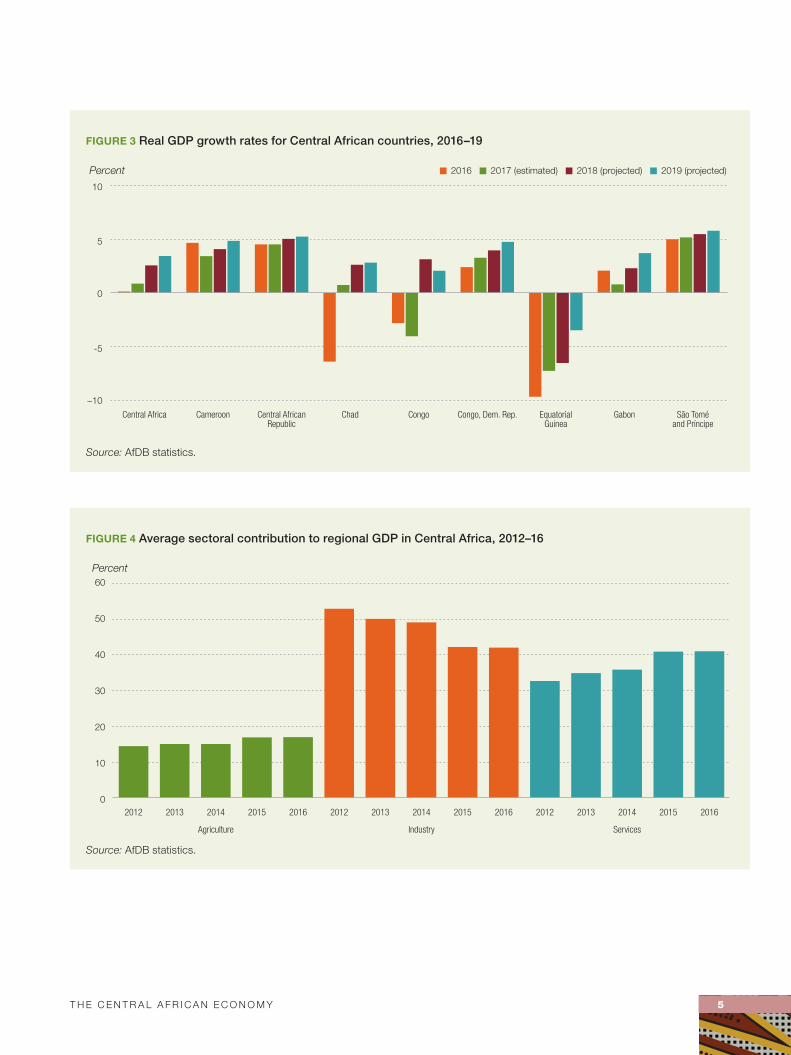
São Tomé and Príncipe, Central African Republic, Cameroon, and DRC are expected to record the highest growth rates in the region in 2017 and in the next two years (figure 3). Among countries whose econo-mies contracted, Equatorial Guinea experi-enced the largest estimated GDP decline, at –7.3 percent in 2017, followed by Congo, at 4 percent. These contractions in growth are due partly to a heavy dependence on oil, whose price and production both declined, as well as to security threats. Little change in these circumstance is expected in the near future, putting a strain on the region.
on a sectoral basis, industry accounted for the largest share of the regional econ-omy in 2016, contributing about 42 percent of regional GDP, followed by services, which contributed 41 percent (figure 4). Agriculture contributed 17 percent.
ECONOMIC PERFORMANCE AND OUTLOOK
E ight countries make up the Central Africa region: Cameroon, Central African Republic,
Chad, Congo, Democratic Republic of Congo (DRC), Equatorial Guinea, Gabon, and
São Tomé and Príncipe. In 2017, Cameroon was the largest economy in the region,
contributing nearly 29 percent of regional GDP, followed by DRC (24 percent), Gabon
(13 percent), Equatorial Guinea (11 percent), Congo (11 percent), and Chad (11 percent;
figure 1). The smallest economies were Central African Republic, which contributed
1.2 percent to regional growth, and the small island country of São Tomé and Príncipe,
which contributed 0.3 percent.
3

4 T H E C E N T R A L A F R I C A N E C o N o M Y
Industry accounted for the largest share
of the regional economy in 2016, contributing about
42 percent of regional GDP
Major sources and drivers of growth on the demand sideDomestic demand has continued to boost growth in many countries in the region. Exter-nal demand has remained subdued, more notably from advanced economies but also from emerging economies. The export values
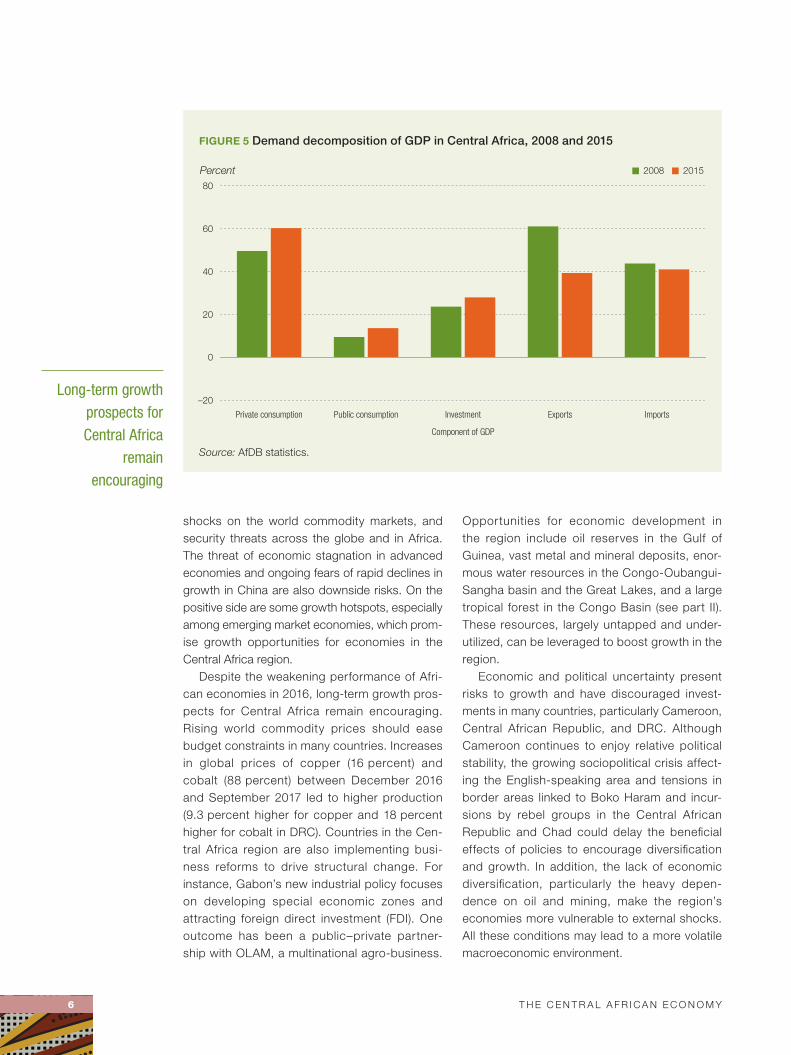
of primary commodities were depressed as a result of lower prices. However, Central African exports are expected to strengthen in 2018 and 2019 as the world economy improves. In 2015, domestic demand in most countries was led by private consumption and public infrastruc-ture investments, often financed by international bond issues. Increased consumer confidence and an expanding middle class helped sustain growth in private consumption, which accounted for 60 percent of GDP in 2015 (figure 5). Invest-ments in expanding the region’s productive capacity and productivity accounted for 28 per-cent of GDP, up from 24 percent in 2008. Gov-ernment consumption contributed the least to GDP, accounting for about 14 percent of GDP in 2015.
In 2015, the region imported more (38 percent of GDP) than it exported (32 percent of GDP), resulting in a trade deficit of –6.6 percent of GDP. As mentioned, export values were depressed by the low price of commodities, on which most of these countries depend heavily.
Opportunities and risksThe global economy is facing several key chal-lenges: uncertainty brought about by Brexit, price
FIGURE 1 Countries’ contribution to regional GDP in Central Africa, 2017
Cameroon29.3%
Central African Rep. 1.2%
Congo, Dem. Rep.24.4%Gabon
13.2%
Chad10.6%
Congo10.5%
EquatorialGuinea10.5%
São Tomé and Príncipe 0.3%
Source: AfDB statistics.
FIGURE 2 Real GDP growth rates for the Central Africa region, 2016–19
0
1
2
3
4
2019(projected)
2018(projected)
2017(estimated)
2016
Real GDP growth rate (percent)
Source: AfDB statistics.
T H E C E N T R A L A F R I C A N E C o N o M Y 5
FIGURE 3 Real GDP growth rates for Central African countries, 2016–19
–10
-5
0
5
10
São Toméand Príncipe
GabonEquatorialGuinea
Congo, Dem. Rep.CongoChadCentral AfricanRepublic
CameroonCentral Africa
Percent 2018 (projected)2017 (estimated)2016 2019 (projected)
Source: AfDB statistics.
FIGURE 4 Average sectoral contribution to regional GDP in Central Africa, 2012–16
201620152014201320122016201520142013201220162015201420132012
Percent
0
10
20
30
40
50
60
ServicesIndustryAgriculture
Source: AfDB statistics.
6 T H E C E N T R A L A F R I C A N E C o N o M Y
Long-term growth prospects for Central Africa
remain encouraging
shocks on the world commodity markets, and security threats across the globe and in Africa. The threat of economic stagnation in advanced economies and ongoing fears of rapid declines in growth in China are also downside risks. on the positive side are some growth hotspots, especially among emerging market economies, which prom-ise growth opportunities for economies in the Central Africa region.
Despite the weakening performance of Afri-can economies in 2016, long-term growth pros-pects for Central Africa remain encouraging. Rising world commodity prices should ease budget constraints in many countries. Increases in global prices of copper (16 percent) and cobalt (88 percent) between December 2016 and September 2017 led to higher production (9.3 percent higher for copper and 18 percent higher for cobalt in DRC). Countries in the Cen-tral Africa region are also implementing busi-ness reforms to drive structural change. For instance, Gabon’s new industrial policy focuses on developing special economic zones and attracting foreign direct investment (FDI). one outcome has been a public–private partner-ship with oLAM, a multinational agro- business.
opportunities for economic development in the region include oil reserves in the Gulf of Guinea, vast metal and mineral deposits, enor-mous water resources in the Congo-oubangui- Sangha basin and the Great Lakes, and a large tropical forest in the Congo Basin (see part II). These resources, largely untapped and under-utilized, can be leveraged to boost growth in the region.
Economic and political uncertainty present risks to growth and have discouraged invest-ments in many countries, particularly Cameroon, Central African Republic, and DRC. Although Cameroon continues to enjoy relative political stability, the growing sociopolitical crisis affect-ing the English-speaking area and tensions in border areas linked to Boko Haram and incur-sions by rebel groups in the Central African Republic and Chad could delay the beneficial effects of policies to encourage diversification and growth. In addition, the lack of economic diversification, particularly the heavy depen-dence on oil and mining, make the region’s economies more vulnerable to external shocks. All these conditions may lead to a more volatile macroeconomic environment.
FIGURE 5 Demand decomposition of GDP in Central Africa, 2008 and 2015
–20
0
20
40
60
80
ImportsExportsInvestmentPublic consumptionPrivate consumption
Percent 20152008
Component of GDP
Source: AfDB statistics.
T H E C E N T R A L A F R I C A N E C o N o M Y 7
Inflation is expected to edge up to 10.4 percent in 2018 and then to dip slightly to 9.1 percent in 2019
MACROECONOMIC STABILITY
Price movements
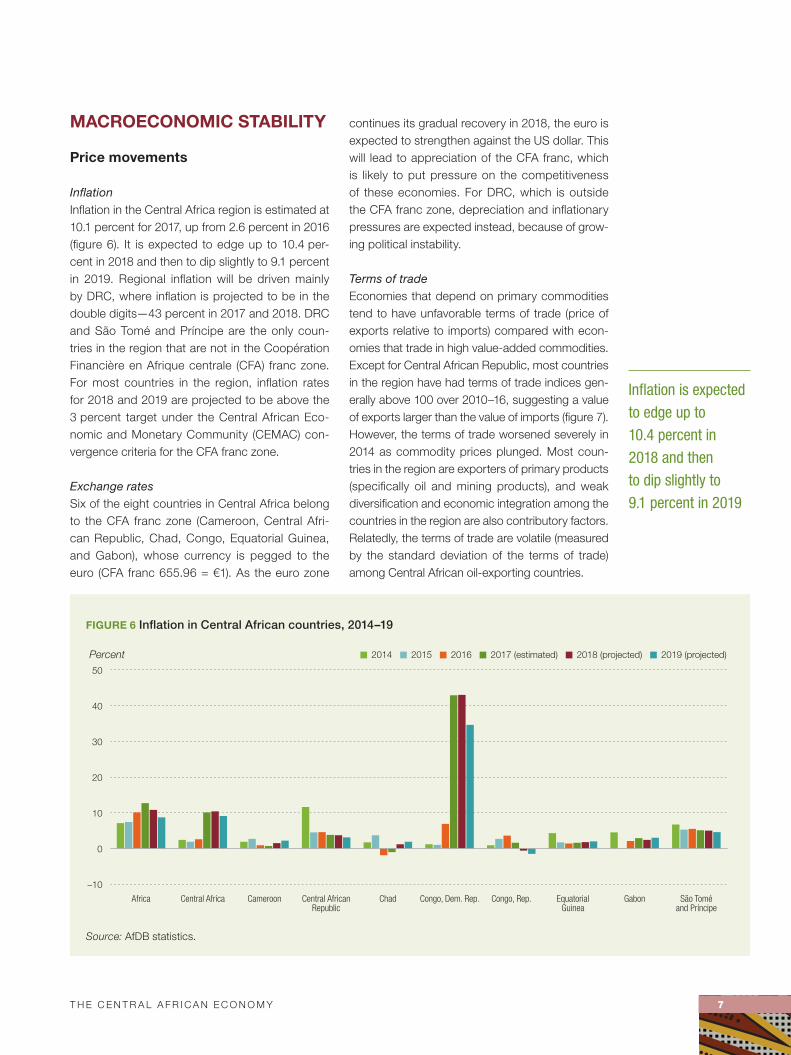
InflationInflation in the Central Africa region is estimated at 10.1 percent for 2017, up from 2.6 percent in 2016 (figure 6). It is expected to edge up to 10.4 per-cent in 2018 and then to dip slightly to 9.1 percent in 2019. Regional inflation will be driven mainly by DRC, where inflation is projected to be in the double digits — 43 percent in 2017 and 2018. DRC and São Tomé and Príncipe are the only coun-tries in the region that are not in the Coopération Financière en Afrique centrale (CFA) franc zone. For most countries in the region, inflation rates for 2018 and 2019 are projected to be above the 3 percent target under the Central African Eco-nomic and Monetary Community (CEMAC) con-vergence criteria for the CFA franc zone.
Exchange ratesSix of the eight countries in Central Africa belong to the CFA franc zone (Cameroon, Central Afri-can Republic, Chad, Congo, Equatorial Guinea, and Gabon), whose currency is pegged to the euro (CFA franc 655.96 = €1). As the euro zone
continues its gradual recovery in 2018, the euro is expected to strengthen against the US dollar. This will lead to appreciation of the CFA franc, which is likely to put pressure on the competitiveness of these economies. For DRC, which is outside the CFA franc zone, depreciation and inflationary pressures are expected instead, because of grow-ing political instability.
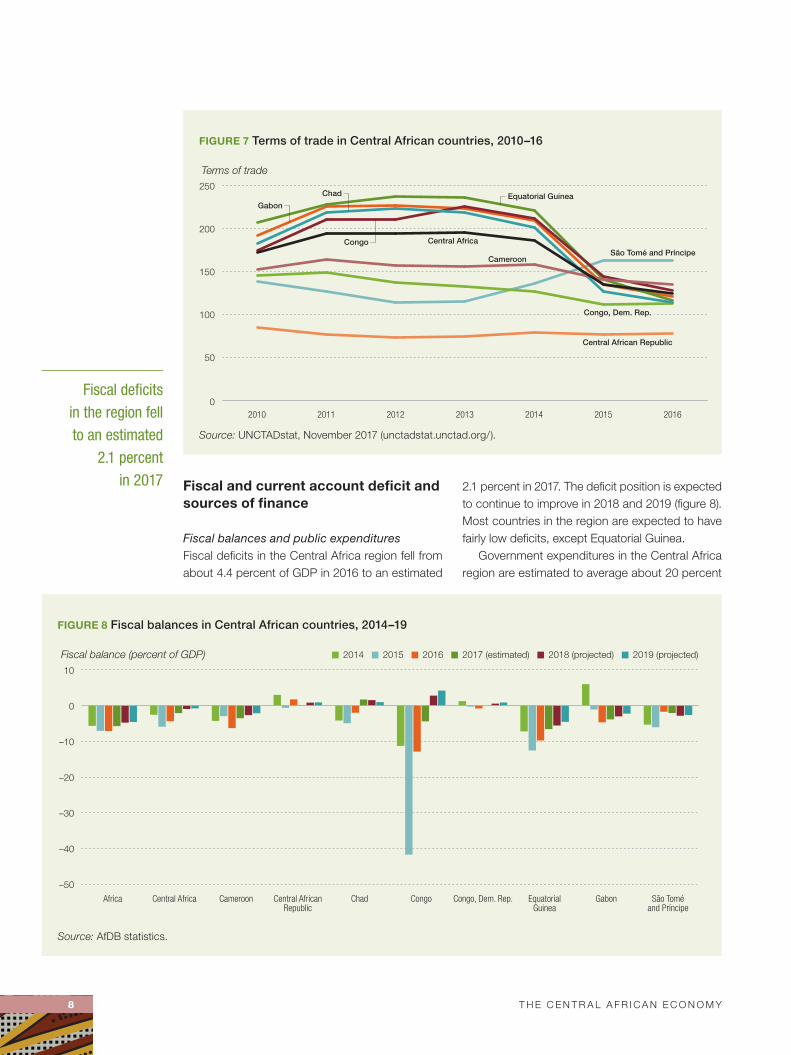
Terms of tradeEconomies that depend on primary commodities tend to have unfavorable terms of trade (price of exports relative to imports) compared with econ-omies that trade in high value-added commodities. Except for Central African Republic, most countries in the region have had terms of trade indices gen-erally above 100 over 2010–16, suggesting a value of exports larger than the value of imports (figure 7). However, the terms of trade worsened severely in 2014 as commodity prices plunged. Most coun-tries in the region are exporters of primary products (specifically oil and mining products), and weak diversification and economic integration among the countries in the region are also contributory factors. Relatedly, the terms of trade are volatile (measured by the standard deviation of the terms of trade) among Central African oil- exporting countries.
FIGURE 6 Inflation in Central African countries, 2014–19
São Toméand Príncipe
GabonEquatorialGuinea
Congo, Rep.Congo, Dem. Rep.ChadCentral AfricanRepublic
CameroonCentral AfricaAfrica
Percent 2018 (projected)2015 2016 2017 (estimated)2014 2019 (projected)
–10
0
10
20
30
40
50
Source: AfDB statistics.
8 T H E C E N T R A L A F R I C A N E C o N o M Y
Fiscal deficits in the region fell to an estimated
2.1 percent in 2017 Fiscal and current account deficit and
sources of finance
Fiscal balances and public expendituresFiscal deficits in the Central Africa region fell from about 4.4 percent of GDP in 2016 to an estimated
2.1 percent in 2017. The deficit position is expected to continue to improve in 2018 and 2019 (figure 8). Most countries in the region are expected to have fairly low deficits, except Equatorial Guinea.
Government expenditures in the Central Africa region are estimated to average about 20 percent
FIGURE 7 Terms of trade in Central African countries, 2010–16
0
50
100
150
200
250
2016201520142013201220112010
Terms of trade
Central African Republic
São Tomé and PríncipeCameroon
Central Africa
Congo, Dem. Rep.
Equatorial GuineaGabon
Chad
Congo
Source: UNCTADstat, November 2017 (unctadstat.unctad.org/).
FIGURE 8 Fiscal balances in Central African countries, 2014–19
São Toméand Príncipe
GabonEquatorialGuinea
Congo, Dem. Rep.CongoChadCentral AfricanRepublic
CameroonCentral AfricaAfrica
Fiscal balance (percent of GDP) 2018 (projected)2015 2016 2017 (estimated)2014 2019 (projected)
–50
–40
–30
–20
–10
0
10
Source: AfDB statistics.

T H E C E N T R A L A F R I C A N E C o N o M Y 9
Gross national savings in the Central Africa region increased considerably, from 5 percent of GDP in 2016 to 12.4 percent in 2017
of GDP in 2017, close to the 2016 level (figure 9). Government expenditures for 2017 were esti-mated to be above the regional average in Congo (around 36 percent of GDP), Equatorial Guinea (27 percent), and Gabon (21 percent). In Congo, development projects have been launched to ren-ovate and modernize the country’s three interna-tional airports (Brazzaville, ollombo, and Pointe-Noire), and some key economic corridors and highways have been modernized and new ones constructed. Equatorial Guinea has modernized in recent years, under its National Economic and Social Development Plan, which has included extensive public investments in infrastructure. Public expenditure ratios are projected to decline in both countries in coming years as they move toward fiscal consolidation.
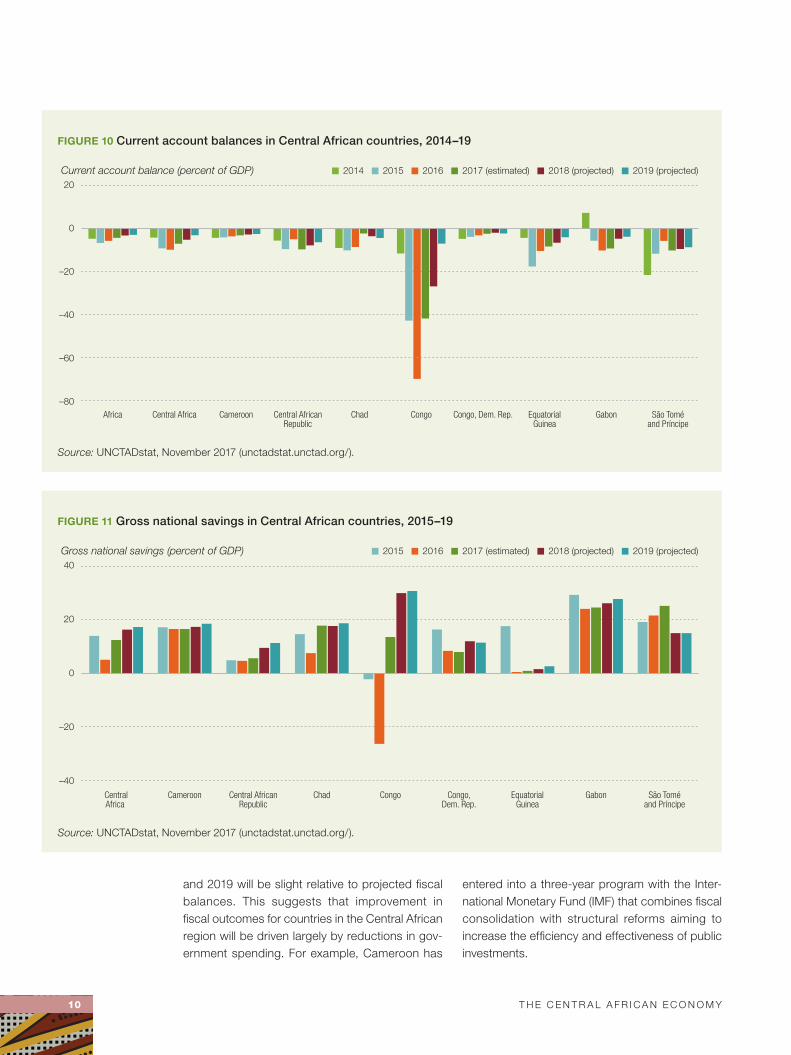
Current account balanceCentral Africa’s current account balance has improved from a deficit of almost 7 percent of GDP in 2016 to a deficit of not quite 5 percent in 2017 (figure 10). This improvement was driven in large part by the $10 billion Moho Nord project in Congo, which is expected to boost oil production to about 140,000 barrels a day — an increase of about 50 percent. As a result, in 2018 and 2019,
Congo is expected to record one of the lowest current account deficits in the region.
Domestic resource mobilizationGross national savings in the Central Africa region increased considerably, from 5 percent of GDP in 2016 (figure 11) to 12.4 percent in 2017 and is projected to rise to 16.3 percent in 2018 and 17.3 percent in 2019. In large part, the regional trend is being driven by Congo, which has benefited from the partial recovery in oil prices; gross national savings are projected to rise to 30 percent of GDP in 2018 and 31 per-cent in 2019.
on average, government revenues seem to match expenditures in the Central Africa region. The average revenue to GDP ratio was about 19 percent in 2016, against public spending of about 22 percent of GDP, and is estimated to have increased slightly to about 20 percent in 2017, against public spending of almost 21 percent of GDP (figure 12). São Tomé and Príncipe, a small island economy that relies mainly on agriculture and tourism, had one of the highest revenue ratios in the region in 2017 (29 percent), second only to Congo (32 percent), an oil producer. Pro-jected increases in government revenue in 2018
FIGURE 9 Government expenditure in Central African countries, 2016–19
Fiscal balance (percent of GDP) 2018 (projected)2016 2017 (estimated) 2019 (projected)
0
10
20
30
40
50
São Tomé andPríncipe
GabonEquatorialGuinea
Congo,Dem. Rep.
CongoChadCentral AfricanRepublic
CameroonCentralAfrica
Source: AfDB statistics.
10 T H E C E N T R A L A F R I C A N E C o N o M Y
and 2019 will be slight relative to projected fiscal balances. This suggests that improvement in fiscal outcomes for countries in the Central African region will be driven largely by reductions in gov-ernment spending. For example, Cameroon has
entered into a three-year program with the Inter-national Monetary Fund (IMF) that combines fiscal consolidation with structural reforms aiming to increase the efficiency and effectiveness of public investments.
FIGURE 10 Current account balances in Central African countries, 2014–19
São Toméand Príncipe
GabonEquatorialGuinea
Congo, Dem. Rep.CongoChadCentral AfricanRepublic
CameroonCentral AfricaAfrica
Current account balance (percent of GDP) 2018 (projected)2015 2016 2017 (estimated)2014 2019 (projected)
–80
–60
–40
–20
0
20
Source: UNCTADstat, November 2017 (unctadstat.unctad.org/).
FIGURE 11 Gross national savings in Central African countries, 2015–19
Gross national savings (percent of GDP) 2018 (projected)20162015 2017 (estimated) 2019 (projected)
São Toméand Príncipe
GabonEquatorialGuinea
Congo,Dem. Rep.
CongoChadCentral AfricanRepublic
CameroonCentralAfrica
–40
–20
0
20
40
Source: UNCTADstat, November 2017 (unctadstat.unctad.org/).

T H E C E N T R A L A F R I C A N E C o N o M Y 11
The percentage of people living on less than $1.90 a day declined steadily from about 76 percent in 1996 to 60 percent in 2013
Debt dynamicsCentral Africa’s gross public debt has risen steadily since 2014, reaching 28.7 percent of GDP in 2016 (figure 13). Gross public debt is projected to continue to rise in the short and medium terms, driven by rising debt in Congo, Cameroon, Equa-torial Guinea, and Gabon. The debt to GDP ratio in the region is estimated at 33.3 percent in 2017 and is projected at 36.3 percent in 2018.
The debt position of countries in the region varies considerably. Congo has the highest debt to GDP ratio, at 95.7 percent in 2017, and its ratio is projected to rise in coming years, reaching 95.8 in 2018, which is almost three times the average for the Central Africa region. Congo’s stock of public debt has followed an upward trajectory since debt relief in 2010, driven by new borrowing contracted earlier with foreign partners including China. São Tomé and Príncipe has the second highest debt to GDP ratio in Central Africa, at 74.2 percent in 2017. Although its economy grew at a robust 4.0 percent in recent years (higher than many other small island countries), its high public debt, low revenue collection, and narrow export base remain key challenges. Its public debt (including arrears) is projected to decrease to 71.7 percent of GDP in 2018. Both Congo’s
and São Tomé and Príncipe’s risk of debt dis-tress is classified as high (despite receiving debt relief under the Highly Indebted Poor Countries Initiative).
POVERTY, INEQUALITY, AND EMPLOYMENT
Trends in poverty and inequalityPoverty levels have declined considerably in Africa in the last decade. In the Central Africa region, the percentage of people living on less than $1.90 a day (the international poverty line, in 2011 pur-chasing power parity terms), declined steadily from about 76 percent in 1996 to 60 percent in 2013 (figure 14). However, ongoing conflicts in the region, such as in Central African Republic and DRC, could reverse the progress made so far.
The poverty gap, which measures the depth of poverty (the mean distance below the poverty line as a proportion of the poverty line), has also decreased (see figure 14). Based on limited avail-able data, inequality also appears to have been rising in the Central Africa region, as measured by the Gini index. Among countries in the region with available data, the Gini index appears to have
FIGURE 12 Government revenues in Central African countries, 2016–19
Government revenue (percent of GDP) 2018 (projected)2016 2017 (estimated) 2019 (projected)
0
10
20
30
40
São Toméand Príncipe
GabonEquatorialGuinea
Congo,Dem. Rep.
CongoChadCentral AfricanRepublic
CameroonCentralAfrica
Source: UNCTADstat, November 2017 (unctadstat.unctad.org/).

12 T H E C E N T R A L A F R I C A N E C o N o M Y
FIGURE 14 Trends in poverty in Central Africa: Poverty headcount and poverty gap, 1981–2013
0
20
40
60
80
100
201320112008200520021999199619931990198719841981
Percent
Headcount
Poverty gap
Source: World Bank PovcalNet.
Note: The poverty gap is the mean distance below the poverty line as a percent of the poverty line.
FIGURE 13 Gross public debt in Central African countries, 2014–19
Gross public debt (percent of GDP) 2018 (projected)2015 2016 2017 (estimated)2014 2019 (projected)
0
20
40
60
80
100
São Toméand Príncipe
GabonEquatorialGuinea
Congo, Dem. Rep.CongoComorosChadCentral AfricanRepublic
CameroonCentral Africa
Source: UNCTADstat, November 2017 (unctadstat.unctad.org/).

T H E C E N T R A L A F R I C A N E C o N o M Y 13
Industry’s contribution to employment is estimated at 7 percent, while its contribution to GDP has been above 50 percent
risen in Cameroon, Chad, Congo and Central Afri-can Republic (table 1).
Central African Republic exhibits the highest level of inequality, with a Gini above 0.55, an out-come that is likely exacerbated by the ongoing conflict. The high level of inequality in the region can also be linked to the unequal distribution of rents from natural resources, to wide disparities in access to resources and basic social services between rural and urban areas, and to gender inequalities.
Structural change, employment, and poverty reductionSustained and inclusive economic development requires structural change — long-term, per-sistent changes in the composition of sectors in an economy. It generally reflects a move from low- productivity, low-technology, labor-intensive activities in traditional sectors such as agricul-ture, toward higher productivity, high-technology, skill-intensive activities in the modern sector, typ-ically dominated by manufacturing and high-end services.1 Since the industrial revolution, manu-facturing has been at the core of structural change in most countries, consistently creating higher output and employment and leading to unprece-dented growth in incomes (UNIDo 2014).
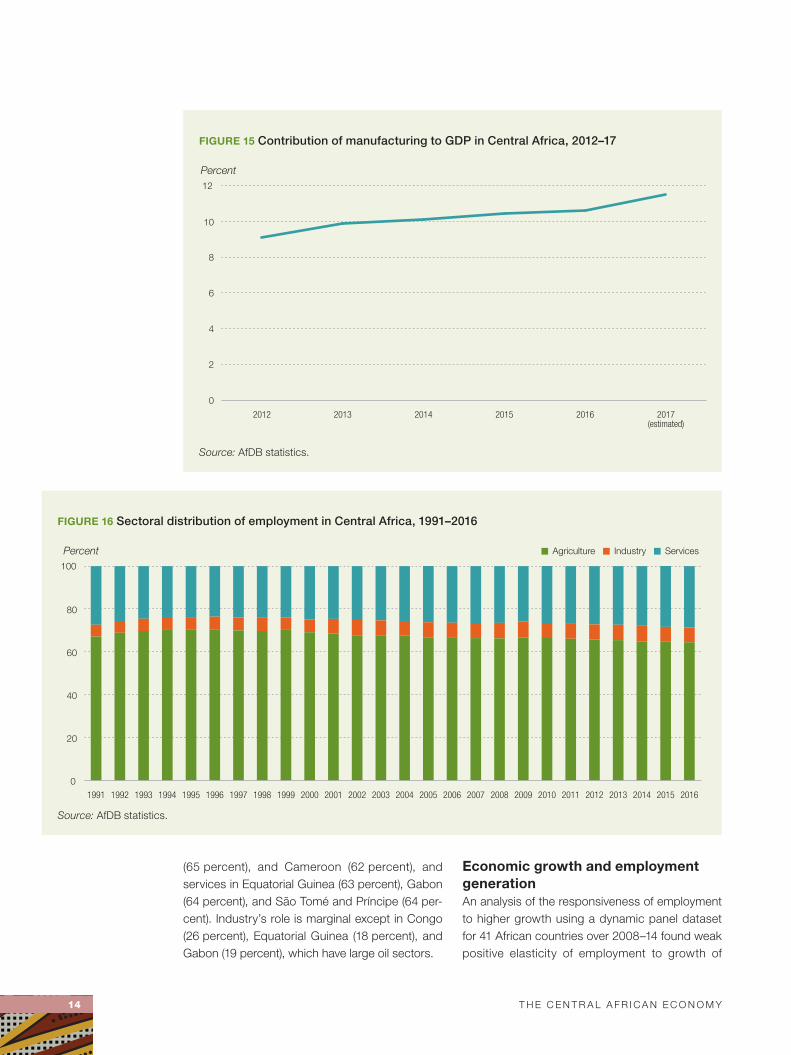
That has also been true in the Central Africa region, where the industrial sector has been the main contributor to growth. Manufacturing, a major component of the industrial sector, has con-tributed much less to GDP, and that contribution
has changed little since the 1970s (figure 15). The share of manufacturing value added in GDP was a little over 8 percent in 2016, when industry’s share (oil, mining, and manufacturing) was about 51.2 percent. This stagnation is worrisome con-sidering manufacturing’s importance to economic growth: “History has repeatedly shown that the single most important thing that distinguishes rich countries from poor ones is basically their higher capabilities in manufacturing, where productivity is generally higher, and, most importantly, where productivity tends to (although it does not always) grow faster than in agriculture and services” (Chang 2007, p. 213).
A similar picture emerges for sectoral employ-ment trends in the region, which show little change between 1991 and 2016 (figure 16).2 The realloca-tion of labor from low- to high-productivity sectors has been limited. Agriculture represents more than 60 percent of employment, but its contribution to GDP is about 20 percent, suggesting that the sector is not reaching its potential (see figure 4). Industry’s contribution to employment is estimated at 7 per-cent, while its contribution to GDP was above 50 percent over 2012–16. The sector is dominated by oil and mining, which clearly have made a very limited contribution to employment creation. The contribution of services to employment was 29 per-cent in 2016, while its share of GDP was 33 percent.
Countries in the region differ considerably in the sectoral allocation of labor. For example, the larg-est employer has been agriculture in Chad (76 per-cent), Central African Republic (72 percent), DRC
TABLE 1 Trends in income inequality in Central African countries, available years, 1992–2014 (Gini index)
Country 1992 1996 2001 2003 2004 2005 2007 2008 2011 2012 2014
Cameroon — 44.5 42.1 — — — 42.8 — — — 46.5
Central African Republic 61.3 — — 43.6 — — — 56.2 — — —
Chad — — — 39.8 — — — — 43.3 — —
Congo — — — — — 47.3 — — 48.9 — —
Democratic Republic of Congo — — — — 42.2 — — — — 42.1 —
Gabon — — — — — 42.2 — — — — —
Source: World Bank PovcalNet.
— not available.
Note: A Gini index of 0 represents perfect equality; an index of 100 represents perfect inequality.
14 T H E C E N T R A L A F R I C A N E C o N o M Y
(65 percent), and Cameroon (62 percent), and services in Equatorial Guinea (63 percent), Gabon (64 percent), and São Tomé and Príncipe (64 per-cent). Industry’s role is marginal except in Congo (26 percent), Equatorial Guinea (18 percent), and Gabon (19 percent), which have large oil sectors.
Economic growth and employment generationAn analysis of the responsiveness of employment to higher growth using a dynamic panel dataset for 41 African countries over 2008–14 found weak positive elasticity of employment to growth of
FIGURE 15 Contribution of manufacturing to GDP in Central Africa, 2012–17
0
2
4
6
8
10
12
2017(estimated)
20162015201420132012
Percent
Source: AfDB statistics.
FIGURE 16 Sectoral distribution of employment in Central Africa, 1991–2016
0
20
40
60
80
100
20162015201420132012201120102009200820072006200520042003200220012000199919981997199619951994199319921991
Percent ServicesIndustryAgriculture
Source: AfDB statistics.

T H E C E N T R A L A F R I C A N E C o N o M Y 15
Central Africa’s labor productivity growth has been mostly positive
about 0.06 in the Central Africa region. In other words, for every 1 percentage point increase in growth, Central African economies increased employment by 0.06 percentage point. This elas-ticity is lower than estimates for other African regions (figure 17), of 0.35, and for Africa overall, of 0.26. This result highlights the need for structural policies that can influence the pattern of growth in a way that yields larger employment dividends.
Structural transformation and labor productivity growthDecomposing labor productivity into two components — within-sector productivity growth and labor reallocation from low- productivity to high- productivity sectors, or structural labor pro-ductivity growth (following McMillan and Rodrik 2011) — can elucidate the nature of growth in the region and reveal whether the changing struc-ture has affected the region’s economic growth. The first component, within-sector productivity growth, can be affected by periodic technologi-cal and price shocks, such as weather and com-modity price volatility. When changes in sectoral
employment shares are positively correlated with productivity levels, structural change will contrib-ute to economywide productivity growth. The second component captures a longer term pro-cess of structural transformation. As countries grow, reallocating resources from low-productivity to high-productivity sectors is essential for deter-mining countries’ long-term economic perfor-mance, including their capacity to reduce poverty and create jobs that pay a decent wage.
Central Africa’s labor productivity growth has been mostly positive, though uneven among coun-tries, rising at an average annual rate of 1.9 percent between 2005 and 2016, with a peak of 5.2 per-cent in 2007 (figure 18). This growth was driven mainly by within-sector productivity growth, which is typically much larger than the structural com-ponent. Labor productivity gains were recorded mainly in the services sector until 2014–16. Produc-tivity growth has been mostly negative or very small in industry and inconsistently positive in agriculture.
The structural component of labor productivity growth was positive over 2005–12 and negative in 2015–16, meaning that employment in Central Africa has been moving from low-productivity sectors (agriculture) to higher productivity sec-tors (services and industry), particularly in recent years. Services have been the most dynamic, par-ticularly in urban areas, attracting labor from agri-culture and industry. While the industrial sector has also been absorbing additional labor, most of the region’s economy is still heavily dependent on primary commodities, with very minimal industrial and manufacturing activities.
KEY POLICY RECOMMENDATIONS
Much remains to be done to unlock the full eco-nomic potential of the countries of Central Africa. The negative consequences of the oil price decline for African economies highlight the need to accel-erate and deepen structural reforms in order to create more jobs for youth and build more resil-ient economies. Despite the steps already taken and an abundance of natural resources, unem-ployment and economic exclusion remain high. Economic development has been held back by
FIGURE 17 Elasticity of employment to growth in Central Africa and other African regions, 2008–14
Elasticity
0.0
0.1
0.2
0.3
0.4
AfricaOther African regionsCentral Africa
Source: Based on World Bank World Develop-
ment Indicators.
Note: See Appendix 1 for methodology.

16 T H E C E N T R A L A F R I C A N E C o N o M Y
Creating more jobs and resilience
begins with diversifying the economy away from the heavy
reliance on oil and other commodities
limited diversification and a sluggish private sector. Some countries are trying to redistribute oil wealth through a system of social benefits, including public employment and social safety nets. Countries can take several measures to advance the goal of more rapid and inclusive economic development.
Enhance job creation and increase resilience to external shocksCreating more jobs and resilience begins with diver-sifying the economy away from the heavy reliance on oil and other commodities and making space for a vibrant private sector. A 2012 AfDB study on the business environment in Central African countries noted that these countries had paid inadequate attention to stimulating the growth of small and medium-size firms, which are the engines of job growth. The study recommended that countries improve institutional frameworks and the business climate (beyond taking formal measures to boost their Doing Business ranking), implement measures to reduce the cost of production factors, adopt an appropriate exchange rate policy, and develop transport infrastructure and public utilities.
In addition, to reduce poverty and income dis-parities in the region, countries should consider
introducing more progressive taxation, improving equitable access to land and its products, and establishing targeted social protection programs. Policies are also needed to create a business environment that encourages private investment, especially FDI, in the region. That includes improv-ing security and focusing attention on value-added activities that take advantage of the region’s vast agricultural and mineral resource endowments (see part II).
Strengthen regional integrationDiversification in Central Africa could be strength-ened by promoting regional economic integration, particularly by accelerating the establishment of the Economic Community of Central African States (ECCAS) free trade area, which was initi-ated in 2004. The economic impact of this free trade area would be large. Economic integration would provide opportunities for growth in produc-tive sectors that could stimulate employment and enable more equitable wealth distribution. These opportunities are even greater in oil-producing countries, since the oil and gas sector is not very labor intensive. For example, in Equatorial Guinea and Gabon, the sector contributes more than
FIGURE 18 Decomposition of labor productivity growth in the Central Africa region, 2005–16
Percent
Weighted within-sector labor productivity growth Weighted structural labor productivity growth
201620152014201320122011201020092008200720062005
–4
–2
0
2
4
6
8
Source: ILostat www.ilo.org/ilostat.
T H E C E N T R A L A F R I C A N E C o N o M Y 17
Macroeconomic reform must include strengthening public expenditure management and mobilizing tax revenues
45 percent of GDP but mobilizes less than 10 per-cent of formal employment.
Regional integration would connect the region’s small fragmented markets, link landlocked coun-tries to international markets, and support intra- African trade. Regional integration in Central Africa has been hampered by deficient infrastructure and the coexistence of two free trade zones, the Cen-tral African Economic and Monetary Community (CEMAC) and ECCAS. Progress in regional inte-gration depends on establishing a free trade area in accordance with the African Union’s agenda by harmonizing the four instruments of the CEMAC and ECCAS free trade areas: certificates of origin, the approval process for preferential rates, the product origin verification form, and the standard scheme of approval for preferential rates.
Create the fiscal space to finance the High 5sCountries in the Central Africa region need to pursue macroeconomic consolidation and pro-mote good governance to create the fiscal space needed to finance the AfDB’s top five development objectives (High 5s: light up and power Africa, feed Africa, industrialize Africa, integrate Africa, and improve the quality of life for the people of Africa). (See part II for a discussion of the High 5 priorities as related to the forestry sector.)
To counteract the negative impact on public finances and macroeconomic balance resulting from low commodity prices in recent years, most countries in the region are undertaking stabiliza-tion and adjustment measures. CEMAC countries have recently agreed to a framework for action called the Economic and Financial Reform Pro-gram (PREF-CEMAC) aimed at reversing the neg-ative trends holding back the region’s economies. Member countries were urged to conclude a budget consolidation and economic recovery pro-gram with the IMF based on the PREF-CEMAC. DRC, though not a CEMAC member, has submit-ted a request to the IMF to establish a fast credit facility.
Strengthen the quality of public spending for economic recoveryMacroeconomic reform must include strength-ening public expenditure management and
mobilizing tax revenues to finance investments in priority sectors such as energy, agriculture, and industry; regional integration; and improved living standards. In 2014, crude oil prices plunged more than 50 percent from their pre-crisis level, and the slow recovery in prices since then has high-lighted the structural vulnerability of the Central African economies. The heavy dependence on the oil sector is illustrated by the share of oil reve-nues in the government budget, which rose from a regional average of 16 percent in 1994 to 70 per-cent in 2008, before dropping to around 60 per-cent in 2014. For DRC, the steep drop in the price of copper, its key export, in 2015 and 2016 halted its growth momentum; GDP growth dropped from an average of 7.7 percent over 2010–15 to 2.4 per-cent in 2016.
Before the 2008–09 global financial crisis, eco-nomic policies in the region were expansionary, financed by domestic hydrocarbon resources and external debt. While investments in infrastructure are economically justified, ensuring high quality investments is equally important, particularly in high value-added sectors where the quality of pre-vious investments has been poor, such as energy, transport, and information and communication. Focusing on the quality of investments is all the more important in the current climate of lower commodity prices, to improve the efficiency and effectiveness of public expenditure, support eco-nomic recovery, and avoid falling back into a new cycle of indebtedness.
Involve the private sector in financing and managing market infrastructures and public servicesPublic financing of infrastructure is pushing up against fiscal limits. External shocks have reduced fiscal resources and export earnings, exposing countries to a risk of deteriorating debt ratios and higher needs for borrowing. Meanwhile, infrastruc-ture is deteriorating due to a lack of investment in maintenance and the underpricing of infrastruc-ture services stemming from poor public man-agement. New options need to be explored for financing and managing market infrastructure and public utility services, such as public–private part-nerships (PPPs), to create budget margins and improve the quality of services. The combined

18 T H E C E N T R A L A F R I C A N E C o N o M Y
effects of reduced budget outlays and increased government revenue from royalties and taxes related to PPPs could make room in budgets to invest in enhancing human capital, making growth stronger and more inclusive.
Attracting private sector participation in financ-ing and managing infrastructure and public utility
services will require institutional and regulatory reform. The AfDB is offering support to countries in Central Africa to establish national PPP arrange-ments and strengthen national PPP capabilities through a Regional PPP Hub and offering legal assistance for PPP contract negotiations through its Legal Support Facility.

PART
With an area covering about 2 million square kilometers and an exploitable area repre-senting more than 72 percent of the total forest cover, the Congo Basin has consid-erable forestry potential. Forest resources, especially wood, are undeniably an oppor-tunity for economic and social development in the six countries in the basin. However, despite the proven comparative advantages of diversity and the high endowment in forest resources, the Congo Basin countries remain highly dependent on oil and mining. In none of the basin countries is the share of the for-estry sector in GDP more than 10 percent, except Central African Republic, where it was 13 percent in 2009 (oFAC 2012; FAo 2011); the average for the six countries is 5 percent. Despite the sector’s labor-intensive nature, its contribution to job creation in the basin coun-tries remains modest, at less than 5 percent.3 As a consequence, the contribution of the sector to economic diversification has been marginal.
FORESTRY AND THE HIGH 5s
Responsible management of forests in Cen-tral Africa could contribute to the realization of economic, social, and environmental ben-efits in harmony with the top five development objectives (High 5s) of the AfDB: light up and power Africa, feed Africa, industrialize Africa, integrate Africa, and improve the quality of life for the people of Africa.
Light up AfricaCentral Africa has abundant biomass resources from agriculture and forestry. Woody biomass is the main source of energy in Sub- Saharan Africa. Some 93 percent of rural households and 58 percent of urban households depend on it in some way. In addition to creating jobs for the poorest people in society, who generally do not have access to formal employment, the woody biomass sector is important to national
C entral African countries’ heavy reliance on nonrenewable natural resources increases
their vulnerability to commodity price volatility. In contrast, the optimal exploitation of the
huge forest and timber resources in the Congo Basin could be an important driver of
diversification, economic resilience, and green growth for the countries that are home to this
second “lungs of the world” after the Amazon (Cameroon, Central African Republic, Congo,
Democratic Republic of Congo, Equatorial Guinea, and Gabon). If developed in an inclusive
and equitable way, these resources present an opportunity for economic and social
development in the six countries that share it and can also benefit the local populations living
in the forest, thus reducing poverty.
IIREALIZING THE FOREST SECTOR’S POTENTIAL FOR SUSTAINABLE AND INCLUSIVE DEVELOPMENT
19

20 R E A L I z I N G T H E F o R E S T S E C To R ’ S P oT E N T I A L F o R S U S TA I N A B L E A N D I N C L U S I v E D E v E Lo P M E N T
Forest resources, especially wood,
are undeniably an opportunity
for economic and social development
economic growth, and its contribution could easily outpace that of other economic sectors. The eco-nomic value of the charcoal industry alone in Sub- Saharan Africa could exceed $12 billion by 2030, employing nearly 12 million people.
Biomass energy is renewable, carbon neutral, and cost effective relative to coal, hydro, wind, and natural gas energy. Biomass power plants could contribute to power generation in Africa and have economic potential in the global energy industry as well.
Feed AfricaIn addition to wood production, silviculture can improve the food security and nutrition of house-holds in forest-dependent communities in Africa in five important ways:• Contribute directly to subsistence food produc-
tion through the richness of forest soils and the harvesting of wild edible plants, nuts, condi-ments, mushrooms, tubers, leaves, and fruits that are rich in essential nutrients.
• Supply energy, especially for cooking.• Complement other supplies of animal proteins.• Generate income and employment.• Provide ecosystem services (soil fertility, water
storage, pollination, windbreak, shelter) that are essential for health and well-being.In addition to providing wood and forest foods
and environmental and ecosystem services, for-ests contain arable land reserves that can be used for agricultural expansion and infrastruc-ture. The potential for using trees to improve soil fertility and increase agricultural productivity through landscape restoration is substantial in Africa.
Industrialize AfricaBoth wood and non-wood forest products are potential drivers of industrialization through upstream and downstream linkages, capital accu-mulation and investment, value added, green growth, and job creation. In addition to forest industries linked to logging concessions in natu-ral forests, private commercial forest plantations operate large industrial complexes in eastern and southern Africa. A large proportion of wood is exported from Africa in the form of logs or primary
products. Adding value to timber harvested in tropical forests is an important element of sustain-able forest management and can generate many jobs and increase foreign exchange earnings. Forestry offers opportunities for processing raw wood to manufacture doors, windows, furniture, and joinery, which are also an important source of jobs. In addition to expanding the industrial sector, the benefits of value addition related to forest products in Africa include green jobs, food secu-rity, income generation, increased export earn-ings, and improved livelihoods.
Integrate AfricaForest products can be a strategic resource for trade and regional integration in Africa, where some countries are forest-rich and others are not. For example, most African countries that import large amounts of timber from Cameroon, Congo, DRC, and Gabon have less than 10 per-cent of their lands covered by forests. Some 26 percent of the population live in the 12 least forested countries in Africa, with a total forest cover of about 1.5 percent. Thus, a large part of the African population must meet their timber needs from elsewhere. Côte d’Ivoire, Ghana, and South Africa export their timber products to some 30 other African countries, accounting for 13–30 percent of the share of intra-African timber trade. For countries in Central Africa such as Cameroon, the Central African Republic, DRC, and Gabon, the number of intra-African partner countries and market shares is smaller but none-theless important. This suggests opportunities for expansion of timber trade for the forest-rich coun-tries in Central Africa.
Improve the quality of life for the people of AfricaForest products and services contribute to the overall well-being of the African people by furnish-ing income, housing, cultural integrity, biodivers-ity conservation, sanitation, health services, and ecosystem services (including micro-climates due to shelterbelts, pollination of agricultural crops, watershed protection, and erosion and sedimen-tation controls). Forest resources also serve as subsistence safety nets, a fallback resource in

R E A L I z I N G T H E F o R E S T S E C To R ’ S P oT E N T I A L F o R S U S TA I N A B L E A N D I N C L U S I v E D E v E Lo P M E N T 21
Forest products can be a strategic resource for trade and regional integration in Africa
lean times or when crops fail, and as gap fillers for low-income residents, who make a little cash from forest products managed or cultivated as a side-line. Forest resources can also help lift households out of poverty by providing a source of permanent income, assets, and services (Mayers 2007).
More than 1.6 billion people in the world depend on forest resources for their livelihoods. of these, 1.2 billion people live in developing coun-tries and use forests to generate food and income (Dubois 2003). About 80 percent of people in developing countries use forest products daily, and about 75 percent of poor people in rural areas depend on forests for subsistence, agricul-ture, employment, and related income generation activities (IFAD 2004). Forestry is associated with food production through its direct contributions to subsistence food production, as a source of sup-plemental animal protein, and as a habitat for a variety of wild plants.
Forestry makes a large contribution to GDP and employment in most African countries. For example, the forest products industry in South Africa contributes some 9 percent to manu-factured exports, earns net foreign exchange of approximately 8.8 billion rand, and employs 170,000 people (Republic of South Africa 2012). In Sudan, export earnings from gum Arabic alone totaled $134.2 million in 2013, about 17 percent of Sudan’s exports, while employment across the gum belt totaled 5–6 million people (Mahmoud 2015). The Congo Basin forests of Central Africa contribute up to 18 percent of GDP to the Cen-tral African Republic and 20 percent to the foreign exchange earnings of Cameroon (Tieguhong and Ndoye 2007).
overall, forest rents contributed at least 5 per-cent over 2005–15 to the GDP of 21 African coun-tries with substantial forests — and 16 percent or more to the top six countries. Forest rents con-tributed 32 percent of GDP in Liberia, 23 percent in Burundi, 19 percent in DRC, and 17 percent in Ethiopia.
Proceeds from the sale of forest products enable local people to purchase basic necessities, including medicines and staple foods to diversify their diets, while herbal medicines gathered from forests provide health benefits as well.
PROCESSING WOOD TO PROMOTE COMPETITIVENESS AND ECONOMIC DIVERSIFICATION
The forest sector in Africa is not homogeneous. Upstream there are multiple species of trees (such as ayous, okoume, and sapelli), producers (arti-sans, small and large companies), and products (logs, sawnwood, plywood, veneers). Downstream there are multiple markets (domestic, regional/continental, international), applications (construc-tion, pulp, furniture, energy), and procedures for transforming forest products.
Such extensive upstream and downstream diversity, poor integration among them, and gen-erally weak infrastructure and coherence between links in the value chain from timber production to the various value-added improvements contribute to the poor economic performance of the sector in Congo Basin countries, despite the wealth of forest resources. However, the opportunities pre-sented by the Congo Basin forests and related processing industries are so large that it is essen-tial to ensure coherence between upstream and downstream segments, actors, actions, and policies by integrating the various upstream and downstream elements.
Past assessments of the sector have revealed gaps and missed opportunities and noted the urgency imposed by population growth and the economic vulnerability resulting from exces-sive reliance on nonrenewable oil and mining resources. It is time for a new analysis that eval-uates the main challenges to transformation of the Congo Basin forest sector into a sustainable source of diversification, economic resilience, and green and inclusive growth. This analysis must also consider cross-regional dimensions and ways of broadening and integrating national and subregional wood markets that are still little devel-oped, if at all.
Current forestry codes are an obstacle to better cohesion in the sector and optimization of upstream and downstream exploitation of the forest wood sector. The codes have resulted in a set of management obligations oriented toward preserving national heritage or industrialization

22 R E A L I z I N G T H E F o R E S T S E C To R ’ S P oT E N T I A L F o R S U S TA I N A B L E A N D I N C L U S I v E D E v E Lo P M E N T
Gabon and Equatorial Guinea
have set minimum processing rates at 100 percent, Congo at 85 percent, and
Central African Republic and DRC
at 70 percent
rather than integrating all the ecosystem, eco-nomic, environmental, cultural, and social dimen-sions of sustainable forest management. Consid-eration of environmental impacts notably involves challenges linked to climate change. If develop-ment of the forest wood sector is to be a source of sustainable growth, an upstream vision of the forest centered on the natural and societal good of preservation must be reconciled with a down-stream vision centered on the economic uses and enhancement of wood.
Slow progress by Congo Basin countries in developing value-added wood production has led several governments to limit log exports to encour-age the domestic processing of wood. Gabon and Equatorial Guinea have set minimum processing rates at 100 percent, Congo at 85 percent, and Central African Republic and DRC at 70 percent.
Despite these measures, the sophistication and quantity of wood processing have changed little. Processing capacities remain limited to pri-mary processing (sawing timber, debarking, cut-ting for plywood and veneer), and most of the processing is done by informal firms and artisanal workers, with very little investment or industrial added value (FAo, ITTo, and ATIBT 2013). The resulting poor quality products are not competitive in international or even regional markets and are sold mainly in local, often informal markets, which results in tax losses as well as forgone opportuni-ties to promote economic and job growth.
Demand for woodWith the local market supplied mostly by the arti-sanal sector, large industrial operators have only a marginal share of domestic markets, with a few notable exceptions, such as the plywood sector in DRC. The regional and continental market in trop-ical wood from Congo Basin forests is also highly undeveloped. Large industrial companies in the formal wood industry engage mainly in exporting logs and semi-processed products (sawn timber).
The main destinations for timber exports from Congo Basin countries are the European Union and Asia. Asian countries accounted for about 60 percent of export volume in the market for tropical wood (especially sawn timber) from the Congo Basin over 2005–08 and for 70 percent in 2009, and that market should continue to grow
(oFAC 2012). Chinese imports of logs and sawn timber fell somewhat in 2012 before recovering in 2013 as sales of commercial buildings, a major engine of demand for millwork and office furni-ture, increased in 2012 (ITTo 2013). Meanwhile, the European market is tightening as a result of ethical and efficiency constraints linked to the new European Union Timber Regulation, which came into effect in March 2013 and concentrates on a few species.
Supply of woodThe large operators dominating wood production in the Congo Basin are mostly industrial compa-nies working with foreign capital. Although the leading companies are still European, Asian cor-porations are gaining a foothold in the Congo Basin forests.4 Asia, as both an increasingly pow-erful investor and an expanding market, can play a leading role in developing wood resources in the Congo Basin.
With international demand likely to continue to grow, especially in Asia, everything on the supply side indicates negligible risk of surplus production of tropical wood from Congo Basin countries in the years ahead. In all the basin countries except DRC, most productive forests have already been allocated to producers, and many have already been exploited or even overexploited. Most of the remaining exploitable forests are located in remote areas, greatly increasing the costs of production and reducing its profitability. Finally, better forest management methods seem likely to reduce the unrestrained production practices of the past.5
Despite the positive commercial outlook for the market, the substantial value of the wood, and the progress achieved in sustainable forest manage-ment, Congo Basin countries remain small actors in international wood production. Wood produced in Central Africa accounts for less than 3 percent of world topical roundwood production, far behind Asia-Pacific and Latin America (oFAC 2012). Cen-tral Africa’s share of processed wood trade is even smaller. Competition may also increase, as numer-ous large industrial plantations in Asia and Latin America reach maturity and as producers and buyers turn to nontropical species and replace-ment materials. However, exploitation of the wide

R E A L I z I N G T H E F o R E S T S E C To R ’ S P oT E N T I A L F o R S U S TA I N A B L E A N D I N C L U S I v E D E v E Lo P M E N T 23
Improving the sector’s efficiency requires better integrating the sector, to harmonize various upstream and downstream elements
range of inadequately commercialized secondary species, in which Congo Basin countries have a measurable advantage, especially in regional markets, offers ready opportunities. Investment in modernizing secondary and tertiary process-ing capacities could generate greater added value and more jobs from existing forest resources and exploit regional demand for quality furniture.
POLICY RECOMMENDATIONS FOR THE FORESTRY AND WOOD SECTOR
Despite rich forestry resources, the sector has had mediocre economic performance and has made only meager contributions to the economic devel-opment of Congo Basin countries. This is largely because of upstream and downstream heteroge-neity, weak integration, and inadequate infrastruc-ture and coherence between links in the value chain for wood. The sector’s poor upstream inte-gration also impairs environmental performance downstream, particularly related to impacts on climate change.
Improving the sector’s efficiency requires better integrating the sector, to harmonize various upstream and downstream elements. Smooth articulation between upstream and downstream elements of the wood industry is also key to the development challenge of turning the sector into a sustainable source of economic diversification and resilience and of inclusive and equitable green growth.
Achieving these development objectives requires attention to the sector’s components and to the network of relationships connecting them upstream and downstream. Implementation of sustainable management upstream must take into account the importance of green growth down-stream (balance among markets and species, niche products for greater competitive advantage and maximized economic and financial profit-ability). Integration of the various elements in the forest wood sector value chain must also con-sider social equity and inclusion to ensure that downstream green growth contributes not only to poverty reduction but also to lessening risks of instability and fragility arising from the attempts by
clientelist groups to wrest control over the income from these natural resources.
Ensure transparency in procurement transactionsA major difficulty in communication between upstream and downstream actors is that it often occurs in a context where the seller has no knowl-edge of the final uses of the product. Effective marketing requires adequate data on product specifications. That promotes optimal economic returns for forest product producers (upstream) while taking account of the needs of manufac-turers (downstream). These links need to be rein-forced in both forest exploitation and the sawn timber industry, in particular through formal con-tracts that offer greater visibility in the organization of work and purchasing. In order to raise prices and the quality competitiveness of local compa-nies, supply mechanisms for downstream indus-tries, and consequently the valorization of forest potential, will also have to be improved by cen-tralizing management of wood supply, moderniz-ing transactions based on formal contracts, and improving forest infrastructure services.
Any new policy for developing the forestry sector efficiently must meet the needs of all market participants. In particular, downstream actors must be able to protect their markets from information asymmetries that would undermine their economic performance. The need for infor-mation is equally important for upstream actors, whose management goals must be based on detailed knowledge of available resources, down-stream needs, and market conditions.
Develop local companies for processing and valorizing woodLong neglected, the artisanal sector is now being recognized as a vital part of forestry develop-ment.6 The artisanal sector is a larger downstream source of direct and indirect local employment than the formal sector, and its benefits are dis-tributed more equally at the local level. The links between international companies, local small and medium-size enterprises (SMEs), and the artisanal sector need to be strengthened. For example, wood drying could be subcontracted to SMEs involved in forest exploitation. More broadly,

24 R E A L I z I N G T H E F o R E S T S E C To R ’ S P oT E N T I A L F o R S U S TA I N A B L E A N D I N C L U S I v E D E v E Lo P M E N T
Reforms should ensure equity in the distribution
of the dividends derived from the
exploitation of the sector’s resources
governments could establish a program of incen-tives and other public support to encourage eco-nomically profitable, ecologically sustainable, and socially equitable and inclusive integrated man-agement of the forestry sector.
Introduce participatory planning in the use of landCurrent land tenure systems in Congo Basin countries do not encourage sustainable forestry management. Forests are considered free-access areas that belong to the state. But land legisla-tion in most Congo Basin countries establishes a direct link between promoting forests and recog-nizing land ownership, thus encouraging people to transform forested land into agricultural land, to gain title. New legislation is needed to disas-sociate recognition of land ownership from forest clearance. Adopting the principles of participatory planning in the use of land could help maximize economic and environmental goals and reduce problems arising from overlapping land use titles and conflicting land uses. Such a process could identify forest areas for preservation, areas that can co-exist with other uses, and areas that can be exploited. New legislation should be based on sound socioeconomic analysis, close coordi-nation between ministries, and arbitration of land disputes at the highest level.
Strengthen institutional capacities and governanceFor land development and land reform to bring about real change will require strong institutions for planning, monitoring, and controlling forest resources and forging alliances within a complex political economy. Strong institutions are neces-sary to prevent illegal activities and to undertake the difficult task of formalizing artisanal wood production, the value chain for fuelwood and charcoal, and artisanal exploitation in critical eco-systems. Public administrations must also have access to new technologies (based on geographic and data management systems) so that informa-tion systems and regulations are supported by data. To understand the challenges involved in developing the forest product value chains and to draw maximum benefit from sustainable use of wood resources, Congo Basin governments
need a clear understanding of the relationships between transparent and accountable gover-nance and the capacities of forestry institutions, certification of compliance with ethical standards and those of origin,7 and valorization of products. Dealing appropriately with these issues is particu-larly important for access to the European market, one of the two main export outlets for Congo Basin countries.
Emphasize equity and inclusiveness in downstream green growthThe ultimate goal for developing the wood indus-try in the Congo Basin is green growth that becomes a downstream source of economic development reducing poverty and lowering the risk of monopolization of benefits by a clientelist minority. Reforms should ensure equity in the distribution of the dividends derived from the exploitation of the sector’s resources, with par-ticular attention to impacts on vulnerable popula-tions living in exploitation areas. A related goal is to avoid conflicts between operators and popula-tions in these areas, such as those experienced in oil and mining exploitation areas in other coun-tries in Africa.
The gap between traditional decision- making processes at the village and community levels and decision- making at the national level can be a serious source of conflict between the central government and local communities. Acknowl-edgement of the population’s traditional values and expertise can contribute to the sustainable management of Congo Basin forest resources, including conservation of its rich fauna and flora, which may become an income-generating tourist attraction.8
Access rights of local populations to natural resources are receiving new attention from Congo Basin governments. Most forestry codes include provisions to increase participation by local pop-ulations in planning and implementing commer-cial exploitation and sharing the benefits. These efforts should be intensified and consolidated. For example, some forest management plans now recognize the usage rights of local populations. Similarly, countries are developing mechanisms for the redistribution of tax revenues from forest concessions to local populations.9
R E A L I z I N G T H E F o R E S T S E C To R ’ S P oT E N T I A L F o R S U S TA I N A B L E A N D I N C L U S I v E D E v E Lo P M E N T 25
The wood industry could constitute a significant source of skilled jobs
Promote intraregional cooperation and coordinationoptimal development of the wood industry requires a regional approach that accounts for the complexity and cross-border characteristics of ecosystems and regional and continental mar-kets. of the more than $4 billion in wood products imported by African countries, only 10 percent come from other African countries. With a popu-lation of more than 1 billion, 400 million of whom live in villages, Africa will have high demand for wood products, especially for house construction. The wood industry could constitute a significant source of skilled jobs. In particular, the grow-ing markets of the large wood-consuming Afri-can countries, such as Egypt, Kenya, Morocco, Nigeria, and South Africa, whose standards are less demanding than those of European and Asian markets, offer considerable opportunities for Congo Basin countries to expand their wood production.10
one step in this direction would be to acceler-ate implementation of the 1999 Yaoundé Decla-ration signed by the heads of state of the Congo Basin countries. This historic declaration and the Convergence Plan that emerged from it, including the Congo Basin Forest Partnership,11 created
a framework for developing common goals in forest conservation and for adopting an integrated and multidimensional regional approach to the development of the wood sector in Congo Basin forests.
Turn the huge carbon reservoir of the basin forest into financial dividendsBecause of its large size, the Congo Basin forest is a carbon reservoir of global significance in regulating greenhouse gases. These forests store approximately a quarter of the total carbon sequestered in the world’s tropical forests, thus mitigating the climate impact of greenhouse gas emissions. Congo Basin countries need to iden-tify ways to realize the large financial dividends from this immense ecological capital, beginning with the auctioning of carbon dioxide quotas in the European carbon market, despite the current difficulties in the market. other sources of inspira-tion can be found in the exchanges of experience and recommendations of the 6th Africa Carbon Forum, in Windhoek in July 2014, co-sponsored by the AfDB, with the goal of identifying ways of supporting Africa’s participation in the global carbon market and other opportunities for green investment.

26 R E A L I z I N G T H E F o R E S T S E C To R ’ S P oT E N T I A L F o R S U S TA I N A B L E A N D I N C L U S I v E D E v E Lo P M E N T
APPENDIX 1. METHODOLOGY FOR EMPLOYMENT ELASTICITY ESTIMATE
The primary concern in our modeling process is the sustainability of job creation, as expressed by the degree of persistence of employment over the years. Hence, assuming that all the dynam-ics could be captured by the first lag, then AR (1) would be specified as:
Lempit = ΦLempit–1 + αi + ε it
In effect, many more exogenous factors con-dition the evolution of employment in Africa. For instance, external demand could be taken as a substitute for domestic demand. Indeed, it is often stated that low domestic demand occurs as a result of declining job opportunities in a given economy (Saget 2000). And a strong international demand could be an important source of job creation. More specifically, openness could offer opportunities for expanding domestic employ-ment, while FDI creates potential sources of job creation. That is especially the case when FDI includes considerable productive investment.
Another important source of employment cre-ation is the financial system, as clearly pointed out in relevant economic literature. The system’s specific channels are credits made available to the private sector. More specifically, if the efficiency of financial institutions could be guaranteed, they would contribute greatly to the development of productive capacities in general and to employ-ment creation in particular. Following Kamgnia
(2009), by using trade index as openness trade and domestic credit of private sector (percent GDP) as exogenous variables with the Log of real GDP our interest variable, we estimate this equation:
Lempit = ∑jΦjLempit–j + ∑
jδjLgdpit–j +
∑jβj tradeit–j + ∑
jγjdcpsit–j + αi + ε it
We use Arellano and Bond’s (1991) method and estimate for 41 African countries (full sample) over 2008–14, dummy of Central African coun-tries is used to estimate just in the local sample of Central Africa. Countries in the full sample are: Algeria, Benin, Botswana, Burkina Faso, Burundi, Cape verde, Cameroon, Central African Repub-lic, Chad, Comoros, Congo, Côte d’Ivoire, Dem-ocratic Republic of Congo, Egypt, Equatorial Guinea, Gabon, Gambia, Ghana, Guinea, Kenya, Lesotho, Liberia, Madagascar, Malawi, Mali, Morocco, Mozambique, Namibia, Niger, Nigeria, Rwanda, São Tomé and Príncipe, Senegal, Sierra Leone, South Africa, Swaziland, Tanzania, Togo, Tunisia, Uganda, zambia.
The employment variable comes from the International Labour organization database; the others come from World Bank (2017).
Short term elasticity = δ0
Long term elasticity = ∑ j δj
1 – ∑ j δj
R E A L I z I N G T H E F o R E S T S E C To R ’ S P oT E N T I A L F o R S U S TA I N A B L E A N D I N C L U S I v E D E v E Lo P M E N T 27
REFERENCES
AfDB (African Development Bank). 2012. “Private Invest-
ment Environment in the Countries of the Economic
Community of Central African States (ECCAS): Con-
straints and Prospects.” Abidjan.
Arellano, M., and S. Bond. 1991. “Some Tests of Speci-
fication for Panel Data: Monte Carlo Evidence and an
Application to Employment Equations.” The Review of
Economic Studies 58 (2): 277–297.
Chang, H-J. 2007. Bad Samaritans: The Myth of Free
Trade and the Secret History of Capitalism. London:
Bloomsbury Publishing.
Dubois o. 2003. “Forest-Based Poverty Reduction: A
Brief Review of Facts, Figures, Challenges and Pos-
sible Ways Forward.” In Forests in Poverty Reduc-
tion Strategies: Capturing the Potential, edited by
T. oksanen, B. Pajari, and T. Tuomasjukka, 65–85.
EFI Proceedings No. 47, European Forest Institute,
Tuusula, Finland.
FAo (Food and Agriculture organization of the United
Nations). 2011. La situation des forêts dans le bassin
amazonien, le bassin du Congo et l’Asie du Sud-Est.
Report prepared for the Sommet des trois bassins
NOTES
1. Such a broad definition clearly oversimplifies the
economic reality. Agriculture can be high- productivity
and high-tech thanks to precision farming, automa-
tion, and genetic engineering. Similarly, informal
manufacturers or traders can have low productivity
and skills, keeping them small and inefficient.
2. Employment data for Africa tend not to include the
informal sector.
3. The timber sector is still the second largest employer
in Gabon, Central African Republic, and Congo. IMF
2012.
4. For a number of years, the industry leader has been
the French Rougier Group, which in 2010 com-
pleted the development of almost 2 million hect-
ares of concessions. other European companies
include IFB (France), CEB Precious Wood (Switzer-
land), SoFoRMA Group (Portugal), and Pallisco
(France). The next three largest groups, all from
Asia, are vicwood (China), Taman and Rimbunan
Hijau (Malaysia), and the olam Group (Singapore),
which has just purchased Timber International from
the DLH group (with forest and industrial assets in
the Republic of the Congo and Gabon). Sources:
Karsenty 2016; oFAC (observatoire des Forêts
d’Afrique Centrale); and SEPBG (Société d’exploita-
tion des parcs à bois du Gabon).
5. While this will reduce the areas that can really be
exploited, it will also limit the volume that can be
extracted per hectare by increasing the minimum
felling diameter and protecting seed-tree reserves
and certain endemic species.
6. In Cameroon and Congo, informal wood production
already surpasses formal production; in Congo, it
represents over 30 percent of total national produc-
tion (Lescuyer et al. 2012).
7. The Action Plan for the European Union’s Forest
Law Enforcement, Governance, and Trade (FLEGT)
prohibits the sale of illegally harvested wood in the
EU market and requires operators to show proof
of due diligence when placing forest products on
the market. Furthermore, the voluntary Partnership
Agreements (vPAs) negotiated between the EU and
producer countries (in the context of FLEGT) require
that the supply of wood be from legal harvesting.
8. Unlike the still-underdeveloped ecotourism industry,
hunting tourism in forests manages to reconcile and
accommodate the requirements of economic devel-
opment with the goals of biodiversity conservation.
9. Successful win-win partnerships between oper-
ators and communities in other African countries
where natural resources are exploited could serve as
models, such as the support program village com-
munities in the bauxite and gold exploitation areas in
Guinea.
10. A preliminary analysis of trends in the demand for
wood and wood products and market opportunities
in consumer countries could be carried out, to be
expanded in the context of future studies.
11. The United States, South Africa, and 27 public and pri-
vate partners launched the Congo Basin Forest Part-
nership in September 2002 during the Earth Summit
on Sustainable Development held in Johannesburg.

28 R E A L I z I N G T H E F o R E S T S E C To R ’ S P oT E N T I A L F o R S U S TA I N A B L E A N D I N C L U S I v E D E v E Lo P M E N T
forestiers tropicaux. Brazzaville, Republic of Congo,
May 31–June 3, 2011. Rome: FAo.
FAo (Food and Agriculture organization of the United
Nations), ITTo (International Tropical Timber orga-
nization), and ATIBT (International Technical Tropical
Timber Association. 2013. “Towards a Development
Strategy for the Wood Processing Industry in the
Congo Basin.” White Paper. http://www.fao.org/
forestry/39002–010ec7dd5c210472033dbaed89c
73abb9.pdf
IFAD (International Fund for Agricultural Development).
2004. Commerce et développement rural: Enjeux et
perspectives pour les ruraux pauvres. Rome.
IMF (International Monetary Fund). 2012. “Republic of
Congo: Poverty Reduction Strategy Paper.” Country
Report 12/242. August. Washington, DC.
ITTo (International Tropical Timber organization). 2013.
Tropical Forest Update 26 (4). http://www.itto.int/tfu/
Kamgnia, D.B. 2009. “Growth Intensity of Employment in
Africa: A Panel Data Approach.” Applied Economet-
rics and International Development 9 (2): 161–174.
Karsenty, A. 2016. “The Contemporary Forest Conces-
sions in West and Central Africa: Chronicle of a Fore-
told Decline?” Forestry Policy and Institutions Working
Paper 34. Food and Agriculture organization of the
United Nations, Rome.
Lescuyer, G., P.o. Cerutti, E.E. Mendoula, R. Eba’a Atyi,
and R. Nasi. 2012. “An Appraisal of Chainsaw Milling
in the Congo Basin.” In State of the Forests. Luxem-
bourg: Publications office of the European Union.
Mahmoud, T.E. 2015. “Potentials of NWFPs for value
Chain Development, value Addition and Development
of NWFPs-Based Rural Microenterprises in Sudan.”
Consultancy Report, FAo Regional office for Near
East and North Africa, Cairo, Egypt.
Mayers J. 2007. “Forests and the Millennium Develop-
ment Goals: Could Do Better.” ETFRN News 47–48
(07): 7–14.
McMillan, M., and D. Rodrik (2011) “Globalization, Struc-
tural Change, and Productivity Growth.” In M. Bac-
chetta and M. Jansen, eds., Making Globalization So-
cially Sustainable. Geneva: International Labour office
and World Trade organization.
oFAC (L’observatoire des Forêts d’Afrique Centrale).
2012. Etat des Forêts 2010 : Les forêts du bassin du
Congo. Luxembourg: Publications office of the Euro-
pean Union.
Republic of South Africa. 2012. “A Profile of the South
African Forestry and Wood Products Market value
Chain: Directorate Marketing.” Pretoria, South Africa:
Department of Agriculture, Forestry and Fisheries.
Saget, C. 2000. “Can the Level of Employment be Ex-
plained by GDP Growth in Transition Countries? (The-
ory versus the Quality of Data).” Review of Labour
Economics and Industrial Relations 14 (4): 623–643.
Tieguhong J.C., and o. Ndoye. 2007. “The Impact of
Timber Harvesting in Forest Concessions on the Avail-
ability of Non-Wood Forest Products (NWFP) in the
Congo Basin.” FAo Forest Harvesting Case Study 23,
FAo, Rome.
UNCTAD (United Nations Conference on Trade and De-
velopment). 2017. UNCTADstat [database]. Gene-
va. http://unctadstat.unctad.org/wds/Tableviewer/
tableview.aspx.
UNIDo (United Nations Industrial Development organiza-
tion). 2014. Inclusive and Sustainable Industrial Devel-
opment: Creating Shared Prosperity, Safeguarding the
Environment. vienna: UNIDo.
World Bank. 2017. World Development Indicators [data-
base]. Washington, DC. Available at: https://data.
worldbank.org/data-catalog/world-development
-indicators


This Central Africa Economic Outlook analyzes the recent economic
situation and prospects for the region. Part I focuses on the evolution of
key macroeconomic indicators, including GDP growth, inflation, fiscal and
current account balances, terms of trade, employment, and inequality. It
also assesses short- and medium-term economic prospects based on
key economic fundamentals, including structural and policy factors. In
addition, it investigates employment generation, looking in particular at
whether growth has created jobs and reduced poverty and inequality.
Part II focuses on development of the huge forest and timber
resources in the Congo Basin, which could be an important driver
of diversification, economic resilience, and green growth for the
six countries in the basin. Inclusive and sustainable development
of the sector can also reduce the vulnerability to external shocks
linked to commodity price volatility that results from Central
African countries’ heavy reliance on nonrenewable oil and
mineral resources.
African Development Bank GroupAvenue Joseph Anoma01 BP 1387 Abidjan 01
Côte d’Ivoirewww.afdb.org