Embed Size (px)
Citation preview
Center for Water and Environmental Sustainability(CWESt)
Annual Technical Report FY 2004
IntroductionIn 2004, Oregons Center for Water and Environmental Sustainability (CWESt) focused efforts on threeprograms:
1) The Water Resources Program administers interdisciplinary and multi-agency watershed education andwater resources research programs in Oregon and the Pacific Northwest.
2) The Groundwater Cleanup and Hazardous Substance Outreach Program studies public perceptions ofcleanup strategies and provides information to communities affected by hazardous waste sites andgroundwater contamination.
3) The Sustainable University Program promotes and facilitates a wide range of interdisciplinary research,information dissemination, and project and agency coordination related to natural resources andenvironmental sustainability.
During FY 2004 the Center for Water and Environmental Sustainability (CWESt) program includedseveral new research and information transfer projects funded by the USGS 104B program.
CWESt also sponsored and/or participated in a wide variety of educational and outreach activitiesincluding numerous conferences and workshops, the Fall Water Resources Seminar Series, the graduateminor in water resources, research internships for undergraduate and graduate students, and educationalwebsites.
Research ProgramFor Fiscal Year 2004 CWESt supported projects examining operation and maintenance of nanofiltrationmembranes, the role of fire in watersheds, integrating science with policy within a small watershed, andaggregate production along Oregon rivers. CWESt sought projects that were interdisciplinary and practicalto the planning, use, and future development of water and water-related resources.
Satellite Remote Sensing of Wildfire Induced Changes inHydro-Geomorphological Landscape Patterns and Processes
Basic Information
Title: Satellite Remote Sensing of Wildfire Induced Changes inHydro-Geomorphological Landscape Patterns and Processes
Project Number: 2004OR45B
Start Date: 2/15/2004
End Date: 2/14/2005
Funding Source: 104B
Congressional District: Oregon 5th
Research Category: None
Focus Category: Geomorphological Processes, Hydrology, Sediments
Descriptors: None
Principal Investigators: Stephen Schoenholtz
Publication

Start Date:15 February 2004 End Date: 14 February 2005 Title: Satellite Remote Sensing of Wildfire-Induced Changes in Hydro-Geomorphological Landscape Patterns and Processes Focus Category: Geomorphological Processes, Hydrology, Sediments Principle Investigator: Dr. Stephen H. Schoenholtz, Associate Professor, Department of Forest Engineering, Oregon State University, 267 Peavy Hall, Corvallis, OR 97331-5706 Telephone: (541) 737-9112; Fax: (541) 737-4316 Congressional District: Oregon 5th Abstract:
Severe wildfires result not only in dramatic changes in vegetation cover, but also can induce significant changes in hydro-geomorphology. These changes may include decreased infiltration, increased overland flow, increased soil erosion, and debris-flow initiation during post-fire storm events. A number of variables (e.g., fire severity) have been identified that can lead to increased erosion activity and subsequent changes in geomorphic features; however, present methods of characterizing these variables within burned basins may be both time-consuming and labor-intensive. Satellite remote sensing holds great potential for rapid assessment of these variables. This research proposed to use data from the Moderate resolution Imaging SpectroRadiometer (MODIS) and the Advanced Spaceborne Thermal Emission and Reflection Radiometer (ASTER) to map and characterize burn-induced erosion variables at multiple spatial scales on sites exposed to wildfires in Oregon. A second goal of this project was to quantify wildfire-induced changes in vegetation and soils of humid forested landscapes and correlate these changes with changes in stream-discharge Problem and Research Objectives:
One goal of the project was to adapt the methods of Key and Benson’s (1999) Landsat-based change-detection algorithm, i.e., delta Normalized Burn Ratio (dNBR) to data and imagery derived from the Advanced Spaceborne Thermal Emission and Reflection Radiometer (ASTER). dNBR is presently used with pre- and post-fire Landsat imagery to quantify wildfire-induced changes in landcover, particularly wildfire-induced changes in vegetation and soil. These burn-severity maps, e.g., Burned Area Reflectance Component (BARC) maps, are presently used to by USFS Burned Area Emergency Rehabilitation (BAER) teams to help identify flood and landslide risks in burned basins. ASTER has improvements in spectral and spatial resolution over Landsat that could offer increased accuracy of the dNBR. ASTER-derived dNBR and BARC burn-severity mapping could assist BAER teams.
A second goal of this project was to quantify wildfire-induced changes in vegetation
and soils of humid forested landscapes and correlate these changes with changes in stream-discharge, e.g., quickflow. Wildfires with high burn severity often destroy canopy and surface vegetation and alter soil properties such as organic-matter content, structure, water-repellency, and infiltration capacity. These wildfire-induced changes in vegetation and soil affect the water-balance of the basin (Equation 1):
P + Gin – (Q + ET + Gout) = ∆S [1]
where P is gross precipitation, Gin is groundwater inflow, Q is stream discharge, ET is evapotranspiration, Gout is groundwater outflow, and S is storage, all in cubic units of measure, e.g., m3.
In particular, interception storage, evapotranspiration magnitude, and infiltration rates
decrease immediately after wildfire. Thus, during times of normal precipitation regime, runoff increases are often observed following wildfire. Changes in soil infiltration capacity may also affect the mode of storm-runoff generation. For example, Horton overland flow, as opposed to saturated overland flow, may occur more frequently on (wildfire-induced) de-vegetated and water-repellent hillslopes.
Changes in the ratio of runoff to precipitation (Rp) are correlated with changes in the
contributing (source) area of the basin (Equation 2):
Rp = V / P [2]
where V = quick-flow in units of depth (e.g., mm) and P = gross precipitation (mm). Thus, changes in the areal extent of vegetation as depicted in BARC imagery are correlated with changes in Rp. Methods, Procedures, and Facilities: Study Site 2003 B&B Complex Fire
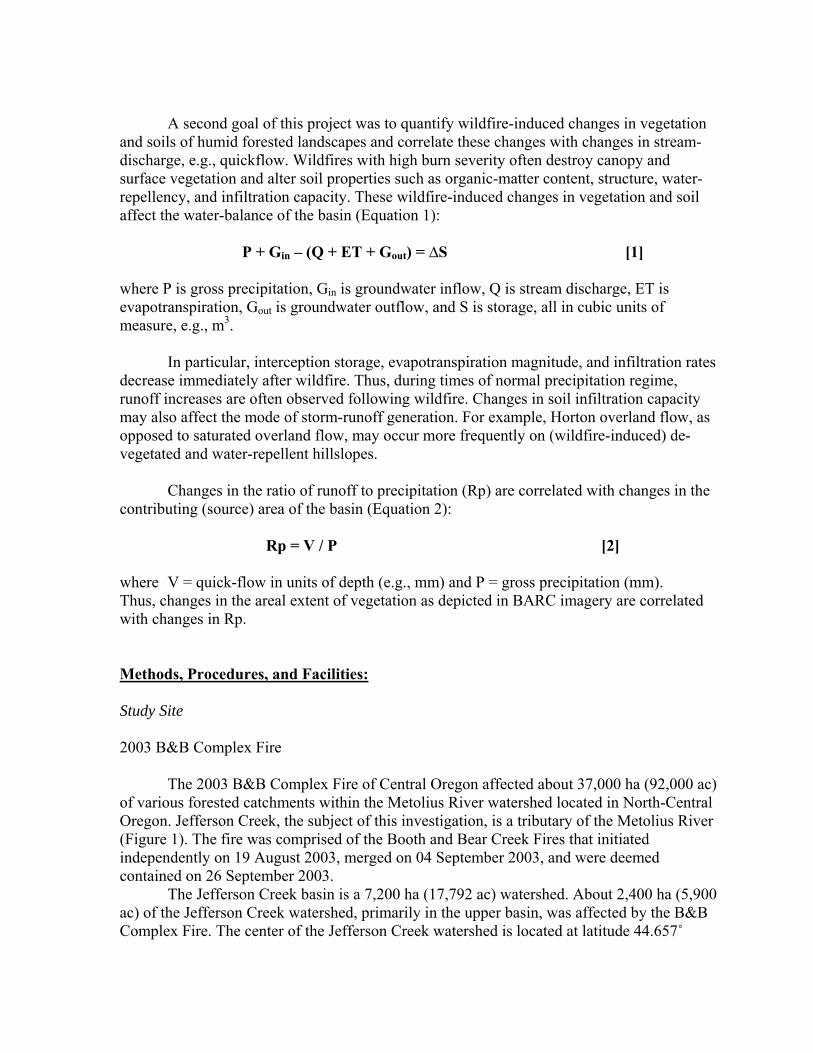
The 2003 B&B Complex Fire of Central Oregon affected about 37,000 ha (92,000 ac) of various forested catchments within the Metolius River watershed located in North-Central Oregon. Jefferson Creek, the subject of this investigation, is a tributary of the Metolius River (Figure 1). The fire was comprised of the Booth and Bear Creek Fires that initiated independently on 19 August 2003, merged on 04 September 2003, and were deemed contained on 26 September 2003.
The Jefferson Creek basin is a 7,200 ha (17,792 ac) watershed. About 2,400 ha (5,900 ac) of the Jefferson Creek watershed, primarily in the upper basin, was affected by the B&B Complex Fire. The center of the Jefferson Creek watershed is located at latitude 44.657˚
North, and longitude 121.738˚ West; elevation ranges from 2,195 to 1,463 m (7,200 to 4,800 ft). The Jefferson Creek watershed is gauged by USGS streamgaging station 14090350 Jefferson Creek located at River Mile 1.3 (i.e., 1.3 mi upstream from the mouth of Jefferson Creek (Figure 1)). A substantial portion of the Jefferson Creek watershed is located on Tribal lands of the Confederated Tribes of the Warm Springs Indian Reservation. Precipitation and Stream-Discharge Data Precipitation Because there are no precipitation gauges located within the Jefferson Creek watershed, precipitation was characterized using data queried from the Oregon Climate Service’s Spatial Climate Analysis Service (SCAS) internet-based data explorer. SCAS uses the Parameter-elevation Regression on Independent Slopes Model (PRISM) (Taylor et al., 1993) to derive precipitation data for a specific time and location. PRISM data have a one-month temporal resolution. The watershed is subdivided into three areally equivalent sectors. Monthly PRISM precipitation estimates are acquired for the center of each sector, i.e., centroid, and a mean value is derived. Mean monthly precipitation for the Jefferson Creek watershed is composed of the arithmetic mean of these three centroid points.
Figure 1. Location of Jefferson Creek and Whitewater River in Central Oregon. Watershed boundaries are delineated by red lines. Stream network is shown by blue
lines. Additional precipitation data were acquired from Remote Automated Weather Station (RAWS) and SNOw TELemetry (SNOTEL) climate data networks. Precipitation data were
Metolius River
obtained from the Western Regional Climate Center’s Internet-based data library. Both RAWS and SNOTEL have daily precipitation (and in some instances hourly) data.
PRISM precipitation estimates are based, in part, on data acquired from other climate
data networks, e.g., RAWS, SNOTEL. As such, the accuracy of the PRISM precipitation estimates is related to the precision and accuracy of the precipitation gauges comprising the original climate data network, e.g., SNOTEL. Nearby SNOTEL precipitation gauges, e.g., Santiam Junction, OR, cumulatively record precipitation to the nearest 0.01 inch during the water year (01 Oct to 30 September). However, there are instances where the cumulative-precipitation-total decreases for short time periods; this is likely related to equipment malfunction. Precipitation measured at SNOTEL stations probably represents approximately 90 percent of the true precipitation values. Stream Discharge
Mean daily streamflow data for Jefferson Creek (15 September 1983 through 31 January 2005) were acquired from the USGS National Water Information System (NWIS) NWISWeb Internet server. The entire period of record (up to 31 January 2005) was acquired. Mean daily discharge data are rated as “good” for Jefferson Creek; a rating of “good” indicates that the data are within 10 percent of the true-value. There are no known diversions or impoundments upstream from USGS gaging station #14090350 Jefferson Creek, Oregon. Hydrograph Separation
USGS NWISWeb mean daily discharge data were processed using an Internet-based hydrograph separation program, iSEP. Total streamflow data were divided into both baseflow and “runoff” components; the minimum temporal resolution of the resulting hydrograph separations was one month. iSEP hydrograph separations agree well with manual hydrograph separations using the local-minimum method set forth by Sloto and Crouse (1996). Hydrological Response Ratios
The pre- and post-fire hydrological response ratio (Equation 2), based on the methods of Hewlett and Hibbert (1967), was derived from USGS stream-discharge data and PRISM precipitation estimates. Monthly hydrographs were separated into quickflow and baseflow components using iSEP and the ratio of quickflow to PRISM precipitation estimates comprised the hydrological response ratio, Rp. Burn-Severity Mapping
Wildfire-induced changes in vegetation and soil were mapped using a change-detection algorithm, i.e., the difference Normalized Burn Ratio (dNBR), devised for delineating and quantifying the effects of wildfire on vegetation and soil (Key and Benson, 1999). High burn-severity pixels on these maps indicate severe damage or destruction of
vegetation and changes in soil (Bobbe et al., 2001). The burn-severity mapping method correctly identifies approximately 66 percent of all high burn-severity pixels. Principal Findings and Significance: Goal One:
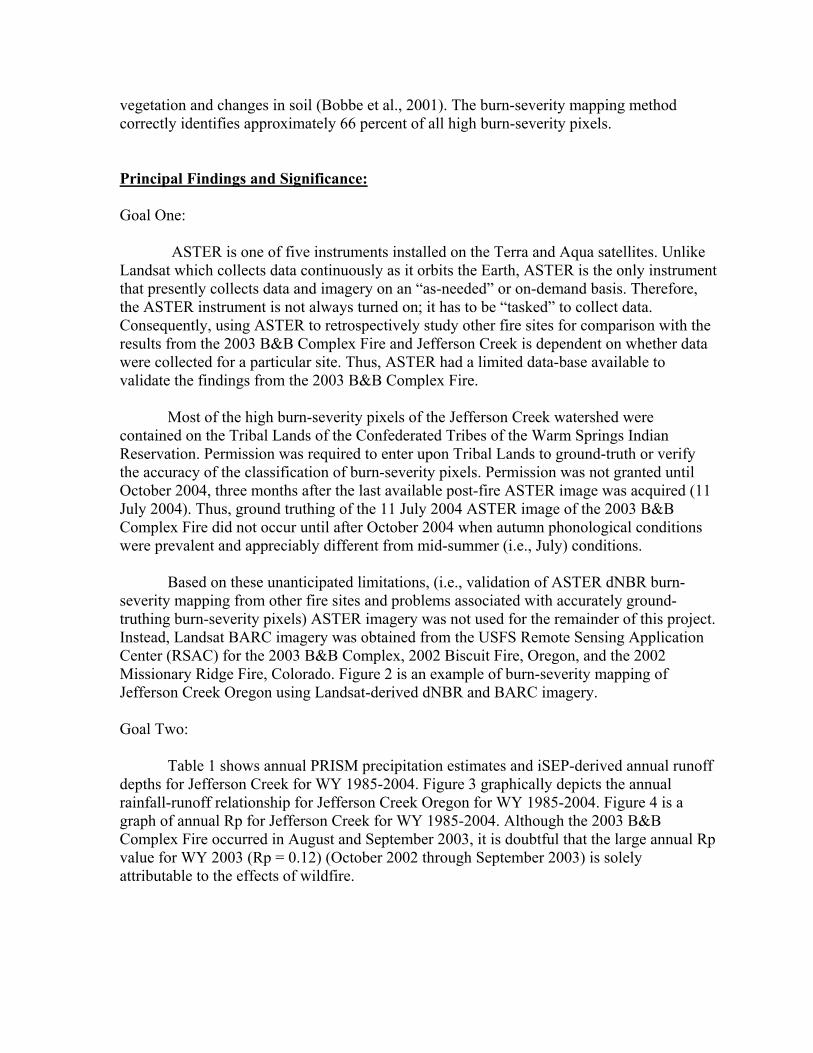
ASTER is one of five instruments installed on the Terra and Aqua satellites. Unlike Landsat which collects data continuously as it orbits the Earth, ASTER is the only instrument that presently collects data and imagery on an “as-needed” or on-demand basis. Therefore, the ASTER instrument is not always turned on; it has to be “tasked” to collect data. Consequently, using ASTER to retrospectively study other fire sites for comparison with the results from the 2003 B&B Complex Fire and Jefferson Creek is dependent on whether data were collected for a particular site. Thus, ASTER had a limited data-base available to validate the findings from the 2003 B&B Complex Fire. Most of the high burn-severity pixels of the Jefferson Creek watershed were contained on the Tribal Lands of the Confederated Tribes of the Warm Springs Indian Reservation. Permission was required to enter upon Tribal Lands to ground-truth or verify the accuracy of the classification of burn-severity pixels. Permission was not granted until October 2004, three months after the last available post-fire ASTER image was acquired (11 July 2004). Thus, ground truthing of the 11 July 2004 ASTER image of the 2003 B&B Complex Fire did not occur until after October 2004 when autumn phonological conditions were prevalent and appreciably different from mid-summer (i.e., July) conditions. Based on these unanticipated limitations, (i.e., validation of ASTER dNBR burn-severity mapping from other fire sites and problems associated with accurately ground-truthing burn-severity pixels) ASTER imagery was not used for the remainder of this project. Instead, Landsat BARC imagery was obtained from the USFS Remote Sensing Application Center (RSAC) for the 2003 B&B Complex, 2002 Biscuit Fire, Oregon, and the 2002 Missionary Ridge Fire, Colorado. Figure 2 is an example of burn-severity mapping of Jefferson Creek Oregon using Landsat-derived dNBR and BARC imagery. Goal Two:
Table 1 shows annual PRISM precipitation estimates and iSEP-derived annual runoff
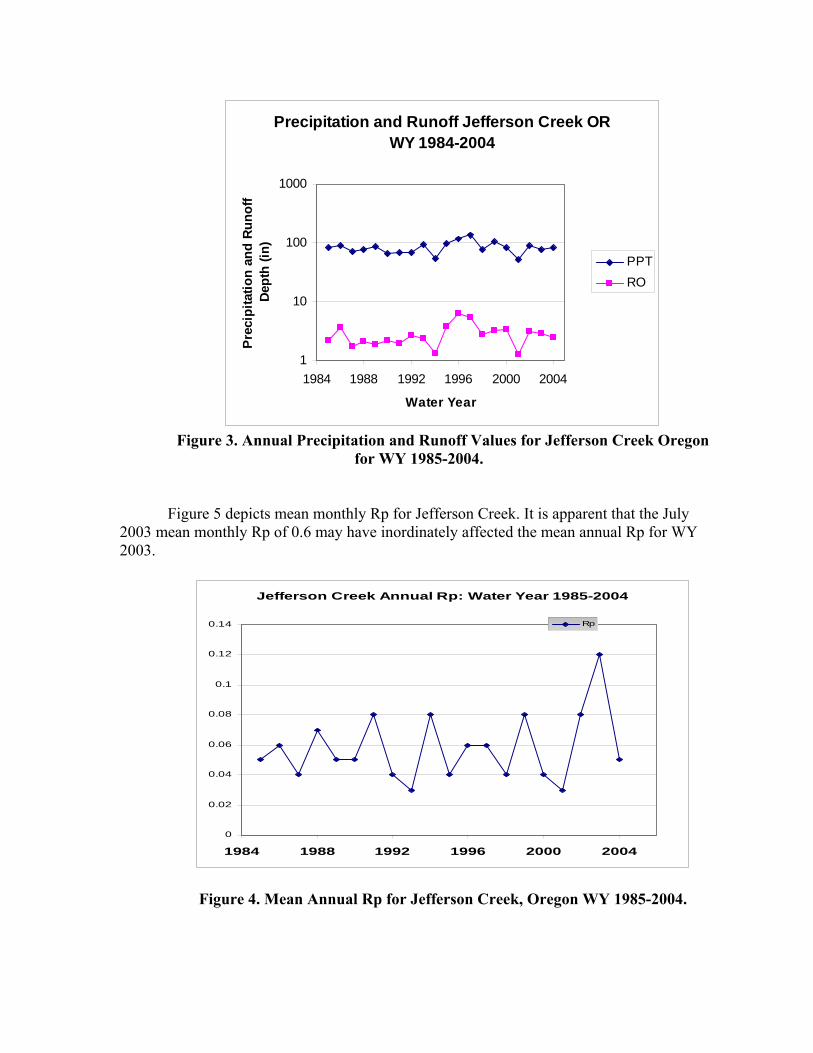
depths for Jefferson Creek for WY 1985-2004. Figure 3 graphically depicts the annual rainfall-runoff relationship for Jefferson Creek Oregon for WY 1985-2004. Figure 4 is a graph of annual Rp for Jefferson Creek for WY 1985-2004. Although the 2003 B&B Complex Fire occurred in August and September 2003, it is doubtful that the large annual Rp value for WY 2003 (Rp = 0.12) (October 2002 through September 2003) is solely attributable to the effects of wildfire.
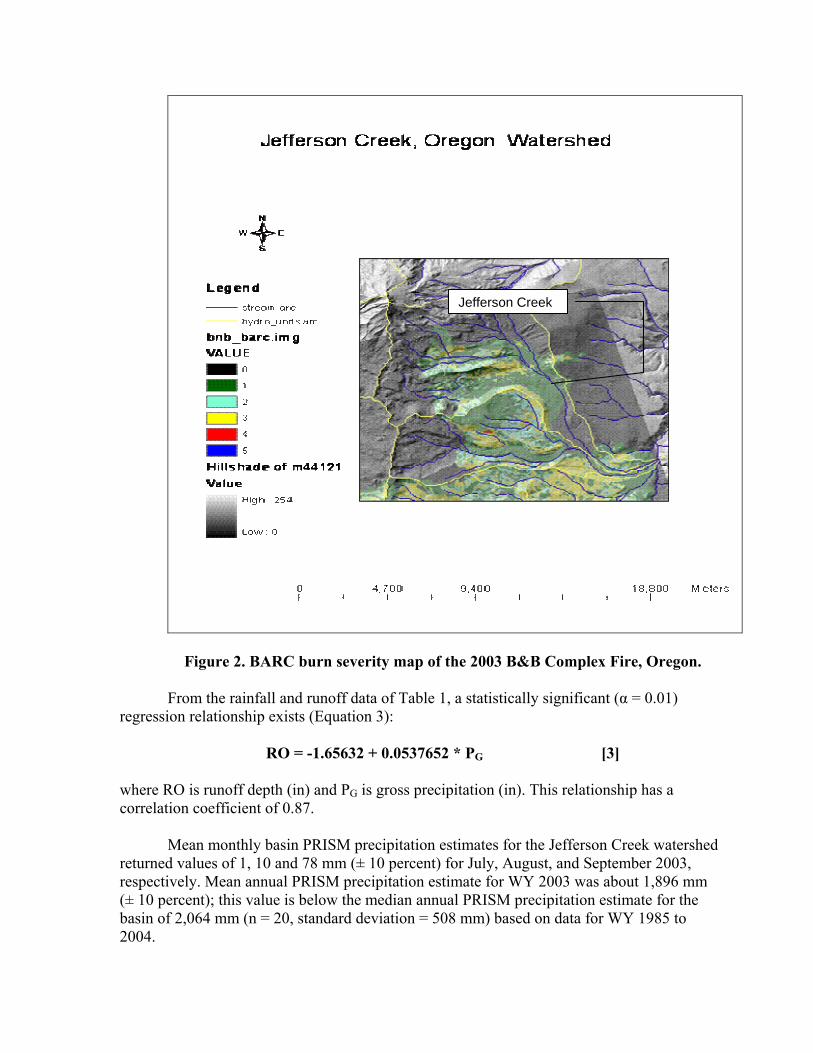
Figure 2. BARC burn severity map of the 2003 B&B Complex Fire, Oregon.
From the rainfall and runoff data of Table 1, a statistically significant (α = 0.01) regression relationship exists (Equation 3):
RO = -1.65632 + 0.0537652 * PG [3]
where RO is runoff depth (in) and PG is gross precipitation (in). This relationship has a correlation coefficient of 0.87.
Mean monthly basin PRISM precipitation estimates for the Jefferson Creek watershed returned values of 1, 10 and 78 mm (± 10 percent) for July, August, and September 2003, respectively. Mean annual PRISM precipitation estimate for WY 2003 was about 1,896 mm (± 10 percent); this value is below the median annual PRISM precipitation estimate for the basin of 2,064 mm (n = 20, standard deviation = 508 mm) based on data for WY 1985 to 2004.
Jefferson Creek
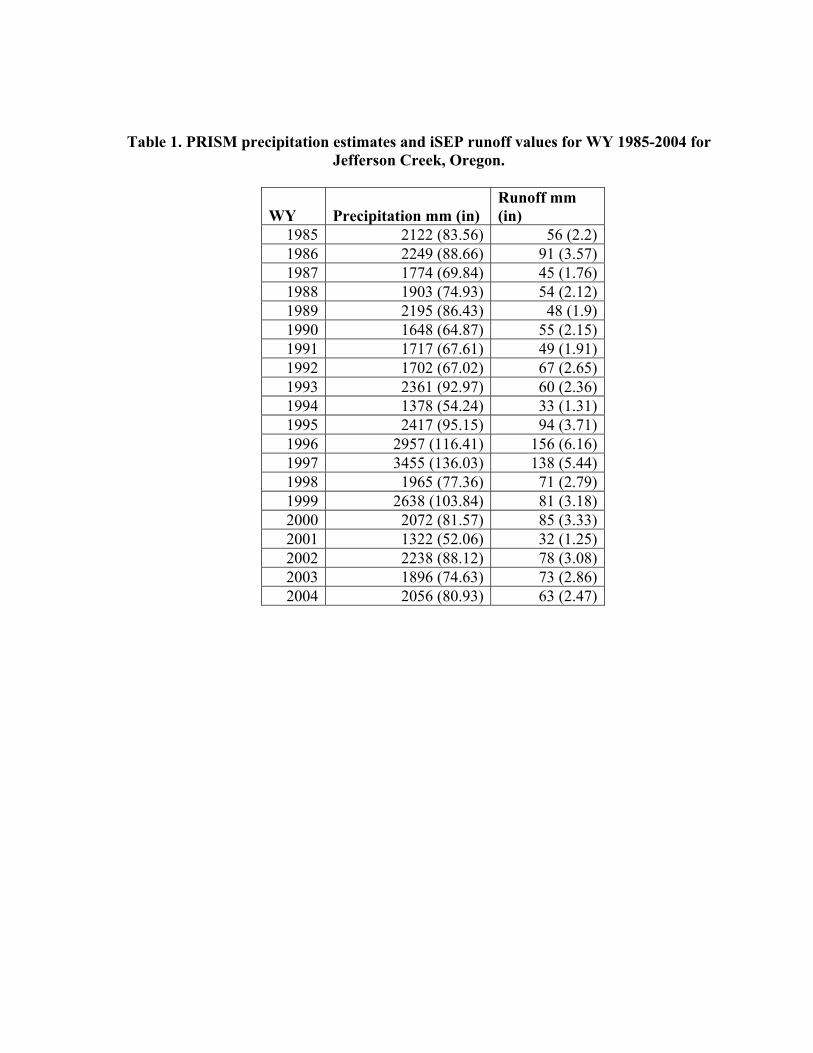
Table 1. PRISM precipitation estimates and iSEP runoff values for WY 1985-2004 for Jefferson Creek, Oregon.
WY Precipitation mm (in) Runoff mm (in)
1985 2122 (83.56) 56 (2.2) 1986 2249 (88.66) 91 (3.57) 1987 1774 (69.84) 45 (1.76) 1988 1903 (74.93) 54 (2.12) 1989 2195 (86.43) 48 (1.9) 1990 1648 (64.87) 55 (2.15) 1991 1717 (67.61) 49 (1.91) 1992 1702 (67.02) 67 (2.65) 1993 2361 (92.97) 60 (2.36) 1994 1378 (54.24) 33 (1.31) 1995 2417 (95.15) 94 (3.71) 1996 2957 (116.41) 156 (6.16) 1997 3455 (136.03) 138 (5.44) 1998 1965 (77.36) 71 (2.79) 1999 2638 (103.84) 81 (3.18) 2000 2072 (81.57) 85 (3.33) 2001 1322 (52.06) 32 (1.25) 2002 2238 (88.12) 78 (3.08) 2003 1896 (74.63) 73 (2.86) 2004 2056 (80.93) 63 (2.47)
Precipitation and Runoff Jefferson Creek OR WY 1984-2004
1
10
100
1000
1984 1988 1992 1996 2000 2004
Water Year
Prec
ipita
tion
and
Run
off
Dep
th (i
n)PPTRO
Figure 3. Annual Precipitation and Runoff Values for Jefferson Creek Oregon
for WY 1985-2004. Figure 5 depicts mean monthly Rp for Jefferson Creek. It is apparent that the July
2003 mean monthly Rp of 0.6 may have inordinately affected the mean annual Rp for WY 2003.
Jefferson Creek Annual Rp: Water Year 1985-2004
0
0.02
0.04
0.06
0.08
0.1
0.12
0.14
1984 1988 1992 1996 2000 2004
Rp
Figure 4. Mean Annual Rp for Jefferson Creek, Oregon WY 1985-2004.
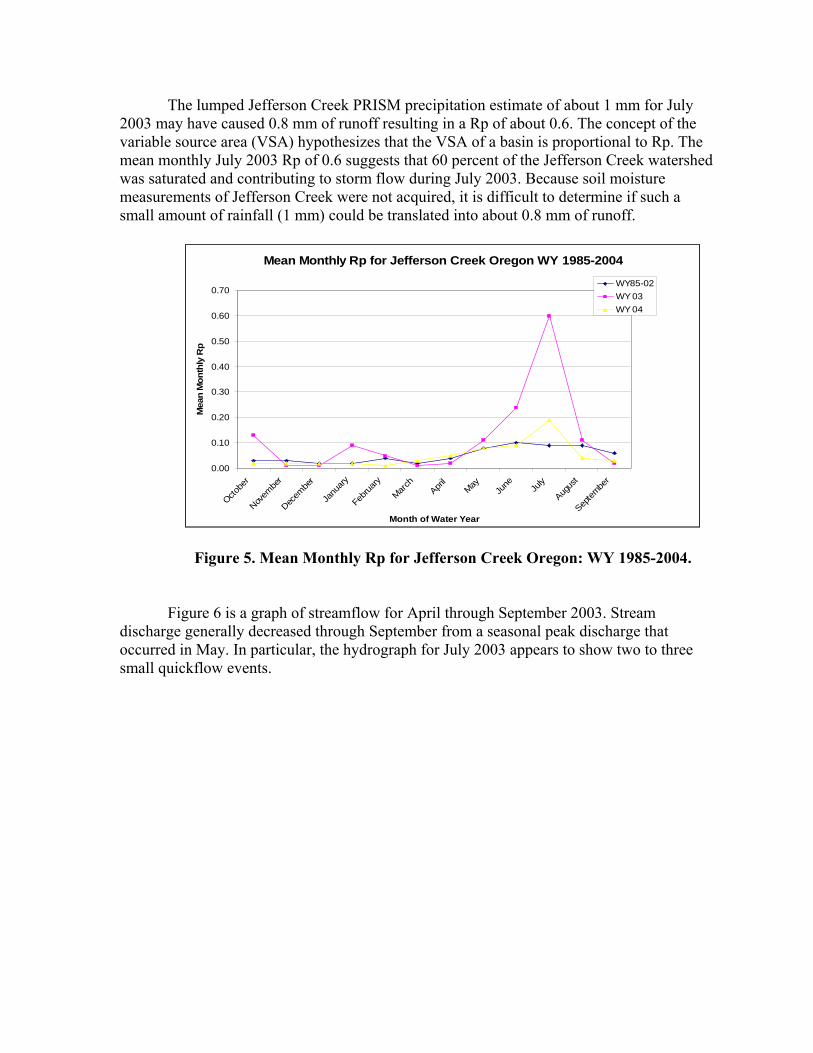
The lumped Jefferson Creek PRISM precipitation estimate of about 1 mm for July 2003 may have caused 0.8 mm of runoff resulting in a Rp of about 0.6. The concept of the variable source area (VSA) hypothesizes that the VSA of a basin is proportional to Rp. The mean monthly July 2003 Rp of 0.6 suggests that 60 percent of the Jefferson Creek watershed was saturated and contributing to storm flow during July 2003. Because soil moisture measurements of Jefferson Creek were not acquired, it is difficult to determine if such a small amount of rainfall (1 mm) could be translated into about 0.8 mm of runoff.
Mean Monthly Rp for Jefferson Creek Oregon WY 1985-2004
0.00
0.10
0.20
0.30
0.40
0.50
0.60
0.70
Octobe
r
Novem
ber
Decem
ber
Janu
ary
Februa
ry
March
April
MayJu
ne July
Augus
t
Septem
ber
Month of Water Year
Mea
n M
onth
ly R
p
WY85-02WY 03WY 04
Figure 5. Mean Monthly Rp for Jefferson Creek Oregon: WY 1985-2004.
Figure 6 is a graph of streamflow for April through September 2003. Stream
discharge generally decreased through September from a seasonal peak discharge that occurred in May. In particular, the hydrograph for July 2003 appears to show two to three small quickflow events.
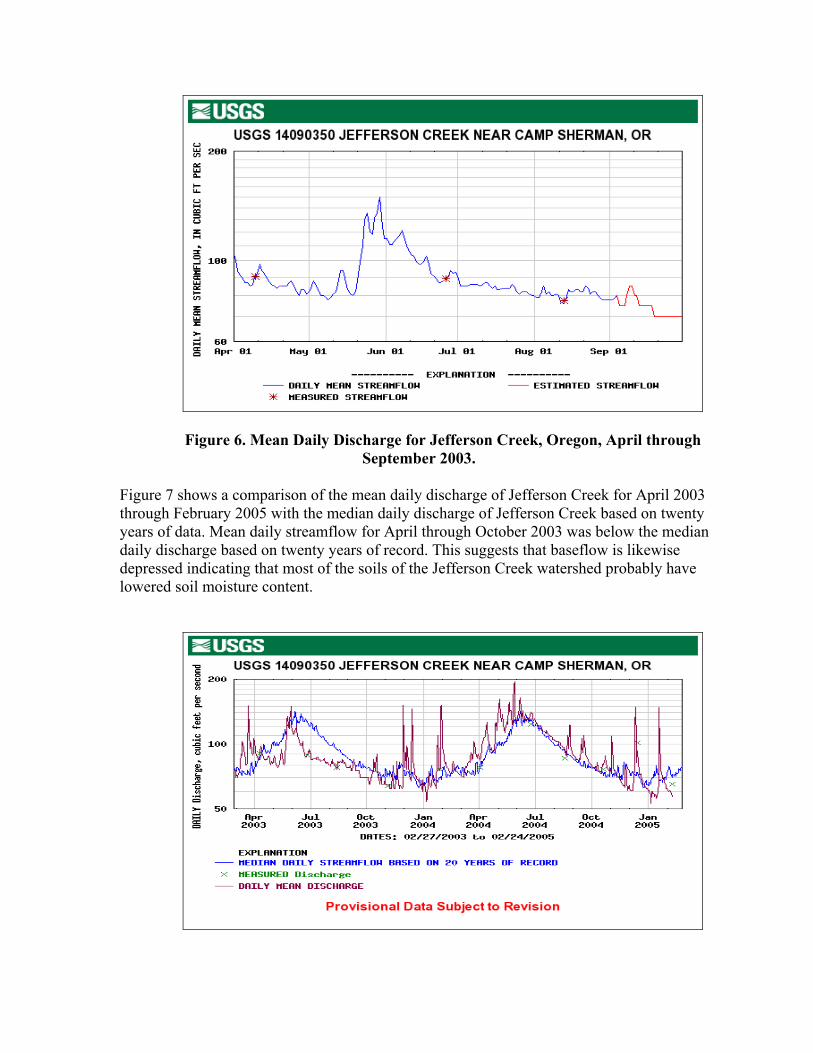
Figure 6. Mean Daily Discharge for Jefferson Creek, Oregon, April through September 2003.
Figure 7 shows a comparison of the mean daily discharge of Jefferson Creek for April 2003 through February 2005 with the median daily discharge of Jefferson Creek based on twenty years of data. Mean daily streamflow for April through October 2003 was below the median daily discharge based on twenty years of record. This suggests that baseflow is likewise depressed indicating that most of the soils of the Jefferson Creek watershed probably have lowered soil moisture content.
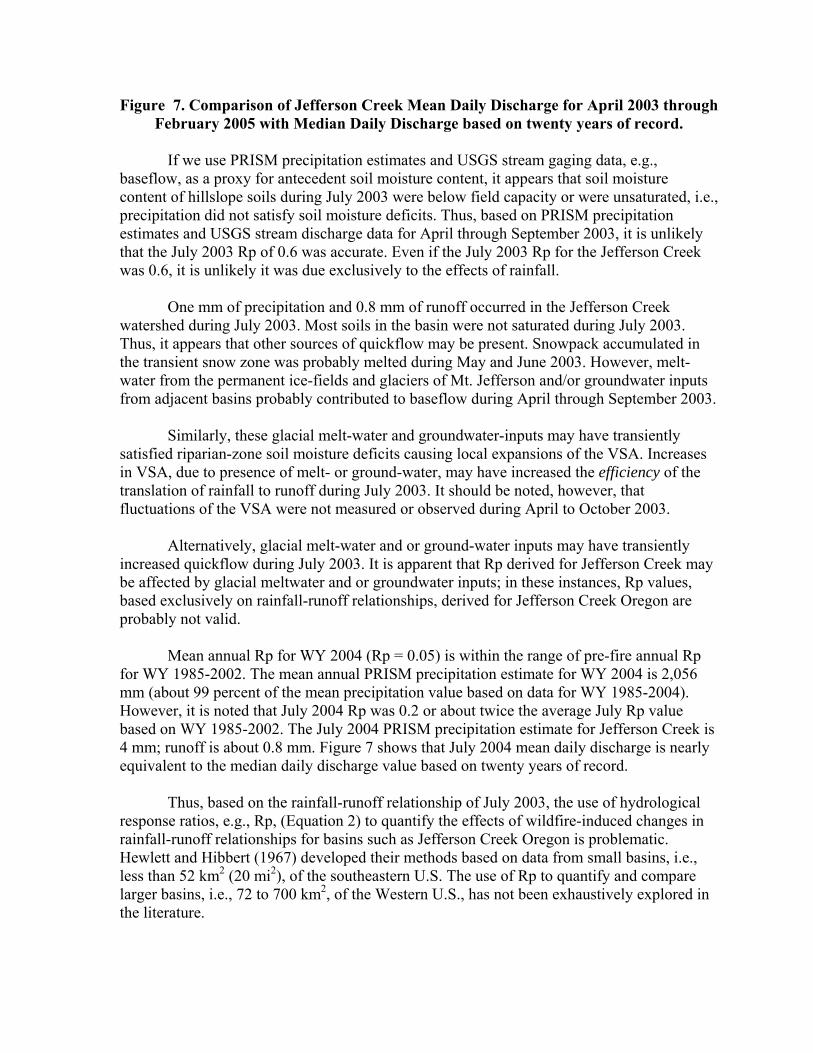
Figure 7. Comparison of Jefferson Creek Mean Daily Discharge for April 2003 through February 2005 with Median Daily Discharge based on twenty years of record.
If we use PRISM precipitation estimates and USGS stream gaging data, e.g.,
baseflow, as a proxy for antecedent soil moisture content, it appears that soil moisture content of hillslope soils during July 2003 were below field capacity or were unsaturated, i.e., precipitation did not satisfy soil moisture deficits. Thus, based on PRISM precipitation estimates and USGS stream discharge data for April through September 2003, it is unlikely that the July 2003 Rp of 0.6 was accurate. Even if the July 2003 Rp for the Jefferson Creek was 0.6, it is unlikely it was due exclusively to the effects of rainfall.
One mm of precipitation and 0.8 mm of runoff occurred in the Jefferson Creek
watershed during July 2003. Most soils in the basin were not saturated during July 2003. Thus, it appears that other sources of quickflow may be present. Snowpack accumulated in the transient snow zone was probably melted during May and June 2003. However, melt-water from the permanent ice-fields and glaciers of Mt. Jefferson and/or groundwater inputs from adjacent basins probably contributed to baseflow during April through September 2003.
Similarly, these glacial melt-water and groundwater-inputs may have transiently
satisfied riparian-zone soil moisture deficits causing local expansions of the VSA. Increases in VSA, due to presence of melt- or ground-water, may have increased the efficiency of the translation of rainfall to runoff during July 2003. It should be noted, however, that fluctuations of the VSA were not measured or observed during April to October 2003.
Alternatively, glacial melt-water and or ground-water inputs may have transiently
increased quickflow during July 2003. It is apparent that Rp derived for Jefferson Creek may be affected by glacial meltwater and or groundwater inputs; in these instances, Rp values, based exclusively on rainfall-runoff relationships, derived for Jefferson Creek Oregon are probably not valid.
Mean annual Rp for WY 2004 (Rp = 0.05) is within the range of pre-fire annual Rp
for WY 1985-2002. The mean annual PRISM precipitation estimate for WY 2004 is 2,056 mm (about 99 percent of the mean precipitation value based on data for WY 1985-2004). However, it is noted that July 2004 Rp was 0.2 or about twice the average July Rp value based on WY 1985-2002. The July 2004 PRISM precipitation estimate for Jefferson Creek is 4 mm; runoff is about 0.8 mm. Figure 7 shows that July 2004 mean daily discharge is nearly equivalent to the median daily discharge value based on twenty years of record.
Thus, based on the rainfall-runoff relationship of July 2003, the use of hydrological
response ratios, e.g., Rp, (Equation 2) to quantify the effects of wildfire-induced changes in rainfall-runoff relationships for basins such as Jefferson Creek Oregon is problematic. Hewlett and Hibbert (1967) developed their methods based on data from small basins, i.e., less than 52 km2 (20 mi2), of the southeastern U.S. The use of Rp to quantify and compare larger basins, i.e., 72 to 700 km2, of the Western U.S., has not been exhaustively explored in the literature.
For this research to proceed, it is necessary to determine if Rp derived for large basins of the American West are valid and accurately depict rainfall-runoff relationships. Work is ongoing to analyze rainfall-runoff data from other wildfire-affected basins, e.g., the Chetco River, Oregon at the 2002 Biscuit Fire and Vallecito Creek, Colorado at the 2002 Missionary Ridge Fire.
Literature Cited: Bobbe, T. M.V. Finco, B. Quayle, K. Lannom, R. Sohlberg & A. Parsons. 2001. Field Measurements for the Training and Validation of Burn Severity Maps from Spaceborne, Remotely Sensed Imagery. Final Project Report, Joint Fire Science Program—2001—2 Remote Sensing Applications Center, Salt Lake City, Utah. Hewlett, J.D. and A.R. Hibbert. 1967. Factors affecting the response of small watersheds to precipitation in humid areas, Int. Symp. Forest Hydrol. Proc., 275-290, Pergamon Press, Inc.,New York. Key, C.H. & N.C. Benson 1999. The Normalized Burn ratio, a Landsat TM radiometric index of burn severity incorporating multi-temporal differencing. Unpublished manuscript. US Geological Survey. Sloto, R.A, and M.Y. Crouse. 1996. HYSEP: a computer program for streamflow hydrograph separation and analysis. USGS Water-Resources Investigations Report. Taylor, G.H., C. Daly, and W.P. Gibson. 1993. Development of an isohyetal analysis for Oregon using the PRISM model. Engineering Hydrology, pp 121-125. Training and publications: Kevin J. Spelts, 3rd year Graduate Student
Synergetic effects of colloids and organic matter on membrane fouling
Basic Information
Title: Synergetic effects of colloids and organic matter on membrane fouling
Project Number: 2004OR47B
Start Date: 2/15/2004
End Date: 2/14/2005
Funding Source: 104B
Congressional District: Oregon 1 and 5
Research Category: None
Focus Category: Water Use, Treatment, Water Quality
Descriptors: None
Principal Investigators: Qilin Li
Publication
Start Date: 3/1/2004 End Date: 3/28/2005 Title: Combined Fouling and Chemical Cleaning of Nanofiltration Membranes Focus Category: Water Use, Water Treatment and Water Quality Principle Investigator: Qilin Li Congressional District: Oregon 5 Abstract This project was conducted to determine the synergetic effect of combined fouling of nanofiltration (NF) membranes by colloidal material and dissolved organic matter in drinking water purification, to reveal the mechanisms of combined fouling, and to develop efficient chemical cleaning strategies for membrane flux recovery. Nanofiltration experiments were conducted using synthetic waters that simulate different drinking water qualities, and the combined colloid/organic fouling layer formed was analyzed using microscopic techniques to determine the roles of colloidal material and dissolved organic matter in combined fouling under various solution chemistries. These results revealed that deposition of colloids and dissolved organic matter was drastically enhanced by the interactions between colloidal material and organic matter, leading to greater membrane flux decline. However, the combined fouling layer could be easily removed by hydraulic flushing due to the lack of specific interactions among foulants, which was found in organic fouling.
Problem and Research Objectives Water shortage and drinking water safety are two critical issues worldwide. With population growth, industrial development, and natural water source contamination, these problems are becoming more and more serious.
Today, the American West is the fastest growing region of the country. However, water, which plays a pivotal role in this region, is the scarcest resource. In some areas, the water supply is not or will not be adequate to meet all demands of water even in normal water years. Water crisis is magnified when severe droughts are encountered. To alleviate the water shortage problem, alternative water sources − wastewater, salty water and other impaired water − are considered. These waters can be purified to meet water quality standards for direct and indirect water reuse using advanced technology such as nanofiltration (NF) and reverse osmosis (RO).
In addition to quantity, water quality is another issue of great concern. Conventional drinking water treatment processes are no longer able to meet the standards for all regulated contaminants, examples of which include synthetic organic compounds and disinfection by-products. Also, poor removal efficiency of dissolved organic carbon (DOC) by conventional treatment processes results in product water that is not biologically stable. Advanced treatment by membrane filtration, such as NF and RO, offers an almost absolute barrier to inorganic, organic and microbial contaminants.
The major obstacle for efficient applications of NF and RO membrane technology in drinking water purification, desalination and wastewater reclamation is membrane fouling.
Membrane fouling results in deterioration of membrane performance (i.e., permeate flux and quality) and ultimately shortens membrane life. However, our understanding of membrane fouling is very limited and the fouling problem is far from being solved. It is necessary to understand the mechanisms of membrane fouling so that further research can be directed towards developing low-fouling membrane materials and optimizing membrane filtration systems. Despite the vast efforts to reduce membrane fouling ⎯ by improving membrane surface properties, optimizing operational conditions, or pretreatment of feed water ⎯ fouling is still inevitable. Thus, it is imperative to develop efficient chemical cleaning agents and procedures for routine cleaning of fouled membranes.
The objectives of this project are: (1) to determine the synergetic effect of combined fouling of nanofiltration (NF) membranes by colloidal material and dissolved organic matter; (2) to reveal the mechanisms of combined fouling, and (3) to develop efficient chemical cleaning strategies for membrane flux recovery.
Methods, Procedures, and Facilities General approach. Both microscopic characterization of the fouling layer and bench-scale membrane filtration/chemical cleaning experiments were performed to determine the effect of colloidal material and dissolved organic matter in combined fouling and membrane chemical cleaning. The mechanisms of combined fouling were investigated by relating the fouling layer characteristics, which controls the mass transfer resistance of the fouled membrane and the rate of membrane flux decline, to the colloidal/organic composition of the feed water. The mechanisms of chemical cleaning were determined from changes in the fouling layer characteristics.
Model Membrane, feed water and chemical cleaning agents. A thin-film composite nanofiltration membrane, NF-270 (FilmTec Corp., Minneapolis, MN), was tested. The surface morphology of the membrane was analyzed using a Multimode atomic force microscope (AFM) (Digital Instruments, Santa Barbara, CA), and zeta potential of the membrane surface was determined by streaming potential measurements conducted with an electrokinetic analyzer (BI-EKA, Brookhaven Instruments Corp., Holtsville, NY) [1,2].
Synthetic waters were formulated using an organic model foulants, Suwannee River humic acid (SRHA) standard (International Humic Substances Society, St. Paul, MN), two model silica colloids with different particle sizes: MP3040 (300 nm) and ST-XL (30-40 nm) (Nissan Chemicals, Westheimer, TX), and typical simple electrolyte found in surface water. Deionized water, NaOH (pH 11), sodium ethylenediaminetetraacetate (EDTA), and sodium dodecyl sulfate (SDS) (Fisher Scientific, Pittsburgh, PA) were used as the model chemical cleaning agents. These chemical agents are common ingredients in commercial chemical cleaning solutions for organic-fouled membranes [3].
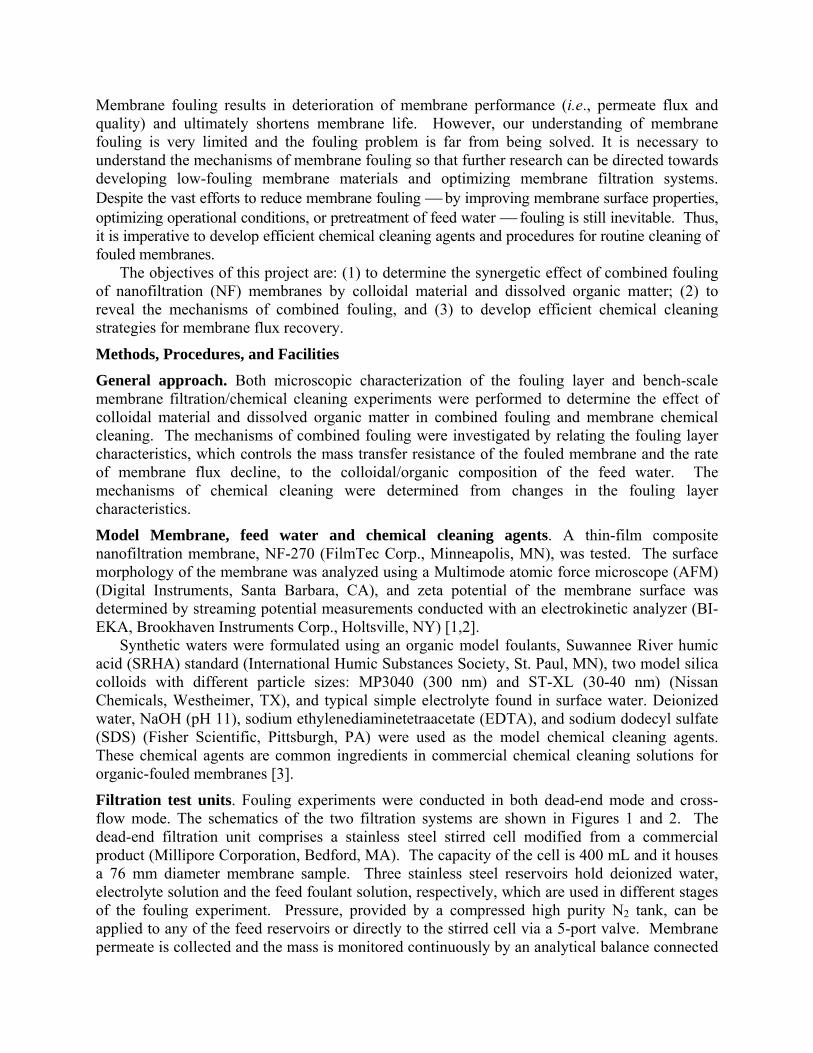
Filtration test units. Fouling experiments were conducted in both dead-end mode and cross-flow mode. The schematics of the two filtration systems are shown in Figures 1 and 2. The dead-end filtration unit comprises a stainless steel stirred cell modified from a commercial product (Millipore Corporation, Bedford, MA). The capacity of the cell is 400 mL and it houses a 76 mm diameter membrane sample. Three stainless steel reservoirs hold deionized water, electrolyte solution and the feed foulant solution, respectively, which are used in different stages of the fouling experiment. Pressure, provided by a compressed high purity N2 tank, can be applied to any of the feed reservoirs or directly to the stirred cell via a 5-port valve. Membrane permeate is collected and the mass is monitored continuously by an analytical balance connected
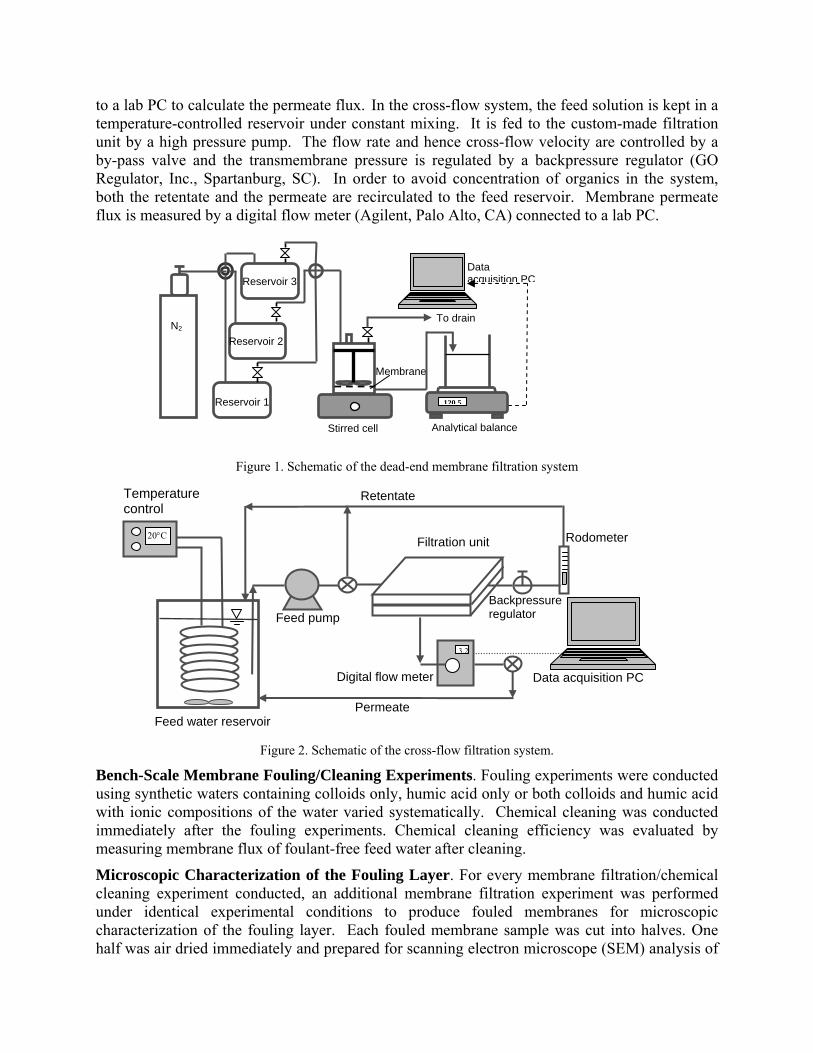
to a lab PC to calculate the permeate flux. In the cross-flow system, the feed solution is kept in a temperature-controlled reservoir under constant mixing. It is fed to the custom-made filtration unit by a high pressure pump. The flow rate and hence cross-flow velocity are controlled by a by-pass valve and the transmembrane pressure is regulated by a backpressure regulator (GO Regulator, Inc., Spartanburg, SC). In order to avoid concentration of organics in the system, both the retentate and the permeate are recirculated to the feed reservoir. Membrane permeate flux is measured by a digital flow meter (Agilent, Palo Alto, CA) connected to a lab PC.
Figure 1. Schematic of the dead-end membrane filtration system
Figure 2. Schematic of the cross-flow filtration system.
Bench-Scale Membrane Fouling/Cleaning Experiments. Fouling experiments were conducted using synthetic waters containing colloids only, humic acid only or both colloids and humic acid with ionic compositions of the water varied systematically. Chemical cleaning was conducted immediately after the fouling experiments. Chemical cleaning efficiency was evaluated by measuring membrane flux of foulant-free feed water after cleaning.
Microscopic Characterization of the Fouling Layer. For every membrane filtration/chemical cleaning experiment conducted, an additional membrane filtration experiment was performed under identical experimental conditions to produce fouled membranes for microscopic characterization of the fouling layer. Each fouled membrane sample was cut into halves. One half was air dried immediately and prepared for scanning electron microscope (SEM) analysis of
Filtration unit
Retentate
Feed pump
Data acquisition PC
3.2
Digital flow meter
Permeate
Backpressure regulator
Feed water reservoir
20°C
Temperature control
Rodometer
Reservoir 3
Analytical balance
N2
Reservoir 2
Reservoir 1 120 5
Data acquisition PC
To drain
Stirred cell
Membrane
the fouling layer surface. Another half of the fouled membrane sample was fractured via a cryogenic method to expose the cross-section of the fouling layer and subsequently freeze-dried and imaged with the SEM.
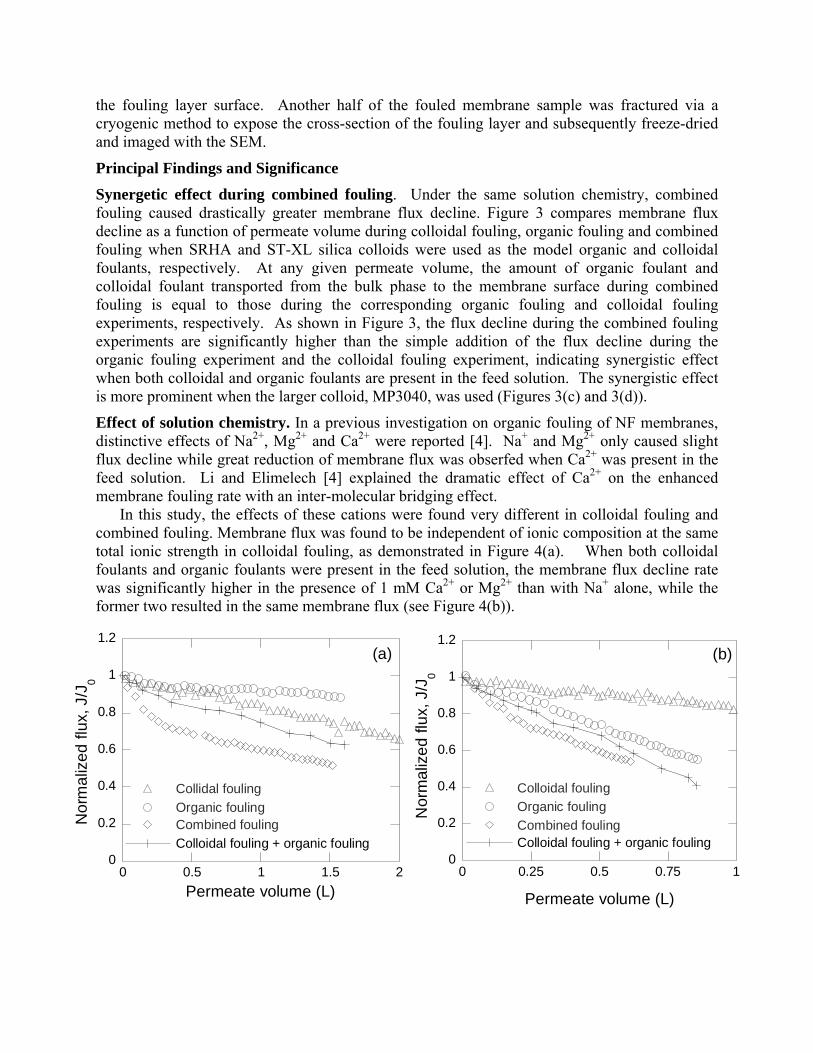
Principal Findings and Significance Synergetic effect during combined fouling. Under the same solution chemistry, combined fouling caused drastically greater membrane flux decline. Figure 3 compares membrane flux decline as a function of permeate volume during colloidal fouling, organic fouling and combined fouling when SRHA and ST-XL silica colloids were used as the model organic and colloidal foulants, respectively. At any given permeate volume, the amount of organic foulant and colloidal foulant transported from the bulk phase to the membrane surface during combined fouling is equal to those during the corresponding organic fouling and colloidal fouling experiments, respectively. As shown in Figure 3, the flux decline during the combined fouling experiments are significantly higher than the simple addition of the flux decline during the organic fouling experiment and the colloidal fouling experiment, indicating synergistic effect when both colloidal and organic foulants are present in the feed solution. The synergistic effect is more prominent when the larger colloid, MP3040, was used (Figures 3(c) and 3(d)).
Effect of solution chemistry. In a previous investigation on organic fouling of NF membranes, distinctive effects of Na2+, Mg2+ and Ca2+ were reported [4]. Na+ and Mg2+ only caused slight flux decline while great reduction of membrane flux was obserfed when Ca2+ was present in the feed solution. Li and Elimelech [4] explained the dramatic effect of Ca2+ on the enhanced membrane fouling rate with an inter-molecular bridging effect.
In this study, the effects of these cations were found very different in colloidal fouling and combined fouling. Membrane flux was found to be independent of ionic composition at the same total ionic strength in colloidal fouling, as demonstrated in Figure 4(a). When both colloidal foulants and organic foulants were present in the feed solution, the membrane flux decline rate was significantly higher in the presence of 1 mM Ca2+ or Mg2+ than with Na+ alone, while the former two resulted in the same membrane flux (see Figure 4(b)).
0
0.2
0.4
0.6
0.8
1
1.2
0 0.5 1 1.5 2
Collidal foulingOrganic foulingCombined foulingColloidal fouling + organic fouling
Nor
mal
ized
flux
, J/J
0
Permeate volume (L)
(a)
0
0.2
0.4
0.6
0.8
1
1.2
0 0.25 0.5 0.75 1
Colloidal foulingOrganic foulingCombined foulingColloidal fouling + organic fouling
Nor
mal
ized
flux
, J/J
0
Permeate volume (L)
(b)
0.0
0.2
0.4
0.6
0.8
1.0
1.2
0.0 0.5 1.0 1.5 2.0
Colloidal foulingOrganic foulingCombined foulingColloidal fouling + organic fouling
Nor
mal
ized
flux
, J/J
0
Permeate volume (L)
(d)
0
0.2
0.4
0.6
0.8
1
1.2
0 120 240 360 480 600 720
Zero divalent cations
1 mM Ca2+
Nor
mal
ized
flux
, J/J
0
Time (min)
(a)
0
0.2
0.4
0.6
0.8
1
1.2
0 60 120 180 240 300
Zero divalent cations
1 mM Mg2+
1 mM Ca2+
Nor
mal
ized
flux
, J/J
0
Time (min)
(b)
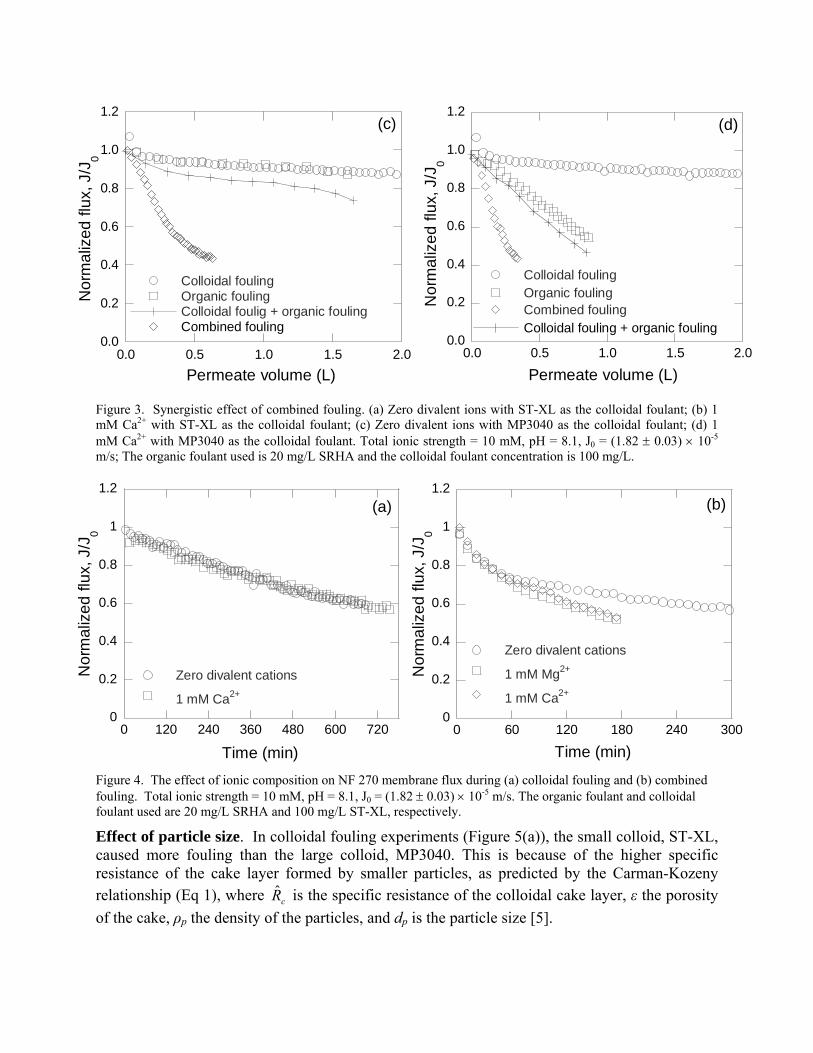
Figure 3. Synergistic effect of combined fouling. (a) Zero divalent ions with ST-XL as the colloidal foulant; (b) 1 mM Ca2+ with ST-XL as the colloidal foulant; (c) Zero divalent ions with MP3040 as the colloidal foulant; (d) 1 mM Ca2+ with MP3040 as the colloidal foulant. Total ionic strength = 10 mM, pH = 8.1, J0 = (1.82 ± 0.03) × 10-5 m/s; The organic foulant used is 20 mg/L SRHA and the colloidal foulant concentration is 100 mg/L.
Figure 4. The effect of ionic composition on NF 270 membrane flux during (a) colloidal fouling and (b) combined fouling. Total ionic strength = 10 mM, pH = 8.1, J0 = (1.82 ± 0.03) × 10-5 m/s. The organic foulant and colloidal foulant used are 20 mg/L SRHA and 100 mg/L ST-XL, respectively.
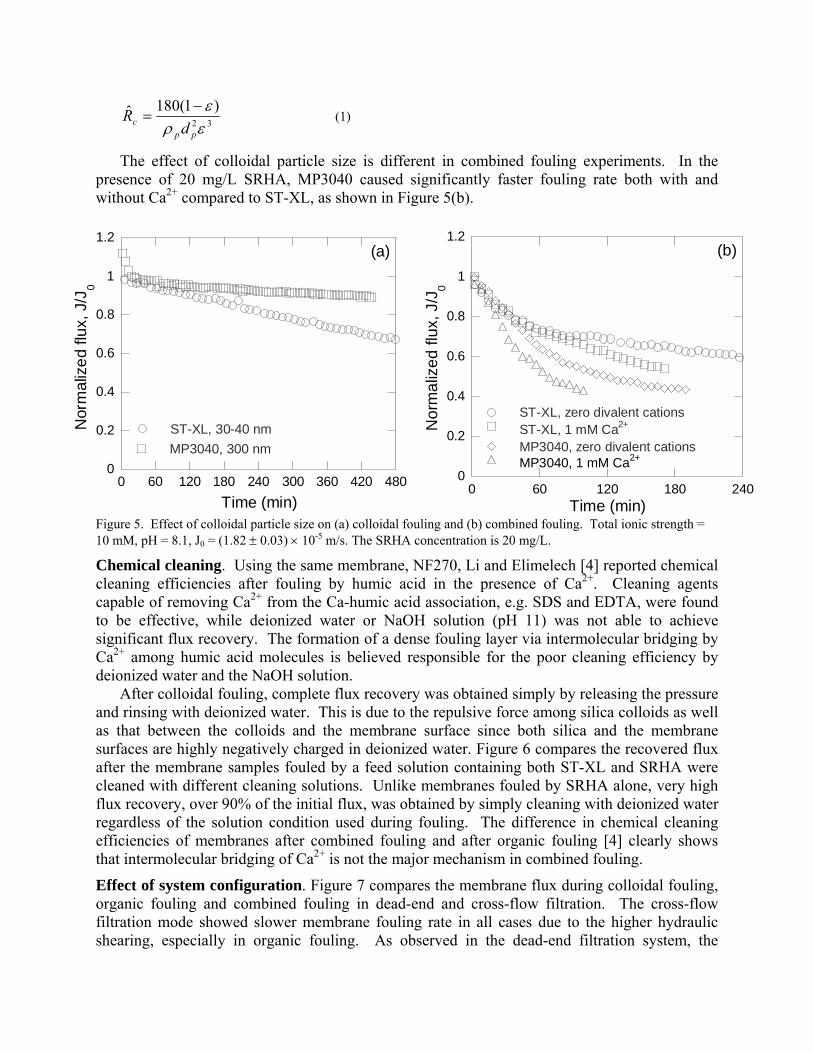
Effect of particle size. In colloidal fouling experiments (Figure 5(a)), the small colloid, ST-XL, caused more fouling than the large colloid, MP3040. This is because of the higher specific resistance of the cake layer formed by smaller particles, as predicted by the Carman-Kozeny relationship (Eq 1), where cR̂ is the specific resistance of the colloidal cake layer, ε the porosity of the cake, ρp the density of the particles, and dp is the particle size [5].
0.0
0.2
0.4
0.6
0.8
1.0
1.2
0.0 0.5 1.0 1.5 2.0
Colloidal foulingOrganic foulingColloidal foulig + organic foulingCombined fouling
Nor
mal
ized
flux
, J/J
0
Permeate volume (L)
(c)
0
0.2
0.4
0.6
0.8
1
1.2
0 60 120 180 240 300 360 420 480
ST-XL, 30-40 nmMP3040, 300 nm
Nor
mal
ized
flux
, J/J
0
Time (min)
(a)
0
0.2
0.4
0.6
0.8
1
1.2
0 60 120 180 240
ST-XL, zero divalent cationsST-XL, 1 mM Ca2+
MP3040, zero divalent cationsMP3040, 1 mM Ca2+
Nor
mal
ized
flux
, J/J
0
Time (min)
(b)
32
)1(180ˆερε
ppc d
R −= (1)
The effect of colloidal particle size is different in combined fouling experiments. In the presence of 20 mg/L SRHA, MP3040 caused significantly faster fouling rate both with and without Ca2+ compared to ST-XL, as shown in Figure 5(b).
Figure 5. Effect of colloidal particle size on (a) colloidal fouling and (b) combined fouling. Total ionic strength = 10 mM, pH = 8.1, J0 = (1.82 ± 0.03) × 10-5 m/s. The SRHA concentration is 20 mg/L.
Chemical cleaning. Using the same membrane, NF270, Li and Elimelech [4] reported chemical cleaning efficiencies after fouling by humic acid in the presence of Ca2+. Cleaning agents capable of removing Ca2+ from the Ca-humic acid association, e.g. SDS and EDTA, were found to be effective, while deionized water or NaOH solution (pH 11) was not able to achieve significant flux recovery. The formation of a dense fouling layer via intermolecular bridging by Ca2+ among humic acid molecules is believed responsible for the poor cleaning efficiency by deionized water and the NaOH solution.
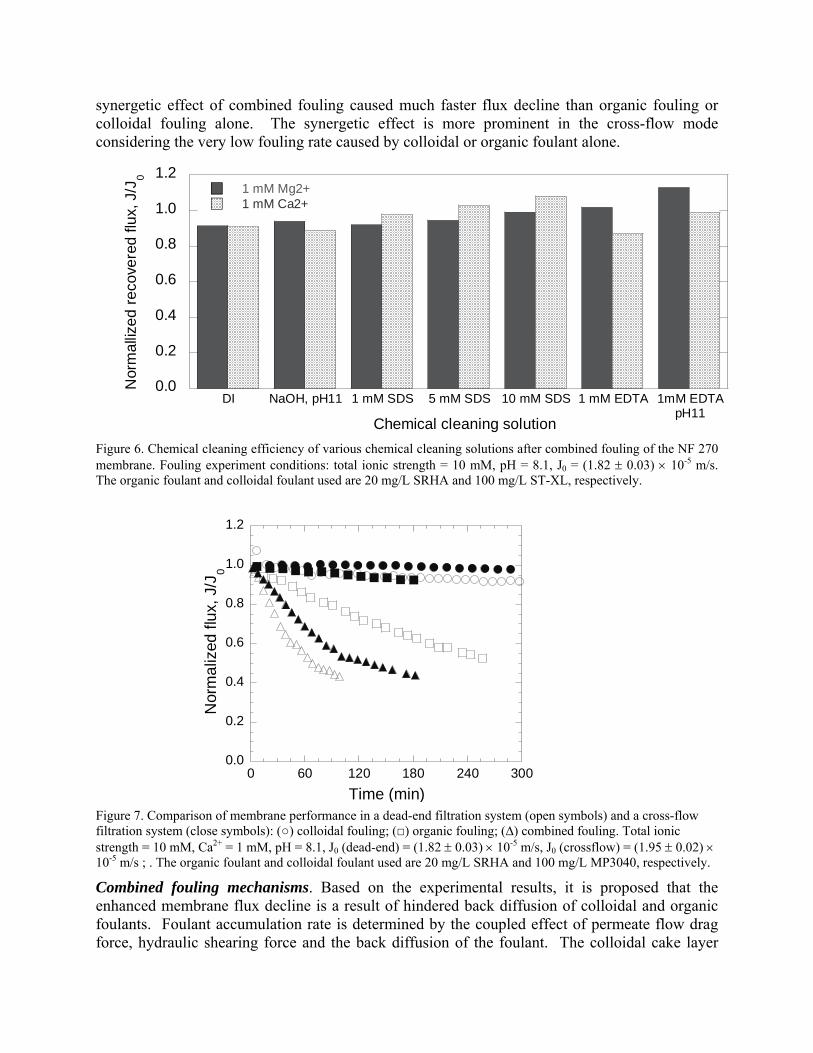
After colloidal fouling, complete flux recovery was obtained simply by releasing the pressure and rinsing with deionized water. This is due to the repulsive force among silica colloids as well as that between the colloids and the membrane surface since both silica and the membrane surfaces are highly negatively charged in deionized water. Figure 6 compares the recovered flux after the membrane samples fouled by a feed solution containing both ST-XL and SRHA were cleaned with different cleaning solutions. Unlike membranes fouled by SRHA alone, very high flux recovery, over 90% of the initial flux, was obtained by simply cleaning with deionized water regardless of the solution condition used during fouling. The difference in chemical cleaning efficiencies of membranes after combined fouling and after organic fouling [4] clearly shows that intermolecular bridging of Ca2+ is not the major mechanism in combined fouling.
Effect of system configuration. Figure 7 compares the membrane flux during colloidal fouling, organic fouling and combined fouling in dead-end and cross-flow filtration. The cross-flow filtration mode showed slower membrane fouling rate in all cases due to the higher hydraulic shearing, especially in organic fouling. As observed in the dead-end filtration system, the
0.0
0.2
0.4
0.6
0.8
1.0
1.2
0 60 120 180 240 300
Nor
mal
ized
flux
, J/J
0
Time (min)
synergetic effect of combined fouling caused much faster flux decline than organic fouling or colloidal fouling alone. The synergetic effect is more prominent in the cross-flow mode considering the very low fouling rate caused by colloidal or organic foulant alone.
0.0
0.2
0.4
0.6
0.8
1.0
1.2
DI NaOH, pH11 1 mM SDS 5 mM SDS 10 mM SDS 1 mM EDTA 1mM EDTApH11
1 mM Mg2+1 mM Ca2+
Chemical cleaning solution
Nor
mal
lized
reco
vere
d flu
x, J
/J0
Figure 6. Chemical cleaning efficiency of various chemical cleaning solutions after combined fouling of the NF 270 membrane. Fouling experiment conditions: total ionic strength = 10 mM, pH = 8.1, J0 = (1.82 ± 0.03) × 10-5 m/s. The organic foulant and colloidal foulant used are 20 mg/L SRHA and 100 mg/L ST-XL, respectively.
Figure 7. Comparison of membrane performance in a dead-end filtration system (open symbols) and a cross-flow filtration system (close symbols): (○) colloidal fouling; (□) organic fouling; (∆) combined fouling. Total ionic strength = 10 mM, Ca2+ = 1 mM, pH = 8.1, J0 (dead-end) = (1.82 ± 0.03) × 10-5 m/s, J0 (crossflow) = (1.95 ± 0.02) × 10-5 m/s ; . The organic foulant and colloidal foulant used are 20 mg/L SRHA and 100 mg/L MP3040, respectively.
Combined fouling mechanisms. Based on the experimental results, it is proposed that the enhanced membrane flux decline is a result of hindered back diffusion of colloidal and organic foulants. Foulant accumulation rate is determined by the coupled effect of permeate flow drag force, hydraulic shearing force and the back diffusion of the foulant. The colloidal cake layer
formed on the membrane surface reduces the back diffusion rate of organic foulant molecules by forming a tortuous pathway for the back diffusion of the organic foulant. The enhanced accumulation of the organic foulant increases the viscosity in the boundary layer, which in turn lowers the back diffusion rate of the colloidal foulant as predicted by the Stokes-Einstein equation (Eq 2), resulting in faster deposition rate of the colloidal material. The high initial flux decline rate during the combined fouling experiments is the result of the enhanced accumulation rate of the organic as well as colloidal foulants.
pdkTDπµ3
= (2)
D = Diffusion coefficient of the suspended colloids, m2/s;
k = Boltzmann’s constant, 1.38×10⁻²³ J/K;
T = Temperature, K;
µ = Viscosity, Pa·s;
dp = Particle diameter, m;
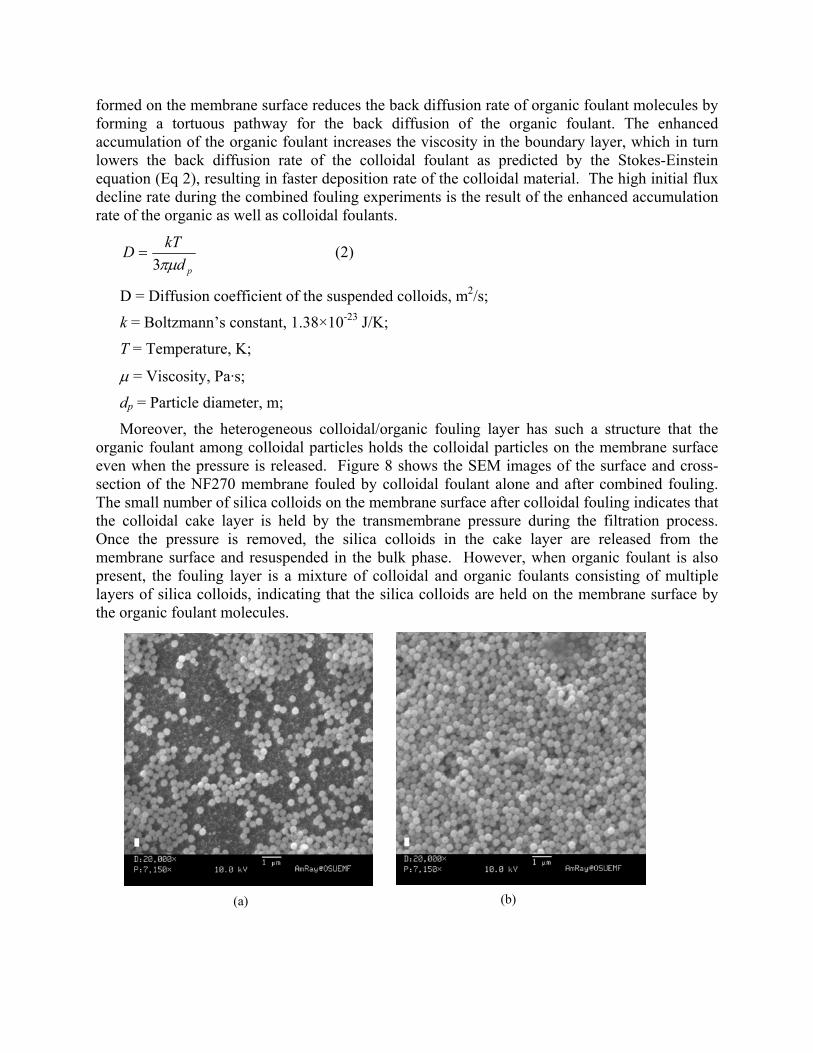
Moreover, the heterogeneous colloidal/organic fouling layer has such a structure that the organic foulant among colloidal particles holds the colloidal particles on the membrane surface even when the pressure is released. Figure 8 shows the SEM images of the surface and cross-section of the NF270 membrane fouled by colloidal foulant alone and after combined fouling. The small number of silica colloids on the membrane surface after colloidal fouling indicates that the colloidal cake layer is held by the transmembrane pressure during the filtration process. Once the pressure is removed, the silica colloids in the cake layer are released from the membrane surface and resuspended in the bulk phase. However, when organic foulant is also present, the fouling layer is a mixture of colloidal and organic foulants consisting of multiple layers of silica colloids, indicating that the silica colloids are held on the membrane surface by the organic foulant molecules.
(a) (b)
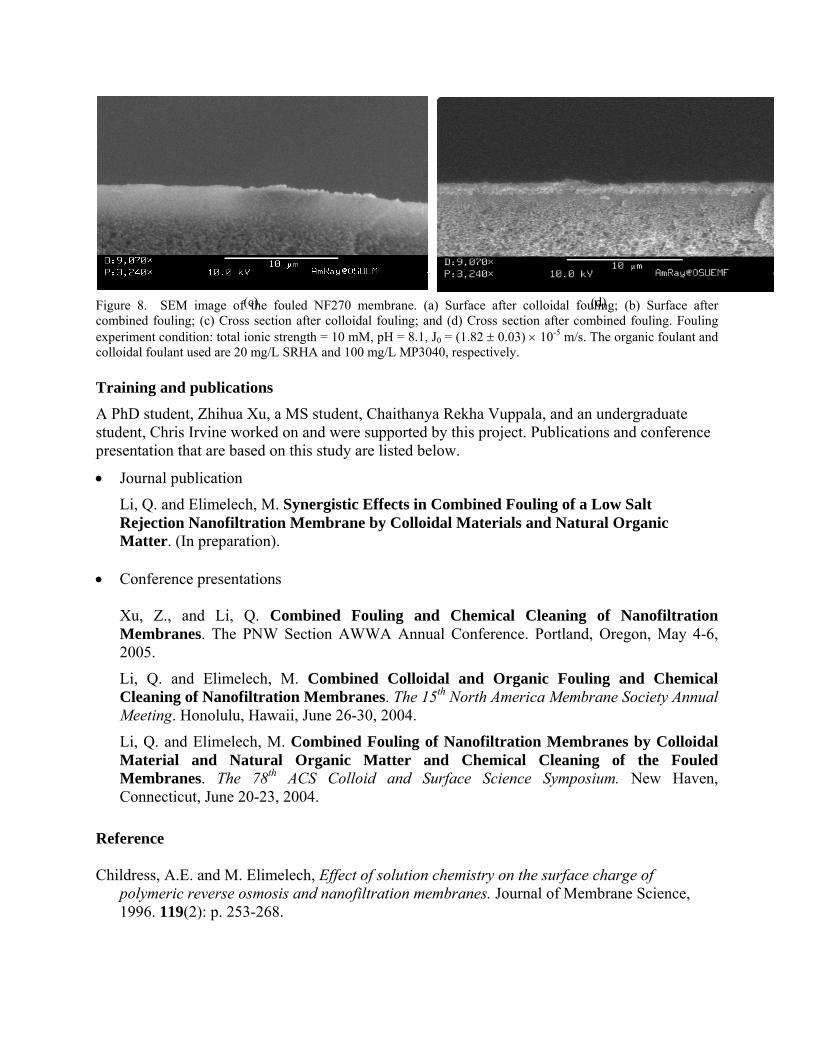
Figure 8. SEM image of the fouled NF270 membrane. (a) Surface after colloidal fouling; (b) Surface after combined fouling; (c) Cross section after colloidal fouling; and (d) Cross section after combined fouling. Fouling experiment condition: total ionic strength = 10 mM, pH = 8.1, J0 = (1.82 ± 0.03) × 10-5 m/s. The organic foulant and colloidal foulant used are 20 mg/L SRHA and 100 mg/L MP3040, respectively. Training and publications A PhD student, Zhihua Xu, a MS student, Chaithanya Rekha Vuppala, and an undergraduate student, Chris Irvine worked on and were supported by this project. Publications and conference presentation that are based on this study are listed below.
• Journal publication
Li, Q. and Elimelech, M. Synergistic Effects in Combined Fouling of a Low Salt Rejection Nanofiltration Membrane by Colloidal Materials and Natural Organic Matter. (In preparation).
• Conference presentations
Xu, Z., and Li, Q. Combined Fouling and Chemical Cleaning of Nanofiltration Membranes. The PNW Section AWWA Annual Conference. Portland, Oregon, May 4-6, 2005.
Li, Q. and Elimelech, M. Combined Colloidal and Organic Fouling and Chemical Cleaning of Nanofiltration Membranes. The 15th North America Membrane Society Annual Meeting. Honolulu, Hawaii, June 26-30, 2004.
Li, Q. and Elimelech, M. Combined Fouling of Nanofiltration Membranes by Colloidal Material and Natural Organic Matter and Chemical Cleaning of the Fouled Membranes. The 78th ACS Colloid and Surface Science Symposium. New Haven, Connecticut, June 20-23, 2004.
Reference Childress, A.E. and M. Elimelech, Effect of solution chemistry on the surface charge of
polymeric reverse osmosis and nanofiltration membranes. Journal of Membrane Science, 1996. 119(2): p. 253-268.
(c) (d)
Elimelech, M., W.H. Chen, and J.J. Waypa, Measuring the Zeta (Electrokinetic) Potential of Reverse-Osmosis Membranes by a Streaming Potential Analyzer. Desalination, 1994. 95(3): p. 269-286.
Trägårdh, G., Membrane Cleaning. Desalination, 1989. 71(3): p. 325-335. Li, Q. and M. Elimelech, Organic fouling and chemical cleaning of nanofiltration membranes:
Measurements and mechanisms. Environmental Science & Technology, 2004. 38(17): p. 4683-4693.
Carman, P.C., Fundamental Principles of Industrial Filtration. Trans. Inst. Chem. Eng., 1938. 16: p. 168-187.
Hydrogeomorphic Analysis of the Luckiamute Watershed,Central Coast Range, Oregon:
Basic Information
Title: Hydrogeomorphic Analysis of the Luckiamute Watershed, Central CoastRange, Oregon:
Project Number: 2004OR48B
Start Date: 2/15/2004
End Date: 2/14/2005
Funding Source: 104B
Congressional District: Oregon 5
Research Category: None
Focus Category: Education, Geomorphological Processes, Hydrology
Descriptors: None
Principal Investigators: Stephen Taylor
Publication
1
USGS Mini Grants FY 2005 Annual Technical Report Start Date: March 1, 2004 Original End Date: February 28, 2005
Extended End Date: February 28, 2006 (No Cost Extension) Title: Hydrogeomorphic Analysis of the Luckiamute Watershed, Central Coast
Range, Oregon: Integrating Applied Watershed Science with Undergraduate Research and Community Outreach
Focus Categories: Education, Geomorphological Processes, Hydrology, Sediments, Water
Quality Principle Investigator: Steve Taylor, Associate Professor, Western Oregon University,
503-838-8398 Congressional District: Oregon 5th Abstract:
Mountainous watersheds are fundamental landscape elements that form an important setting for local ecological interactions, human occupation, and water resource development. They also represent the foundational components for mass sediment transfer from continental regions to ocean basins. As such, the understanding of hydrogeomorphic variables and related process interactions is critical for designing sustainable water resource and habitat conservation plans. From the perspective of undergraduate training in the Earth Sciences, watersheds represent the ideal natural laboratory for student application of quantitative techniques to multivariate systems with interdependent process-response mechanisms.
This project involves hydrogeomorphic analysis of the Luckiamute River basin (Ad = 815 km2) of western Oregon. The Luckiamute is being used as a model watershed to integrate select components of applied research into a sequence of surface-process courses at Western Oregon University (WOU). Faculty and undergraduate Earth Science majors are currently engaged with integrated studies in fluvial geomorphology, environmental geology, hydrology, and GIS analysis. Primary research objectives include: (1) characterization of bedrock control on topography and geomorphic processes in the upper Luckiamute, (2) calculation of valley-bottom sediment storage volumes, as related to item 1 above, (3) characterization of channel-bed composition with respect to sediment-transport functions, and (4) collection and analysis of hydrologic data in the context of geologic and anthropogenic variables.
From a training perspective, the watershed-based curriculum (1) incorporates research into the undergraduate Earth Science program at WOU, (2) engages students in socially-relevant watershed-based science, (3) improves quantitative skills via coursework, lab exercises, and applied research, (4) develops problem-solving and scientific skills within a regional watershed setting, and (5) fosters an interconnected perspective of watershed processes across several linked courses. The research model is placed in the context of community outreach via collaboration with a local watershed council. In addition, final results of this project will contribute to the understanding of upland watershed dynamics in the Pacific Northwest.
As originally proposed, the project timeline was planned to extend over 2 summers and 1.5 academic years to develop the related curriculum modules and complete the proposed research. This
2
time frame is necessary to offset the persistent teaching commitments related to working at a primarily undergraduate institution. As such, a no cost extension was requested and granted in Spring of 2005, with the mini-grant subcontract extended through February 28, 2006. Status reports and relevant projects links are located at http://www.wou.edu/las/physci/taylor/luck/research.htm. Final results from this study will be posted by January 31, 2006.
Problems and Research Objectives: Sediment-Transport Dynamics
Study of the production, transport, and storage of surficial sediment in drainage basins is essential for understanding their evolution and geomorphic behavior. Fluvial regimes are intimately related to hillslope sediment delivery and storage systems (Dietrich and Dunne, 1978). The central Coast Range of Oregon represents an unglaciated, humid-mountainous landscape. Active mountain building and extreme precipitation patterns result in a dynamic geomorphic system characterized by seasonal flooding, slope failure, and debris flow activity (Benda, 1990). As such, forested drainage basins export sediment by colluvial and alluvial processes in high-gradient channel systems. Understanding the controls for routing and storage of sediments in this region are a critical component of habitat management plans (Swanson and others, 1990; Gregory and others, 1989; FEMAT, 1993). Taylor (2002) conducted GIS-based analyses in the Luckiamute to elucidate associations between lithospatial domain (i.e. Tyee, Siletz, Yamhill-Intrusive, Spencer-Valley Fill) and slope gradients. The study revealed that the Tyee domain is associated with significantly steeper slopes, wider valley bottoms, and higher occurrence of slope failure compared to the other three domains. Previous studies similarly documented the debris-flow-prone nature of Tyee landscapes in the Oregon Coast Range (e.g. Benda and Dunne, 1987; Mills and Ziolko, 2002). Taylor (2002) postulated that the comparatively steep slopes and wide valley bottoms in the Tyee domain are associated with hillslope transport rates greater than the ability of the channel system to export sediment. The model suggests a net deficit of unit stream power along the higher-order portions of the Luckiamute tributary. As slope gradients and valley-width morphology vary according to lithospatial domain, the model implies that spatial variation of bedrock lithology is a primary factor controlling slope gradients, hillslope delivery rates, and the resulting sediment-transport efficiency of the channel system. A portion of the work will test this hypothesis via large-scale surficial mapping, channel-reach characterization, and sediment-storage volume estimates. Water Quality and Hydrogeology The relationship between land use and water-quality degradation in the Willamette Valley is well documented (Wentz and others; 1998). Given that greater than 75% of all water use in the Willamette Basin is derived from surface sources, land-use and river quality issues are at the forefront of environmental planning in western Oregon. The greatest potential for water-quality degradation in the lower Luckiamute is from fertilizer-related nitrates, pesticides (herbicides, insecticides, and fungicides), and high concentrations of suspended sediment. Available surface water quality data for the Luckiamute Basin is limited to a few select field parameters (e.g. turbidity, dissolved oxygen, pH, conductivity) that were collected mostly in the late 1960's and early 1970's (Oregon Dept. of Environmental Quality, 2003). The most consistent water data are associated with the Soap Creek tributary near Coffin Butte Landfill, Benton County. Given the relative paucity of data and lack of a systematic sampling distribution, little is known about the effects of anthropogenic activity and regional geology on surface-water quality in the Luckiamute Watershed. In addition, detailed
3
quantitative analyses of Luckiamute aquifer systems are needed to delineate the physical and chemical nature of hydrogeologic processes in the basin. A significant component of the work plan addresses these needs and calls for systematic hydrologic analysis throughout the Luckiamute basin. Undergraduate Training
Integrating undergraduate research and education in the sciences is recognized as an important model for preparing students to participate in the 21st century workforce (National Science Foundation, 2003). College graduates are increasingly required to understand complex integrated systems by applying multi-disciplinary problem solving skills. As such, there is a general lack of linked science curricula in which students systematically build a set of problem-solving skills that are applied to a real-world problem (Heins and Walker, 1998). Watershed systems represent the interaction of physical and biological processes at spatial and temporal scales that are highly relevant to the community at large (Woltemade and Blewett, 2002). This project will serve as a framework for undergraduate training in applied fluvial geomorphlogy, environmental geology, and watershed science at Western Oregon University. Project Goals And Objectives
The purpose of this project is to integrate research, undergraduate education, curriculum development, and community outreach with watershed science as a unifying theme. The Luckiamute Watershed is being used as a natural laboratory for integrated studies in fluvial geomorphology, environmental geology, hydrology, and GIS analysis. The scientific objective of this project is to contribute to the understanding of mountainous watershed dynamics in the Pacific Northwest. Primary research objectives include: (1) characterization of bedrock control on topography and geomorphic processes in the upper Luckiamute, (2) calculation of valley-bottom sediment storage volumes, as related to item 1 above, (3) characterization of channel-bed composition with respect to sediment-transport functions, and (4) collection and analysis of water quality data in the context of geologic and anthropogenic variables.
From a training perspective, the proposed watershed-based curriculum will (1) incorporate research into the undergraduate Earth Science program at WOU, (2) engage students in socially-relevant watershed-based science (e.g. Woltemade and Blewett, 2002), (3) improve quantitative skills via coursework, lab exercises, and applied research, (4) develop problem-solving and scientific skills within a regional watershed setting, and (5) foster an interconnected perspective of watershed processes across several linked courses. Methods, Procedures, and Facilities:
Proposed research activities focus on hydrogeomorphic assessment of the Luckiamute Watershed, explicit action items include:
(1) Design and implementation of undergraduate research modules in a series of Earth Science courses at WOU: G322 Geomorphology, G473 Environmental Geology, G476 Hydrology, and G492 GIS Applications in Earth Science.
(2) Weave select portions of Earth Science course curricula with assessment and monitoring
activities associated with the Luckiamute Watershed Council.
4
(3) Creating linked research modules in the courses listed above, each focusing on different aspects of the Luckiamute Watershed:
(A) G322 Geomorphology: Assessment of valley-bottom sediment storage volumes, sediment-
transport efficiency, and channel bed composition. (i) Surficial mapping of Luckiamute valley bottom (ii) Channel reach characterization
(B) G473 Environmental Geology: Assessment of surface water quality and land-use impacts in the Luckiamute basin. (i) Baseline water quality monitoring (ii) Land use analysis
(C) G476 Hydrology: Characterization of drainage composition and slope-area relationships in the context of bedrock associations (i) Morphometric analyses
(D) G492 GIS Applications: Compilation of geospatial products. (i) Building spatial data bases (ii) Assembling web-based GIS products
(4) Cultivate community involvement via advisory panel meetings with Luckiamute stakeholders and students.
(5) Web-based dissemination of research products.
Geomorphic Techniques
Surficial mapping techniques follow those presented by Taylor and others (1996) for mountainous landscapes. Valley-bottom storage compartments (channel, floodplain, terrace, fan) are the focus as they reflect the ability of watersheds to export sediment. Detailed surficial mapping, with measurement of surface heights above channel grade, allow first-order approximation of valley-bottom storage volumes. Channel-reach surveys include: (1) channel classification (after Rosgen, 1994; Kondolf, 1995; Montgomery and Buffington, 1997), (2) clast-size analysis (after Wolman, 1954 and Hack, 1957), (3) measurement of bankful stage, gradient, channel width, total valley width, and (4) spatial distribution of bedrock-alluvium reaches (after Montgomery and others, 1996). Morphometric analyses and slope-area relationships are being analyzed using GIS, as modified from procedures outlined by Hack (1957), Strahler (1957), and Dalla Fontana and Marchi (2003). Volume estimates are examined in tandem with clast-size analysis, bedrock-channel distribution, and slope-area relationships to make inferences regarding controls on long-term sediment-transport efficiency. Hydrologic Analysis Surface water quality and aquifer systems are currently being evaluated by extrapolation of existing data from available state and federal databases. Database extrapolation will allow derivation of an initial assessment from which to devise a more extensive, field-based sampling strategy. GIS anayses will be used to identify associations between water quality, land use, and geologic setting.
5
Data Compilation-Dissemination-Community Outreach All data and reports completed as part of this project are being compiled and distributed via internet technologies (refer to URL: http://www.wou.edu/las/physci/taylor/luck/research.htm. The project web site is the primary information source for students and watershed stakeholders. Spatial data are being compiled into a GIS and distributed via a dedicated map-server housed at Western Oregon University. Research results and related curriculum products are being disseminated by presentation at national geoscience meetings (e.g. Taylor, 2005). Principal Findings and Significance: As stated above, the project is still in progress and is extended through February 2006. However the following provides a status summary of findings achieved thus far: Lithologic Controls on Watershed Morphology
Studies in the Oregon Coast Range have yielded numerous contributions to the understanding of mountain river systems. Published research topics include sediment budget analysis, sediment transport models, debris flow dynamics, hillslope hydrology, landslide risk modelling, effects of punctuated sediment supply, landscape evolution, and tectonic controls on bedrock erosion rates. While this rich body of work has significantly improved our geomorphic understanding of mountain river systems, most studies have been limited to landscapes underlain by bedrock of the Eocene Tyee Formation. Few studies have been conducted in portions of the Oregon Coast Range underlain by other lithostratigraphic units. Work in other bedrock domains is needed to assess the applicability of existing models to other Coast Range landscapes. This study involves comparative morphometric analysis of HUC 6th field watersheds, using Tyee-based landscapes as a benchmark for comparison with other bedrock types in the central Oregon Coast Range.
The Luckiamute River watershed drains 815 km2 along the east flank of the Coast Range in west-central Oregon. Bedrock map units are grouped into four lithospatial domains, these include the Siletz River Volcanics Domain (south), the Tyee Domain (west-southwest), the Yamhill-Intrusive Domain (north-northwest), and the Spencer-Valley Fill Domain (east). The Siletz River Domain comprises 19% of the watershed and is mainly seafloor basalt. The Tyee Domain (29% of total area) is underlain by arkosic sandstone lithofacies with local mafic intrusives. The Yamhill-Intrusive Domain occupies 23% of the watershed and is characterized by outcrop of marine siltstone and mafic intrusives. The Spencer-Valley Fill Domain (29%) is underlain by a patchwork of marine sandstones and Quaternary alluvium. Hillslope landforms and colluvial processes dominate the Siletz River, Tyee, and Yamhill domains, whereas fluvial landforms and alluvial processes are characteristic of the Spencer Domain.
Fourth-order subbasins (n = 5-6, avg. Ad = 16 km2) were selected from each bedrock domain for subsequent terrain analysis of USGS 10-meter DEMs. Averaged quantitative parameters for the Spencer, Siletz, Yamhill, and Tyee domains include, respectively: (1) hypsometric integral (0.30, 0.40, 0.48, 0.29), (2) basin ruggedness (0.2, 1.2, 1.1, 1.6), (3) total drainage density (1.4, 2.3, 2.0, 2.4 km-1), (4) Shreve magnitude (14, 49, 31, 55), (5) first-order stream density (0.7, 1.2, 1.0, 1.2 km-1), (6) channel gradients (0.04, 0.13, 0.18, 0.14), (7) stream power index (69, 1909, 2534, 1133), (8) hillslope gradients (3.2, 12.7, 11.9, and 14.5 degrees), and (9) hillslope profile curvature (0.004, 0.008, 0.007, 0.011 m/deg). The Tyee Domain is more finely dissected by low-order stream channels and associated with more rugged hillslopes compared to the other three domains. Results of the slope analyses are consistent with debris-flow hazard models released by the Oregon Department of Forestry, suggesting
6
that hillslopes in the Tyee Domain are most prone to slope failure (percent of domain area in hazard zone: Tyee = 38.1, Siletz = 30.2, Yamhill = 24.6, and Valley Fill = 0.7). Morphometric analysis of higher-order valley widths at 500 m increments shows that trunk drainage across the Tyee Domain covers a much wider swath of valley floor (avg. Wv = 274 m) compared to a similar-sized drainage area in the Yamhill Domain (avg. Wv = 109 m). Stream power parameters suggest that while Tyee drainages are more energetic than the Spencer system, they are less potentially less effective at sediment transport than the other upland domains. These data suggest that bedrock lithology exerts a strong control on hillslope morphology, style of hillslope process, and sediment-transport efficiency in headwater portions of the Luckiamute. The interplay between hillslope transport mechanisms, delivery rates, and channel hydraulics control the volume of sediment exported or stored within a mountainous watershed. The comparatively steep, debris-flow-prone slopes and wide valley bottoms in the Tyee Domain indicate a potential for hillslope transport rates to be greater than the ability of the channel system to export sediment. Analytical results presented herein provide a preliminary dataset upon which to build a field-based sediment-storage budget for the Luckiamute watershed. The working hypothesis is that the Tyee Domain has a significantly greater volume of valley-bottom sediment in storage compared to the other upland domains (Siletz, Yamhill). The model implies that spatial variation of bedrock lithology is a primary factor controlling slope gradients, hillslope delivery rates, and the resulting sediment-transport efficiency of the channel system. The rich body of work from other Tyee-based landscapes in the Oregon Coast Range will serve as the platform from which to extend future research in the Luckiamute to other bedrock domains. Hydrogeologic Setting
Gannet and Caldwell (1998) and Woodward et al. (1998) delineated the principle hydrostratigraphic units in the Southern Willamette Basin. In ascending order these include: (1) basement confining unit (BCU), (2) Willamette confining unit (WCU), (3) Willamette aquifer (WAq), and (4) Willamette Silt (WS). The lowermost unit is represented by indurated bedrock, while the latter three are comprised of unconsolidated alluvium and valley-fill sediments. Alluvial-fill thickness in the lower Luckiamute and Ash Creek sub-basins ranges up to 30 m (100 ft) with most localities in the 12 to 24 m (40 to 80 ft) range. Luckiamute alluvial-fill thickens to the east towards the center of the Willamette Valley, and thins upstream to a minimum near the communities of Falls City and Pedee (Caldwell, 1993; Gannett and Caldwell, 1998).
The basement confining unit is composed predominantly of Tertiary marine sedimentary rocks and related submarine basalts. This unit is characterized by relatively low permeability lithofacies with intermixed low-yield aquifer horizons and aquitards. In the lower Luckiamute and Ash Creek subbasins, BCU is composed largely of Spencer Formation strata. The Siletz River Volcanics form the basement unit in the southern portion of the watershed, along Soap Creek.
The Willamette confining unit is composed of unconsolidated fine-grained fluvial facies deposited by low-gradient streams during the Pleistocene. Drilling logs commonly refer to this unit as “blue clay”, “silty clay” or “shale", containing laterally discontinous sandy and gravelly interbeds. WCU is characterized by limited ground water production, however coarse-grained interbeds locally serve as aquifers. Regional yields from wells set in this unit range from 2 to 10 gallons per minute. WCU thickness in the study area ranges from a maximum of 18 m (60 ft) at Luckiamute Landing, to less than 6 m (20 ft) upstream of Helmick State Park. The Willamette confining unit is less than 18 m (60 ft) thick in the Ash Creek subbasin. The Willamette aquifer is composed of coarse-grained facies associated with Pleistocene alluvial fans and deposits of smaller side tributaries. This unit was referred to as the "Linn Gravel" by
7
Allison (1953). It is characterized by thick-bedded sand and gravel facies with thin interbeds of fine-grained sand, silt and clay. WAq is locally cemented and partially indurated. Regionally, the Willamette aquifer is formed by fluvio-glacial outwash from large drainage systems in the Cascades that debouch westward onto the valley floor. Given lower summit elevations, the Coast Range was not glaciated during the Pleistocene. Thus eastward-draining tributaries to the Willamette, including the Luckiamute, tend to be smaller in area compared to those of the western Cascades, and are not associated with high-volume fluvio-glacial aquifer systems. The lower end of the Luckiamute lies approximately 30 km (18 mi) west of the Stayton and Lebanon fans, deposits of the North and South Santiam Rivers, respectively. Given the distal position of the Luckiamute in relation to large fan deposits, WAq gravels in the watershed are generally less than 6 m (20 ft) thick and are likely composed of sediments derived locally from Coast Range sources.
The Willamette Silt is the uppermost valley-fill unit and is comprised of late Pleistocene Missoula Flood deposits (map unit Qff2 of O’Connor and others, 2001). Fine-grained clay, silty clay, and silt occurs up to an elevation of 120 m (400 ft) in Luckiamute Basin and is less than 6 to 9 m (20 to 30 ft) thick. This unit serves as a semi-confining aquitard for the Willamette aquifer, however it is partly saturated and is commonly associated with water table conditions throughout much of the Willamette Basin.
In addition to the valley ground-water system, a significant portion of the Luckiamute is served by upland bedrock aquifer horizons set in strata of the Siletz River Volcanics, Tyee Formation, Yamhill Formation, and Oligocene Intrusives. Crystalline volcanic and intrusive rocks have inherently low porosity and permeability, but secondary fracture porosity can be significant (Freeze and Cherry, 1979). In the case of the Siletz River basalts, low-grade alteration and secondary zeolitization has likely resulted in significant reduction of hydraulic conductivity. Similary, the fine-grained nature of the Tyee and Yamhill formations makes them of limited value as aquifer material.
Hydrogeologic data were collected from field-located wells as part of the Willamette Regional Aquifer Systems Analysis (RASA) conducted by the U.S. Geological Survey (Woodward and others, 1998; Gannett and Caldwell,1998). Approximately 40% of well heads are located in unconsolidated valley-fill alluvium, with 60% situated in basement-confining or upland bedrock units. Given that maximum alluvial fill in the Luckiamute-Ash Creek basins is generally less than 30 m (100 ft), all of the wells in the inventory have bottom depths situated in the basement-confining or upland bedrock aquifers. Average depth relations reveal that the bedrock wells have greater total depths and lower static water level elevations compared to wells situated on valley fill. Although quantitative hydraulic analyses are lacking in the Luckiamute, Gonthier (1983) documented hydraulic conductivities in the range of 0.2 to 0.3 ft/day for the Dallas-Monmouth Area. Accordingly, the average specific capacity for wells ranges from <1 to 7 gallons per minute per foot of drawdown (Woodward and others, 1998).
The Spencer-Valley Fill domain in the Luckiamute forms part of the regional Willamette aquifer system which is generally associated with unconfined potentiometric conditions. Valley-fill aquifers in the Ash Creek subbasin are hydrogeologically separated from the Luckiamute by a hydraulic divide comprised of low-permeability lithofacies in the Spencer Formation (basement confining unit of Gannett and Caldwell, 1998). The lower Luckiamute valley-fill aquifer system is characterized by eastward ground water flow and hydraulic gradients on the order of 5 ft/mi (Woodward and others, 1998). Unconsolidated valley fill is more prevalent in the Ash Creek subbasin with eastward-directed hydraulic gradients of 20 ft/mi (Caldwell, 1993). Regionally, seepage velocity in the Willamette aquifer ranges from 3 to 30 ft / day, comparable to other coarse-grained aquifers. Iverson and Haggerty (2002) are conducting ongoing research in the Willamette Silt to determine hydraulic and geochemical properties. The results of their preliminary work along the Pudding River suggests that WS serves as a confining unit to the underlying Waq. Horizontal hydraulic
8
conductivities are on the order of 0.004 to 5.53 ft/day, with vertical permeabilities of 0.008 ft/day and porosity of 40%.
Natural ground water quality ranges from good to poor in the Luckiamute-Ash Creek subbasins. Caldwell (1993) documented localized high salinity concentrations in the Monmouth-Independence area. His study utilized trace element analyses to relate bedrock mineralogy to ground water residence times and salinity contamination risk. The results indicate that ground water in the region is associated with chloride-dominant ionic species (CaCl2 and NaCl) and poses a potential water quality hazard. It is interpreted that increased salinity levels are derived from connate brine waters trapped in Tertiary marine sedimentary rocks. This saline water mixes with shallow ground water via upward migration along folds and faults in the basement confining units. Preliminary analyses of water quality data to the south indicate that similar salinity conditions may also be present in Luckiamute aquifers. Detailed quantitative analyses of Luckiamute aquifer systems are needed to delineate the physical and chemical nature of hydrogeologic processes in the basin. Training and Support: 4 undergraduate students at WOU have been / are being supported by this project as research assistants: Jeff Budnick, B.S. Earth Science (expected graduation June 2005) Chandra Drury, B.S. Earth Science (expected graduation December 2005) Jamie Fisher, B.S. Earth Science (expected graduation December 2005) Diane Hale, B.S. Physical Geography (August 2004) The watershed coordinator at the Luckiamute Watershed Council is being trained and supported by this project as a research associate: Eve Montanaro (B.S. Physical Geography, 2002, University of Oregon) Publications, Reports, Presentations, and Spin-off Grant Proposals: Taylor, 2005, In Preparation, Lithologic Controls on Watershed Morphology in the Central Oregon
Coast Range: to be submitted to Geomorphology. Taylor, S.B., 2005, Lithologic Controls on Watershed Morphology in the Central Oregon Coast
Range: Towards Extrapolation of Tyee-Based Models to Other Bedrock Types – Mountain Rivers Session: Association of American Geographers, Abstracts with Programs, Annual Meeting, Denver.
Taylor, S.B., 2004, Geology of the Luckiamute River watershed, upper Willamette Basin, Polk and
Benton Counties, Oregon: in Garono, R.J., Anderson, B.D., Harma, K., Buhl, C., and Adamus, P., Luckiamute / Ash Creek / American Bottom Watershed Assessment: Unpublished Technical Document, Luckiamute Watershed Council, Western Oregon University, Monmouth, Oregon, Appendix A – 19 p., available on line at <URL: http://www.wou.edu/las/natsci_math/geology/luckiamute/Appendix A Geology of Luckiamute River Watershed.pdf, updated June 2204.
9
Taylor, S.B., 2005, Proposal for Water Quality Study: “Lithologic Controls on Water Temperature in the Luckiamute Watershed, Polk and Benton Counties, Oregon”, funding for $1500 awarded by the College of Liberal Arts and Sciences, Western Oregon University.
Dutton, B. and Taylor, S.B., 2004, Proposal for Conservation Rearch: “Geomorphic and
Anthropogenic Controls on the Distribution of Invasive Plant Species in the Luckiamute Watershed, Polk and Benton Counties, Oregon”, funding for $12,000 awarded by the Oregon Community Foundation.
Dutton, B. and Taylor, S.B., 2004, Proposal for Conservation Rearch: “Geomorphic and
Anthropogenic Controls on the Distribution of Invasive Plant Species in the Luckiamute Watershed, Polk and Benton Counties, Oregon”, funding for $6,000 awarded by the Western Oregon University Faculty Development Fund.
Dutton, B. and Taylor, S.B., 2005, Proposal for Invasive Plant Research: “Reconnaissance Survey of
Japanese Knotweed in the Riparian Zone of the Luckiamute Watershed”, funding for $2000 awarded by the Northwest Invasive Weed Management Partnership Program.
References Cited: Benda, L., 1990, The influence of debris flows on channels and valley floors in the Oregon Coast
Range, U.S.A.: Earth Surface Processes and Landforms, v. 15, p. 457-466. Benda, L., and Dunne, T., 1987, Sediment routing by debris flow, in Erosion and Sedimentation in the
Pacific Rim, Proceedings of the Corvallis Symposium, International Association of Hydrological Sciences, Publication 165, p. 213-223.
Caldwell, R.R., 1993, Geochemistry, alluvial facies distribution, hydrogeology, and groundwater quality of the Dallas
Monmouth area, Oregon: Unpublished M.S. Thesis, Portland State University, Portland, Oregon, 198 p. Dalla Fontana, G., and Marchi, L., 2003, Slope-area relationships and sediment dynamics in two alpine
streams: Hydrological Processes, 17, p.73-87 Dietrich, W.E., and Dunne, T., 1978, Sediment budget for a small catchment in mountainous terrain:
Zeitschrift fur Geomorphologie Supplementband, v. 29, p. 191-206. FEMAT (Forest Ecosystem Management Assessment Team), 1993, Forest ecosystem management: an
ecological, economic, and social assessment, Portland, Oregon: U.S.D.A., Washington, D.C. Freeze, R.A., and Cherry, J.A., 1979, Groundwater: Prentice-Hall, New Jersey, 604 p. Gannett, M.W. and Caldwell, R.R., 1998, Geologic framework of the Willamette Lowland aquifer system, Oregon and
Washington: U.S. Geological Survey Professional Paper 1424A, 32p. Gregory, S.V., Lamberti, G.A., and Moore, K.M., 1989, Influence of valley floor landforms on stream
ecosystems: U.S. Department of Agriculture Forest Service General Technical Report PSW-110. Hack, J.T., 1957, Studies of longitudinal stream profiles in Virginia and Maryland: U.S. Geological Survey Professional
Paper 294-B, p. 45-97. Heins, W.A., and J.R. Walker, 1998, Using a campus waterway for undergraduate-course exercises
and summer-research experiences: Journal of Geoscience Education, v. 46, p. 45-50.
10
Iverson, J., and Haggerty, R., 2002, Investigation of the hydraulic, physical, and chemical buffering capacity of Missoula flood deposits for water quality and supply in the Willamette Valley of Oregon: Geological Society of America Abstracts with Programs, Cordilleran Section Meeting, v. 34, no. 5, p. 109.
Kondolf, G.M., 1995, Geomorphological stream channel classification in aquatic habitat restoration:
uses and limitation: Aquatic Conservation: Marine and Freshwater Ecosystems, v. 5, p. 127-141. Mills, K.A., and Ziolko, M., 2002, Oregon's debris flow warning system: Geological Society of
America, Abstracts with Program, v. 34, p. 24 Montgomery, D.R., and Buffington, J.M., 1997, Channel-reach morphology in mountain drainage basins: Geological
Society of America Bulletin, v. 109, p. 596-611. Montgomery, D.R., Abbe, T.B., Buffington, J.M., Peterson, N.P., Schmidt, K.M., and Stock, J.D., 1996, Distribution of
bedrock and alluvial channels in forested mountain drainage areas: Nature, v. 381, p. 587-589. National Science Foundation, 2003, National Science Foundation Strategic Plan – FY 2003-2008: NSF
Publication NSF-04201, Washington, D.C., 34 p. O'Connor, J.E., Sarna-Wojcicki, A., Wozniak, K.C., Polette, D.J., and Fleck, R.J., 2001, Origin, extent,
and thickness of Quaternary geologic units in the Willamette Valley, Oregon: U.S. Geological Survey Professional Paper 1620 (with 1:250,000 maps), 52 p.
Oregon Department of Environmental Quality, 2003, Laboratory Analytical Storage and Retrieval
Database: online resource, http://www.deq.state.or.us/wq/lasar/LasarHome.htm. Rosgen, D.L., 1994, A classification of natural rivers: Catena, v. 22, p. 169-199. Strahler, A.N., 1957, Quantitative analysis of watershed geomorphology: American Geophysical Union Transactions, v. 38,
p. 913-920. Swanson, F.J., Franklin, J.F., and Sedell, J.R., 1990, Landscape patterns, disturbance, and management
in the Pacific Northwest, USA, in Zonneveld, R.S., and Forman, R.T., eds., Changing landscapes: An ecological perspective: Springer-Verlage, New York, p. 191-213.
Taylor, S.B., 2002, Bedrock Control on Slope Gradients in the Luckiamute Watershed, Central
Coast Range, Oregon: Implications for Sediment Transport and Storage: American Geophysical Union Abstracts with Programs, Fall Meeting 2002, San Francisco, California.
Taylor, S.B., 2005, Lithologic Controls on Watershed Morphology in the Central Oregon Coast
Range: Towards Extrapolation of Tyee-Based Models to Other Bedrock Types – Mountain Rivers Session: Association of American Geographers, Abstracts with Programs, Annual Meeting, Denver.
Taylor, S.B., Kite, J.S., and Kuhn, K., 1996, Surficial map criteria for unglaciated humid-mountainous landscapes - linkage
of process and landform: An example from the Fernow Experimental Forest, Tucker County, West Virginia: Geological Society of America, Abs. Programs, v. 28.
Wentz, D.A., Bonn, B.A., Carpenter, K.D., Hinkle, S.R., Janet, M.L., Rinella, F.A., Uhrich, M.A.,
Waite, I.R., Laenen, A., and Bencala, K.E., 1998, Water quality in the Willamette Basin, Oregon, 1991-1995: U.S. Geological Survey Circular 1161, on line atURL:http://water.usgs.gov/pubs/ circ1161, updated June 25, 1998.
Wolman, M.G., 1954, A method for sampling coarse river bed material: Transactions of the American
Geophysical Union, v. 35, p. 951-956. Woltemade, C.J., and Blewett, W.L., 2002, Design, implementation, and assessment of an
undergraduate interdisciplinary watershed research laboratory: Journal of Geoscience Education, v. 50, p. 372-379.
11
Woodward, D.G., Gannett, M.W., and Vaccaro, J.J., 1998, Hydrogeologic Framework of the Willamette Lowland Aquifer System, Oregon and Washington: U.S. Geological Survey Professional Paper 1424-B, 82 p.
Riverine gravel supply in Oregon
Basic Information
Title: Riverine gravel supply in Oregon
Project Number: 2004OR49B
Start Date: 2/15/2004
End Date: 2/14/2005
Funding Source: 104B
Congressional District: Oregon 1, 5
Research Category: None
Focus Category: Geomorphological Processes, Hydrology, Sediments
Descriptors: None
Principal Investigators: Peter Klingeman
Publication
Start Date: February 15, 2004 End Date: February 14, 2005 Title: Riverine gravel supply in Oregon Focus Categories: Geomorphology Processes, Hydrology, Sediments Principal Investigator: Peter Klingeman, Professor, Department of Civil, Construction and Environmental Engineering Oregon State University, Corvallis, OR 97331, Telephone: 541-737-4977 Congressional Districts: Oregon, 1st and 5th Abstract The relative abundance and availability of river gravel in lower reaches of coastal streams will be determined for Oregon’s coastal streams. The determination involved documentation of its presence in channels, verification of its availability for transport, identification of the source areas for gravel supply and recruitment, and location of the delivery and deposition zones in the tidal reaches. Available gravel quantities were determined by basic sediment mass balances and the use of formulas to estimate transport capabilities and transport occurrences. Statement of Critical Regional Problem River gravel occurring in tidewater reaches of Oregon's coastal streams is a natural resource subject to three main conflicting concerns and stream uses. These are: habitat, gravel mining, and flood control. Each is briefly described in the following paragraphs. River gravel is an essential physical element for most stream ecosystems, particularly the coastal streams of the Pacific Northwest. Beyond the natural physical boundary provided by such material, gravel also forms a substrate where benthic organisms live and other organisms and species use the material for portions of their life cycles. In particular, the several salmonid species that are found in the Pacific Northwest use gravel for spawning, egg incubation, and fry habitat. Gravel also provides a growing medium for various rooted aquatic plants. There is no substitute to take the place of river gravel for these uses. River gravel that occurs in the lower reaches of rivers near roads and communities has a high demand for its use as aggregate for making concrete. Such gravel has already survived the abrasion associated with river transport and hence tends to have more durable properties than quarry rock or hillside material derived from bedrock weathering. River gravel may also be closer to potential use areas than some floodplain gravels or may not be affected by competing, expensive floodplain land uses. Royalties to the State for mining of river gravel may be much smaller than the alternative land acquisition costs. Hence, river gravel is
favored for its strength, its proximity to potential markets, and its apparent fewer cost barriers. Counterbalancing these are restrictions on removal of gravel from stream channels. Flooding in the tidewater reaches of coastal streams often results from a combination of circumstances. For example, river floods lead to high water levels; tidal reaches are subject added elevation changes due to ocean tides; and during high-tide phases of tidal cycles the estuarine water levels may retard the outflow of and add to the water elevations of river runoff. To the extent that river gravels are abundant in such tidewater zones, they are viewed by some people as either adding to the flooding problem or offering a means (through dredging) to lower flood levels. A variation on this example involves past efforts of agencies or adjacent landowners to confine floodplain channels, thus reducing the flow capacity. When a flood occurs in a tidal reach of stream, the problems already described are compounded. The tidal reaches of five main rivers entering the Tillamook plain and estuary are particularly susceptible to the combination of all three pressures on the gravel resource -- habitat, aggregate, and flood mitigation. This is in part due to the flat river gradients in the tidal reaches and in part because of floodplain encroachment by the town of Tillamook and by nearby agricultural zones. Tidal reaches of other coastal rivers also experience some of the same problems, although to a lesser combined degree. In some places other issues also arise. For example, the lower reaches of the Umpqua River tend to be affected mainly by habitat and aggregate issues, but with the added problem of storm-caused landslides along adjacent steep tributaries draining lands with a history of forest clear-cut harvesting. Statement of Results One result of the geomorphic assessment was to have a clear idea of the physical nature of each studied stream based on several evaluation criteria. These criteria included:
• whether the stream reach is dominated by gravel or by bed material having other size descriptions;
• whether the stream appears to be "choking" with gravel or to be deficient of gravel; • whether the bed has well-formed geomorphic features that suggest active fluvial
processes or instead has poorly-formed features that suggest zones of net deposition; • whether the overall channel alignment or the specific morphological features of the
bed contribute to bank erosion; • whether the channel appears to offer a "reasonable" capability to carry floodwaters
and sediment, relative to the contributing drainage area, or appears to be too small or large to be an effective conveyance system for water and sediment;
• indicators of habitat diversity, complexity, and connectivity in lateral channel directions and with respect to the adjacent riparian and floodplain areas.
One result of the hydrologic assessment was to provide quantitative information on flow availability for sediment transport and on periods of flow capability to transport sediment. This was needed to determine the actual delivery of gravel to the lower reaches and replenishment (recruitment) of gravel from upstream sources.
One result of the hydraulic assessment was to develop a basic mass balance of inputs, outputs, and storages for gravel for the lower reaches of the study streams. A second result was to develop a gravel recruitment relationship for each reach. These results lead to initial conclusions regarding the relative supply and replacement of gravel to lower reaches of the studied coastal streams. Thus, a physical basis was developed, along with quantitative information, for use to address some of the main gravel resource issues. References Bogavelli, Vaishali. Streamflow Research Web Site: Development of Hydrologic Analysis Techniques Section. Master of Science Report; Department of Civil, Construction & Environmental Engineering; Corvallis. July 2002. Coles, Derron. Streamflow Research Web Site: Web Design Process. Master of Science Report; Department of Civil, Construction & Environmental Engineering; Corvallis. July 2002. Graduate Student Training A major part of the budget for the proposed research is for student support. One graduate student, Josh Wyrick, pursued a Ph.D. while working on this project leading to his dissertation entitled “On the Formation of Fluvial Islands,”. The project provided training opportunities that are not normally available in regular graduate educational program.
Publication Institute of Natural Resources, 2005, Draft Technical Report on Aggregate Resources to the Aggregate/Agriculture Consensus Group: Research Report prepared for the National Policy Consensus Center, Portland State University
Information Transfer ProgramCWESt continued its interest in supporting efforts to make water resources data sets accessible to potentialusers. Projects were selected that included:
data set(s) for web use, techniques or methods for making data more accessible and/or useful to otherusers, direct connection to needs of user communities.
CWESt sponsored several conferences, workshops, and planning meetings at local, statewide, regional,and national levels. These activities were a joint effort by Denise Lach and Ken Williamson, Co-Directors;Stephanie Sanford, Program Coordinator; Maria Wright, Technology Transfer Coordinator; Todd Jarvis,Water Resources Assistant Professor Senior Research; and Technical Outreach Specialists, MichaelFernandez, Jerry Orlando, and Sonal Shetty; in addition to cooperation from other faculty members.CWESt successfully sponsored and co-sponsored the following conferences, seminars and workshops.
Co-sponsor, Northwest Stream Restoration Design Symposium, Skamania, WA, February 3-5, 2004. Thisconference created a forum for regulators, engineering and biology consultants, and educators to exchangeinformation about technical issues in the design of stream restoration projects. An enthusiastic group of250 people attended. The symposium was co-sponsored by CWESt, Portland State University, and RiverRestoration Northwest, and other companies and agencies.
Co-sponsor, seminar by Brian Walker, Resilience as a Basis for Sustainable Development: With examplesfrom the Australian rangelands. February 2004.
Co-sponsor, Is Sustainability Good Business?, Corvallis, Oregon, April 5 May 17, 2004. This lectureseries explored the relationship between business and sustainability by examining the environmental,economic, social, and ethical dimensions of sustainability. Co-sponsored by the OSU College of Business,Honors College, Convocations and Lectures Committee, and CWESt.
Co-sponsor, Amory Lovins and Hank Patton, Covallis, Oregon, April 16-19, 2005. Invited participant,National Center for Ecological Analysis and Synthesis: Ecology and Metaphor.
Co-sponsor, Sustainable Engineering Expo, Corvallis, Oregon, May 3, 2004. OSU students and facultypresented their work related to sustainable engineering. The Expo included a poster session and an awardsceremony. Co-sponsored by the College of Engineering and CWESt.
Co-sponsor, Oasis Earth: A Planet in Peril, Corvallis, Oregon, May 12, 2004. A narrated slide show usingphotographic images from NASA and the United Nations Environment Program and the Canon, Inc.
Sponsor, Brownfields Site Selection Criteria Workshop, Spokane, Washington, July 2004.
Presentation, Spokane Tribe Workshop on Uranium, Radiation, and Heavy Metals, August 2004 .
Presentation, Risk Assessment, Willits Citizens Advisory Committee meeting, September 2004.
Co-sponsor, EFS Sustainability Conference, University of Portland, Portland, Oregon, October 21-23,2004.
Sponsor, Fall 2004 Water Resources Seminar, The Perfect Storm: Civic Science and the Hurricane ofPolicy, Oregon State University, Corvallis, Oregon.
Participant, Career Day, Careers in Water Resources, David Douglas High School, Portland, Oregon,January, 2005.
Training Cooperative Partnership with US EPA Under this cooperative agreement funded by the EPA,CWESt placed approximately 25 undergraduates and 5 graduate students in research projects at the EPAWestern Ecology Division in 2004. With the US EPA, CWESt held an Undergraduate ResearchSymposium for the student interns.
Basin level datasets for anticipating future water scarcity andconflict in Oregon
Basic Information
Title: Basin level datasets for anticipating future water scarcity and conflict in Oregon
Project Number: 2004OR44B
Start Date: 2/15/2004
End Date: 8/15/2004
Funding Source: 104B
Congressional District: Oregon 1, 5
Research Category: None
Focus Category: Law, Institutions, and Policy, Management and Planning, Drought
Descriptors: None
Principal Investigators: Aaron T. Wolf
Publication
Start Date: March 1, 2004 End Date: March 28, 2005 Title: Basin level datasets for anticipating future water scarcity and conflict in Oregon Focus Category: LIP, M&P, DROU, WQL, WS, WU Principle Investigator:
Aaron T. Wolf Associate Professor Oregon State University Phone: (541) 737-2722
Congressional District: Oregon, 1st and 5th Abstract: By 2025, Oregon’s population is projected to grow twenty-eight percent, adding nearly one million people to the state. As population expands, changes in demographic variables such as income, age structure and employment will influence the nature of future water use in Oregon, expanding claims for water in industrial, municipal and recreational sectors. Independent of population growth, increased claims for in-stream water needs, associated with the implementation of state and federal environmental laws, will further heighten competition for limited supplies. Without strategies to anticipate and address competing water demands, Oregon’s water management stakeholders run the risk of allocating financial, technical, and legal resources inefficiently. Without successful strategies, conflicts over water resources, such as the ongoing Klamath Basin situation, are likely to become more frequent and stalwart as the state’s population grows. Information accessibility is the most critical component of appropriate resource allocation, to better understanding long term balance of supply and demand and the prevention of conflict. Action needs to be taken to adapt available data from multiple sources to create datasets that will help facilitate informed and sustainable water management decisions. We compiled datasets pertinent to understanding water supply, demand, quality, conflict and cooperation in Oregon into a consistent, basin-scale format . • Hydrologic data: Past and current trends in water supply and demand, consisting of three indices: 1) a
drought index, 2) a water quality index, and 3) a water allocation index. • Demographic data: Population structure, income, and employment within hydrologic basins. Each of
these variables influences the magnitude of water use in urban and rural communities, but is normally summarized for political units, rather than within basins.
• Hydropolitical data: Interactions of conflict and cooperation over water resources, summarized by basin. News reports, legal proceedings, and stakeholder agreements chronicling key water issues in the state allow for historical insights in past trends in conflict and cooperation among different water use sectors and management entities.
These data as well as premade maps and summary reports will be available in tabular and GIS shapefile format on the web in July 2005, via Oregon State University’s Transboundary Freshwater Dispute Database: http://www.transboundarywaters.orst.edu; and from links on the webpages of the Oregon Water Resources Department; and Portland State University’s Population Resource Center. This project was a partnership with Oregon State University, Portland State University and the Oregon Water Resources Department, and will train two graduate students in database and GIS skills. This project was as a critical step to supporting proactive, interdisciplinary, and informed decision-making about water resources in Oregon, and a presentation of our findings to our Oregon Water Resources Department partners resulted in two invitations from OWRD to come back and present the information to their regional managers and the Oregon Water Resources Commission.
2
Problem and Research Objectives: This was not a research project; it was an information generation project, resulting in several geospatial datasets. The problem addressed was the lack of compatible hydrological, population, and hydropolitical datasets for Oregon Water Resources Department administrative basins which would allow for an understanding of demographic, conflict, and water supply trends in different basins in Oregon. Our objectives were to: 1. Create basin-level hydrologic indices summarizing: a) drought conditions; b) percent of water allocated for consumptive uses by existing water rights; and c) water quality; 2. Create basin-level demographic layers from Census data which summarized population and other demographic indicators driving water use; and 3. Create basin-level Hydropolitical data which summarized incidents and issues of conflict and cooperation. Methods, Procedures, and Facilities: This project was a collaborative effort among three institutions: Oregon State University (OSU) Department of Geosciences; Portland State University’s Population Research Center; and the Oregon Water Resources Department. Procedures:
1. Compiled and consolidated existing hydrologic data (NRCS Surface Water Supply Index; OWRD Water Availability Reporting System; and ODEQ’s Water Quality Index and transform it into water availability indices for each of Oregon’s 18 administrative basins for the years 1990 - 2004
2. Adapted 1990 and 2000 census data to fit the boundaries of Oregon’s 18 administrative water basins, compatible with water availability and hydropolitical indices GIS coverages - PSU
3. Created a hydropolitical event database for Oregon for the period 1990-2004, using Lexis-Nexis database for news events and legal cases from the Federal and State Courts - OSU
4. Summarize the contents of the each of the datasets (hydrologic, demographic, and hydropolitical) in the form of maps – OSU & PSU
5. Document the methodologies associated with the creation of the datasets within a summary report, on the internet as part of metadata associated with each database
6. Train graduate students in database and GIS construction using hydrologic and census data Principal Findings and Significance: The best way to illustrate the findings is through the maps that were generated from this project, but we will summarize in the narratives below. The maps showing these results are available on the website. The significance of the findings is that they have created a visual medium for showing trends over time or specific years that can allow for comparison of conditions across the state. The Hydropolitical information is exemplary of this in particular – Our datasets are by no means a complete sampleof conflict and cooperation in Oregon, but an initial glance at where and when issues have been covered in the media or by litigation. The Hydropolitical dataset thus can serve as a starting point to get the attention of policy makers and decision makers and to show that it is possible to look at water conflict and cooperation in space and time, and therefore analyze it systematically. The Hydropolitical dataset turned out to be the information that was most interesting to our collaborators at OWRD. Hydrologic Indices: Drought index: The drought index showed relative wetness and dryness values for OWRD basins representing variations from the norm – the values were similar to the same values for the SWSI index produced by NRCS. Consumptive Use Index: Most streams in Oregon are fully allocated, and become over-allocated in the summer months, particularly in the eastern side of the state. Water Quality Index: These values did not differ substantially from the DEQ values when placed in OWRD basins.
3
Population Indices: Population Density: Willamette Basin is both the most populous basin and the one with the highest population density. Overall, western basins tend to have larger populations and higher densities. Income: Average household income had followed a pattern similar to that of population change, with most densely populated or fast growing counties seeing bigger gains, while all coastal basins and those in the southeast experiencing declines. Household income in OWRD administrative basins follows the rule of the "Rich getting richer, poor getting poorer": the basins with most gains in average household income also had highest levels of income in 2000, while all coastal basins had the lowest income levels. Average household income is the highest in Willamette and Sandy, followed by Deschutes and Rogue basins. Population Growth: Most rapid population growth had occurred in Sandy & Deschutes basins in the 1990s. Only one basin - Owyhee - had seen a decline in population. Growth in the Deschutes basin seems to be related to in-migration. About one third of Deschutes Basin's residents moved from outside of their county of residence since 1995, the highest level among basins. Hydropolitical Indices: News Events: Please note that this collection is limited to the records uncovered by a preliminary search of Lexis Nexis and Oregonian Newspaper on line articles and is in no way comprehensive. The values for each basin are presented as the number of reports/square mile and therefore are area corrected. In general, the news media reported more incidents of conflict or cooperation on the Western Side of the state, with the largest percentage of events reported per square mile in the Sandy, Klamath and the Willamette Basins. The Colombia River Basin, which is not an OWRD administrative basin, also had a large number of news reports on water related conflict and cooperation. The major issues reported in the news events had to do with 1) Endangered Species Act and 2) Water Quality were the top issues discussed . Fifty percent of the events reported were reporting incidents of cooperation, the overwhelming majority of these were scored at the highest level of cooperation, where stakeholder groups were formerly engaged in an activity that involved them working together on a water related issue. Ten percent of the events were scored as neutral, and the remaining 40 percent were conflictive. The conflictive events were concentrated in a median range of intensity; with the media reporting disagreements, dispute, or litigation among stakeholders regarding a water related issue. Litigation Records: This data set explored what the distribution and issues were in water related cases that went to either the state or federal courts. Please note that this collection is limited to the records uncovered by a preliminary search of Lexis Nexis on line cases and is in no way comprehensive. The values for each basin are presented as the number of reports/square mile and therefore are area corrected State Courts: Water rights and water quality were the primary issues driving water litigation in the State Courts. Willamette, Umatilla, and Rogue basins had the highest number of cases per square mile. Federal Courts: The Clean Water Act, Endangered Species Act, and National Environmental Protection act were the dominant Federal Laws under which litigation was filed. The primary issues were water quality, hydropower, and discharge. The Willamette/Sandy/Hood and Klamath basins had the highest incidence of Federal Litigation per area, followed by the Rogue, Umatilla, and Grande Ronde. Training and publications: From OREGON STATE UNIVERSITY: Kristel Fesler, MS Geography, Second year of program From PORTLAND STATE UNIVERSITY: Sonoko Endo, MS Urban Studies and Planning, Second year of program Laurel Harris, MS Urban Studies and Planning, Second year of program
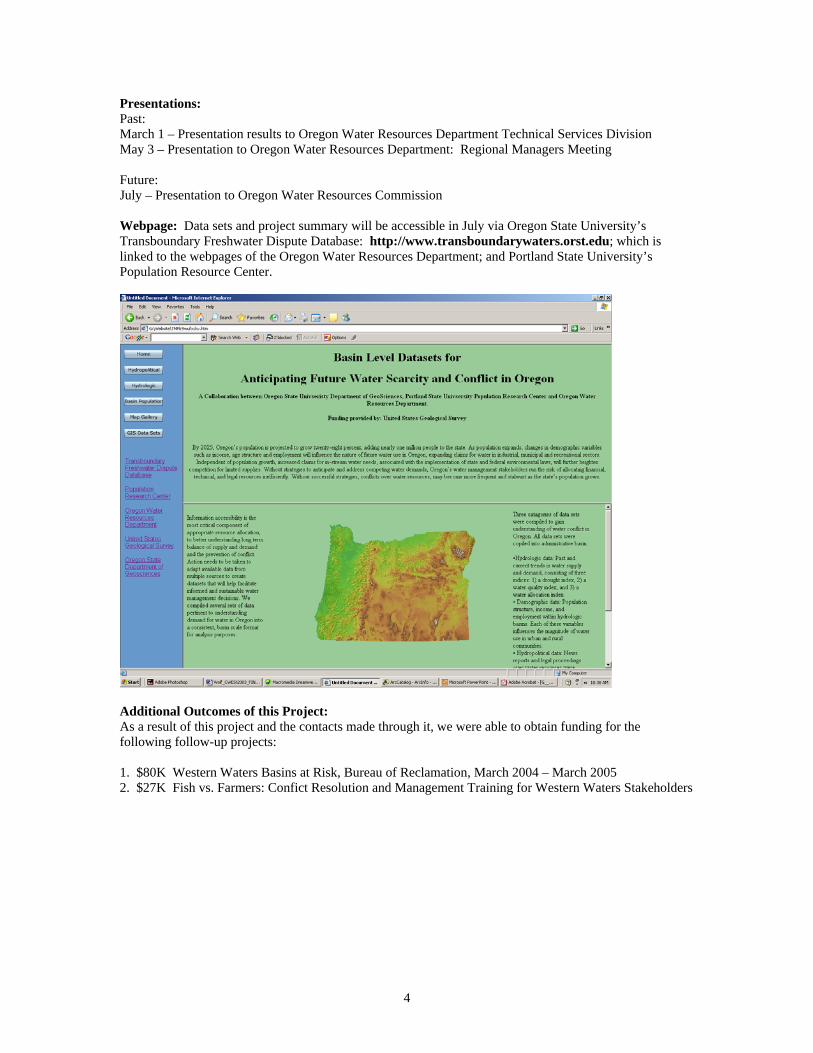
4
Presentations: Past: March 1 – Presentation results to Oregon Water Resources Department Technical Services Division May 3 – Presentation to Oregon Water Resources Department: Regional Managers Meeting Future: July – Presentation to Oregon Water Resources Commission Webpage: Data sets and project summary will be accessible in July via Oregon State University’s Transboundary Freshwater Dispute Database: http://www.transboundarywaters.orst.edu; which is linked to the webpages of the Oregon Water Resources Department; and Portland State University’s Population Resource Center.
Additional Outcomes of this Project: As a result of this project and the contacts made through it, we were able to obtain funding for the following follow-up projects: 1. $80K Western Waters Basins at Risk, Bureau of Reclamation, March 2004 – March 2005 2. $27K Fish vs. Farmers: Confict Resolution and Management Training for Western Waters Stakeholders
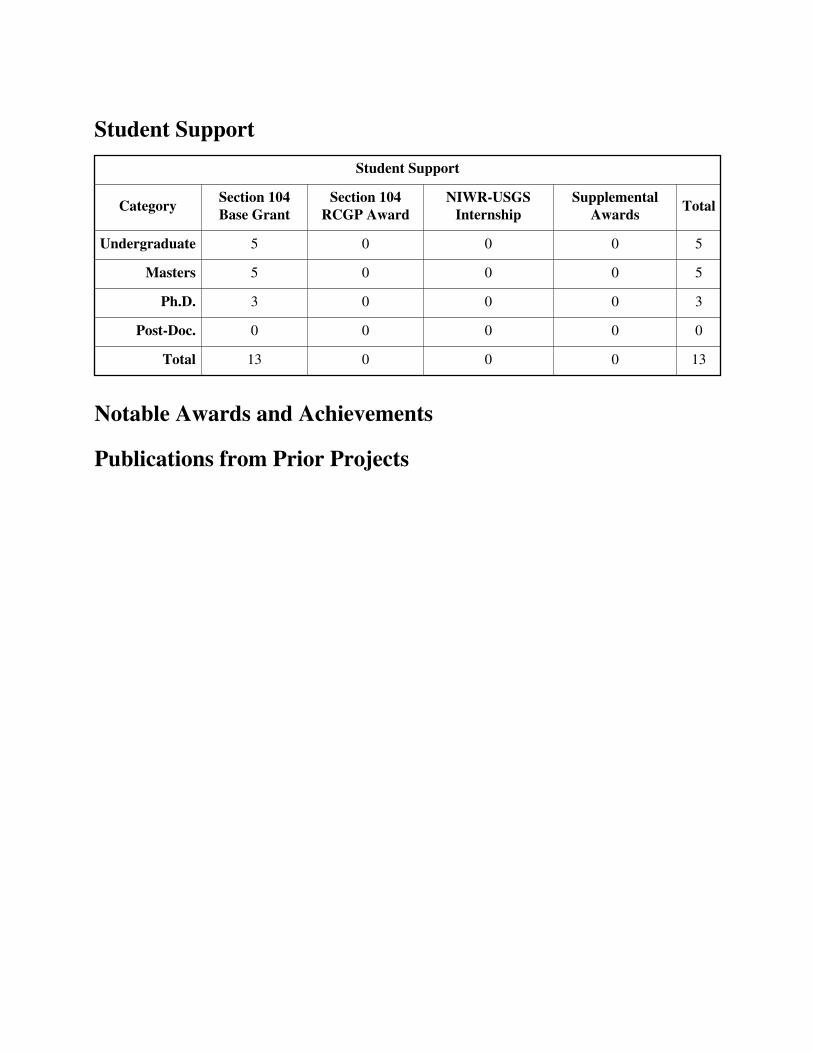
Student SupportStudent Support
Category Section 104Base Grant
Section 104RCGP Award
NIWR-USGS Internship
Supplemental Awards Total
Undergraduate 5 0 0 0 5
Masters 5 0 0 0 5
Ph.D. 3 0 0 0 3
Post-Doc. 0 0 0 0 0
Total 13 0 0 0 13
Notable Awards and Achievements
Publications from Prior Projects