Embed Size (px)
Citation preview
Center for Turbulence ResearchAnnual Research Briefs 2010
69
Full-system RANS of the HyShot II scramjetPart 2: Reactive cases
By V. E. Terrapon, R. Pecnik, F. Ham AND H. Pitsch
1. Motivation and objective
This is the second of a two-part study of the HyShot II scramjet. While the first partfocused on non-reacting cases, combustion and heat release are considered here. TheHyShot II model scramjet has been the subject of many studies. Experimentally, bothflight (e.g., Hass et al. 2005; Smart et al. 2006) and ground (e.g., Gardner et al. 2004;Schramm et al. 2008) measurements have provided useful data on the operation of high-speed air-breathing vehicles. However, many critical aspects of the combustion processesare not directly accessible to experimental measurements. Relying on computation istherefore a useful complement for physical understanding, design and failure analysis.This explains the large number of computational studies on the HyShot II system, rang-ing from quasi-one-dimensional models (Birzer & Doolan 2007) to, more recently, LESsimulations (Fureby et al. 2010; Ingenito et al. 2010).
The critical aspect in scramjet propulsion is that combustion takes place at supersonicspeeds. Therefore, the flow has a very short residence time, i.e., of the order of 1ms, dur-ing which air and fuel must mix on a molecular level, and chemical reactions have to becompleted before leaving the engine. Moreover, supersonic flows are usually accompaniedby shocks that interact with both the turbulence and the flame. The kinetic energy of thefree stream of air entering the propulsion engine is of the same order of magnitude as thecombustion heat release. This results in a small net thrust compared to the aerodynamicdrag, and minimizing this drag becomes critical. On the other hand, an excessive heatrelease can lead to the unstart phenomenon, i.e., the choking of the engine, that causesa sudden drop in thrust and large mechanical loads on the structure. Performance opti-mization thus requires maximizing thrust without crossing the unstart bound. Since heatrelease is at the heart of a scramjet operation and the main contributor to unstart, theimplementation of an accurate combustion model for supersonic combustion is critical.
A comparison between flight data and CFD calculations was performed by Boyce et
al. (2003), but showed a consistently lower pressure level than the experimental measure-ments. Steelant et al. (2006) and Karl et al. (2006) performed RANS simulations of theHyShot II configuration and compared these with both flight and ground experiments.This work was then extended in Karl et al. (2008), where a systematic study of inflowconditions and turbulence models was performed. The combustion model used in thesestudies relied on finite-rate chemistry and the explicit transport of the involved species.The turbulence-chemistry interaction was modeled using a multivariate assumed prob-ability distribution function (PDF) introduced by Baurle & Girimaji (2003). A similarapproach, but with a different code, was used by Kindler et al. (2008), who demonstratedthat the use of a closure model for the species source term and an accurate mechanismare critical to accurately reproduce the physics. Nevertheless, some authors found goodagreement with experiments while neglecting appropriate closure. Kodera et al. (2005),for instance, investigated different injection strategies in a modified version of the HyShot

70 V. E. Terrapon et al.
combustor. Other approaches to deal with this closure problem have been followed forsupersonic combustion, like the Eddy Dissipation Concept model (Chakraborty et al.
2000), or with closure based on transported PDF (Baurle et al. 1995). Some authorshave also used the Linear Eddy Mixing model (LEM) (Genin et al. 2004). But due tothe strong non-linearity of the source term and the wide range of time scales associatedwith the chemistry, those equations are very stiff and difficult to solve. Moreover, due tovery short residence times in such high-speed flows, flame stabilization mechanisms aregoverned by auto-ignition. It is critical to model accurately such ignition and extinctionphenomena in order to predict the stability of scramjet combustion. Therefore, predic-tion of flame stabilization requires a detailed description of the chemical kinetics. While amodel transporting all involved species can easily be extended to more detailed chemicalmechanisms, it quickly becomes computationally intractable, especially when complexfuels are considered. Since combustion in a scramjet is mostly mixing controlled, it isalso critical to accurately predict turbulent mixing. Very recently some authors have re-lied on large eddy simulation (LES) and showed that capturing turbulent eddies improvesmixing and, thus, combustion predictions (Ingenito et al. 2010; Fureby et al. 2010).
All the aforementioned studies have relied on transporting all involved species and someclosure models for the turbulence-chemistry interaction. An alternative approach is basedon the flamelet concept (Peters 2000; Pitsch 2006), which assumes that the chemicaltime scales are shorter than the turbulent time scales of the energy-containing eddies sothat the flame can be approximated as one-dimensional. The flamelet approach allows thecomputation of the chemistry to be performed independently of the combustor simulationand stored in tabulated form as a function of a limited number of scalars. During theactual scramjet simulation, the quantities of interest are read and interpolated, thusdramatically decreasing the computational cost and allowing the use of complex chemicalmechanisms. However, typical implementations of the flamelet model are based on a lowMach number assumption, explaining the still very limited number of studies of high-speed flows using this approach (Berglund & Fureby 2007; Terrapon et al. 2009).
A similar combustion model based on tabulated chemistry, as described in the nextsection, is presented here. The model is then used to simulate the heat release in theHyShot II combustor. First, a constant equivalence ratio φ = 0.3 is used and results arecompared with the experimental measurements performed in the High Enthalpy ShockTunnel (HEG) of the German Aerospace Center (DLR) (Gardner et al. 2004). In a secondstep, the fuel flow rate is increased and the evolution of the flow topology towards unstartis investigated.
2. Combustion Model
2.1. Equations
The conserved Favre-averaged variables Q = {ρ, ρui, ρE, ρZ, ρZ ′′2, ρC}T are solved in
conservative form, where ρ is the density, ui the components of the velocity vector, E
the total energy, including the chemical energy, Z the mixture fraction, Z ′′2 the varianceof the mixture fraction and C a progress variable. The transport equations are
∂ρ
∂t+
∂ρuj
∂xj= 0, (2.1)
Full-system RANS of the HyShot II scramjet, Part 2 71
∂ρui
∂t+
∂ρuiuj
∂xj+
∂p
∂xi=
∂
∂xj
[(µ + µt)
(∂ui
∂xj+
∂uj
∂xi−
2
3δij
∂uk
∂xk
)−
2
3ρkδij
], (2.2)
∂ρE
∂t+
∂ρujE
∂xj=
∂
∂xj
[(λ
cp+
µt
Prt
)∂h
∂xj
]+
∂
∂xj
[N∑
k=1
(ρDk −
λ
cpk
)hk
∂Yk
∂xj
]
+∂
∂xj
[(µ +
µt
σk
)∂k
∂xj− uj p + ui
(τij + τR
ij
)],
(2.3)
∂ρZ
∂t+
∂ρujZ
∂xj=
∂
∂xj
[(ρD +
µt
Sct
)∂Z
∂xj
], (2.4)
∂ρZ ′′2
∂t+
∂ρujZ ′′2
∂xj=
∂
∂xj
[(ρD +
µt
Sct
)∂Z ′′2
∂xj
]+ 2
µt
Sct2
∂Z
∂xj
∂Z
∂xj− ρχ, (2.5)
∂ρC
∂t+
∂ρujC
∂xj=
∂
∂xj
[(ρD +
µt
Sct
)∂C
∂xj
]+ ¯ωC , (2.6)
where µ and µt are the laminar and turbulent viscosity, k the turbulent kinetic energy, λthe thermal diffusivity, cp the specific heat capacity at constant pressure, Prt a turbulentPrandtl number, h the sensible and chemical enthalpy, Yk the species mass fractions, σk
the turbulent kinetic energy Schmidt number, τij and τRij the viscous and Reynolds
stresses as defined on the right-hand side of Eq. (2.2), D the diffusion coefficient for thescalars, Sct a turbulent Schmidt number, χ the scalar dissipation rate and ωC the sourceterm for the progress variable. The laminar properties µ, λ, cp are computed using mixingrules (Bird et al. 2007), thus accounting for changes in composition and temperature.The turbulent viscosity µt and the kinetic energy k are computed with an adequateturbulence model.
Notice that the summation on the right-hand side of Eq. (2.3) vanishes under the unityLewis number assumption Lek = 1, so that the species mass fractions do not need to beexplicitly computed. Although the unity Lewis number assumption is not valid in thecase of hydrogen, it is assumed that turbulent diffusion is much higher than the laminardiffusion, so this term can be neglected.
In order to close this system, the pressure and the temperature need to be determined.This is achieved, as explained below, by using an equation of state and the definition ofthe energy and enthalpy.
2.2. Flamelet-based combustion model
The combustion model used here is based on a Flamelet/Progress Variable approach(Pierce & Moin 2004; Ihme et al. 2005), in which the chemistry is pre-computed andtabulated as a series of laminar flamelet solutions for a given set of boundary conditionsand background pressure. In the low Mach number flamelet implementation, the tem-perature and the species mass fraction are assumed to depend only on a transportedscalar, traditionally the mixture fraction, and its dissipation rate. Chemical tables arethen constructed assuming constant background pressure. However, the low Mach num-ber assumptions no longer hold at supersonic speed where compressibility effects and
72 V. E. Terrapon et al.
viscous heating play an important role. Therefore, the temperature is here computedfrom the transported total energy E and the species mass fractions Yk. Further, themodel is extended for the auto-ignition regime with arguments similar to those in themodel developed by Cook et al. (2007) for ignition in HCCI engines. Assumed PDFs areintroduced to account for the turbulence/chemistry interaction. Typically, a β-PDF isassumed for the mixture fraction Z and a δ-PDF for the progress variable C. Therefore,the flamelet library is parametrized by the mean mixture fraction Z, the variance of the
mixture fraction Z ′′2, and the mean progress variable C.The total energy E of the N species mixture is defined as the sum of the internal
energy including chemical energy e, the kinetic energy 1/2u2j and the turbulent kinetic
energy k. The internal energy is
e = h − RT =
N∑
k=1
Ykhk − RT , (2.7)
where R = Ru
∑k Yk/Wk is the gas constant, Ru the universal gas constant, Wk the
molecular weight of species k and T the temperature. The specific enthalpy of species kis computed as
hk(T ) = ∆h0k(Tref ) +
∫ T
Tref
cp,k(T ′)dT ′, (2.8)
using its specific heat capacity cp,k and heat of formation ∆h0k(Tref ). Due to the wide
range of temperature in a high-speed flow, the dependence of the heat capacity on tem-perature must be considered.
Since the total energy is a non-linear function of the temperature, an iterative methodlike Newton-Raphson is required to compute the temperature given E. In order to elimi-nate this expensive iterative step, an alternate approach is proposed. For a given mixture,
i.e., for fixed Z, Z ′′2 and C, Eq. (2.7) can be approximated as
e = e0 +
∫ T
T0
cv(T )dT = e0 +
∫ T
T0
R0
γ(T ) − 1dT, (2.9)
where γ is the ratio of the specific heats. γ can be expanded about the flamelet solutionusing a linear expansion in temperature,
γ(T ) = γ0 + aγ(T − T0), (2.10)
where the subscript 0 denotes the value at the flamelet solution. The values of e0, R0, γ0,aγ and T0 can be computed during a preprocessing step and tabulated in the chemistrylibrary. This approximation leads to an analytical relationship between temperature andspecific energy
e = e0 +R
aγln
(1 +
aγ(T − T0)
γ0 − 1
), (2.11)
T = T0 +γ0 − 1
aγ
(eaγ(ee−ee0)/ eR − 1
). (2.12)
In order to completely close the system of equations (2.1)-(2.6), the equation of statefor an ideal gas is used to compute the pressure
p = ρRT . (2.13)
Full-system RANS of the HyShot II scramjet, Part 2 73
A similar expansion around the flamelet solution is used for µ and λ/cp, where thefunctional form of the expansion is based on a power law
µ = µ0
(T
T0
)aµ
, (2.14)
λ/cp = λ/cp0
(T
T0
)aλ
. (2.15)
In practice, the constants aµ and aλ are kept constant at a value of 0.7 and 0.62, respec-tively.
2.3. Pressure rescaling of the progress variable source term
It can be shown that the source term for the progress variable is very sensitive to pres-sure. Therefore, we introduce a rescaling of the progress variable source term to accountfor pressure variations due to compressibility. Because the majority of the fundamentalchemical reactions controlling the oxidation of hydrogen involve bimolecular reactions,the source term scales with the square of the pressure. We can thus rescale the sourceterm in Eq. (2.6) as follows:
¯ωC = ¯ωC0
p2
p20
, (2.16)
where ¯ωC0is the tabulated source term computed at a background pressure p0. A sim-
ilar approach is being developed to account for the dependence of the source term ontemperature.
3. Results
The same configuration and conditions as in part I are investigated here. The numericalimplementation and the meshes used are also identical (see also Pecnik et al. 2009). Thek-ω SST model is used for all simulations. Note that the scalars for the combustionmodel, i.e., Z, Z ′′2 and C, are solved fully coupled with the Navier-Stokes equations.The turbulent Schmidt and Prandtl numbers are, respectively, Sct = Sct2 = 0.5 andPrt = 0.5.
The chemistry model is based on the GRI-Mech v3.0 mechanism modified with newOH thermodynamics data (Herbon et al. 2002) and new H+O2+M rates (Bates et al.
2001). The nine species considered are nitrogen (N2), molecular and atomic oxygen andhydrogen (O2, O, H2, H), water (H2O), hydrogen peroxide (H2O2), and the hydroxyland hydroperoxyl radicals (OH, HO2). The mechanism consists of 28 reactions. Nitrogenchemistry is not considered in this model. The chemistry table has been created froma series of laminar diffusion flamelet computations using the FlameMaster code. Thepressure was chosen to correspond to an approximate average combustor pressure ofP = 1.5 bar, whereas the boundary conditions were set to TO = 1300 K for the oxidizerand TF = 300 K for the fuel. The progress variable is defined as the mass fraction ofwater, i.e., C = YH2O.
3.1. Nominal fuel flow rate
As a first step, the model is compared to experimental data from DLR for the nomi-nal fuel flow rate corresponding to an equivalence ratio of φ = 0.3 (Hannemann et al.
2010). This case has been computed with two different meshes (see part I). The first one

74 V. E. Terrapon et al.
0 100 200 300 4000
0.005
0.01
0.015
0.02
0.025
x[mm]
P/P
0
Figure 1. Pressure along the bottom wall of the combustor between two hydrogen injectors.The pressure is normalized by the total pressure P0 = 17.7 MPa. One eighth of the combustorwithout side walls, continuous line; one half of the combustor with side walls, dotted line; andexperimental data, symbols with error bars. The location of the injector is indicated by thegeometry schematics at the bottom of the figure.
corresponds to one eighth of the combustor span including half an injector. Symmetryboundary conditions are used for the sides of the domain in the spanwise direction. Inthe second configuration, half of the combustor and 2 injectors are included in the com-putational domain. In addition, a side wall with a no-slip boundary condition is used onone side, while a symmetry condition is used for the other side. This second configurationintroduces additional physics as a shock originates from the leading edge of the side walland propagates throughout the combustion chamber.
Figure 1 shows the normalized pressure trace at the bottom wall of the combustor(body side) along the centerline (i.e., between two injectors). In this and the followingfigures the position of the injector and the beginning of the exhaust nozzle are indicated inthe combustor schematics. The error bars on the experimental measurements result fromvariability across different runs (different total conditions) and from the time fluctuationsover the duration of the measurements. Note that the large variability observed acrossruns is mostly due to variability in the fuel injection pressure. The results agree wellwith the experimental measurements, with a slightly lower computed pressure towardsthe end of the straight section of the combustor. The two computational domains (withand without side walls) lead to a similar pressure level, but small differences can beobserved.
Slightly larger discrepancies are seen in the wall heat flux (Figure 2). In particular,the overall heat flux in the downstream half of the combustor is slightly overpredictedby the computation. The computed heat flux also indicates small differences betweenthe two computational domains. These discrepancies originate from the additional shockcreated by the leading edge of the side walls (half combustor case), as illustrated byFigure 3. Contours of pressure are plotted in a plane parallel to the bottom wall ata wall-normal distance of y/d = 0.25, where d = 2 mm is the injector diameter. The
Full-system RANS of the HyShot II scramjet, Part 2 75
0 100 200 300 400-0.0002
0
0.0002
0.0004
0.0006
0.0008
x[mm]
Q/Q
0
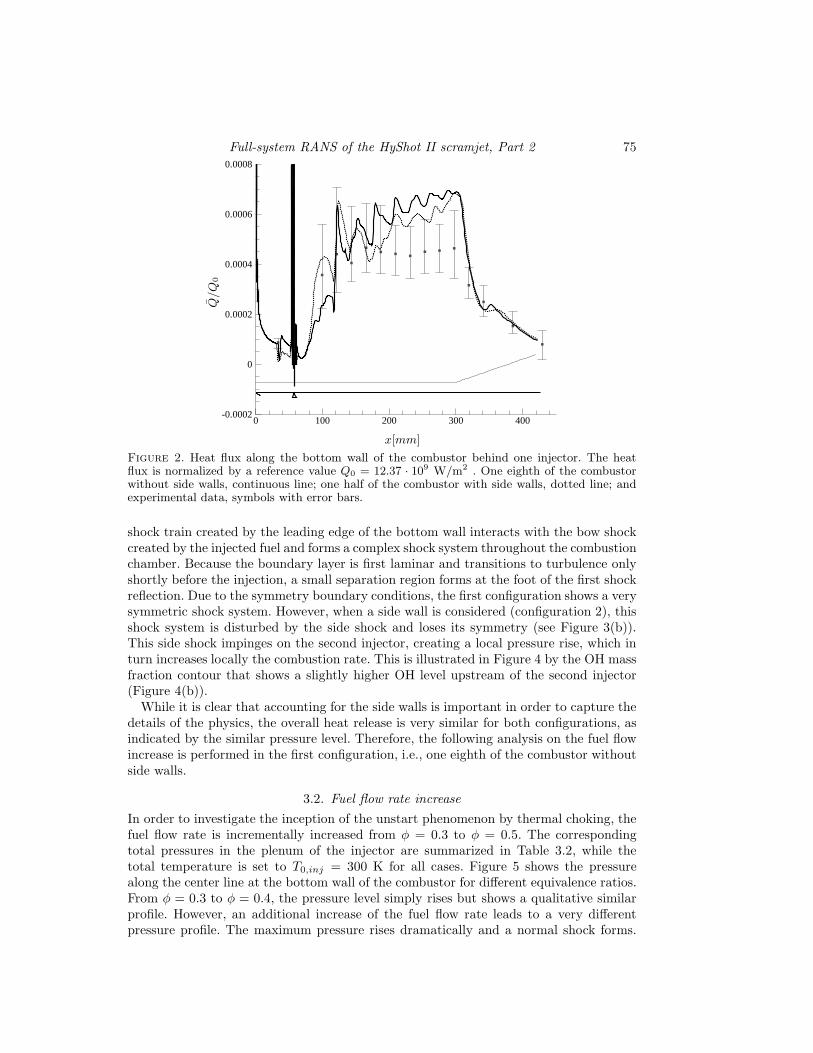
Figure 2. Heat flux along the bottom wall of the combustor behind one injector. The heatflux is normalized by a reference value Q0 = 12.37 · 109 W/m2 . One eighth of the combustorwithout side walls, continuous line; one half of the combustor with side walls, dotted line; andexperimental data, symbols with error bars.
shock train created by the leading edge of the bottom wall interacts with the bow shockcreated by the injected fuel and forms a complex shock system throughout the combustionchamber. Because the boundary layer is first laminar and transitions to turbulence onlyshortly before the injection, a small separation region forms at the foot of the first shockreflection. Due to the symmetry boundary conditions, the first configuration shows a verysymmetric shock system. However, when a side wall is considered (configuration 2), thisshock system is disturbed by the side shock and loses its symmetry (see Figure 3(b)).This side shock impinges on the second injector, creating a local pressure rise, which inturn increases locally the combustion rate. This is illustrated in Figure 4 by the OH massfraction contour that shows a slightly higher OH level upstream of the second injector(Figure 4(b)).
While it is clear that accounting for the side walls is important in order to capture thedetails of the physics, the overall heat release is very similar for both configurations, asindicated by the similar pressure level. Therefore, the following analysis on the fuel flowincrease is performed in the first configuration, i.e., one eighth of the combustor withoutside walls.
3.2. Fuel flow rate increase
In order to investigate the inception of the unstart phenomenon by thermal choking, thefuel flow rate is incrementally increased from φ = 0.3 to φ = 0.5. The correspondingtotal pressures in the plenum of the injector are summarized in Table 3.2, while thetotal temperature is set to T0,inj = 300 K for all cases. Figure 5 shows the pressurealong the center line at the bottom wall of the combustor for different equivalence ratios.From φ = 0.3 to φ = 0.4, the pressure level simply rises but shows a qualitative similarprofile. However, an additional increase of the fuel flow rate leads to a very differentpressure profile. The maximum pressure rises dramatically and a normal shock forms.

76 V. E. Terrapon et al.
(a) One eighth of the combustor without side walls (mirrored four times).
(b) One half of the combustor with side walls.
Figure 3. Contour of pressure in a plane parallel to the bottom wall of the combustor locatedat y/d = 0.25.
(a) One eighth of the combustor without side walls (mirrored four times).
(b) One half of the combustor with side walls.
Figure 4. Contour of OH mass fraction in a plane parallel to the bottom wall of thecombustor located at y/d = 0.25.
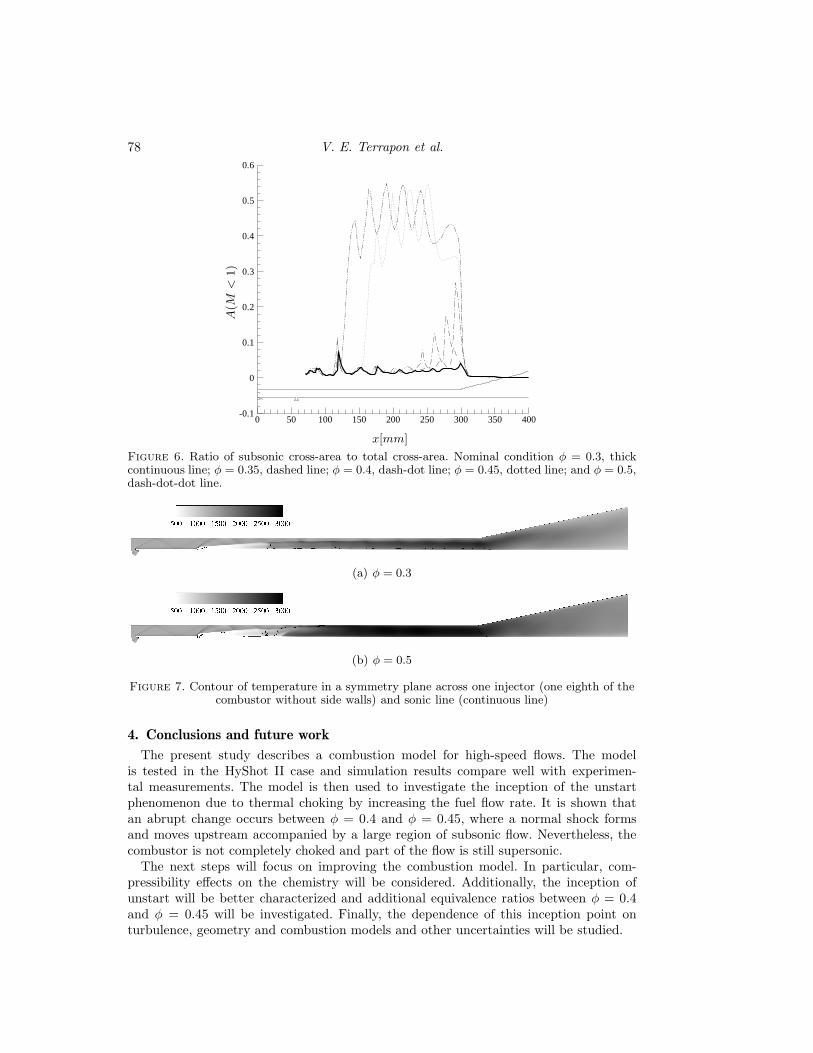
The location of this normal shock moves upstream with increasing fuel flow rate. Notethat the shock train is still present behind the normal shock, demonstrating the flowbehind the normal shock is not completely subsonic. This is confirmed in Figure 6, wherethe ratio of subsonic cross-area to the total cross-area is shown. Approximately half ofthe combustor area is subsonic between the first normal shock and the beginning of theexhaust nozzle.
The large pressure increase is caused by the additional heat release due to higher fuelflow rate. This is illustrated in Figures. 7 and 8 where contours of temperature and water
Full-system RANS of the HyShot II scramjet, Part 2 77
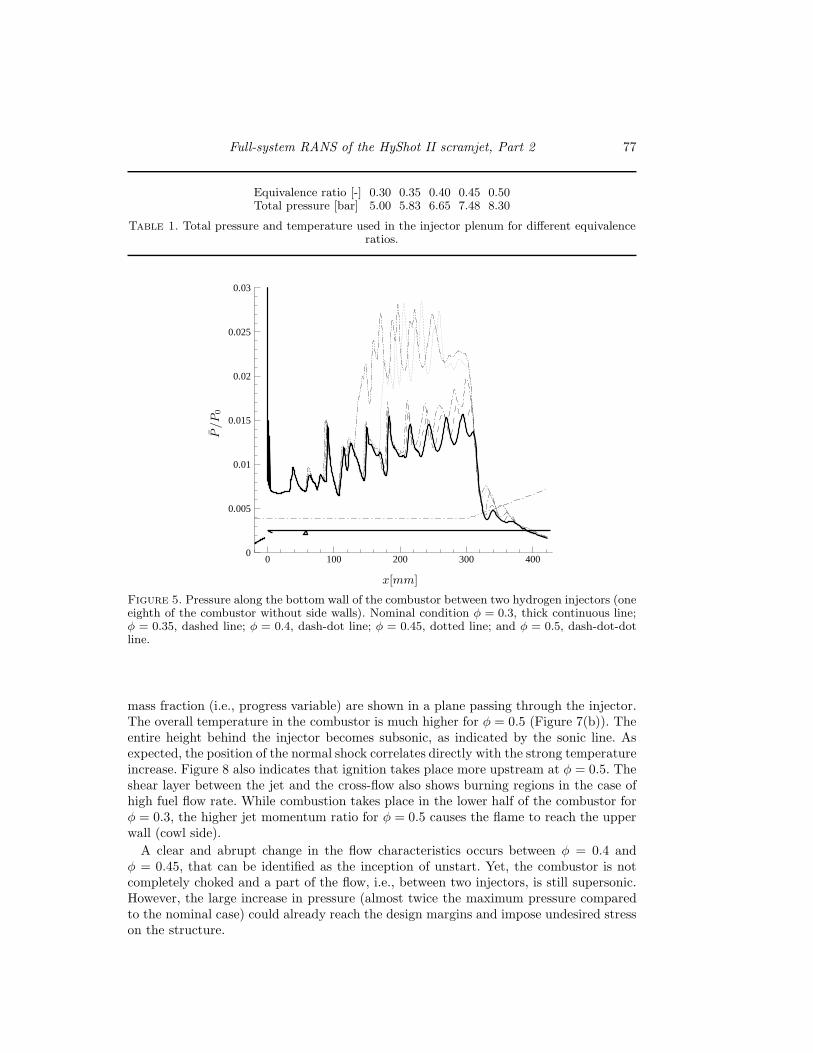
Equivalence ratio [-] 0.30 0.35 0.40 0.45 0.50Total pressure [bar] 5.00 5.83 6.65 7.48 8.30
Table 1. Total pressure and temperature used in the injector plenum for different equivalenceratios.
0 100 200 300 4000
0.005
0.01
0.015
0.02
0.025
0.03
x[mm]
P/P
0
Figure 5. Pressure along the bottom wall of the combustor between two hydrogen injectors (oneeighth of the combustor without side walls). Nominal condition φ = 0.3, thick continuous line;φ = 0.35, dashed line; φ = 0.4, dash-dot line; φ = 0.45, dotted line; and φ = 0.5, dash-dot-dotline.
mass fraction (i.e., progress variable) are shown in a plane passing through the injector.The overall temperature in the combustor is much higher for φ = 0.5 (Figure 7(b)). Theentire height behind the injector becomes subsonic, as indicated by the sonic line. Asexpected, the position of the normal shock correlates directly with the strong temperatureincrease. Figure 8 also indicates that ignition takes place more upstream at φ = 0.5. Theshear layer between the jet and the cross-flow also shows burning regions in the case ofhigh fuel flow rate. While combustion takes place in the lower half of the combustor forφ = 0.3, the higher jet momentum ratio for φ = 0.5 causes the flame to reach the upperwall (cowl side).
A clear and abrupt change in the flow characteristics occurs between φ = 0.4 andφ = 0.45, that can be identified as the inception of unstart. Yet, the combustor is notcompletely choked and a part of the flow, i.e., between two injectors, is still supersonic.However, the large increase in pressure (almost twice the maximum pressure comparedto the nominal case) could already reach the design margins and impose undesired stresson the structure.
78 V. E. Terrapon et al.
0 50 100 150 200 250 300 350 400-0.1
0
0.1
0.2
0.3
0.4
0.5
0.6
x[mm]
A(M
<1)
Figure 6. Ratio of subsonic cross-area to total cross-area. Nominal condition φ = 0.3, thickcontinuous line; φ = 0.35, dashed line; φ = 0.4, dash-dot line; φ = 0.45, dotted line; and φ = 0.5,dash-dot-dot line.
(a) φ = 0.3
(b) φ = 0.5
Figure 7. Contour of temperature in a symmetry plane across one injector (one eighth of thecombustor without side walls) and sonic line (continuous line)
4. Conclusions and future work
The present study describes a combustion model for high-speed flows. The modelis tested in the HyShot II case and simulation results compare well with experimen-tal measurements. The model is then used to investigate the inception of the unstartphenomenon due to thermal choking by increasing the fuel flow rate. It is shown thatan abrupt change occurs between φ = 0.4 and φ = 0.45, where a normal shock formsand moves upstream accompanied by a large region of subsonic flow. Nevertheless, thecombustor is not completely choked and part of the flow is still supersonic.
The next steps will focus on improving the combustion model. In particular, com-pressibility effects on the chemistry will be considered. Additionally, the inception ofunstart will be better characterized and additional equivalence ratios between φ = 0.4and φ = 0.45 will be investigated. Finally, the dependence of this inception point onturbulence, geometry and combustion models and other uncertainties will be studied.

Full-system RANS of the HyShot II scramjet, Part 2 79
(a) φ = 0.3
(b) φ = 0.5
Figure 8. Contour of water mass fraction (progress variable) in a symmetry plane across oneinjector (one eighth of the combustor without side walls) and sonic line (continuous line).
Acknowledgments
The authors would like to thank Dr. K. Hannemann and S. Karl (German AerospaceCenter, DLR, Germany) for providing the experimental data. This material is basedupon work supported by the Department of Energy [National Nuclear Security Adminis-tration] under the Predictive Science Academic Alliance Program (PSAAP) at StanfordUniversity, Award Number(s) DE-FC52-08NA28614.
REFERENCES
Bates, R. W., Golden, D. M., Hanson, R. K. & Bowman, C. T. 2001 Experimentalstudy and modeling of the reaction H+O2+M → HO2 + M (M=Ar, N2, H2O) atelevated pressures and temperatures between 1050 and 1250 K. Phys. Chem. Chem.
Phys. 3(12), 2337–2342.
Baurle, R., Hsu, A. & Hassan, H. 1995 Assumed and evolution probability densityfunctions in supersonic turbulent combustion calculations. J. Propul. Power 11(6),1132–1138.
Baurle, R. & Girimaji, S. 2003 Assumed PDF turbulence-chemistry closure withtemperature-composition correlations. Combust. Flame 134, 131–148.
Berglund, M. & Fureby, C. 2007 LES of supersonic combustion in a scramjet enginemodel. Proc. Combust. Inst. 31, 2497–2504.
Birzer, C. & Doolan, C.J. 2007 Quasi-one-dimensional modeling of hydrogen fueledscramjet combustors. AIAA 2007-4314.
Bird, R.B., Stewart, W.E. & Lightfoot, E.N. 2007 Transport Phenomena, JohnWiley & Sons, Inc.
Boyce, R.R., Gerard, S. & Paull, A. 2003 The HyShot scramjet flight experiment- flight data and CFD calculations compared. AIAA 2003-7029.
Chakraborty, D., Paul, P. & Mukunda, H. 2000 Evaluation of combustion modelsfor high speed H2/air confined mixing layer using DNS data. Combust. Flame 121,195–209.
Cook, D. J., Pitsch, H., Chen, J. H. & Hawkes, E. R. 2007 Flamelet-based model-ing of auto-ignition with thermal inhomogeneities for application to HCCI engines.Proc. Combust. Inst. 31, 2903–2911.
Fureby, C., Chapuis, M., Fedina, E. & Karl, S. 2010 CFD analysis of the HyShotII scramjet combustor. Proc. Comb. Inst. (in press).
80 V. E. Terrapon et al.
Gardner, A. D., Hannemann, K., Steelant, J. & Paull, A. 2004 Ground testingof the HyShot supersonic combustion flight experiment in HEG and comparison withflight data. AIAA 2004-3345.
Genin, F., Chernyavsky, B. & Menon, S. 2004 Large eddy simulation of scramjetcombustion using a subgrid mixing/combustion model. AIAA 2004-7035.
Hannemann, K., Karl, S., Martinez Schramm, J. & Steelant, J. 2010 Method-ology of a combined ground based testing and numerical modeling analysis of su-personic combustion flow paths. Shock Waves 20(5), 353–366.
Hass, N.E., Smart, M.K. & Paull, A. 2005 Flight data analysis of HyShot 2. AIAA
2005-3354.
Herbon, J. T., Hanson, R. K., Golden, D. M. & Bowman C. T. 2002 A shocktube study of the enthalpy of formation of OH. Proc. Combust. Inst. 29, 1201–1208.
Ihme, M., Cha, C. M. & Pitsch, H. 2005 Prediction of local extinction and re-ignitioneffects in non-premixed turbulent combustion using a flamelet/progress variable ap-proach. Proc. Combust. Inst. 30, 793–800.
Ingenito, A., Bruno, C. & Cecere, D. 2010 LES of the HyShot scramjet combustor.AIAA 2010-758.
Karl, S., Hannemann, K., Mack, A. & Steelant, J. 2008 CFD analysis of theHyShot II scramjet experiments in the HEG shock tunnel. AIAA 2008-2548.
Karl, S., Hannemann, K., Steelant, J. & Mack, A. 2006 CFD analysis of theHyShot supersonic combustion flight experiment configuration. AIAA 2006-8041.
Kindler, M., Lempke, M., Blacha, T., Gerlinger, P. & Aigner, M. 2008 Numer-ical investigation of the HyShot supersonic combustion configuration. AIAA 2005-
3355.
Kodera, M., Sunami, T. & Itoh, K. 2005 Numerical simulation of a scramjet enginefor JAXA’s flight experiment using HyShot. AIAA 2005-3355.
Pecnik, R., Constantine, P., Ham, F. & Iaccarino, G. 2008 A probabilistic frame-work for high-speed flow simulations. Annual Research Briefs 2008. Center for Tur-bulence Research, Stanford University/NASA Ames, 3–17.
Pecnik, R., Terrapon, V.E., Ham, F. & Iaccarino, G. 2009 Full system scramjetsimulation. Annual Research Briefs 2009. Center for Turbulence Research, StanfordUniversity/NASA Ames, 33–45.
Peters, N. 2000 Turbulent Combustion, Cambridge University Press.
Pierce, C. D. & Moin, P. 2004 Progress-variable approach for large-eddy simulationof non-premixed turbulent combustion. J. Fluid Mech. 504, 73–97.
Pitsch, H. 2006 Large-eddy simulation of turbulent combustion. Annu. Rev. Fluid Mech.
38, 453–382.
Schramm, J.M., Karl, S., Hannemann, K. & Steelant, J. 2008 Ground testingof the HyShot II scramjet configuration in HEG. AIAA 2008-2547.
Smart, M. K., Hass, N. E. & Paull, A. 2006 Flight data analysis of the HyShot 2scramjet flight experiment. AIAA Journal 44(10), 2366–2375.
Steelant, J., Mack, A., Hannemann, K. & Gardner, A.D. 2006 Comparison ofsupersonic combustion tests with shock-tunnels, flight and CFD. AIAA 2006-4684.
Terrapon, V.E., Pecnik, R., Ham, F. & Pitsch, H. 2009 A flamelet-based modelfor supersonic combustion. Annual Research Briefs 2009. Center for TurbulenceResearch, Stanford University/NASA Ames, 47–58.