Embed Size (px)
Citation preview
QUANTIFYING THE COMPREHENSIVE GREENHOUSE
GAS CO-BENEFITS OF GREEN BUILDINGS
ARB Research Seminar DEC 17 2014
Dr. William Eisenstein
Kimberly Seigel Prof. Louise Mozingo
Prof. Ed Arens
CENTER FOR THE BUILT ENVIRONMENT CENTER FOR RESOURCE EFFICIENT COMMUNITIES
Project Purpose
• Estimate GHG emissions due to:
o Water use o Solid waste disposal o Transportation
in certified green commercial buildings in CA
Project Need
• Green buildings a major GHG-fighting
strategy at state and municipal levels
• Heavy focus on energy efficiency in buildings
• No full accounting of GHG co-benefits of water, solid waste, and transportation measures
• Achieve more complete assessment of potential GHG benefits of green buildings
• Facilitate progress toward GHG goals by allowing fuller accounting of green building benefits
• Stimulate voluntary actions to reduce
emissions by documenting role of green buildings
• Inform future building standards-setting
Project Goals
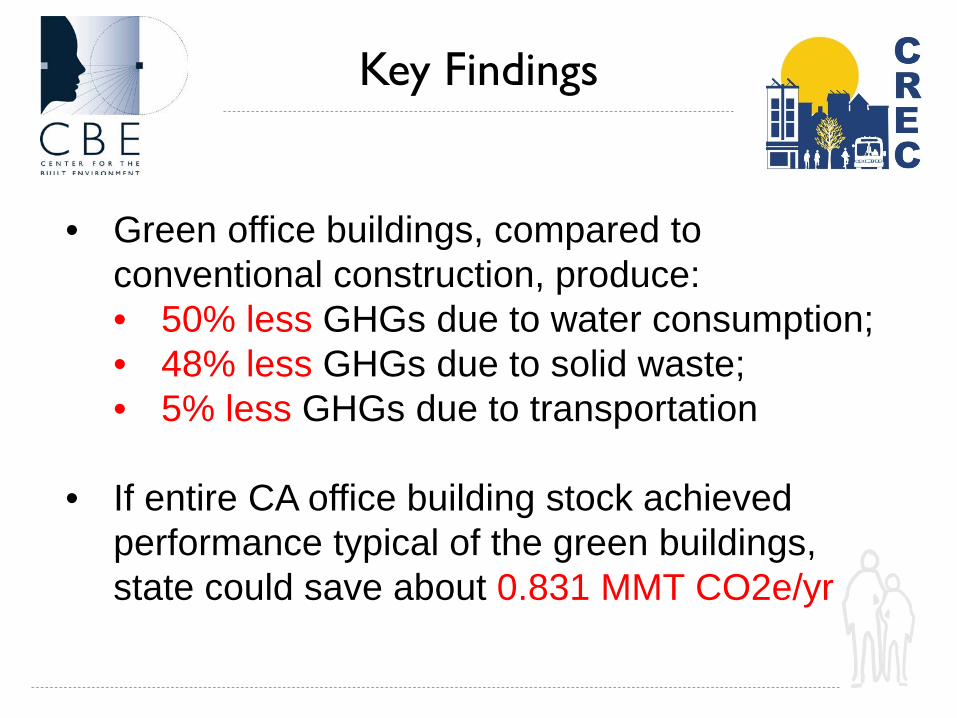
• Green office buildings, compared to conventional construction, produce: • 50% less GHGs due to water consumption; • 48% less GHGs due to solid waste; • 5% less GHGs due to transportation
• If entire CA office building stock achieved performance typical of the green buildings, state could save about 0.831 MMT CO2e/yr
Key Findings
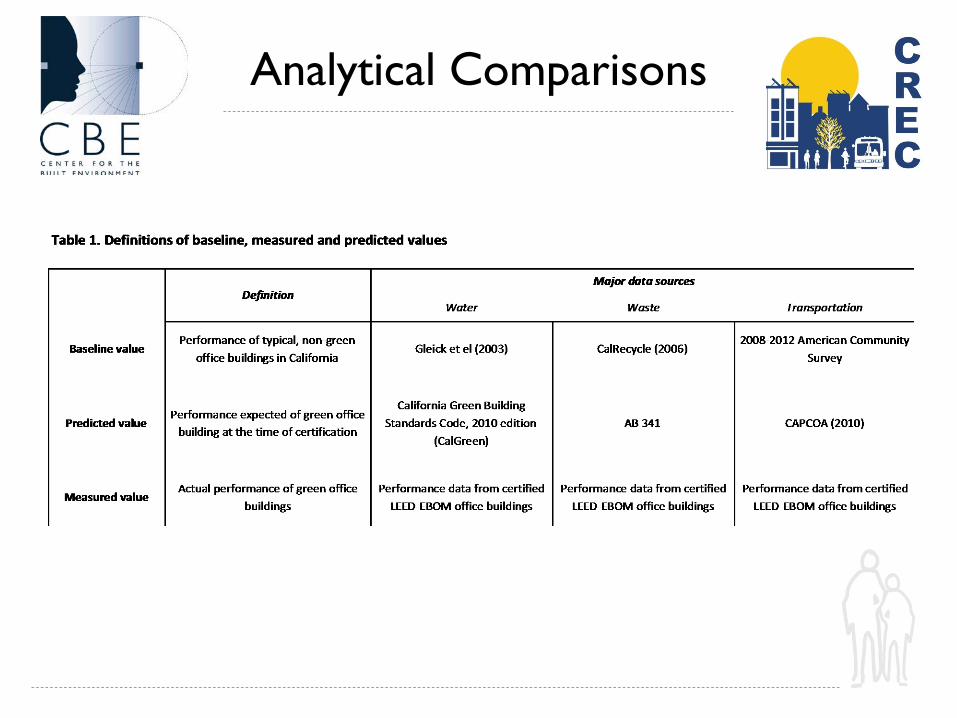
Analytical Comparisons
• LEED-EBOM is primary data source • Strength: Provides operational data
• Weakness: Little information on strategies
• Focus on commercial OFFICE buildings only
• Included buildings certified under LEED-EBOM 2008 and 2009
Green Building Data Source
LEED-EBOM notes
• LEED is a menu, not a recipe
• Many get credit just for measuring usage of water, waste, and transportation
• Additional credits available for achieving specified performance levels
• Minimal information on strategies used to achieve these performance levels
LEED-EBOM credits
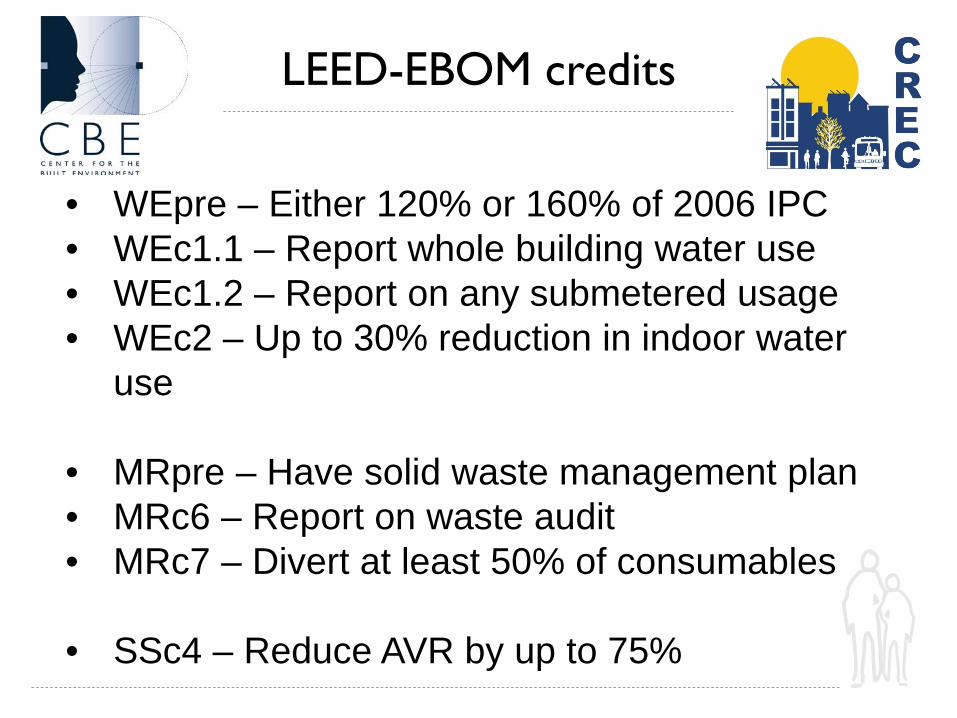
• WEpre – Either 120% or 160% of 2006 IPC • WEc1.1 – Report whole building water use • WEc1.2 – Report on any submetered usage • WEc2 – Up to 30% reduction in indoor water
use
• MRpre – Have solid waste management plan • MRc6 – Report on waste audit • MRc7 – Divert at least 50% of consumables
• SSc4 – Reduce AVR by up to 75%
Key Performance Data
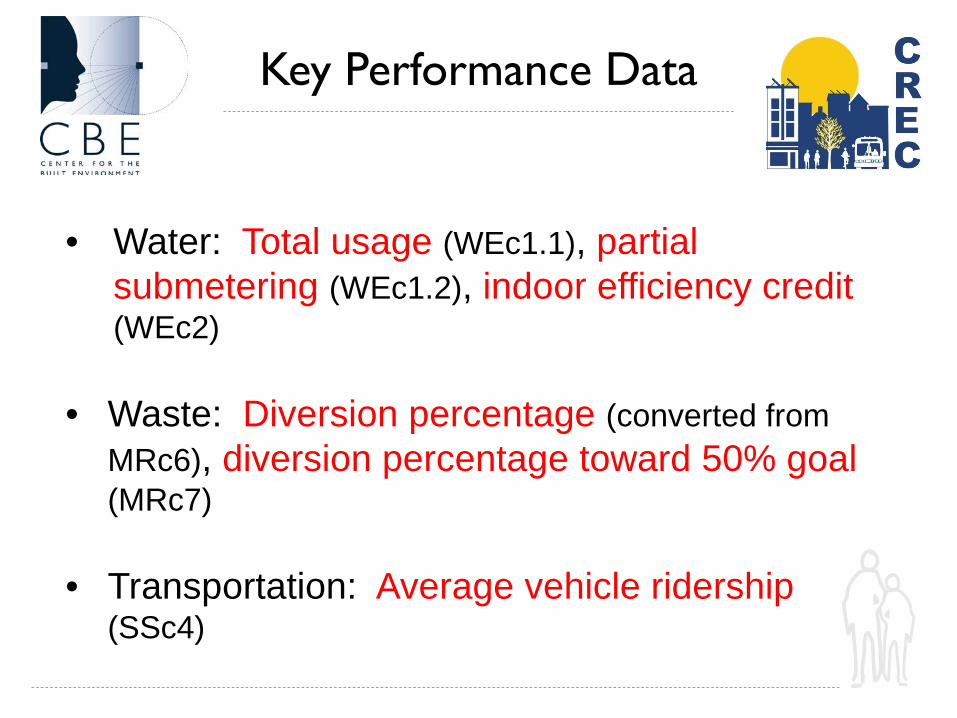
• Water: Total usage (WEc1.1), partial submetering (WEc1.2), indoor efficiency credit (WEc2)
• Waste: Diversion percentage (converted from MRc6), diversion percentage toward 50% goal (MRc7)
• Transportation: Average vehicle ridership (SSc4)

• Regional variations in: o Irrigation demand o Energy intensity of water o Regional transportation infrastructure
• Performed all calculations for: o Bay Area o Los Angeles o San Diego o Sacramento o Rest of California
Regional Variations
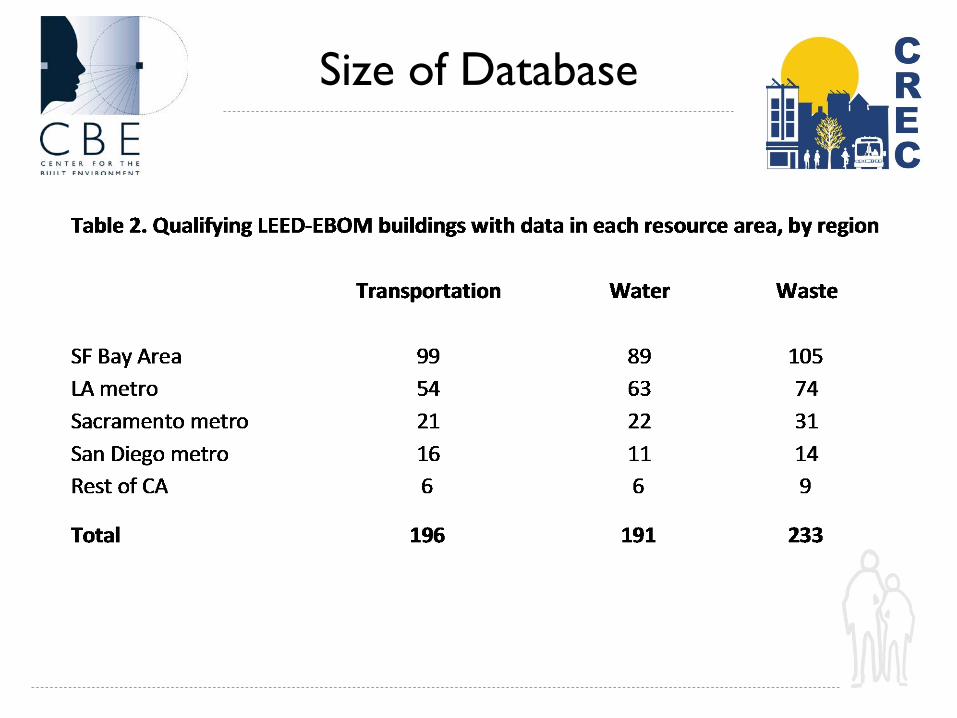
Size of Database
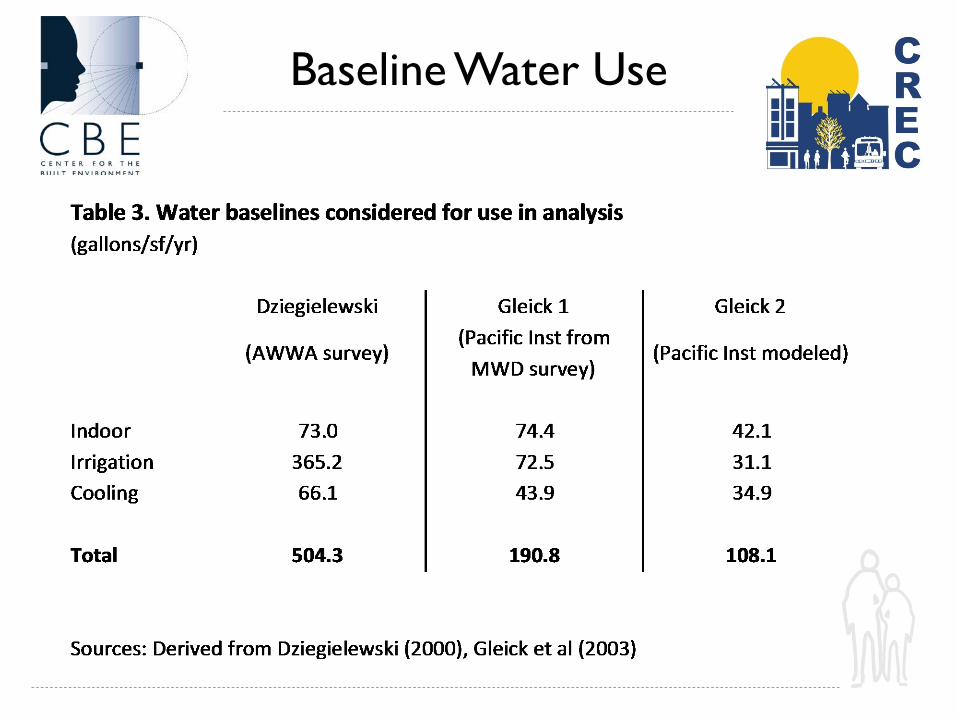
Baseline Water Use
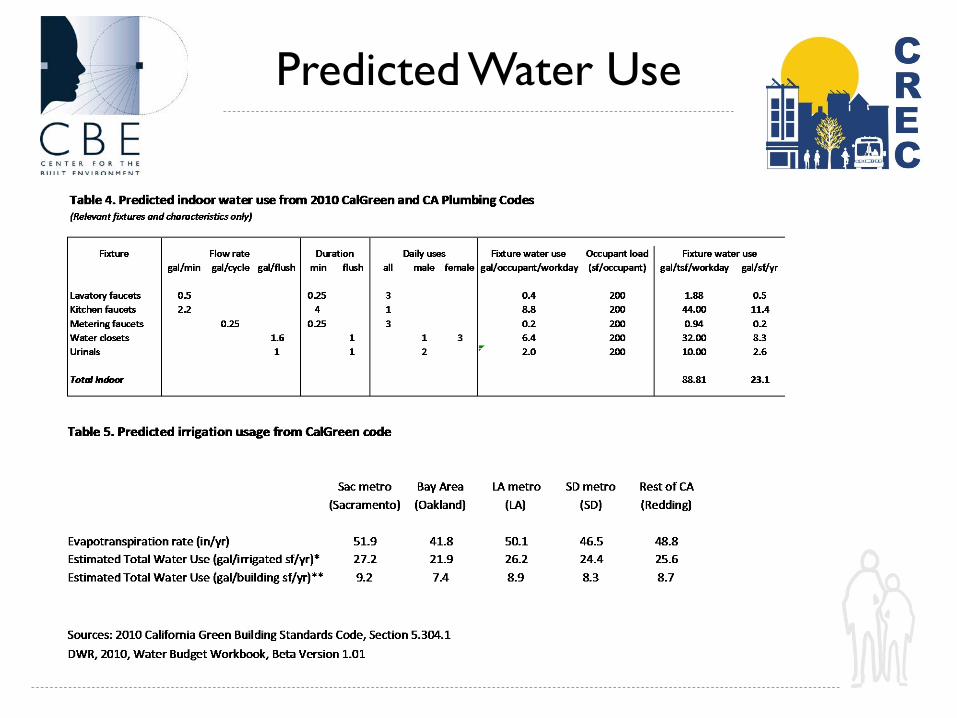
Predicted Water Use
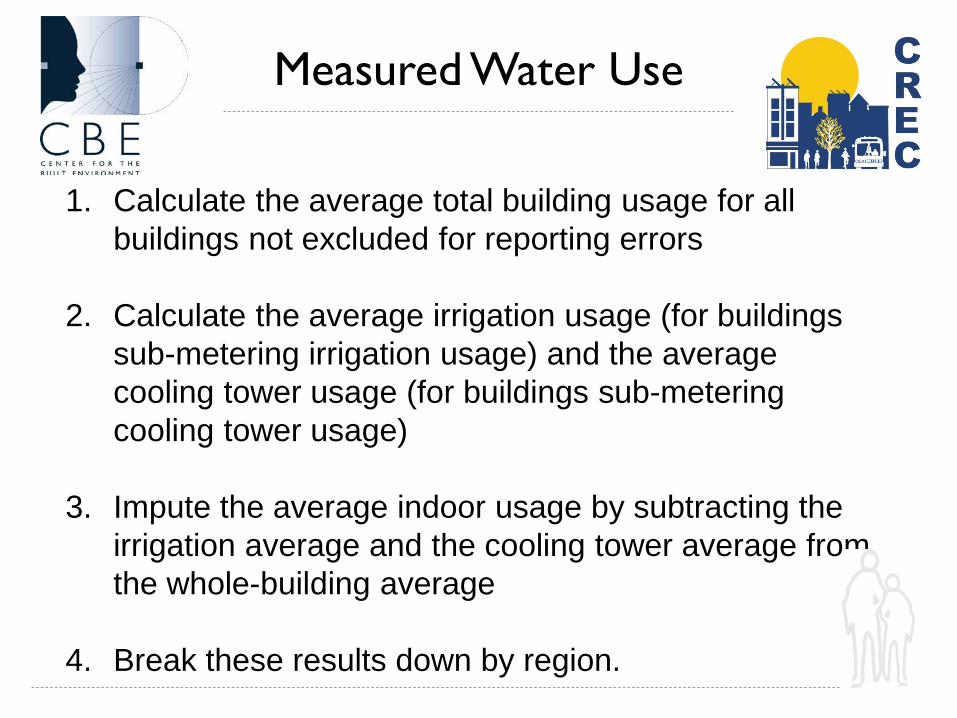
1. Calculate the average total building usage for all buildings not excluded for reporting errors
2. Calculate the average irrigation usage (for buildings sub-metering irrigation usage) and the average cooling tower usage (for buildings sub-metering cooling tower usage)
3. Impute the average indoor usage by subtracting the irrigation average and the cooling tower average from the whole-building average
4. Break these results down by region.
Measured Water Use
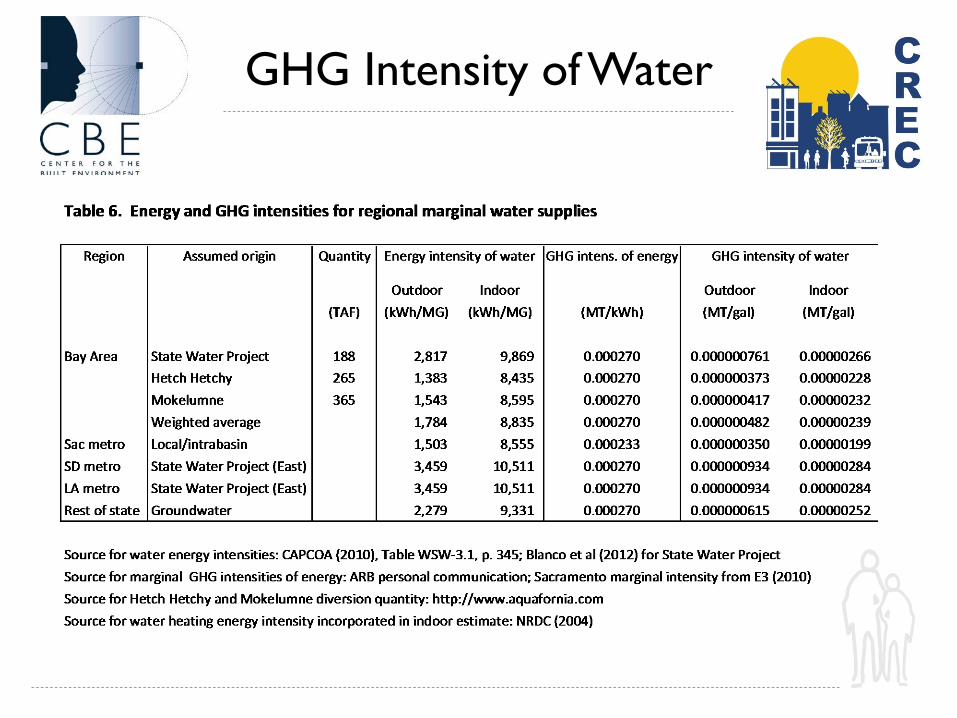
GHG Intensity of Water
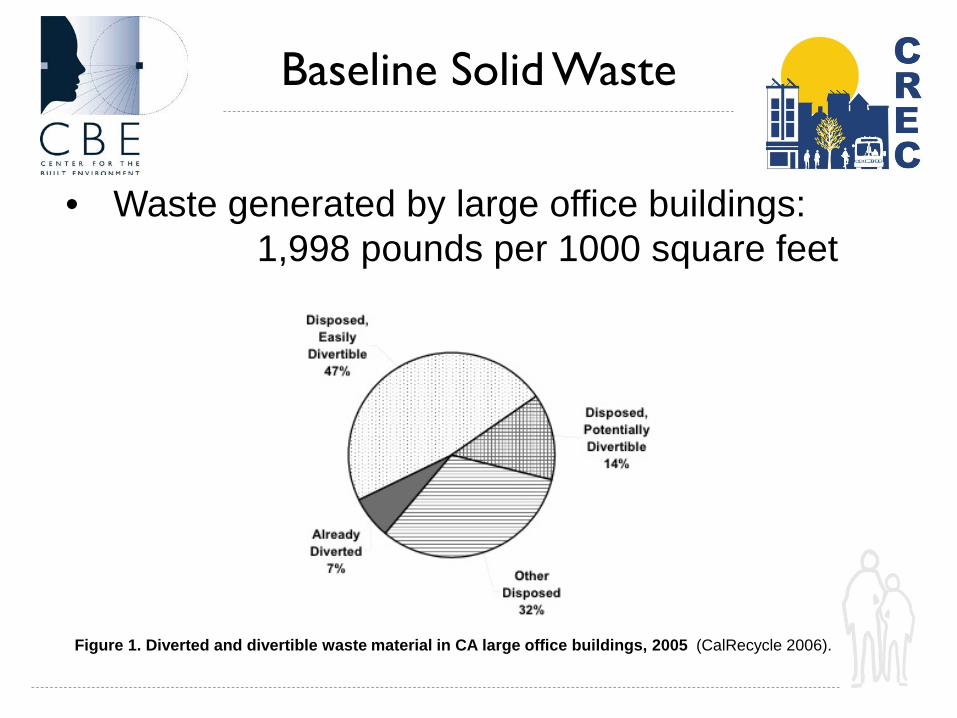
• Waste generated by large office buildings: 1,998 pounds per 1000 square feet
Baseline Solid Waste
Figure 1. Diverted and divertible waste material in CA large office buildings, 2005 (CalRecycle 2006).
• AB 341 requires 50% diversion rate for jurisdictions
• At the time of building certification, this represented the state’s aspirational goal for green building
Predicted Solid Waste
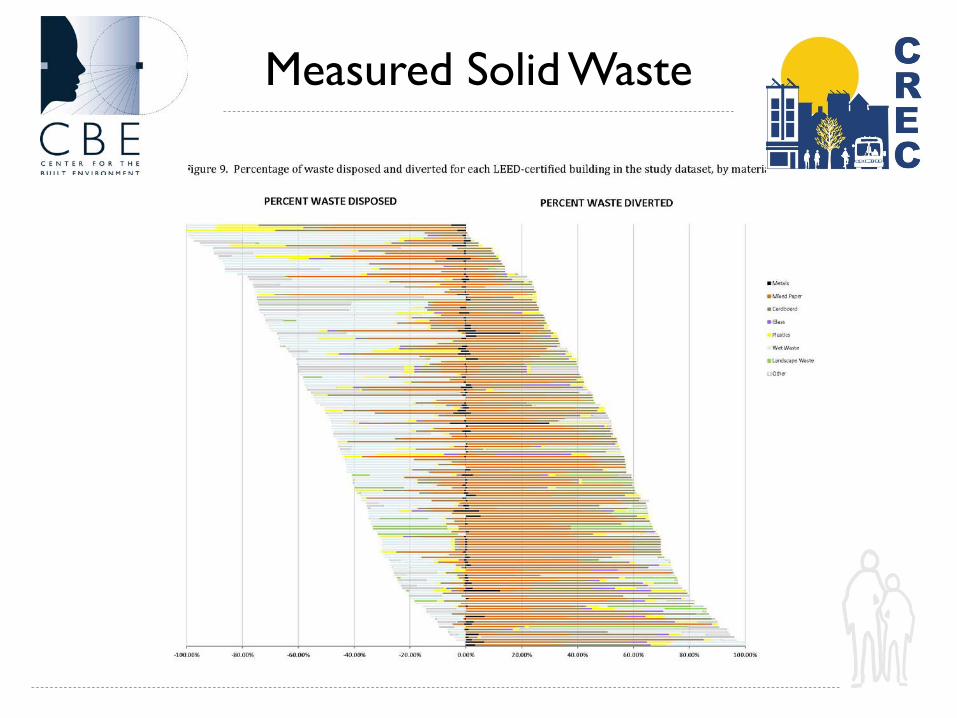
Measured Solid Waste
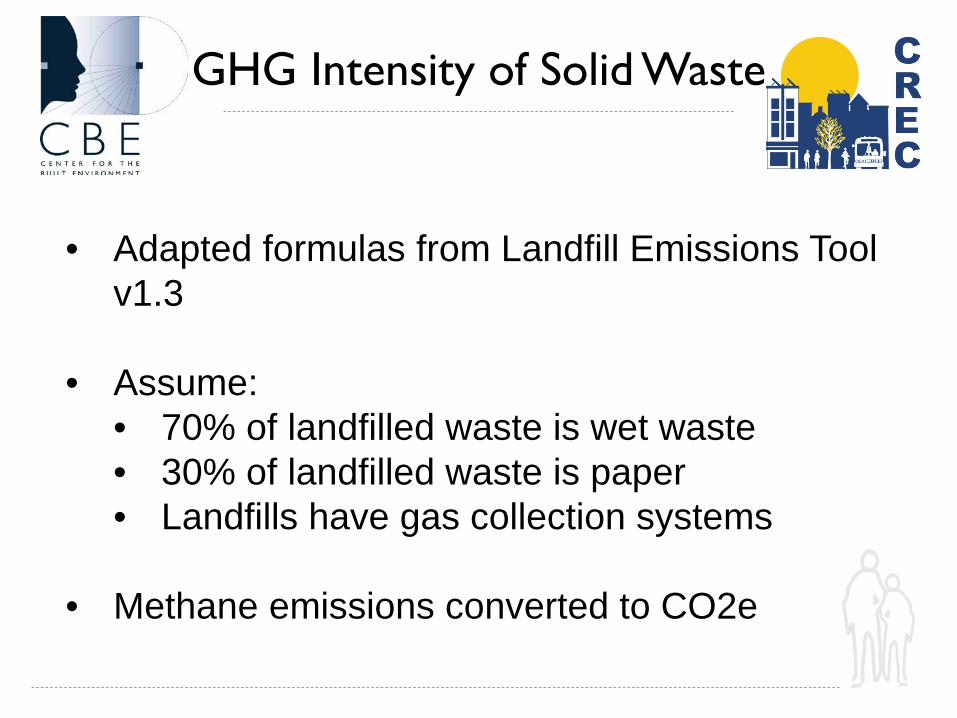
• Adapted formulas from Landfill Emissions Tool
v1.3
• Assume: • 70% of landfilled waste is wet waste • 30% of landfilled waste is paper • Landfills have gas collection systems
• Methane emissions converted to CO2e
GHG Intensity of Solid Waste
Baseline Transportation
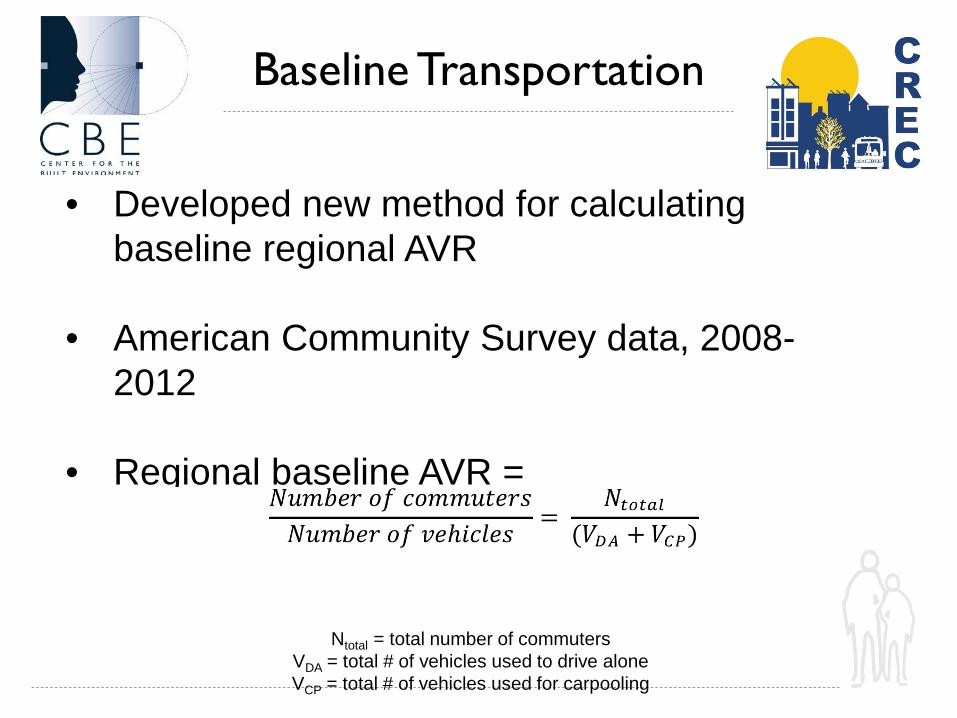
• Developed new method for calculating baseline regional AVR
• American Community Survey data, 2008-2012
• Regional baseline AVR =
Ntotal = total number of commuters VDA = total # of vehicles used to drive alone VCP = total # of vehicles used for carpooling
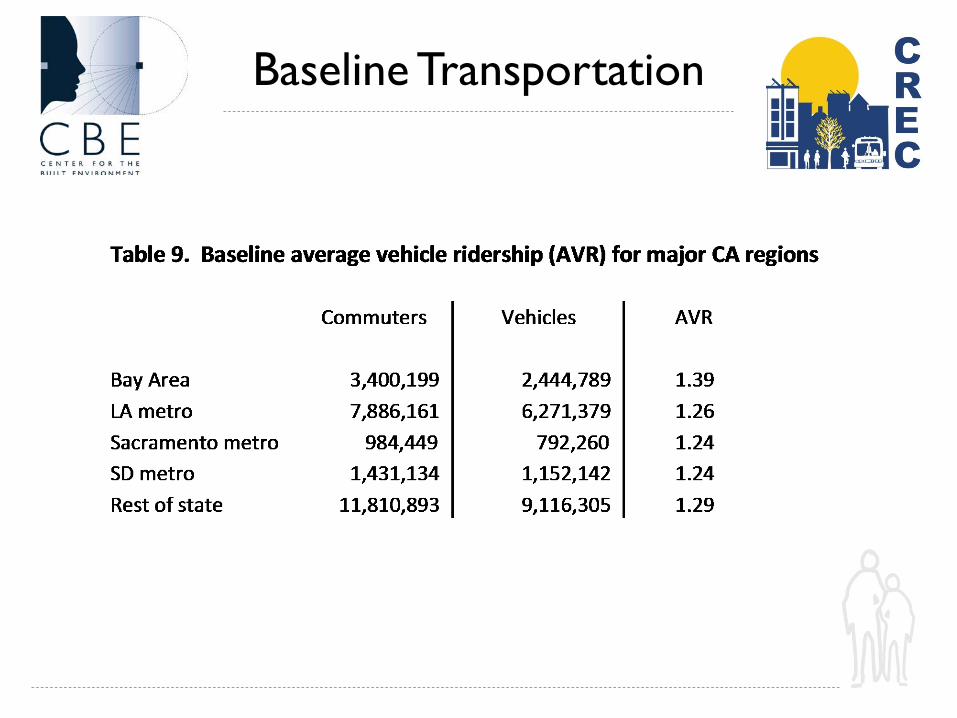
Baseline Transportation
Predicted Transportation
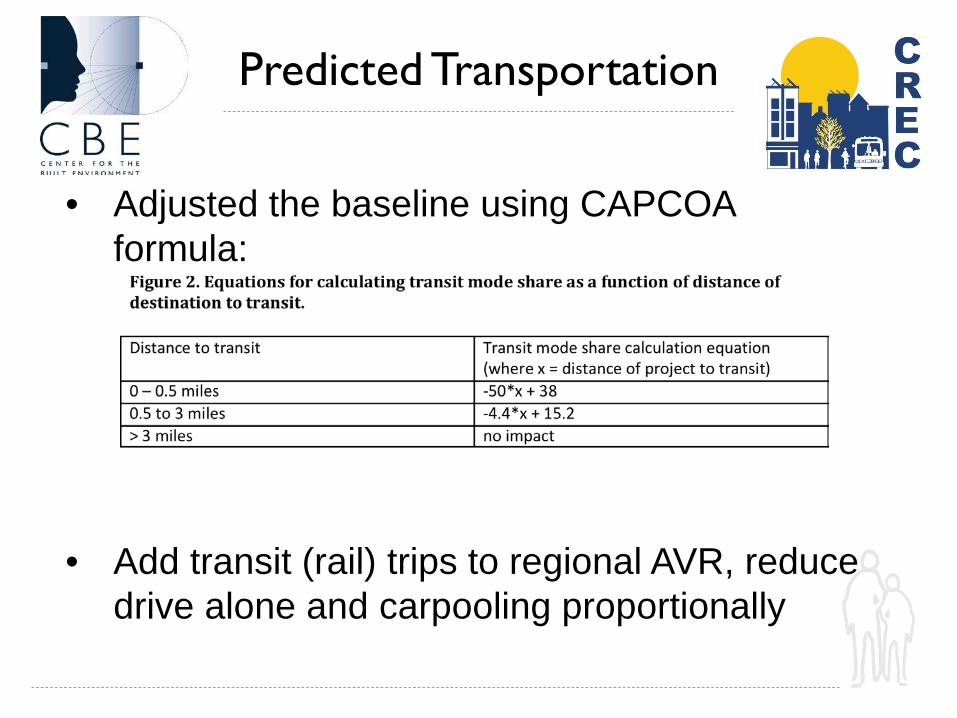
• Adjusted the baseline using CAPCOA formula:
• Add transit (rail) trips to regional AVR, reduce drive alone and carpooling proportionally
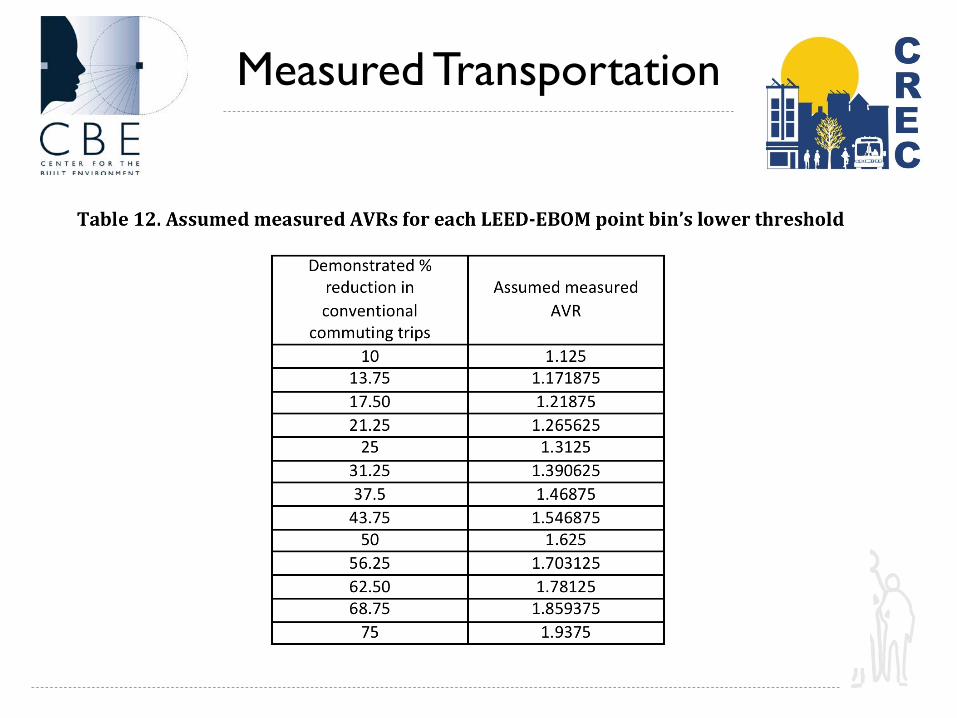
Measured Transportation
• Weighted average of GHG intensities of each mode, proportional to regional usage rate
• Assumed same building occupancy rate as plumbing code (5 occupants per 1000sf)
• Assumed average commute distance of 24 miles/person/day
GHG Intensity of Transp.
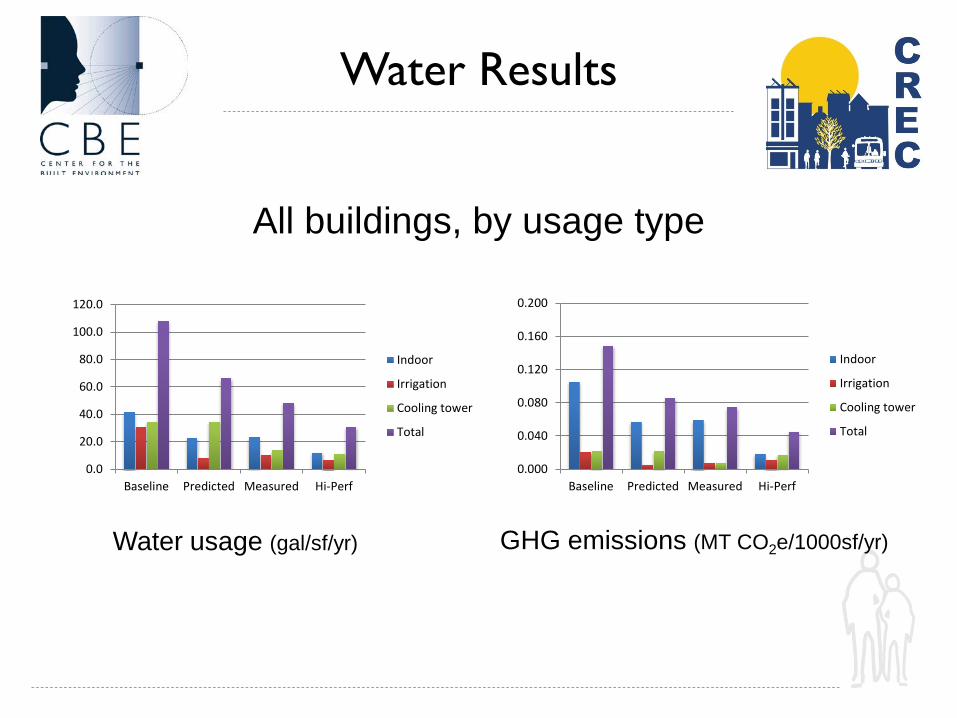
Water Results
0.0
20.0
40.0
60.0
80.0
100.0
120.0
Baseline Predicted Measured Hi-Perf
Indoor
Irrigation
Cooling tower
Total
0.000
0.040
0.080
0.120
0.160
0.200
Baseline Predicted Measured Hi-Perf
Indoor
Irrigation
Cooling tower
Total
All buildings, by usage type
Water usage (gal/sf/yr) GHG emissions (MT CO2e/1000sf/yr)
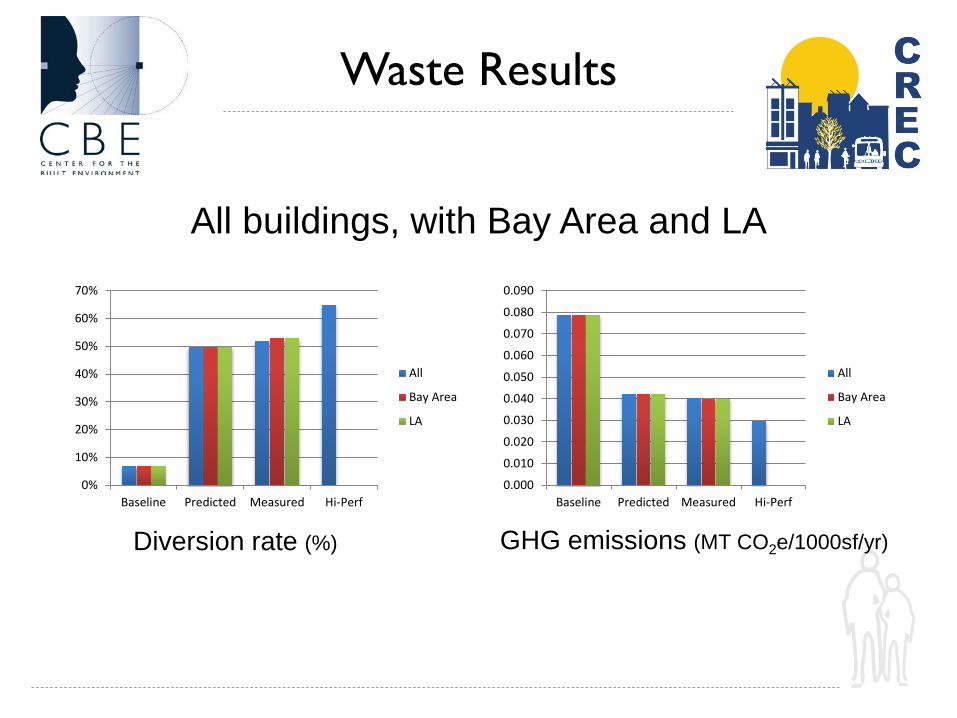
Waste Results
0%
10%
20%
30%
40%
50%
60%
70%
Baseline Predicted Measured Hi-Perf
All
Bay Area
LA
0.000
0.010
0.020
0.030
0.040
0.050
0.060
0.070
0.080
0.090
Baseline Predicted Measured Hi-Perf
All
Bay Area
LA
All buildings, with Bay Area and LA
Diversion rate (%) GHG emissions (MT CO2e/1000sf/yr)
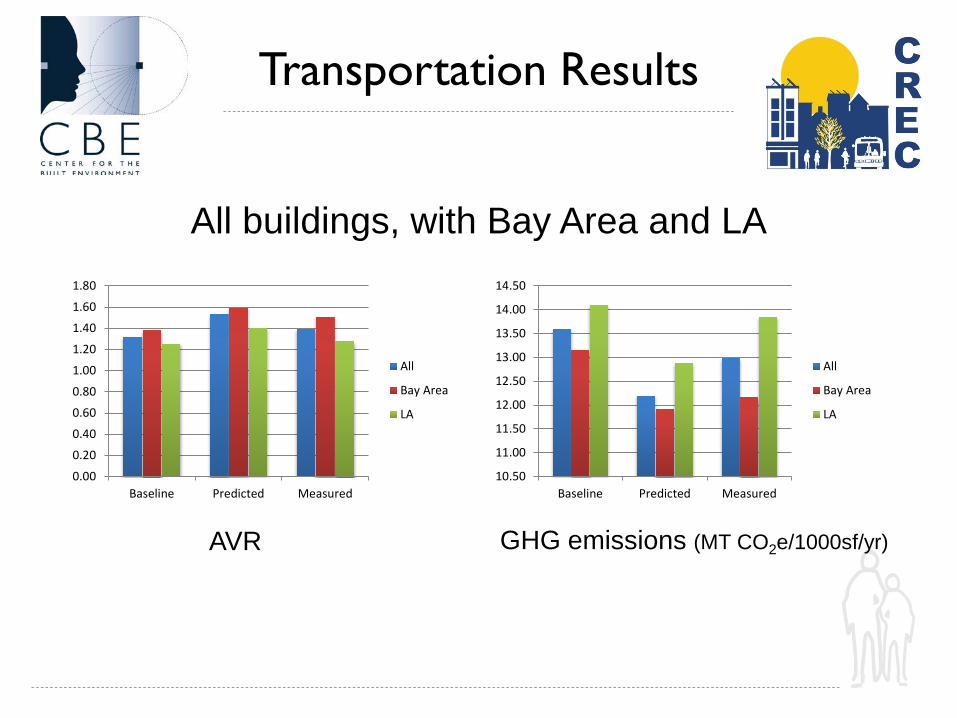
Transportation Results
0.00
0.20
0.40
0.60
0.80
1.00
1.20
1.40
1.60
1.80
Baseline Predicted Measured
All
Bay Area
LA
10.50
11.00
11.50
12.00
12.50
13.00
13.50
14.00
14.50
Baseline Predicted Measured
All
Bay Area
LA
All buildings, with Bay Area and LA
AVR GHG emissions (MT CO2e/1000sf/yr)
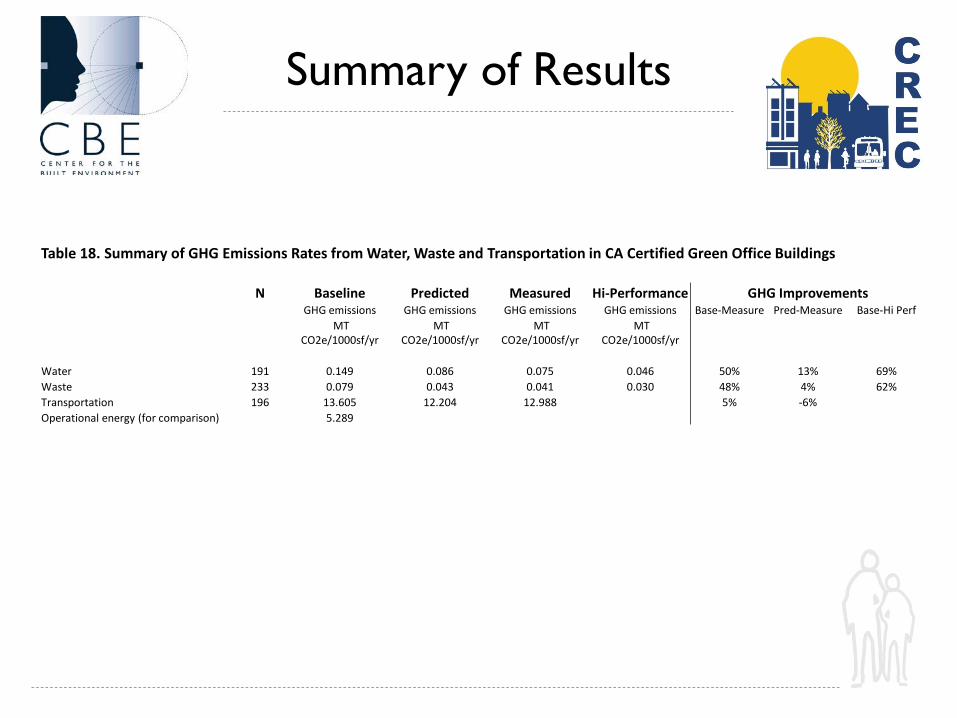
Summary of Results
Table 18. Summary of GHG Emissions Rates from Water, Waste and Transportation in CA Certified Green Office Buildings
N Baseline Predicted Measured Hi-Performance GHG Improvements GHG emissions GHG emissions GHG emissions GHG emissions Base-Measure Pred-Measure Base-Hi Perf
MT CO2e/1000sf/yr
MT CO2e/1000sf/yr
MT CO2e/1000sf/yr
MT CO2e/1000sf/yr
Water 191 0.149 0.086 0.075 0.046 50% 13% 69% Waste 233 0.079 0.043 0.041 0.030 48% 4% 62% Transportation 196 13.605 12.204 12.988 5% -6% Operational energy (for comparison) 5.289
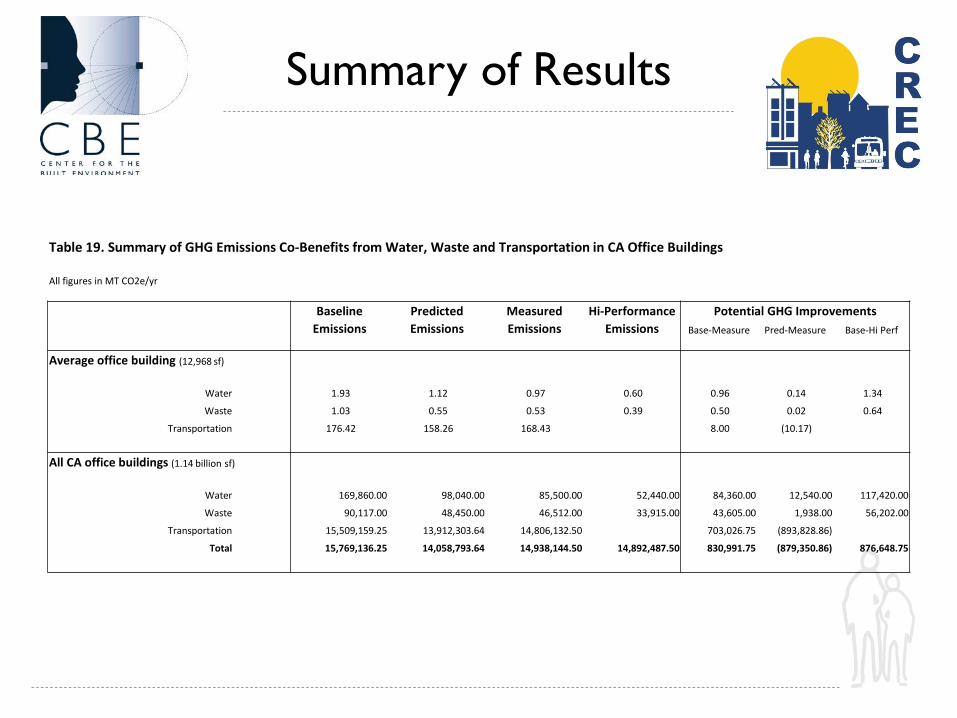
Summary of Results
Table 19. Summary of GHG Emissions Co-Benefits from Water, Waste and Transportation in CA Office Buildings
All figures in MT CO2e/yr
Baseline Predicted Measured Hi-Performance Potential GHG Improvements Emissions Emissions Emissions Emissions Base-Measure Pred-Measure Base-Hi Perf
Average office building (12,968 sf)
Water 1.93 1.12 0.97 0.60 0.96 0.14 1.34
Waste 1.03 0.55 0.53 0.39 0.50 0.02 0.64
Transportation 176.42 158.26 168.43 8.00 (10.17)
All CA office buildings (1.14 billion sf)
Water 169,860.00 98,040.00 85,500.00 52,440.00 84,360.00 12,540.00 117,420.00
Waste 90,117.00 48,450.00 46,512.00 33,915.00 43,605.00 1,938.00 56,202.00
Transportation 15,509,159.25 13,912,303.64 14,806,132.50 703,026.75 (893,828.86)
Total 15,769,136.25 14,058,793.64 14,938,144.50 14,892,487.50 830,991.75 (879,350.86) 876,648.75
Major Conclusions
• Transportation GHGs dwarf water and waste
• Water and waste performance significantly better for certified green buildings (~50% usage drop)
• Extra performance incentives prompt even greater efficiency improvements than EBOM rewards
• Performance and prediction diverge for irrigation usage and transportation
• Prediction method is conservative, yet
buildings still fall short of it
• Buildings certified in other LEED systems may perform better on transportation
• Trends in commute distances are very important to shaping transportation GHGs – this method doesn’t incorporate this issue
Transportation Issues
• LEED-EBOM buildings are existing buildings, so these findings have most pertinence to retrofits
• New construction should be able to do better
• CalGreen has taken effect now, has prescriptive but not yet any mandatory performance thresholds for water, waste or transportation
Discussion Points
• ARB goal to achieve 7.5 MMT CO2e/yr emission reduction from green commercial buildings (not just office)
• These findings are not directly comparable to this goal, but are plausibly consistent with it
• GHG intensity of water (and operational energy) will drop over time as electricity system gets cleaner
Discussion Points
• Address transportation emissions through CalGreen or other building codes if possible
• Improve baseline and prediction calculation methods, especially for transportation
• CalGreen should strengthen plumbing standards and require composting
Recommendations
• Encourage all buildings to make performance data public (not just green buildings)
• Include questions on water, waste and transportation in CEUS and CBECS
• Expand emphasis on existing buildings in climate planning efforts
Recommendations
Dr. William Eisenstein Executive Director Center for Resource Efficient Communities [email protected] 510-219-3083
Questions?