Embed Size (px)
Citation preview
Center for Study of Science, Technology and Policy, Bangalore
Abhik Kumar Das* & Sujaya Rathi
An Empirical Geometric Model for City Expansion
International Conference on Intelligent InfrastructureDate : December 1-2,2012 | Science City, Kolkata
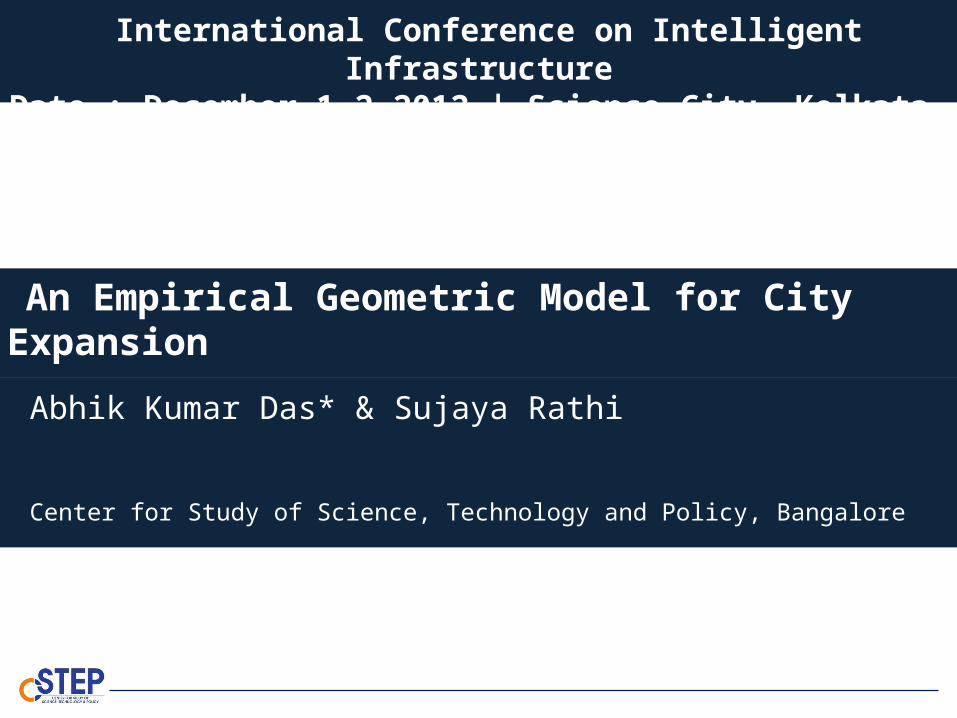
Defining City : Computational Approach
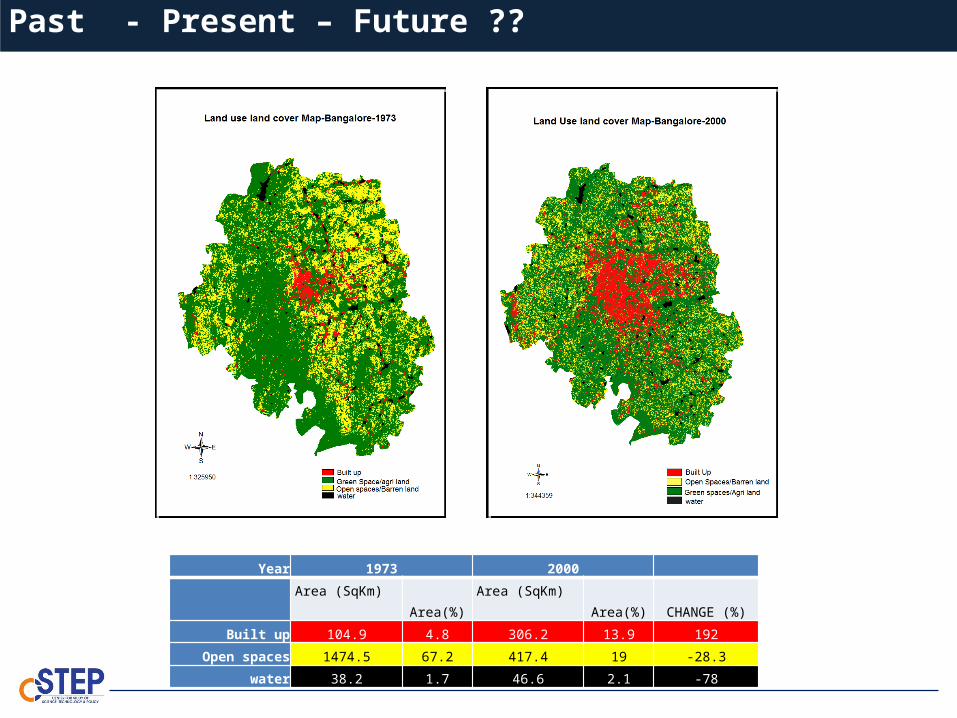
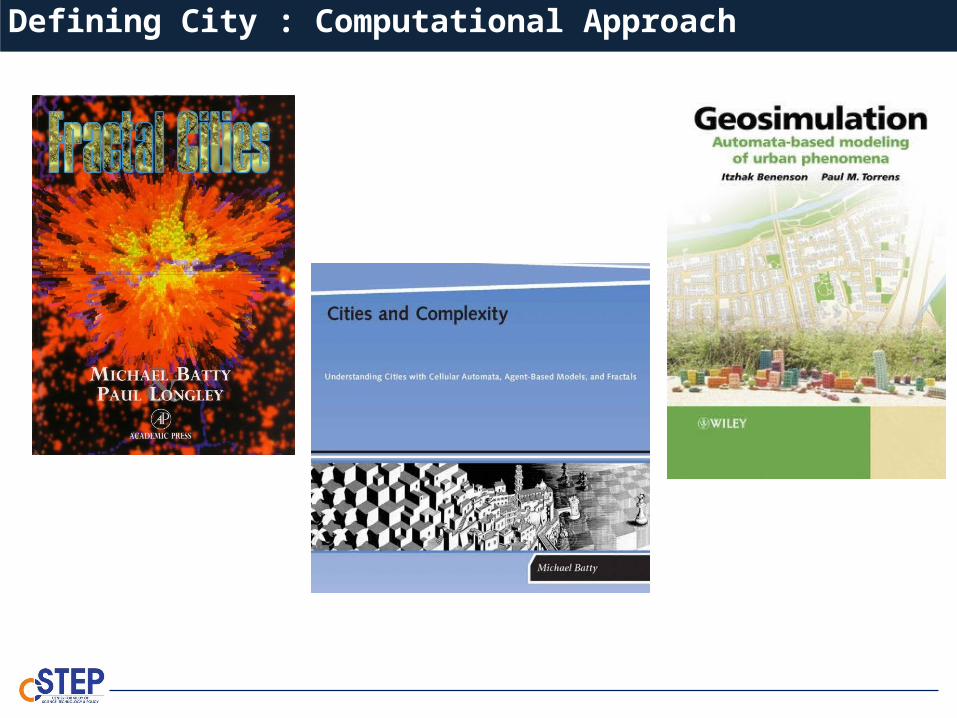
Past - Present – Future ??
Year 1973 2000
Area (SqKm) Area(%) Area (SqKm) Area(%) CHANGE (%)
Built up 104.9 4.8 306.2 13.9 192
Open spaces 1474.5 67.2 417.4 19 -28.3
water 38.2 1.7 46.6 2.1 -78
Assumption of the Geometric Model
• The center of an area can be considered at (xi, yi) where i = 1,2,...,n. Here i -represents the i-th area and n is the total number of areas under consideration
• The area has radial-outward expansion, for simplicity let assume the expansion rate in x and y direction as ex(i) and ey(i), respectively.
• The area contains a ‘growth-time-factor’ (gi)
Mono-Centric Structure of An Area
• Any area can be represented as [xi, yi ,gi , ex(i), ey(i) ]
• The growth of the area at any time step can be represented as,
Gi(xi, yi ,gi , ex(i), ey(i) )
What is G ? : Spatial Organization of Economic Activity !!!
• G can be considered as Two dimensional Gaussian distribution
Expansion Rate ??
• Depends on Absorption Capacity of an Area
• Migration Pattern
• Accessibility of Infrastructure (Energy, Housing, Transport, ……)
M. Fujita and J. F. Thisse, “Economics of Agglomeration”, Journal of the Japanese and International Economics, 10, pp.339-378, 1996.
P. Krugman, “Increasing returns and Economic Geography”, Journal of Political Economy, 99-3 ; 484-499. 1991.
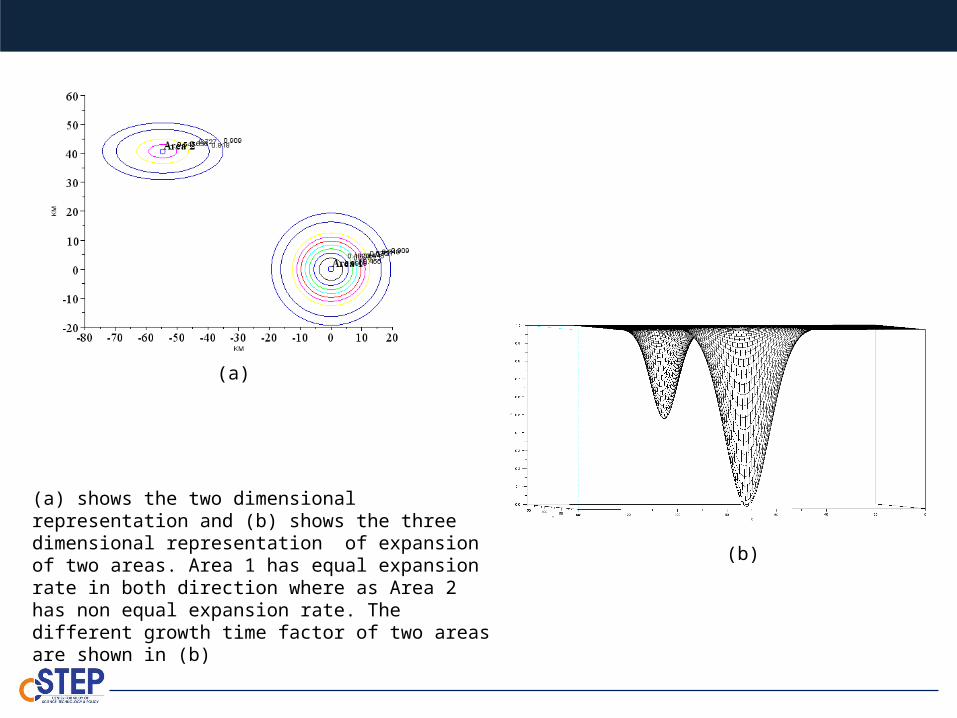
(a) shows the two dimensional representation and (b) shows the three dimensional representation of expansion of two areas. Area 1 has equal expansion rate in both direction where as Area 2 has non equal expansion rate. The different growth time factor of two areas are shown in (b)
(a)
(b)
Mono-Centric Poly-Centric Structure
• the original mono-centric structure of large metropolises with time tends to dissolve progressively into a poly-centric structure.
• Historical business center with low level of amenities, increasing car ownership, cheap land, flat topography, and street design may accentuate the tendency toward poly-centricity
• forces that might inhibit poly-centricity could be commercial center with high level of amenities; rail based public transport, radial primary road network, and difficult topography preventing communication between suburbs.
L. S. Mayer, “The Gaming of Policy and the Politics of Gaming: A Review”, Simulation and Gaming, 40, pp. 825-862, 2009.
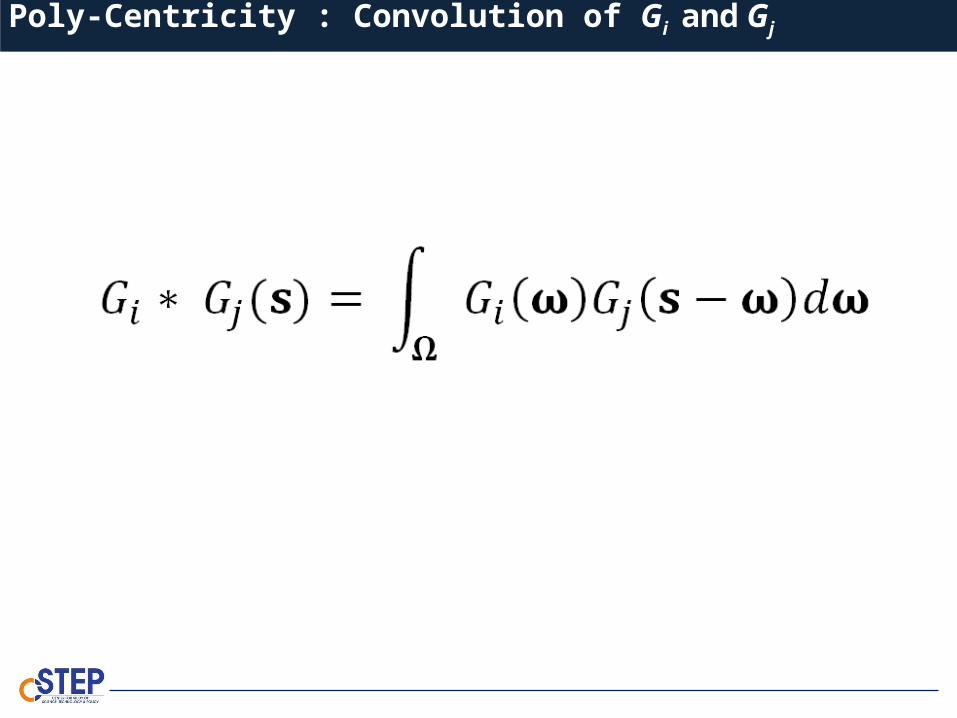
Poly-Centricity : Convolution of Gi and Gj
Control Variables : Expansion rate (An Economic Variable) !!
• Generate Different Plausible Scenarios
• Scenario Planning : Policy Planning
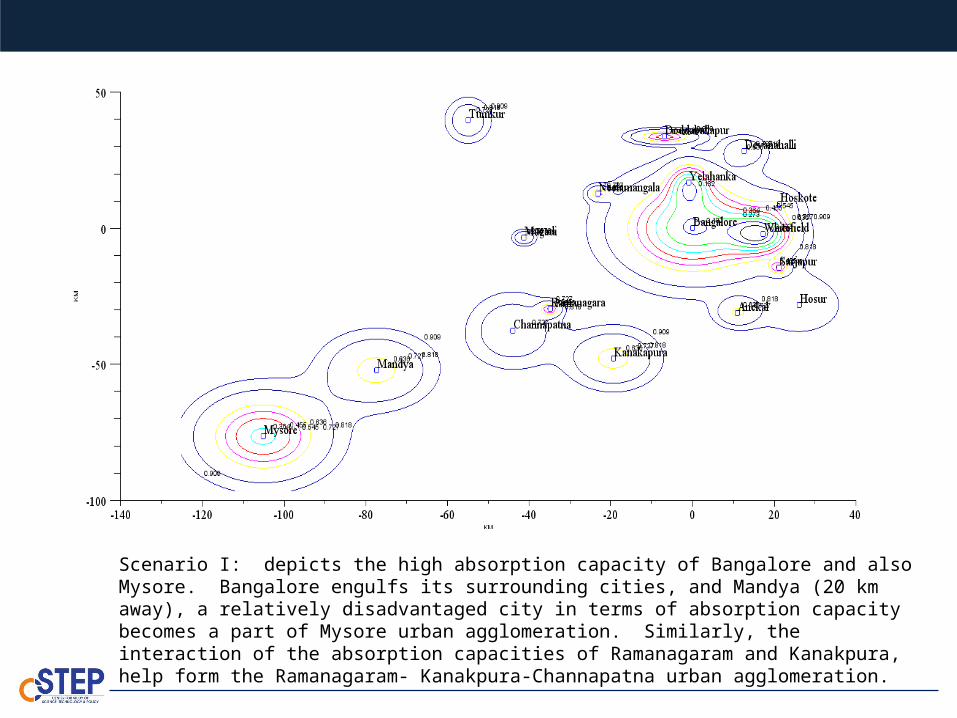
Scenario I: depicts the high absorption capacity of Bangalore and also Mysore. Bangalore engulfs its surrounding cities, and Mandya (20 km away), a relatively disadvantaged city in terms of absorption capacity becomes a part of Mysore urban agglomeration. Similarly, the interaction of the absorption capacities of Ramanagaram and Kanakpura, help form the Ramanagaram- Kanakpura-Channapatna urban agglomeration.
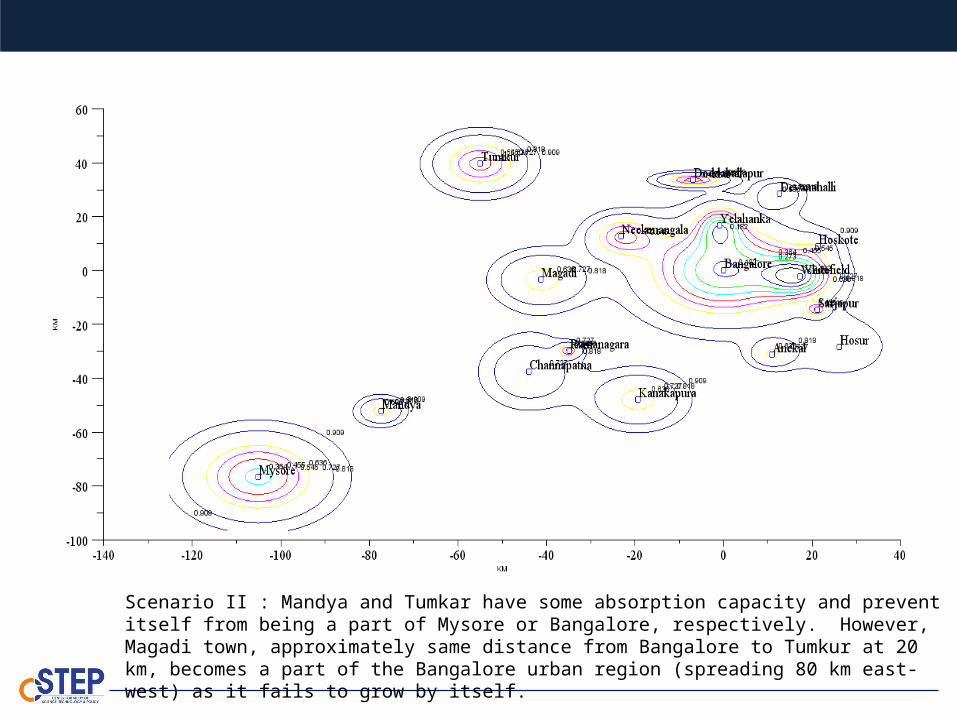
Scenario II : Mandya and Tumkar have some absorption capacity and prevent itself from being a part of Mysore or Bangalore, respectively. However, Magadi town, approximately same distance from Bangalore to Tumkur at 20 km, becomes a part of the Bangalore urban region (spreading 80 km east-west) as it fails to grow by itself.
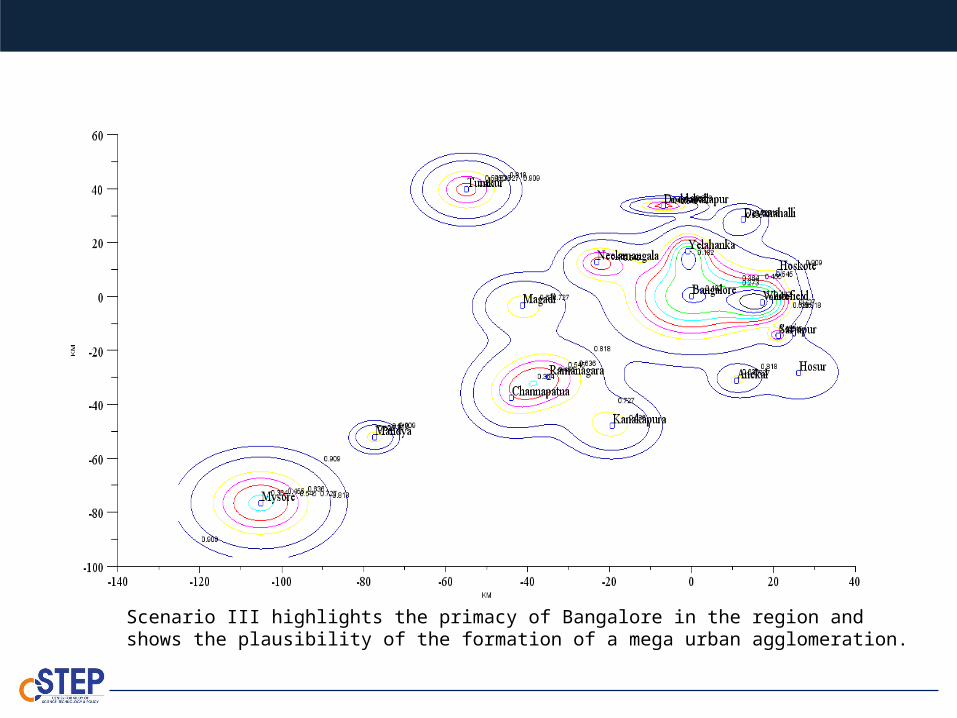
Scenario III highlights the primacy of Bangalore in the region and shows the plausibility of the formation of a mega urban agglomeration.
Scenario Planning
• Scenario Planning is now an Essential Tool for Policy Makers
• Model based approach is computationally feasible to ‘Generate Plausible Scenarios’
• The concept of alternative scenarios is already introduced in the draft of twelfth Five-Year Planning for shaping India’s future (“Scenarios: Shaping India’s Future”, Planning Commission, Government of India, June 2012)

Thank You