Embed Size (px)
Citation preview
MDOT RC-1448 CSD-2003-01
CAUSES & CURES FOR CRACKING OF CONCRETE BARRIERS
August 2004
Center for Structural Durability A Michigan DOT Center of Excellence

This report presents the results of research conducted by the authors and does not necessarily reflect the views of the Michigan Department of Transportation. This report does not constitute a standard or specification.

Technical Report Documentation Page
1. Report No. Research Report RC-1448
2. Government Accession No. 3. MDOT Project Manager John F. Staton, P.E.
4. Title and Subtitle Causes and cures for cracking of concrete barriers
5. Report Date August 2004
7. Author(s) Dr. Haluk Aktan, Ph.D, P.E. and Mr. Upul Attanayaka
6. Performing Organization Code WSU
9. Performing Organization Name and Address Department of Civil & Environmental Engineering College of Engineering Wayne State University 5050 Anthony Wayne Drive Detroit, MI 48202
8. Performing Org Report No. CSD-2003-01
10. Work Unit No. (TRAIS) 11. Contract Number: 2002-0341
12. Sponsoring Agency Name and Address Michigan Department of Transportation Construction and Technology Division P.O. Box 30049 Lansing, MI 48909
11(a). Authorization Number: 13. Type of Report & Period Covered Final 03/2002 – 08/2003
15. Supplementary Notes
14. Sponsoring Agency Code
16. Abstract The research objective was to investigate the causes of premature deterioration of concrete bridge barriers with the goal of developing strategies for corrective actions. The synthesis of all the data collected in various tasks revealed that barrier deterioration starts with early formation of vertical cracking as a result of the tensile stress due to early-age thermal load. Volume change of concrete due to temperature and shrinkage occurs simultaneously. An increase in drying shrinkage arising from delays in curing also affects the barrier cracking. Additionally, drying shrinkage, beyond the very early ages, increases the width of cracks that have formed due to thermal loads. Penetration of moisture and other corrosive agents through the cracks causes reinforcing steel corrosion leading to horizontal cracking and finally the delamination and spall. Insufficient consolidation of concrete often observed in slipformed barriers accelerated the deterioration. Concrete parameters controlling the thermal load are the cement type, content, and fineness, ambient temperature at the time of concrete placement, and the time of inception of curing. From field inspection data and the finite element results it was found that the minimum possible full-length vertical crack spacing is equal to barrier height. One of the most important recommendations drawn from this study is the implementation of crack arrestors at about 3-feet intervals. The crack arrestors, some with cracks formed at full length, should be sealed with durable silicone-based flexible material during first scheduled maintenance cycle. Additional recommendations include the substitution of cement with mineral admixtures and the development of detailed specifications for barrier construction.
17. Key Words Bridge barrier, premature-deterioration, concrete, thermal load, shrinkage, transverse cracking
18. Distribution Statement No restrictions. This document is available to the public through the Michigan Department of Transportation.
19. Security Classification (report) Unclassified
20. Security Classification (Page) Unclassified
21. No of Pages 22. Price

CAUSES AND CURES FOR CRACKING OF CONCRETE BARRIERS
Submitted to the
RESEARCH ADVISORY PANEL
Submitted by the
CENTER FOR STRUCTURAL DURABILITY A Michigan DOT Center of Excellence
August 2004
Dr. Haluk Aktan, Ph.D, P.E Professor Tel: 313-577-3825 Fax: 313-577-9850 E-mail: [email protected]
Mr. Upul Attanayaka Graduate Research Assistant Tel: 313-577-9293 Fax: 313-577-9850 E-mail: [email protected]
Department of Civil & Environmental Engineering 5050 Anthony Wayne Drive
Detroit, MI 48202

CENTER FOR STRUCTURAL DURABILITY – Causes & Cures for Cracking of Concrete Barriers i
EXECUTIVE SUMMARY
This research need was established in a report by J.F. Staton and J. Knauff (1999), titled,
“Evaluation of Michigan’s Concrete Barriers”. The report described that many of the current
generation barriers used by the Michigan Department of Transportation (MDOT) are
deteriorating at a rate greater than expected. This study was designed in order to further evaluate
the observations described in the above report and to develop a comprehensive understanding of
the barrier life span, from construction to repair or replacement.
The objectives of this project were to investigate the causes of concrete bridge barrier
deterioration with the goal of developing strategies for corrective action. The strategies were
developed by examining and determining the distress states and mechanisms. Material selection,
mixture design, and/or modifications to construction procedures are proposed to reduce
premature deterioration.
The project was designed in eight tasks including literature review, a nation wide survey of State
Highway Agencies (SHAs), inspection of existing barriers, monitoring barrier construction,
laboratory testing, and data synthesis. The primary goal of the project was to develop
recommendations in order to minimize or eliminate barrier cracking.
As a first step, a preliminary inspection of existing barriers was performed and observed
distresses were documented. Observed distresses and their causes were examined in the
literature review. The causes of distress are classified as design related, material related, and
construction practice related. In any case, most of the distress types can be eliminated with good
construction practices. Most distresses are observed at early ages and initiate from unmitigated
volume change of concrete at very early ages. Improper construction practices that initiate the
progression of distress are early removal of forms in form-cast barriers, insufficient
consolidation, and lack of wet curing.
The survey responses of State Highway Agencies provided information on their experiences with
regard to the early-age cracking problem with barriers and, materials and construction practices
used for concrete barriers (especially New Jersey type).

CENTER FOR STRUCTURAL DURABILITY – Causes & Cures for Cracking of Concrete Barriers ii
All the survey respondents indicated that premature distress is observed on concrete bridge
barriers. Those observed distresses are of the same types observed in Michigan. Though all the
respondents identified premature distress, only Illinois, New Mexico, Vermont, and Virginia
acknowledged that they have experienced an overall durability problem with the bridge barriers.
Nationally, both form-cast and slipformed barriers are commonly used. Precast New Jersey type
barriers are also used in States of Florida, Maryland, New Hampshire, New York, Texas,
Vermont, and Virginia. Sprayed curing compound on the slipformed barrier surfaces is the most
often cited method of curing. States of Illinois, Minnesota, New Hampshire, New Mexico, New
York, and Washington use a different concrete mix design for the barriers than for the deck. All
the respondents specified the use of ground granulated blast-furnace slag (GGBS) and flyash
(FA) in the mix design for the goal of reduction of the concrete permeability. States of
Massachusetts, New York, and Virginia also use silica fume (SF) along with GGBS and FA.
Except in States of Alabama, Idaho, Nevada, North Dakota, Virginia, and Washington the most
prevailing method of surface finishing is the rubbed method. Most of the respondents
emphasized changing the mix design and curing procedure for improved durability of New
Jersey type barriers.
During field inspections, the condition of barriers of a total of 21 bridges consisting of 155
barrier segments with a total length of 3,729 ft. were documented. According to the inspection
data, the vertical (or transverse) cracking is the leading cause of most of other distress types.
The number of vertical cracks is important in establishing the deterioration rate.
Horizontal cracks can be classified as either local or continuous. The local cracks are often on
the barrier vertical face. Continuous horizontal cracks are also mostly observed on the vertical
face, about the level of top longitudinal reinforcement. In barriers with horizontal cracking,
significant section loss is often observed around the barrier top portion.
The construction of four bridge superstructure replacement projects with New Jersey type
barriers was monitored. In two of the projects, the barriers were slipformed. In the other two
projects, barriers were form-cast using metal forms on the traffic bearing side and wood forms on
the fascia.
CENTER FOR STRUCTURAL DURABILITY – Causes & Cures for Cracking of Concrete Barriers iii
In the slipformed barriers, concrete was not sufficiently consolidated. Though it is difficult to
conclusively evaluate the barrier interior without taking well distributed core samples, while the
joints were being cut, honeycombing and large cavities were observed. The curing compound
was sprayed using the MDOT recommended procedure. However, the spray was not uniform
over the barrier surface as specified in the MDOT Standard Specifications for Construction.
Two days after placement, inspection revealed map cracking on most of the portion of the barrier
surface as well as few full-length vertical cracking. In form-cast barriers, the top surface of the
concrete is not covered or protected from direct atmospheric exposure. Forms were removed
approximately 18 hours following construction (this is in compliance with the specification
requirements). Curing compound was not applied after form removal even though it is required
by the specifications. Visual inspection upon form removal did not reveal any visible cracking.
Mechanical properties of barrier concrete were obtained from compressive strength and elasticity
modulus tests in accordance with ASTM C 39 and ASTM C 469, respectively. Ultrasonic pulse
velocity (UPV) test was performed in compliance with ASTM C 597. The rapid chloride
permeability test (RCPT) was performed in accordance with ASTM C 1202. The absorption and
air permeability tests were performed for determining the void ratio and to obtain the limits of
absorption. The absorption test was performed in compliance with ASTM C 642. The air-
permeability test was performed using a special apparatus not yet standardized by ASTM. Test
results indicate that two of the bridge barriers were cast with 28-day concrete strength in excess
of 6000 psi. Several core samples were obtained from existing barriers. Core samples taken
from distress-free zones showed lower air-permeability values than the measurements of the
standard specimens obtained from new barriers indicating greater resistance to moisture as well
as chloride ion penetration. Core samples taken from the zones of distress displayed excessive
leakage. The existence of cracks and large voids triggered the leakage. The permeable pore
space measured from the absorption test did not reveal any significant difference between cores
and standard specimens. UPV test results measured on cores and standard specimens from new
barriers also showed similar results. The Coulomb values measured according to ASTM C 1202
on standard specimens were significantly higher than that of core specimens. It was also
observed that there is significant variability in the concrete properties obtained from cores and
standard specimens.

CENTER FOR STRUCTURAL DURABILITY – Causes & Cures for Cracking of Concrete Barriers iv
The primary factor affecting durability of concrete barriers in Michigan was determined as the
formation of multiple full- or partial-depth vertical cracks. The causes of cracking were
identified as the internal restraint stresses resulted from thermal and shrinkage loads during
cement hydration. It was also established that other distress types often emanate from vertical
cracking. The reduction or control of vertical cracking will most certainly improve barrier
service life.
Inspection data from existing barriers showed that the average full-length vertical crack spacing
is twice the barrier height. Upon the inspection of newly slipformed barriers (two days following
placement), full-length vertical cracks were also observed at a ratio of average full-length crack
spacing to barrier height also as two. On the other hand, finite element analysis of a barrier
segment with full base restraint showed that the full-length vertical crack spacing is equal to the
barrier height. Vertical crack spacing increases with reduced base restraint conditions. The
difference between observed crack spacing in the field and the results of the analysis is due to
reduced barrier base restraint.
According to the findings of this study, the early barrier deterioration is initiated by the vertical
cracking and accelerated by the presence of voids, cavities, and the overall concrete quality of
the barrier. Recommendations are made by emphasizing the fact that early-age crack control, or
in more general terms crack management, is the key to durable barriers. It is recommended that
crack arrestors are used by placing a trim inside the forms at approximately 3 feet intervals. The
crack arrestors, some with cracks formed at full length, should be sealed with a durable silicone-
based flexible material during the first scheduled maintenance cycle. Additional
recommendations include substitution of mineral admixtures, shifting barrier casting process to
evening or night, protecting the top surface of form-cast barrier with curing compound or a wet
burlap, and delaying form removal to five or even seven days after concrete placement.
CENTER FOR STRUCTURAL DURABILITY – Causes & Cures for Cracking of Concrete Barriers v
ACKNOWLEDGMENTS
This study was funded by the Michigan Department of Transportation (MDOT) through the
Center for Structural Durability at Wayne State University. The authors would like to
acknowledge the support and effort of John Staton for initiating this research. The authors also
wish to acknowledge the continuing assistance of the Michigan Department of Transportation –
Research Advisory Panel (RAP) members in contributing to the advancement of this study. The
research team is grateful to MDOT employees that helped with this research and especially to
Tom Miller and Joe Anderson for obtaining the core samples, and to Larry Young, Macomb
Transportation Service Center, and Mike Gorman, Detroit Transport Service Center, for
permitting our work in the construction zones.
The authors acknowledge the support and effort of Dr. Recep Birgul in helping with a lot of
aspects of this project. We would like to thank Okan Duyar, Yilmaz Koyuncu, Rudaba
Chowdhury, Jason Rutyna, and Carissa Markel for their work during the inspection, construction
monitoring, and in sample preparation. Assistance of Bonnie Yu and Carrie Saul in the
preparation of the final report is much appreciated.
We appreciate the help of the deck contractors for providing the concrete materials for this study.

CENTER FOR STRUCTURAL DURABILITY – Causes & Cures for Cracking of Concrete Barriers vi
CENTER FOR STRUCTURAL DURABILITY – Causes & Cures for Cracking of Concrete Barriers vii
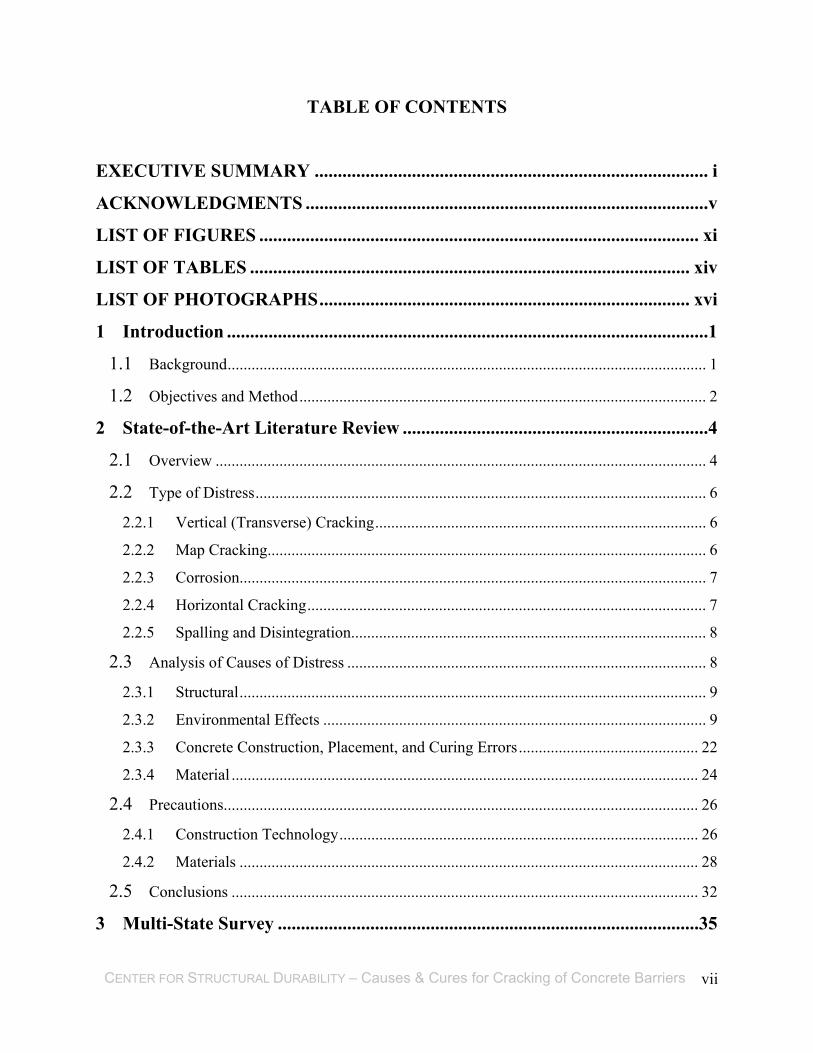
TABLE OF CONTENTS
EXECUTIVE SUMMARY ..................................................................................... i
ACKNOWLEDGMENTS .......................................................................................v
LIST OF FIGURES ............................................................................................... xi
LIST OF TABLES ............................................................................................... xiv
LIST OF PHOTOGRAPHS................................................................................ xvi
1 Introduction ........................................................................................................1
1.1 Background........................................................................................................................ 1
1.2 Objectives and Method...................................................................................................... 2
2 State-of-the-Art Literature Review ..................................................................4
2.1 Overview ........................................................................................................................... 4
2.2 Type of Distress................................................................................................................. 6
2.2.1 Vertical (Transverse) Cracking................................................................................... 6
2.2.2 Map Cracking.............................................................................................................. 6
2.2.3 Corrosion..................................................................................................................... 7
2.2.4 Horizontal Cracking.................................................................................................... 7
2.2.5 Spalling and Disintegration......................................................................................... 8
2.3 Analysis of Causes of Distress .......................................................................................... 8
2.3.1 Structural..................................................................................................................... 9
2.3.2 Environmental Effects ................................................................................................ 9
2.3.3 Concrete Construction, Placement, and Curing Errors............................................. 22
2.3.4 Material ..................................................................................................................... 24
2.4 Precautions....................................................................................................................... 26
2.4.1 Construction Technology.......................................................................................... 26
2.4.2 Materials ................................................................................................................... 28
2.5 Conclusions ..................................................................................................................... 32
3 Multi-State Survey ...........................................................................................35

CENTER FOR STRUCTURAL DURABILITY – Causes & Cures for Cracking of Concrete Barriers viii
3.1 Overview ......................................................................................................................... 35
3.2 Analysis of Survey Data .................................................................................................. 37
3.3 Conclusions ..................................................................................................................... 52
4 Field Inspection ................................................................................................54
4.1 Overview ......................................................................................................................... 54
4.2 Distress Documentation................................................................................................... 55
4.3 Collection of Specimens.................................................................................................. 55
4.4 Field Inspection Data Collection ..................................................................................... 55
4.4.1 Inspection Protocol ................................................................................................... 56
4.4.2 Inspection Data Processing ....................................................................................... 59
4.5 Compilation of Inspection Data....................................................................................... 80
4.6 Evaluation of Inspection Data ......................................................................................... 92
4.7 Conclusions ..................................................................................................................... 96
5 Construction Monitoring.................................................................................97
5.1 Construction Sites............................................................................................................ 97
5.2 Pre-placement Observations ............................................................................................ 97
5.2.1 Specification Requirements ...................................................................................... 97
5.2.2 Field Observations .................................................................................................... 98
5.3 Placement Observations ................................................................................................ 100
5.3.1 Specification Requirements .................................................................................... 100
5.3.2 Field Observations of Barrier Construction............................................................ 101
5.3.3 Curing of Concrete.................................................................................................. 106
5.3.4 Curing of Concrete - Field Observations ................................................................ 106
5.4 Conclusions ................................................................................................................... 112
6 Laboratory Testing ....................................................................................... 114
6.1 Overview ....................................................................................................................... 114
6.1.1 Standard Specimens Prepared during Construction................................................ 115
6.1.2 Core Specimens from Existing Barriers ................................................................. 116

CENTER FOR STRUCTURAL DURABILITY – Causes & Cures for Cracking of Concrete Barriers ix
6.1.3 Test Procedures for Standard Specimens Prepared during Construction ............... 116
6.1.4 Test Procedures for Core Specimens ...................................................................... 116
6.2 Test Results.................................................................................................................... 117
6.2.1 Standard Specimens Prepared during Construction................................................ 117
6.2.2 Core Specimens ...................................................................................................... 122
6.3 Conclusions ................................................................................................................... 123
7 Parameters Influencing Barrier Cracking ................................................. 125
7.1 Overview ....................................................................................................................... 125
7.2 Mechanical Properties of Concrete................................................................................ 127
7.2.1 Compressive Strength ............................................................................................. 127
7.2.2 Elasticity Modulus .................................................................................................. 129
7.2.3 Direct Tensile Strength ........................................................................................... 130
7.2.4 Concrete Strain........................................................................................................ 130
7.2.5 Mechanical Properties and Shrinkage of Barrier Concrete..................................... 131
7.3 Bridge Barrier Cracking ................................................................................................ 132
7.3.1 Overview................................................................................................................. 132
7.4 Finite Element Analysis for Evaluating Crack Spacing on Barriers ............................. 135
7.4.1 Overview................................................................................................................. 135
7.4.2 Thermal Loads ........................................................................................................ 136
7.4.3 Shrinkage Strain...................................................................................................... 137
7.4.4 Mechanical Properties of Concrete......................................................................... 138
7.4.5 FE Modeling and Analysis of Barrier Segment...................................................... 139
7.4.6 Analysis Results...................................................................................................... 139
7.5 Conclusions ................................................................................................................... 145
8 Summary & Conclusions.............................................................................. 147
8.1 Summary........................................................................................................................ 147
8.2 Conclusions ................................................................................................................... 148
9 Suggestions for Future Research ................................................................. 151
10 References ................................................................................................... 152

CENTER FOR STRUCTURAL DURABILITY – Causes & Cures for Cracking of Concrete Barriers x
Appendix A .......................................................................................................... 165
Appendix B .......................................................................................................... 194

CENTER FOR STRUCTURAL DURABILITY – Causes & Cures for Cracking of Concrete Barriers xi
LIST OF FIGURES
Figure 2-1. Effect of concrete placing temperature and volume to surface (exposed to
environment) ratio on age at peak temperature for Type 1 cement.................... 17
Figure 2-2. The effect of volume to surface ratio and age at peak temperature on percent
absorbed or dissipated of difference in placing and ambient temperature ......... 18
Figure 2-3. Effects of placement temperature on adiabatic temperature rise ........................ 19
Figure 2-4. The effect of volume to surface ratio and exposed surface condition on temperature
rise of concrete members (376 lb/yd3)................................................................ 20
Figure 2-5. Variation of adiabatic temperature rise with age of concrete for different types of
cements ............................................................................................................... 21
Figure 2-6. Effects of cement fineness on heat generation.................................................... 22
Figure 2-7. The porous layer under the ribs and the rebar upon concrete placement............ 24
Figure 3-1. Geographic location of State Highway Agencies responded to the survey ........ 36
Figure 3-2. Frequency of map cracks observed on barriers................................................... 38
Figure 3-3. Frequency of horizontal cracking observed near joints of barriers..................... 38
Figure 3-4. Frequency of observed continuous horizontal cracks near the top and along the
length of barrier .................................................................................................. 39
Figure 3-5. Frequency of observed vertical cracks within proximity of the construction joint39
Figure 3-6. Frequency of observed multiple vertical cracks between barrier joints.............. 40
Figure 3-7. Frequency of observed multiple vertical cracks near the barrier toe .................. 40
Figure 3-8. Frequency of section loss observed at or near the top of the barrier................... 41
Figure 3-9. Frequency of local pop outs observed................................................................. 41
Figure 3-10. Frequency of sign of corrosion observed on bridge barriers............................. 42
Figure 3-11. Frequency of type of premature distress observed on bridge barriers .............. 43
Figure 3-12. Frequency of observed overall durability problems with NJ type barriers....... 44
Figure 3-13. Most popular construction procedures used for casting New Jersey Type 4 barriers
............................................................................................................................ 45
Figure 3-14. Curing procedures used /specified for barriers ................................................. 46
Figure 3-15. Frequency of using epoxy coated reinforcements for the barriers.................... 46
Figure 3-16. Use of coatings/sealants for bridge barriers ...................................................... 47

CENTER FOR STRUCTURAL DURABILITY – Causes & Cures for Cracking of Concrete Barriers xii
Figure 3-17. Use of different concrete mix design for bridge barriers and decks ................. 47
Figure 3-18. Use of different types of pozzolans for barrier concrete................................... 48
Figure 3-19. The percentage of usage of different types of pozzolans.................................. 48
Figure 3-20. Surface finish methods used for barrier concrete.............................................. 49
Figure 3-21. Performance differences of barriers on rural roads and trunk line/interstate routes
............................................................................................................................ 50
Figure 3-22. Application of deicers to the bridge decks........................................................ 50
Figure 3-23. The percentage of usage of different deicers .................................................... 51
Figure 3-24. Changes made by the State Highway Agencies to improve the durability of New
Jersey Type 4 barriers......................................................................................... 52
Figure 4-1. Barrier inspection template (S06-82022) ............................................................ 57
Figure 4-2. Sample photos documenting the visual data documented on the barrier inspection
template (S06-82022) ......................................................................................... 58
Figure 4-3. Inspection raw data of bridge B01-50021........................................................... 60
Figure 4-4. Inspection raw data of bridge B01-66051........................................................... 61
Figure 4-5. Inspection raw data of bridge B02-66051........................................................... 62
Figure 4-6. Inspection raw data of bridge S01-44044 ........................................................... 63
Figure 4-7. Inspection raw data of bridge S20-63174 ........................................................... 64
Figure 4-8. Inspection raw data of bridge S02-82194 ........................................................... 65
Figure 4-9. Inspection raw data of bridge S02-23152 ........................................................... 66
Figure 4-10. Inspection raw data of bridge S04-63101 ......................................................... 67
Figure 4-11. Inspection raw data of bridge S04-63174 ......................................................... 68
Figure 4-12. Inspection raw data of bridge S04-82022 ......................................................... 69
Figure 4-13. Inspection raw data of bridge S06-82022 ......................................................... 70
Figure 4-14. Inspection raw data of bridge S08-82191 ......................................................... 71
Figure 4-15. Inspection raw data of bridge S09-63101 ......................................................... 72
Figure 4-16. Inspection raw data of bridge S12-63022 ......................................................... 73
Figure 4-17. Inspection raw data of bridge S15-63172 ......................................................... 74
Figure 4-18. Inspection raw data of bridge S24-82022 ......................................................... 75
Figure 4-19. Inspection raw data of bridge S26-82022 ......................................................... 76
Figure 4-20. Inspection raw data of bridge S27-41064 ......................................................... 77
CENTER FOR STRUCTURAL DURABILITY – Causes & Cures for Cracking of Concrete Barriers xiii
Figure 4-21. Inspection raw data of bridge S28-41064 ......................................................... 78
Figure 4-22. Inspection raw data of bridge S12-63172 ......................................................... 79
Figure 5-1. Cross-section of New Jersey Type 4 bridge barrier railing................................. 99
Figure 7-1. Comparison of compressive strength prediction models .................................. 128
Figure 7-2. Comparison of elasticity modulus prediction models....................................... 130
Figure 7-3. Geometry of the barrier..................................................................................... 131
Figure 7-4. (a) Stress-strain envelope for cracking of concrete and (b) stress- strain normal to
cracking plane after crack initiation (assuming linear-elastic behavior).......... 133
Figure 7-5. Variation of heat of hydration of cement with different percentages of GGBS 137
Figure 7-6. Longitudinal stress distribution along the barrier (a) height and (b) length for L/H=1
.......................................................................................................................... 141
Figure 7-7. Longitudinal stress distribution along the barrier length under upper and lower limits
of shrinkage ...................................................................................................... 142
Figure 7-8. Longitudinal stress distribution along barrier height at mid section (a) L/H=1 and (b)
L/H=2 ............................................................................................................... 143
Figure 7-9. Longitudinal stress distribution along barrier height at mid section for L/H = 2144

CENTER FOR STRUCTURAL DURABILITY – Causes & Cures for Cracking of Concrete Barriers xiv
LIST OF TABLES
Table 2-1. Types of Distress Observed on Reinforced Concrete Barriers............................... 4
Table 2-2. The Relationship between Humidity Range and Correction Formula ................. 11
Table 2-3. Coefficients α1 and α2 used in Bazant B3 Model................................................. 12
Table 2-4. Humidity Relation used in Bazant B3 Model....................................................... 12
Table 2-5. Humidity Relation used in CEB-FIB 90 Model ................................................... 13
Table 2-6. Cement Type Coefficient used in CEB-FIP 90 Model......................................... 14
Table 2-7. Humidity Relation used in Gardner-Lockman Model.......................................... 15
Table 2-8. Cement Type Coefficient used in Gardner-Lockman Model ............................... 15
Table 2-9. Cement Types and Fineness used for Developing Graphs in ACI 207.2R .......... 21
Table 3-1. List of Respondent States and Media of Responses............................................. 35
Table 3-2. Codes used for Presentation of Survey Responses............................................... 37
Table 4-1. Bridges Selected for Barrier Inspection ............................................................... 54
Table 4-2. Symbols used to Represent Distress Types .......................................................... 59
Table 4-3. Compiled Data on Barrier Distress....................................................................... 81
Table 4-4. Compiled Data on Barrier Distress....................................................................... 81
Table 4-5. Compiled Data on Barrier Distress....................................................................... 82
Table 4-6. Compiled Data on Barrier Distress....................................................................... 82
Table 4-7. Compiled Data on Barrier Distress....................................................................... 83
Table 4-8. Compiled Data on Barrier Distress....................................................................... 83
Table 4-9. Compiled Data on Barrier Distress....................................................................... 84
Table 4-10. Compiled Data on Barrier Distress..................................................................... 84
Table 4-11. Compiled Data on Barrier Distress..................................................................... 85
Table 4-12. Compiled Data on Barrier Distress..................................................................... 85
Table 4-13. Compiled Data on Barrier Distress..................................................................... 86
Table 4-14. Compiled Data on Barrier Distress..................................................................... 86
Table 4-15. Compiled Data on Barrier Distress..................................................................... 87
Table 4-16. Compiled Data on Barrier Distress..................................................................... 87
Table 4-17. Compiled Data on Barrier Distress..................................................................... 88
Table 4-18. Compiled Data on Barrier Distress..................................................................... 88
CENTER FOR STRUCTURAL DURABILITY – Causes & Cures for Cracking of Concrete Barriers xv
Table 4-19. Compiled Data on Barrier Distress..................................................................... 89
Table 4-20. Compiled Data on Barrier Distress..................................................................... 89
Table 4-21. Compiled Data on Barrier Distress..................................................................... 90
Table 4-22. Compiled Data on Barrier Distress..................................................................... 90
Table 4-23. Summary of Inspection Data .............................................................................. 91
Table 4-24. Distress of Barriers with North Exposure .......................................................... 93
Table 4-25. Distress of Barriers with South Exposure .......................................................... 93
Table 4-26. Distress of Barriers with West Exposure............................................................ 94
Table 4-27. Distress of Barriers with East Exposure............................................................. 94
Table 4-28. Ratio of Crack Spacing to Barrier Height of Existing Bridge Barriers.............. 95
Table 5-1. List of Reconstructed Bridges Monitored during Barrier Placement................... 97
Table 6-1. The Conducted Tests and Required Number of Standard Specimens................ 115
Table 6-2. Compressive Strength Test Results of Standard Specimens .............................. 118
Table 6-3. Modulus of Elasticity Results of Standard Specimens....................................... 118
Table 6-4. Poisson’s Ratio Test Results of Standard Specimens......................................... 119
Table 6-5. RCPT Test Results of Standard Specimens........................................................ 120
Table 6-6. UPV Test Results of Standard Specimens.......................................................... 120
Table 6-7. Air-Permeability Test Results of Standard Specimens ...................................... 121
Table 6-8. Absorption Test Results of Standard Specimens................................................ 121
Table 6-9. RCPT Test Results of Core Specimens .............................................................. 122
Table 6-10. UPV Test Results of Core Specimens .............................................................. 122
Table 6-11. Air-Permeability Test Results of Core Specimens........................................... 123
Table 6-12. Absorption Test Results of Core Specimens .................................................... 123
Table 7-1. Estimated Early-Age Mechanical Properties of Barrier Concrete ..................... 131
Table 7-2. Shrinkage Strain Predictions by Various Models............................................... 132
Table 7-3. Concrete Mix Design for Bridge S06 of 82194.................................................. 135
Table 7-4. Limitations of Shrinkage Prediction Model ....................................................... 138
Table 7-5. Total Shrinkage of Concrete at Different Ages.................................................. 138
Table 7-6. Tensile Stress and Strain Required for Crack Initiation..................................... 139

CENTER FOR STRUCTURAL DURABILITY – Causes & Cures for Cracking of Concrete Barriers xvi
LIST OF PHOTOGRAPHS
Photo 5-1. Reinforcement ties missing at some rebar intersections (bridge S06–82194) ..... 99
Photo 5-2. Formwork of barriers of bridge S05–82191....................................................... 100
Photo 5-3. Debris inside the forms (S05–82191)................................................................. 102
Photo 5-4. Steel molds on the traffic side (S05-82191)....................................................... 102
Photo 5-5. Concrete placement with bucket (S05-82191) ................................................... 103
Photo 5-6. Concrete placement directly from mix-truck (S20-50111) ................................ 103
Photo 5-7. Concrete consolidation using vibrator (S20-50111) .......................................... 103
Photo 5-8. (a) Steel bracing connected to barrier reinforcement and (b) steel bracing for the
alignment of formwork (S26-50111)................................................................ 104
Photo 5-9. Test run of the paver (S06-82194) ..................................................................... 105
Photo 5-10. Realigning rebars by hammering (S06-82194) ................................................ 105
Photo 5-11. Surface finishing of slipformed barriers (S06-82194) ..................................... 105
Photo 5-12. Repaired surface voids of form-cast barrier surface (S05-82191) ................... 107
Photo 5-13. Saw-cut joint of a form-cast barrier (S05-82191) ............................................ 107
Photo 5-14. Barrier surface without curing compound the day after concrete placement (S05-
82191)............................................................................................................... 108
Photo 5-15. Visible surface defects after extrusion in slipformed barriers (S06-82194) .... 109
Photo 5-16. Portions of plastic concrete near the construction joint of slipformed barrier broke
away and later hand repaired (S06-82194)....................................................... 109
Photo 5-17. Hand finish joint of a slipformed barrier (S06-82194) .................................... 110
Photo 5-18. Honeycombing and large voids were visible at the joint of slipformed barrier (S06-
82194)............................................................................................................... 110
Photo 5-19. Application of the one and only layer of curing compound on barrier surface (S06-
82194)............................................................................................................... 110
Photo 5-20. Map cracking of barrier surface observed 48 hours after slipforming (S06-82194)
.......................................................................................................................... 111
Photo 5-21. Full-length vertical crack on the barrier observed 48 hours after slipforming (S06-
82194)............................................................................................................... 111
Photo 5-22. Traffic generating vibrations while slipforming of barriers (S06-82194)........ 112
CENTER FOR STRUCTURAL DURABILITY – Causes & Cures for Cracking of Concrete Barriers 1
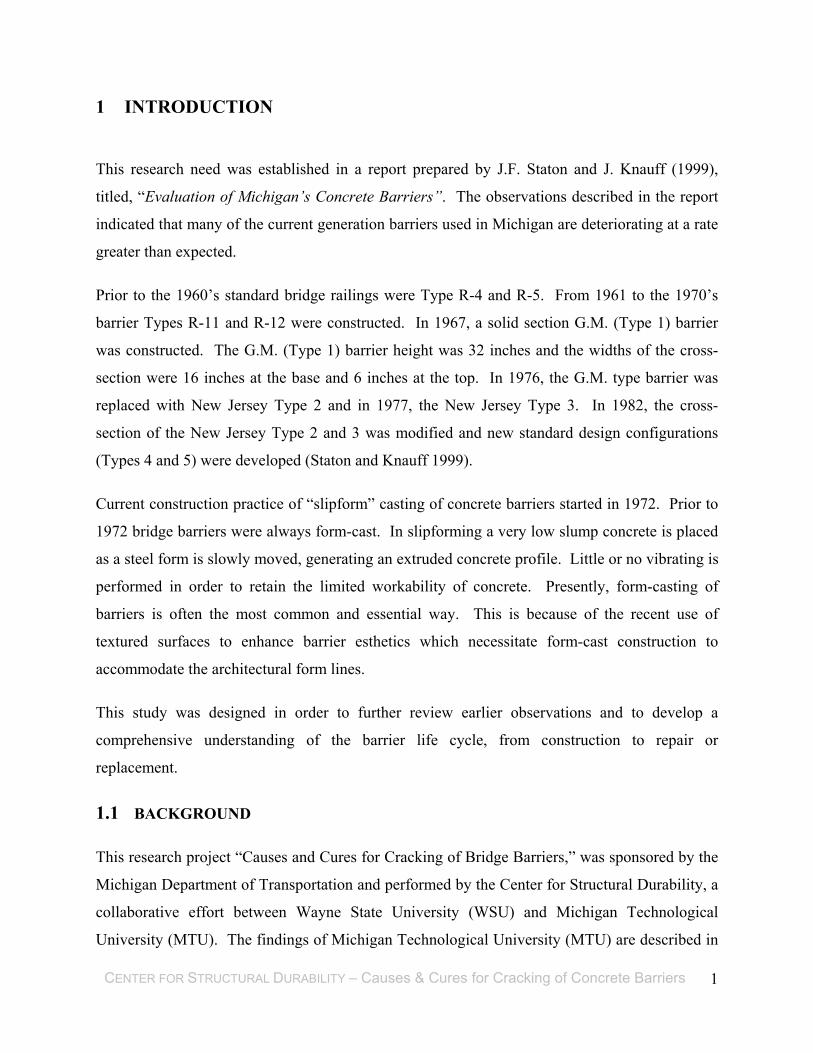
1 INTRODUCTION
This research need was established in a report prepared by J.F. Staton and J. Knauff (1999),
titled, “Evaluation of Michigan’s Concrete Barriers”. The observations described in the report
indicated that many of the current generation barriers used in Michigan are deteriorating at a rate
greater than expected.
Prior to the 1960’s standard bridge railings were Type R-4 and R-5. From 1961 to the 1970’s
barrier Types R-11 and R-12 were constructed. In 1967, a solid section G.M. (Type 1) barrier
was constructed. The G.M. (Type 1) barrier height was 32 inches and the widths of the cross-
section were 16 inches at the base and 6 inches at the top. In 1976, the G.M. type barrier was
replaced with New Jersey Type 2 and in 1977, the New Jersey Type 3. In 1982, the cross-
section of the New Jersey Type 2 and 3 was modified and new standard design configurations
(Types 4 and 5) were developed (Staton and Knauff 1999).
Current construction practice of “slipform” casting of concrete barriers started in 1972. Prior to
1972 bridge barriers were always form-cast. In slipforming a very low slump concrete is placed
as a steel form is slowly moved, generating an extruded concrete profile. Little or no vibrating is
performed in order to retain the limited workability of concrete. Presently, form-casting of
barriers is often the most common and essential way. This is because of the recent use of
textured surfaces to enhance barrier esthetics which necessitate form-cast construction to
accommodate the architectural form lines.
This study was designed in order to further review earlier observations and to develop a
comprehensive understanding of the barrier life cycle, from construction to repair or
replacement.
1.1 BACKGROUND
This research project “Causes and Cures for Cracking of Bridge Barriers,” was sponsored by the
Michigan Department of Transportation and performed by the Center for Structural Durability, a
collaborative effort between Wayne State University (WSU) and Michigan Technological
University (MTU). The findings of Michigan Technological University (MTU) are described in
CENTER FOR STRUCTURAL DURABILITY – Causes & Cures for Cracking of Concrete Barriers 2
the report titled, “Causes and Cures for Cracking of Concrete Barriers” by Van Dam et al.
(2003). The WSU work focused on the development of a crack management procedure for the
bridge barriers as detailed in this report.
1.2 OBJECTIVES AND METHOD
The work on this project was initiated on May 1, 2002. The objectives of this project were as
follows:
1. Investigation of the causes of concrete bridge barrier deterioration with the goal of
developing strategies for corrective action.
2. Examination and determination of the barrier distress states and mechanisms, then
development of material selection, mixture design, and/or construction strategies to
prevent rapid barrier deterioration.
This project consists of eight tasks. Sections of this report corresponding to the project tasks are
described below:
Task 1: Literature review includes, a review of relevant MDOT design, construction, and
maintenance practices concerning bridge barriers, a historical review of bridge barrier design,
material specifications and construction practices, and a review of literature and reports dealing
with cracking distress and its impact to bridge barrier service life.
Task 2: A nation wide survey on bridge barrier deterioration was prepared and distributed to
State Bridge Engineers in all 50 states. The results of this survey was used to assess the type of
concrete barrier distress and deterioration problems observed nation wide, as well as their
material specifications, design, construction practices, acceptance parameters, and acceptance
tests.
Task 3: Selected bridge barriers were visually inspected at arms length for documenting the
visible distress types, extend, and progression. Representative categories of barrier distress were
established from pre-inspection field observations. These categories were used for selecting
barriers for coring. The barriers inspected showed both good and poor performance,
representing a range of age, material types, and construction methods. The inspection was
performed visually using an assessment tool. The distress types were identified and classified

CENTER FOR STRUCTURAL DURABILITY – Causes & Cures for Cracking of Concrete Barriers 3
according to their significance on barrier durability performance. Extensive digital photographs
of each inspection site were obtained to document the observed conditions.
Task 4: Eight of the barriers were cored for laboratory investigations. Sampling included two
core specimens for petrographic examination and one for permeability testing, and some
additional specimens depending on the visual assessment.
Task 5: Bridge barrier constructions during deck and/or full structure replacement projects were
monitored and compliance with the Michigan Department of Transportation (MDOT) - Standard
Specifications for Construction was appraised. Of special interest was the monitoring of
slipformed barrier construction, with particular interest in the casting as well as the curing
procedures.
Task 6: Laboratory testing of the specimens obtained from existing and new barriers was
performed. The petrographic and distress characterization tests are reported separately in a
report by the Michigan Technological University (Van Dam et al. 2003). Mechanical property
testing of standard specimens was performed to assess the material properties related to cracking
and durability. Gas permeability, water permeability, and porosity measurements were made on
core specimens and standard specimens.
Task 7: Barrier performance parameters were established from the results of the literature
review, visual inspections, monitoring of new construction, and laboratory analysis. Additional
performance parameters were defined contributing to the service life of concrete bridge barriers.
The recommendations include modifications to the construction procedures, curing practices,
material specifications, and a crack management procedure.
Task 8: Quarterly reports and a final report were prepared for submittal to the Research Advisor
Panel. The final report summarizes the entire project and includes recommendations for changes
to bridge barrier design practices, materials specifications, and construction procedures in order
to increase bridge barrier service life.

CENTER FOR STRUCTURAL DURABILITY – Causes & Cures for Cracking of Concrete Barriers 4
2 STATE-OF-THE-ART LITERATURE REVIEW
2.1 OVERVIEW
In order to have an understanding of barrier condition, an initial survey was performed for
identifying common distress states. Fourteen bridges with NJ barriers were randomly selected in
the Detroit Metropolitan area for distress identification. The distress was recorded in
photographs. The data collected was used for defining the scope of the investigation.
The photos taken that recorded the condition of bridge barriers and the associated distresses were
in consensus with Staton and Knauff (1999) and documented that the primary distress types were
spalling or disintegration, delamination, horizontal cracking, corrosion, efflorescence, vertical
cracking (termed as transverse cracking), map cracking, and, popouts (Table 2-1).
Table 2-1. Types of Distress Observed on Reinforced Concrete Barriers
Distress Type Description
Spall or Disintegration
A fragment, usually in the shape of a flake, detached from a larger mass; a small spall shape is roughly circular or oval or in some cases elongated, is more than 0.8 in. in depth and 6 in. in greatest dimension.
Delamination A separation along a plane parallel to a surface.
Horizontal cracking
Cracks that develop parallel to the length of a member. Also referred to as longitudinal cracking.

CENTER FOR STRUCTURAL DURABILITY – Causes & Cures for Cracking of Concrete Barriers 5
Table 2-1. Types of Distress Observed on Reinforced Concrete Barriers
Distress Type Description
Corrosion Destruction of rebar by chemical, electrochemical, or electrolytic reaction with its environment.
Efflorescence
A deposit of salts, usually white, formed on a surface, the substance having emerged in solution from within concrete and subsequently been precipitated by evaporation.
Vertical Cracking
Cracks that develop at right angles to the longitudinal direction of the member. Also referred to as transverse cracking.
Map Cracking Intersecting cracks that are near the concrete surface.
Popouts
The breaking away of small portions of a concrete surface which leaves a shallow, typically conical, depression; small popouts leave holes up to 0.4 in. in diameter, medium popouts leave holes 0.4 to 2 in. in diameter, large popouts leave holes greater than 2 in. in diameter.
In the literature review, topics were discussed among the pertinent articles in the order of type of
distress, causes of distress, and the corrective actions taken to mitigate bridge barrier distress.

CENTER FOR STRUCTURAL DURABILITY – Causes & Cures for Cracking of Concrete Barriers 6
2.2 TYPE OF DISTRESS
2.2.1 Vertical (Transverse) Cracking
Vertical or transverse cracking that is observed at early ages is often the predominant type of
distress in a given barrier segment. The vertical cracking is identified as the leading cause of
other distress types. These cracks lead to ingress of moisture, which results in early initiation of
corrosion. Though epoxy coat is used to prevent/delay reinforcement corrosion, recent studies
revealed that epoxy coating debonds with moisture and reinforcement is still susceptible to
corrosion (see Section 2.2.3). The causes of vertical cracking on newly constructed barriers were
examined on Vachon Bridge, Montreal Canada. Vertical cracks were observed within a few
days after concrete placement. The observed vertical crack spacing was approximately 0.8 times
the height of the barrier. Cracking forms on barriers primarily under restrained volume change.
Barriers can be assumed to be fully restrained at the base (Cusson and Repette 2000). Additional
work focusing on restrained cracking of concrete members shows that most vertical cracks occur
within a few days after concrete placement (Cusson and Repette 2000, Al Rawi and Kheder
1990, Kheder et al. 1994, Carlson and Reading 1988 and Wiegrink et al. 1996). Al Rawi and
Kheder (1990) observed vertical cracking on fully base restrained unreinforced concrete walls at
a spacing of 1.24 times the wall height. According to ACI 207 (2001), fully base-restrained
unreinforced concrete walls ultimately attain full-length vertical cracks spaced between one to
two times the height of the wall.
2.2.2 Map Cracking
Map cracking is a common defect observed on the barrier surface. The cause of map cracking is
attributed to factors related to material properties and construction practices. Map cracking of
barriers is often related to early thermal shrinkage cracking due to hydration of cement, an
exothermic process. The center of the barrier retains sufficient heat to hydrate; meanwhile, the
surface is subjected to water loss and subsequently thermal stresses, and causes map cracking on
the surface (Baradan et al. 2002 and Kovler 1995). In another case, rapid loss of water from the
surface during the hydration process also can cause map cracking.
CENTER FOR STRUCTURAL DURABILITY – Causes & Cures for Cracking of Concrete Barriers 7
2.2.3 Corrosion
Corrosion influences the long-term performance of reinforced concrete, particularly in
aggressive environments. Corrosion causes spalling of concrete cover and leads to loss of
integrity and strength. Corrosion initiation and propagation reduces the area of steel and the
bond between concrete and steel (Stewart and Rosowsky 1998). There is an agreement among
concrete researchers that cracking can accelerate the ingress of corrosive agents and accelerate
corrosion. However, ACI 207.2R (2001) states that cracking transverse to the reinforcing bar
does not accelerate corrosion.
Corrosion of steel in a concrete member can develop within a few years after placement of
concrete, depending on concrete design, construction practices, and exposure level. Corrosion
does not remain limited to the initiation zone, especially in cyclic wetting-drying areas of
structures. Uncontrolled corrosion leads to severe deterioration and very rapid loss of capacity
of concrete members (Alampalli and Owens 2000, Costa and Appleton 2002, and Montemor et
al. 2002).
Epoxy coating is used to inhibit the corrosion of reinforcement. In a study for assessing the
effectiveness of epoxy-coating, 18 bridge decks in Virginia was evaluated. The bridge decks
were 2 to 20 years old at the time of investigation. A total of 250 concrete cores were extracted
from these bridge decks. In all cases except one bridge, adhesion loss of epoxy coating to the
steel surface was detected. Chloride, moisture, and oxygen ingress through the debonded coating
initiate corrosion. Additional investigations performed in Minnesota and Florida confirms the
finding of the Virginia study. Virginia study documented that epoxy coating debonds in as little
as 4 years (Pyć et al. 2000).
2.2.4 Horizontal Cracking
Horizontal cracks can be related to the consolidation of plastic concrete into the voids that
remained in the slipforming process. Additionally, bridge deck vibrations under traffic can be a
factor in generating further consolidation of plastic concrete and should be examined (Cusson
and Repette 2000). Plastic settlement cracking can be the source of continuous horizontal cracks
CENTER FOR STRUCTURAL DURABILITY – Causes & Cures for Cracking of Concrete Barriers 8
(Baradan et al. 2002). Additional local cracks, which are observed with the continuous
horizontal cracking, can be related to corrosion expansion (Allan 1995).
2.2.5 Spalling and Disintegration
Spalling and disintegration are characteristics of the ultimate stages of distress in reinforced
concrete structures. With vertical and horizontal cracking, increased volume of moisture with
deicers and other deteriorative agents ingress into concrete initiating and accelerating
reinforcement corrosion. Further, the freeze-thaw effect with the presence of moisture rapidly
increases the length and width of the cracks. Spalling is typically defined as the loss of sizable
chunks of intact concrete. Disintegration is usually the loss of small particles and individual
aggregate particles due to freeze-thaw effects, chemical attack, or poor construction practices
(EM 1110-2-2002 1995).
2.3 ANALYSIS OF CAUSES OF DISTRESS
Primary causes of early-age cracking are identified as drying shrinkage, thermal loads, and
restraint of concrete. Volume change in concrete is mainly due to autogenous shrinkage, drying
shrinkage, and thermal loads. Autogenous shrinkage occurs due to self-desiccation of cement
paste. Autogenous shrinkage is primarily observed in mass concrete. Drying shrinkage occurs
while water on the concrete surface evaporates. As drying continues, water in the concrete mass
is removed either by evaporation or by hydration, and volume change occurs. In principle,
uniform evaporation of free water causes little or no shrinkage in concrete (Neville 1995).
Hydration of cement is an exothermic process, thus generates heat. The amount of heat
generated and the age of concrete at which the maximum temperature difference occurs between
the interior and exterior of the concrete element depends on the geometry of the structure,
ambient temperature at the time of casting, and the concrete mix. The temperature difference
between the interior and exterior of the element causes restraint volume change and consequently
stresses within the barrier section (ACI 207.1R 2001 and Siew et al. 2003).

CENTER FOR STRUCTURAL DURABILITY – Causes & Cures for Cracking of Concrete Barriers 9
2.3.1 Structural
Cracking due to restraints on a reinforced concrete member has been discussed in ACI 207.2R
(2001). Barriers can be assumed to be fully base-restrained continuous members. Cracking due
to volume change is a result of the combined effects of strain due to volume change and restraint.
When strain due to volume change of a concrete component exceeds the concrete cracking strain
accompanied by sufficient stress due to restraint effects, concrete will crack (Al-Rawi and
Kheder 1990 and Hossain et al. 2003). Once the crack initiates, it can extend at a much lower
tensile stress than that which was required for initiation. A propagating crack will increase the
tensile stress at every section along the uncracked plane. The full base restraint will cause crack
propagation up to 0.2 or 0.3 times the height of the section. At that point, the crack is free to
propagate to the full section without any shrinkage due to the unbalanced stress between the
cracked and uncracked portions of the section (ACI 207.2R 2001).
Studies on restrained shrinkage described differential shrinkage between the base material and
the barrier. This differential shrinkage creates stress that exceeds the tensile strength of
immature concrete, and results in shrinkage cracking (Cusson and Repette 2000, Al Rawi and
Kheder 1990, Kheder et al. 1994, Carlson and Reading 1988, and Wiegrink et al. 1996). Vertical
or transverse cracking is often observed on flat structures such as decks and walls. The
formation time of cracks depends on free shrinkage, tensile strength and elasticity modulus, and
creep (Wiegrink et al. 1996). Another factor involved in shrinkage cracking is the concrete
member geometry, especially during thermal shrinkage at an early-age (Schutter and Taerwe
1996). The exposed-surface to volume ratio of the member affects the rate of shrinkage and heat
losses.
2.3.2 Environmental Effects
The environmental condition such as ambient temperature, relative humidity, and wind velocity
has a significant influence on the properties of fresh and hardened concrete. The rate of water
evaporation and shrinkage strain increases with increased ambient temperature and wind velocity
and decreased relative humidity. Elevated temperature exposure decreases the compressive
strength of concrete. Environmental exposure conditions influence the concrete pore volume and
hence the porosity. Concrete having large pore sizes and a hollow structure allows greater

CENTER FOR STRUCTURAL DURABILITY – Causes & Cures for Cracking of Concrete Barriers 10
penetration of moisture at an elevated temperature than concrete at a lower temperature.
Concrete placed at an elevated temperature is often less durable (Almulsallam 2001 and ACI
207.2R 2001).
Concrete shrinks when it is exposed to a drying environment. The amount of shrinkage depends
on material properties, ambient temperature, relative humidity, and the age and size of the
structure. Non-uniform moisture distribution, steel embedded in section, or aggregate can cause
differential drying shrinkage. When concrete is placed, it is exposed to the ambient air. Water
movement inside concrete occurs by diffusion. Therefore, the moisture content in concrete
varies in both space and time, and moisture distribution in a given concrete section becomes non-
uniform. Non-uniformity and internal drying shrinkage vary through the depth of the section;
thus stress induced by differential drying shrinkage may cause surface cracks (Kim and Lee
1998).
2.3.2.1 Methods for Estimating Shrinkage Strain
2.3.2.1.1 Overview
The available shrinkage prediction models for concrete are mostly based on the ACI 209 and
CEB-FIP models. Other models are derived from these models by incorporating additional
parameters and modifications (Hani et al. 2003). Researchers have tried to evaluate shrinkage
prediction models with different curing procedures. Mokarem et al. (2003) used crushed
limestone gravel and diabase in concrete mixes in order to see the effects of aggregate type on
shrinkage. For all types of aggregate, CEB-FIP 90 is found to be a better predictor than ACI
209, Gardner-Lockman, and the Bazant B3 model. The Gardner-Lockman and Bazant B3
models are found to be the second best prediction models. ACI 209 is found to be the least
accurate in predicting drying shrinkage. On the other hand, Hani et al. (2003) found that ACI
209 is a good predictor for 28-day shrinkage and is more conservative for later ages. It was also
established that the CEB-FIP 90 model is a good shrinkage prediction model for concrete at very
early ages. Researchers state that the Bazant B3 model is a good prediction model for long-term
shrinkage estimation.

CENTER FOR STRUCTURAL DURABILITY – Causes & Cures for Cracking of Concrete Barriers 11
The mathematical formulations for prediction models are very similar. Each model has an
ultimate shrinkage value that predicts total possible shrinkage for given strength and cement
type. Ultimate shrinkage is a constant only in ACI 209 for all types of cements and concretes.
The shrinkage time function component is a time-dependent function varying based on drying
time of concrete, which starts from the time of concrete placement. The shrinkage process stops
at any time, at about 100% relative humidity. The shape of components is incorporated in the
formula as volume to exposed-surface ratio. The relative humidity component is related to the
average humidity of the environment.
2.3.2.1.2 Prediction Model Recommended in ACI 209
ACI 209 is an empirical approach to calculate free total shrinkage of concrete:
ushc
csh )t(t35
)t(t(t)ε ε⋅
−+
−= (2-1)
where t is the age of concrete at which the shrinkage strain is to be predicted, tc is the age of
curing or the age at which concrete starts drying, and ushε is the ultimate shrinkage (in./in.).
In ACI equation the ultimate shrinkage value is constant and equal to 780µ strain for all types of
concrete and curing conditions. Ultimate shrinkage is corrected based on a humidity function:
Table 2-2. The Relationship between Humidity Range and Correction Formula
Humidity range Humidity function (γ RH)
40% < RH < 80% 1.40 – RH/100
80% < RH < 100% 3.00 – 3*RH/100
ushε = 780x10-6 x γRH (2-2)
The constant shrinkage approximation reduces the accuracy of predictions. Time (t) and age of
curing (tc) are the variables of the prediction function. The ACI formula is based on the

CENTER FOR STRUCTURAL DURABILITY – Causes & Cures for Cracking of Concrete Barriers 12
assumption of a 7-day wet curing period upon placement. The shrinkage prediction becomes
more accurate with increased curing duration.
2.3.2.1.3 Bazant B3 Model for Shrinkage Prediction
The Bazant B3 formulation was developed from an analytical statistical evaluation (Bazant
1995). Shrinkage at time t, (εsh(t)), is calculated considering the type of cement, curing, water
content, and 28-day standard strength:
S(t)k(t)ε hushsh ××= ε (2-3) Ultimate shrinkage (εshu) is formulated as follows:
( ) ( ) 10270fw26αα 60.282.121ush
'c
−−×
+=ε (2-4)
Ultimate shrinkage is a function of cement type (α1), curing conditions (α2), water content (w),
and 28-day strength (f ’c).
Table 2-3. Coefficients α1 and α2 used in Bazant B3 Model
ASTM C 150 type cements α1 Curing coefficient α2 Type I 1 Steam cured concretes 0.75 Type II 0.85 Water cured or RH 100 % 1.0 Type III 1.1 Sealed specimens 1.2
The component kh is related to the humidity of the environment, and the relationship is given in
Table 2-4:
Table 2-4. Humidity Relation used in Bazant B3 Model
Relative humidity kh for h ≤ 0.98 1 – h3 for h = 1 -0.2 for 0.98 ≤ h ≤1 Use linear interpolation
The time function of shrinkage S(t) is a function of concrete age (t), duration of wet cure (tc), and
shrinkage time coefficient (τsh).
CENTER FOR STRUCTURAL DURABILITY – Causes & Cures for Cracking of Concrete Barriers 13
τ
tttanhS(t)
sh
c−= (2-5)
Shrinkage time coefficient τsh is size dependent as given below:
( )Dkkτ s2
tsh ×= (2-6)
( ) ( )ft190.8k '
cc0.250.08
t−−= (2-7)
ks is cross section shape factor ( for a rectangular section, it is 1) and D=2*Volume/Surface ratio
(in.).
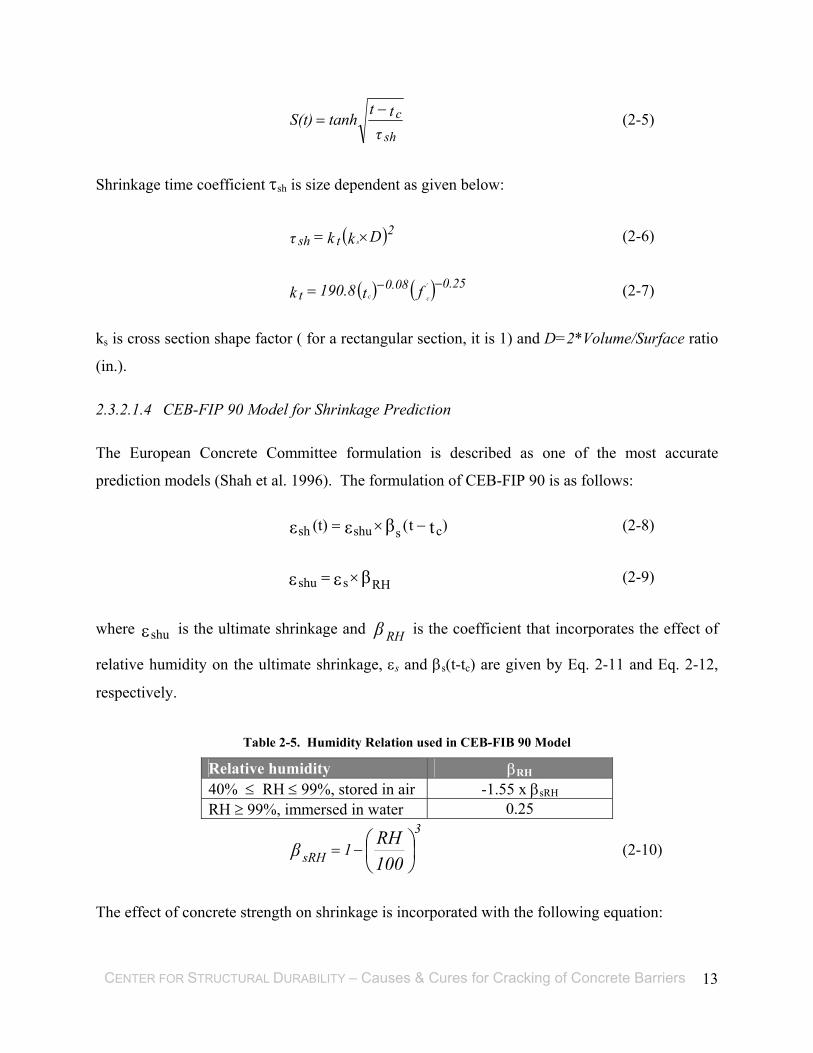
2.3.2.1.4 CEB-FIP 90 Model for Shrinkage Prediction
The European Concrete Committee formulation is described as one of the most accurate
prediction models (Shah et al. 1996). The formulation of CEB-FIP 90 is as follows:
)t((t) tβεε csshush −×= (2-8)
βRHsshu ×= εε (2-9)
where εshu is the ultimate shrinkage and β RH is the coefficient that incorporates the effect of
relative humidity on the ultimate shrinkage, εs and βs(t-tc) are given by Eq. 2-11 and Eq. 2-12,
respectively.
Table 2-5. Humidity Relation used in CEB-FIB 90 Model
Relative humidity βRH 40% ≤ RH ≤ 99%, stored in air -1.55 x βsRH RH ≥ 99%, immersed in water 0.25
−=
100RHβ
3
sRH 1 (2-10)
The effect of concrete strength on shrinkage is incorporated with the following equation:

CENTER FOR STRUCTURAL DURABILITY – Causes & Cures for Cracking of Concrete Barriers 14
10f
β10 6'c
scs 14509160 −×
−+= ×ε (2-11)
The cement type factor is given according to European cement types but it is also defined for the
ASTM type cements as shown in Table 2-6.
Table 2-6. Cement Type Coefficient used in CEB-FIP 90 Model
Type of cement βsc Low heat development cements (Type II and Type V) 4
Rapid heat development cements Type I and Type III 5
The development of shrinkage with time is defined in the βs coefficient and described in Eq.2-
12:
( )
( )
−+×
−=−
t937.3h
ttβ
c
2c
cs
t350
t)t(
0
(2-12)
where h0 = 2x(cross sectional area/ perimeter of the member in contact with the atmosphere).
The CEB formulation is similar to the Bazant B3 prediction formula. It has an ultimate
shrinkage and humidity coefficient as well as a time-dependent shrinkage function.
The European committee formulation is an accurate method for predicting shrinkage, since it
incorporates almost all factors that may affect shrinkage. The results of this formulation are in
close agreement with the Bazant B3 formulation in the long term (Mokarem et al. 2003 and Hani
et al. 2003). In addition, the CEB-FIP 90 model is quite accurate for early-age predictions since
it was developed for specimens cured in short durations (Hani et al. 2003).
CENTER FOR STRUCTURAL DURABILITY – Causes & Cures for Cracking of Concrete Barriers 15
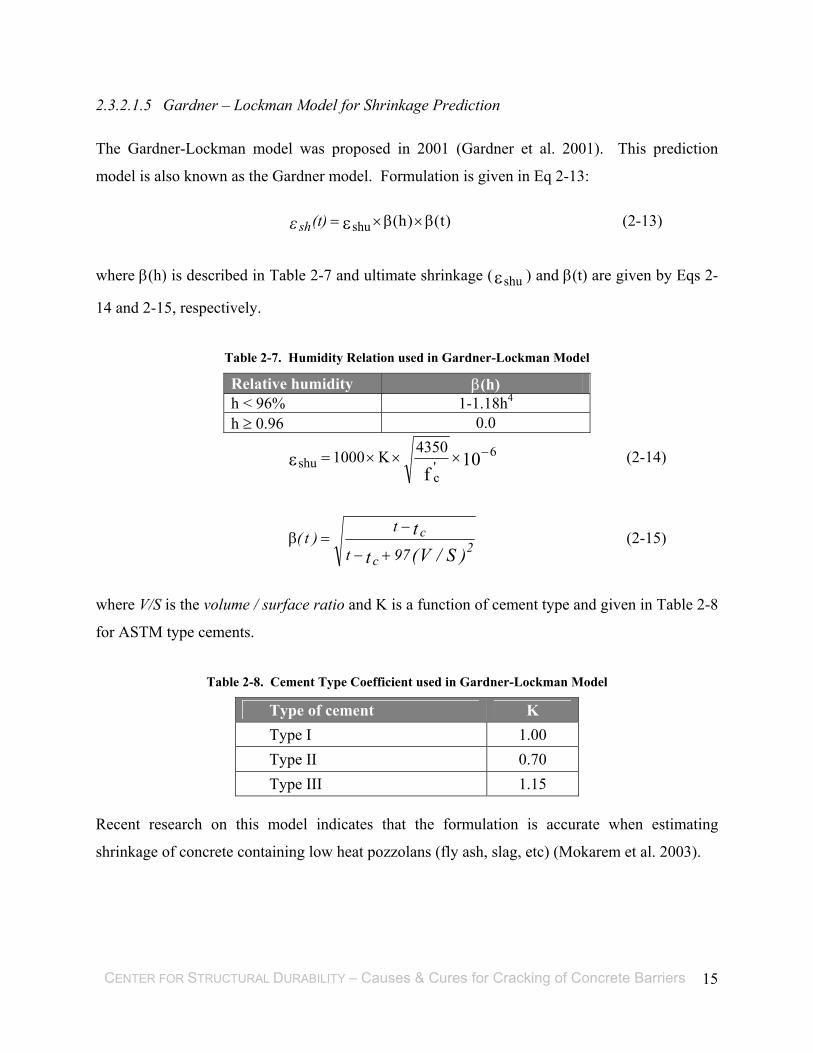
2.3.2.1.5 Gardner – Lockman Model for Shrinkage Prediction
The Gardner-Lockman model was proposed in 2001 (Gardner et al. 2001). This prediction
model is also known as the Gardner model. Formulation is given in Eq 2-13:
)t()h(shu β×β×= ε(t)ε sh (2-13)
where β(h) is described in Table 2-7 and ultimate shrinkage (εshu ) and β(t) are given by Eqs 2-
14 and 2-15, respectively.
Table 2-7. Humidity Relation used in Gardner-Lockman Model
Relative humidity β(h) h < 96% 1-1.18h4 h ≥ 0.96 0.0
10f
6'c
shu4350K1000 −×××=ε (2-14)
)S/V(t
t2
c
c
97t
t)t(
+−
−=β (2-15)
where V/S is the volume / surface ratio and K is a function of cement type and given in Table 2-8
for ASTM type cements.
Table 2-8. Cement Type Coefficient used in Gardner-Lockman Model
Type of cement K Type I 1.00 Type II 0.70 Type III 1.15
Recent research on this model indicates that the formulation is accurate when estimating
shrinkage of concrete containing low heat pozzolans (fly ash, slag, etc) (Mokarem et al. 2003).

CENTER FOR STRUCTURAL DURABILITY – Causes & Cures for Cracking of Concrete Barriers 16
2.3.2.2 Evaporation of water from fresh concrete
Heat of hydration in fresh concrete, amount of plastic shrinkage, and plastic shrinkage cracking
depend to a great extent on the rate of evaporation from fresh concrete, which influences the
strength and durability of the concrete. It is recognized that the level of evaporation from the
surface of fresh concrete depends on the prevailing ambient temperature, relative humidity, wind
speed, and the temperature of the fresh concrete. The evaporation rate depends on climatic
conditions because at the beginning of casting, water exists at the surface of the concrete
(bleeding water). Additionally, the moisture movement within the solid is rapid enough to
maintain a saturated condition of the surface. The drying process of porous media can be
divided into two periods referred to as initial and terminal drying period. In the case of concrete,
initial drying period consists of two evaporation stages. The mechanism of moisture removal
during the first stage is equivalent to evaporation from a liquid water surface. The evaporation-
drying rate of concrete can be calculated from heat transfer relationship (Razek and Enein 1999):
LTThR wdacc /)( −= (2-16) where, Rc is the evaporation drying rate (lb/ft2/hr), hc is convection heat transfer coefficient
(Btu/ft2/hr/K) and can be calculated by relation v375.028.4hc += (v is the wind velocity in
ft/s), Tda is the dry bulb temperature (ambient air temperature) (K), Tw is the wet bulb
temperature (K) and can be calculated from ASHRAE Psychrometric Chart No.6 (ASHRAE
Handbook 1992) by knowing relative humidity and dry bulb temperature of air, and L is the
latent heat of vaporization of water (Btu/lb).
2.3.2.3 Hydration Temperature Stresses
Hydration of cement is an exothermic process that causes a temperature rise within a concrete
mass. This initial temperature rise and expansion induces no residual compressive stresses in
concrete when changing from a plastic state to a solid state. This is because of the extremely low
modulus of elasticity of the concrete at this plastic-to-solid state. When the concrete reaches its
peak temperature, it has also solidified. Subsequently, the hardened concrete begins to cool to
ambient temperature. During the cooling process, the fixed base of the barrier restrain the
shrinkage. This phenomenon will in turn cause tensile stresses and cracking of the barrier. The

CENTER FOR STRUCTURAL DURABILITY – Causes & Cures for Cracking of Concrete Barriers 17
magnitude of thermal shrinkage in the barrier depends on the difference between the peak
concrete temperature and the temperature of the supporting deck at that time. Unlike drying
shrinkage, which may take over a year, thermal shrinkage is more rapid and loads the concrete
over a short period (a few days). Thus, concrete creep properties cannot fully engage to relax the
concrete and mitigate cracking (Purvis et al. 1995).
2.3.2.4 Hydration Temperature
The rate and magnitude of concrete temperature rise during the hydration process depend on
several factors. These factors include cement composition (cement type) and fineness, amount
of cement per unit volume of concrete, ambient temperature, concrete temperature during
placement, and amount of heat lost or gained during hydration process. The exposure conditions
and volume to exposed-surface area ratio of bridge barrier governs the amount of heat lost or
gained.
Figure 2-1. Effect of concrete placing temperature and volume to surface (exposed to environment) ratio on
age at peak temperature for Type 1 cement
If the concrete placing temperature and volume/surface ratio of bridge barrier are known, the
time of achieving peak temperature is determined from Figure 2-1, provided Type 1 cement is
used. During the hydration process there is a temperature difference between the concrete
(ACI 207.2R 2001)

CENTER FOR STRUCTURAL DURABILITY – Causes & Cures for Cracking of Concrete Barriers 18
forming the barrier and the ambient air. After determining the peak temperature from Figure
2-1, Figure 2-2 can be used to compute the percent absorbed or dissipated heat between placing
and ambient temperature.
Figure 2-2. The effect of volume to surface ratio and age at peak temperature on percent absorbed or
dissipated of difference in placing and ambient temperature
New Jersey bridge barrier geometry gives a volume to exposed-surface ratio (V/S) of 0.42 feet.
Consequently, from Figure 2-2 the rate of heat absorbed or dissipated approaches 100%. Thus,
the effective concrete temperature during placement approaches ambient temperature. Concrete
temperature during placement is also a parameter for adiabatic temperature rise (Figure 2-3).
The temperature rise within the concrete barrier also depends on the exposed barrier surface
condition. As depicted in Figure 2-4, if the exposed concrete surface is kept wet, the temperature
rise decreases significantly.
(ACI 207.2R 2001)

CENTER FOR STRUCTURAL DURABILITY – Causes & Cures for Cracking of Concrete Barriers 19
Figure 2-3. Effects of placement temperature on adiabatic temperature rise
(ACI 207.2R 2001)
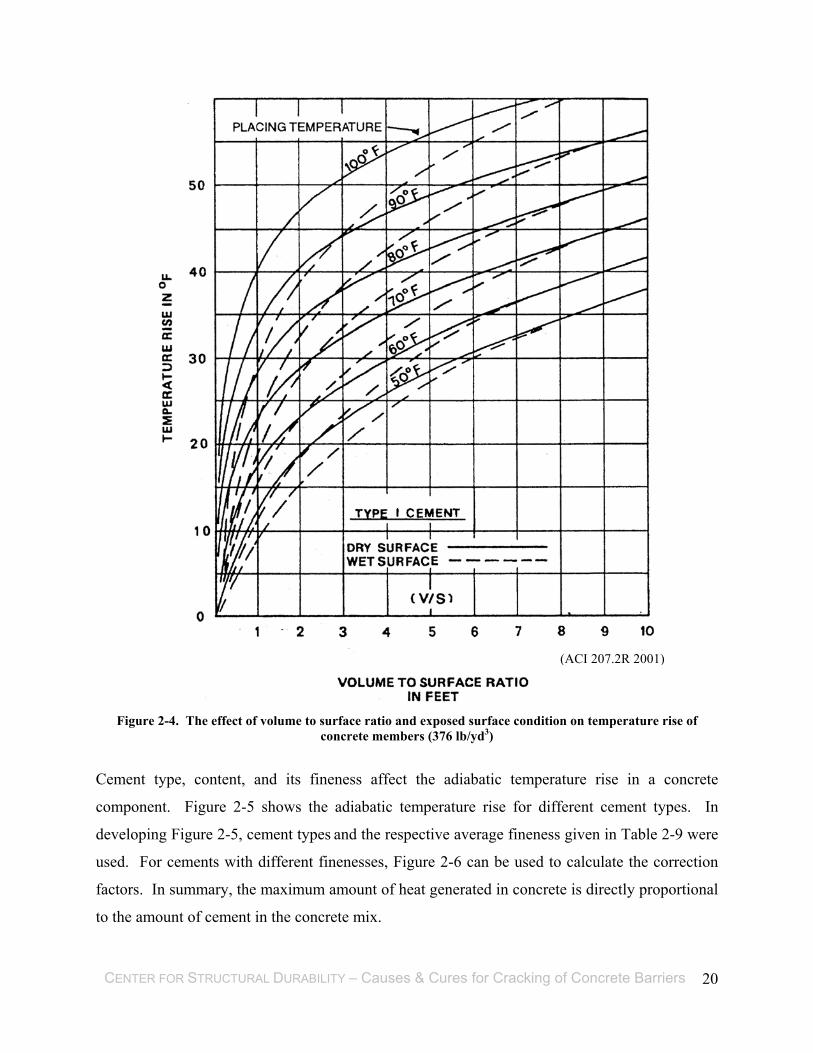
CENTER FOR STRUCTURAL DURABILITY – Causes & Cures for Cracking of Concrete Barriers 20
Figure 2-4. The effect of volume to surface ratio and exposed surface condition on temperature rise of
concrete members (376 lb/yd3)
Cement type, content, and its fineness affect the adiabatic temperature rise in a concrete
component. Figure 2-5 shows the adiabatic temperature rise for different cement types. In
developing Figure 2-5, cement types and the respective average fineness given in Table 2-9 were
used. For cements with different finenesses, Figure 2-6 can be used to calculate the correction
factors. In summary, the maximum amount of heat generated in concrete is directly proportional
to the amount of cement in the concrete mix.
(ACI 207.2R 2001)

CENTER FOR STRUCTURAL DURABILITY – Causes & Cures for Cracking of Concrete Barriers 21
Figure 2-5. Variation of adiabatic temperature rise with age of concrete for different types of cements
Table 2-9. Cement Types and Fineness used for Developing Graphs in ACI 207.2R
Cement Type Fineness ASTM C 115 ft2/lb
I 875 II 924 III 992 IV 933
(ACI 207.2R 2001)

CENTER FOR STRUCTURAL DURABILITY – Causes & Cures for Cracking of Concrete Barriers 22
Figure 2-6. Effects of cement fineness on heat generation
2.3.3 Concrete Construction, Placement, and Curing Errors
A major factor that reduces the service life of a structure is due to errors during placement and
curing. Shallow concrete cover, misplaced or missing reinforcements, substandard curing, and
other substandard construction practices are often observed in many projects. However, the
severity of the effects of the errors on the service life of the concrete structure is controlled by
exposure conditions. Mistakes in material selection, construction practices, and post-
construction work should be anticipated and immediate corrective measures should be taken
during early-age preventive maintenance activities. Specifications should cover possible errors
(Jaycox 1982).
The amount of water required for the hydration process should be available if the concrete is to
achieve its full potential quality. During the first few hours after concrete placement, specifically
prior to start of wet cure, if high wind velocity, high temperature, and low relative humidity
(ACI 207.2R 2001)

CENTER FOR STRUCTURAL DURABILITY – Causes & Cures for Cracking of Concrete Barriers 23
conditions exist, excessively rapid drying can cause plastic shrinkage cracking. Permanent
strength loss can result if moisture supply is insufficient. Substandard application of the curing
compound or insufficient moisture during the first hours and substandard curing following the
first few hours is detrimental to the concrete performance at later ages. In addition to the
permanent strength loss due to insufficient moisture during the hydration process, other
consequences are the increased permeability of concrete and map cracking (RILEM-42-CEA
1981).
The reinforcing bar position and the quality of the surrounding concrete primarily control the
bond quality of deformed bars. Upon concrete placement, due to the effect of water gain and
sedimentation of coarse aggregates under reinforcing bars, a porous layer of concrete can form
under the reinforcement and its ribs as shown in Figure 2-7 (Park and Paulay 1975). Due to this
effect, the top rebars of a concrete barrier will have poor bond quality when compared with the
bottom rebars. Also, consolidation of concrete immediately upon placement causes a relative
downward movement of the concrete surrounding the top reinforcement. This process forms a
conduit under the horizontal rebars (Park and Paulay 1975). If vertical cracks occur, water and
other contaminants that penetrate through the cracks propagate through the conduit along the
length of the rebar, initiating corrosion along the full length of reinforcement. Corrosion of the
rebar initiates further cracking along the top horizontal reinforcement.
Slipforming is a widely used construction technique for reinforced concrete bridge barriers. This
technique gained high acceptance in the industry and the highway agencies because of its speed.
Slipforming is the extrusion of very low slump concrete around the reinforcements to form the
barriers. The extruded concrete from the pavement machine is hand floated, broomed, and
sprayed with curing compound. No further curing is specified or performed upon the application
of the curing compound. If the curing compound does not form a uniform impervious
membrane, the barrier is exposed to the ambient air at very early ages. Concrete exposure to the
environment at early ages affects compressive and tensile strength gain of concrete as described
in RILEM 42-CEA (1981). Additionally, thermal and drying shrinkage strains are amplified.
These effects, combined with restraint effects, may create cracking and other distresses. The
distress may either be due to loosely consolidated concrete material that inhibits further
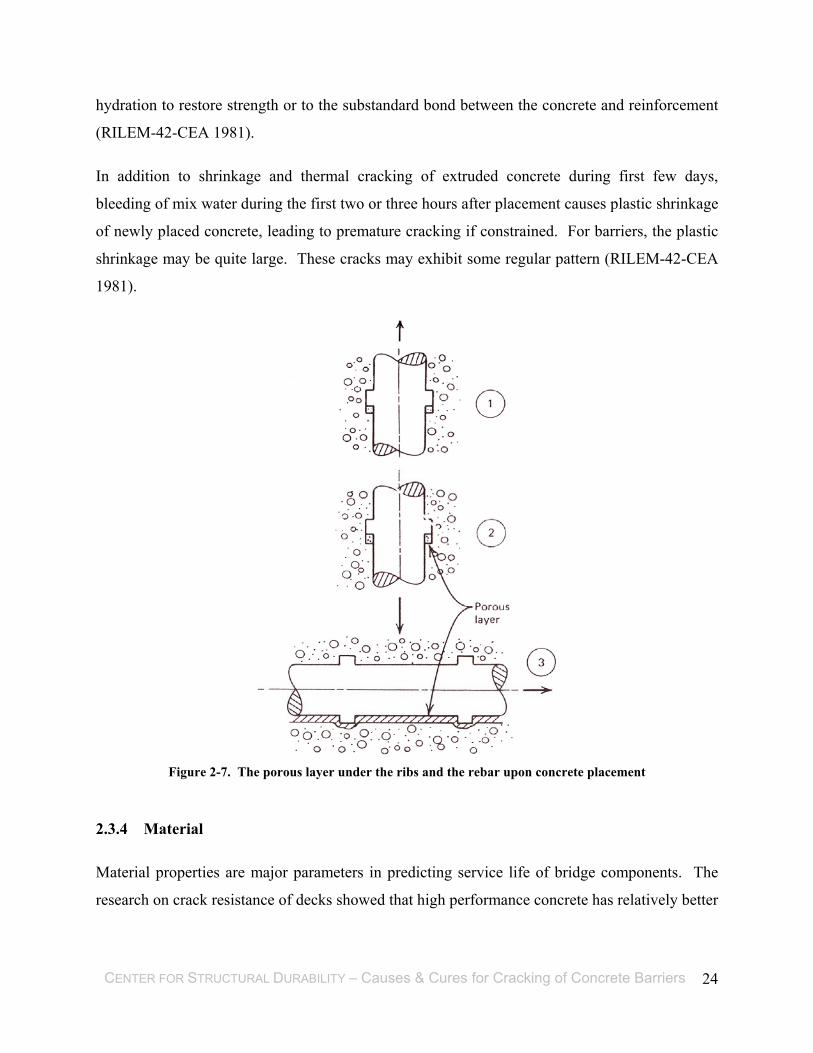
CENTER FOR STRUCTURAL DURABILITY – Causes & Cures for Cracking of Concrete Barriers 24
hydration to restore strength or to the substandard bond between the concrete and reinforcement
(RILEM-42-CEA 1981).
In addition to shrinkage and thermal cracking of extruded concrete during first few days,
bleeding of mix water during the first two or three hours after placement causes plastic shrinkage
of newly placed concrete, leading to premature cracking if constrained. For barriers, the plastic
shrinkage may be quite large. These cracks may exhibit some regular pattern (RILEM-42-CEA
1981).
Figure 2-7. The porous layer under the ribs and the rebar upon concrete placement
2.3.4 Material
Material properties are major parameters in predicting service life of bridge components. The
research on crack resistance of decks showed that high performance concrete has relatively better
CENTER FOR STRUCTURAL DURABILITY – Causes & Cures for Cracking of Concrete Barriers 25
performance than ordinary concrete designs regardless of workability, construction practice, or
cost (Alampalli and Owens 2000).
In addition to thermal loads, chemical effects, excessive loads, concrete cracking may be due to
shrinkage. In the literature, based on the crack formation time, two shrinkage phenomena are
described. These are drying shrinkage and autogenous or plastic shrinkage (Li et al. 1999).
Drying shrinkage occurs gradually during the first 30 days after placement (Alsayed 1998). The
drying shrinkage rate with time is controlled by the rate at which concrete loses moisture. In that
respect, curing influences shrinkage rate. The parameters controlling total shrinkage are the
amount, strength, and elasticity modulus of the coarse aggregate and the type and amount of
cementious materials. Plastic shrinkage of high strength concrete is more than normal strength
concrete with respect to cracking under hot and dry weather conditions (Samman et al. 1996 and
Wiegrink et al. 1996). High strength concrete also has higher strength than normal strength
concrete at early ages. An important parameter in shrinkage cracking of concrete is the cracking
strength. Cracking strength is lower than nominal tensile strength at early ages (Altoubat and
Lange 2001).
The time to cracking of concrete varies based on the mix properties. With decreasing water-to-
binder ratio, cracks occur sooner (Altoubat et al. 2001). Continuous restraint to shrinkage in
high strength concrete induces large creep stresses at early ages. A lower water-to-binder ratio
could be the cause of higher creep strains (Igarashi et al. 2000).
Cement composition, which governs the properties of cement paste, is one of the most important
factors influencing the durability of concrete. Although, a large portion of concrete volume is
filled with coarse aggregate, the cement paste is responsible for the overall performance of a
given concrete. Cement technology has undergone significant changes during the last two
decades. Today’s cement contains more C3S and less C2S as compared with the old cements,
which accelerates the strength gain. Ordinary Portland Cement (OPC) currently being used is
much finer in specific surface than the cements of two decades ago. Further, today’s cements are
different from old cements with respect to concrete mix water demand. They consume less
water, but produce a higher heat of hydration, due to their finer specific surface and higher C3S
content (Uzzafar 1992).

CENTER FOR STRUCTURAL DURABILITY – Causes & Cures for Cracking of Concrete Barriers 26
Microstructural changes occur in concretes exposed to severe environments. A broad range of
analytical techniques is used to document the deterioration in concrete microstructure. With
these analytical techniques deicing salt, freeze thaw effects, alkali silicate reaction (ASR), sulfate
attack, and other physical causes of concrete deterioration can be identified. Also, Petrographic
examinations can be used to determine the cause, depth, and extent of deterioration (Grattan-
Bellew 1996).
2.4 PRECAUTIONS
Most of the researchers refer to ACI-207.2R, “Effect of restraint, volume change and
reinforcement on cracking of mass concrete”. ACI-207.2R examines the effects of heat
generation and volume change on the design and behavior of reinforced concrete elements. It
particularly focuses on the effects of restrained cracking, placement temperatures, concrete
strength requirements, and fineness and type of cement. Likewise, ACI-224.R “Control of
cracking in concrete structures” investigates causes of cracking in order to develop appropriate
solutions for cracking problems.
2.4.1 Construction Technology
Construction procedure plays an important role in the durability of concrete and cracking of
concrete members. Regardless of selected construction procedure, multi-purpose approaches
could not be executed to solve problems with complex structures subjected to severe exposures
(Brozzetti 2000). As an example, in the construction of the Confederation Bridge, which is in a
severe marine environment, a 100-year service life was required. The quality concept was set to
a great extent to produce concrete that has the ability to protect embedded steel from corrosion.
Applied concrete technology, nondestructive material testing, high standards of quality control,
and cooperation of consultants and construction companies allowed the achievement of this
performance (Holley et al. 1999).
Available codes and standards, where strength requirements are the primary parameters for
acceptance, are not adequate for achieving durability of concrete especially under harsh
environmental conditions. The current system does not address the entire spectrum of concrete
performance parameters, defining strength, durability, constructibility, and appearance. Local

CENTER FOR STRUCTURAL DURABILITY – Causes & Cures for Cracking of Concrete Barriers 27
environments and material variations should also be considered to verify concrete performance
(Shilstone and Shilstone 2002).
2.4.1.1 Slipforming
A commonly used construction technique for barriers is slipforming. Slipform construction
requires specialized equipment, skill, and experience. The slipforming technique has some
advantages with regard to speed of construction and disadvantages with regard to workability
properties of the concrete mix. The limitations that are imposed on the mix proportions in the
slipforming technique impacts concrete workability. For proper implementation of slipforming,
special mixes with a well-defined cement content, workability, plasticizers, and optimum total
aggregate gradation are required (Neville 1999). During the placement, environmental
conditions are also important. Even if all precautions are taken, plastic shrinkage cracking
cannot be controlled under windy and dry weather conditions. Proper environmental protection
and curing procedures are needed for minimizing cracking potential of slipformed members;
curing compounds are suitable for that purpose (Fu 1998). A newly implemented slipforming
construction technique, which allows the application of curing compounds and membranes on
time, is a cost effective and efficient solution for complex structures. Concreting speed, sliding
operations, and curing should be reevaluated and enhanced with respect to concrete performance
(Anguelov 1995 and RILEM-42-CEA 1981).
2.4.1.2 Curing of Concrete
Curing has a direct influence on drying shrinkage of concrete members. Type of curing is a
factor that must be decided. RILEM-42-CEA (1991) recommends the use of an efficient
membrane cover to be immediately placed over the newly placed concrete to prevent early
evaporation in order to avoid shrinkage cracking. Early-age thermal cracking can be controlled
by reducing the thermal movements or temperature differences. Selection of an appropriate
curing process is the most important means of reducing the potential thermal movement by
keeping temperature differences within the concrete section to a minimum (RILEM-42-CEA
1991).

CENTER FOR STRUCTURAL DURABILITY – Causes & Cures for Cracking of Concrete Barriers 28
Sealing of plastic concrete with a curing compound that forms an impervious membrane could
reduce potential for drying shrinkage, but it will not eliminate autogenous shrinkage (Altoubat
and Lange 2001). Silane treatment of concrete members in the field results in a decrease in
drying shrinkage; this treatment can be considered in curing procedures (Xu and Chung 2000).
2.4.1.3 Quality Control
Quality of a finished construction project should be evaluated by a given structure’s functional,
physical, environmental, and economical utility (Abdun-Nur 1982). Establishment of a quality
system for construction is important; specifications, control charts, and education should support
the total quality of system. Variations in understanding of specifications and application
differences in the field should be minimized to ensure that the job is done properly.
Specifications must be clear and precise to avoid misunderstandings and to minimize effort in the
field (Abdun-Nur 1982). Violations in construction procedure should be anticipated, and a
designer’s review should be implemented. Hiding a questionable condition could be hazardous
for a structure and its serviceability. The potential problem points are important to review and
should be recorded for further evaluation. For instance, the nuclear concrete industry has many
reference documents for use in further evaluation of results (Mayer 1982). The size of the
project should not influence the engineering effort and judgement. Obviously, small structures
and nonstructural concrete members command less attention than other, more complex
applications. The same attention should be paid to all structural elements in terms of
construction and curing practices, regardless of size and importance (Jaycox 1982).
2.4.2 Materials
2.4.2.1 Cement
ACI 224-R (1990) states that cement properties have a direct effect on concrete shrinkage.
Higher shrinkage of cement does not mean higher concrete shrinkage (Neville 1995). Finer
cements generally cause increased shrinkage in concrete, but the increase in fineness is not
proportional to shrinkage (ACI 224 1990). An advantage of coarse cement particles is that they
give relatively less shrinkage as compared to finer cements; on the other hand, coarser cement

CENTER FOR STRUCTURAL DURABILITY – Causes & Cures for Cracking of Concrete Barriers 29
requires a longer curing period to avoid development of low strength, larger pores, and high
porosity (Bentz et al. 1999).
Cement has less shrinkage if it has lower C3A/SO3 ratios, lower alkalinity, and higher C4AF
contents. The choice of cement type is another means of reducing shrinkage. Type II cement
has a tendency to less shrinkage when compared with Type I cement (ACI 224 1990).
Industrial by-products such as fly ash, silica fume, and ground granulated blast-furnace slag
(GGBS) are mixed with Portland cement in different proportions to develop desirable concrete
properties, sometimes in plastic state, but more often in the hardened state. Neville (1995) states
that addition of minerals such as fly ash, GGBS, or silica fume can increase concrete shrinkage.
Specifically, a higher proportion of a mineral admixture in blended cements leads to higher
shrinkage.
The most common cement replacement is by the use of fly ash. The use of fly ash (especially
Class F) in concrete has many different advantages such as an increase in long-term strength and
reduction in permeability. Fly ash reduces the peak concrete temperature due to heat of cement
hydration. Addition of fly ash reduces water demand for constant workability. High carbon
content of fly ash affects the workability. Porous carbon particles absorb certain types of air-
entraining agents, thus reducing its effectiveness. The initial setting of concrete is delayed due to
the retarding effect of fly ash, thus requires longer curing period. The effects of inadequate
curing on the water absorption properties are more profound than the effect on the strength of
concrete containing fly ash.
Silica fume is used in small amounts (3 – 6 %) as an ordinary Portland cement substitute. Use of
silica fume in concrete mix causes high early-strength and low permeability but high heat of
hydration. Also causes problems in developing an acceptable air-void system. Curing is very
important when silica fume is used. Silica fume reduces bleeding of mix water which can lead to
plastic shrinkage under drying conditions unless preventive measures are taken (Neville 1995).
The hydration reaction of silica fume has a heat sensitivity that is different from cement
hydration (Jensen and Hansen 1999). Silica fume substitution often results in better performance
with reduced permeability in severe environments (Sabir 1997).
CENTER FOR STRUCTURAL DURABILITY – Causes & Cures for Cracking of Concrete Barriers 30
GGBS is another substitute for ordinary Portland cement. GGBS reduces bleeding of mix water
from concrete and retards the hydration process reducing the heat of hydration of cement. GGBS
leads to better strength development at the later ages (due to very slow initial hydration).
Concrete containing GGBS shows improved durability performance due to reduced water
permeability. Since GGBS reduces bleeding of mix water, precautions are needed to prevent
plastic shrinkage under drying conditions. In concrete placement at temperatures below 50oF the
strength development is poor and the use of GGBS is undesirable (Neville 1995).
Pozzolans can also be used in the formulation of blended cement. They are added to the cement
during production. This type of blended cement production is common in Europe and Asia. A
number of disadvantages of ordinary Portland cement can be overcome by using additional
pozzolans such as fly ash, GGBS, and silica fume. Blended cements give users a chance to
enhance cement performance when considering the severe environments to which concrete will
be subjected (Malhotra and Hemmings 1995 and Nehdi 2001). Swamy (1989) states that the use
of appropriate blended cement and high range water reducer is one of the options for design of
durable concrete in severe environments.
2.4.2.2 Concrete
A study on the key parameters controlling concrete shrinkage and the effect of shrinkage on
performance based on the distress evaluations of field specimens illustrated that the size of the
concrete member significantly affects shrinkage (Bissonnette et al. 1999). Shrinkage decreases
with relative humidity in the range of 48–100%. Cement paste volume has a direct effect on
amount of shrinkage. Shrinkage compensating concrete mixes are preferred (Altoubat and
Lange 2001).
Performance of high strength concrete under different exposure and environmental conditions
was examined by the Florida Department of Transportation (Edwards 2000). The severity of
exposure is the main criterion in selecting the type of concrete mix design. In moderate and
aggressive exposure classes, the use of pozzolans (fly ash, GGBS, and silica fume) in high
strength concretes with Type II cement is recommended to reduce chloride ingress.
Additionally, construction practices should be tuned to the required construction quality. It is

CENTER FOR STRUCTURAL DURABILITY – Causes & Cures for Cracking of Concrete Barriers 31
necessary to test all-purpose mixes and the test results have to be interpreted in the light of the
exposure conditions (Neville 1995)
2.4.2.3 Water / Cement Ratio
ACI 224 (1990) states that one of the major factors affecting concrete performance is the water
content of the mix design. The U.S. Bureau of Reclamation test results showed that any increase
in the water content results in an increase in shrinkage. Reduction in concrete shrinkage is made
possible by keeping the water content to a minimum and the total aggregate content as high as
possible. On the other hand, some recent research findings show that lowering the water content
can increase concrete shrinkage (Igarashi et al. 2000, Samman et al. 1996, and Wiegrink et al.
1996). There is a need to better understand the role of water in concrete shrinkage. The
optimum water/cement ratio range for shrinkage minimization is between 0.35 and 0.50
(Bissonnette et al. 1999).
2.4.2.4 Admixtures
Gillot and Gillot (1996) studied the durability performance of ground granulated blast-furnace
slag cement concrete with respect to freeze-thaw resistance, microstructure, and curing
conditions. It could be that the durability of both ordinary cement and ground granulated blast-
furnace slag cement is due to air entrainment in mix design. In selecting the admixture(s) for
concrete compatibility to construction practices and serviceability of the structure should be
considered. Retarding agents and plasticizing admixtures can be used for addressing
compatibility concerns to construction practice, but further research may be needed with regard
to durability concerns (Ronneberg 1989). Clearly, retarders delay the hydration process
subsequently the strength gain in concrete. If moisture evaporation from concrete is not
prevented during the hydration process, very early-age cracks will form.
Concrete mix production process and concrete properties are important considerations when
selecting the type of air entrainment. Concrete properties can be controlled by the amount of air
entrainment agent, but the amount of active air entrainment agent and its reaction with the water
reducing agent is important. Another important factor in achieving a specified air entrainment
amount is the cement content and its physical and chemical composition. Lower cement content

CENTER FOR STRUCTURAL DURABILITY – Causes & Cures for Cracking of Concrete Barriers 32
and/or a coarser grind of cement results in better air entrainment. The concrete production
process could change the amount and stability of air entrainment. An increased amount of air
entrainment will reduce the required fine aggregate content needed to maintain the same
workability. Mixing time, mixing and transportation period, and placement are other major
factors that should be considered when using air entrainment agents (Rixom and Mailvaganam
1999).
High range water reducers, under hot and dry field and laboratory conditions, increase the long
term and early-age shrinkage (Alsayed, 1998). Concrete curing has an important role in concrete
shrinkage rate. Delaying shrinkage reduces cracking by allowing concrete to gain a higher
tensile strength.
2.5 CONCLUSIONS
The primary distress types identified on bridge barriers are vertical cracking (termed as
transverse cracking), map cracking, horizontal cracking, popouts, spalling or disintegration,
efflorescence, corrosion, and delamination. Vertical cracking that is observed at early ages is
often the predominant type of distress in a given barrier segment. Map cracking is also a
common defect observed on barrier surfaces. Map cracking on barriers may be related to early
thermal shrinkage cracking due to hydration of cement. Other distresses are the signs of
progression of distress initiated by vertical cracking.
Fully base-restrained unreinforced concrete walls ultimately attain full-length vertical cracks
spaced at one to two times the height of the wall. Upon concrete placement, due to the effect of
water rising to the top and sedimentation under reinforcing bars, a porous layer of concrete can
form under the reinforcement and its ribs. Additionally, consolidation of plastic concrete causes
relative downward movements (settlement) of the concrete around the top reinforcement. This
process forms a conduit under the top horizontal reinforcement. Water and other contaminants
penetrate through the vertical cracks and propagate in the conduits formed below the top
reinforcement, initiating corrosion along the full length of reinforcement. Recent research
revealed that epoxy coating debonds with moisture and reinforcement is still susceptible to
corrosion. Corrosion of reinforcement generates internal outward pressure in concrete and leads
to further cracking. Corrosion does not remain limited to the initiation zone and propagates,

CENTER FOR STRUCTURAL DURABILITY – Causes & Cures for Cracking of Concrete Barriers 33
especially in cyclic wetting-drying areas of structures. Upon cracking, further corrosion also
causes spalling of concrete cover. Spalling and disintegration are characteristics of the final
stages of distress in concrete structures that requires immediate action for repair and
rehabilitation.
Major causes of early-age cracking are identified as shrinkage, thermal loads, and base restraint
of the concrete barrier. Volume change in concrete is mainly due to autogenous shrinkage,
drying shrinkage, and thermal loads. Cracking due to volume change is a result of the combined
effects of volume change strains and restraint. When strain due to volume change of a concrete
component exceeds the concrete strain capacity accompanied by sufficient stress due to restraint
effects, concrete cracks.
A major factor that reduces the service life of a concrete structure is construction quality.
Shallow concrete covers, misplaced reinforcement, substandard curing, and other construction
errors may be seen in many projects. The impact of construction errors on service life is a
function of exposure conditions. The environment has a significant influence on the properties
of fresh and hardened concrete. Ambient temperature, relative humidity, and wind velocity can
change the properties of concrete. The amount of water required for the hydration process needs
to be available if the concrete is to achieve a fully acceptable quality. The effects of substandard
curing are only observed with increasing age of concrete. Use of an impervious membrane cover
over the newly placed concrete is required to prevent early evaporation and therefore avoid
shrinkage cracking. Early-age thermal cracking can be controlled by reducing the thermal
movements or temperature differences. Selection of an appropriate curing process is the most
important means of reducing the potential thermal movement by keeping temperature differences
within the concrete section to a minimum. Silane treatment of concrete members in the field
results in a decrease in drying shrinkage; this treatment should be considered in curing practices.
When construction procedures are considered, early form removal without further curing affect
concrete durability performance. Substandard curing such as late or uneven application of curing
compound exposes the slipformed barrier concrete to the ambient environment immediately.
Without moist curing, early overloading by thermal and shrinkage loads combined with restraint
effects can cause permanent damage by forming cracks. In addition to shrinkage and thermal
CENTER FOR STRUCTURAL DURABILITY – Causes & Cures for Cracking of Concrete Barriers 34
cracking, bleeding of mix water causes consolidation of newly placed concrete during the first
two or three hours, leading to premature cracking around the top horizontal reinforcement due to
the restrain provided by the reinforcement.
The parameters controlling shrinkage are the strength and elasticity modulus of coarse aggregate
and type and content of cementitous material. For a given aggregate and cement, cement
composition determines concrete properties such as strength, durability, and stability. The
aggregate acts as a passive filler material, if unreactive, while the cement paste is responsible for
the good and bad properties of a given concrete.
Lower cement content and coarser cement result in better air entrainment. Mixing time, mixing
and transportation period, and placement are the other major factors that should be considered
when using air entrainment agents. Cement properties have a direct effect on concrete shrinkage
and heat of hydration. Finer cements generally increase shrinkage and generate higher heat of
hydration in concrete than coarser cements. Coarser cements require a longer curing period to
avoid development of larger pores and high porosity.
Ground granulated blast-furnace slag substitution in an amount approximately equal to 50-55%
of cement weight could significantly reduce the heat of hydration. Blended cements give users a
chance to enhance cement performance considering the severe environments to which concrete
will be subjected. The optimum water/cement ratio range for minimizing shrinkage is between
0.35 and 0.50.
The quality concept is the key to improve the concrete performance that has the ability to protect
embedded steel from corrosion. Applied concrete technology, nondestructive material testing for
quality control and quality assurance, and cooperation of consultants and construction companies
is necessary for achievement of required performance. Specifications must be clear and precise
to avoid misunderstandings. Potential violations in construction procedures should be
anticipated. The same attention should be paid to all structural components in terms of
construction, quality, and curing practices, regardless of size and perceived importance.

CENTER FOR STRUCTURAL DURABILITY – Causes & Cures for Cracking of Concrete Barriers 35
3 MULTI-STATE SURVEY
3.1 OVERVIEW
The Project Team (PT) and MDOT Research Advisory Panel (RAP) members designed and
administered a nation wide survey for documenting the experience of the State Highway
Agencies (SHAs) with the problem of cracking of concrete bridge barriers. The survey was sent
to SHAs and the District of Columbia in September, 2002. Twenty-six SHAs responded to the
survey, giving a response rate of 50 percent. The survey was administered by email, requesting a
web submission. There was more than one response from some of the SHAs. The responses
were received through email, fax and postal mail. The list of respondents is shown in Table 3-1.
The geographic locations of SHAs are shown in the U.S. map in Figure 3-1. The final survey is
included in Appendix A.
Table 3-1. List of Respondent States and Media of Responses
Media of Responses Respondent States
Web Submission
Connecticut, District of Columbia, Florida, Hawaii, Idaho,
Indiana, Maryland, Massachusetts, Michigan, Minnesota,
Missouri, Montana, Nebraska, North Dakota, New Hampshire,
New Mexico, Nevada, New York, Tennessee, Texas, Vermont,
Virginia, Washington
Fax Alabama, Illinois
Postal Mail New Jersey
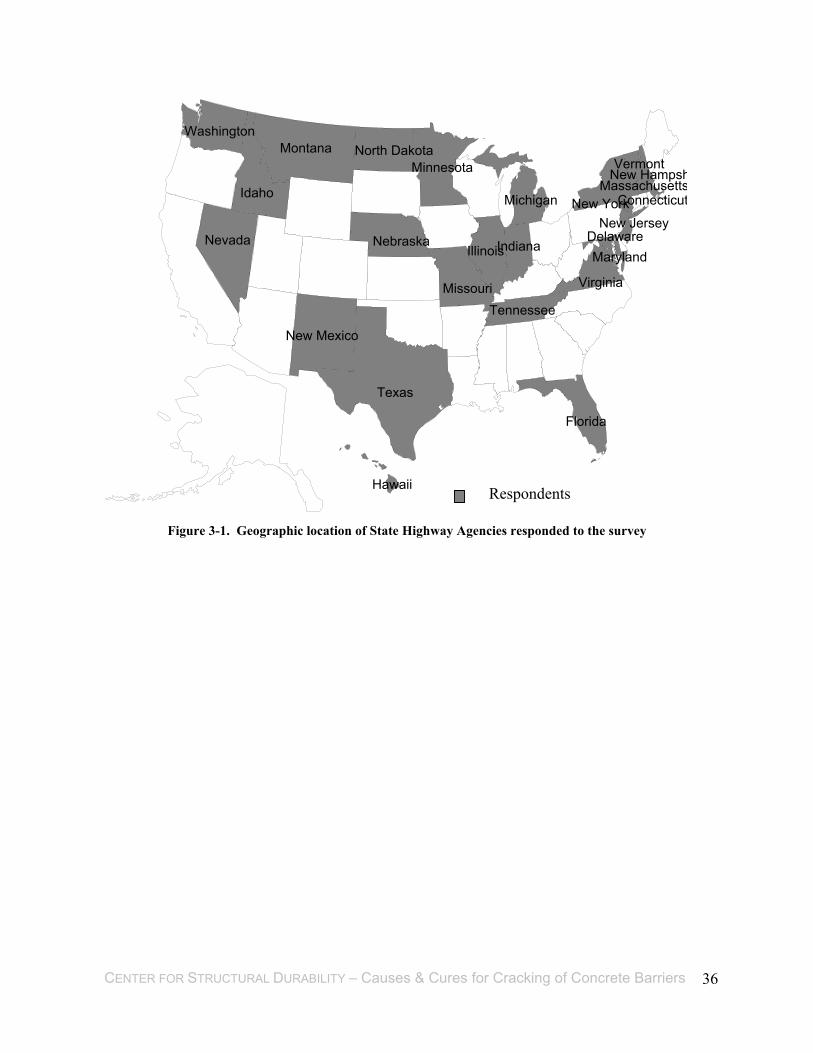
CENTER FOR STRUCTURAL DURABILITY – Causes & Cures for Cracking of Concrete Barriers 36
Delaware
Connecticut
WashingtonMontana
Idaho
Nevada
New Mexico
Texas
Hawaii
Missouri
IllinoisNebraska
North DakotaMinnesota
Michigan
Indiana
Tennessee
Florida
Virginia
Maryland
VermontMassachusetts
New York
New Hampsh
New Jersey
Figure 3-1. Geographic location of State Highway Agencies responded to the survey
Respondents

CENTER FOR STRUCTURAL DURABILITY – Causes & Cures for Cracking of Concrete Barriers 37
3.2 ANALYSIS OF SURVEY DATA
The survey data was compiled and analyzed. The number of responses obtained from some
SHAs is more than one. Some of the responses to the same question on the survey questionnaire
vary by respondent within the particular SHA. For that reason, the count of responses represents
the number of respondents rather than the number of SHAs. Summaries of the responses are
presented in the following figures. The codes used to represent the responses are given in Table
3-2
Table 3-2. Codes used for Presentation of Survey Responses
Codes Used Meaning of the Codes 1 Yes DN Don’t know NR No response None Don't have, did not observe
The first question of the survey questionnaire asked the frequencies (high, medium, low) of
various distresses (map cracking, horizontal cracking near joints, etc.,). The respondents
identified the frequency of the distresses and those are summarized in the following figures
(Figure 3-2 through Figure 3-11).
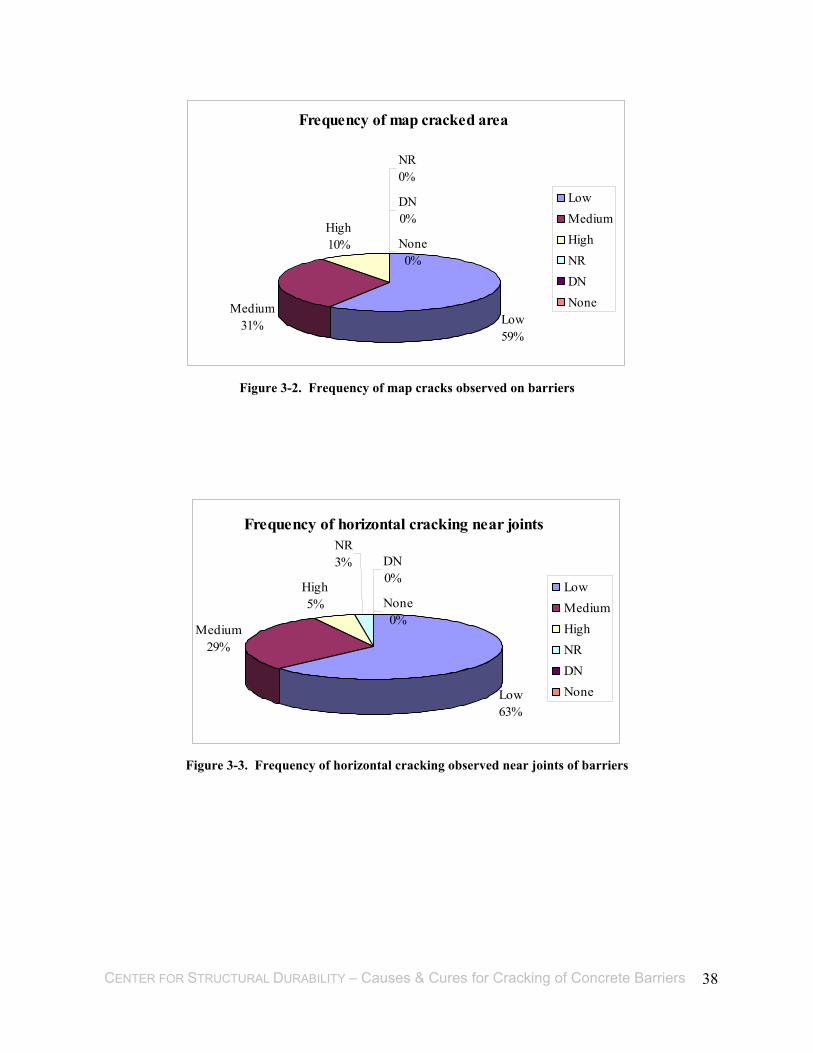
CENTER FOR STRUCTURAL DURABILITY – Causes & Cures for Cracking of Concrete Barriers 38
Frequency of map cracked area
Low59%
Medium31%
High10%
NR0%
DN0%
None0%
LowMediumHighNRDNNone
Figure 3-2. Frequency of map cracks observed on barriers
Frequency of horizontal cracking near joints
Low63%
Medium29%
High5%
NR3% DN
0%
None0%
LowMediumHighNRDNNone
Figure 3-3. Frequency of horizontal cracking observed near joints of barriers
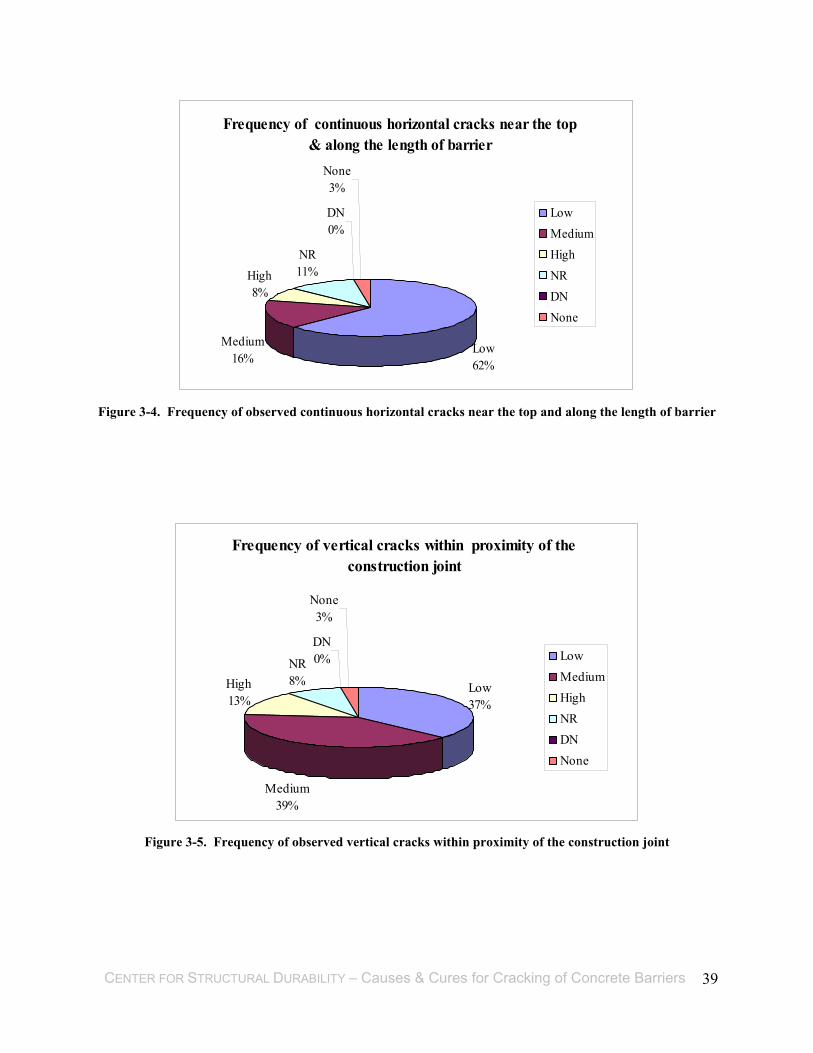
CENTER FOR STRUCTURAL DURABILITY – Causes & Cures for Cracking of Concrete Barriers 39
Frequency of continuous horizontal cracks near the top & along the length of barrier
Low62%
Medium16%
High8%
NR11%
DN0%
None3%
LowMediumHighNRDNNone
Figure 3-4. Frequency of observed continuous horizontal cracks near the top and along the length of barrier
Frequency of vertical cracks within proximity of the construction joint
Low37%
Medium39%
High13%
DN0%
None3%
NR8%
LowMediumHighNRDNNone
Figure 3-5. Frequency of observed vertical cracks within proximity of the construction joint

CENTER FOR STRUCTURAL DURABILITY – Causes & Cures for Cracking of Concrete Barriers 40
Frequency of multiple vertical cracks between joints
Low34%
Medium24%
High34%
NR8%
DN0%
None0%
LowMediumHighNRDNNone
Figure 3-6. Frequency of observed multiple vertical cracks between barrier joints
Frequency of multiple vertical cracks near the barrier toe
Low45%
Medium39%
High8%
NR8%
DN0%
None0%
LowMediumHighNRDNNone
Figure 3-7. Frequency of observed multiple vertical cracks near the barrier toe

CENTER FOR STRUCTURAL DURABILITY – Causes & Cures for Cracking of Concrete Barriers 41
Frequency of section loss at or near the top of the barrier
Low69%
Medium8%
High5%
NR15%
DN0%
None3%
LowMediumHighNRDNNone
Figure 3-8. Frequency of section loss observed at or near the top of the barrier
Frequency of local popouts
Low71%
Medium13%
High0%
NR13%
DN0%
None3%
LowMediumHighNRDNNone
Figure 3-9. Frequency of local pop outs observed

CENTER FOR STRUCTURAL DURABILITY – Causes & Cures for Cracking of Concrete Barriers 42
Frequency of sign of corrosion due to lack of concrete cover
Low60%
Medium23%
High3%
NR11%
DN0%
None3%
LowMediumHighNRDNNone
Figure 3-10. Frequency of sign of corrosion observed on bridge barriers

CENTER FOR STRUCTURAL DURABILITY – Causes & Cures for Cracking of Concrete Barriers 43
From the responses, the order of prevailing distresses observed on bridge barriers is:
1. Map cracks
2. Horizontal cracking near joints
3. Multiple vertical cracks between joints
4. Multiple vertical cracks near the barrier toe
5. Vertical cracks within the proximity of the construction joints
6. Continuous horizontal cracks near the top and along the length of barrier
7. Signs of corrosion due to lack of concrete cover
8. Local pop out
9. Section loss at or near the top of the barrier
0102030405060708090
100
Res
pons
e (%
)
1 2 3 4 5 6 7 8 9
Type of distress
Frequency of type of premature distress observed
HighMediumLow
Figure 3-11. Frequency of type of premature distress observed on bridge barriers

CENTER FOR STRUCTURAL DURABILITY – Causes & Cures for Cracking of Concrete Barriers 44
A total of 23 (73%) out of 26 SHAs indicated that they do not have an overall durability problem
with New Jersey Type 4 bridge barriers. Three SHAs (24%) indicated durability concerns
(Figure 3-12)
Do you observe an overall durability problem with the NJ type concrete bridge barriers?
Yes24%
No73%
DN0%
None0%
NR3%
YesNoNRDNNone
Figure 3-12. Frequency of observed overall durability problems with NJ type barriers
Form-cast and slipformed are the two predominant barrier construction procedures. A few SHAs
also use precast barriers. The percentage of usage of different construction procedures among
the respondents is shown in Figure 3-13.

CENTER FOR STRUCTURAL DURABILITY – Causes & Cures for Cracking of Concrete Barriers 45
05
1015202530354045
Res
pons
e (%
)
Form-cast Slipform Other NR DNConstruction procedures
What construction procedures are being used for casting NJ type barriers?
Figure 3-13. Most popular construction procedures used for casting New Jersey Type 4 barriers
The most frequently specified curing procedure for bridge barriers are (Figure 3-14).
1. Burlap
2. Membrane curing
3. Continuous wet curing
4. Other (curing by wet burlene sheets, blankets).

CENTER FOR STRUCTURAL DURABILITY – Causes & Cures for Cracking of Concrete Barriers 46
0
10
20
30
40
50
60R
espo
nse
(%)
1 2 3 4 DN
Type of curing
What curing procedures are being used/specified for barriers?
Figure 3-14. Curing procedures used /specified for barriers
Most of respondents (82%) have been using epoxy-coated reinforcements for the barriers (Figure
3-15).
Is your Agency specifying epoxy coated reinforcement for the barriers?
Yes82%
No18%
NR0%
DN0% Yes
NoNRDN
Figure 3-15. Frequency of using epoxy coated reinforcements for the barriers
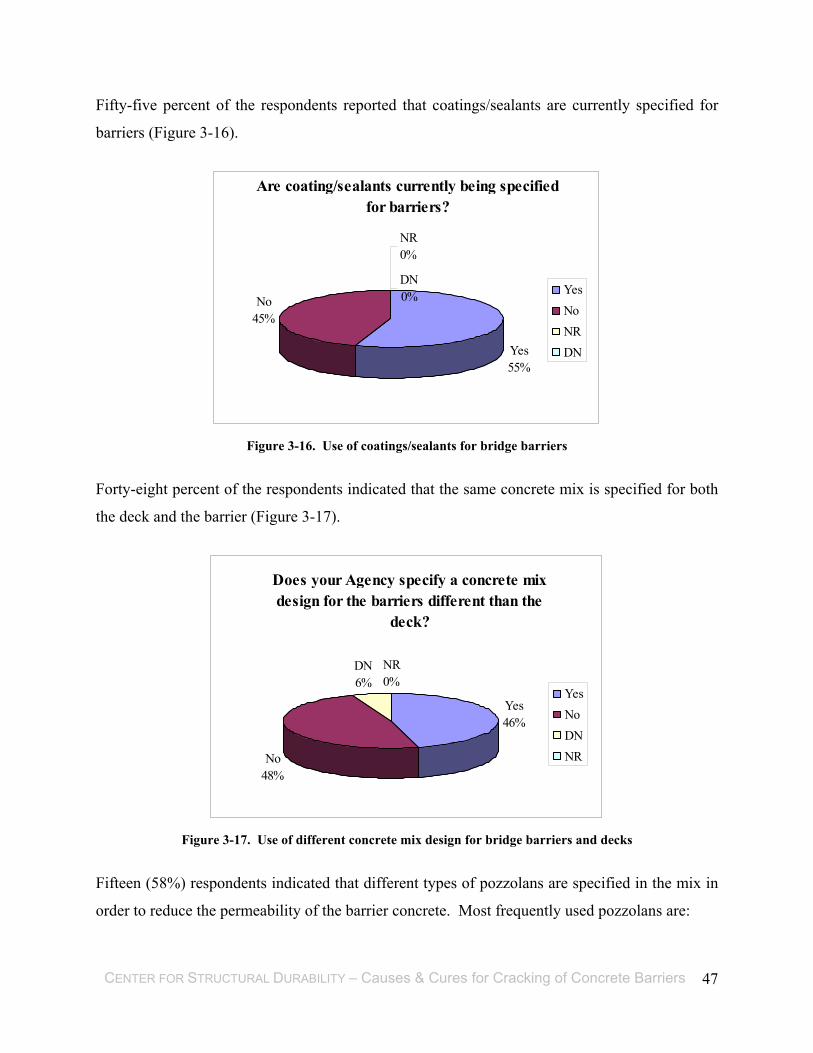
CENTER FOR STRUCTURAL DURABILITY – Causes & Cures for Cracking of Concrete Barriers 47
Fifty-five percent of the respondents reported that coatings/sealants are currently specified for
barriers (Figure 3-16).
Are coating/sealants currently being specified for barriers?
Yes55%
No45%
NR0%
DN0% Yes
NoNRDN
Figure 3-16. Use of coatings/sealants for bridge barriers
Forty-eight percent of the respondents indicated that the same concrete mix is specified for both
the deck and the barrier (Figure 3-17).
Does your Agency specify a concrete mix design for the barriers different than the
deck?
Yes46%
No48%
DN6%
NR0%
YesNoDNNR
Figure 3-17. Use of different concrete mix design for bridge barriers and decks
Fifteen (58%) respondents indicated that different types of pozzolans are specified in the mix in
order to reduce the permeability of the barrier concrete. Most frequently used pozzolans are:
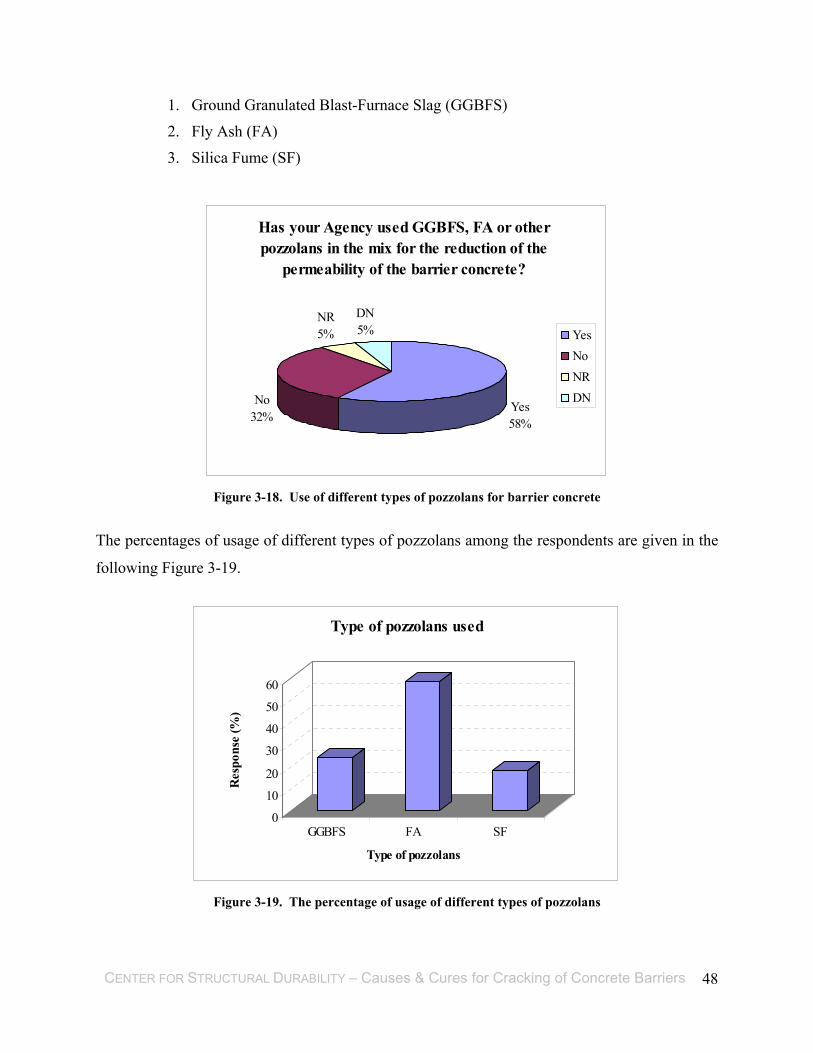
CENTER FOR STRUCTURAL DURABILITY – Causes & Cures for Cracking of Concrete Barriers 48
1. Ground Granulated Blast-Furnace Slag (GGBFS)
2. Fly Ash (FA)
3. Silica Fume (SF)
Has your Agency used GGBFS, FA or other pozzolans in the mix for the reduction of the
permeability of the barrier concrete?
Yes58%
No32%
NR5%
DN5% Yes
NoNRDN
Figure 3-18. Use of different types of pozzolans for barrier concrete
The percentages of usage of different types of pozzolans among the respondents are given in the
following Figure 3-19.
0
10
20
30
40
50
60
Res
pons
e (%
)
GGBFS FA SF
Type of pozzolans
Type of pozzolans used
Figure 3-19. The percentage of usage of different types of pozzolans

CENTER FOR STRUCTURAL DURABILITY – Causes & Cures for Cracking of Concrete Barriers 49
The most frequently specified methods for barrier concrete surface finishing are:
1. Rubbed
2. Sacked
Other methods stated by the respondents are light brush or broom finishing, grind fins, sprayed
coatings, and formed finishing (Figure 3-20).
What is the surface finish method that is used for barrier concrete?
Sacked19%
Rubbed45%
Other36%
DN0%
NR0%
SackedRubbedOtherDNNR
Figure 3-20. Surface finish methods used for barrier concrete
The most identifiable feature is that 64% of respondents did not reply to the question regarding
the performance of barriers on rural roads versus trunk line/interstate routes. Twenty-six percent
of the respondents indicated that performance differences are observed between barriers on rural
roads and interstate routes (Figure 3-21).

CENTER FOR STRUCTURAL DURABILITY – Causes & Cures for Cracking of Concrete Barriers 50
Do you observe differences in performance between barriers on rural roads vs
trunkline/interstate routes?
Yes26%
No5%
NR64%
DN5% Yes
NoNRDN
Figure 3-21. Performance differences of barriers on rural roads and trunk line/interstate routes
Many of the SHAs (85%) apply deicers to the bridge deck. Exceptions are Florida, Hawaii, New
Jersey, and Nevada. Commonly used deicers are:
1. Different types of salt
2. CMA (Calcium Magnesium Acetate)
3. Others (Urea, heavy salt brine, etc)
Does your Agency apply deicers to the bridge decks?
Yes85%
No15%
NR0%
None0%
YesNoNRNone
Figure 3-22. Application of deicers to the bridge decks
The percentage of usage of different deicers among the respondents is shown in Figure 3-23.

CENTER FOR STRUCTURAL DURABILITY – Causes & Cures for Cracking of Concrete Barriers 51
0
10
20
30
40
50
60
70
Res
pons
e (%
)
CMA Salt Other
Type of deicers
Type of deicers used
Figure 3-23. The percentage of usage of different deicers
Actions taken by the State Highway Agencies in order to improve the barrier durability were
reported as:
1. Changes to mix design
2. Changes to curing procedure
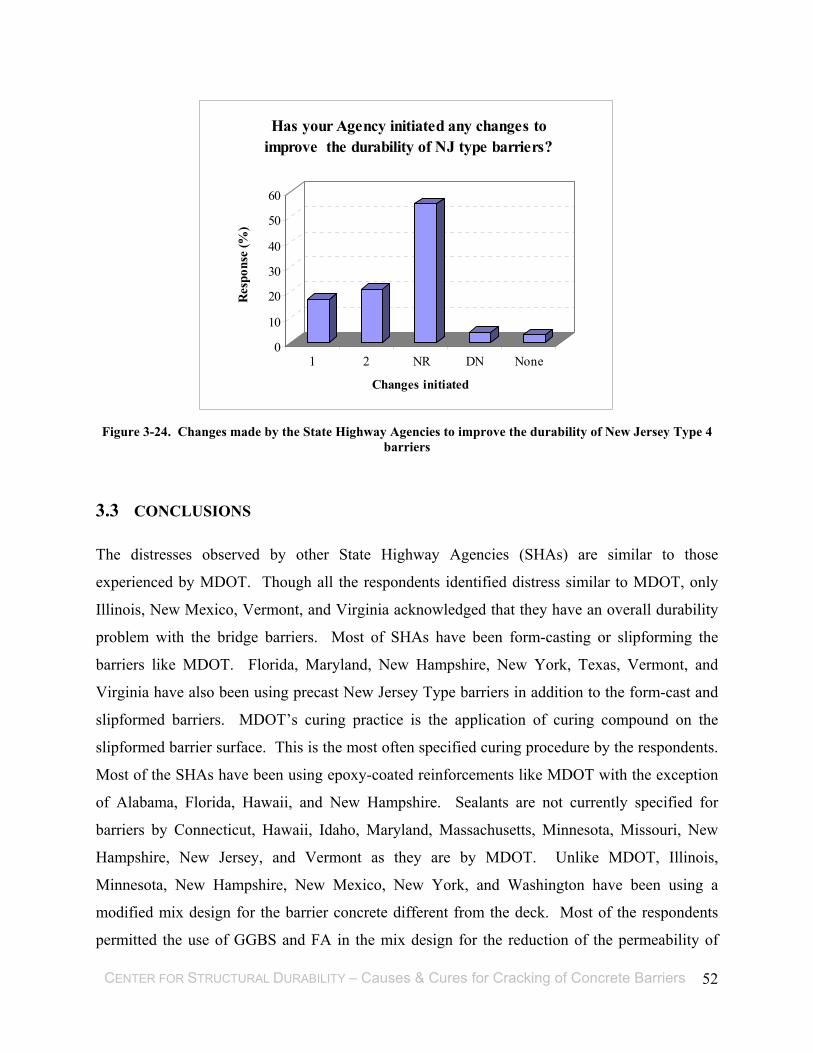
CENTER FOR STRUCTURAL DURABILITY – Causes & Cures for Cracking of Concrete Barriers 52
0
10
20
30
40
50
60
Res
pons
e (%
)
1 2 NR DN None
Changes initiated
Has your Agency initiated any changes to improve the durability of NJ type barriers?
Figure 3-24. Changes made by the State Highway Agencies to improve the durability of New Jersey Type 4
barriers
3.3 CONCLUSIONS
The distresses observed by other State Highway Agencies (SHAs) are similar to those
experienced by MDOT. Though all the respondents identified distress similar to MDOT, only
Illinois, New Mexico, Vermont, and Virginia acknowledged that they have an overall durability
problem with the bridge barriers. Most of SHAs have been form-casting or slipforming the
barriers like MDOT. Florida, Maryland, New Hampshire, New York, Texas, Vermont, and
Virginia have also been using precast New Jersey Type barriers in addition to the form-cast and
slipformed barriers. MDOT’s curing practice is the application of curing compound on the
slipformed barrier surface. This is the most often specified curing procedure by the respondents.
Most of the SHAs have been using epoxy-coated reinforcements like MDOT with the exception
of Alabama, Florida, Hawaii, and New Hampshire. Sealants are not currently specified for
barriers by Connecticut, Hawaii, Idaho, Maryland, Massachusetts, Minnesota, Missouri, New
Hampshire, New Jersey, and Vermont as they are by MDOT. Unlike MDOT, Illinois,
Minnesota, New Hampshire, New Mexico, New York, and Washington have been using a
modified mix design for the barrier concrete different from the deck. Most of the respondents
permitted the use of GGBS and FA in the mix design for the reduction of the permeability of

CENTER FOR STRUCTURAL DURABILITY – Causes & Cures for Cracking of Concrete Barriers 53
concrete. Massachusetts, New York, and Virginia have been also using SF along with GGBS
and FA. MDOT specifies the rubbed surface finish for barrier concrete. This is the common
practice of surface finishing among the respondents excluding Alabama, Idaho, Nevada, North
Dakota, Virginia, and Washington. Most of the respondents emphasized modifying the mix
design and curing procedure for improving the durability of barriers.
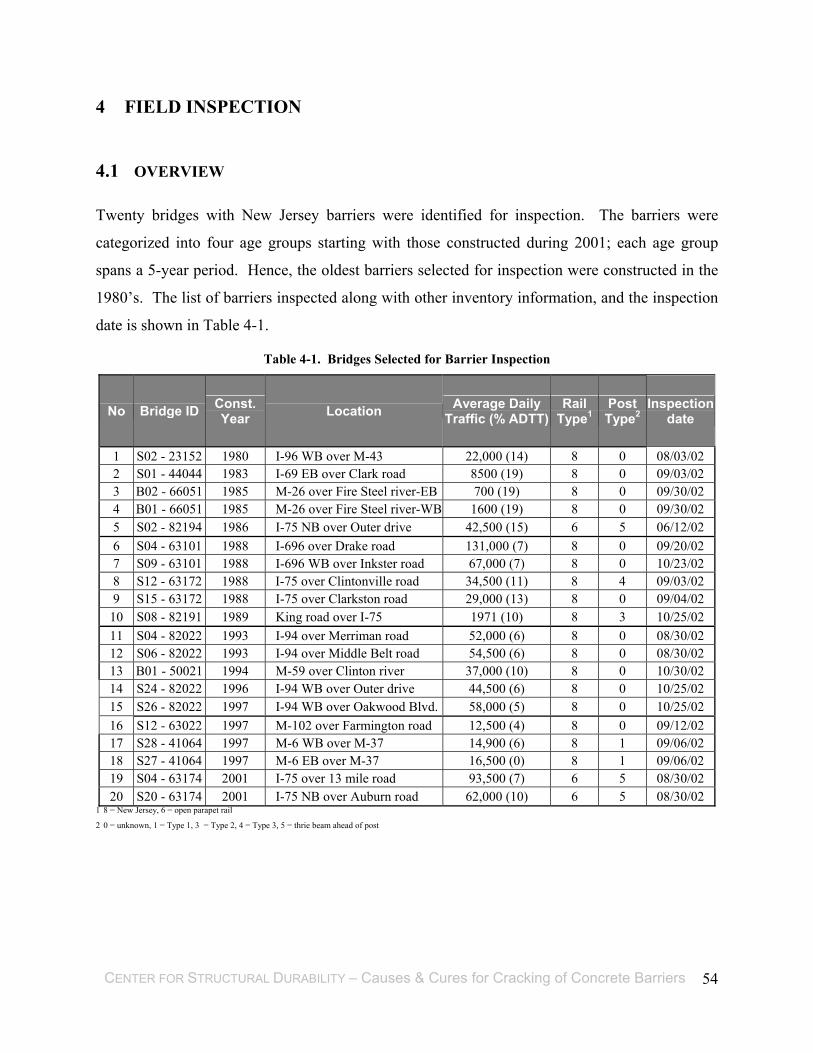
CENTER FOR STRUCTURAL DURABILITY – Causes & Cures for Cracking of Concrete Barriers 54
4 FIELD INSPECTION
4.1 OVERVIEW
Twenty bridges with New Jersey barriers were identified for inspection. The barriers were
categorized into four age groups starting with those constructed during 2001; each age group
spans a 5-year period. Hence, the oldest barriers selected for inspection were constructed in the
1980’s. The list of barriers inspected along with other inventory information, and the inspection
date is shown in Table 4-1.
Table 4-1. Bridges Selected for Barrier Inspection
No Bridge ID Const. Year Location Average Daily
Traffic (% ADTT)Rail
Type1 Post Type2
Inspection date
1 S02 - 23152 1980 I-96 WB over M-43 22,000 (14) 8 0 08/03/02 2 S01 - 44044 1983 I-69 EB over Clark road 8500 (19) 8 0 09/03/02 3 B02 - 66051 1985 M-26 over Fire Steel river-EB 700 (19) 8 0 09/30/02 4 B01 - 66051 1985 M-26 over Fire Steel river-WB 1600 (19) 8 0 09/30/02 5 S02 - 82194 1986 I-75 NB over Outer drive 42,500 (15) 6 5 06/12/02 6 S04 - 63101 1988 I-696 over Drake road 131,000 (7) 8 0 09/20/02 7 S09 - 63101 1988 I-696 WB over Inkster road 67,000 (7) 8 0 10/23/02 8 S12 - 63172 1988 I-75 over Clintonville road 34,500 (11) 8 4 09/03/02 9 S15 - 63172 1988 I-75 over Clarkston road 29,000 (13) 8 0 09/04/02
10 S08 - 82191 1989 King road over I-75 1971 (10) 8 3 10/25/02 11 S04 - 82022 1993 I-94 over Merriman road 52,000 (6) 8 0 08/30/02 12 S06 - 82022 1993 I-94 over Middle Belt road 54,500 (6) 8 0 08/30/02 13 B01 - 50021 1994 M-59 over Clinton river 37,000 (10) 8 0 10/30/02 14 S24 - 82022 1996 I-94 WB over Outer drive 44,500 (6) 8 0 10/25/02 15 S26 - 82022 1997 I-94 WB over Oakwood Blvd. 58,000 (5) 8 0 10/25/02 16 S12 - 63022 1997 M-102 over Farmington road 12,500 (4) 8 0 09/12/02 17 S28 - 41064 1997 M-6 WB over M-37 14,900 (6) 8 1 09/06/02 18 S27 - 41064 1997 M-6 EB over M-37 16,500 (0) 8 1 09/06/02 19 S04 - 63174 2001 I-75 over 13 mile road 93,500 (7) 6 5 08/30/02 20 S20 - 63174 2001 I-75 NB over Auburn road 62,000 (10) 6 5 08/30/02
1 8 = New Jersey, 6 = open parapet rail
2 0 = unknown, 1 = Type 1, 3 = Type 2, 4 = Type 3, 5 = thrie beam ahead of post

CENTER FOR STRUCTURAL DURABILITY – Causes & Cures for Cracking of Concrete Barriers 55
4.2 DISTRESS DOCUMENTATION
Bridge barriers were selected using “Pontis” based on inspectability, sampling ability without
lane closure, and barrier age. As a general concept, the geographical distribution of bridges was
kept as uniform as possible. Pontis data was not fully accurate and final inspection decisions
could only be made after a preliminary site visit. The final list of barriers inspected includes two
bridges from the Superior Region, two from the Grand Region, one from the Bay Region, one
from the University Region, and the remaining from the Metro Region.
The barrier segment lengths varied between bridges. Barrier segments were divided into quarters
for inspection purposes and observations were recorded on the respective inspection templates.
Some segments that were very long were also inspected and recorded in quarters. The inspection
sheets were prepared for each quarter as if each were a separate segment. Inspectors reviewed
the work of one another upon completing the inspection of their assigned segment quarters. Use
of this approach ensured the consistency and the accuracy of the inspection sheet.
All visible defects on the barrier segments were recorded. However, the predominant distresses
were vertical cracking, horizontal cracking, map cracking, popout, scaling, delamination,
spalling, and disintegration. Other observations such as patches, replacements, and repairs were
noted.
4.3 COLLECTION OF SPECIMENS
Cores were collected from eight out of twenty inspected bridges in order to investigate the
material related distress as well as to establish the concrete properties. The purpose was to
document the barrier distress type, state, and extent. An average of 12 core specimens were
obtained from each barrier. Half of these core specimens were obtained from distress-free parts
of the barriers and the other half was obtained from areas close to the visible distress zones.
4.4 FIELD INSPECTION DATA COLLECTION
The bridges contained a varying number of barrier segments. In order to have a consistent data
set, only the first half of the barrier segments in the traffic direction were inspected.

CENTER FOR STRUCTURAL DURABILITY – Causes & Cures for Cracking of Concrete Barriers 56
A sample inspection raw data sheet is shown in Figure 4-1. The inspection data was obtained
from one barrier segment of bridge S06 of 82022 located in the Metro Region. The bridge
carries I-94 WB and the barrier was constructed in 1993. All visual defects are marked on the
barrier inspection template as lines and/or zones corresponding to their location on the barrier
segment. The crack length and width as well as distance between cracks are noted. Bridge
orientation is documented in order to evaluate the exposure effects. Photos taken from the traffic
side of the barrier are marked on the inspection template. The condition of the fascia of each
barrier is documented with photos taken from the intersecting roadway. The photograph index
number is recorded on the inspection template with an arrow showing the photo direction.
Selected photos of the inspected barrier are shown in Figure 4-2. The inspection data, shown in
Figure 4-1, shows significant cracking.
4.4.1 Inspection Protocol
Bridges with New Jersey barriers and shoulders wider than 12 feet were selected for inspection.
This provided the inspection crew with a safe and workable area without any need for lane
closure. Topology of segments and all visible distresses were recorded with regard to their
location, width, and dimensions. A general bridge view and data was also collected for each
bridge.

CENTER FOR STRUCTURAL DURABILITY – Causes & Cures for Cracking of Concrete Barriers 57
Figure 4-1. Barrier inspection template (S06-82022)

CENTER FOR STRUCTURAL DURABILITY – Causes & Cures for Cracking of Concrete Barriers 58
Photograph # 23 Photograph # 24
Photograph # 28
Photograph # 29
Photograph # 25
Photograph # 30
Figure 4-2. Sample photos documenting the visual data documented on the barrier inspection template (S06-82022)
(Photograph numbers refer to the location index shown in Figure 4-1)

CENTER FOR STRUCTURAL DURABILITY – Causes & Cures for Cracking of Concrete Barriers 59
4.4.2 Inspection Data Processing
Prior to quantitative analysis, all inspection raw data sheets are presented using graphical
symbols. The exposure is defined based on the direction of the traffic bearing side of the barrier
(e.g., if the traffic bearing side of the barrier faces north, its exposure is designated as “north
exposure”). The legend shown in Table 4-2 is used to represent the data.
Table 4-2. Symbols used to Represent Distress Types
Distress Type Symbol
Spall
Delamination
Crack (Heavier lines signify
crack widths > 0.015)
Map Cracking
Scaling
Patch
Popout
Figures 4-3 through 4-22 show the barrier condition documented on the inspection templates in
processed form.
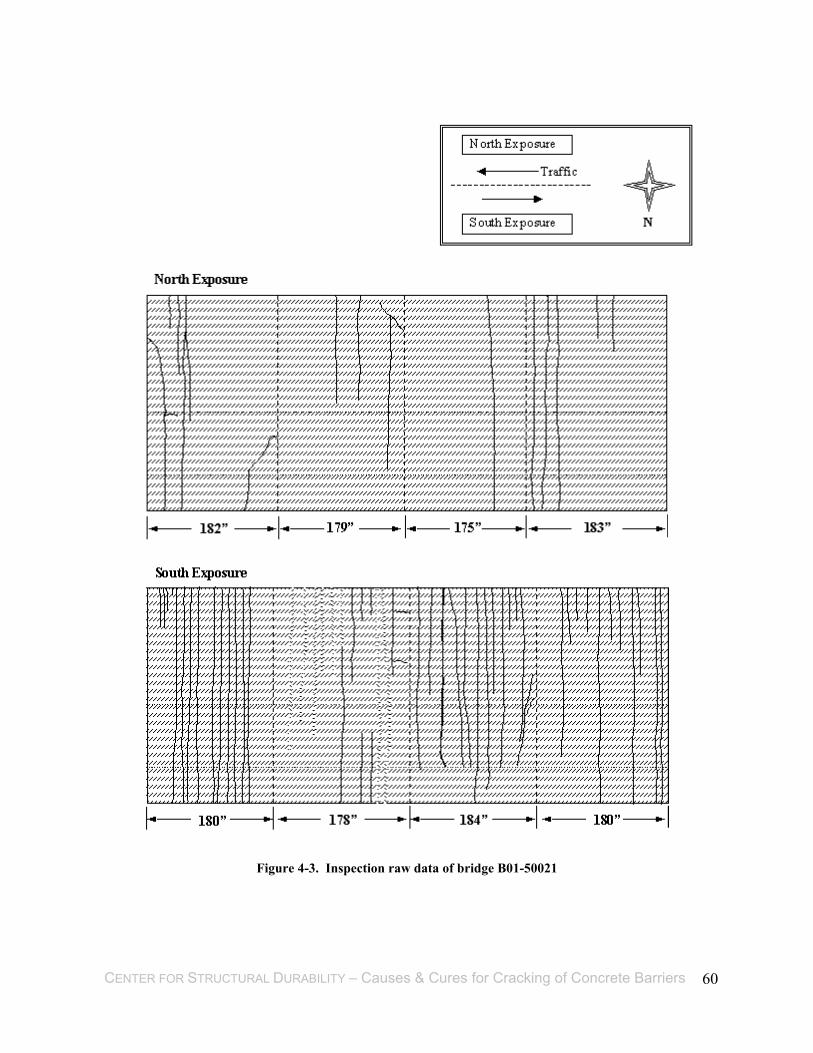
CENTER FOR STRUCTURAL DURABILITY – Causes & Cures for Cracking of Concrete Barriers 60
B01 of 50021
Year Built: 1994
Figure 4-3. Inspection raw data of bridge B01-50021

CENTER FOR STRUCTURAL DURABILITY – Causes & Cures for Cracking of Concrete Barriers 61
B01 of 66051
Construction Year: 1985
North Exposure
South Exposure
Traffic
N
Figure 4-4. Inspection raw data of bridge B01-66051
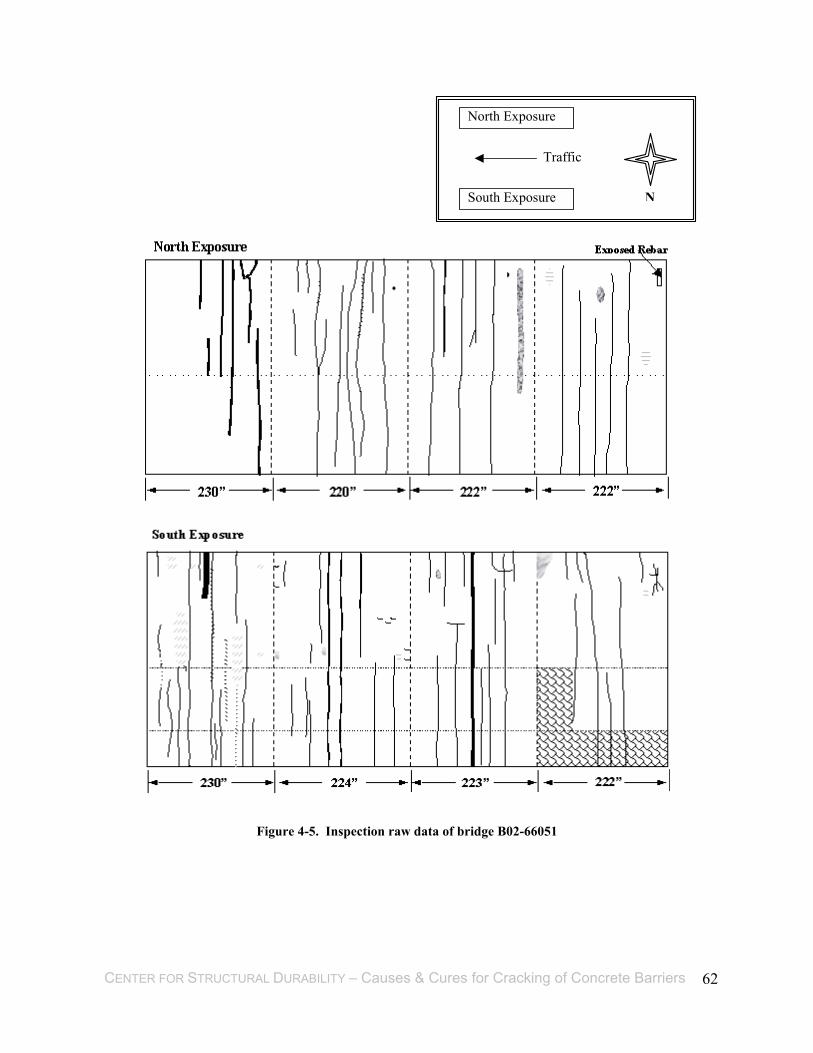
CENTER FOR STRUCTURAL DURABILITY – Causes & Cures for Cracking of Concrete Barriers 62
B02 of 66051
Construction Year: 1985
North Exposure
South Exposure
Traffic
N
Figure 4-5. Inspection raw data of bridge B02-66051
CENTER FOR STRUCTURAL DURABILITY – Causes & Cures for Cracking of Concrete Barriers 63
S01 of 44044
Construction Year: 1983
North Exposure
South Exposure
Traffic
N
North Exposure
145” 144” 156” 142”
South Exposure
134” 141” 141” 146”
Figure 4-6. Inspection raw data of bridge S01-44044

CENTER FOR STRUCTURAL DURABILITY – Causes & Cures for Cracking of Concrete Barriers 64
S20 of 63174
Construction Year: 2001
Figure 4-7. Inspection raw data of bridge S20-63174

CENTER FOR STRUCTURAL DURABILITY – Causes & Cures for Cracking of Concrete Barriers 65
S02 of 82194
Construction Year: 1986
Figure 4-8. Inspection raw data of bridge S02-82194

CENTER FOR STRUCTURAL DURABILITY – Causes & Cures for Cracking of Concrete Barriers 66
S02 of 23152
Construction Year: 1980
East Exposure
West Exposure
Traffic N
Figure 4-9. Inspection raw data of bridge S02-23152

CENTER FOR STRUCTURAL DURABILITY – Causes & Cures for Cracking of Concrete Barriers 67
S04 of 63101
Construction Year: 1988
Figure 4-10. Inspection raw data of bridge S04-63101

CENTER FOR STRUCTURAL DURABILITY – Causes & Cures for Cracking of Concrete Barriers 68
S04 of 63174
Construction Year: 2001
Figure 4-11. Inspection raw data of bridge S04-63174

CENTER FOR STRUCTURAL DURABILITY – Causes & Cures for Cracking of Concrete Barriers 69
S04 of 82022
Construction Year: 1993
Figure 4-12. Inspection raw data of bridge S04-82022
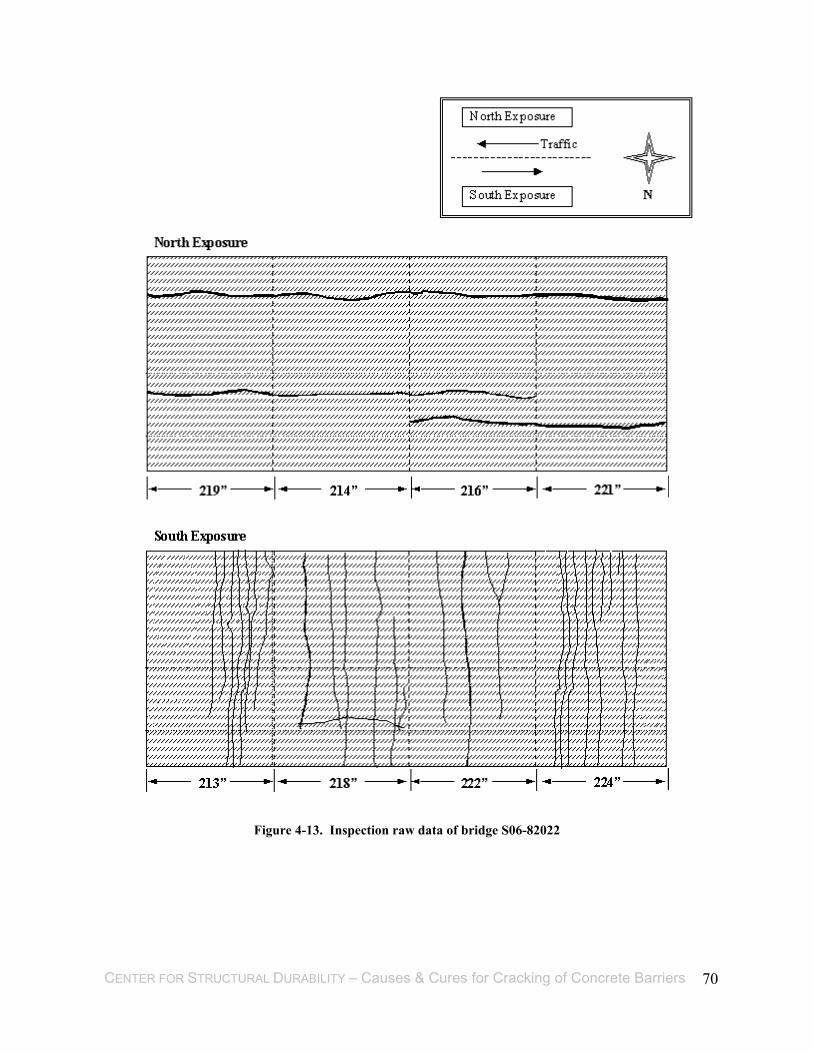
CENTER FOR STRUCTURAL DURABILITY – Causes & Cures for Cracking of Concrete Barriers 70
S06 of 82022
Construction Year: 1993
Figure 4-13. Inspection raw data of bridge S06-82022
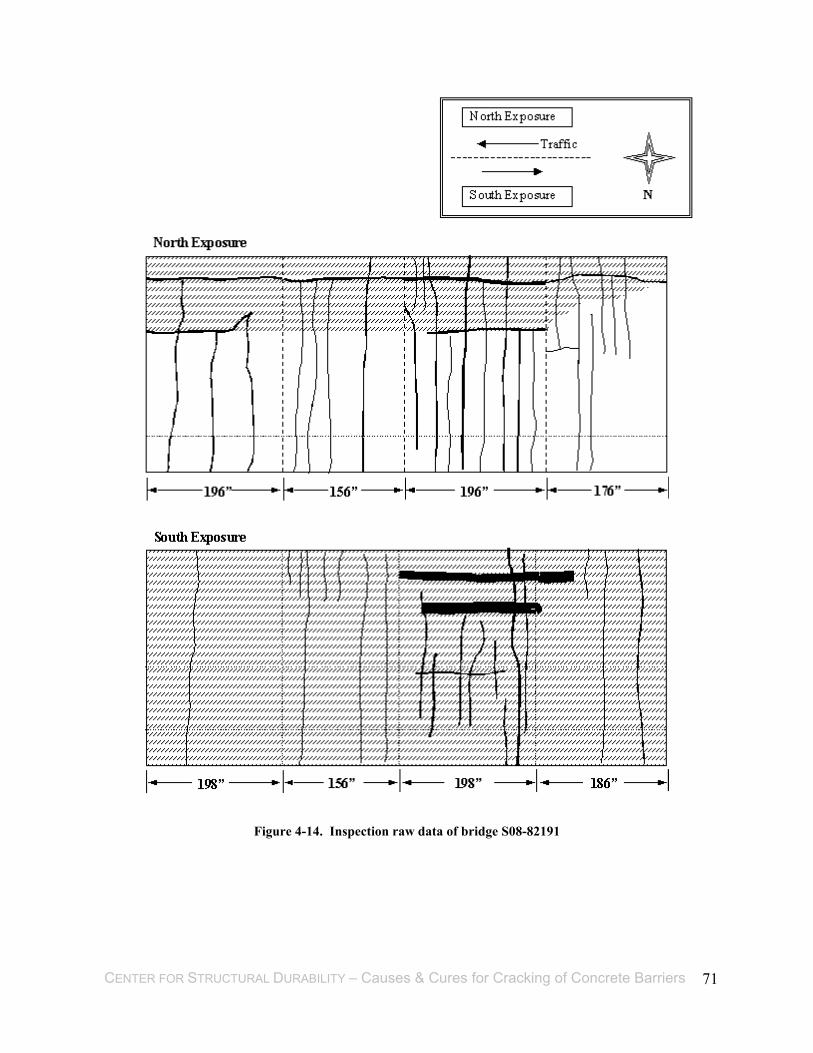
CENTER FOR STRUCTURAL DURABILITY – Causes & Cures for Cracking of Concrete Barriers 71
S08 of 82191
Construction Year: 1989
Figure 4-14. Inspection raw data of bridge S08-82191

CENTER FOR STRUCTURAL DURABILITY – Causes & Cures for Cracking of Concrete Barriers 72
S09 of 63101
Construction Year: 1988
North Exposure
South Exposure
Traffic
N
Figure 4-15. Inspection raw data of bridge S09-63101

CENTER FOR STRUCTURAL DURABILITY – Causes & Cures for Cracking of Concrete Barriers 73
S12 of 63022
Construction Year: 1997
Figure 4-16. Inspection raw data of bridge S12-63022
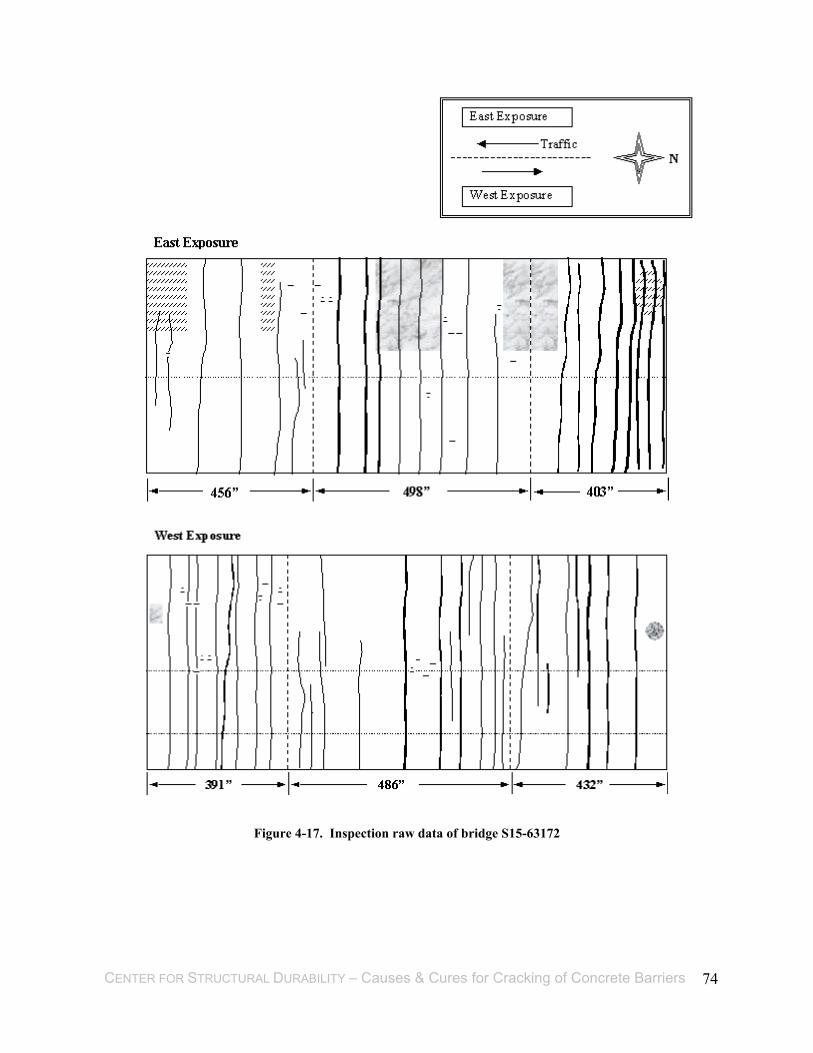
CENTER FOR STRUCTURAL DURABILITY – Causes & Cures for Cracking of Concrete Barriers 74
S15 of 63172
Construction Year: 1988
Figure 4-17. Inspection raw data of bridge S15-63172

CENTER FOR STRUCTURAL DURABILITY – Causes & Cures for Cracking of Concrete Barriers 75
S24 of 82022
Construction Year: 1996
North Exposure
South Exposure
Traffic
N
Figure 4-18. Inspection raw data of bridge S24-82022
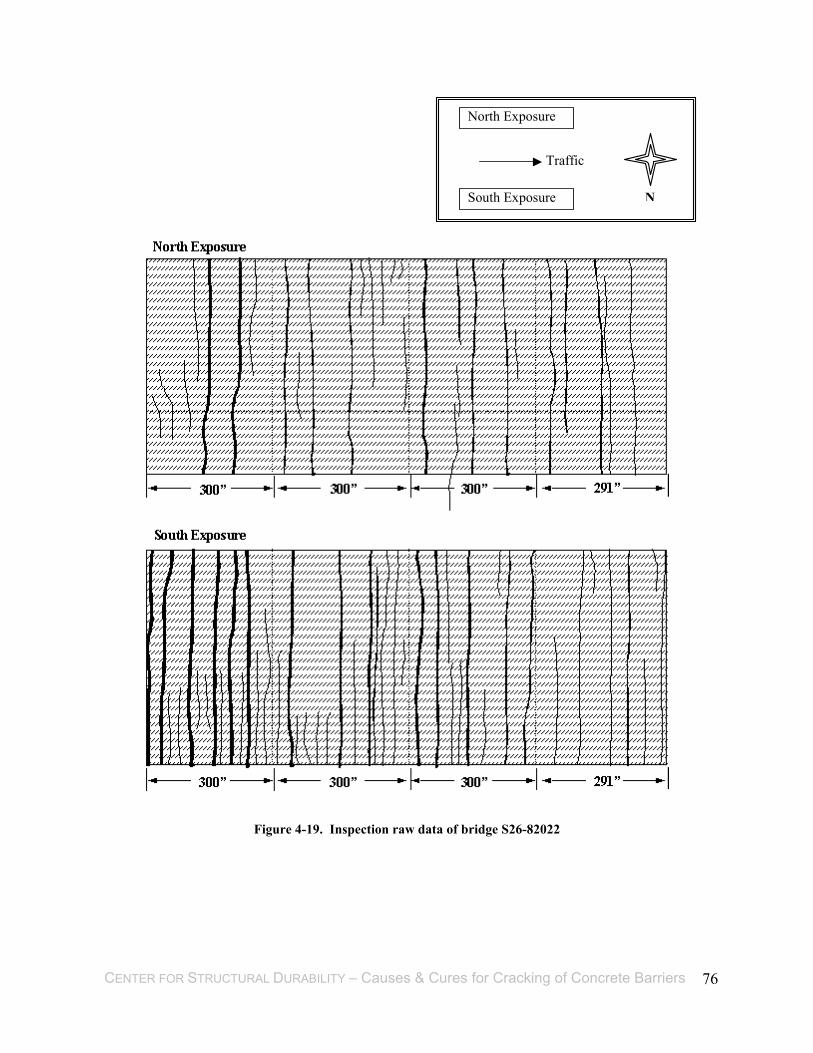
CENTER FOR STRUCTURAL DURABILITY – Causes & Cures for Cracking of Concrete Barriers 76
S26 of 82022
Construction Year: 1997
North Exposure
South Exposure
Traffic
N
Figure 4-19. Inspection raw data of bridge S26-82022
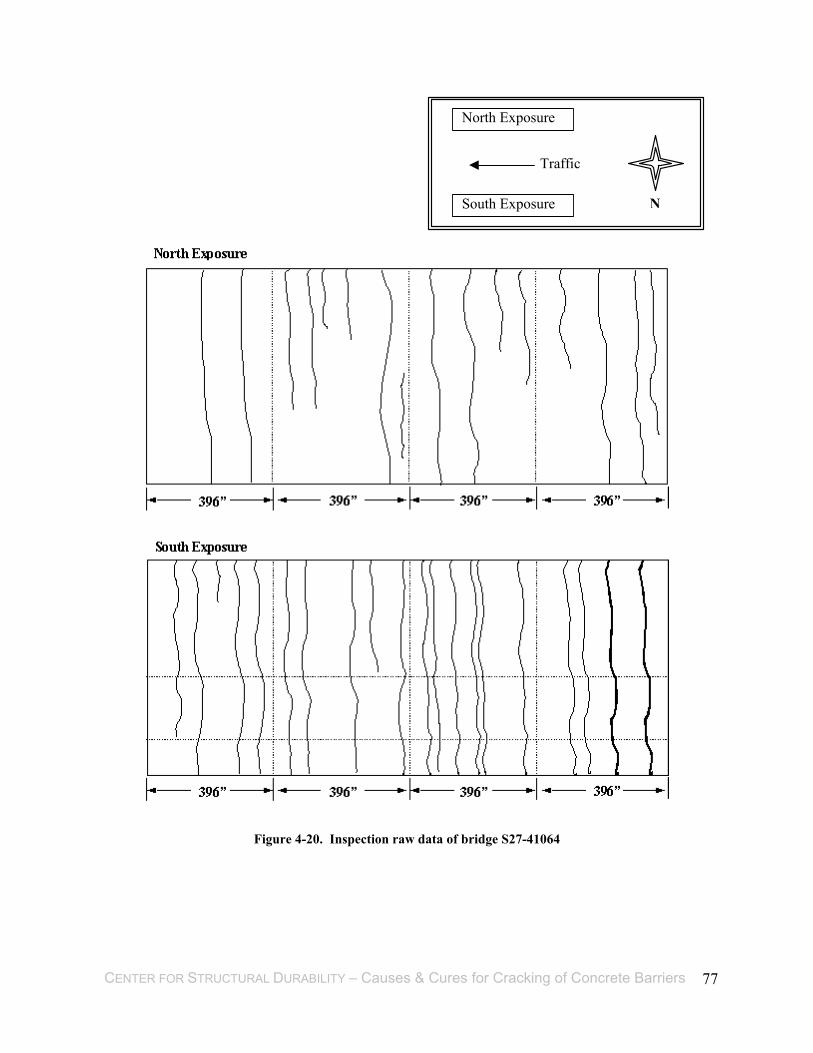
CENTER FOR STRUCTURAL DURABILITY – Causes & Cures for Cracking of Concrete Barriers 77
S27 of 41064
Construction Year: 1997
North Exposure
South Exposure
Traffic
N
Figure 4-20. Inspection raw data of bridge S27-41064
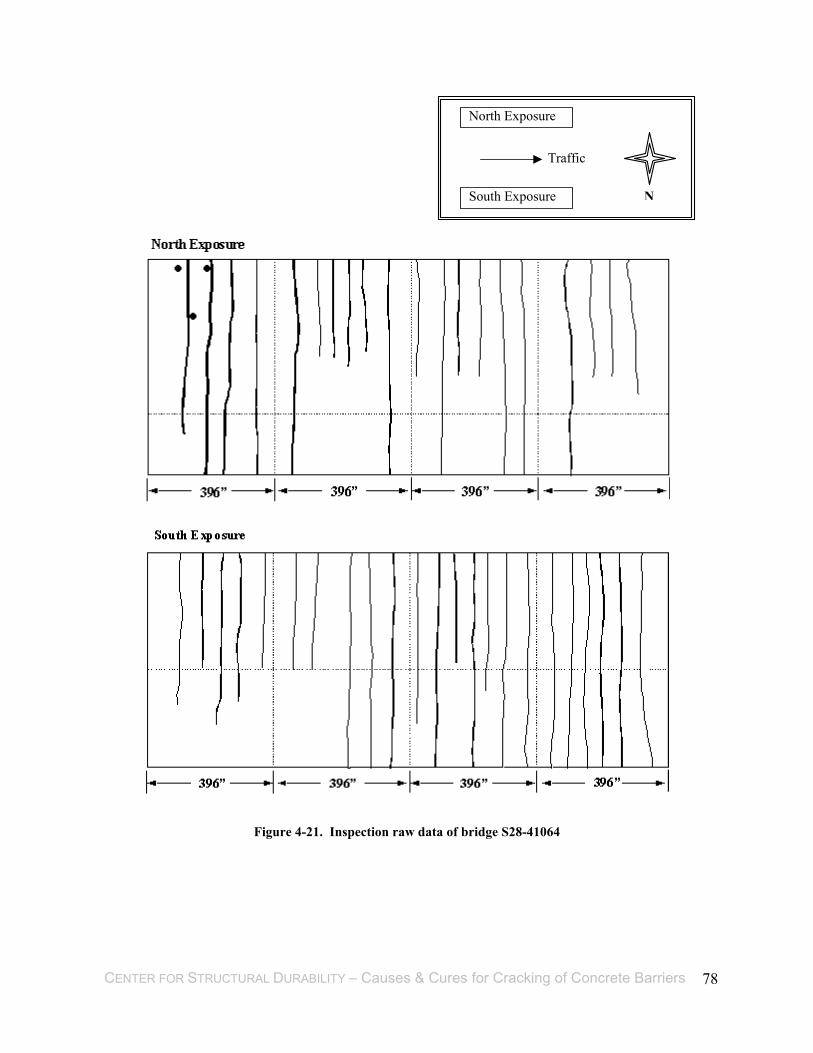
CENTER FOR STRUCTURAL DURABILITY – Causes & Cures for Cracking of Concrete Barriers 78
S28 of 41064
Construction Year: 1997
North Exposure
South Exposure
Traffic
N
Figure 4-21. Inspection raw data of bridge S28-41064

CENTER FOR STRUCTURAL DURABILITY – Causes & Cures for Cracking of Concrete Barriers 79
S12 of 63172
Construction Year: 1988
Figure 4-22. Inspection raw data of bridge S12-63172

CENTER FOR STRUCTURAL DURABILITY – Causes & Cures for Cracking of Concrete Barriers 80
4.5 COMPILATION OF INSPECTION DATA
The main distress types are compiled from the raw data. The distress types are: vertical
cracking, horizontal cracking, map cracking, delamination, spalling and disintegration, patch,
and popout. Data is first compiled for each individual barrier segment and grouped under the
bridge ID.
Vertical cracking is grouped under different crack widths due to the fact that it is a distress type
observed at a very early-age. It is hypothesized that other distresses such as corrosion, horizontal
cracking, spall and disintegration proliferate from vertical cracking. Also, map cracking appears
at early ages of barriers. However, the cracks within the map cracked area remain near the
surface and do not proliferate to other distress types. Table 4-3 through Table 4-22 summarizes
the map cracking, vertical cracking, and horizontal cracking data for each barrier segment. Table
4-23 summarizes the data compiled for each bridge.

CENTER FOR STRUCTURAL DURABILITY – Causes & Cures for Cracking of Concrete Barriers 81
Table 4-3. Compiled Data on Barrier Distress
Bridge ID B01-50021
(1)
Segment Length (Inches)
(2)
Exposure
(3)
Map cracking
(%)
(4)
Total number of
vertical cracks
(5)
Number of vertical cracks > 0.01 in.
(6)
Number of vertical cracks
>0.015 in. (7)
Total number of horizontal
cracks (8)
Segment 1 182 NORTH 100 4 3 0 2 Segment 2 179 NORTH 100 3 0 0 1 Segment 3 175 NORTH 100 1 1 0 0 Segment 4 183 NORTH 100 5 3 0 0 Segment 5 180 SOUTH 100 15 13 0 0 Segment 6 178 SOUTH 100 12 12 1 2 Segment 7 184 SOUTH 100 11 5 1 1 Segment 8 180 SOUTH 100 13 3 0 0
Total 1441 64 40 2 6 Average 180 100 8 5 0.25 1
This bridge was constructed in 1994 using PCI girders. The data obtained for evaluation was taken from span two of this bridge.
1. Segment number 2. Segment length measured in inches 3. Direction of exposure of the traffic side of the barrier 4. Percentage of map cracking based on the barrier surface area 5. Total number of vertical cracks on the segment 6. Total number of vertical cracks with crack widths greater than 0.01 inches 7. Total number of vertical cracks with crack widths greater than 0.015 inches 8. Total number of horizontal cracks on the segment
Table 4-4. Compiled Data on Barrier Distress
Bridge ID B01-66051
(1)
Segment Length (Inches)
(2)
Exposure
(3)
Map cracking
(%)
(4)
Total number of
vertical cracks
(5)
Number of vertical cracks > 0.01 in.
(6)
Number of vertical cracks
>0.015 in. (7)
Total number of horizontal
cracks (8)
Segment 1 253 SOUTH 1 10 2 0 1 Segment 2 253 SOUTH 0 10 10 3 1 Segment 3 246 SOUTH 0 8 4 2 0 Segment 4 250 SOUTH 0 7 1 0 1 Segment 5 252 NORTH 0 9 3 1 0 Segment 6 251 NORTH 0 6 5 2 0 Segment 7 254 NORTH 0 7 5 4 0 Segment 8 246 NORTH 0 6 3 1 0
Total 2005 63 33 13 3 Average 251 0 8 4 2 0
This bridge was constructed in 1985 using steel girders. The data obtained for evaluation was taken from span three of this bridge.
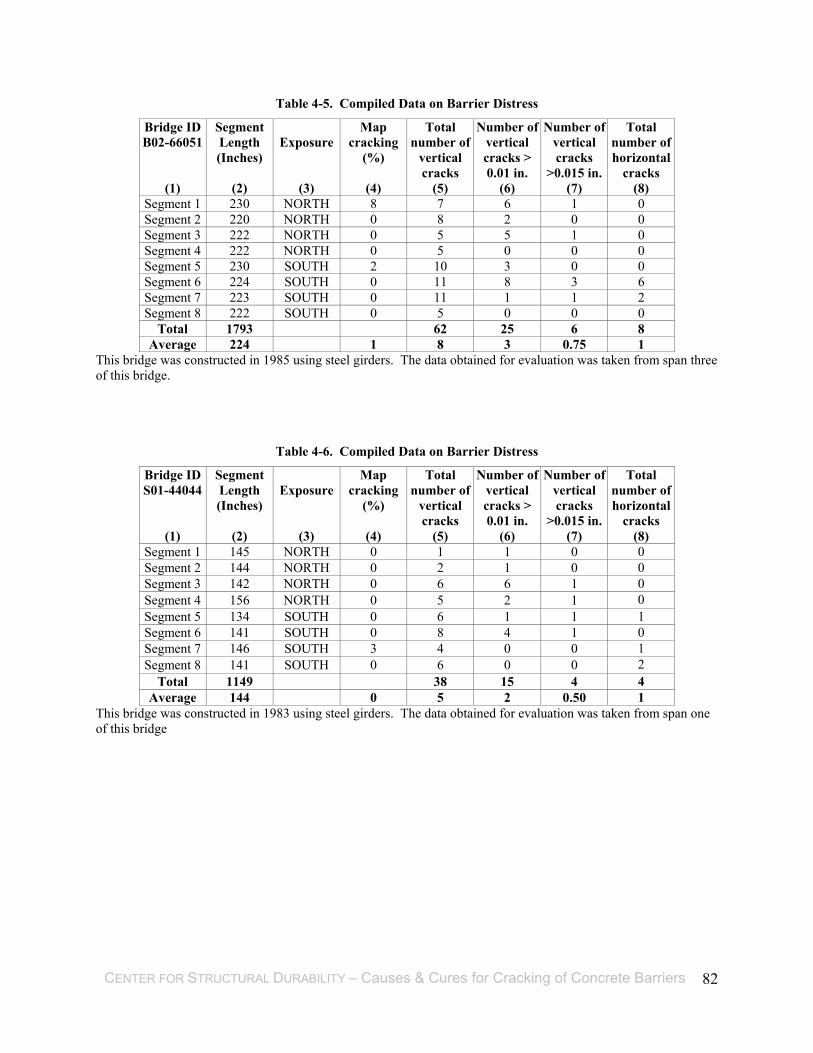
CENTER FOR STRUCTURAL DURABILITY – Causes & Cures for Cracking of Concrete Barriers 82
Table 4-5. Compiled Data on Barrier Distress
Bridge ID B02-66051
(1)
Segment Length (Inches)
(2)
Exposure
(3)
Map cracking
(%)
(4)
Total number of
vertical cracks
(5)
Number of vertical cracks > 0.01 in.
(6)
Number of vertical cracks
>0.015 in. (7)
Total number of horizontal
cracks (8)
Segment 1 230 NORTH 8 7 6 1 0 Segment 2 220 NORTH 0 8 2 0 0 Segment 3 222 NORTH 0 5 5 1 0 Segment 4 222 NORTH 0 5 0 0 0 Segment 5 230 SOUTH 2 10 3 0 0 Segment 6 224 SOUTH 0 11 8 3 6 Segment 7 223 SOUTH 0 11 1 1 2 Segment 8 222 SOUTH 0 5 0 0 0
Total 1793 62 25 6 8 Average 224 1 8 3 0.75 1
This bridge was constructed in 1985 using steel girders. The data obtained for evaluation was taken from span three of this bridge.
Table 4-6. Compiled Data on Barrier Distress
Bridge ID S01-44044
(1)
Segment Length (Inches)
(2)
Exposure
(3)
Map cracking
(%)
(4)
Total number of
vertical cracks
(5)
Number of vertical cracks > 0.01 in.
(6)
Number of vertical cracks
>0.015 in. (7)
Total number of horizontal
cracks (8)
Segment 1 145 NORTH 0 1 1 0 0 Segment 2 144 NORTH 0 2 1 0 0 Segment 3 142 NORTH 0 6 6 1 0 Segment 4 156 NORTH 0 5 2 1 0 Segment 5 134 SOUTH 0 6 1 1 1 Segment 6 141 SOUTH 0 8 4 1 0 Segment 7 146 SOUTH 3 4 0 0 1 Segment 8 141 SOUTH 0 6 0 0 2
Total 1149 38 15 4 4 Average 144 0 5 2 0.50 1
This bridge was constructed in 1983 using steel girders. The data obtained for evaluation was taken from span one of this bridge

CENTER FOR STRUCTURAL DURABILITY – Causes & Cures for Cracking of Concrete Barriers 83
Table 4-7. Compiled Data on Barrier Distress
Bridge ID S20-63174
(1)
Segment Length (Inches)
(2)
Exposure
(3)
Map cracking
(%)
(4)
Total number of
vertical cracks
(5)
Number of vertical cracks > 0.01 in.
(6)
Number of vertical cracks
>0.015 in. (7)
Total number of horizontal
cracks (8)
Segment 1 193 EAST 1 6 5 0 0 Segment 2 191 EAST 0 9 7 2 0 Segment 3 250 EAST 0 11 9 4 1 Segment 4 255 EAST 0 8 8 3 0 Segment 5 257 EAST 1 9 6 2 0 Segment 6 240 EAST 0 7 4 1 0 Segment 7 223 EAST 0 9 3 3 0
Total 1609 59 42 15 1 Average 230 0 8 6 2 0
This bridge was constructed in 2001 using PCI girders. The data obtained for evaluation was taken from span three of this bridge.
Table 4-8. Compiled Data on Barrier Distress
Bridge ID S02-82194
(1)
Segment Length (Inches)
(2)
Exposure
(3)
Map cracking
(%)
(4)
Total number of
vertical cracks
(5)
Number of vertical cracks > 0.01 in.
(6)
Number of vertical cracks
>0.015 in. (7)
Total number of horizontal
cracks (8)
Segment 1 432 WEST 0 16 15 11 3 Segment 2 516 WEST 0 16 11 9 3 Segment 3 444 WEST 0 12 8 4 5 Segment 4 300 WEST 0 10 9 6 1 Segment 5 297 WEST 0 14 10 3 5 Segment 6 444 WEST 0 15 9 4 6 Segment 7 487 WEST 0 16 11 5 3 Segment 8 548 WEST 0 16 16 14 2
Total 3468 115 89 56 28 Average 434 0 14 11 7 4
This bridge was constructed in 1986 using steel girders. The data obtained for evaluation was taken from span four of this bridge.

CENTER FOR STRUCTURAL DURABILITY – Causes & Cures for Cracking of Concrete Barriers 84
Table 4-9. Compiled Data on Barrier Distress
Bridge ID S02-23152
(1)
Segment Length (Inches)
(2)
Exposure
(3)
Map cracking
(%)
(4)
Total number of
vertical cracks
(5)
Number of vertical cracks > 0.01 in.
(6)
Number of vertical cracks
>0.015 in. (7)
Total number of horizontal
cracks (8)
Segment 1 497 EAST 0 12 10 6 0 Segment 2 471 EAST 0 10 9 5 2 Segment 3 471 EAST 0 7 5 4 0 Segment 4 497 EAST 0 11 10 6 5 Segment 5 499 WEST 0 15 12 9 2 Segment 6 470 WEST 0 9 4 2 4 Segment 7 470 WEST 0 8 7 2 1 Segment 8 499 WEST 0 17 15 3 5
Total 3874 89 72 37 19 Average 484 0 11 9 5 2
This bridge was constructed in 1980 using steel girders. The data obtained for evaluation was taken from span three of this bridge.
Table 4-10. Compiled Data on Barrier Distress
Bridge ID S04-63101
(1)
Segment Length (Inches)
(2)
Exposure
(3)
Map cracking
(%)
(4)
Total number of
vertical cracks
(5)
Number of vertical cracks > 0.01 in.
(6)
Number of vertical cracks
>0.015 in. (7)
Total number of horizontal
cracks (8)
Segment 1 203 SOUTH 0 4 3 3 0 Segment 2 201 SOUTH 0 2 2 2 1 Segment 3 168 SOUTH 0 3 0 0 0 Segment 4 151 SOUTH 46 3 2 0 5 Segment 5 210 NORTH 0 3 1 1 3 Segment 6 208 NORTH 0 5 4 3 2 Segment 7 168 NORTH 0 2 2 2 0 Segment 8 126 NORTH 0 3 3 1 0
Total 1435 25 17 12 11 Average 179 6 3 2 2 1
This bridge was constructed in 1988 using PCI girders. The data obtained for evaluation was taken from span three of this bridge.

CENTER FOR STRUCTURAL DURABILITY – Causes & Cures for Cracking of Concrete Barriers 85
Table 4-11. Compiled Data on Barrier Distress
Bridge ID S04-63174
(1)
Segment Length (Inches)
(2)
Exposure
(3)
Map cracking
(%)
(4)
Total number of
vertical cracks
(5)
Number of vertical cracks > 0.01 in.
(6)
Number of vertical cracks
>0.015 in. (7)
Total number of horizontal
cracks (8)
Segment 1 239 WEST 0 0 0 0 0 Segment 2 232 WEST 0 2 2 2 0 Segment 3 268 WEST 0 3 3 2 0 Segment 4 258 WEST 0 3 3 3 0 Segment 5 228 EAST 0 3 3 0 0 Segment 6 240 EAST 0 4 4 2 0 Segment 7 262 EAST 0 6 4 3 0 Segment 8 262 EAST 0 6 3 2 0
Total 1989 27 22 14 0 Average 249 0 3 3 2 0
This bridge was constructed in 2001 using side-by-side box girders.
Table 4-12. Compiled Data on Barrier Distress
Bridge ID S04-82022
(1)
Segment Length (Inches)
(2)
Exposure
(3)
Map cracking
(%)
(4)
Total number of
vertical cracks
(5)
Number of vertical cracks > 0.01 in.
(6)
Number of vertical cracks
>0.015 in. (7)
Total number of horizontal
cracks (8)
Segment 1 228 NORTH 22 13 7 0 0 Segment 2 221 NORTH 24 10 5 1 0 Segment 3 213 NORTH 14 6 3 0 0 Segment 4 208 NORTH 29 8 8 0 0 Segment 5 208 SOUTH 100 4 4 1 2 Segment 6 242 SOUTH 26 5 5 1 1 Segment 7 202 SOUTH 7 5 5 1 3 Segment 8 217 SOUTH 5 4 4 1 2
Total 1739 55 41 5 8 Average 217 28 7 5 0.63 1
This bridge was constructed in 1993 using side-by-side box girders. The data obtained for evaluation was taken from span two of this bridge.

CENTER FOR STRUCTURAL DURABILITY – Causes & Cures for Cracking of Concrete Barriers 86
Table 4-13. Compiled Data on Barrier Distress
Bridge ID S06-82022
(1)
Segment Length (Inches)
(2)
Exposure
(3)
Map cracking
(%)
(4)
Total number of
vertical cracks
(5)
Number of vertical cracks > 0.01 in.
(6)
Number of vertical cracks
>0.015 in. (7)
Total number of horizontal
cracks (8)
Segment 1 219 NORTH 100 25 25 0 2 Segment 2 214 NORTH 100 24 24 0 3 Segment 3 216 NORTH 100 25 25 0 5 Segment 4 221 NORTH 100 24 24 0 5 Segment 5 224 SOUTH 26 12 5 0 4 Segment 6 222 SOUTH 0 3 3 1 1 Segment 7 218 SOUTH 68 8 4 1 9 Segment 8 213 SOUTH 24 11 11 0 7
Total 1747 132 121 2 36 Average 218 65 17 15 0.25 5
This bridge was constructed in 1993 using side-by-side box girders. The data obtained for evaluation was taken from span two of this bridge.
Table 4-14. Compiled Data on Barrier Distress
Bridge ID S08-82191
(1)
Segment Length (Inches)
(2)
Exposure
(3)
Map cracking
(%)
(4)
Total number of
vertical cracks
(5)
Number of vertical cracks > 0.01 in.
(6)
Number of vertical cracks
>0.015 in. (7)
Total number of horizontal
cracks (8)
Segment 1 196 NORTH 0 3 3 3 3 Segment 2 156 NORTH 0 5 4 1 2 Segment 3 196 NORTH 0 10 10 5 3 Segment 4 176 NORTH 0 10 9 1 5 Segment 5 198 SOUTH 1 2 2 2 0 Segment 6 156 SOUTH 16 6 2 0 0 Segment 7 198 SOUTH 0 9 9 9 5 Segment 8 186 SOUTH 0 4 2 2 3
Total 1462 49 41 23 21 Average 183 2 6 5 3 3
This bridge was constructed in 1989 using steel girders. The data obtained for evaluation was taken from span four of this bridge.
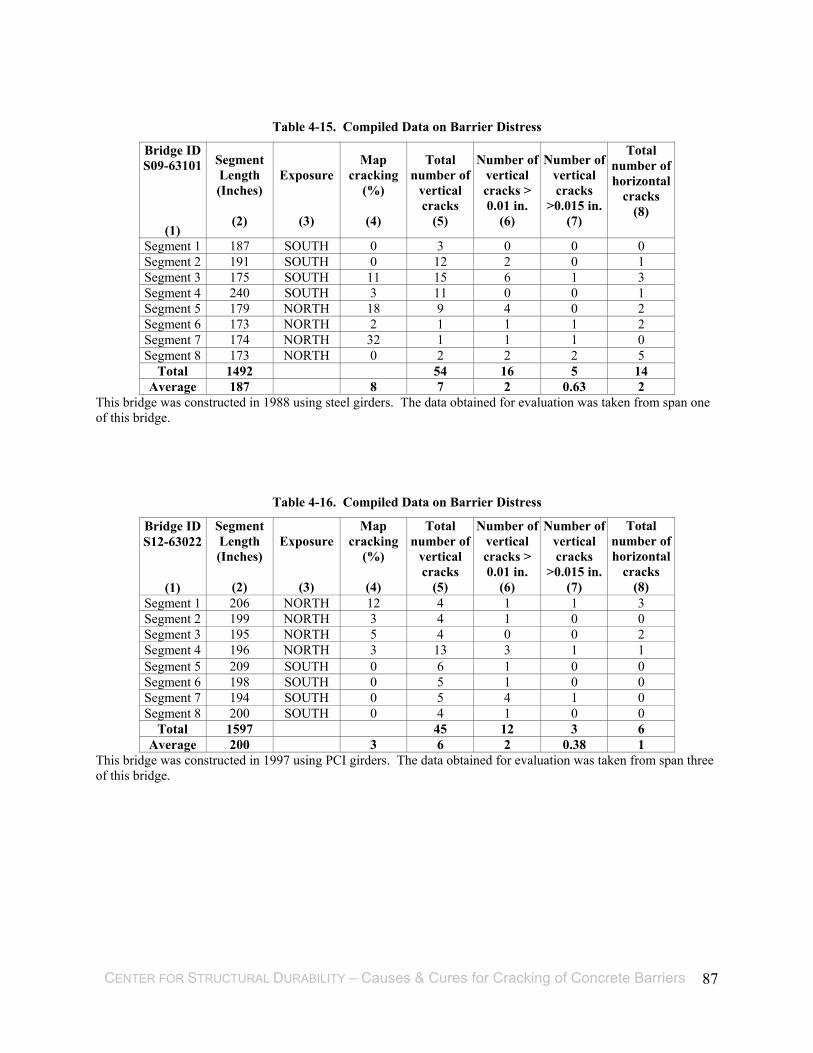
CENTER FOR STRUCTURAL DURABILITY – Causes & Cures for Cracking of Concrete Barriers 87
Table 4-15. Compiled Data on Barrier Distress
Bridge ID S09-63101
(1)
Segment Length (Inches)
(2)
Exposure
(3)
Map cracking
(%)
(4)
Total number of
vertical cracks
(5)
Number of vertical cracks > 0.01 in.
(6)
Number of vertical cracks
>0.015 in. (7)
Total number of horizontal
cracks (8)
Segment 1 187 SOUTH 0 3 0 0 0 Segment 2 191 SOUTH 0 12 2 0 1 Segment 3 175 SOUTH 11 15 6 1 3 Segment 4 240 SOUTH 3 11 0 0 1 Segment 5 179 NORTH 18 9 4 0 2 Segment 6 173 NORTH 2 1 1 1 2 Segment 7 174 NORTH 32 1 1 1 0 Segment 8 173 NORTH 0 2 2 2 5
Total 1492 54 16 5 14 Average 187 8 7 2 0.63 2
This bridge was constructed in 1988 using steel girders. The data obtained for evaluation was taken from span one of this bridge.
Table 4-16. Compiled Data on Barrier Distress
Bridge ID S12-63022
(1)
Segment Length (Inches)
(2)
Exposure
(3)
Map cracking
(%)
(4)
Total number of
vertical cracks
(5)
Number of vertical cracks > 0.01 in.
(6)
Number of vertical cracks
>0.015 in. (7)
Total number of horizontal
cracks (8)
Segment 1 206 NORTH 12 4 1 1 3 Segment 2 199 NORTH 3 4 1 0 0 Segment 3 195 NORTH 5 4 0 0 2 Segment 4 196 NORTH 3 13 3 1 1 Segment 5 209 SOUTH 0 6 1 0 0 Segment 6 198 SOUTH 0 5 1 0 0 Segment 7 194 SOUTH 0 5 4 1 0 Segment 8 200 SOUTH 0 4 1 0 0
Total 1597 45 12 3 6 Average 200 3 6 2 0.38 1
This bridge was constructed in 1997 using PCI girders. The data obtained for evaluation was taken from span three of this bridge.
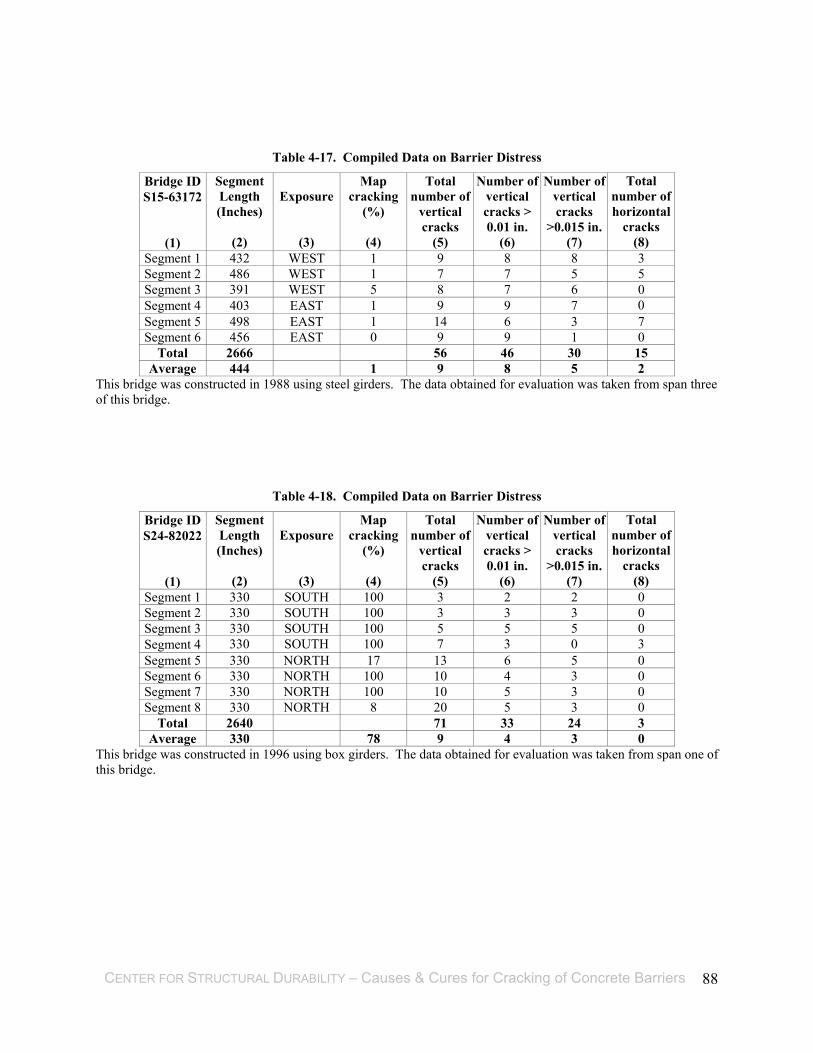
CENTER FOR STRUCTURAL DURABILITY – Causes & Cures for Cracking of Concrete Barriers 88
Table 4-17. Compiled Data on Barrier Distress
Bridge ID S15-63172
(1)
Segment Length (Inches)
(2)
Exposure
(3)
Map cracking
(%)
(4)
Total number of
vertical cracks
(5)
Number of vertical cracks > 0.01 in.
(6)
Number of vertical cracks
>0.015 in. (7)
Total number of horizontal
cracks (8)
Segment 1 432 WEST 1 9 8 8 3 Segment 2 486 WEST 1 7 7 5 5 Segment 3 391 WEST 5 8 7 6 0 Segment 4 403 EAST 1 9 9 7 0 Segment 5 498 EAST 1 14 6 3 7 Segment 6 456 EAST 0 9 9 1 0
Total 2666 56 46 30 15 Average 444 1 9 8 5 2
This bridge was constructed in 1988 using steel girders. The data obtained for evaluation was taken from span three of this bridge.
Table 4-18. Compiled Data on Barrier Distress
Bridge ID S24-82022
(1)
Segment Length (Inches)
(2)
Exposure
(3)
Map cracking
(%)
(4)
Total number of
vertical cracks
(5)
Number of vertical cracks > 0.01 in.
(6)
Number of vertical cracks
>0.015 in. (7)
Total number of horizontal
cracks (8)
Segment 1 330 SOUTH 100 3 2 2 0 Segment 2 330 SOUTH 100 3 3 3 0 Segment 3 330 SOUTH 100 5 5 5 0 Segment 4 330 SOUTH 100 7 3 0 3 Segment 5 330 NORTH 17 13 6 5 0 Segment 6 330 NORTH 100 10 4 3 0 Segment 7 330 NORTH 100 10 5 3 0 Segment 8 330 NORTH 8 20 5 3 0
Total 2640 71 33 24 3 Average 330 78 9 4 3 0
This bridge was constructed in 1996 using box girders. The data obtained for evaluation was taken from span one of this bridge.

CENTER FOR STRUCTURAL DURABILITY – Causes & Cures for Cracking of Concrete Barriers 89
Table 4-19. Compiled Data on Barrier Distress
Bridge ID S26-82022
(1)
Segment Length (Inches)
(2)
Exposure
(3)
Map cracking
(%)
(4)
Total number of
vertical cracks
(5)
Number of vertical cracks > 0.01 in.
(6)
Number of vertical cracks
>0.015 in. (7)
Total number of horizontal
cracks (8)
Segment 1 300 SOUTH 100 14 14 6 0 Segment 2 300 SOUTH 46 13 12 4 0 Segment 3 300 SOUTH 46 8 8 5 0 Segment 4 291 SOUTH 46 8 4 1 0 Segment 5 300 NORTH 29 9 4 2 0 Segment 6 300 NORTH 55 9 4 3 0 Segment 7 300 NORTH 46 5 5 4 0 Segment 8 291 NORTH 100 5 4 2 0
Total 2382 71 55 27 0 Average 298 59 9 7 3 0
This bridge was constructed in 1997 using box girders. The data obtained for evaluation was taken from span one of this bridge.
Table 4-20. Compiled Data on Barrier Distress
Bridge ID S27-41064
(1)
Segment Length (Inches)
(2)
Exposure
(3)
Map cracking
(%)
(4)
Total number of
vertical cracks
(5)
Number of vertical cracks > 0.01 in.
(6)
Number of vertical cracks
>0.015 in. (7)
Total number of horizontal
cracks (8)
Segment 1 396 SOUTH 0 4 4 3 0 Segment 2 396 SOUTH 0 6 6 4 0 Segment 3 396 SOUTH 0 5 5 3 0 Segment 4 396 SOUTH 0 5 5 2 0 Segment 5 396 NORTH 0 2 2 2 0 Segment 6 396 NORTH 0 6 6 3 0 Segment 7 396 NORTH 0 4 4 2 0 Segment 8 396 NORTH 0 4 4 3 0
Total 3168 36 36 22 0 Average 396 0 5 5 3 0
This bridge was constructed in 1997 using PCI girders. The data obtained for evaluation was taken from span two of this bridge.

CENTER FOR STRUCTURAL DURABILITY – Causes & Cures for Cracking of Concrete Barriers 90
Table 4-21. Compiled Data on Barrier Distress
Bridge ID S28-41064
(1)
Segment Length (Inches)
(2)
Exposure
(3)
Map cracking
(%)
(4)
Total number of
vertical cracks
(5)
Number of vertical cracks > 0.01 in.
(6)
Number of vertical cracks
>0.015 in. (7)
Total number of horizontal
cracks (8)
Segment 1 396 NORTH 0 4 4 4 0 Segment 2 396 NORTH 0 6 6 5 0 Segment 3 396 NORTH 0 6 6 1 0 Segment 4 396 NORTH 0 4 4 1 0 Segment 5 396 SOUTH 0 6 3 2 0 Segment 6 396 SOUTH 0 7 5 2 0 Segment 7 396 SOUTH 0 5 5 1 0 Segment 8 396 SOUTH 0 5 4 3 0
Total 3168 43 37 19 0 Average 396 0 5 5 2 0
This bridge was constructed in 1997 using PCI girders. The data obtained for evaluation was taken from span two of this bridge.
Table 4-22. Compiled Data on Barrier Distress
Bridge ID S12-63172
(1)
Segment Length (Inches)
(2)
Exposure
(3)
Map cracking
(%)
(4)
Total number of
vertical cracks
(5)
Number of vertical cracks > 0.01 in.
(6)
Number of vertical cracks
>0.015 in. (7)
Total number of horizontal
cracks (8)
Segment 1 624 EAST 4 9 7 1 0 Segment 2 702 EAST 0 18 18 9 1 Segment 3 636 EAST 1 17 15 5 0 Segment 4 636 WEST 0 9 9 8 2 Segment 5 696 WEST 0 15 12 7 0 Segment 6 616 WEST 0 16 13 8 2
Total 3910 84 74 38 5 Average 652 1 14 12 6 1
This bridge was constructed in 1988 using steel girders. The data obtained for evaluation was taken from span three of this bridge.

CENTER FOR STRUCTURAL DURABILITY – Causes & Cures for Cracking of Concrete Barriers 91
Table 4-23. Summary of Inspection Data
No Bridge ID Year Constructed
Average Daily
Traffic
Inspected Barrier
Length (ft)No. of
Segments
Map Cracked
Area (%)
Total # of Vertical Cracks
# of Vertical Cracks Larger Than 0.015 in
# of Horizontal
Cracks Type of Coarse
Aggregate*
1 S02 - 23152 1980 22,000 323 8 0 89 37 19 Natural gravel 2 S01 - 44044 1983 8500 95 8 0 38 4 4 Limestone or dolomite 3 B02 - 66051 1985 700 149 8 1 62 6 8 4 B01 - 66051 1985 1600 167 8 0 63 13 3
5 S02 - 82194 1986 42,500 289 8 0 115 56 12
6 S04 - 63101 1988 131,000 120 8 6 25 12 11 7 S09 - 63101 1988 67,000 124 8 8 54 5 14 8 S12 - 63172 1988 34,500 326 6 1 84 38 5 Natural gravel 9 S15 - 63172 1988 29,000 222 6 1 56 30 15 Crushed &Natural gravel
10 S08 - 82191 1989 1971 122 8 2 49 23 21
11 S04 - 82022 1993 52,000 145 8 28 55 5 8 Slag 12 S06 - 82022 1993 54,500 146 8 65 132 2 36 Slag 13 B01 - 50021 1994 37,000 120 8 100 64 2 6 14 S24 - 82022 1996 44,500 220 8 78 71 24 3
15 S26 - 82022 1997 58,000 199 8 59 71 27 0
16 S12 - 63022 1997 12,500 133 8 3 45 3 6 17 S28 - 41064 1997 14,900 264 8 0 43 19 0 18 S27 - 41064 1997 16,500 264 8 0 36 22 0 19 S04 - 63174 2001 93,500 166 8 0 27 14 0 Limestone or dolomite
20 S20 - 63174 2001 62,000 134 7 0 59 15 1 Limestone or dolomite * - Data is extracted from the publication made by Van Dam et al. (2003).

CENTER FOR STRUCTURAL DURABILITY – Causes & Cures for Cracking of Concrete Barriers 92
4.6 EVALUATION OF INSPECTION DATA
The exposure direction influence was the first evaluation. The observed distress types of map
cracking, vertical cracking, and horizontal cracking are grouped with respect to barrier exposure
directions (Table 4-24 through Table 4-27). From the data presented in the tables, barriers
exposed to north and south directions show significantly more map cracking when compared to
east and west exposure directions. There is no observed relation between map cracking percent
per segment and the bridge age. The data in the tables also show that average number of vertical
cracks per segment is approximately constant and independent of the exposure direction and
bridge age. It was hypothesized that the barriers with traffic side exposed to the south will have
rapid deterioration due to increased freeze-thaw cycles. However, the data does not support this
hypothesis.
Further data evaluation was performed only considering the average number of full-length
vertical cracks per barrier segment. This analysis interestingly showed that the ratio of crack
spacing to barrier height in Michigan is approximately two (Table 4-28). This table also contains
the inspection data gathered from a newly constructed slipformed bridge barrier inspected two
days following placement.
The coarse aggregate strength and modulus used in barrier construction is an important
parameter in assessing the cracking potential of concrete. The core samples obtained from the
barriers of eight inspected bridges indicated that the slag aggregate was used only in two bridges
and natural and crushed limestone were used in the other six (Table 4-23). Because of the lack
of data, conclusions on the effects of slag aggregate on premature barrier deterioration were not
made.

CENTER FOR STRUCTURAL DURABILITY – Causes & Cures for Cracking of Concrete Barriers 93
Table 4-24. Distress of Barriers with North Exposure
No. Bridge ID Construction Year
Average Length
of Barrier Segment (inches)
Average Map Cracking
per Segment (%)
Average Vertical
Cracks per Segment
Average Horizontal Cracks per
Segment
1 S01-44044 1983 147 0 4 0 2 B01-66051 1985 251 0 7 0 3 B02-66051 1985 224 2 6 1 4 S04-63101 1988 178 0 3 1 5 S09-63101 1988 175 13 3 2 6 S08-82191 1989 181 0 7 3 7 S04-82022 1993 218 22 9 0 8 S06-82022 1993 218 100 25 4 9 B01-50021 1994 180 100 3 1
10 S24-82022 1996 330 56 13 0 11 S26-82022 1997 298 58 7 0 12 S12-63022 1997 199 6 6 1 13 S27-41064 1997 396 0 4 0 14 S28-41064 1997 396 0 5 0
Table 4-25. Distress of Barriers with South Exposure
No. Bridge ID Construction Year
Average Length
of Barrier Segment (inches)
Average Map Cracking
per Segment (%)
Average Vertical
Cracks per Segment
Average Horizontal Cracks per
Segment
1 S01-44044 1983 141 1 6 1 2 B01-66051 1985 251 0 9 1 3 B02-66051 1985 225 1 9 2 4 S04-63101 1988 181 12 3 2 5 S09-63101 1988 198 4 10 1 6 S08-82191 1989 185 4 5 2 7 S04-82022 1993 217 35 5 2 8 S06-82022 1993 219 30 9 5 9 B01-50021 1994 181 100 13 1
10 S24-82022 1996 330 100 5 1 11 S26-82022 1997 298 60 11 0 12 S12-63022 1997 200 0 5 0 13 S27-41064 1997 396 0 5 0 14 S28-41064 1997 396 0 6 0
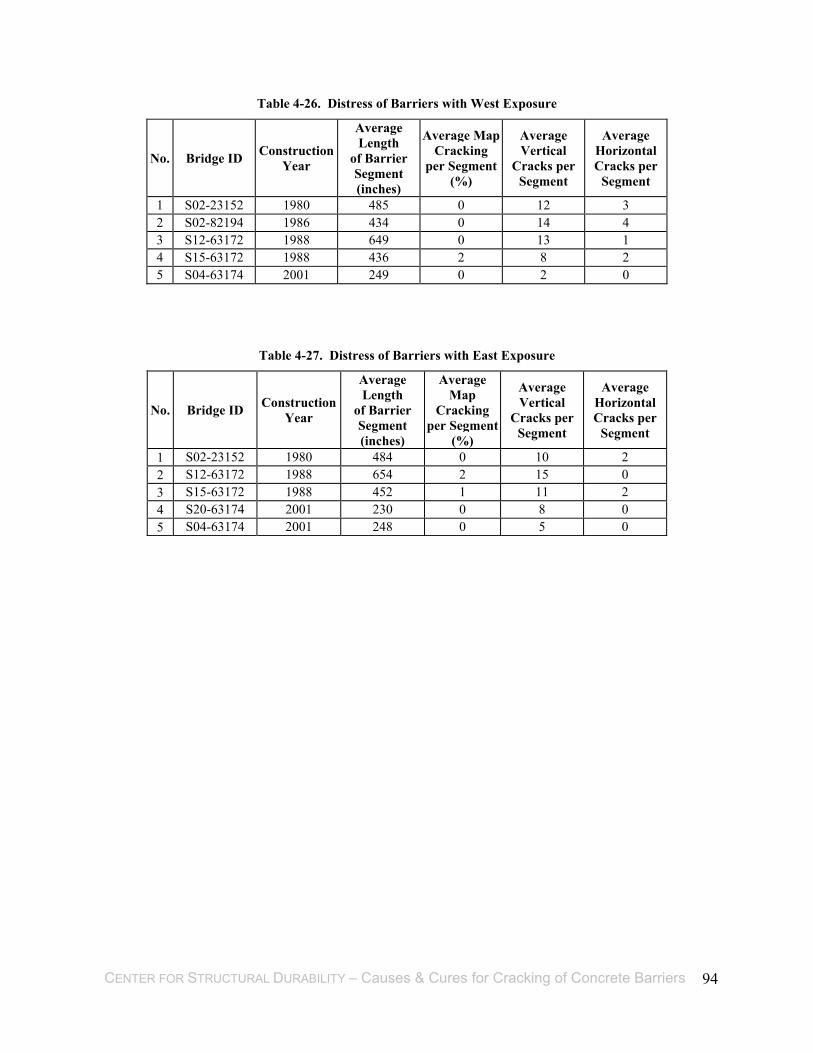
CENTER FOR STRUCTURAL DURABILITY – Causes & Cures for Cracking of Concrete Barriers 94
Table 4-26. Distress of Barriers with West Exposure
No. Bridge ID Construction Year
Average Length
of Barrier Segment (inches)
Average Map Cracking
per Segment (%)
Average Vertical
Cracks per Segment
Average Horizontal Cracks per
Segment
1 S02-23152 1980 485 0 12 3 2 S02-82194 1986 434 0 14 4 3 S12-63172 1988 649 0 13 1 4 S15-63172 1988 436 2 8 2 5 S04-63174 2001 249 0 2 0
Table 4-27. Distress of Barriers with East Exposure
No. Bridge ID Construction Year
Average Length
of Barrier Segment (inches)
Average Map
Cracking per Segment
(%)
Average Vertical
Cracks per Segment
Average Horizontal Cracks per
Segment
1 S02-23152 1980 484 0 10 2 2 S12-63172 1988 654 2 15 0 3 S15-63172 1988 452 1 11 2 4 S20-63174 2001 230 0 8 0 5 S04-63174 2001 248 0 5 0

CENTER FOR STRUCTURAL DURABILITY – Causes & Cures for Cracking of Concrete Barriers 95
Table 4-28. Ratio of Crack Spacing to Barrier Height of Existing Bridge Barriers
Bridge ID
(1)
Year
Constructed
(2)
Average Length ofBarrier Segment
(inches)
(3)
Average Number ofFull-Length Vertical Cracks per Segment
(4)
Crack Spacing/ Barrier Height
(5)
S02-23152 1980 484 5 2
S01-44044 1983 144 1 2
B01-66051 1985 251 2 2
B02-66051 1985 224 1 3
S02-82194 1986 434 6 2
S12-63172 1988 652 5 3
S09-63101 1988 187 1 2
S04-63101 1988 179 1 2
S15-63172 1988 444 3 3
S08-82191 1989 183 1 2
S06-82022 1993 218 1 3
S04-82022 1993 217 2 2
B01-50021 1994 180 2 2
S24-82022 1996 330 3 2
S26-82022 1997 298 4 2
S28-41064 1997 396 2 3
S27-41064 1997 396 3 2
S12-63022 1997 200 1 2
S20-63174 2001 230 2 2
S04-63174 2001 249 1 3

CENTER FOR STRUCTURAL DURABILITY – Causes & Cures for Cracking of Concrete Barriers 96
4.7 CONCLUSIONS
A total of 20 bridges consisting of 155 barrier segments were inspected. Only two bridges were
on a new road section not yet open to traffic. Thirteen bridges out of 20 were on interstate
highways where the average daily traffic ranged from 8,500 to 131,000.
Field inspection data agrees with the findings described in the literature, showing that vertical
cracks are most often the originator of other distress. The full-length vertical crack data
compiled from the inspection data shows that the ratio of crack spacing to barrier height is equal
to two.
Horizontal cracks are classified as either local or continuous. The local and continuous
horizontal cracks were mostly observed on the vertical face, at about the level of the top
longitudinal reinforcement. Barrier surfaces at the intersections of horizontal and vertical cracks
were always in highly distressed condition. This observation was made only on barrier segments
noted to be in poor condition. Concrete was spalling and disintegrating above the horizontal
cracks on portions of barrier segments. Section loss may create a safety hazard due to falling
debris. Hence, the barriers with continuous horizontal cracks require immediate attention.
Exposure of barrier segments is based on the direction of the traffic side of the barrier. Out of
155 inspected barrier segments, 56 segments with a total length of 1,129 ft. were exposed to the
north, 56 segments with a total length of 1,140 ft. were exposed to the south, 21 segments with a
total length of 655 ft. were exposed to the east, and 22 segments with a total length of 805 ft.
were exposed to the west. Data indicated that barriers exposed to north and south directions
show increased map cracking. No relationship was found between the barrier age and the
amount of map cracking. It was also hypothesized that barriers with south exposure will have
increased freeze-thaw cycles, thus more rapid deterioration. The data did not support this
hypothesis.

CENTER FOR STRUCTURAL DURABILITY – Causes & Cures for Cracking of Concrete Barriers 97
5 CONSTRUCTION MONITORING
5.1 CONSTRUCTION SITES
Four bridge reconstruction projects with New Jersey barriers were monitored. Consideration
was given to construction dates and locations, one being a late season project. Formwork and
reinforcement cages were inspected and concrete placement was monitored. Following the
placement day, the barriers were reinspected and the standard specimens prepared during
placement were collected. The list of monitored construction projects is given below in Table
5-1:
Table 5-1. List of Reconstructed Bridges Monitored during Barrier Placement
Bridge ID Location Construction Procedure
S05 of 82191 Vreeland Road over I-75 Form-cast
S06 of 82194 I-75over Fort Street Slipformed
S26 of 50111 I-94 over Metro Parkway Form-cast
S20 of 50111 I-94 over Little Mack Slipformed
5.2 PRE-PLACEMENT OBSERVATIONS
5.2.1 Specification Requirements
The Michigan Department of Transportation - Standard Specifications for Construction
(specbook@2003) was followed as a reference for observations in the field. Specification
requires all structural concrete forms to be mortar tight and sufficiently rigid for concrete
placing, consolidating, and curing. Forms are used to classify the concrete surfaces as exposed
(Type A) and unexposed (Type B). Any defect on a barrier surface due to either plywood or
steel forms is not allowed. In addition, the size, spacing, and dimensions of forms must meet
standard dimensions for Type 4 as described in the MDOT Bridge Design Guide. All dust and
debris is to be removed from the interior of the forms. In order to get proper surface and service

CENTER FOR STRUCTURAL DURABILITY – Causes & Cures for Cracking of Concrete Barriers 98
condition, the condition of the forms is required to be maintained until the concrete has
sufficiently hardened.
Steel reinforcement is to be epoxy-coated and free from dust, rust, and coating damage and
securely tied at all intersections. The Standard Specifications for Construction allows field
bending of epoxy-coated bars as provided in the plans or to correct minor errors or omissions in
shop bending. If epoxy coating becomes damaged during correction or placement, it must be
repaired.
5.2.2 Field Observations
The day before the concrete placement, sites were visited to check the formwork and
reinforcement. Removable forms (steel forms on traffic bearing side and wooden forms on the
other side) were used in form-cast barrier construction. Figure 5-1 shows the barrier and
reinforcement geometry and the specified reinforcement cover for New Jersey Type 4 barriers.
Observations show that the reinforcements were not tied at all intersections as required by the
specifications (Photo 5-1). In general, fabrication of reinforcement appeared satisfactory, yet
some problems with inconsistent cover for the transverse reinforcement were observed (Photo
5-2).
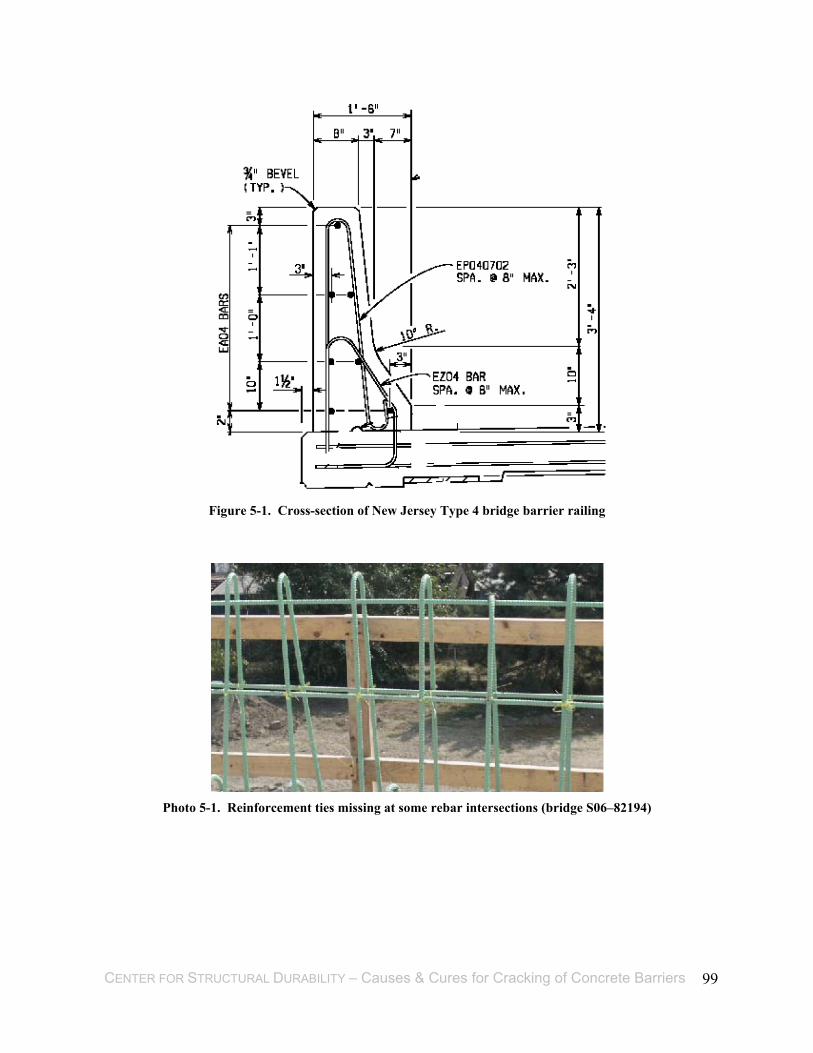
CENTER FOR STRUCTURAL DURABILITY – Causes & Cures for Cracking of Concrete Barriers 99
Figure 5-1. Cross-section of New Jersey Type 4 bridge barrier railing
Photo 5-1. Reinforcement ties missing at some rebar intersections (bridge S06–82194)

CENTER FOR STRUCTURAL DURABILITY – Causes & Cures for Cracking of Concrete Barriers 100
Photo 5-2. Formwork of barriers of bridge S05–82191
(Note that rebar cover is inconsistent and almost touching the traffic side forms)
5.3 PLACEMENT OBSERVATIONS
5.3.1 Specification Requirements
In the MDOT Standard Specifications for Construction, a slipforming procedure is not described.
However, there is a definition for machine finishing. Specification requires a test run to adjust
the finishing position of the paver, deflections, and to measure the depth of concrete cover. All
necessary corrections are to be made before concrete placement.
The specification indicates that in form-cast barrier construction, form bracings that are
temporarily placed into the cross-section of members must be removed before concrete sets.
Mechanical high-frequency internal vibration is suggested for consolidation of structural
concrete. In using a vibrator, a rubber-coated apparatus must be used to avoid damage to epoxy
coated bars. The duration of vibration is required to be adequate to consolidate the concrete, but
not to cause segregation. The vibration is to be applied no further apart than twice the radius
over which the vibration is visibly effective, and spaced uniformly. Vibration is required to be
directly applied to concrete, rather than to forms and reinforcement.
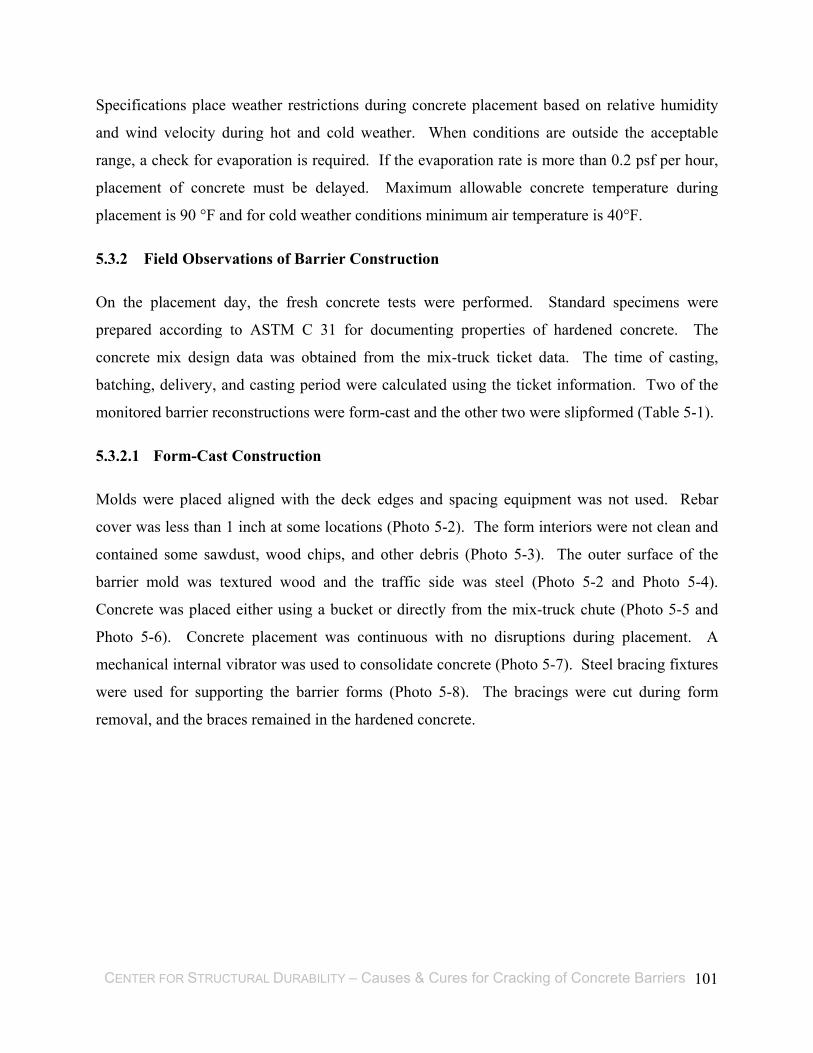
CENTER FOR STRUCTURAL DURABILITY – Causes & Cures for Cracking of Concrete Barriers 101
Specifications place weather restrictions during concrete placement based on relative humidity
and wind velocity during hot and cold weather. When conditions are outside the acceptable
range, a check for evaporation is required. If the evaporation rate is more than 0.2 psf per hour,
placement of concrete must be delayed. Maximum allowable concrete temperature during
placement is 90 °F and for cold weather conditions minimum air temperature is 40°F.
5.3.2 Field Observations of Barrier Construction
On the placement day, the fresh concrete tests were performed. Standard specimens were
prepared according to ASTM C 31 for documenting properties of hardened concrete. The
concrete mix design data was obtained from the mix-truck ticket data. The time of casting,
batching, delivery, and casting period were calculated using the ticket information. Two of the
monitored barrier reconstructions were form-cast and the other two were slipformed (Table 5-1).
5.3.2.1 Form-Cast Construction
Molds were placed aligned with the deck edges and spacing equipment was not used. Rebar
cover was less than 1 inch at some locations (Photo 5-2). The form interiors were not clean and
contained some sawdust, wood chips, and other debris (Photo 5-3). The outer surface of the
barrier mold was textured wood and the traffic side was steel (Photo 5-2 and Photo 5-4).
Concrete was placed either using a bucket or directly from the mix-truck chute (Photo 5-5 and
Photo 5-6). Concrete placement was continuous with no disruptions during placement. A
mechanical internal vibrator was used to consolidate concrete (Photo 5-7). Steel bracing fixtures
were used for supporting the barrier forms (Photo 5-8). The bracings were cut during form
removal, and the braces remained in the hardened concrete.

CENTER FOR STRUCTURAL DURABILITY – Causes & Cures for Cracking of Concrete Barriers 102
Photo 5-3. Debris inside the forms (S05–82191)
Photo 5-4. Steel molds on the traffic side (S05-82191)
Traffic side of the barrier

CENTER FOR STRUCTURAL DURABILITY – Causes & Cures for Cracking of Concrete Barriers 103
Photo 5-5. Concrete placement with bucket (S05-82191)
Photo 5-6. Concrete placement directly from mix-truck (S20-50111)
Photo 5-7. Concrete consolidation using vibrator (S20-50111)
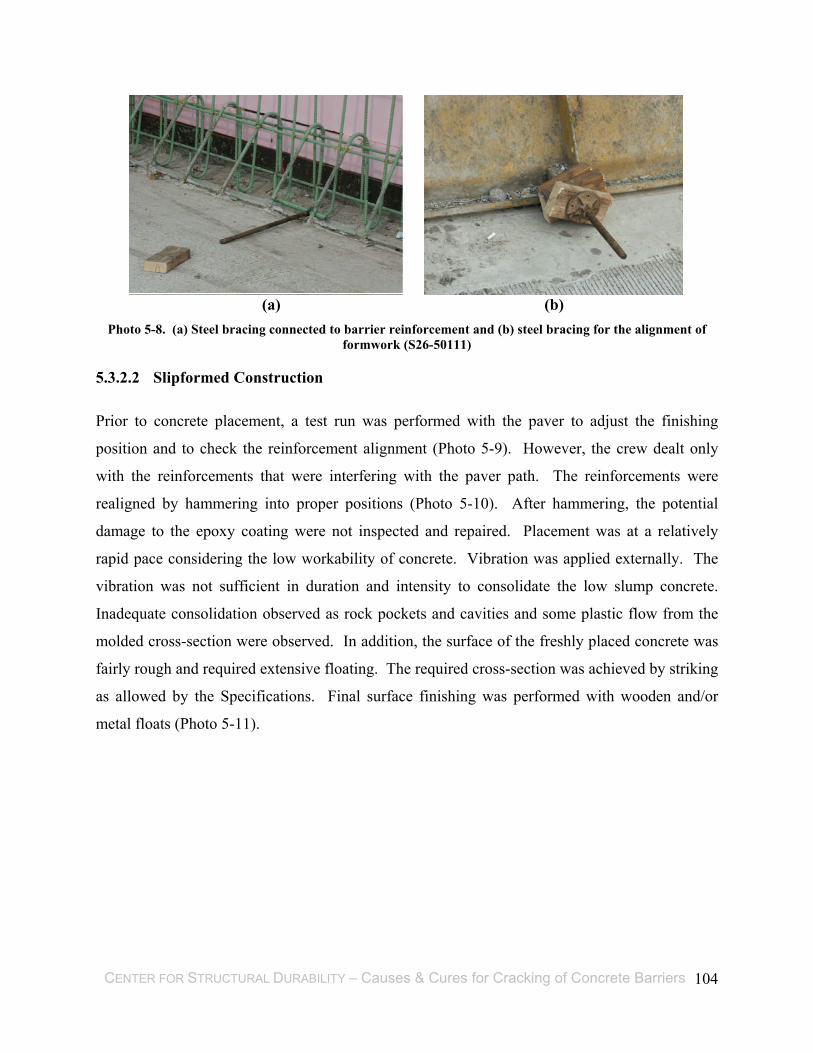
CENTER FOR STRUCTURAL DURABILITY – Causes & Cures for Cracking of Concrete Barriers 104
(a)
(b)
Photo 5-8. (a) Steel bracing connected to barrier reinforcement and (b) steel bracing for the alignment of formwork (S26-50111)
5.3.2.2 Slipformed Construction
Prior to concrete placement, a test run was performed with the paver to adjust the finishing
position and to check the reinforcement alignment (Photo 5-9). However, the crew dealt only
with the reinforcements that were interfering with the paver path. The reinforcements were
realigned by hammering into proper positions (Photo 5-10). After hammering, the potential
damage to the epoxy coating were not inspected and repaired. Placement was at a relatively
rapid pace considering the low workability of concrete. Vibration was applied externally. The
vibration was not sufficient in duration and intensity to consolidate the low slump concrete.
Inadequate consolidation observed as rock pockets and cavities and some plastic flow from the
molded cross-section were observed. In addition, the surface of the freshly placed concrete was
fairly rough and required extensive floating. The required cross-section was achieved by striking
as allowed by the Specifications. Final surface finishing was performed with wooden and/or
metal floats (Photo 5-11).

CENTER FOR STRUCTURAL DURABILITY – Causes & Cures for Cracking of Concrete Barriers 105
Photo 5-9. Test run of the paver (S06-82194)
Photo 5-10. Realigning rebars by hammering (S06-82194)
Photo 5-11. Surface finishing of slipformed barriers (S06-82194)
CENTER FOR STRUCTURAL DURABILITY – Causes & Cures for Cracking of Concrete Barriers 106
5.3.3 Curing of Concrete
Specifications only require wet curing of bridge decks. According to specifications, vertical
forms must be left in place for at least 15 hours following the completion of concrete placement.
The concrete must be cured upon form removal. If the air temperature is below 40 °F, then the
low temperature concrete protection procedure is required. If the air temperature is over 40°F,
then curing compound should be applied immediately upon completion of concrete finishing.
The curing compound (ASTM C 309 Type 2) is applied in two coats. The second coat should be
applied within two hours (if the first coat has sufficiently dried) after the first coat. For barriers,
curing compound can be applied using a brush, roller or sprayer. The curing compound must
form a continuous uniform film without running or sagging. Prior to the application of curing
compound, all surface defects (honeycombs, broken corners, cavities, etc.) and all holes more
than ¾ inch in diameter must be repaired with mortar.
5.3.4 Curing of Concrete - Field Observations
5.3.4.1 Form-Cast Construction
Forms were removed approximately 18 hours upon concrete placement, even for the late season
placement. The surface defects were repaired with a mortar (Photo 5-12). Repair was only
performed on the traffic side surface of barrier in order to satisfy MDOT exposed surface
regulations. Close inspection of the barrier did not show any vertical, horizontal, map or local
cracking upon form removal. The control joints were saw-cut on the traffic side of the barrier
(Photo 5-13). Curing compound was not applied anytime during the day after the form removal
(Photo 5-14); at that time concrete was exposed to very hot summer temperatures.
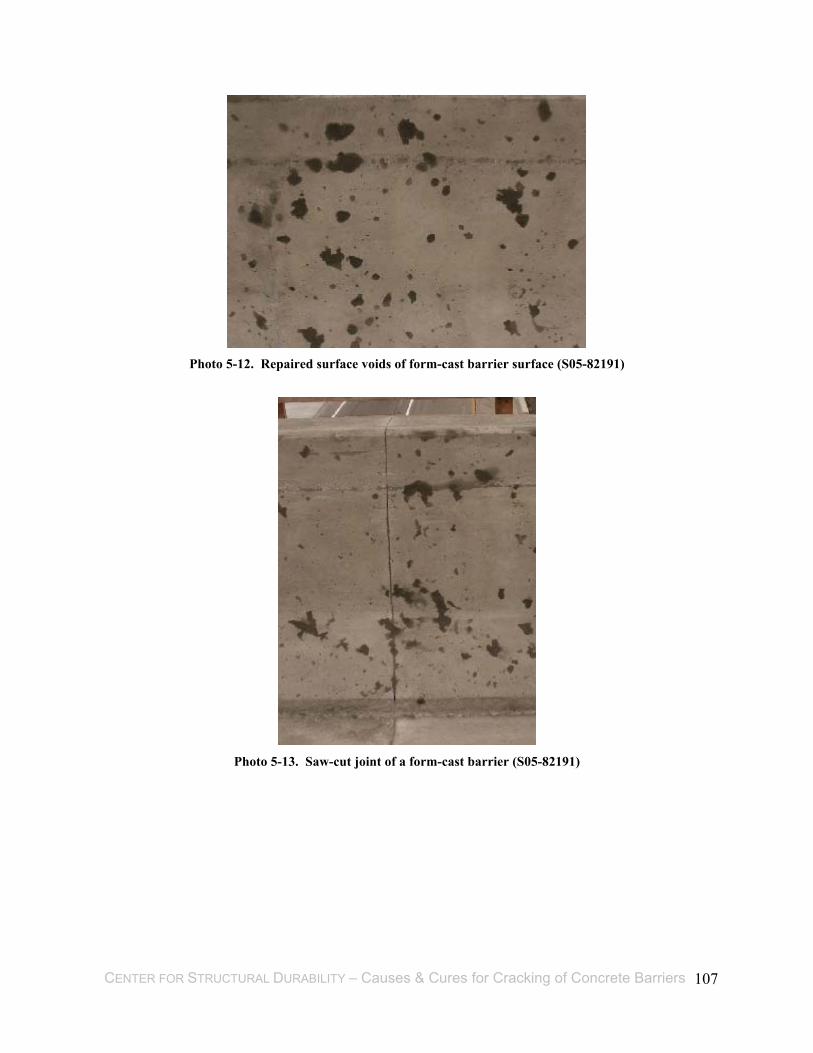
CENTER FOR STRUCTURAL DURABILITY – Causes & Cures for Cracking of Concrete Barriers 107
Photo 5-12. Repaired surface voids of form-cast barrier surface (S05-82191)
Photo 5-13. Saw-cut joint of a form-cast barrier (S05-82191)
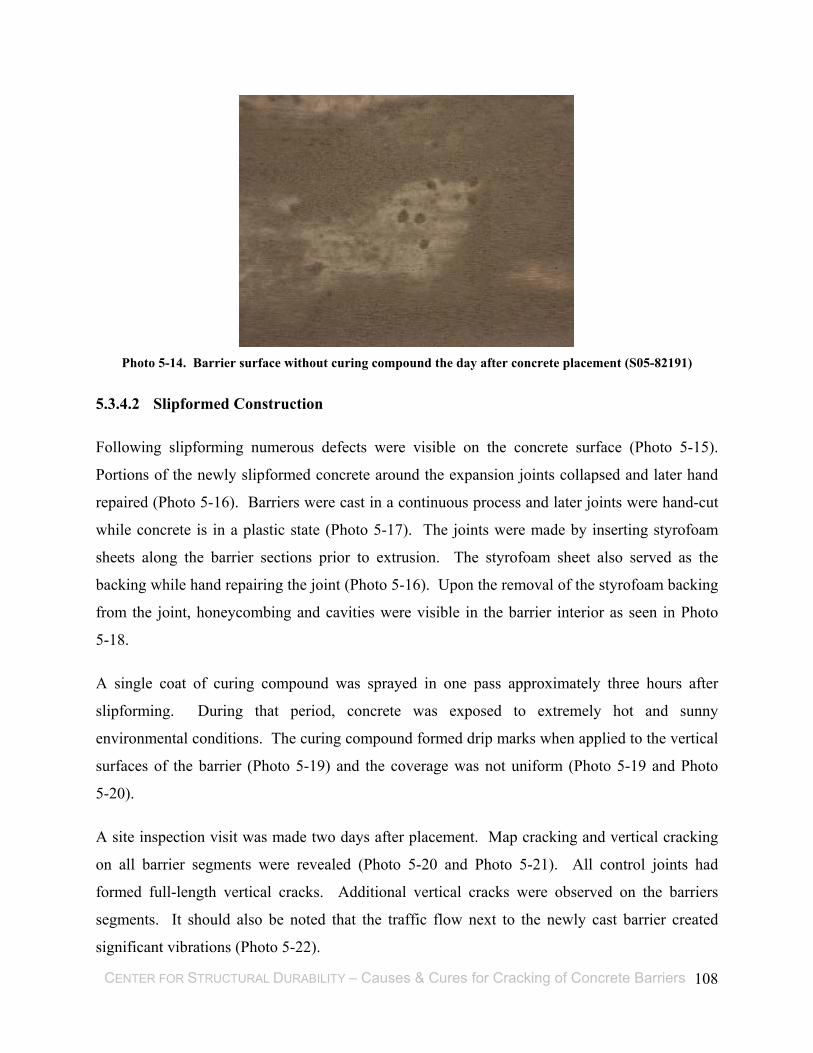
CENTER FOR STRUCTURAL DURABILITY – Causes & Cures for Cracking of Concrete Barriers 108
Photo 5-14. Barrier surface without curing compound the day after concrete placement (S05-82191)
5.3.4.2 Slipformed Construction
Following slipforming numerous defects were visible on the concrete surface (Photo 5-15).
Portions of the newly slipformed concrete around the expansion joints collapsed and later hand
repaired (Photo 5-16). Barriers were cast in a continuous process and later joints were hand-cut
while concrete is in a plastic state (Photo 5-17). The joints were made by inserting styrofoam
sheets along the barrier sections prior to extrusion. The styrofoam sheet also served as the
backing while hand repairing the joint (Photo 5-16). Upon the removal of the styrofoam backing
from the joint, honeycombing and cavities were visible in the barrier interior as seen in Photo
5-18.
A single coat of curing compound was sprayed in one pass approximately three hours after
slipforming. During that period, concrete was exposed to extremely hot and sunny
environmental conditions. The curing compound formed drip marks when applied to the vertical
surfaces of the barrier (Photo 5-19) and the coverage was not uniform (Photo 5-19 and Photo
5-20).
A site inspection visit was made two days after placement. Map cracking and vertical cracking
on all barrier segments were revealed (Photo 5-20 and Photo 5-21). All control joints had
formed full-length vertical cracks. Additional vertical cracks were observed on the barriers
segments. It should also be noted that the traffic flow next to the newly cast barrier created
significant vibrations (Photo 5-22).
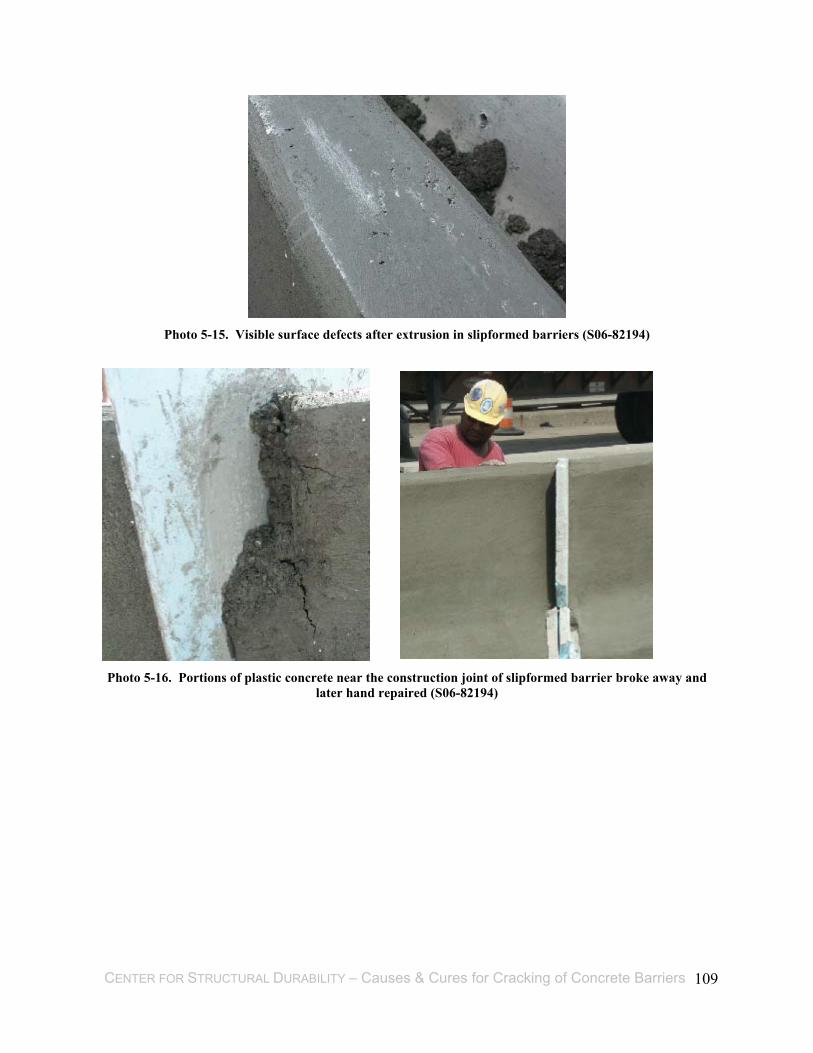
CENTER FOR STRUCTURAL DURABILITY – Causes & Cures for Cracking of Concrete Barriers 109
Photo 5-15. Visible surface defects after extrusion in slipformed barriers (S06-82194)
Photo 5-16. Portions of plastic concrete near the construction joint of slipformed barrier broke away and
later hand repaired (S06-82194)
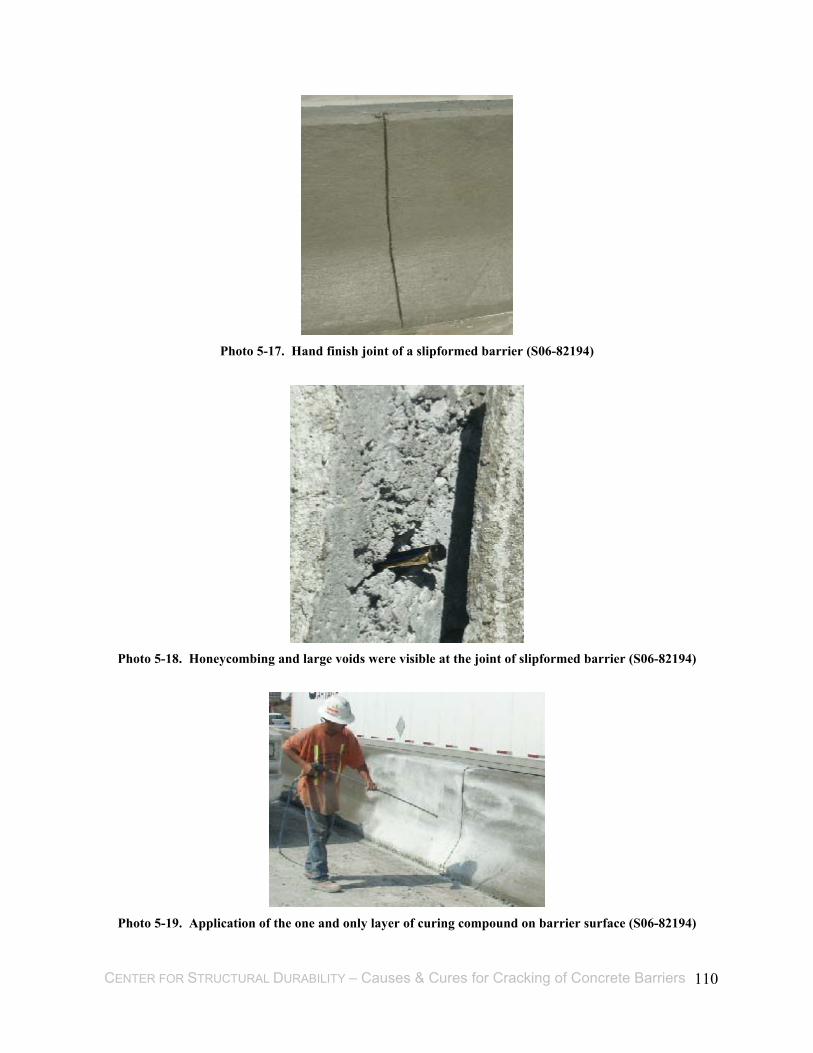
CENTER FOR STRUCTURAL DURABILITY – Causes & Cures for Cracking of Concrete Barriers 110
Photo 5-17. Hand finish joint of a slipformed barrier (S06-82194)
Photo 5-18. Honeycombing and large voids were visible at the joint of slipformed barrier (S06-82194)
Photo 5-19. Application of the one and only layer of curing compound on barrier surface (S06-82194)

CENTER FOR STRUCTURAL DURABILITY – Causes & Cures for Cracking of Concrete Barriers 111
Photo 5-20. Map cracking of barrier surface observed 48 hours after slipforming (S06-82194)
(Note: absence of curing compound)
Photo 5-21. Full-length vertical crack on the barrier observed 48 hours after slipforming (S06-82194)
(Note: the lack of curing compound on barrier surface)
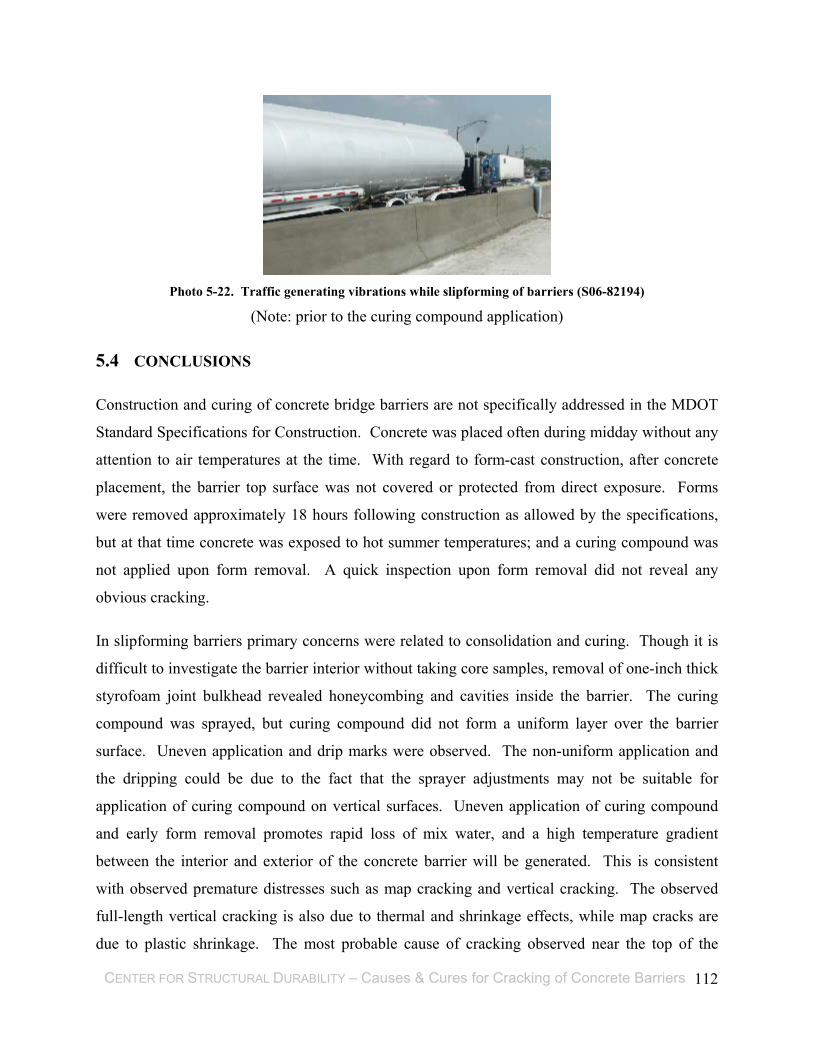
CENTER FOR STRUCTURAL DURABILITY – Causes & Cures for Cracking of Concrete Barriers 112
Photo 5-22. Traffic generating vibrations while slipforming of barriers (S06-82194)
(Note: prior to the curing compound application)
5.4 CONCLUSIONS
Construction and curing of concrete bridge barriers are not specifically addressed in the MDOT
Standard Specifications for Construction. Concrete was placed often during midday without any
attention to air temperatures at the time. With regard to form-cast construction, after concrete
placement, the barrier top surface was not covered or protected from direct exposure. Forms
were removed approximately 18 hours following construction as allowed by the specifications,
but at that time concrete was exposed to hot summer temperatures; and a curing compound was
not applied upon form removal. A quick inspection upon form removal did not reveal any
obvious cracking.
In slipforming barriers primary concerns were related to consolidation and curing. Though it is
difficult to investigate the barrier interior without taking core samples, removal of one-inch thick
styrofoam joint bulkhead revealed honeycombing and cavities inside the barrier. The curing
compound was sprayed, but curing compound did not form a uniform layer over the barrier
surface. Uneven application and drip marks were observed. The non-uniform application and
the dripping could be due to the fact that the sprayer adjustments may not be suitable for
application of curing compound on vertical surfaces. Uneven application of curing compound
and early form removal promotes rapid loss of mix water, and a high temperature gradient
between the interior and exterior of the concrete barrier will be generated. This is consistent
with observed premature distresses such as map cracking and vertical cracking. The observed
full-length vertical cracking is also due to thermal and shrinkage effects, while map cracks are
due to plastic shrinkage. The most probable cause of cracking observed near the top of the

CENTER FOR STRUCTURAL DURABILITY – Causes & Cures for Cracking of Concrete Barriers 113
barrier is perhaps due to the plastic settlement of insufficiently consolidated concrete. Vibration
generated by the traffic adjacent to the newly cast barriers could contribute to the settlement of
plastic concrete. Based on overall observations, the following conclusions are made with respect
to construction practices:
1. The MDOT Standard Specifications for Construction should clearly address barrier
construction.
2. Bridge barriers should receive the same attention as other structural components in terms
of construction and curing practices (e.g., night casting is the practice for bridge decks in
summer but on the same bridge deck barriers are cast during daytime; wet curing is
required for bridge decks but only curing compound is for bridge barriers).
3. In order to continue the use of slipforming, consolidation and curing practices should be
improved.
4. In form-cast construction, forms should be kept in place for a minimum of 3 days and
curing compound should be applied to the exposed top surface immediately upon
placement.
5. Curing compound should be applied immediately following form removal with a roller or
brush (not with the sprayer as allowed by the specifications).
6. Traffic flow next to the newly cast barriers can be isolated otherwise reduced speed can
be imposed until concrete gains sufficient strength.

CENTER FOR STRUCTURAL DURABILITY – Causes & Cures for Cracking of Concrete Barriers 114
6 LABORATORY TESTING
6.1 OVERVIEW
The concrete specimens tested consisted of 6-inch and 4-inch diameter standard cylindrical
specimens prepared during construction and 4-inch diameter specimens of various lengths cored
from existing barriers. Mechanical and other physical properties related to concrete durability
are obtained through several standard tests.
Mechanical properties of concrete are obtained from compressive strength and elasticity modulus
tests in accordance with ASTM C 39 and ASTM C 469, respectively. The compressive strength
test is the most common test performed on hardened concrete. There is a strong correlation
between the durability properties of concrete and its compressive strength. This test is used to
document material performance and can help to establish the mixture proportion to attain the
required strength. The strength test is performed on standard cylinder specimens made from
concrete in the field. Elasticity modulus and Poisson’s ratio tests provide a value for stress to
strain proportionality and a ratio of lateral to longitudinal strain for hardened concrete most
commonly at 28 days. The modulus of elasticity and Poisson’s ratio values are applicable in
stress ranges from 0 to 40% of the ultimate concrete strength. Elasticity modulus is needed for
computing the stress from intrinsic strains. In addition, by conducting compressive strength,
elasticity modulus, and Poisson’s ratio tests at different ages of concrete, the change in
mechanical properties with respect to time is established.
The ultrasonic pulse velocity (UPV) test measures the velocity of stress waves propagating
through the concrete specimen. The pulse velocity of stress waves in concrete is related to its
elastic properties and density. This test method is often used to evaluate the uniformity and
relative quality of concrete and to indicate the presence of voids and cracks. It may also be used
as evidence to the changes in concrete properties. The elasticity modulus can be calculated from
measured ultrasonic pulse velocity. This test is performed in compliance with ASTM C 597.
The rapid chloride permeability test (RCPT) is performed in accordance with ASTM C 1202.
This test is useful in determining the electrical conductance of concrete and provides an

CENTER FOR STRUCTURAL DURABILITY – Causes & Cures for Cracking of Concrete Barriers 115
indication of its resistance to penetration of chloride ions. The absorption and air permeability
tests are performed in developing the data required for determining the volume of permeable
voids and limits of absorption. Concrete with large or many permeable voids is not desirable due
to its lack of ability to protect itself from environmental attacks (i.e. chloride ion penetration);
therefore, it is ideal to obtain a low pore-volume ratio for quality concrete. The absorption test is
performed in compliance with ASTM C 642. The air-permeability test is performed using an
apparatus not yet standardized by ASTM.
The rapid chloride permeability, absorption, gas and water permeability, and ultrasonic pulse
velocity tests were performed on the standard specimens made during construction and the core
specimens obtained from existing barriers.
6.1.1 Standard Specimens Prepared during Construction
A comprehensive list, which enumerates the tests performed on the standard cylinder specimens
and the required number of samples, is given in Table 6-1. Compressive strength, elasticity
modulus, Poisson’s ratio, rapid chloride permeability test (RCPT), ultrasonic pulse velocity
(UPV), air-permeability, and absorption tests were conducted and the test results are shown in
Table 6-2, Table 6-3, Table 6-4, Table 6-5, Table 6-6, Table 6-7, and Table 6-8, respectively.
Table 6-1. The Conducted Tests and Required Number of Standard Specimens
Test Days Tests Type of
SpecimenNumber of Specimens 3 7 28 56 90
Total Number of Specimens
Compressive Strength (ASTM – C 39) 6 x 12 in 4 x x x x x 20
Modulus of Elasticity (ASTM – C 469) 6 x 12 in 4 2 2 x x x 12
UPV (ASTM – C 597) 4 x 8 in 12 x x x x x 12
Air-Permeability 4 x 2 in 4 x x x 12
RCPT (ASTM – C 1202) 4 x 2 in 4 x x x 12
Absorption (ASTM –C 642) 4 x 2 in 4 x x x 12

CENTER FOR STRUCTURAL DURABILITY – Causes & Cures for Cracking of Concrete Barriers 116
6.1.2 Core Specimens from Existing Barriers
The core samples were obtained from a limited number of barriers. All cored specimens were
first processed in the laboratory by cleaning, documenting the state, taking measurements, and
photologging. Two core samples from each bridge were taken to Michigan Technological
University for petrographic and microstructural investigations. Remaining core specimens were
tested for ultrasonic pulse velocity (UPV), air-permeability, rapid chloride penetration (RCPT),
and absorption. Test results are shown in Table 6-9, Table 6-10, Table 6-11, and Table 6-12.
6.1.3 Test Procedures for Standard Specimens Prepared during Construction
Standard specimens (minimum thirty two 6-in.x12-in. and twenty four 4-in.x 8-in.) were
prepared during the placement of barrier concrete for laboratory testing (Table 6-1). The
specimens remained undisturbed at the site for 24 hours before transporting to the lab.
Specimens were labeled, cataloged, and wet cured in 70oF water bath for 28 days. The
specimens were kept in ambient laboratory air after the 28th day. Compressive strength, modulus
of elasticity, Poisson’s ratio, and ultrasonic pulse velocity tests were conducted at the ages of 3,
7, 28, 56, and 90 days. Rapid chloride permeability (RCPT), absorption, and air-permeability
tests were conducted at the ages of 28, 56, and 90 days. The laboratory data sheets are presented
in Appendix B.
6.1.4 Test Procedures for Core Specimens
The petrographic test procedures are described in the report titled, “Causes and Cures for
Cracking of Concrete Barriers” by Van Dam et al. (2003). Remaining cores were labeled,
cataloged, and visually inspected. The qualitative observations made during this inspection
helped to provide an overall assessment of the concrete. Core samples were photologged for
later reference.
Core samples were prepared for UPV, RCPT, air-permeability, and absorption tests. The broken
portions of the specimens were reattached with epoxy. Sample ends were saw cut to form
straight polished ends. After the UPV test, core samples were again saw cut into two-inch thick
portions for air-permeability, RCPT, and absorption tests.

CENTER FOR STRUCTURAL DURABILITY – Causes & Cures for Cracking of Concrete Barriers 117
6.2 TEST RESULTS
6.2.1 Standard Specimens Prepared during Construction
Table 6-2, Table 6-3, and Table 6-4 show mean values and coefficient of variance for
compressive strength, elasticity modulus, and Poisson’s ratio, respectively. RCPT, UPV, air
permeability, and absorption test results are given in Table 6-5, Table 6-6, Table 6-7, and Table
6-8, respectively.
All the tests were conducted according to ASTM Standards with the exception of the air
permeability test. These Standards are given in Table 6-1.

CENTER FOR STRUCTURAL DURABILITY – Causes & Cures for Cracking of Concrete Barriers 118
Table 6-2. Compressive Strength Test Results of Standard Specimens
Compressive Strength (psi) Bridge ID
f'c,3 COV (%) f'c,7 COV (%) f'c,28 COV (%) f'c,56 COV (%) f'c,90 COV (%)S05 of 82191 3685 2.9 4160 4.9 4740 1.0 - - 5795 3.5 S06 of 82194 2603 0.8 2893 2.9 3380 3.4 4098 4.1 4097 4.3 S26 of 50111 - - - - 6473 1.8 7670 2.6 7920 1.3 S20 of 50111 - - 5775 -* 7063 2.0 8338 2.4 8931 0.2
- Missing data -* -Only two readings are available
Table 6-3. Modulus of Elasticity Results of Standard Specimens
Modulus of Elasticity (ksi) Bridge ID
E,3 COV (%) E,7 COV (%) E,28 COV (%) E,56 COV (%) E,90 COV (%)S05 of 82191 5209 -* 5267 -* 5132 -** - - 4928 0.4 S06 of 82194 4131 -* 4241 -* 4520 3.9 4174 4.5 3841 2.4 S26 of 50111 - -* - -* 4967 1.6 4793 1.3 4755 2.1 S20 of 50111 - -* - -* 5418 3.4 5386 1.6 5257 1.5
- Missing data -* - Only two readings are available -** - Only three readings are available

CENTER FOR STRUCTURAL DURABILITY – Causes & Cures for Cracking of Concrete Barriers 119
Table 6-4. Poisson’s Ratio Test Results of Standard Specimens
Poisson's Ratio Bridge ID
ν,3 COV (%) ν,7 COV (%) ν,28 COV (%) ν,56 COV (%) ν,90 COV (%)S05 of 82191 0.25 -* 0.25 -* 0.24 -** - - 0.24 2.0 S06 of 82194 0.24 -* 0.24 -* 0.24 4.4 0.24 4.7 0.22 5.5 S26 of 50111 - -* - -* 0.25 1.7 0.26 8.0 0.24 4.7 S20 of 50111 - -* - -* 0.25 0.1 0.24 3.8 0.25 2.7
- Missing data -* - Only two readings are available -** - Only three readings are available

CENTER FOR STRUCTURAL DURABILITY – Causes & Cures for Cracking of Concrete Barriers 120
Table 6-5. RCPT Test Results of Standard Specimens
RCPT (Coulombs) Bridge ID Test Age
(days) #1 #2 #3 #4 Mean
COV (%)
28 4830 4670 5700 4765 4994 10 56 4770 4370 4940 3700 4445 12 S05 of 82191
90 5380 9720 8470 6340 7478 26
28 3880 3290 3350 3460 3495 8 56 - 7520 7020 - 7270 - S06 of 82194
90 - - - - - -
28 - 9220 - - - - 56 - - - - - - S26 of 50111
90 8130 5850 6410 6780 6790 14
28 - 10660 - - - - 56 5485 5955 6210 5740 5850 5 S20 of 50111
90 7700 7020 7800 6380 7230 9
28 - - - - - - 56 5390 9080 7700 7630 7440 21 S05 of 82025
90 6500 6730 9930 7190 7590 21 - Missing data
Table 6-6. UPV Test Results of Standard Specimens
UPV Speed (in/sec) Bridge ID
3 Days 7 Days 28 Days 56 Days 90 Days
S05 of 82191 - - 194,000 196,000 196,000
S06 of 82194 - 190,000 195,000 196,000 196,000
S26 of 50111 184,000 187,000 190,000 194,000 193,000
S20 of 50111 186,000 190,000 193,000 197,000 197,000 - Missing data

CENTER FOR STRUCTURAL DURABILITY – Causes & Cures for Cracking of Concrete Barriers 121
Table 6-7. Air-Permeability Test Results of Standard Specimens
Intrinsic Gas Permeability (in2) 10-13
Bridge ID Test Age (Day) #1 #2 #3 #4 Mean
COV (%)
28 3.4 3.1 2.3 2.9 2.9 15.5
56 3.1 3.3 3.1 3.6 3.3 6.7 S05 of 82191
90 7.3 8.5 6.7 7.0 7.4 11.0
28 1.6 4.7 2.2 1.7 2.5 57.4
56 - 4.3 3.1 1.9 3.1 - S06 of 82194
90 4.3 7.3 10.7 2.2 6.1 60.4
28 2.6 2.9 3.7 2.8 3.0 16.0
56 11.3 8.8 8.5 9.8 9.6 13.0 S26 of 50111
90 7.8 9.8 9.6 10.5 9.4 12.6
28 - 2.9 3.6 2.5 3.0 -
56 4.8 4.5 - - 4.7 - S20 of 50111
90 11.0 5.4 3.9 2.9 5.8 62.1 - Missing data
Table 6-8. Absorption Test Results of Standard Specimens
Volume of Permeable Pore Space (Voids), % Bridge ID
28 day COV (%) 56 day COV (%) 90 day COV (%)S05 of 82191 11.5 4.2 12.3 2.3 12.9 4.9 S06 of 82194 11.4 4.8 12.8 3.1 13.6 4.3 S26 of 50111 11.9 8.8 11.8 5.8 13.1 4.0 S20 of 50111 11.4 2.2 12.2 2.9 8.8 8.8

CENTER FOR STRUCTURAL DURABILITY – Causes & Cures for Cracking of Concrete Barriers 122
6.2.2 Core Specimens
The tests performed on core specimens were rapid chloride permeability, ultrasonic pulse
velocity, air permeability, and absorption. The results of these tests are given in Table 6-9, Table
6-10, Table 6-11, and Table 6-12, respectively.
The petrographic test results and microstructural observations are described in the report titled,
“Causes and Cures for Cracking of Concrete Barriers” by Van Dam et al. (2003).
Table 6-9. RCPT Test Results of Core Specimens
RCPT (Coulombs) Bridge ID
#1 #2 #3 #4 Mean COV (%)
S02 of 23152 - - - - - -
S01 of 44044 2010 1760 5075 2760 2900 52
S12-1 of 63172 1490 1150 1375 1320 1335 11
S04-4 of 82022 3030 2020 2750 3120 2730 18
S04-2 of 63174 5080 5010 3930 5150 4790 12 - Missing data
Table 6-10. UPV Test Results of Core Specimens
UPV Speed (in/sec) Bridge ID
Mean COV (%)
S02 of 23152 188,000 3.6
S01 of 44044 189,000 3.5
S12-1 of 63172 193,000 12.7
S15 of 63172 193,000 5.3
S04-4 of 82022 185,000 2.3
S06 of 82022 190,000 1.7
S04-2 of 63174 182,000 2.4
S20-1 of 63174 178,000 1.8
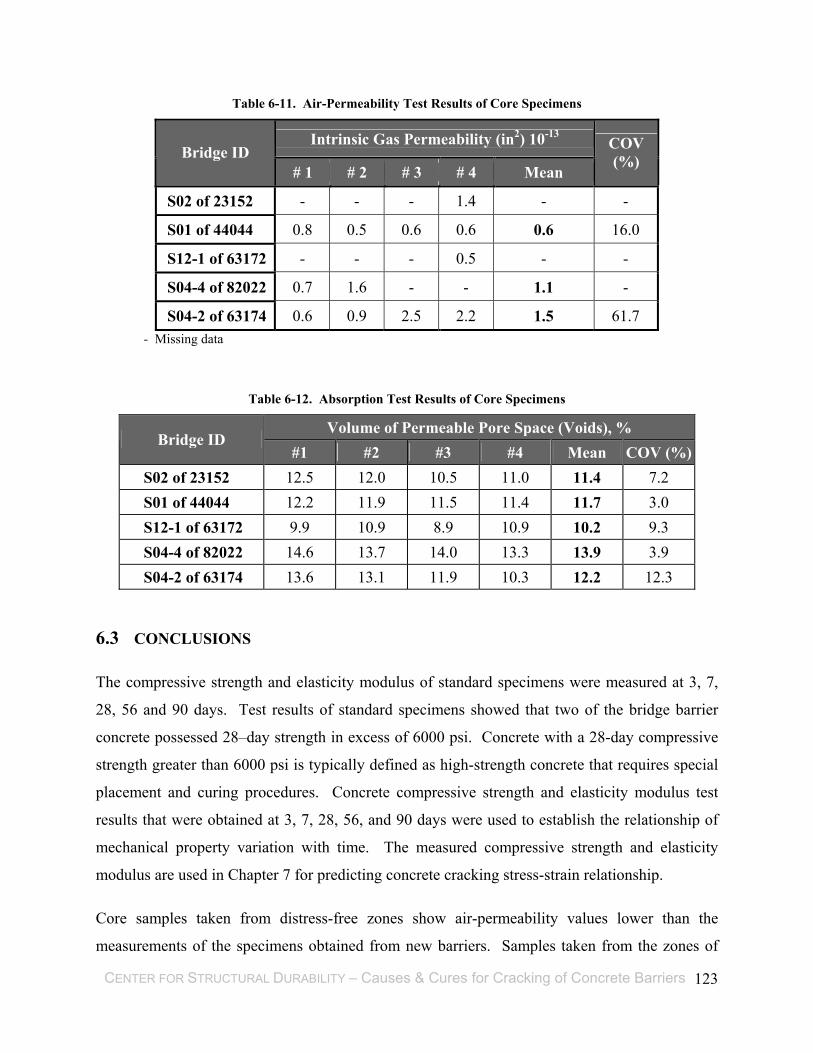
CENTER FOR STRUCTURAL DURABILITY – Causes & Cures for Cracking of Concrete Barriers 123
Table 6-11. Air-Permeability Test Results of Core Specimens
Intrinsic Gas Permeability (in2) 10-13 Bridge ID
# 1 # 2 # 3 # 4 Mean
COV (%)
S02 of 23152 - - - 1.4 - -
S01 of 44044 0.8 0.5 0.6 0.6 0.6 16.0
S12-1 of 63172 - - - 0.5 - -
S04-4 of 82022 0.7 1.6 - - 1.1 -
S04-2 of 63174 0.6 0.9 2.5 2.2 1.5 61.7 - Missing data
Table 6-12. Absorption Test Results of Core Specimens
Volume of Permeable Pore Space (Voids), % Bridge ID
#1 #2 #3 #4 Mean COV (%)S02 of 23152 12.5 12.0 10.5 11.0 11.4 7.2 S01 of 44044 12.2 11.9 11.5 11.4 11.7 3.0 S12-1 of 63172 9.9 10.9 8.9 10.9 10.2 9.3 S04-4 of 82022 14.6 13.7 14.0 13.3 13.9 3.9 S04-2 of 63174 13.6 13.1 11.9 10.3 12.2 12.3
6.3 CONCLUSIONS
The compressive strength and elasticity modulus of standard specimens were measured at 3, 7,
28, 56 and 90 days. Test results of standard specimens showed that two of the bridge barrier
concrete possessed 28–day strength in excess of 6000 psi. Concrete with a 28-day compressive
strength greater than 6000 psi is typically defined as high-strength concrete that requires special
placement and curing procedures. Concrete compressive strength and elasticity modulus test
results that were obtained at 3, 7, 28, 56, and 90 days were used to establish the relationship of
mechanical property variation with time. The measured compressive strength and elasticity
modulus are used in Chapter 7 for predicting concrete cracking stress-strain relationship.
Core samples taken from distress-free zones show air-permeability values lower than the
measurements of the specimens obtained from new barriers. Samples taken from the zones of

CENTER FOR STRUCTURAL DURABILITY – Causes & Cures for Cracking of Concrete Barriers 124
distress displayed excessive leakage that resulted in the out of bound results. The existence of
cracks and large voids triggered the leakage. The permeable pore volume measured from the
absorption test does not reveal any significant difference between cores and standard samples.
UPV measurements on the cores and standard specimens also show similar results. The
Coulomb values measured on standard specimens are significantly higher than that of core
specimens. The lack of correlation of test results indicates that there is a significant variation in
concrete properties obtained from cores and standard specimens as well as within the same
bridge barrier.
CENTER FOR STRUCTURAL DURABILITY – Causes & Cures for Cracking of Concrete Barriers 125
7 PARAMETERS INFLUENCING BARRIER CRACKING
7.1 OVERVIEW
Field inspections on the condition of New Jersey Type 4 barriers on 20 selected bridges were
appraised by field inspection. These barriers were selected to represent a well-distributed sample
with ages of up to 22 years for the purposes of identifying the primary distress forms and their
progression. Also, newly slipformed barriers of bridge S06-82194 were inspected two days after
placement. The inspection data analysis results agree with the findings of the literature review;
rapid barrier deterioration is initiated by early-age vertical cracking. Analysis of the inspection
data showed that the average full-length vertical crack spacing of barriers is twice the barrier
height.
The findings so far indicate that the deterioration of concrete barriers starts with vertical cracking
which provides access to deteriorating agents into the concrete interior. The rate of barrier
deterioration is a function of concrete consolidation and in general, overall concrete and
construction quality. Barrier concrete deterioration rate is the lowest in well consolidated and
well cured concrete with the proportions and aggregate quality specified by MDOT Standard
Specifications.
Literature review and construction monitoring reveled that there are a limited number of factors
that influence early-age cracking of reinforced concrete bridge barriers. The major parameter is
the volume change due to shrinkage and thermal loads combined with the base restraint at the
deck-barrier interface. As discussed in the previous chapters, vertical cracking that initiates due
to volume change is the primary cause of other distress types. Reduction, control, or prevention
of vertical cracking will improve barrier service life.
Shrinkage and thermal loads are inherent to concrete construction. Cement hydration is an
exothermic process that generates heat and consequently a temperature difference between the
concrete mass and the ambient air. As discussed in Chapter 2, several factors control the heat
magnitude that develops within the concrete mass. At a specific time after placement, during the
hydration process, the concrete mass reaches peak temperature. The concrete interior being

CENTER FOR STRUCTURAL DURABILITY – Causes & Cures for Cracking of Concrete Barriers 126
warmer than the ambient air, a temperature gradient forms between the interior and the exterior
surface of the barrier. As the hydration subsides and concrete interior starts cooling, the barrier
starts shrinking and tensile stresses develop at the base of the barrier where the restraint is the
highest.
Drying shrinkage initiates as soon as concrete is placed. Factors controlling drying shrinkage are
described in Chapter 2. Lack of available restraint when concrete is in a plastic state prevents
stresses developing from shrinkage. The maximum shrinkage strain that will develop in concrete
is a constant value. The formation of cracks during shrinkage progression is a function of when
shrinkage takes place. Often concrete cracks if shrinkage is not controlled during early-ages
when cracking strength is low. Cracking will be controlled if wet curing is promptly initiated
and shrinkage is delayed. The effectiveness of the curing compound is limited and only if an
impervious membrane can be formed.
There are several shrinkage prediction models that estimate the progression of drying shrinkage
following wet or moist curing. Although specific models for the prediction of very early-age
drying shrinkage are not available, the formulation and discussion given in Section 2.3.2.2 verify
the importance of implementing appropriate curing procedures immediately upon concrete
placement.
Volume change of the barrier caused by concrete shrinkage and thermal loads in conjunction
with restraint effects generate tensile stresses. In order to appraise the cracking potential of
bridge barriers, shrinkage and thermal loads need to be estimated. Prediction of the shrinkage
strain is based on concrete properties, barrier geometry, and ambient conditions. Thermal loads
are predicted based on the concrete mix proportions, curing conditions, barrier geometry, and
ambient conditions that prevailed during the time of concrete placement.
In this chapter, the potential full-length vertical crack spacing of concrete barriers under
predicted shrinkage and thermal loads in combination with restraint effects is evaluated by the
finite element (FE) analysis of a barrier segment. FE analysis models are generated for several
barrier length/height (L/H) ratios. The purpose of the multiple models is to determine the
length/height ratio at which cracking may initiate. Further, the analysis of longitudinal stress

CENTER FOR STRUCTURAL DURABILITY – Causes & Cures for Cracking of Concrete Barriers 127
distributions with accompanying strain distributions establishes the vertical crack spacing. The
reinforcements are incorporated in these models.
In order to incorporate the shrinkage, thermal effects, and restraint effects on vertical cracking,
change in the mechanical properties of concrete with respect to time is required. The
compressive strength and elasticity modulus tests of concrete obtained from standard specimens
at 3, 7, 28, 56, and 90 days were given in Chapter 6. However, the analysis requires variation of
mechanical properties of concrete against time at very early ages (from the time of concrete
placement up to 2 days). Hence, various prediction models are investigated to determine the
models that are capable of estimating the very early-age compressive strength, elasticity
modulus, and tensile strength.
7.2 MECHANICAL PROPERTIES OF CONCRETE
The purpose of developing mechanical property prediction models is to have a continuous
relationship describing concrete strength and elasticity modulus (stiffness) against time. Also,
the crack initiation requires the direct tensile strength of concrete. A prediction model for direct
tensile strength of concrete is also described.
7.2.1 Compressive Strength
The two concrete compressive strength prediction models compared here are described by ACI
and CEB-FIP.
ACI Committee 209 recommends a model for moist-cured concrete made with normal Portland
cement (ASTM Type I) as given in Eq. 7-1.
)f(t04
t)f( '
c 28'c t 85.+
= (7-1)
The following relationship is suggested by CEB-FIP Models Code (1990) for concrete specimens
cured at 68 0F (Mehta 1993):
)f(tt
281sexp)f( 'c 28
1
1/2'c t
−= (7-2)
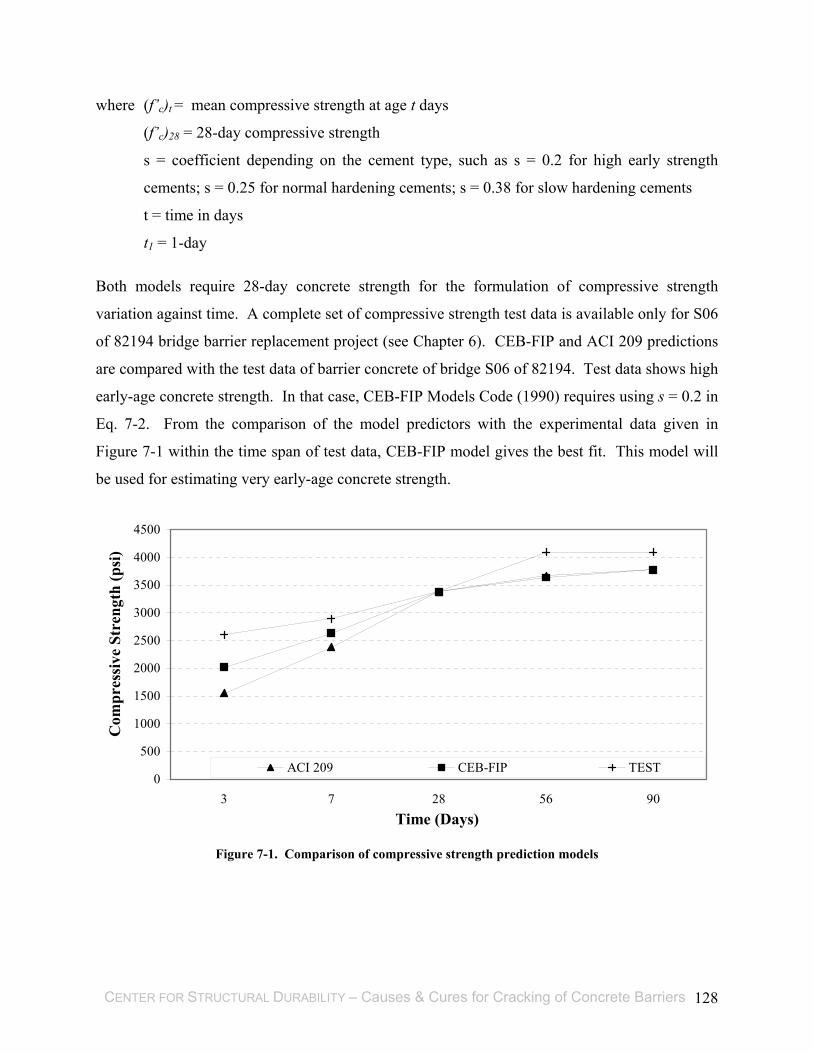
CENTER FOR STRUCTURAL DURABILITY – Causes & Cures for Cracking of Concrete Barriers 128
where (f’c)t = mean compressive strength at age t days
(f’c)28 = 28-day compressive strength
s = coefficient depending on the cement type, such as s = 0.2 for high early strength
cements; s = 0.25 for normal hardening cements; s = 0.38 for slow hardening cements
t = time in days
t1 = 1-day
Both models require 28-day concrete strength for the formulation of compressive strength
variation against time. A complete set of compressive strength test data is available only for S06
of 82194 bridge barrier replacement project (see Chapter 6). CEB-FIP and ACI 209 predictions
are compared with the test data of barrier concrete of bridge S06 of 82194. Test data shows high
early-age concrete strength. In that case, CEB-FIP Models Code (1990) requires using s = 0.2 in
Eq. 7-2. From the comparison of the model predictors with the experimental data given in
Figure 7-1 within the time span of test data, CEB-FIP model gives the best fit. This model will
be used for estimating very early-age concrete strength.
0
500
1000
1500
2000
2500
3000
3500
4000
4500
3 7 28 56 90Time (Days)
Com
pres
sive
Str
engt
h (p
si)
ACI 209 CEB-FIP TEST
Figure 7-1. Comparison of compressive strength prediction models

CENTER FOR STRUCTURAL DURABILITY – Causes & Cures for Cracking of Concrete Barriers 129
7.2.2 Elasticity Modulus
There are several models available for calculating the modulus of elasticity. Two of the models
are adopted by ACI and by CEB-FIP.
The ACI Committee 209 recommended model is given as:
[ ])f(wgE 'c t
3 1/2ctct = (7-3)
where w is the unit weight of concrete (pcf) and gct = 33 is a constant.
The model most commonly used in literature and given in ACI 318 is: )f(57000E '
c tct = (7-4)
The following relationship is suggested by CEB-FIP Models Code (1990) (Vincent 2003):
eEE )]28/t[s/2(1cct
−= (7-5)
where Ec is the mean modulus of elasticity of concrete at 28-days.
ACI 209 and ACI 318 models require concrete compressive strength for calculating variation of
elasticity modulus against time. Similarly, CEB-FIP model requires 28-day mean modulus of
elasticity of concrete. The CEB-FIP, ACI 318, and ACI 209 predictions are compared with the
test results obtained from barrier concrete of bridge S06 of 82194. Figure 7-2 shows the
comparison of the proposed models with the experimental counterparts.
Based on these comparisons, the CEB-FIP model, which closely predicts the early-age elasticity
modulus generated in this study, is used for estimating the elasticity modulus.

CENTER FOR STRUCTURAL DURABILITY – Causes & Cures for Cracking of Concrete Barriers 130
0
1000
2000
3000
4000
5000
3 7 28 56 90
Time (Days)
Ela
stic
ity M
odul
us (k
si)
Test CEB-FIP ACI 209 ACI 318
Figure 7-2. Comparison of elasticity modulus prediction models
7.2.3 Direct Tensile Strength
ACI Committee 209 recommends the following equation for computing average values of direct
tensile strength (ft’):
[ ])f(wgf 'c t
1/2t
't = (7-6)
where w is unit weight of concrete (pcf), and gt is given as 1/3. 7.2.4 Concrete Strain
Assuming concrete behaves as an elastic brittle material in tension, concrete strain at cracking
can be calculated using Hook’s law from the tensile strength and elasticity modulus.
Efε 't= (7-7)
where ε is the strain, f’
t is the tensile stress, and E is the elasticity modulus.
Concrete crack initiates when concrete strain due to volume change exceeds the concrete strain
calculated using Eq. 7-7, and with sufficient accompanying restraining stress.

CENTER FOR STRUCTURAL DURABILITY – Causes & Cures for Cracking of Concrete Barriers 131
7.2.5 Mechanical Properties and Shrinkage of Barrier Concrete
Concrete mechanical properties calculated using the CEB-FIP model are given in Table 7-1. The
concrete shrinkage is calculated using the models described in Section 2.3.2.1. The comparisons
of shrinkage strains obtained from various models are shown in Table 7-2. The shrinkage is
calculated specifically for MDOT Grade D concrete (ASTM Type I cement, w/c ratio of 0.4, and
cement content of 660 lb/yd3) and assuming 60% relative humidity with two days moist curing.
Figure 7-3. Geometry of the barrier
Table 7-1. Estimated Early-Age Mechanical Properties of Barrier Concrete
Period Compressive Strength
(psi) CEB-FIP Model
Elasticity Modulus (ksi)
CEB-FIP Model
Direct Tensile Strength (psi)
ACI 209 Model 3-day 3315 4071 235
7-day 4094 4524 261
14-day 4602 4797 277
28-day 5000 5000 289
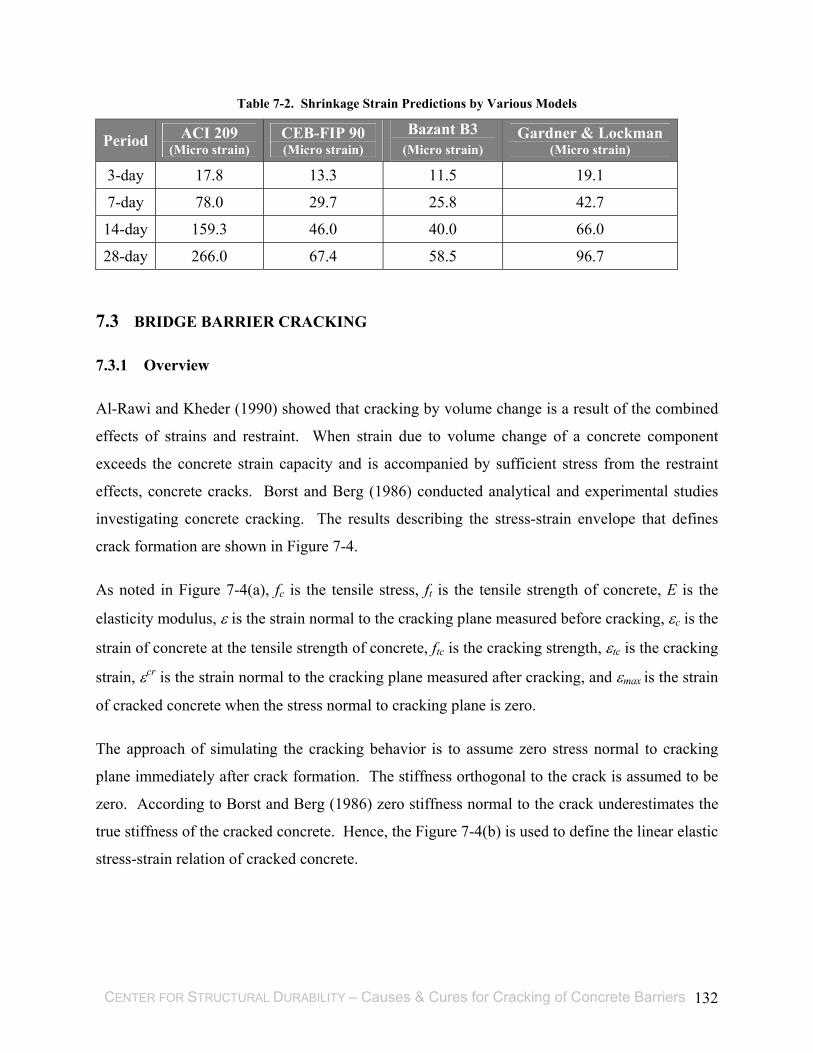
CENTER FOR STRUCTURAL DURABILITY – Causes & Cures for Cracking of Concrete Barriers 132
Table 7-2. Shrinkage Strain Predictions by Various Models
Period ACI 209 (Micro strain)
CEB-FIP 90 (Micro strain)
Bazant B3 (Micro strain)
Gardner & Lockman (Micro strain)
3-day 17.8 13.3 11.5 19.1
7-day 78.0 29.7 25.8 42.7
14-day 159.3 46.0 40.0 66.0
28-day 266.0 67.4 58.5 96.7
7.3 BRIDGE BARRIER CRACKING
7.3.1 Overview
Al-Rawi and Kheder (1990) showed that cracking by volume change is a result of the combined
effects of strains and restraint. When strain due to volume change of a concrete component
exceeds the concrete strain capacity and is accompanied by sufficient stress from the restraint
effects, concrete cracks. Borst and Berg (1986) conducted analytical and experimental studies
investigating concrete cracking. The results describing the stress-strain envelope that defines
crack formation are shown in Figure 7-4.
As noted in Figure 7-4(a), fc is the tensile stress, ft is the tensile strength of concrete, E is the
elasticity modulus, ε is the strain normal to the cracking plane measured before cracking, εc is the
strain of concrete at the tensile strength of concrete, ftc is the cracking strength, εtc is the cracking
strain, εcr is the strain normal to the cracking plane measured after cracking, and εmax is the strain
of cracked concrete when the stress normal to cracking plane is zero.
The approach of simulating the cracking behavior is to assume zero stress normal to cracking
plane immediately after crack formation. The stiffness orthogonal to the crack is assumed to be
zero. According to Borst and Berg (1986) zero stiffness normal to the crack underestimates the
true stiffness of the cracked concrete. Hence, the Figure 7-4(b) is used to define the linear elastic
stress-strain relation of cracked concrete.

CENTER FOR STRUCTURAL DURABILITY – Causes & Cures for Cracking of Concrete Barriers 133
f t
E
A B C
ε cr
B
(a) (b)
f c fc
ε c ε ε max
f tc
ε tc maxε
Figure 7-4. (a) Stress-strain envelope for cracking of concrete and (b) stress- strain normal to cracking plane
after crack initiation (assuming linear-elastic behavior)
Figure 7-4 (a) is a combination of the linear elastic stress-strain diagram for cracked and
uncracked concrete. As the stress develops with the restraint in the major principal direction and
stress achieves point A in Figure 7-4 (a), strain softening begins. As a consequence of softening,
strain jumps to point B from point A while stress remaining nearly constant. When the
combination of stress and strain in the major principal direction reaches the envelope (point B),
cracking initiates. Under this stress condition, the tensile strain should be greater than the
ultimate tensile strain of concrete (εc) for crack initiation. The stress level at point B is assumed
to be 80% of the tensile strength of concrete.
The literature describes two approaches for reducing cracking of concrete walls: these are the
reduction of length/height (L/H) ratio of the wall and provision of reinforcements in an effort to
replace the large cracks in plain concrete walls with an increased number of finer cracks in
reinforced walls. The factors governing the cracking of continuously base-restrained walls are
given below (Al-Rawi and Kheder 1990):
• L/H ratio
• magnitude of base restraint
• base rigidity and the relative volume change between wall and the base
• rate and magnitude of shrinkage and thermal loads
• percentage and type of horizontal wall reinforcement

CENTER FOR STRUCTURAL DURABILITY – Causes & Cures for Cracking of Concrete Barriers 134
Al-Rawi and Kheder (1990) conducted experiments with regard to these factors on 14 reduced–
scale base-restrained walls. According to their observations, first crack initiated at the bottom of
the central portion of the wall and propagated towards the top of the wall. Further cracks were
formed towards the end of the wall. This cracking pattern and sequence confirmed that the
cracks initiate in the high restraint zone and propagate towards the lower restraint zones.
Comparison of crack spacing between plain concrete and reinforced concrete walls showed that
reinforcement reduces the crack spacing as well as the crack width. Further experiments showed
the existence of an upper limit for the horizontal reinforcement ratio. At the optimum
reinforcement ratio, further reduction in crack spacing and width could be attained only by
reducing the L/H ratio. The crack spacing observed with plain concrete walls was 1.24H; this is
in agreement with the range given in the ACI Committee 207 report. The Eq 7-8 below is
proposed for estimating the minimum crack spacing (Smin) in a fully base-restrained reinforced
concrete wall (Al-Rawi and Kheder 1990). The thermal load effects were eliminated by the
reduced size of specimens and submerged curing.
)dpH()dH( kkS 11min += (7-8)
where, k1 =0.57 for deformed bars, d is the bar diameter, H is the wall height, and p is the
reinforcement ratio.
According to ACI 207 (2001), fully base-restrained plain concrete walls ultimately attain full-
length cracks spaced at one to two times the height of the wall. Meanwhile, Cusson and Repette
(2000) inspected early-age cracking of the Vachon Bridge barriers and the observed crack
spacing was 0.8 times the barrier height. The steel reinforcement generates additional restraints
and reduces crack spacing (ACI 207 2001). Cusson and Repette (2000) concluded that the
amount of reinforcement (p=0.4%) used in Vachon Bridge barriers was the reason for crack
spacing of 0.8 times the barrier height.
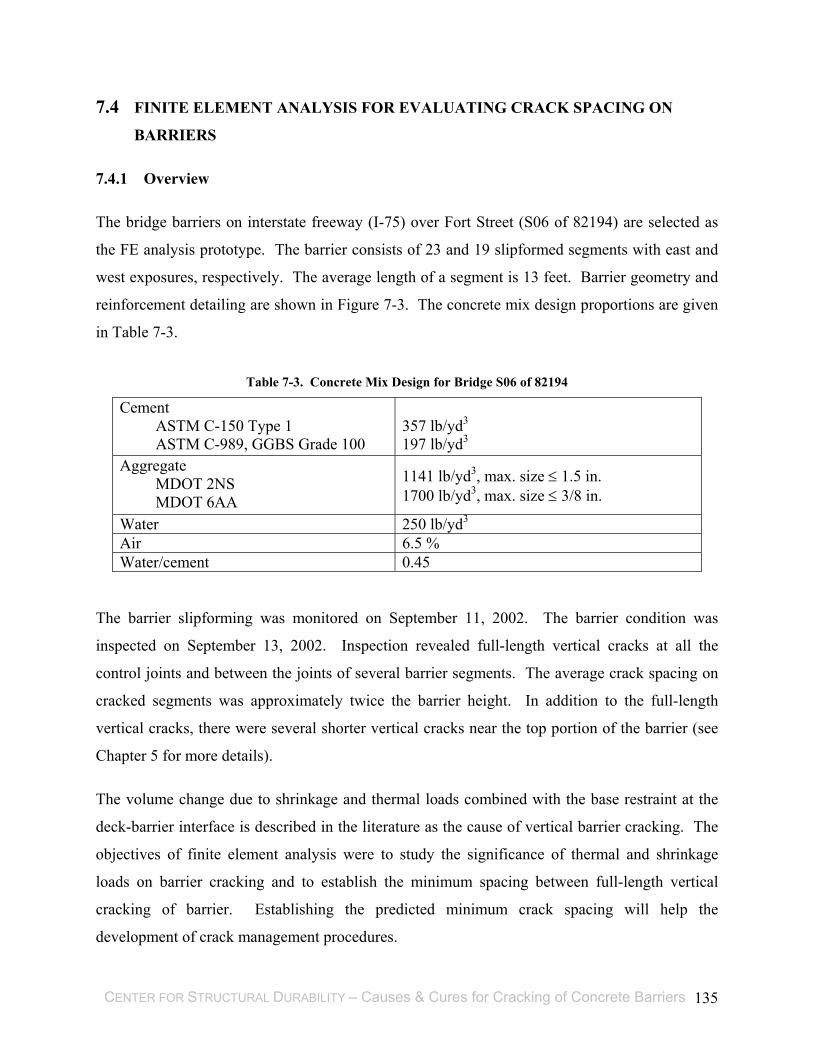
CENTER FOR STRUCTURAL DURABILITY – Causes & Cures for Cracking of Concrete Barriers 135
7.4 FINITE ELEMENT ANALYSIS FOR EVALUATING CRACK SPACING ON
BARRIERS
7.4.1 Overview
The bridge barriers on interstate freeway (I-75) over Fort Street (S06 of 82194) are selected as
the FE analysis prototype. The barrier consists of 23 and 19 slipformed segments with east and
west exposures, respectively. The average length of a segment is 13 feet. Barrier geometry and
reinforcement detailing are shown in Figure 7-3. The concrete mix design proportions are given
in Table 7-3.
Table 7-3. Concrete Mix Design for Bridge S06 of 82194
Cement ASTM C-150 Type 1 ASTM C-989, GGBS Grade 100
357 lb/yd3 197 lb/yd3
Aggregate MDOT 2NS MDOT 6AA
1141 lb/yd3, max. size ≤ 1.5 in. 1700 lb/yd3, max. size ≤ 3/8 in.
Water 250 lb/yd3 Air 6.5 % Water/cement 0.45
The barrier slipforming was monitored on September 11, 2002. The barrier condition was
inspected on September 13, 2002. Inspection revealed full-length vertical cracks at all the
control joints and between the joints of several barrier segments. The average crack spacing on
cracked segments was approximately twice the barrier height. In addition to the full-length
vertical cracks, there were several shorter vertical cracks near the top portion of the barrier (see
Chapter 5 for more details).
The volume change due to shrinkage and thermal loads combined with the base restraint at the
deck-barrier interface is described in the literature as the cause of vertical barrier cracking. The
objectives of finite element analysis were to study the significance of thermal and shrinkage
loads on barrier cracking and to establish the minimum spacing between full-length vertical
cracking of barrier. Establishing the predicted minimum crack spacing will help the
development of crack management procedures.

CENTER FOR STRUCTURAL DURABILITY – Causes & Cures for Cracking of Concrete Barriers 136
The following sections describe the calculation of thermal and shrinkage loads from the concrete
mix, barrier geometry, and the environmental conditions. Further, the finite element modeling of
barrier, analysis, and the results are discussed.
7.4.2 Thermal Loads
Thermal loads are inherent to concrete construction. Cement hydration is an exothermic process
that generates heat and consequently a temperature difference between the concrete mass and the
ambient air.
The time period required for a specific concrete mix to attain its highest temperature level due to
hydration is needed for determining the thermal load. Thermal load is the temperature difference
between the ambient air and the interior of the concrete mass. The peak hydration temperature
of the barrier (volume-to-exposed surface ratio of 0.42 ft), which is slipformed using concrete
with Type I cement under the ambient temperature of 85oF, is reached at 12 hours after
slipforming. The use of GGBS delays the time of peak hydration temperature. According to
Siew et al. (2003) the addition of 65% GGBS delays the time of peak hydration temperature by
18 hours. In barrier concrete mix 55% of GGBS is used and the delay is estimated as 12 hours.
Hence, the peak hydration temperature of barrier concrete is achieved 24 hours after slipforming.
In order to calculate the peak hydration temperature using ACI 207.2R procedure, the heat of
hydration generated by the mix needs to be evaluated. ACI 207.2R procedure is specifically
developed for mixtures with OPC. For substitution with GGBS correction needs to be
incorporated in calculating the heat of hydration. Figure 7-5 shows that the addition of GGBS
reduces the heat of hydration (Ecocem@ 2003). The data given in Figure 7-5 shows that the
amount of heat generated during hydration of GGBS is equivalent to 25% of the heat generated
by OPC. The amount of GGBS used in barrier concrete mix is 197 lb/yd3 (Table 7-3). The
amount of heat generated by 197 lb/yd3 of GGBS is equivalent to that of 49.25 lb/yd3 of OPC.
Hence, the equivalent OPC content of barrier concrete mix given in Table 7-3 is calculated as
406.25 lb/yd3. According to the cement mill report obtained from the concrete supplier, the
average Blaine fineness of the cement used in barrier concrete is 1774 ft2/lb. The peak hydration
temperature calculated for barrier concrete, which contains 406.25 lb/yd3 of cement with the
average fineness of 1774 ft2/lb, is 111oF. The ambient temperature when barrier concrete attain
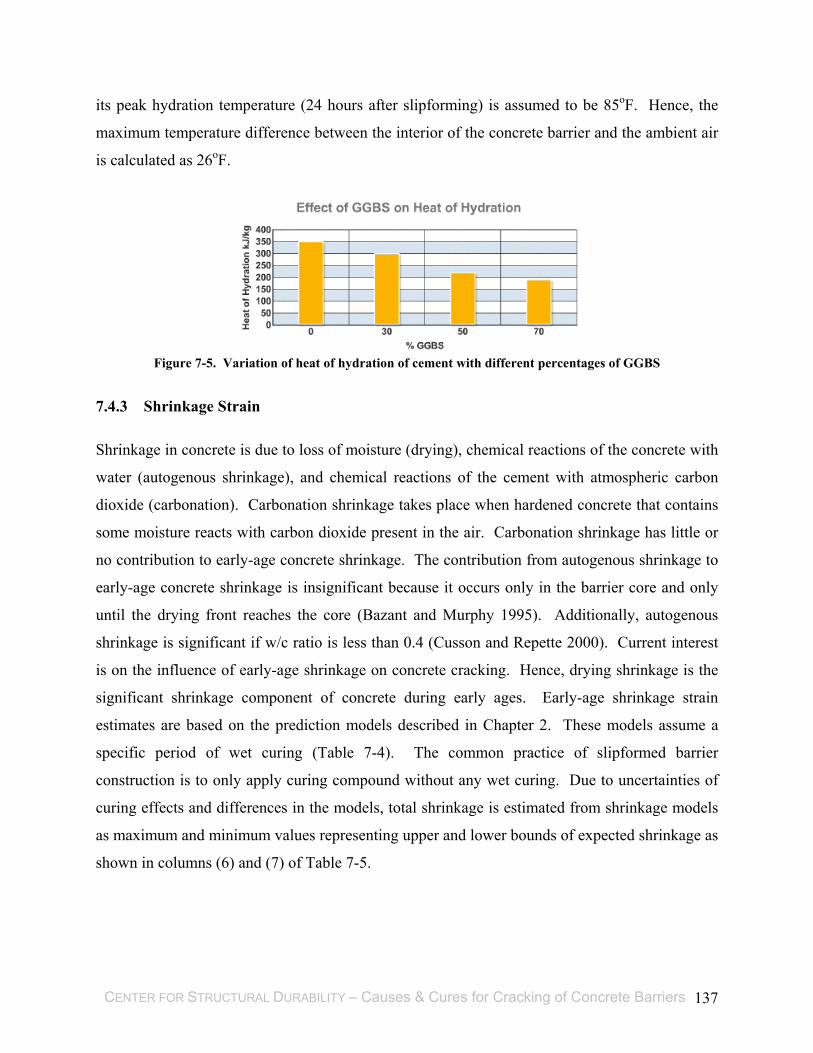
CENTER FOR STRUCTURAL DURABILITY – Causes & Cures for Cracking of Concrete Barriers 137
its peak hydration temperature (24 hours after slipforming) is assumed to be 85oF. Hence, the
maximum temperature difference between the interior of the concrete barrier and the ambient air
is calculated as 26oF.
Figure 7-5. Variation of heat of hydration of cement with different percentages of GGBS
7.4.3 Shrinkage Strain
Shrinkage in concrete is due to loss of moisture (drying), chemical reactions of the concrete with
water (autogenous shrinkage), and chemical reactions of the cement with atmospheric carbon
dioxide (carbonation). Carbonation shrinkage takes place when hardened concrete that contains
some moisture reacts with carbon dioxide present in the air. Carbonation shrinkage has little or
no contribution to early-age concrete shrinkage. The contribution from autogenous shrinkage to
early-age concrete shrinkage is insignificant because it occurs only in the barrier core and only
until the drying front reaches the core (Bazant and Murphy 1995). Additionally, autogenous
shrinkage is significant if w/c ratio is less than 0.4 (Cusson and Repette 2000). Current interest
is on the influence of early-age shrinkage on concrete cracking. Hence, drying shrinkage is the
significant shrinkage component of concrete during early ages. Early-age shrinkage strain
estimates are based on the prediction models described in Chapter 2. These models assume a
specific period of wet curing (Table 7-4). The common practice of slipformed barrier
construction is to only apply curing compound without any wet curing. Due to uncertainties of
curing effects and differences in the models, total shrinkage is estimated from shrinkage models
as maximum and minimum values representing upper and lower bounds of expected shrinkage as
shown in columns (6) and (7) of Table 7-5.

CENTER FOR STRUCTURAL DURABILITY – Causes & Cures for Cracking of Concrete Barriers 138
Table 7-4. Limitations of Shrinkage Prediction Model
Parameter (1)
ACI 209R-92 (2)
CEB-FIP 90 (3)
Bazant B3 (4)
GL 2000 (5)
Mean 28-day compressive strength fc
’ psi
- 2,900 – 13, 000 2,500 – 10,000 2,900 – 10,000
Aggregate/Cement - - 2.5 – 13.5 -
Cement lbs/ft3 - - 10 – 45 -
Water/cement ratio - - 0.3 - 0.85 -
Relative Humidity (%) 40-100 40-100 40-100 40-100
Cement Type I or III R, SL, or RS I, II, or III I, II, or III
Age of concrete at the time of shrinkage strain calculation (t) or age at which concrete starts drying (tc) (Moist cured)
≥ 7 days tc ≤ 14 days tc ≤ t ≥ 2 days
t or tc (Steam cured) ≥ 1-3 days tc ≤ 14 days tc ≤ t ≥ 2 days
Table 7-5. Total Shrinkage of Concrete at Different Ages
Shrinkage in./in.x10-6 Age (Days)
(1)
ACI 209
(2)
CEB-FIP 90
(3)
Bazant B3
(4)
Gardner &Lockman
(5)
Minimum
(6)
Maximum
(7) 0.5 4.4 6.2 4.4 9.6 4.4 9.6 0.75 8.8 8.8 6.3 13.6 6.3 13.6
1 13.1 10.8 7.7 16.6 7.7 16.6 2 29.7 16.5 11.7 25.4 11.7 29.7 3 45.5 20.7 14.7 31.8 14.7 45.5 7 100.9 32.3 23.0 49.8 23.0 100.9
7.4.4 Mechanical Properties of Concrete
Early-age mechanical properties of concrete are required to evaluate the cracking potential of
barrier concrete. Several models and a model of choice were presented in the section entitled
“Mechanical Properties of Concrete” on the estimation of early-age mechanical properties.
Early-age mechanical properties of concrete calculated using the model of choice are given in
Table 7-6. Additionally, for establishing the crack formation parameters the cracking tensile
strain is taken as 1.2 times the ultimate tensile strain of concrete and the cracking strength is 0.8
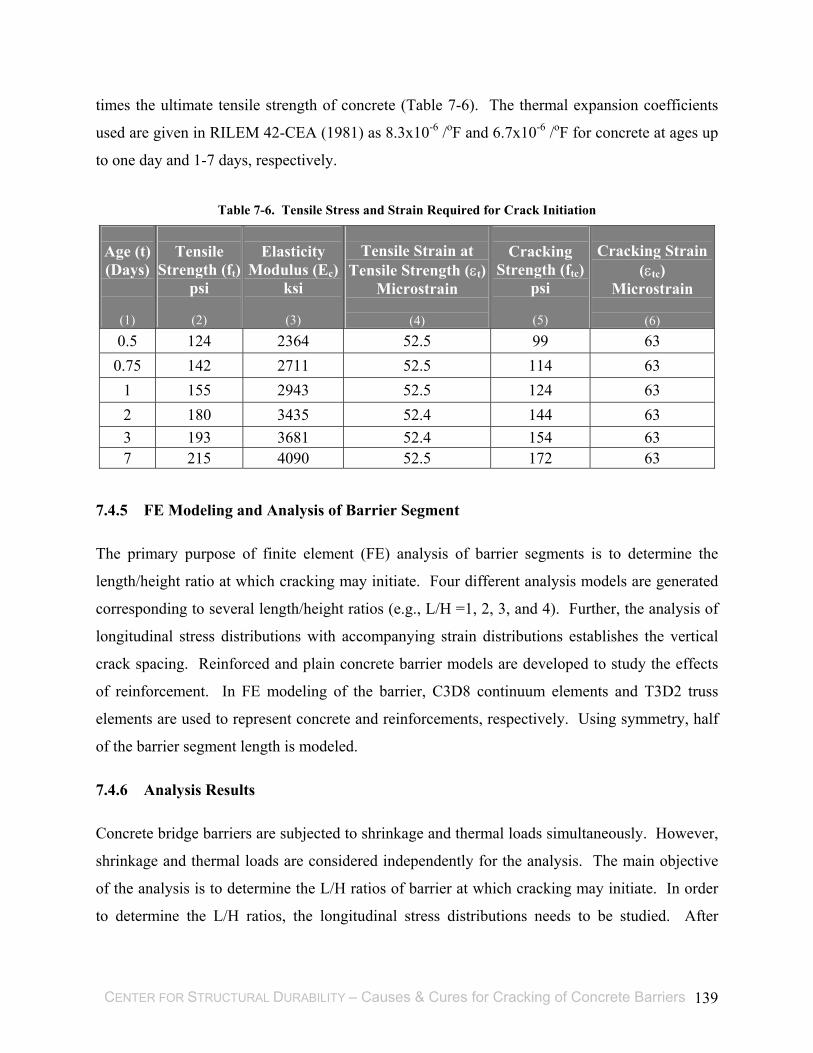
CENTER FOR STRUCTURAL DURABILITY – Causes & Cures for Cracking of Concrete Barriers 139
times the ultimate tensile strength of concrete (Table 7-6). The thermal expansion coefficients
used are given in RILEM 42-CEA (1981) as 8.3x10⁻⁶ /oF and 6.7x10⁻⁶ /oF for concrete at ages up
to one day and 1-7 days, respectively.
Table 7-6. Tensile Stress and Strain Required for Crack Initiation
Age (t) (Days)
(1)
Tensile
Strength (ft) psi
(2)
Elasticity
Modulus (Ec)ksi
(3)
Tensile Strain at
Tensile Strength (εt)Microstrain
(4)
Cracking
Strength (ftc) psi
(5)
Cracking Strain
(εtc) Microstrain
(6)
0.5 124 2364 52.5 99 63 0.75 142 2711 52.5 114 63
1 155 2943 52.5 124 63 2 180 3435 52.4 144 63 3 193 3681 52.4 154 63 7 215 4090 52.5 172 63
7.4.5 FE Modeling and Analysis of Barrier Segment
The primary purpose of finite element (FE) analysis of barrier segments is to determine the
length/height ratio at which cracking may initiate. Four different analysis models are generated
corresponding to several length/height ratios (e.g., L/H =1, 2, 3, and 4). Further, the analysis of
longitudinal stress distributions with accompanying strain distributions establishes the vertical
crack spacing. Reinforced and plain concrete barrier models are developed to study the effects
of reinforcement. In FE modeling of the barrier, C3D8 continuum elements and T3D2 truss
elements are used to represent concrete and reinforcements, respectively. Using symmetry, half
of the barrier segment length is modeled.
7.4.6 Analysis Results
Concrete bridge barriers are subjected to shrinkage and thermal loads simultaneously. However,
shrinkage and thermal loads are considered independently for the analysis. The main objective
of the analysis is to determine the L/H ratios of barrier at which cracking may initiate. In order
to determine the L/H ratios, the longitudinal stress distributions needs to be studied. After

CENTER FOR STRUCTURAL DURABILITY – Causes & Cures for Cracking of Concrete Barriers 140
establishing the critical L/H ratio for cracking, significance of very early-age shrinkage and
thermal loads on barrier cracking is investigated.
7.4.6.1 Shrinkage and Reinforcement Effects
Shrinkage effects in concrete are simulated using an equivalent temperature load corresponding
to the estimated upper and lower shrinkage limits. Maximum tensile stress occurs at the area
with the highest restraint (Figure 7-6). This further confirms that cracking of barriers initiates at
a location close to the highly restrained base. For barriers with different L/H ratios, longitudinal
stress along the barrier length close to the base increases towards the center section of the barrier.
Changes to maximum stress are very limited for increased L/H ratio beyond two (Figure 7-7).
Figure 7-8(a) and (b) show the longitudinal stress distribution along the barrier height at mid
section. In these figures, the longitudinal stresses are normalized with respect to the maximum
longitudinal stress at the base of the barrier. For L/H=1, compressive stress develops at the
upper portion of the barrier preventing the formation of full-length vertical cracks (Figure
7-8(a)). However, for L/H=2, the barrier cross-section is only subjected to tensile stresses
(Figure 7-8(b)). This illustrates the potential of full-length vertical crack formation at a spacing
equal to the barrier height.
Though perfect bond between concrete and reinforcement is assumed, the influence of
reinforcement located close to the base of the barrier is insignificant, irrespective of L/H ratios.
There is an incremental effect on longitudinal stress for low L/H ratios from the reinforcement
located at sections near the upper portion of the barrier. With increasing L/H ratio, the base
restraint negates the contribution of the reinforcement regardless of its location along the barrier
section (Figure 7-8).
The analysis results verify that the potential full-length vertical crack spacing in bridge barriers is
approximately equal to the barrier height if the barrier is fully base restrained. In reality, the
barrier is not fully base restrained due to the fact that there is a cold joint between the deck and
the barrier. Effect of base restraint on longitudinal stress distribution along the barrier height
was investigated for a barrier with L/H = 2. Figure 7-9 shows the longitudinal stress distribution
along the barrier height at the mid section. With the reducing base restraint, compressive stress

CENTER FOR STRUCTURAL DURABILITY – Causes & Cures for Cracking of Concrete Barriers 141
region at the barrier upper portion increases thus eliminating the vertical cracking. Therefore,
reduction in base restraint will increase crack spacing.
In concrete of 2-day age, the maximum shrinkage strain calculated from the prediction models is
less than the cracking strain. However, this strain level still causes significant levels of tensile
stress (near the cracking strength of concrete) at the base. Additionally, without moist curing
early-age shrinkage is substantially increased at a time when tensile strength is very low. In that
case cracks may form even before two days after placement, which is the time at which
shrinkage strains are calculated.
High
Stress intensity
Low
(a)
(b) Figure 7-6. Longitudinal stress distribution along the barrier (a) height and (b) length for L/H=1
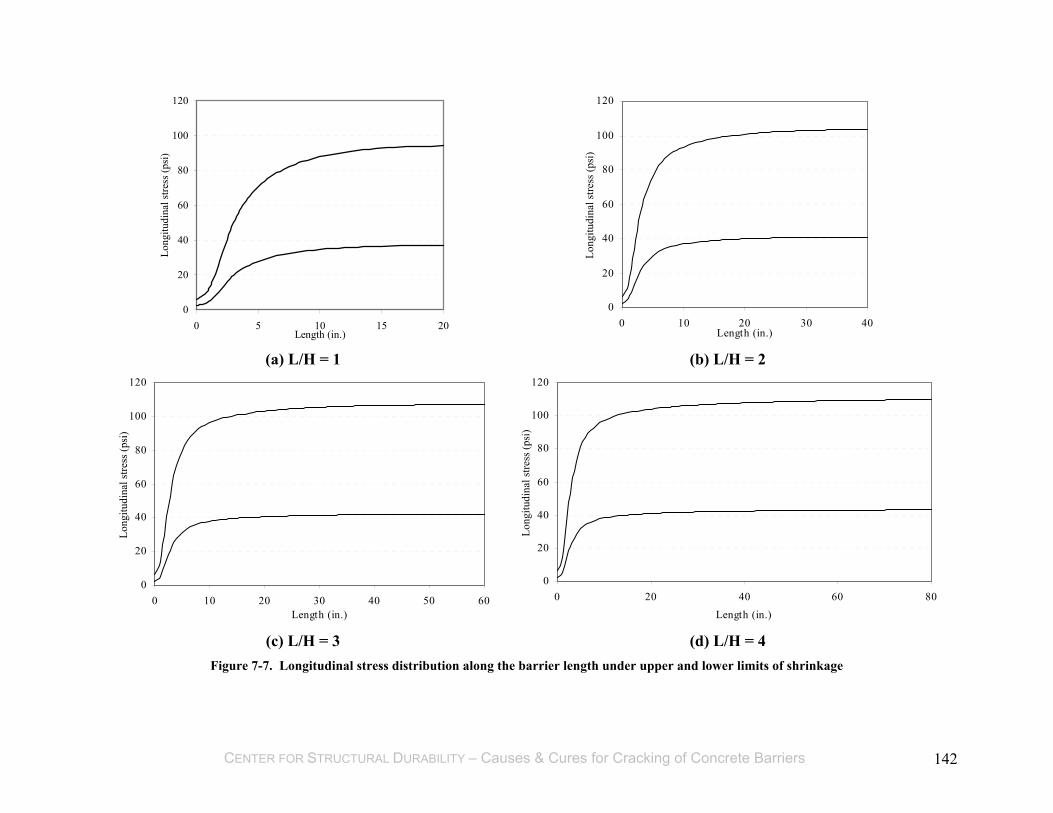
CENTER FOR STRUCTURAL DURABILITY – Causes & Cures for Cracking of Concrete Barriers 142
0
20
40
60
80
100
120
0 5 10 15 20Length (in.)
Long
itudi
nal s
tress
(psi
)
(a) L/H = 1
0
20
40
60
80
100
120
0 10 20 30 40Length (in.)
Long
itudi
nal s
tress
(psi
)
(b) L/H = 2
0
20
40
60
80
100
120
0 10 20 30 40 50 60Length (in.)
Long
itudi
nal s
tress
(psi
)
(c) L/H = 3
0
20
40
60
80
100
120
0 20 40 60 80Length (in.)
Long
itudi
nal s
tress
(psi
)
(d) L/H = 4 Figure 7-7. Longitudinal stress distribution along the barrier length under upper and lower limits of shrinkage

CENTER FOR STRUCTURAL DURABILITY – Causes & Cures for Cracking of Concrete Barriers 143
0
0.1
0.2
0.3
0.4
0.5
0.6
0.7
0.8
0.9
1
-0.200.20.40.60.81Normalized Longitudinal Stress
L/H = 1 (Plain Concrete) L/H = 1 (Reinforced Concrete)
CompressionTension
Frac
tion
of T
otal
Bar
rier
Hei
ght
(a)
0
0.1
0.2
0.3
0.4
0.5
0.6
0.7
0.8
0.9
1
-0.200.20.40.60.81Normalized Longitudinal Stress
L/H = 2 (Plain Concrete) L/H = 2 (Reinforced Concrete)
CompressionTension
Frac
tion
of T
otal
Bar
rier
Hei
ght
(b)
Figure 7-8. Longitudinal stress distribution along barrier height at mid section (a) L/H=1 and (b) L/H=2

CENTER FOR STRUCTURAL DURABILITY – Causes & Cures for Cracking of Concrete Barriers 144
0.0
0.1
0.2
0.3
0.4
0.5
0.6
0.7
0.8
0.9
1.0
-0.4-0.20.00.20.40.60.81.0
Normalized Longitudinal Stress
Frac
tion
of T
otal
Bar
rier H
eigh
tL/H = 2 - Fully Restrained BaseL/H = 2 - Partially Restrained Base
Figure 7-9. Longitudinal stress distribution along barrier height at mid section for L/H = 2
7.4.6.2 Thermal Load Effects in Reinforced Barriers
In Section 7.4.6.1, it is established that the minimum potential crack spacing in bridge barrier
with full base restraint is equal to the barrier height. To investigate the stress magnitudes under
thermal loading, barrier models with L/H = 2 are analyzed. For the analysis, perfect bond
between concrete and reinforcement and full base restraint conditions are assumed. The thermal
loading was calculated following the procedure given in ACI 207.2R (2001) and using the other
relevant factors discussed in Section 7.4.2. The maximum temperature difference between the
interior and exterior of the barrier was estimated at 24 hours after concrete placement. At this
time, the maximum temperature difference between the ambient air (85 oF) and the interior of the
concrete barrier is estimated as 26 0F. The analysis results showed that the longitudinal stress at
barrier base for L/H=2 is 627 psi. This stress and associated strains are significantly higher than
the cracking strength of concrete at respective age.
Regardless of bond quality between concrete and reinforcement (model assumes perfect bond),
under thermal loading the influence of reinforcement to stresses and strains within the barrier is
insignificant, irrespective of L/H ratios. This is because the temperature of both concrete and
steel are equal and cool down at about the same rate.

CENTER FOR STRUCTURAL DURABILITY – Causes & Cures for Cracking of Concrete Barriers 145
In summary, the analysis results showed that the thermal loading alone can cause early-age
barrier cracking. Reinforcements are ineffective in controlling cracking under thermal loads.
Additionally, volume change due to shrinkage and thermal loading occurs simultaneously.
Though the shrinkage contribution alone may not be sufficient to induce cracking, the combined
effects of shrinkage and thermal loading generate strains well above the cracking strains.
7.5 CONCLUSIONS
Full-length vertical cracking that is observed at early ages is often the predominant type of
distress in a barrier segment. Other documented distresses are due to the progression of distress
initiated by vertical cracking. Map cracking is also a common defect observed on barrier
surfaces. Map cracking generally remains near the barrier surface and its impact on long term
barrier distress is minimal.
Field inspection data obtained from barriers of 21 bridges show that the full-length vertical crack
spacing to barrier height ratio is equal to two. Additional data indicated that barriers exposed to
north and south directions show an increased amount of map cracking.
Major causes of cracking are identified as volume change of concrete barrier and restraint.
Early-age volume change is mainly due to drying shrinkage and thermal loads. Cracking due to
volume change is a result of the combined effects of volume change strains and restraint. When
strain due to volume change of a concrete component exceeds the concrete strain capacity
accompanied by sufficient stress due to restraint effects, concrete cracks.
The analysis presented in this research demonstrated that the tensile stresses due to early-age
thermal load alone can cause barrier cracking. Volume change of concrete due to temperature
and shrinkage occurs simultaneously. An increase in drying shrinkage due to construction errors
and delays in wet cure can increase the tensile stresses. Drying shrinkage, beyond very early
ages, will increase crack widths that have formed due to thermal loads.
The time concrete reaches peak temperature during hydration depends, among other parameters,
on the volume to exposed-surface ratio and the concrete placement temperature. Volume to
exposed-surface ratio of New Jersey Type 4 concrete barrier is 0.42 ft. For small volume to
exposed-surface ratio, the percent absorbed or dissipated heat between placement and ambient
CENTER FOR STRUCTURAL DURABILITY – Causes & Cures for Cracking of Concrete Barriers 146
temperatures is very high. In that case, the effective placement temperature approaches the
ambient temperature. Consequently, the concrete temperature measured before placement does
not play a major role in predicting early-age concrete properties. The ambient temperature at the
time of placement governs the early-age concrete thermal properties.
The concrete parameters controlling the thermal load are the cement type, content, and fineness,
ambient temperature at the time of concrete placement, and the time of inception of curing.
These parameters govern the temperature rise in barrier concrete during hydration process. The
temperature difference between peak temperature reached within the concrete mass and the
ambient temperature establishes the thermal load on the barrier. The thermal load controls the
magnitude of the tensile stress developed at the barrier. Reducing thermal load will reduce the
cracking potential of barriers. Today’s weather prediction technology can be utilized as a
decision tool in using admixtures that can refine the hydration process in order to minimize the
thermal load. Use of mineral additives that generates low heat of hydration is helpful in reducing
early-age thermal load.
The shrinkage prediction models used in calculating the early-age shrinkage of barrier concrete
are based on a certain wet curing duration. In the case of slipformed barriers, higher values of
shrinkage strains should be expected due to lack of wet curing.
From the literature review, field inspection data, and finite element analysis results, the following
conclusions are made:
1. If volume change of barrier is not controlled until the tensile strength of concrete develops,
vertical cracks will develop on the barrier with the minimum spacing equals to barrier
height.
2. Cracking can be delayed in barriers with extended wet curing but cannot be prevented.
3. Contribution of reinforcement is not significant in controlling cracking under thermal
loads. After the crack formation, reinforcement will establish the crack width provided
there is adequate bond with concrete.

CENTER FOR STRUCTURAL DURABILITY – Causes & Cures for Cracking of Concrete Barriers 147
8 SUMMARY & CONCLUSIONS
8.1 SUMMARY
The research need was established in a report by J.F. Staton and J. Knauff (1999), titled,
“Evaluation of Michigan’s Concrete Barriers”. The observations made in the report indicated
that many of the New Jersey type concrete barriers used on Michigan bridges are deteriorating at
a rate faster than expected. The current study was designed in order to further evaluate the
observations described in this report and to develop a comprehensive understanding of the
barrier life span, from construction to repair or replacement.
The project was organized into eight tasks. The first task covering the literature review which
included the review of relevant MDOT design, construction, and maintenance practices
concerning bridge barriers and a historical review of bridge barrier design, material
specifications and construction practices. Also included in the literature review are reports
dealing with cracking distress and its impact to bridge barrier service life. The literature
identified the primary distress types on barriers as vertical cracking (termed as transverse
cracking), map cracking, horizontal cracking, popouts, spalling or disintegration, efflorescence,
corrosion, and delamination. Vertical cracking that is observed at early ages is often reported as
the predominant type of distress observed in any given barrier segment. Map cracking is also
reported as a common defect observed on barrier surfaces. Other types of distress originate
primarily from the vertical cracking.
As the second task, bridge engineers at state highway agencies were surveyed. The results of
this survey were used to assess the types of problems other states might have with their bridge
barriers, as well as their material specifications, design, construction practices and acceptance
parameters, and tests.
Under the third task, selected bridge barriers were inspected for documentation of distress types,
their extent, and their progression. Representative categories of barrier distress were established
from pre-inspection field observations and the literature review. These categories were used as a
platform to select candidate barriers for obtaining core specimens. The inspected barriers

CENTER FOR STRUCTURAL DURABILITY – Causes & Cures for Cracking of Concrete Barriers 148
included both good and poor performing barriers, representing a range of variables including
age, material types, and construction methods.
Task four included sampling eight of the inspected barriers for laboratory investigations.
Sampling included collection of two specimens for petrographic examination. Additional
specimens were sought depending on the visual assessment and UPV, RCPT, absorption, and
permeability tests were performed.
The four bridge barrier construction projects were monitored under task five. The purpose of
construction monitoring was to observe and document the construction procedures, materials,
and test procedures. The construction of two slipformed barrier and two form-cast barrier
projects were monitored.
Under task six, laboratory testing of the specimens obtained by coring existing barriers and the
standard specimens prepared during barrier construction was performed. Mechanical property
testing, UPV, RCPT, absorption, and air-permeability tests were performed on the standard
specimens obtained during construction monitoring to assess the material properties that related
to concrete cracking and durability. Barrier performance parameters were established using the
findings of the literature review, inspection data, construction monitoring observations,
laboratory analysis, and finite element analysis. The recommendations of this study are grouped
under the processes of design, construction, and maintenance. The recommendations are for
improvement of barrier service life.
8.2 CONCLUSIONS
The study findings established that early barrier deterioration is initiated by vertical (transverse)
cracking and accelerated by the presence of voids and cavities, reinforcement cover, and the
overall soundness and quality of the concrete barrier. The barrier concrete quality is an
aggregate of quality of material, construction procedures, and workmanship. The cracking of
concrete is the result of stresses that form due to volume change under thermal and shrinkage
loads by the restraint developed between the deck and the barrier base. Concrete cracking is
more likely if volume change takes place prior to concrete achieving sufficient tensile strength.
Cracking of form-cast and slipformed barriers cannot be prevented but can be controlled.

CENTER FOR STRUCTURAL DURABILITY – Causes & Cures for Cracking of Concrete Barriers 149
Vertical cracking can be minimized by eliminating the base restraints (e.g., use of precast barrier
segments).
In this research a solution was sought without making a dramatic change to the current practice;
the means of reducing volume change strains at early ages is related to the environmental
conditions during early ages. How concrete is handled, placed, and cured is defined in
construction specifications. Unfortunately, specifications do not specifically address barriers,
although, significant detail in the specification is provided for decks. This omission is indicative
and representative of the attention given to barrier construction. Thus, in order to emphasize the
intent of improving barrier performance, specifications should include specific requirements for
barrier construction (although a section for general structural concrete is described in the
MDOT- Standard Specifications for Construction in addition to decks). The specifications do
not describe slip forming but construction practices imply that slipforming is allowed. As
implemented today, slip forming needs significant improvements in order to produce a barrier
segment with acceptable compaction and surface quality. In form-cast concrete, Standard
Specifications allow form removal after 18 hours without any expectation of wet curing. The
only requirement is the application of curing compound upon form removal. After placement,
the barrier top surface needs to be protected by an application of curing compound. Limitations
to ambient temperature and evaporation are discussed in the specifications during the time of
concrete placement. Expectations of concrete protection upon placement are not at an equal
level of detail with those of during placement.
Emphasizing the fact that early-age crack control, or in more general terms crack management, is
the key to durable barriers, further recommendations are as follows:
1. It is established that when using the current cast-in-place practices, the minimum
expected vertical crack spacing of the barrier is about 3 feet. A prudent approach may be
to implement the use of crack arrestors by placing a trim inside the forms at about 3 feet
intervals. The crack arrestors, some with cracks formed at full length, can be sealed with
a durable silicone-based flexible material during the first scheduled maintenance cycle.

CENTER FOR STRUCTURAL DURABILITY – Causes & Cures for Cracking of Concrete Barriers 150
2. Concrete mix design needs to be modified to tolerate substandard curing and to generate
lower heat of hydration. Substitution of mineral admixtures results in generation of
concrete mixes that generate lower heat of hydration and curing tolerable concrete.
3. The curing process needs to be improved by delaying form removal to five or even seven
days after placement. The barrier casting process needs to be shifted to evening or
nighttime for the purpose of limiting evaporation during placement and temperature
difference between barrier concrete and ambient air. The top surface of the form-cast
barrier needs to be protected with curing compound or a wet burlap.

CENTER FOR STRUCTURAL DURABILITY – Causes & Cures for Cracking of Concrete Barriers 151
9 SUGGESTIONS FOR FUTURE RESEARCH
There are two topics of significant importance with regards to improvement of the performance
of concrete barriers. The first one deals with developing new concrete mix designs with mineral
admixtures that can reduce shrinkage and tolerate substandard curing. There are numerous
studies in the literature describing potential designs. It will be very beneficial to test these mix
designs and evaluate their resistance to exposure conditions in Michigan.
The second topic is a more pragmatic approach to dealing with barrier durability. The use and
applicability of precast barriers should be investigated. Some states already allow precast
barriers. The research can evaluate both the effective length of precast barriers as well as a
means of fastening the precast barrier components to the bridge structure. The strength and
ductility expectations from the fasteners need to be defined. Testing should be performed on
prospective fastening mechanisms.
CENTER FOR STRUCTURAL DURABILITY – Causes & Cures for Cracking of Concrete Barriers 152
10 REFERENCES
1. Abdun-Nur, E.A. (1982). “Incentive specifications for concrete.” ACI Concrete
International, Vol. 4, No. 9, pp. 20-24.
2. Abdun-Nur, E.A. (1982). ”Inspection and quality assurance.” ACI Concrete International,
Vol. 4, No. 9, pp. 58-62.
3. ACI 207.1R-96. (2001). “Mass concrete.” Manual of Concrete Practice, American
Concrete Institute, Farmington Hills, Michigan.
4. ACI 207.2R-95. (2001). “Effect of restraint, volume change, and reinforcement on
cracking of mass concrete.” Manual of Concrete Practice, American Concrete Institute,
Farmington Hills, Michigan.
5. ACI Committee 224. (1990). “Control of cracking in concrete structures.” Manual of
Concrete Practice, Vol. 1, Report No. 224.
6. Adkins, D.F. and Christiansen, V.T. (1989). "Freeze-thaw deterioration of concrete
pavements.” Journal of Materials in Civil Engineering, Vol. 1, No. 2, pp. 97-104.
7. Adkins, D.F. and Merkley, G.P. (1990). "Mathematical model of temperature changes in
concrete pavements.” Journal of Transportation Engineering, Vol. 116, Issue 3, pp. 349-
358.
8. Adkins, D.F. Merkley, G.P. and Brito, G.P. (1993). "Mathematics of concrete scaling.”
Journal of Materials in Civil Engineering, Vol. 5, Issue 2, pp. 280-288.
9. Aïtcin, P.C. (2000). "Cements of yesterday and today, concrete of tomorrow.” Cement and
Concrete research, Vol. 30, Issue 9, pp. 1349-1359.
10. Alampalli, S. and Owens, F. (2000). "Increasing durability of concrete decks using class
HP concrete.” Concrete International, Vol. 22, Issue 7.
11. Al-Khaja, W.A. (1997). "Influence of temperature, cement type and level of concrete
consolidation on chloride ingress in conventional and high-strength concretes.”
Construction and Building Materials, Vol. 11, Issue 1, pp. 9-13.
12. Allan, M.L. (1995). "Probability of corrosion induced cracking in reinforced concrete.”
Cement and Concrete Research, Vol. 25, Issue 6, pp. 1179-1190.
13. Almusallam, A. (2001). "Effect of environmental conditions on the properties of fresh and
hardened concrete.” Cement and Concrete Composites, Vol. 23, Issues 4-5, pp. 353-361.

CENTER FOR STRUCTURAL DURABILITY – Causes & Cures for Cracking of Concrete Barriers 153
14. Almusallam, A.A., Maslehuddin, M., Abdul-Waris, M., and Khan M.M. (1998). “Effect of
mix proportions on plastic shrinkage cracking of concrete in hot environments.”
Construction and Building Materials, Vol. 12 pp. 353-358
15. Al Rawi, A. and Kheder, G.F. (1990). “Control of cracking due to volume change in base
restrained concrete members.” ACI Structural Journal, Vol. 87, Issue 4, pp. 397-405.
16. Alsayed, S. H. (1998). “Influence of superplastisizer and silica fume on the drying
shrinkage of high strength concrete subjected to hot-dry field conditions.” Cement &
Concrete Research, Vol. 28, Issue 10, pp. 1405-1415.
15. Altoubat, S.A., and Lange, D.A. (2001). “Creep, shrinkage, and cracking of restrained
concrete at early age.” ACI Materials Journal, Vol. 98, Issue 4.
16. Anguelov, P. (1995). “Rollerform technology for concrete construction.” ACI Concrete
International, Vol. 17, Issue 10, pp. 50-54.
17. ASHRAE Handbook of Fundamentals. Atlanta: American Society of Heating Refrigerating
and Air Conditioning Engineers, Inc. 1992.
18. Banthia, N., Yan, C., and Mindess, S. (1996). "Restrained shrinkage cracking in fiber
reinforced concrete: a novel test technique." Cement and Concrete Research, Vol. 26, Issue
1, pp. 9-14.
19. Baradan, B., Yazici, H., and Un, H. (2002). Durability in reinforced concrete structures,
Dokuz Eylul Universitesi Muhendislik Fakultesi Yayinlari, Yayin No. 298.
20. Basheer, P.A.M., Chidiact, S.E. and Long, A.E. (1996). “Predictive model for deterioration
of concrete structures.” Construction and Building, Vol. 10, pp. 27-37.
21. Bazant, Z. P. and Murphy, W. P. (1995). “Creep and shrinkage prediction model for
analysis and design of concrete structures – model B3.” ACI Materials and Structures, Vol.
28, pp. 357-365.
22. Bentz, D.P., Garbaczi, E.J., Haecker, C.J. and Jensen O.U.M. (1999). “Effects of cement
particle size distribution on performance properties of Portland cement based materials.”
Vol. 29, pp. 1663-1671.
23. Bentz, D.P. and Snyder, K.A. (1999). "Protected paste volume in concrete extension to
internal curing using saturated lightweight fine aggregate.” Cement and Concrete
Research, Vol. 29, Issue 11, pp. 1863-1867.
CENTER FOR STRUCTURAL DURABILITY – Causes & Cures for Cracking of Concrete Barriers 154
24. Bissonnette, B., Pierre P. and Pigeon, M. (1999). “Influence of key parameters on drying of
cementitious materials.” Cement and Concrete Research, Vol. 29, pp. 1655-1662.
25. Bilodeau, A., Sivasundaram, V., Painter, K.E., and Malhotra, V.M. (1994). “Durability of
concrete incorporating high volumes of fly ash from sources in the U.S.” ACI Material
Journal, Vol. 91, Issue 1, pp. 3-12.
26. Brozzetti, J. (2000). "Design development of steel-concrete composite bridges in France.”
Journal of Constructional Steel Research, Vol. 55, Issues 1-3, pp. 229-243.
27. Borst, R., and Berg, P. (1986). “Analysis of Creep and Cracking in Concrete Members –
Further Viewpoints.” Fourth RILEM International Symposium on Creep & Shrinkage of
Concrete: Mathematical Modeling – Preprints, August 26-29, pp. 527-538.
28. Cai, H. and Liu, X. (1998). "Freeze-thaw durability of concrete: ice formation process in
pores.” Cement and Concrete Research, Vol. 28, Issue 9, pp. 1281-1287.
29. Carlson, R.W. and Reading, T.J. (1988). “Model study of shrinkage cracking in concrete
building walls.” ACI Structural Journal, Vol. 85, Issue 4, pp. 395-404.
30. Chapman, R.A. and Shah, S.P. (1987). "Early-age bond strength in reinforced concrete.”
ACI Materials Journal, Vol. 84, Issue 6.
31. Chatterji, S. (1999). "Aspects of freezing process in porous material-water system (part 2.
Freezing and properties of frozen porous materials).” Cement and Concrete Research, Vol.
29, Issue 5, pp. 781-784.
32. Costa, A. and Appleton, C.J. (2002). "Case studies of concrete deterioration in a marine
environment in Portugal." Cement and Concrete Composites, Vol. 24, Issue 1, pp. 169-179.
33. Cusson, D. and Repette, W. (2000). "Early-age cracking in reconstructed concrete bridge
barrier walls.” ACI Materials Journal, Vol. 97, Issue 4, pp. 438-446.
34. Dhir, R.K., Hewlett, P.C. and Dyer, T.D. (1995). “Durability of ‘self-cure’ concrete.”
Cement and Concrete Research, Vol. 25, pp. 1153-1158.
35. Ding, Y. and Kusterle, W. (1999). “Comparative study of steel fiber-reinforced and steel
mesh reinforced concrete at early ages panel tests.” Cement and Concrete Research, Vol.29,
Issue 11, pp. 1827-1834.
36. “Ecocem Ireland.” (2003). <http://www.ecocem.ie/th_heat.php.> (July 8, 2003)
37. Edwards, D.L. (2000). “HPC on bridges: the Florida experience.” ACI Concrete
International, Vol. 22, Issue 2, pp. 63-65.

CENTER FOR STRUCTURAL DURABILITY – Causes & Cures for Cracking of Concrete Barriers 155
38. EM 1110-2-2002. (1995). “Evaluation and Repair of Concrete Structures.” CECW-EG,
Engineering Manual 1110-2-2002, Department of the Army, U.S. Army Corps of
Engineers, Washington, DC 20314.
39. Fu, Z. (1998). “Slipform pavement construction in China.” ACI Concrete International Vol.
20, Issue 5, pp. 36-38.
40. Gardner N.J., and Lockman M.J., (2001). “Design provisions for drying shrinkage and
creep of normal strength concrete. ” ACI Materials Journal, Vol. 98, No.2, pp. 159-167.
41. Gillot, P.M. and Gillot, J.E. (1996). “Freeze thaw durability of activated blast furnace slag
cement concrete.” ACI Materials Journal, Vol. 93, Issue 3, pp. 242-245.
42. Grattan-Bellew, P.E. (1996). “Microstructural investigation of deteriorated Portland cement
concretes.” Construction and Building Materials, Vol. 10, No. 1, pp. 3-16.
43. Hani N., Suksawang, N., and Mohammed, M. (2003). “Effects of curing methods on early
age and drying shrinkage of high performance concrete.” TRB 2003 Annual meeting CD-
Rom
44. Holley, J.J., Thomas, M.D.A., Hopkins, D.S., Cail, K.M. and Lanctot, M.C. (1999).
“Custom HPC mixtures for challenging bridge design.” ACI Concrete International, Vol.
21, No. 9, pp. 43-48.
45. Hossain, A.B., Pease B. and Weiss J. (2003). “Quantifiying early age stress development
and cracking in low w/c concrete using the restrained ring test with acoustic emission.”
Proceedings of TRB 2003 Annual Meeting.
46. Igarashi, S., Kubo, H.R., and Kawamura, M. (2000). “Long-term volume changes and
microcracks formation in high strength mortars.” Cement and Concrete Research, Vol. 30,
pp. 943-951.
47. Jaycox, C.E. (1982). “Guidance in the establishment of an inspection program.” ACI
Concrete International, Vol. 4, No. 9, pp. 79-83.
48. Jensen, O.M. and Hansen, P.F. (1999). "Influence of temperature on autogenous
deformation and relative humidity change in hardening cement paste." Cement and
Concrete Research, Vol. 29, Issue 4, pp. 567-575.
49. Kheder, G. F., Al Rawi, R.S. and Al Dhahi, J.K. (1994). "Study of the behavior of volume
change cracking in base-restraint concrete walls." ACI Materials Journal, Vol. 91, Issue 2,
pp. 150-157.

CENTER FOR STRUCTURAL DURABILITY – Causes & Cures for Cracking of Concrete Barriers 156
50. Kim, J.K. and Lee, C.S. (1998). "Prediction of differential drying shrinkage in concrete."
Cement and Concrete Research, Vol. 28, Issue 7, pp. 985-994.
51. Kmita, A. (2000). “A new generation of concrete in civil engineering.” Journal of Materials
Processing Technology, Vol.106, pp. 80-86.
52. Kosmatka, S. H. and Panarese, W. C. (1994). Design and Control of Concrete Mixtures.
Thirteenth Edition. Portland Cement Association (PCA), 5420, Old Orchard Road, Skokie,
Illinois.
53. Kovler, K. (1995). “Shock of evaporative cooling of concrete in hot dry climates.” ACI
Concrete International, Vol. 17, Issue 10, pp. 65-69.
54. Li, Z., Qi, M., Li, Z. and Ma, B. (1999). "Crack width of high-performance concrete due to
restrained shrinkage." Journal of Materials in Civil Engineering, Vol. 11, Issue 3, pp. 214-
223.
55. Malhotra, V.M. and Hemmings, R.T. (1995). “Blended cements in North America – a
review.” Cement and Concrete Research, Issue 17, pp. 23-35.
56. Mayer, C.W. (1982). “Quality control by the contractor.” ACI Concrete International, Vol.
4, No. 9, pp. 72-74.
57. Mokarem, D.W., Weyers R.E., and Lane D.S., (2003). “Development of Portland cement
concrete shrinkage performance specifications.” TRB 2003 Annual meeting CD-Rom.
58. Montemor, M.F., Cunha, M.P., Ferreira, M.G. and Simoes, A.M. (2002). “Corrosion
behavior of rebars in fly ash mortar exposed to carbon dioxide and chlorides.” Cement and
Concrete Composites, Vol. 24, pp. 45-53.
59. Naik, T.R., Shiw, S.S. and Hossain, M.M. (1995). "Properties of high performance concrete
systems incorporating large amounts of high-lime fly ash." Construction and Building
Materials, Vol. 9, Issue 4, pp. 195-204.
60. Nehdi, M. (2001). "Ternary and quaternary cements for sustainable development." Concrete
International, Vol. 23, Issue 04.
61. Neville, A.M. (1999). ”Specifying concrete for slipforming.” ACI Concrete International
Vol. 21, Issue 11, pp. 61-63.
62. Neville, A.M. (1995). Properties of concrete. Longman Group, 4th edition.
63. Park. R. and Paulay, T (1975). Reinforced Concrete Structures. John Wiley & Sons, Inc.
CENTER FOR STRUCTURAL DURABILITY – Causes & Cures for Cracking of Concrete Barriers 157
64. Pyć, W. A., Weyers, R. E., Weyers, R. N., Mokarem, D. W., and Zemajtis, J., Sprinkel, M.
M., and Dillard, J. G. (2000). “Field Performance of Epoxy-Coated Reinforcing Steel in
Virginia Bridge Decks.” VTRC 00-R16, Virginia Transportation Research Council,
Charlottesville, Virginia.
65. Ramakrishnan, V. and McDonald, C.N. (1997). “Durability evaluations and performance
histories of projects using polyolefin fiber reinforced concrete.” ACI Special Publication
170, Paper 35, pp. 665-680.
66. Razek, M. M. A., and Enein, S. A. A. (1999). “Moisture performance through fresh
concrete at different environmental conditions.” Cement and Concrete Research. 29, 1819-
1825.
67. Redston, J. (1999). “Canada’s infrastructure benefits from FRP.” Reinforced Plastics,
July/August, pp. 33-34.
68. RILEM-42-CEA. (1981). “Properties of set concrete at early-ages – State of the Art
Report.” Matériaux et Constructions, Vol. 14, No. 84, pp. 399-450.
69. Rixom, R. and Mailvaganam, N. (1999). Chemical admixtures for concrete, Third Edition,
E & FN Spon, London, England.
70. Ronneberg, H. (1989). “Use of chemical admixtures in concrete platforms.” ACI Special
Publication 119, Paper 27, pp. 517-533.
71. Sabir, B.B. (1997). "Mechanical properties and frost resistance of silica fume concrete."
Cement and Concrete Composites, Vol. 19, Issue 4, pp. 285-294.
72. Samman, T.A., Mirza, W.H. and Wafa, F.F. (1996). “Plastic shrinkage cracking of normal
and high strength concrete: a comparative study.” ACI Material Journal, Vol. 93, pp. 36-40.
73. Schutter, G.D. and Taerwe (1996). “Estimation of early age thermal cracking tendency of
massive concrete elements by means of equivalent thickness.” ACI Materials Journal, Vol.
93, Issue 5, pp. 403-408.
74. Schmitt, T.R., and Dawin, D., (1999). “Effect of material properties on cracking in bridge
decks.” Journal of Bridge Engineering.
75. Shah, S. P., Marikunte, S., Yang, W., and Aldea, C. (1996). “Control of cracking with
shrinkage-reducing admixtures.” Transportation Research Record, pp. 25.
76. Shilstone, J.M., Jr. and Shilstone, J.M. (2002). “Performance based concrete mixtures and
specifications for today.” ACI Concrete International, Vol. 24, Issue 2, pp. 80-83.
CENTER FOR STRUCTURAL DURABILITY – Causes & Cures for Cracking of Concrete Barriers 158
77. Siew, P. F., Puapansawat, T., and Wu, Y. H. (2003). “Temperature and heat stress in a
concrete column at early ages.” The ANZIAM Journal, Vol. 44, Issue E, pp. C705-C722.
78. “Specbook.” (2003). <http://www.mdot.state.mi.us/specbook/ >, (May 5, 2003)
79. Staton, J.F. and Knauff, J. (1999). “Evaluation of Michigan’s concrete barrier.” MDOT
Construction and Technology Division Report.
80. Stewart, M.G. and Rosowsky, D.V. (1998). “Time dependent reliability of deteriorating
reinforced concrete bridge decks.” Structural Safety, Vol. 20, pp. 91-109.
81. Swamy, R.N. (1989). “Super plasticizers and concrete durability.” ACI Special Publication
119, Article 19, pp. 363-382.
82. Swamy, R.N. (1997). ”Design for durability and strength through the use of fly ash and slag
in concrete.” ACI Special Publication 171, Paper 1, pp. 1-72.
83. Uzzafar, R. (1992). "Influence of cement composition on concrete durability." ACI
Materials Journal, Vol. 89, Issue 6.
84. Van Dam, T. J., Delem, L., Peterson, K.R., and Sutter, L.L. (2003). Causes and Cures for
Cracking of Concrete Barriers. RC-1445. Michigan Department of Transportation,
Construction and Technology Division, Lansing, MI 48909.
85. Van Dam, T. J., Sutter, L.L., Smith, K.D., Wade, M.J., and Peterson, K.R. (2002).
Guidelines for the Detection, Analysis, and Treatment of Materials-Related Distress in
Concrete Pavements - Vol. 2: Guidelines Description and Use. FHWA-RD-01-164. Federal
Highway Administration, McLean, VA.
86. Vincent, E. C. (2003). Compressive Creep of a Lightweight, High Strength Concrete
Mixture. Master Thesis. Virginia polytechnic Institute and State University, Blacksburg,
VA, January 10, 2003.
87. Whiting, D. and Schmitt J. (1989). “A model for deicer scaling resistance of field concretes
containing high-range water reducers.” ACI Special Publication 119, Paper 18, pp. 343-
359.
88. Wiegrink, K., Marikunte, S. and Shah S. (1996). “Shrinkage cracking of high strength
concrete.” ACI Materials Journal, Vol. 93, Issue 5, pp. 409-415.
89. Xu Y. and Chung D.D.L. (2000). “Reducing the drying shrinkage of cement paste by
admixture surface treatments.” Cement and Concrete Research, Vol. 30, pp. 241-245.

CENTER FOR STRUCTURAL DURABILITY – Causes & Cures for Cracking of Concrete Barriers 159
ADDITIONAL DOCUMENTS
The interested reader may also refer to the following documents.
1. Cusson, D. and Mailvaganam, N.P. (1999). “Corrosion-inhibiting systems.” ACI Concrete
International, Vol. 21, Issue 8, pp. 41-47.
2. De Schutter, G. and Taerwe, L. (1996). "Estimation of early-age thermal cracking
tendency of massive concrete elements by means of equivalent thickness." ACI Materials
Journal, Vol. 93, Issue 5.
3. Engelund, S. and Sorensen, J.D. (1998). “A probabilistic model for chloride ingress and
initiation of corrosion in reinforced concrete structures.” Structural Safety, Issue 20, pp. 69-
89.
4. Enright, M.P. and Frangopol, D.M. (1998). "Probabilistic analysis of resistance degradation
of reinforced concrete bridge beams under corrosion." Engineering Structures, Vol. 20,
Issue 11, pp. 960-971.
5. Forster, S.W. (2000). "HIPERPAV-guidance to avoid early-age cracking in concrete
pavements." ACI Special Publication, Vol. 192.
6. Fowler D.W. (1999). “Polymers in concrete a vision for the 21st century.” Cement and
Concrete Composites, Vol. 21, pp. 449-452.
7. Fraczek, J. (1979). "ACI survey of concrete structure errors." Concrete International, Vol.
1, Issue 12.
8. Freidin, C. (1999). “Hydration and strength development of binder on high calcium oil fly
ash: part II influence of curing conditions on long term stability.” Cement and Concrete
Research, Vol. 29, Issue 11, pp. 1713-1719.
9. Ghaffori, N. and Mathis, R. (1998). "Prediction of freezing and thawing durability of
concrete paving blocks." Journal of Materials in Civil Engineering, Vol. 10, Issue 1, pp. 45-
51.
10. Golterman, P. (1994). “Mechanical predictions on concrete deterioration. part 1:
eigenstresses in concrete.” ACI Material Journal, Vol. 91, Issue 6, pp. 543-550.
11. Gowripalan, N.V., Sirivivatnanon, C. and Lim, C. (2000). "Chloride diffusivity of concrete
cracked in flexure." Cement and Concrete Research, Vol. 30, Issue 5, pp. 725-730.

CENTER FOR STRUCTURAL DURABILITY – Causes & Cures for Cracking of Concrete Barriers 160
12. Guenot, L., Torrenti, J.M. and Laplante, P. (1996). "Stresses in early-age concrete:
comparison of different creep models." ACI Materials Journal, Vol. 93, Issue 3, pp. 254-
259.
13. Guo, C. (1994). “Early age behavior of Portland cement paste.” ACI Materials Journal,
Vol. 91, Issue 1, pp. 13-25.
14. Hawks, N.F., Teng T.P., Bellinger W.Y. and Rogers, R.B. (1993). Distress identification
manual for the long term pavement performance project, Strategic Highway Research
Program, SHRP-P-338.
15. Ho, D.W.S. and Chirgwin, G.J. (1996). "A performance specification for durable concrete."
Construction and Building Materials, Vol. 10, Issue 5, pp. 375-379.
16. Hong, K. and Hooton, R.D. (1999). "Effects of cyclic chloride exposure on penetration of
concrete cover." Cement and Concrete Research, Vol. 29, Issue 9, pp. 1379-1386.
17. Hong, K. and Hooton, R.D. (2000). “Effects of fresh water exposure on chloride
contaminated concrete.” Cement and Concrete Research, Vol. 30, pp. 1199-1207.
18. Hue, F., Serrano, G., and Bolaño, J.A. (2000). "Öresund Bridge: Temperature and cracking
control of the deck slab concrete at early ages." Automation in Construction, Vol. 9, Issues
5-6, pp. 437-445.
19. Hughes, B.P. and Mahmood, A.T. (1988). "Laboratory investigation of early thermal
cracking of concrete." ACI Materials Journal, Vol. 85, Issue 3, pp. 164-171.
20. Jeknavorian, A. and Barry, E.F. (1999). "Determination of durability-enhancing admixtures
in concrete by thermal desorption and pyrolysis gas chromatography-mass spectrometry."
Cement and Concrete Research, Vol. 29, Issue 6, pp. 899-907.
21. Jones, M.R., Dhir, R.K. and Gill, J.P. (1995). "Concrete surface treatment: effect of
exposure temperature on chloride diffusion resistance." Cement and Concrete Research,
Vol. 25, Issue 1, pp. 197-208.
22. Kawamura, M.K. and Nakamura, H. (2001). "Development of a bridge management
system for existing bridges." Advances in Engineering Software, Vol. 32, Issues 10-11, pp.
821-833.
23. Khan, M.S. (1991). "Corrosion state of reinforcing steel in concrete at early ages." ACI
Materials Journal, Vol. 88, Issue 1, pp. 37-40.

CENTER FOR STRUCTURAL DURABILITY – Causes & Cures for Cracking of Concrete Barriers 161
24. Lachemi, M. and Aitcin, P.C. (1997). “Influence of ambient and fresh concrete
temperatures on the maximum temperature and thermal gradient in a high performance
concrete structure.” ACI Materials Journal, Vol. 94, Issue 2, pp. 102-109.
25. Liang, M.T., Wang, K.L. and Liang, C.H. (September 1999). "Service life prediction of
reinforced concrete structures." Cement and Concrete Research, Vol. 29, Issue 9, pp. 1411-
1418.
26. Long, E., Henderson, G.D. and Montgomery, F.R. (2001). "Why assess the properties of
near-surface concrete?" Construction and Building Materials, Vol. 15, Issues 2-3, pp. 65-
79.
27. Lou, Z., Gunaratne, M., Lu, J.J. and Dietrich, B. (2001). "Application of a neural network
model to forecast short-term pavement crack condition: florida case study." Journal of
Infrastructure Systems, Vol. 7, Issue 4, pp. 166-171.
28. Lykke, S., Skotting, E. and Kjaer, U. (2000). "Prediction and control of early-age cracking:
experiences from the oresund tunnel." Concrete International, Vol. 22, Issue 9.
29. Miao B., Chaallal O., Perraton D. and Aitcin P.C. (1993). “On site early age monitoring of
high performance concrete columns.” ACI Materials Journal, Vol. 90, Issue 5, pp. 415-420.
30. McConnell, V. (1999). “Composites make progress in reinforcing concrete.” Reinforced
Plastics, July/August, pp. 40-46.
31. Mietz, J. and Isecke, B. (1996). "Monitoring of concrete structures with respect to rebar
corrosion." Construction and Building Materials, Vol. 10, Issue 5, pp. 367-373.
32. Mohamed, O.A., Rens, K.L. and Stalnaker, J.J. (2000). "Factors affecting resistance of
concrete to freezing and thawing damage." Journal of Materials in Civil Engineering, Vol.
12, Issue 1, pp. 26-32.
33. Nagi, M., Janssen, D. and Whiting, D. (1994). "Durability of concrete for early opening of
repaired highways - field evaluation (SP-145)." ACI Special Publication, Vol. 145.
34. Neville, A.M. (2000). “The question of concrete durability: we can make good concrete
today.” ACI Concrete International, Vol. 22, Issue 7, pp. 21-26.
35. Nmai, C.K. (1998). "Cold weather concreting admixtures." Cement and Concrete
Composites, Vol. 20, Issues 2-3, pp. 121-128.
36. Nmai, C., Tomita, R., Hondo, F. and Buffenbarger, J. (1998). "Shrinkage-reducing
admixtures.” Concrete International, Vol. 20, Issue 4.
CENTER FOR STRUCTURAL DURABILITY – Causes & Cures for Cracking of Concrete Barriers 162
37. Ohama, Y., Demura, K., Satoh, Y., Tachibana, K. and Miyazaki Y. (1989). ”Development
of admixtures for highly durable concrete.” ACI Special Publication 119, Article 17, pp.
322-342.
38. Osretgoard, L., Lange, D.A., Altaubat, S.A. and Stang, H. (2001). "Tensile basic creep of
early-age concrete under constant load." Cement and Concrete Research, Vol. 31, Issue 12,
pp. 1895-1899.
39. Pedeferri, P. (1996). “Cathodic protection and cathodic prevention.” Construction and
Building Materials, Vol. 10, No. 5, pp. 391-402.
40. Pheeraphan, T. and Leung, C.K.Y. (1997). "Freeze-thaw durability of microwave cured air-
entrained concrete." Cement and Concrete Research, Vol. 27, Issue 3, pp. 427-435.
41. Phelan W.S. (2000). “Admixtures and aggregates: key elements of athletic concrete.” ACI
Concrete International, Vol. 22, Issue 4, pp. 35-39.
42. Reed, R.C. (1993). "Cracking - an early warning of structural problems." Concrete
International, Vol. 15, Issue 9.
43. Rhodes J.A. and Carreira D. (1997). “Prediction of creep, shrinkage, and temperature
effects in concrete structures.” ACI Manual of Concrete Practice, Vol. 1, Report 209-R.
44. Rostam, S. (1996). "High performance concrete cover - why it is needed, and how to
achieve it in practice." Construction and Building Materials, Vol. 10, Issue 5, pp. 407-421.
45. Samples, L.M. and Ramirez, J.A. (2000). “Field investigation of concrete bridge decks in
Indiana.” ACI Concrete International, Vol. 22, Issue 2, pp. 53-56.
46. Schiessl, P. (1996). "Durability of reinforced concrete structures." Construction and
Building Materials, Vol. 10, Issue 5, pp. 289-292.
47. Sellevlod, E.J. (1996). "High-performance concrete: early age cracking, pore structure, and
durability (SP-159)." ACI Special Publication, Vol. 159.
48. Shaeles, C.A. (1988). “Influence of mix proportions and construction operations on plastic
shrinkage cracking in thin slabs.” ACI Material Journal, Vol. 85, pp. 495-504.
49. Shihata, S.A. and Baghdadi, Z.A. (2001). "Simplified method to assess freeze-thaw
durability of soil cement." Journal of Materials in Civil Engineering, Vol. 13, Issue 4, pp.
243-247.

CENTER FOR STRUCTURAL DURABILITY – Causes & Cures for Cracking of Concrete Barriers 163
50. Siebel, E. (1989). “Air-void characteristics and freezing and thawing resistance of
superplasticized air entrained concrete with high workability.” ACI Special Publication
119, Paper 16, pp. 297-319.
51. Simonsen, E., Janoo, V.C. and Isacsson, U. (1997). "Prediction of pavement response
during freezing and thawing using finite element approach." Journal of Cold Regions
Engineering, Vol. 11, Issue 4, pp. 308-324.
52. Smith J.L. and Virmani, Y.P. (2000). Materials and methods for corrosion control of
reinforced and prestressed concrete structures in new construction. LTTP Publication No:
00-091.
53. Sun, W., Zhang, Y.M., Yan, H.D. and Mu, R. (1999). "Damage and damage resistance of
high strength concrete under the action of load and freeze-thaw cycles." Cement and
Concrete Research, Vol. 29, Issue 9, pp. 1519-1523.
54. Tang, T., Zollinger, D.G. and Yoo, R.H. (1993). "Fracture toughness of concrete at early
ages." ACI Materials Journal, Vol. 90, Issue 5.
55. Tay, D.C.K. and Tam, C.T. (1996). "In situ investigation of the strength of deteriorated
concrete." Construction and Building Materials, Vol. 10, Issue 1, pp. 17-26.
56. Taylor, H.F.W. (1990). Cement Chemistry, Academic Press Ltd, London, England.
57. Toutanji, H.A (1999). “Durability characteristics of concrete columns confined with
advanced composite materials.” Composite Structures, Vol. 44, pp. 155-161.
58. Ulm, F.J. and Coussy, O. (2001). "What is a 'massive' concrete structure at early ages?
some dimensional arguments." Journal of Engineering Mechanics, Vol. 127, Issue 5, pp.
512-522.
59. Wang K., Jansen, D. and Shah, S.P. (1997). “Permeability of cracked concrete.” Cement
and Concrete Research, Vol. 27, No. 3, pp. 381-393.
60. Weiss, W.J., Yang, W. and Shah, S.P. (2000). "Factors influencing durability and early-age
cracking in high-strength concrete structures." ACI Special Publication, Vol. 189.
61. Wong, G.S., Alexander, A.M., Haskins, R., Poole, T.S., Malone P.G. and Wakeley, L.
(2001). Portland cement concrete rheology and workability – final report. FHWA report
(FHWA-RD-00-025).
CENTER FOR STRUCTURAL DURABILITY – Causes & Cures for Cracking of Concrete Barriers 164
62. Wood, J.G.M. and Crerar, J. (1997). "Tay road bridge: analysis of chloride ingress
variability & prediction of long term deterioration." Construction and Building Materials,
Vol. 11, Issue 4, pp. 249-254.
63. Zhou, Y., Cohen, M.D. and Dolch, W.L. (1995). "Effect of external loads on the frost-
resistant properties of mortar with and without silica fume." ACI Materials Journal, Vol.
91, Issue 6.

CENTER FOR STRUCTURAL DURABILITY – Causes & Cures for Cracking of Concrete Barriers 165
APPENDIX A
Cover Letter and the Proposed Survey

CENTER FOR STRUCTURAL DURABILITY – Causes & Cures for Cracking of Concrete Barriers 166
Causes and Cures for Cracking of Concrete Barriers Michigan Department of Transportation
This survey will take you approximately 10- 15 minutes
Please check this box if you like to receive a copy of survey results. Project Summary The objective of this research project, funded by Michigan Department of Transportation (MDOT), is to recognize causes and to employ cures for premature deterioration of New Jersey (NJ) type concrete barriers. The causes will be investigated and recommendations will be made that are intended to increase the service life and to reduce premature deterioration of concrete barriers. As a result of this research, those methods that are immediately implementable in Michigan will be recommended for action. The following information would be greatly appreciated.
Your Name: ____________________________ Phone: _________________________ E-mail: ________________________________ If you cannot complete this entire survey, please provide us the brief information requested only on this page. This will lead us to the personnel in your organization who may have the information and/or experience on concrete barriers. Thank you very much for your time and effort.
Name: ________________________________ Phone: _________________________ E-mail: ________________________________ Name: ________________________________ Phone: _________________________ E-mail: ________________________________ Should you have questions in this regard, please contact the MDOT project manager. John F. Staton, P.E.
Supervising Engineer, Materials Research Group Construction & Technology, Michigan Department of Transportation P.O. Box 30049 Lansing, MI 48909 Phone: 517-322-5701 Fax: 517-322-5664 E-mail: [email protected]

CENTER FOR STRUCTURAL DURABILITY – Causes & Cures for Cracking of Concrete Barriers 167
1. How frequently do you observe any of the following premature distress conditions in your bridge barriers? If yes, please indicate.
Map cracked areas
Low Medium High
Horizontal cracking near joints
Low Medium High
Continuous horizontal cracks near the top and along the length of barrier
Low Medium High

CENTER FOR STRUCTURAL DURABILITY – Causes & Cures for Cracking of Concrete Barriers 168
Vertical cracking within the proximity of the joint
Low Medium High
Multiple vertical cracks between joints
Low Medium High
Multiple vertical cracking near the barrier toe
Low Medium High

CENTER FOR STRUCTURAL DURABILITY – Causes & Cures for Cracking of Concrete Barriers 169
Severe section loss at or near the top of the barrier
Low Medium High
Local popout
Low Medium High
Signs of corrosion due to lack of concrete cover
Low Medium High

CENTER FOR STRUCTURAL DURABILITY – Causes & Cures for Cracking of Concrete Barriers 170
2. Do you observe an overall durability problem with the NJ-type concrete bridge barriers?
Yes / No
3. What construction procedures are being used for casting NJ-type barriers in your Agency?
Cast-in-place
Slipfom
Other (Please specify): _________________________________
4. What curing procedures are being used/specified for barriers?
5. Is your Agency specifying epoxy-coated reinforcement for the barriers? Yes / No If yes, please specify since when: _________________________________
6. Are coatings/sealants currently being specified for barriers?
Yes / No 7. Does your Agency specify a concrete mix design for the barriers different than the deck?
(Please describe)
8. Has your Agency used ground granulated blast furnace slag, fly ash or other pozzolans in the mix for the reduction of the permeability of barrier concrete?
Yes / No If yes, please specify: _____________________________(Percentages of total cementitous materials)
9. What is the surface finish method that is used for barrier concrete?

CENTER FOR STRUCTURAL DURABILITY – Causes & Cures for Cracking of Concrete Barriers 171
Sacked / Rubbed / Other , please specify: _______________________
10. Do you observe differences in performance between barriers on rural roads versus trunkline/interstate routes?
Yes / No If yes, any explanation why?
11. Does your Agency apply deicers to the bridge deck?
Yes / No If yes, what kind of deicer (CMA, Salt, etc.): _________________
12. Has your Agency initiated any changes to improve the durability of NJ-type barriers? (Check all that apply)
Changing the mix design (Cement content, cement type, mineral admixture, water-cement ratio, aggregate, and admixture)
Changing curing and/or construction procedure
Other changes, please explain:
13. If your Agency performed or participated in research related to this topic, can you please provide a contact name:
Name: ________________________________ Phone: _________________________ E-mail: ________________________________ You can also print and fax a hard copy to 313-577 3881

CENTER FOR STRUCTURAL DURABILITY – Causes & Cures for Cracking of Concrete Barriers 172
Compiled Survey Response Data
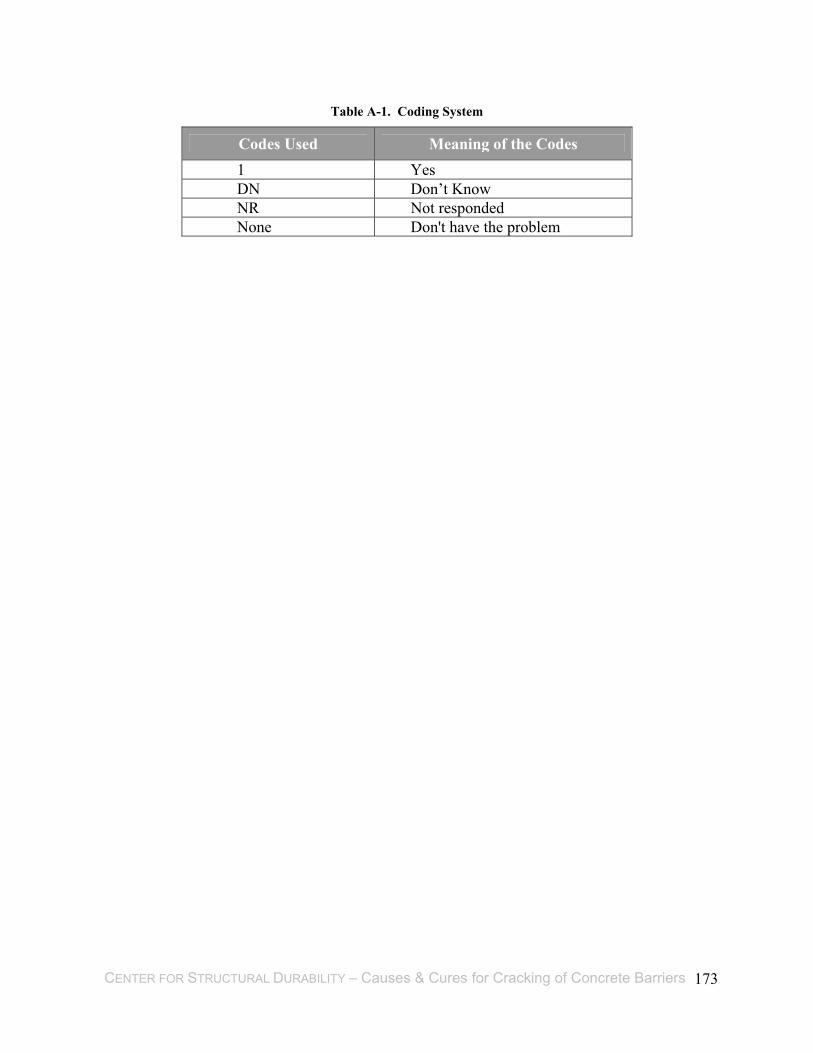
CENTER FOR STRUCTURAL DURABILITY – Causes & Cures for Cracking of Concrete Barriers 173
Table A-1. Coding System
Codes Used Meaning of the Codes 1 Yes DN Don’t Know NR Not responded None Don't have the problem

CENTER FOR STRUCTURAL DURABILITY – Causes & Cures for Cracking of Concrete Barriers 174
Table A-2. Response to Question No. 1(a)
How frequently do you observe any of the following premature distress conditions in your bridge barriers? (a) Map cracked areas
States
High Medium Low Comments Alabama (1) 1
1 Alabama (2) 1 2 Connecticut 1 3 D.C. 1 4 Florida 1 5 Hawaii 1
Idaho (1) 1 6 Idaho (2) 1
Illinois (1) 1 7 Illinois (2) 1 8 Indiana 1 9 Maryland 1
10 Massachusetts 1 Michigan (1) 1 Michigan (2) 1 Michigan (3) 1 11
Michigan (4) 1 12 Minnesota 1 13 Missouri 1 14 Montana 1 15 Nebraska 1 16 Nevada 1 17 New Hampshire 1 18 New Jersey 1
New Mexico (1) 1 New Mexico (2) 1 19 New Mexico (3) 1 New York (1) 1
20 New York (2) 1 21 North Dakota 1
Tennessee (1) 1 Tennessee (2) 1 22 Tennessee (3) 1
23 Texas 1 24 Vermont 1
Virginia (1) 1 25 Virginia (1) 1 26 Washington 1

CENTER FOR STRUCTURAL DURABILITY – Causes & Cures for Cracking of Concrete Barriers 175
Table A-3. Response to Question 1(b)
How frequently do you observe any of the following premature distress conditions in your bridge barriers? (b) Horizontal cracking near joints
States
High Medium Low Comments Alabama (1) 1 1 Alabama (2) 1
2 Connecticut 1 3 D.C. 1 4 Florida 1 5 Hawaii 1
Idaho (1) 1 6 Idaho (2) 1 Illinois (1) 1 7 Illinois (2) 1
8 Indiana 1 9 Maryland 1
10 Massachusetts 1 Michigan (1) 1 Michigan (2) 1 Michigan (3) 1 11
Michigan (4) 1 12 Minnesota 1 13 Missouri 1 14 Montana 1 15 Nebraska 1 16 Nevada 1 17 New Hampshire 1 18 New Jersey 1
New Mexico (1) 1 New Mexico (2) 1 19 New Mexico (3) 1 New York (1) NR 20 New York (2) 1
21 North Dakota 1 Tennessee (1) 1 Tennessee (2) 1 22 Tennessee (3) 1
23 Texas 1 24 Vermont 1
Virginia (1) 1 25 Virginia (2) 1 26 Washington 1

CENTER FOR STRUCTURAL DURABILITY – Causes & Cures for Cracking of Concrete Barriers 176
Table A-4. Response to Question 1(c)
How frequently do you observe any of the following premature distress conditions in your bridge barriers? (c) Continuous horizontal cracking near the top &along the length of barrier
States
High Medium Low Comments Alabama (1) 1 1 Alabama (2) 1
2 Connecticut 1 3 D.C. 1 4 Florida 1 5 Hawaii 1
Idaho (1) 1 6 Idaho (2) 1 Illinois (1) 1 7 Illinois (2) 1
8 Indiana 1 9 Maryland 1
10 Massachusetts NR Michigan (1) 1 Michigan (2) 1 Michigan (3) 1 11
Michigan (4) 1 12 Minnesota 1 13 Missouri 1 14 Montana 1 15 Nebraska 16 Nevada 1 17 New Hampshire 1 18 New Jersey None
New Mexico (1) 1 New Mexico (2) 1 19 New Mexico (3) 1 New York (1) NR 20 New York (2) 1
21 North Dakota NR Tennessee (1) 1 Tennessee (2) 1 22 Tennessee (3) 1
23 Texas 1 24 Vermont 1
Virginia (1) 1 25 Virginia (2) 1 26 Washington 1
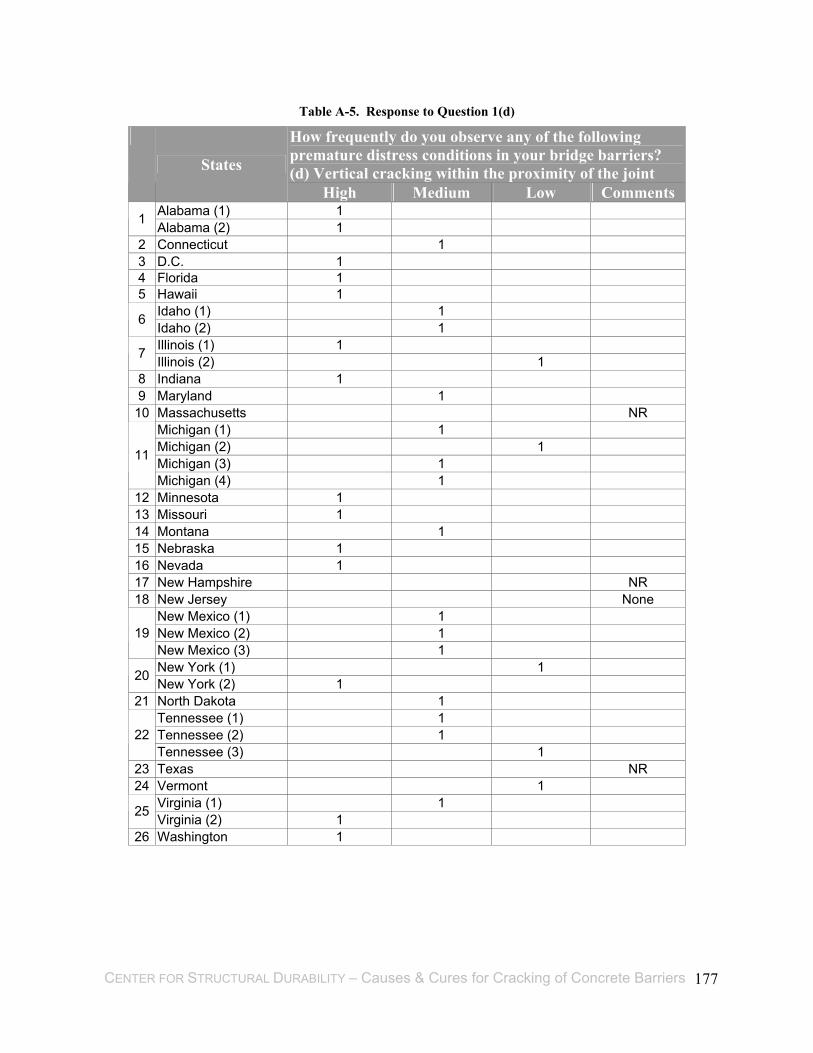
CENTER FOR STRUCTURAL DURABILITY – Causes & Cures for Cracking of Concrete Barriers 177
Table A-5. Response to Question 1(d)
How frequently do you observe any of the following premature distress conditions in your bridge barriers? (d) Vertical cracking within the proximity of the joint
States
High Medium Low Comments Alabama (1) 1 1 Alabama (2) 1
2 Connecticut 1 3 D.C. 1 4 Florida 1 5 Hawaii 1
Idaho (1) 1 6 Idaho (2) 1 Illinois (1) 1 7 Illinois (2) 1
8 Indiana 1 9 Maryland 1
10 Massachusetts NR Michigan (1) 1 Michigan (2) 1 Michigan (3) 1 11
Michigan (4) 1 12 Minnesota 1 13 Missouri 1 14 Montana 1 15 Nebraska 1 16 Nevada 1 17 New Hampshire NR 18 New Jersey None
New Mexico (1) 1 New Mexico (2) 1 19 New Mexico (3) 1 New York (1) 1 20 New York (2) 1
21 North Dakota 1 Tennessee (1) 1 Tennessee (2) 1 22 Tennessee (3) 1
23 Texas NR 24 Vermont 1
Virginia (1) 1 25 Virginia (2) 1 26 Washington 1

CENTER FOR STRUCTURAL DURABILITY – Causes & Cures for Cracking of Concrete Barriers 178
Table A-6. Response to Question 1 (e)
How frequently do you observe any of the following premature distress conditions in your bridge barriers? (e) Multiple vertical cracking between joints
States
High Medium Low Comments Alabama (1) 1 1 Alabama (2) 1
2 Connecticut 1 3 D.C. 1 4 Florida 1 5 Hawaii 1
Idaho (1) 1 6 Idaho (2) 1 Illinois (1) 1 7 Illinois (2) 1
8 Indiana 1 9 Maryland 1
10 Massachusetts 1 Michigan (1) 1 Michigan (2) 1 Michigan (3) 1 11
Michigan (4) 1 12 Minnesota 1 13 Missouri 1 14 Montana 1 15 Nebraska 1 16 Nevada 1 17 New Hampshire NR 18 New Jersey 1
New Mexico (1) New Mexico (2) 1 19 New Mexico (3) 1 New York (1) 1 20 New York (2) 1
21 North Dakota NR Tennessee (1) 1 Tennessee (2) 1 22 Tennessee (3) 1
23 Texas 1 24 Vermont 1
Virginia (1) 1 25 Virginia (2) 1 26 Washington 1

CENTER FOR STRUCTURAL DURABILITY – Causes & Cures for Cracking of Concrete Barriers 179
Table A-7. Response to Question 1 (f)
How frequently do you observe any of the following premature distress conditions in your bridge barriers? (f) Multiple vertical cracking near the barrier toe
States
High Medium Low Comments Alabama (1) 1 1 Alabama (2) 1
2 Connecticut 1 3 D.C. 1 4 Florida 1 5 Hawaii 1
Idaho (1) 1 6 Idaho (2) 1 Illinois (1) 1 7 Illinois (2) 1
8 Indiana 1 9 Maryland 1
10 Massachusetts NR Michigan (1) 1 Michigan (2) 1 Michigan (3) 1 11
Michigan (4) 1 12 Minnesota 1 13 Missouri 1 14 Montana 1 NR 15 Nebraska 1 16 Nevada 1 17 New Hampshire NR 18 New Jersey 1
New Mexico (1) 1 New Mexico (2) 1 19 New Mexico (3) 1 New York (1) 1 20 New York (2) 1
21 North Dakota 1 Tennessee (1) 1 Tennessee (2) 1 22 Tennessee (3) 1
23 Texas 24 Vermont 1
Virginia (1) 1 25 Virginia (2) 1 26 Washington 1
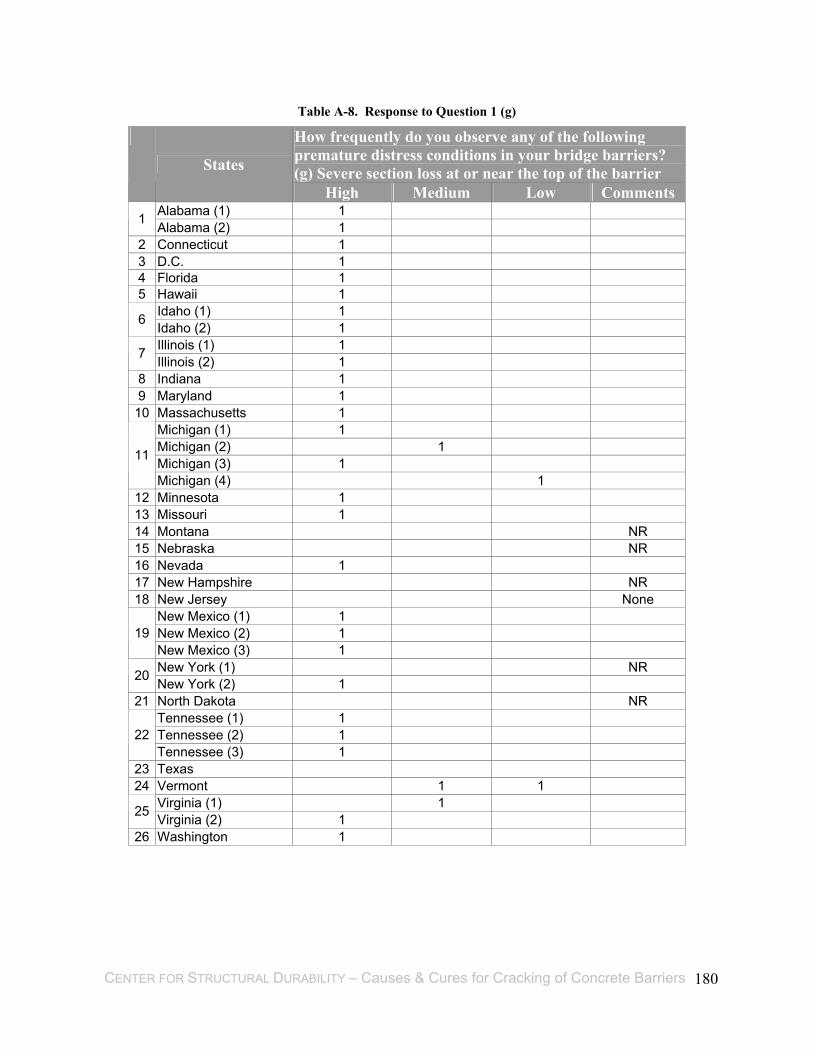
CENTER FOR STRUCTURAL DURABILITY – Causes & Cures for Cracking of Concrete Barriers 180
Table A-8. Response to Question 1 (g)
How frequently do you observe any of the following premature distress conditions in your bridge barriers? (g) Severe section loss at or near the top of the barrier
States
High Medium Low Comments Alabama (1) 1 1 Alabama (2) 1
2 Connecticut 1 3 D.C. 1 4 Florida 1 5 Hawaii 1
Idaho (1) 1 6 Idaho (2) 1 Illinois (1) 1 7 Illinois (2) 1
8 Indiana 1 9 Maryland 1
10 Massachusetts 1 Michigan (1) 1 Michigan (2) 1 Michigan (3) 1 11
Michigan (4) 1 12 Minnesota 1 13 Missouri 1 14 Montana NR 15 Nebraska NR 16 Nevada 1 17 New Hampshire NR 18 New Jersey None
New Mexico (1) 1 New Mexico (2) 1 19 New Mexico (3) 1 New York (1) NR 20 New York (2) 1
21 North Dakota NR Tennessee (1) 1 Tennessee (2) 1 22 Tennessee (3) 1
23 Texas 24 Vermont 1 1
Virginia (1) 1 25 Virginia (2) 1 26 Washington 1
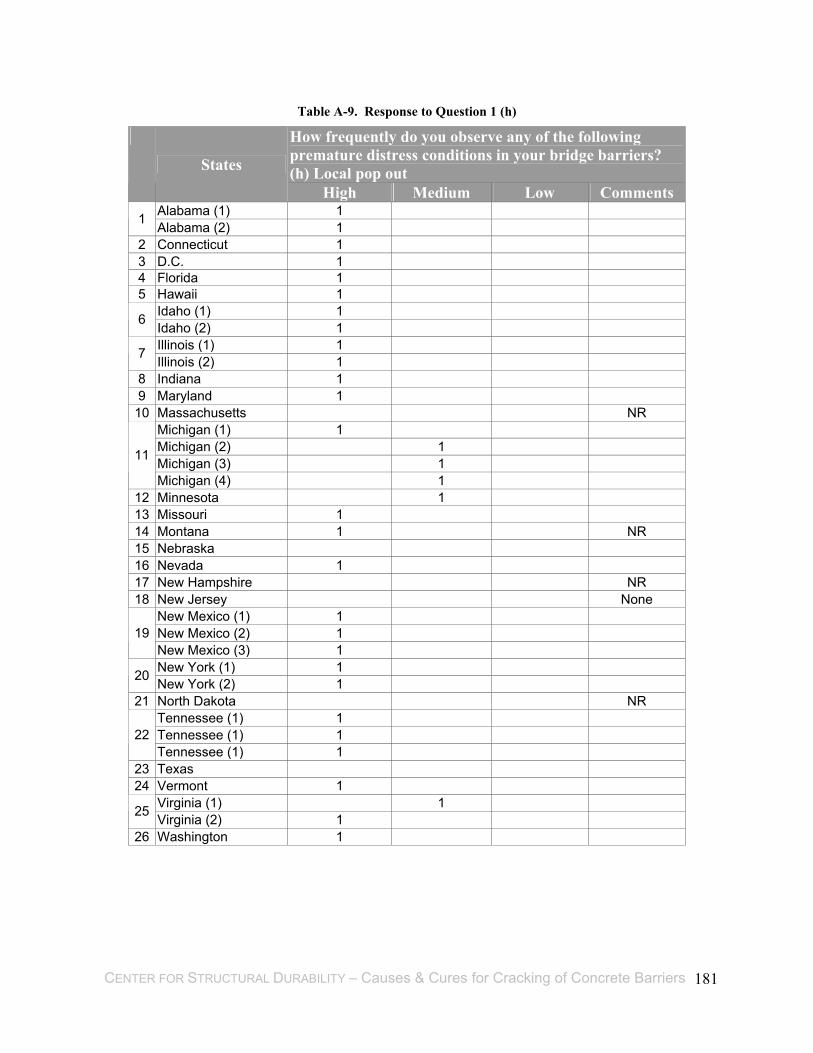
CENTER FOR STRUCTURAL DURABILITY – Causes & Cures for Cracking of Concrete Barriers 181
Table A-9. Response to Question 1 (h)
How frequently do you observe any of the following premature distress conditions in your bridge barriers? (h) Local pop out
States
High Medium Low Comments Alabama (1) 1 1 Alabama (2) 1
2 Connecticut 1 3 D.C. 1 4 Florida 1 5 Hawaii 1
Idaho (1) 1 6 Idaho (2) 1 Illinois (1) 1 7 Illinois (2) 1
8 Indiana 1 9 Maryland 1
10 Massachusetts NR Michigan (1) 1 Michigan (2) 1 Michigan (3) 1 11
Michigan (4) 1 12 Minnesota 1 13 Missouri 1 14 Montana 1 NR 15 Nebraska 16 Nevada 1 17 New Hampshire NR 18 New Jersey None
New Mexico (1) 1 New Mexico (2) 1 19 New Mexico (3) 1 New York (1) 1 20 New York (2) 1
21 North Dakota NR Tennessee (1) 1 Tennessee (1) 1 22 Tennessee (1) 1
23 Texas 24 Vermont 1
Virginia (1) 1 25 Virginia (2) 1 26 Washington 1

CENTER FOR STRUCTURAL DURABILITY – Causes & Cures for Cracking of Concrete Barriers 182
Table A-10. Response to Question 1 (i)
How frequently do you observe any of the following premature distress conditions in your bridge barriers? (i) Signs of corrosion due to lack of concrete cover
States
High Medium Low Comments Alabama (1) 1 1 Alabama (2) 1
2 Connecticut 1 3 D.C. 1 4 Florida 1 5 Hawaii 1
Idaho (1) 1 6 Idaho (2) 1 Illinois (1) 1 7 Illinois (2) 1
8 Indiana 1 9 Maryland 1 10 Massachusetts 1 NR
Michigan (1) 1 Michigan (2) 1 Michigan (3) 1
11
Michigan (4) 1 12 Minnesota 1 13 Missouri 1 14 Montana 1 15 Nebraska NR 16 Nevada 1 17 New Hampshire NR 18 New Jersey None
New Mexico (1) 1 New Mexico (2) 1
19
New Mexico (3) 1 New York (1) NR 20 New York (2) 1
21 North Dakota NR Tennessee (1) 1 Tennessee (2) 1
22
Tennessee (3) 1 23 Texas 1 24 Vermont 1
Virginia (1) 1 25 Virginia (2) 1
26 Washington 1

CENTER FOR STRUCTURAL DURABILITY – Causes & Cures for Cracking of Concrete Barriers 183
Table A-11. Response to Question 2
Do you observe an overall durability problem with the NJ-type concrete bridge barriers?
States
Yes No Comments Alabama (1) 1 1 Alabama (2) 1
2 Connecticut 1 3 D.C. 1 4 Florida 1 5 Hawaii 1
Idaho (1) 1 6 Idaho (2) 1 Illinois (1) 1 7 Illinois (2) 1
8 Indiana 1 9 Maryland 10 Massachusetts 1
Michigan (1) 1 Michigan (2) 1 Michigan (3) 1 11
Michigan (4) 1 12 Minnesota 1 13 Missouri 1 14 Montana 1 15 Nebraska 1 16 Nevada 1 17 New Hampshire 1 18 New Jersey 1
New Mexico (1) 1 New Mexico (2) 1 19 New Mexico (3) 1 New York (1) 1 20 New York (2) 1
21 North Dakota 1 Tennessee (1) 1 Tennessee (2) 1 22 Tennessee (3) 1
23 Texas 1 24 Vermont 1
Virginia (1) 1 25 Virginia (2) 1 26 Washington 1
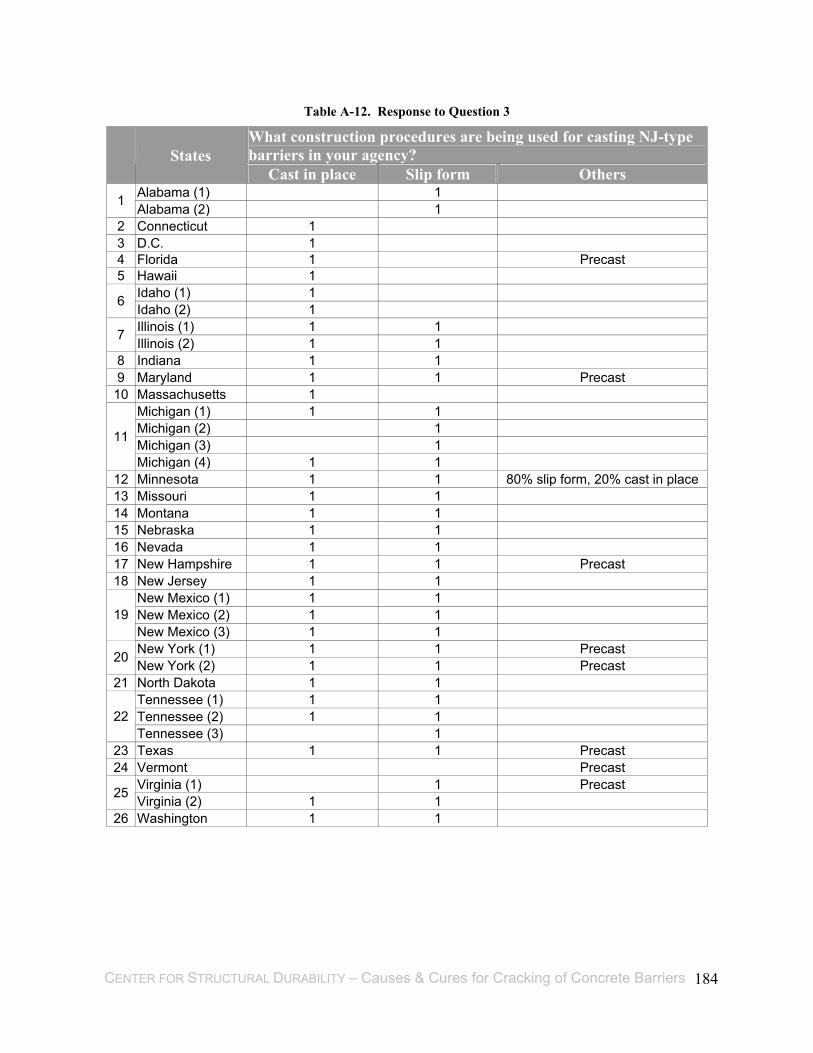
CENTER FOR STRUCTURAL DURABILITY – Causes & Cures for Cracking of Concrete Barriers 184
Table A-12. Response to Question 3
What construction procedures are being used for casting NJ-type barriers in your agency?
States
Cast in place Slip form Others Alabama (1) 1 1 Alabama (2) 1
2 Connecticut 1 3 D.C. 1 4 Florida 1 Precast 5 Hawaii 1
Idaho (1) 1 6 Idaho (2) 1 Illinois (1) 1 1 7 Illinois (2) 1 1
8 Indiana 1 1 9 Maryland 1 1 Precast 10 Massachusetts 1
Michigan (1) 1 1 Michigan (2) 1 Michigan (3) 1 11
Michigan (4) 1 1 12 Minnesota 1 1 80% slip form, 20% cast in place 13 Missouri 1 1 14 Montana 1 1 15 Nebraska 1 1 16 Nevada 1 1 17 New Hampshire 1 1 Precast 18 New Jersey 1 1
New Mexico (1) 1 1 New Mexico (2) 1 1 19 New Mexico (3) 1 1 New York (1) 1 1 Precast 20 New York (2) 1 1 Precast
21 North Dakota 1 1 Tennessee (1) 1 1 Tennessee (2) 1 1 22 Tennessee (3) 1
23 Texas 1 1 Precast 24 Vermont Precast
Virginia (1) 1 Precast 25 Virginia (2) 1 1 26 Washington 1 1
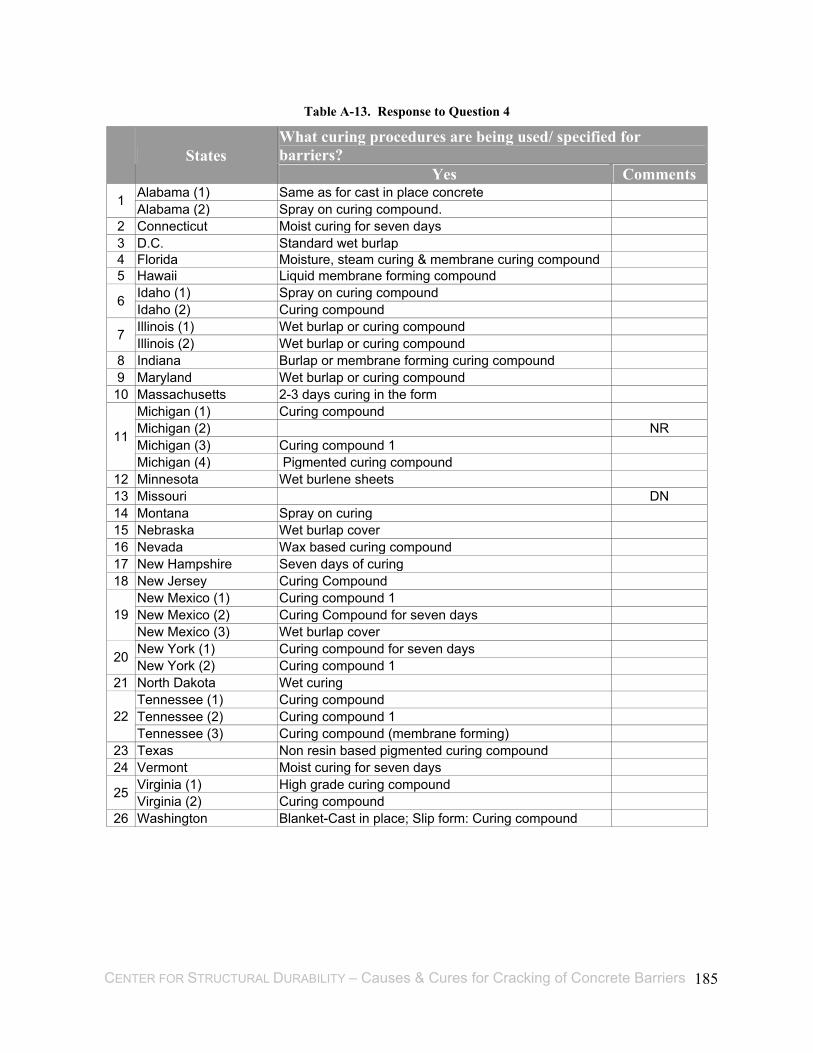
CENTER FOR STRUCTURAL DURABILITY – Causes & Cures for Cracking of Concrete Barriers 185
Table A-13. Response to Question 4
What curing procedures are being used/ specified for barriers?
States
Yes Comments Alabama (1) Same as for cast in place concrete 1 Alabama (2) Spray on curing compound.
2 Connecticut Moist curing for seven days 3 D.C. Standard wet burlap 4 Florida Moisture, steam curing & membrane curing compound 5 Hawaii Liquid membrane forming compound
Idaho (1) Spray on curing compound 6 Idaho (2) Curing compound Illinois (1) Wet burlap or curing compound 7 Illinois (2) Wet burlap or curing compound
8 Indiana Burlap or membrane forming curing compound 9 Maryland Wet burlap or curing compound 10 Massachusetts 2-3 days curing in the form
Michigan (1) Curing compound Michigan (2) NR Michigan (3) Curing compound 1 11
Michigan (4) Pigmented curing compound 12 Minnesota Wet burlene sheets 13 Missouri DN 14 Montana Spray on curing 15 Nebraska Wet burlap cover 16 Nevada Wax based curing compound 17 New Hampshire Seven days of curing 18 New Jersey Curing Compound
New Mexico (1) Curing compound 1 New Mexico (2) Curing Compound for seven days 19 New Mexico (3) Wet burlap cover New York (1) Curing compound for seven days 20 New York (2) Curing compound 1
21 North Dakota Wet curing Tennessee (1) Curing compound Tennessee (2) Curing compound 1 22 Tennessee (3) Curing compound (membrane forming)
23 Texas Non resin based pigmented curing compound 24 Vermont Moist curing for seven days
Virginia (1) High grade curing compound 25 Virginia (2) Curing compound 26 Washington Blanket-Cast in place; Slip form: Curing compound

CENTER FOR STRUCTURAL DURABILITY – Causes & Cures for Cracking of Concrete Barriers 186
Table A-14. Response to Question 5
Is your Agency specifying epoxy coated reinforcement for the barriers?
States
Yes No If yes, please specify since when Alabama (1) 1 1 Alabama (2) 1
2 Connecticut 1 NR 3 D.C. 1 NR 4 Florida 1 5 Hawaii 1
Idaho (1) 1 1975 6 Idaho (2) 1 NR Illinois (1) 1 NR 7 Illinois (2) 1 Many years
8 Indiana 1 1980 9 Maryland 1 Late 1970's 10 Massachusetts 1 About 1980's
Michigan (1) 1 NR Michigan (2) 1 NR Michigan (3) 1 Early 1980's 11
Michigan (4) 1 1984 12 Minnesota 1 Circa 1985 13 Missouri 1 Date unknown 14 Montana 1 Last 5-10 years 15 Nebraska 1 About 1994 16 Nevada 1 1 Epoxy is not used in South Nevada 17 New Hampshire 1 NR 18 New Jersey 1 Over 20 years
New Mexico (1) 1 NR New Mexico (2) 1 At least 14 years 19 New Mexico (3) 1 Approximately Late 80's New York (1) 1 Always 20 New York (2) 1 Mid 1980's
21 North Dakota 1 Only started a couple of years ago Tennessee (1) 1 Since early 80's Tennessee (2) 1 Unknown 22 Tennessee (3) 1 Bridges only +10 years
23 Texas 1 Vary rarely 24 Vermont 1 Unsure but possibly early mid 1990’s
Virginia (1) 1 NR 25 Virginia (2) 1 Early 1980's 26 Washington 1 Inside face of barrier to slab only

CENTER FOR STRUCTURAL DURABILITY – Causes & Cures for Cracking of Concrete Barriers 187
Table A-15. Response to Question 6
Are coatings/sealants currently being specified for barriers?
States
Yes No Comments Alabama (1) 1
1 Alabama (2) 1 2 Connecticut 1 3 D.C. 1 4 Florida 1 5 Hawaii 1
Idaho (1) 1 6 Idaho (2) 1
Illinois (1) 1 7 Illinois (2) 1 8 Indiana 1 9 Maryland 1 10 Massachusetts 1
Michigan (1) 1 Michigan (2) 1 Michigan (3) 1 11
Michigan (4) 1 12 Minnesota 1 13 Missouri 1 14 Montana 1 15 Nebraska 1 16 Nevada 1 17 New Hampshire 1 18 New Jersey 1
New Mexico (1) 1 New Mexico (2) 1 19 New Mexico (3) 1 New York (1) 1
20 New York (2) 1 21 North Dakota 1
Tennessee (1) 1 Tennessee (2) 1 22 Tennessee (3) 1
23 Texas 1 24 Vermont 1
Virginia (1) 1 25 Virginia (2) 1 26 Washington 1

CENTER FOR STRUCTURAL DURABILITY – Causes & Cures for Cracking of Concrete Barriers 188
Table A-16. Response to Question 7
Does your Agency specify a concrete mix design for the barriers different than the deck?
States
Please describe CommentsAlabama (1) No 1 Alabama (2) No
2 Connecticut No 3 D.C. NR 4 Florida Different from deck 5 Hawaii Generally no
Idaho (1) No 6 Idaho (2) Same as deck Illinois (1) Different from deck 7 Illinois (2) 40 lbs less cement used for central mixed concrete
8 Indiana No 9 Maryland Same as deck (4500 psi) 10 Massachusetts Silica fume modified concrete with 6% silica fume
Michigan (1) For slip form barriers, minimum air content is 4.5% Michigan (2) Standard Specification NR Michigan (3) NR 11
Michigan (4) No 12 Minnesota Different from deck 13 Missouri NR 14 Montana Same as deck 15 Nebraska No 16 Nevada Deck concrete is generally the same as rail concrete 17 New Hampshire Different than deck 18 New Jersey No
New Mexico (1) No New Mexico (2) Different than deck 19 New Mexico (3) Depends on slip formed or cast in place New York (1) Different than deck (Class H or Class HP) 20 New York (2) Class A for CIP, Class J for Slip formed
21 North Dakota NR Tennessee (1) DN Tennessee (2) 3000 psi mix 22 Tennessee (3) Lower slump etc for slip forming
23 Texas No 24 Vermont DN
Virginia (1) Use low slump mixes with lower air content 25 Virginia (2) Same design strength but smaller aggregate
26 Washington Deck uses concrete class 400 D with min FA content of 75 lb/yd3 &minimum cement content of 660 lb/yd3; barrier uses a minimum cement content of 565 lb/yd3

CENTER FOR STRUCTURAL DURABILITY – Causes & Cures for Cracking of Concrete Barriers 189
Table A-17. Response to Question 8
Has your Agency used ground GBFS, FA or other pozzolans in the mix for the reduction of the permeability of barrier concrete?
States
Yes No If yes, please specify Alabama (1) 1 Per job basis 1 Alabama (2) 1 Up to 25% of substitution rate
2 Connecticut 1 3 D.C. 1 4 Florida 1 Varies depending on application 5 Hawaii 1
Idaho (1) 1 FA occasionally min 20% 6 Idaho (2) 1 Dependent upon mix design Illinois (1) 1
7 Illinois (2) 1 GBFS- max 25% & Class C FA-max 20%& Class F FA- max 15%
8 Indiana 1 30% 9 Maryland 1 GBFS 50% max slip form
10 Massachusetts 1 6% silica fume, 15% FA, 25-40% GBFS Michigan (1) NR DN Michigan (2) 1 Michigan (3) 1 Optional 11
Michigan (4) 1 FA 12 Minnesota 1 15% 13 Missouri NR NR 14 Montana 1 5+ % 15 Nebraska 1 16 Nevada 1 17 New Hampshire 1 Varies 18 New Jersey 1
New Mexico (1) 1 FA-25% as of 1999 New Mexico (2) 1 FA-20% 19 New Mexico (3) NR NR New York (1) 1 Class HP requires 20% FA &6% silica fume 20 New York (2) 1
21 North Dakota 1 Up to 30% FA is optional Tennessee (1) 1 Tennessee (2) 1 Maximum 25% replacement 22 Tennessee (3) 1
23 Texas 1 Numerous FA mixers exist 24 Vermont DN
Virginia (1) 1 Max 50% slag, 35% FA, 10% SF 25 Virginia (2) 1 26 Washington 1
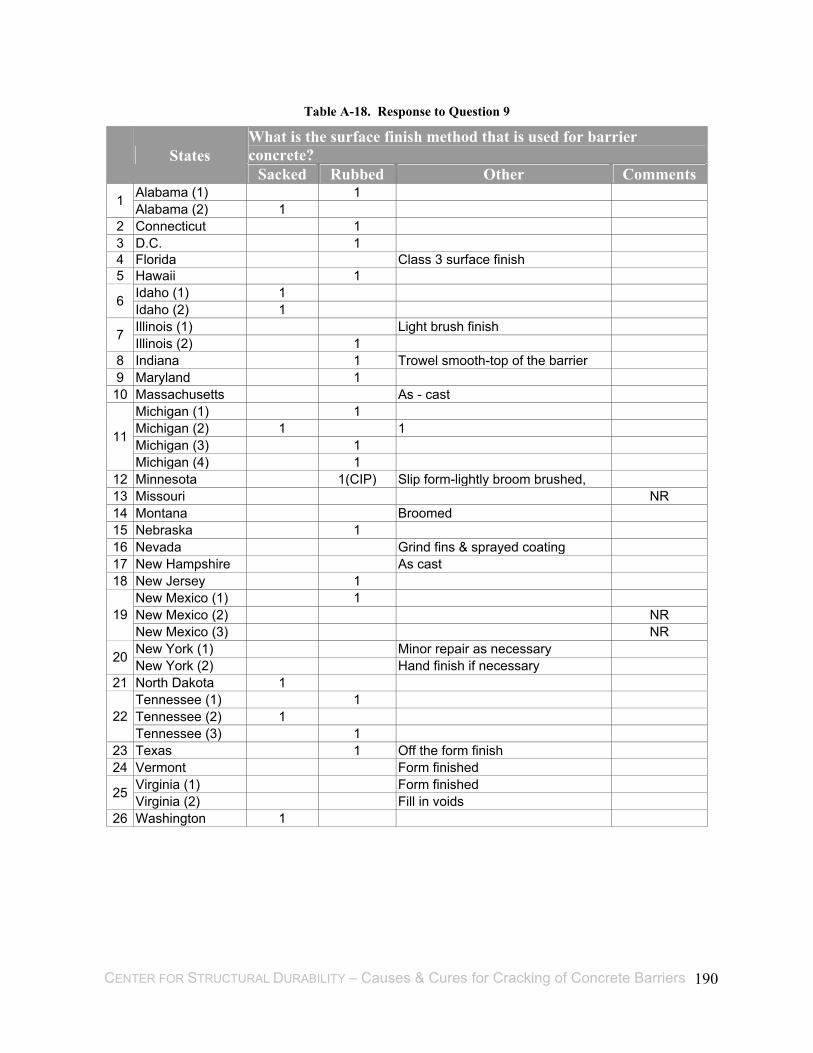
CENTER FOR STRUCTURAL DURABILITY – Causes & Cures for Cracking of Concrete Barriers 190
Table A-18. Response to Question 9
What is the surface finish method that is used for barrier concrete?
States
Sacked Rubbed Other Comments Alabama (1) 1 1 Alabama (2) 1
2 Connecticut 1 3 D.C. 1 4 Florida Class 3 surface finish 5 Hawaii 1
Idaho (1) 1 6 Idaho (2) 1 Illinois (1) Light brush finish 7 Illinois (2) 1
8 Indiana 1 Trowel smooth-top of the barrier 9 Maryland 1
10 Massachusetts As - cast Michigan (1) 1 Michigan (2) 1 1 Michigan (3) 1 11
Michigan (4) 1 12 Minnesota 1(CIP) Slip form-lightly broom brushed, 13 Missouri NR 14 Montana Broomed 15 Nebraska 1 16 Nevada Grind fins & sprayed coating 17 New Hampshire As cast 18 New Jersey 1
New Mexico (1) 1 New Mexico (2) NR 19 New Mexico (3) NR New York (1) Minor repair as necessary 20 New York (2) Hand finish if necessary
21 North Dakota 1 Tennessee (1) 1 Tennessee (2) 1 22 Tennessee (3) 1
23 Texas 1 Off the form finish 24 Vermont Form finished
Virginia (1) Form finished 25 Virginia (2) Fill in voids 26 Washington 1

CENTER FOR STRUCTURAL DURABILITY – Causes & Cures for Cracking of Concrete Barriers 191
Table A-19. Response to Question 10
Do you observe differences in performance between barriers on rural areas versus trunk line/interstate routes?
States
Yes No If yes, please explain why? Alabama (1) 1 1 Alabama (2) NR
2 Connecticut NR 3 D.C. NR 4 Florida NR 5 Hawaii NR
Idaho (1) NR 6 Idaho (2) NR Illinois (1) NR 7 Illinois (2) DN
8 Indiana NR 9 Maryland NR
10 Massachusetts 1 NR Michigan (1) 1 Salt spray Michigan (2) NR Michigan (3) NR 11
Michigan (4) NR FA 12 Minnesota 1 Trunk line receives more salt than local routes 13 Missouri 1 Because of traffic &deicing materials 14 Montana 1 More vertical cracking on barriers on interstate 15 Nebraska None 16 Nevada NR 17 New Hampshire NR 18 New Jersey 1
New Mexico (1) 1 More problems in urban area where barriers get splashed with water
New Mexico (2) NR 19
New Mexico (3) NR New York (1) NR 20 New York (2) 1 Lower salt, better overall performance
21 North Dakota NR Tennessee (1) NR Tennessee (2) NR 22 Tennessee (3) NR
23 Texas 1 Length of spans affect cracking, typically longer span & truck impacts more severe on curved structures in urban areas,
24 Vermont DN Virginia (1) 1 Increased salt content on snow pack 25 Virginia (2) NR
26 Washington NR

CENTER FOR STRUCTURAL DURABILITY – Causes & Cures for Cracking of Concrete Barriers 192
Table A-20. Response to Question 11
Does your Agency apply deicers to the bridge deck? States
Yes No If yes, what kind of deicers? Alabama (1) 1 CMA 1 Alabama (2) 1
2 Connecticut 1 Salt 3 D.C. 1 4 Florida 1 5 Hawaii 1
Idaho (1) 1 Salt-Magnesium Chloride 6 Idaho (2) 1 Magnesium Chloride Illinois (1) 1 Very heavy salt/brine 7 Illinois (2) 1 Typically salt or salt brine
8 Indiana 1 Salt 9 Maryland 1 Salt & Magnesium Chloride
10 Massachusetts 1 NR Michigan (1) 1 Salt &CMA Michigan (2) 1 Salt Michigan (3) 1 Salt (CMA) 11
Michigan (4) 1 Salt 12 Minnesota 1 Salt 13 Missouri 1 Salt along with salt brine as pretreatment 14 Montana 1 Freeze guard (Magnesium Chloride) 15 Nebraska 1 NR 16 Nevada 1 1 Northern part only 17 New Hampshire 1 Salt 18 New Jersey 1
New Mexico (1) 1 Salt New Mexico (2) 1 CMA & salt 19 New Mexico (3) 1 Calcium or Magnesium Chloride New York (1) 1 Salts mostly, some liquids also 20 New York (2) 1 Salt
21 North Dakota 1 Salt Tennessee (1) 1 Salt Tennessee (2) 1 NR 22 Tennessee (3) 1 Salt
23 Texas 1 CMA, salt sand, 24 Vermont 1 Salt & Chloride
Virginia (1) 1 CMA, salt, Calcium Chloride 25 Virginia (2) 1 Salts 26 Washington 1 Urea
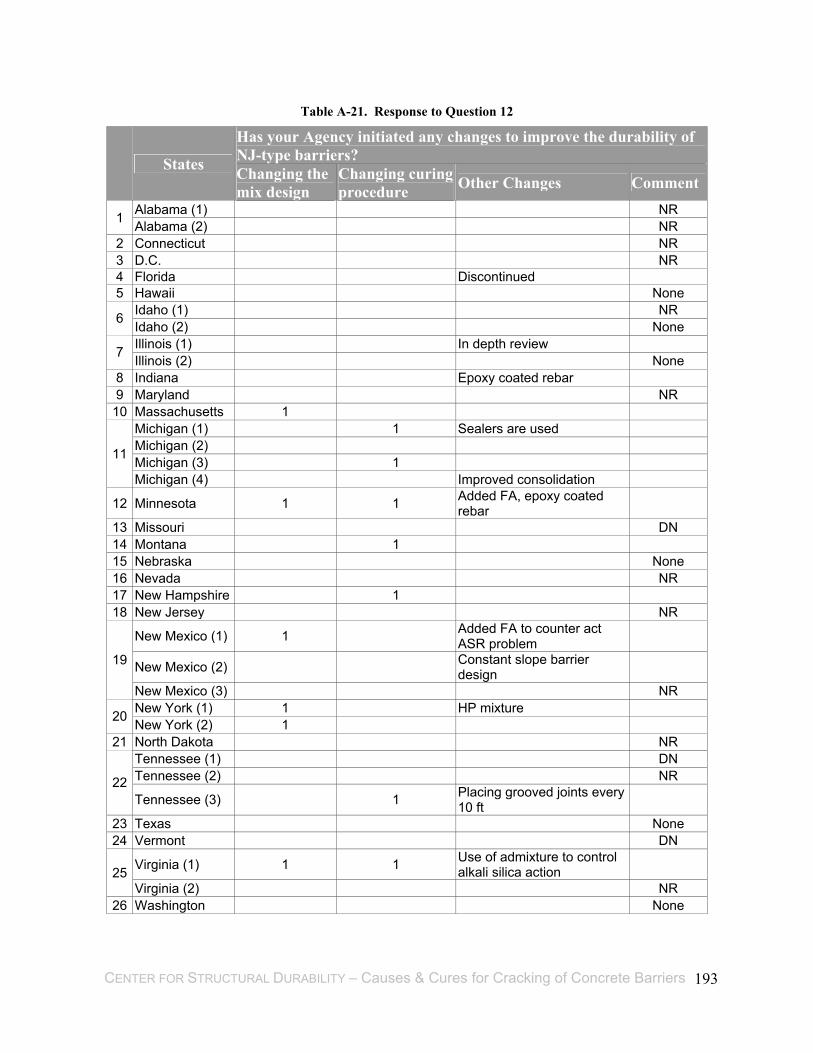
CENTER FOR STRUCTURAL DURABILITY – Causes & Cures for Cracking of Concrete Barriers 193
Table A-21. Response to Question 12
Has your Agency initiated any changes to improve the durability of NJ-type barriers?
States Changing the mix design
Changing curing procedure Other Changes Comment
Alabama (1) NR 1 Alabama (2) NR 2 Connecticut NR 3 D.C. NR 4 Florida Discontinued 5 Hawaii None
Idaho (1) NR 6 Idaho (2) None Illinois (1) In depth review 7 Illinois (2) None
8 Indiana Epoxy coated rebar 9 Maryland NR
10 Massachusetts 1 Michigan (1) 1 Sealers are used Michigan (2) Michigan (3) 1 11
Michigan (4) Improved consolidation
12 Minnesota 1 1 Added FA, epoxy coated rebar
13 Missouri DN 14 Montana 1 15 Nebraska None 16 Nevada NR 17 New Hampshire 1 18 New Jersey NR
New Mexico (1) 1 Added FA to counter act ASR problem
New Mexico (2) Constant slope barrier design 19
New Mexico (3) NR New York (1) 1 HP mixture 20 New York (2) 1
21 North Dakota NR Tennessee (1) DN Tennessee (2) NR 22 Tennessee (3) 1 Placing grooved joints every
10 ft
23 Texas None 24 Vermont DN
Virginia (1) 1 1 Use of admixture to control alkali silica action 25
Virginia (2) NR 26 Washington None

CENTER FOR STRUCTURAL DURABILITY – Causes & Cures for Cracking of Concrete Barriers 194
APPENDIX B
Laboratory Data Sheets

CENTER FOR STRUCTURAL DURABILITY – Causes & Cures for Cracking of Concrete Barriers 195
Project Name : CAUSES & CURES FOR CRACKING OF CONCRETE BARRIERS
Test Name :Determination of Air Content of Freshly Mixed Concrete by the Pressure
Method
Related Code : (ASTM C231)
Conducted By :
Date :
Brief Description of Test • Dampen the interior of measuring bowl and place it on a flat, level, firm surface. Place fresh
concrete in three equal layers. Consolidate each layer by rodding (if slump>3 in), by either rodding or vibrating (if 1<slump<3 in), by vibrating (if slump<1 in).
• Strike-off the top surface of concrete and finish it smoothly with a flat strike-off plate using great care to leave the measuring bowl just level full.
• After strike-off clean all excess concrete from the exterior of the measuring bowl (base rim) and cover. Then clamp base rim and cover.
• Open petcocks. Inject water through one petcock until water is expelled from opposite petcock.
• Close air bleeder valve on air chamber. Close petcocks. Pump up air to the marked point on gauge. Wait a few seconds and tap gauge lightly. If necessary add or subtract air to attain reading at the marked point.
• Press needle valve lever to release air into base. Continue pressing lever and lightly tap gauge. Read direct percentage of air.
• Thoroughly clean base, cover and petcock openings with running water.
Measure A (Air Content, %) =
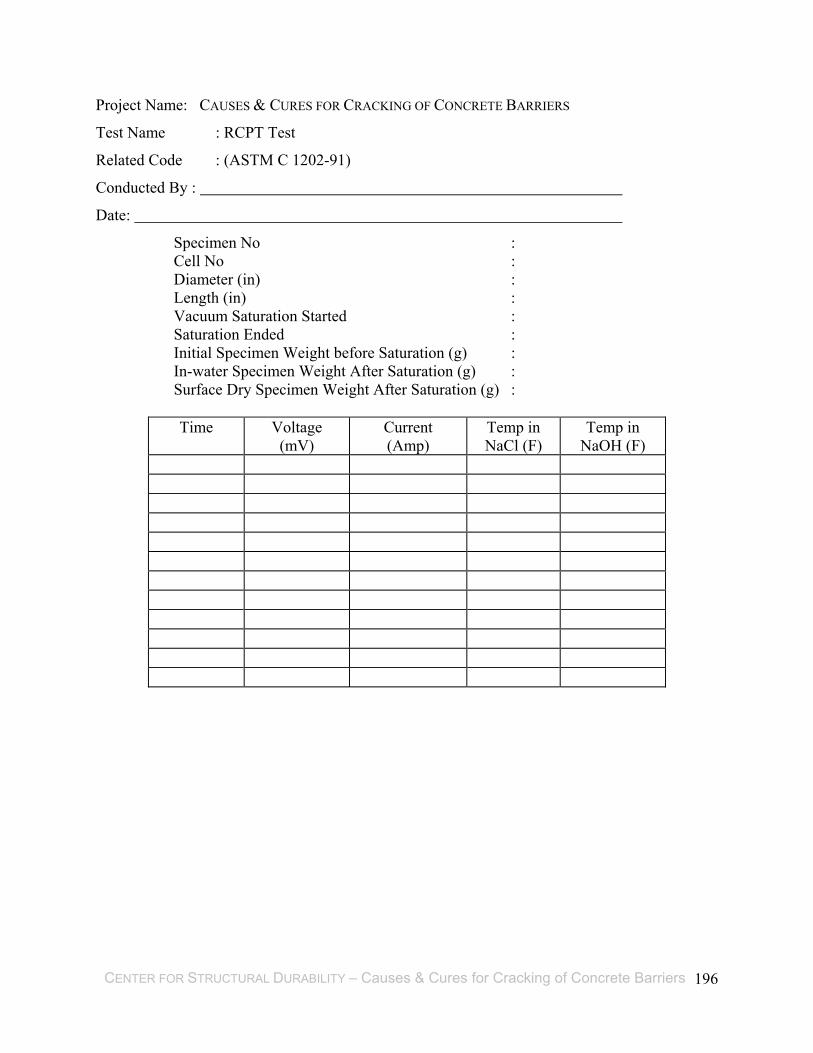
CENTER FOR STRUCTURAL DURABILITY – Causes & Cures for Cracking of Concrete Barriers 196
Project Name: CAUSES & CURES FOR CRACKING OF CONCRETE BARRIERS
Test Name : RCPT Test
Related Code : (ASTM C 1202-91)
Conducted By :
Date:
Specimen No : Cell No : Diameter (in) : Length (in) : Vacuum Saturation Started : Saturation Ended : Initial Specimen Weight before Saturation (g) : In-water Specimen Weight After Saturation (g) : Surface Dry Specimen Weight After Saturation (g) :
Time Voltage
(mV) Current (Amp)
Temp in NaCl (F)
Temp in NaOH (F)

CENTER FOR STRUCTURAL DURABILITY – Causes & Cures for Cracking of Concrete Barriers 197
Project Name: CAUSES & CURES FOR CRACKING OF CONCRETE BARRIERS
Test Name : Determination of Slump of Concrete
Related Code : (ASTM C143)
Conducted By :
Date:
Brief Description of Test • Fill the mold with concrete in three layers of equal volume, (one third of the volume of the
mold fills it approximately to a depth of 6.7 cm; two thirds of the volume approximately fills it to a depth of 15.5 cm) each time rodding the layers with 25 strokes of tamping rod evenly distributed on the surface.
• Strike-off the top surface of concrete and finish it smoothly by rolling the damping rod. • Remove the mold by raising it vertically and put the mold near the concrete. • Measure the decrease in height to the nearest 6 mm.
Measure
Slump =

CENTER FOR STRUCTURAL DURABILITY – Causes & Cures for Cracking of Concrete Barriers 198
Length 1 Length 2 Length 3 Diameter 1 Diameter 2 Diameter 3 Specimen Number (inch)
1 2 3 4 5 6 7 8 9 10 11 12 13 14 15 16 17 18 19 20 21 22 23 24 25 26 27 28 29

CENTER FOR STRUCTURAL DURABILITY – Causes & Cures for Cracking of Concrete Barriers 199
Project Name: CAUSES & CURES FOR CRACKING OF CONCRETE BARRIERS
Test Name: Determination of Unit Weight of Concrete
Related Code: (ASTM C138)
Conducted By :
Date:
Brief Description of Test • Determine the volume of the measure. (V) • Determine the mass of the measure. (T) • Fill the measure with concrete in three layers each time rodding the layers with 25 strokes of
tamping rod evenly distributed on the surface. After rodding each layer tap the sides of measure.
• Strike-off the top surface of concrete and finish it smoothly with a flat strike-off plate using great care to leave the measure just level full.
• After strike-off clean all excess concrete from the exterior of the measure. • Determine the mass of the measure plus its contents. (M)
Measure V (Volume of measure) = G (Mass of conc. and measure) = T (Mass of measure) =
Calculate M (Unit weight of concrete) = (G-T)/V =

CENTER FOR STRUCTURAL DURABILITY – Causes & Cures for Cracking of Concrete Barriers 200
Project Name: CAUSES & CURES FOR CRACKING OF CONCRETE BARRIERS
Test Name : Absorption Test
Related Code :
Conducted By :
Specimen No Weight 1 (gr) Date Time Weight 2 (gr) Date Time Weight 3 (gr) Date Time Weight 4 (gr) Date Time
1 2 3 Dry Diameter (in) 1 2 3
Dry Length (in)
Saturation Starts
Weight 5 (gr) Date Time Weight 6 (gr) Date Time Weight 7 (gr) Date Time Weight 8 (gr) Date Time
Start boiling for 5 hours
Weight after boiling (gr)
Date
Time
Weight in water (gr)
Date
Time
1 2 3 Saturated Diameter (in)
1 2 3 Saturated Length (in)