Embed Size (px)
Citation preview
SURFACE ELECTRICAL PROPERTIES-EXPERIMENT!
STUDY PHASE
FINAL REPORT
NASA CONTRACT NAS 9-10748
Vol. 1 of 3January 1973
CENTER FOR SPACE RESEARCHMASSACHUSETTS INSTITUTE OF T E C H N O L O G Y
SURFACE ELECTRICAL PROPERTIES-EXPERIMENT
STUDY PHASE
FINAL REPORT
.. NASA CONTRACT NAS 9-10748
January 1973 Vol. 1 of 3
SURFACE ELECTRICAL PROPERTIES EXPERIMENT
STUDY PHASE
FINAL REPORT
NASA CONTRACT NAS 9 10748
January 1973
Prepared for:
National Aeronautics and Space AdministrationManned Spacecraft Center .
Prepared by:
James W. MeyerRichard H. BakerLeonard B. Johnson
Approved by:
Gene Simmons, Principal InvestigatorJohn V. Harrington, Director
Center for Space ResearchMassachusetts Institute of Technology
TABLE OF CONTENTS V
List of Appendices ii.
1.0 Introduction and Summary 1
2.0 Surface Electrical Properties Experiment, ./'•Conceptual Design . , 3
3.0 Propagation and Antenna Analysis \ 6
4.0 Field Tests 8
5.0 Engineering Development and Feasibility Program ; 9
5.1 SEP Transmitter Electrical Design Activity 10) • . .
5.2 SEP Receiver Electrical Design Activity 11
5.3 SEP Mechanical and Thermal Design Activity 13
Figures 5.1 and 5.2 < 14-15
5.4 Reporting of Engineering DevelopmentActivities and Results 16
5.5 EMI Considerations 16
5.:5.1 Initial EMI Tests 17
5.5.2 Development of the EMI Receiver 17
Figures 5.3, 5.4,' 5.5, 5.6 . : 19-22
6.0 Phase I Documentation 23
7.0 Contract and Subcontract Definition, Proposal,Preparation and Evaluation 24
Tables 1. Proposed Transmitter Designs 29
2. Proposed Receiver Designs 30
8.0 Science - Principal investigator - 31
8.1 Theory .31
8.2 Related Experimental Data 32
8.3 Technical Memoranda 32
9.0 A Brief Summary of Task Evolution of.theSEP Study Contract NAS 9 10748 33
10.0 Conclusion • . " " ' - - . 3 6

11
APPENDICES
2.1 SEP Conceptual Design
l TE/TM Patterns of Hertzian Dipole in Two -or Three-Layered Medium
3.2 Model Study of Lunar Subsurface Electric Properties
3.3 Resonant Dipole on Surface of a Dielectric
4.1 (1) Preliminary Report on the Athabasca GlacierField Expedition
(2) A Heuristic Interpretation of the March 1970Athabasca Glacier Field Trial Data
5.1 CSDL Conceptual Design Report July 21,. 1970
5.2 SEP Memo SEP-4-T, June 8* 1970;SEP Memo SEP-5-T, June 12, 1970
5.3 CSDL Weekly Memos Nbs. 1 & 2 , . ' . . .
5.4 MIT/CSDL SEP Presentation December 11, 0.970
5.5 SEP Memo1SEP-10-T EMI Tests on the RoverTraction Motor Drive .
5.6 EMI Test Results Quick Look (Using MIT EMIReceiver) 12 April 1971
6.1 Preliminary End Item Specification
6.2 Configuration Management Plan
3 NASA Experiments Reliability andQuality Operating Procedures
6.4 Procurement Specification for the DataStorage Electronics Assembly .
-7.1 MIT/CSDL Technical Proposal for the SurfaceElectrical Properties Experiment Revision I
7.2 MIT Center for Space Research Technical Proposal forthe Surface Electrical Properties Experiment January, 1971
8.1 Selected SEP Project Technical Memos
1.0 INTRODUCTION AND SUMMARY . .:.
This final report describes work leading to the evolution
of a conceptual design of the flight hardware for the Surface
Electrical Properties Experiment (SEP), the definition of
requests for proposals, the analysis of proposals submitted by
prospective flight hardware subcontractors, and recommendations
for the flight configuration to be implemented.
Initial efforts were made to assess the electromagnetic
environment of the SEP Experiment. An EMI receiver and tri-loop
antenna were constructed and tests of opportunity were performed
with a Lunar Roving Vehicle (LRV). Initial analyses were made
of data from these tests with support from this contract,
analyses which were continued in depth under the hardware
contract.
Extensive theoretical work was performed in an effort
to reduce to a conveniently tractable form, the difficult
problem of finding an analytic solution for the near-, inter-
mediate-, and far-field components of a radiating dipole
deployed at the interface between two dielectric media. The
problem was further complicated by the addition of layers with
varying dielectric "contrast" in one of the media.
Field tests were performed on glaciers to evaluate
several engineering design concepts, and to acquire empirical
data to support design performance criteria identified in the
conceptual design. Glacier data along with measurements made
on samples of lunar rock and soil returned by Apollo astro-
nauts were used to refine the scientific conceptual design
•'••.' • • • • : : • • ^ • - . • ' • " • '. 2
of the experiment, and as an aid in forecasting the kind of
information that could be derived from the experiment as it
applied to the first few thousand meters of the lunar surface.
Preliminary electronic, thermal, and mechanical designs
were completed and tested in breadboard and model form. These
yielded information which proved valuable in the evaluation of
the sub-contractor proposals. :
The salient features of the conceptual design evolved dur-
ing this study are as follows:
The SEP flight hardware was to consist of-a transmitter
and a receiver of combined weight not to exceed 30 pounds.
The transmitter was to be equipped with a pair of dipoles,
designed to operate efficiently at each of six frequencies
when deployed by the astronaut orthogonal to one another on
the lunar surface. The overall length of each leg of each
dipole was not to exceed 70 meters. The transmitter was to
power each orthogonal dipole alternately for a .period of 200
milliseconds at each of the six frequencies totalling 400
milliseconds on-time at each frequency. The'transmitter would
be off for two 400 millisecond periods before the pattern was
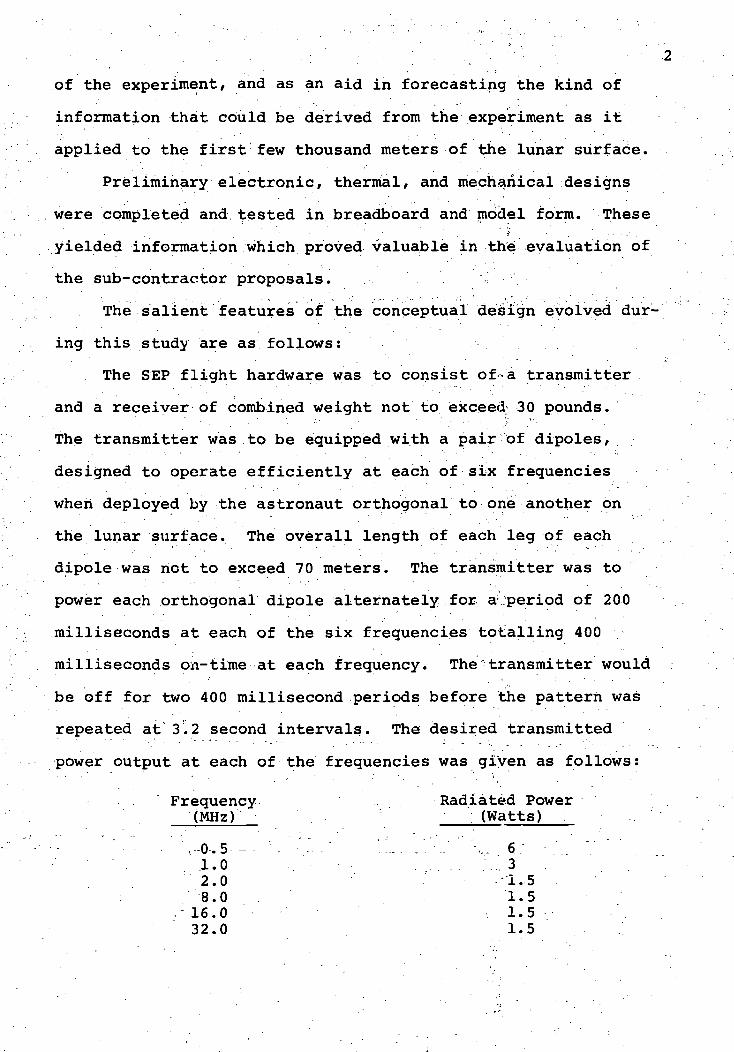
repeated at" 3.2 second intervals. The desired transmitted
power output at each of the frequencies was given as follows:
Frequency Radiated Power(MHz) (Watts)
,-0.5 '- •'".'." '.'.... . . . " , . 6 :
1 . 0 . . . . ' . , 32.0 -1.58.0 1.5
,16.0 ,1.532.0 1.5
The receiving antenna was to consist of three mutually
orthogonal loops approximately one third meter in diameter,
but not necessarily circular, with minimum cross coupling J
between the loops.
The Data Storage Electronics Assembly (DSEA) was prescribed
as the magnetic tape recorder to be used for recording the
experiment data. The receiver .was to acquire and synchronize
automatically with the transmitter signal pattern. Each of the
three orthogonal loops was to be connected to the receiver input
sequentially for equal times during each 200 millisecond inter-
val. It was envisaged that the receiver would be mounted on
the LRV as a source of locomotion during traverses needed for
interferometic operation.
Detailed information on the various parts of this program
is contained in reports and memoranda which are referenced in
the main body text and appended in full text to principal
copies of this report. There are a few instances in which the
bulk of the work, but not all, reported in a given document
was supported under this contract. In these instances, the
document is included in full for completeness. *
2.0 SURFACE ELECTRICAL PROPERTIES EXPERIMENT,CONCEPTUAL DESIGN
The objectives of the SEP experiment were to detect layering
in the lunar subsurface as revealed by significant changes -in.
the dielectric properties (e.g., dielectric constant, conduc-
tivity) on the scale of a wavelength. The draniatic difference
between the dielectric constant of water (80) and ice (3) or
lunar soil (3-15) makes it possible to detect the presence
of water at depth. The detection and measurement of the depth
of a water-ice interface (0° C. isotherm) would make it
possible to obtain an independent estimate of the lunar thermal
flux. • ••"•• "' • ' ' . . ; .'- .;. • ';.' . -
The electrical properties of the lunar material were to be
measured in situ over the seven octave frequency range to be
employed by the experiment. Under favorable conditions, it
might be possible to estimate the number and size of subsurface
scattering bodies through an analysis of their impact on the
interferograms taken at each of the six operating frequencies.
The status of the SEP experiment conceptual design as of
October 28, 1970 was described in detail in a M.I.T. Center
for Space Research Technical Report CSR TR 70-7, attached as
Appendix 2.1 to principal copies of this report; The Technical
Report contains sections on administrative/biographical
information, plus discussion of technical, engineering, and
operational aspects of the conceptual design. An appendix .
details a rotating beam direction finding concept which at the
time of the report writing was being considered as a prime
candidate solution to the problem of tracking and locating the
LRV during a_ traverse.
The conceptual design at this stage envisaged a trans-
mitter providing a rotating beam pattern from an orthogonally
driven turnstyle antenna. Eight frequencies (0,5, 1, 2, 4,
8, 16, 24, 32 MHz) each radiated for 0.1 seconds were called
for, plus two 0.1 second periods during which the transmitter
would be off in the total cycle time of 1 second. Anticipated
radiated powers were 2 watts at 0.5 MHz, 1/2 w£tt at 1.0 MHz,
and 1/8 watt at each of the other frequencies. The estimated
weight of the transmitter was 11.1 Ib. The receiver equipped
with three mutually orthogonal loops was to be designed for
a logarithmic response to accommodate the large dynamic range
of signals expected in the experiment. The data were to be
recorded on the DSEA which was to be returned to earth. The• . • , .<
weight of the receiver in this conceptual design was estimated
at 10.8 Ibs. The estimated time required for deployment by
one astronaut was 31 minutes, with an additional 3 1/2 minutes
required for ether experiment-related activities.
As a result of engineering tests on the glacier, and of
further analytical work, the rotating beam antenna concept
was abandoned. The multiple conductor flat ribbon wire trans-
mitting antenna concept also had to be abandoned because glacier
tests showed break-up of the dipole patterns resulting from
interactions of the contiguous wire elements. To improve the
signal to noise ratio, more transmitter power was deemed
necessary. Also, two of the original eight frequencies (4 &
24 MHz) were dropped from the conceptual design.
This conceptual design, as modified, was used as a
baseline guide in the writing of the several proposals and
requests for proposal prepared to implement the acquisition
of the flight hardware.
3.0 PROPAGATION AND ANTENNA ANALYSIS
One of the most intriguing aspects of the Study Phase was
the investigation of electromagnetic propagation phenomena and
antenna problems associated with the lunar environment. In
the case of the transmitter, a radiating antenna lying on the
lunar surface was to be operated at the boundary of different"
dielectric media. In the case of the receiver, the antenna was
to be portable and capable of sensing the separate orthogonal
magnetic field components of the transmitted electromagnetic
wave. ' . ' .f
One problem was the characterization of the basic propaga-
tion phenomena associated with the lunar environment, which
involved the simultaneous interaction of electromagnetic waves
propagating above the lunar surface, energy propagating below
the surface, and propagated energy reflected by one or more
contrasting layers within the dielectric material. In addition,
.'„• the experiment posed many antenna unknowns of a practical nature
. such as input impedance, efficiency, radiation patterns, and
power division into the dual media in the case of the trans-
mitting antenna; and field strengths and cross-coupling levels
in the case of the receiving antenna. The problems were
attacked in somewhat different fashions by different investi-
gators. '
Within the Center for Space Research, Laboratory for Space- - - - - - i . . • ? . ' .
Experiments, the principal analytic effort to develop propaga-
tion conditions in layered media was pursued by W. W. Cooper
who approached the problem by a direct method1'which obtained
the field components associated with orthogonal Hertzian di-
poles without using electromagnetic potentials. His work,
: . '• . • •••''•• : • • 7
begun in the Study Phase was continued in the Hardware Phase
resulting in Report TR 71-3 in June 1971 entitled "Patterns of
Dipole Antenna on Stratified Medium," and later in January 1972
a report entitled "TE/TM Patterns of Hertzian Dipole in Two- or
Three-Layered Medium" which is included as Appendix 3,1.
Simultaneously, Professor J. A> Kong of the M.I.T. Electri-
cal Engineering Department conducted propagation studies based
on a dielectrically stratified model of the moon, the results
of which are summarized in Appendix 3.2, in a memo of February
17, 1971 entitled "Model Study of Lunar Subsurface Electrical
Properties; Formal Solutions of Radiation from Dipole Antennas
over Stratified Media". Professor Kong's studies have also
continued in the Hardware Phase.
Toward the end of the Study Phase, J. Lozow of the Charles
Stark Draper Laboratory, M.I.T., formed a review and extension
of the work of Annan as a prelude to the determination of the
electrical and radiation properties of the SEP; antenna. The
results of his brief effort, terminated by depletion of Study
Phase funds, are given in Memo 23S 70-81 of 23 December 1971,
entitled "Resonant Dipole on the Surface of a:Dielectric Half
Space," which also appears as Appendix 3.3.
In addition/ propagation and antenna studies were carried
out by LSE personnel. Typical results of this effort are
abstracted in Appendix 8.1i
4.0 FIELD TESTS
Two field tests were carried out. Early tests at the
Corner Glacier in Switzerland were designed to verify the
validity of the experimental concept. During the Study Phase
tests were performed at the Athabasca Glacier to evaluate the
conceptual design. A preliminary report on the;;Athabasca .
expedition and a heuristic interpretation of the results
appear in Appendix 4.1.
5.0 ENGINEERING DEVELOPMENT AND FEASIBILITY PROGRAM
. In the first portion of the Study Phase starting May 5;,
1970, and covering a period of approximately three months, the
bulk of the CSDL engineering effort was directed toward the .
evolution of a design concept for implementation of the' -' ' ' ' , - ' ' " •' '• . • .^! ' . • ' - ' • .
experiment. The result of this early effort is represented in
the "Conceptual Design Report", forwarded to MSC on July 23,
1970. It contains a description of the mechanical aspects of
the concept, thermal design considerations, tape recorder
requirements, astronaut deployment description^ weight estimates,
power requirements, and equipment requirements,- This document,
reproduced in Appendix 5.1, described the original design con-
cept to which many modifications were later made.
In addition, a portion of the early engineering effort was
expended in the generation of a technical specification which
subsequently became part of a proposed statement of work by
CSDL for hardware development. The S.O.W. was -forwarded to
MSC on July 31, 1970. The original expiration date for this study
Phase effort was August 7, 1970.
The engineering feasibility program, which1involved the
design, construction and laboratory evaluation within CSDL of
breadboard system elements implementing the conceptual design,
was not initiated until after receipt of the Study Phase contract
extension notification of August 17, 1970. Under this extension,
preTImihary crrcuTt,^mechaniceil and^ thermal breadbbaBds "were
contrxicted, based on conceptual design information available
•in early September of 1970, for the purpose of facilitating the
development of a Field Evaluation Model of botH the SEP trans-
mitter and receiver as well as a special EMI receiver to survey
LRV interference.
5.1 SEP TRANSMITTER ELECTRICAL DESIGN ACTIVITY
At the start of the breadboard design effort, the salient
SEP transmitter requirements differed from those which ulti-
mately evolved and are summarized as follows: ,
(1) RF frequencies of 0.5, 1, 2, 4, 8, 16, 24, 32 MHz.
(2) A rotating dipole field vising a crossed dipole trans-
mitting antenna.
(3) Power delivered to the transmitting antenna of 2
watts @0.5 MHz; 1 watt @ 1 MHz, 0.5 watts @2 MHz;
0.25 watts @ 4 MHz; and 0.125 watts a 8, 16, 24,
and 32 MHz.
The frequencies were derived from a 32 MHz TCXO. Low
power TT logic was used in a count-down chain to derive the
RF frequencies. This section was built and tested in-house.
The square-wave outputs of the logic were buffered and
then filtered using high-Q filters of 2-, 4-, and 6- pole
Tchebycheff design. This section was built and tested in-house.
Diode switches were used to select the RF frequencies to
be transmitted. In-house design as well as commercially avail-
able switches from companies such as Lorch and Meriman Research
were tested and evaluated.
Power dividers, balanced modulators, and baluns used in
the transmitter design were obtained commercially from companies
such as Meriman Research. '
The rotating dipole field was implemented by amplitude
modulating the N-S dipole RF excitation with a 15 Hz sine wave
• ' • - ; . • • • , ' • . . " • • : . . • • . . • • . . . . - • " • • • - . ; . • . • i i
and the E-W dipole RF excitation with.a 15 Hz cosine wave.
The sine-cosine generator used a linear approximation approach
which digitally locked the phasing of the sine and cosine out-
puts. . • ; . • • . - • ' . ' • ' • ' . . • ' : ' ' ; ' • //;/;;,; ' . •
Linear amplifiers were chosen to drive the N-S and E-W
antennas as it was,required to have a differential phase error
of less than 5° and a gain error, of less than 1 db over the
required frequency and temperature range. LEL division of
Varian and Advantek were two companies who were approached
for the supply of these amplifiers.
Preliminary negotiations were concluded with both M>I.T. -
Lincoln Laboratory and Raytheon for the design of the antennas,
as the proper facilities were not available at Draper Laboratory.
This design effort was accomplished with approximately... -
3 man-months of engineering time and 3 man-months of technician
time. .
5.2 SEP RECEIVER ELECTRICAL DESIGN ACTIVITY
In early September 1970, based on tentative specification
information received from CSR, CSDL began breadboarding an eight-
channel single hetrodyne Field Evaluation receiver, using a log
amplifier for data compression. To meet the tight schedule,
outside RF specialists were consulted in the areas of their
expertise. . . , - . . . . - . " ; . _ : ; ; ,
Efforts to obtarn""16"g "a plTfiersr"fr'oW"two'"co"mp"e"titive~"' : •
sources were initiated with Varian, (LEL Division) and RHG.
These companies agreed to supply working samples of small
hybrid log amplifiers deemed potentially applicable to the
receiver. .
' . ' • • ' . • • • ' " ' ' ' ' . ' ' " . - ' . ' 1 2
"Off-the-shelf" local oscillators, mixers, combiners,
etc. were ordered in parallel- to the in-house design efforts
initiated in this area. ?;•! : •
Breadboards of diode switches, front-end RF preamplifiers,
and a telemeter VCO, were built and tested in-house. Specialized
RF instrumentation to support the in-house design and buil'dr..'".•
;'."effort was rented (Vector voltmeter, spectrum analyzer, .etci)
Some of the in-house built electronics was used to construct a
special EMI investigation receiver, a coincident effort described
• in Paragraph 5.5.2. !
In the area of antenna design, consultations were initiated
with the M.I.T. Lincoln Laboratory and the Raytheon Company.. \. • -• ,
; In addition, preliminary negotiations for resident RF design
and system engineers to backup the effort were undertaken-with
the Raytheon Company, RCA, and Varian (LEL Division). .
The preliminary effort described above began in early
September 1970 and terminated in early December 1970, a period
of approximately 3 months. During this period, approximately
2.5 man-months/ month staff effort and 2 man-months/mbnth staff
effort and 2 man-months/month technician effort was applied to
the receiver design. In addition, gratuitous study efforts
by engineers at Varian (LEL Division), RHG and Lorch were
expended, the results of which were used by CSDL to supplement.' . • " . " . • - - • * .
the in-house effort. . . . . ' ' . , : ' "
13
5.3 SEP MECHANICAL AND THERMAL DESIGN, ACTIVITY . ;, .
The mechanical and thermal design was started before the
conceptual design of the experiment had been hardened, in order
to meet the imposed schedule. The design described here was
based on information available in September and October, 1970.
A minimum weight design requires that the mechanical design
incorporate the required thermal isolation while providing the
necessary mechanical structure. The structural design must
also make provision for ease of handling by the astronauts -and
mounting on the LEM and LRV. The thermal design must provide
the proper thermal environment for the electronics, recorder,
batteries, and solar cells under anticipated stowage and use
conditions. \
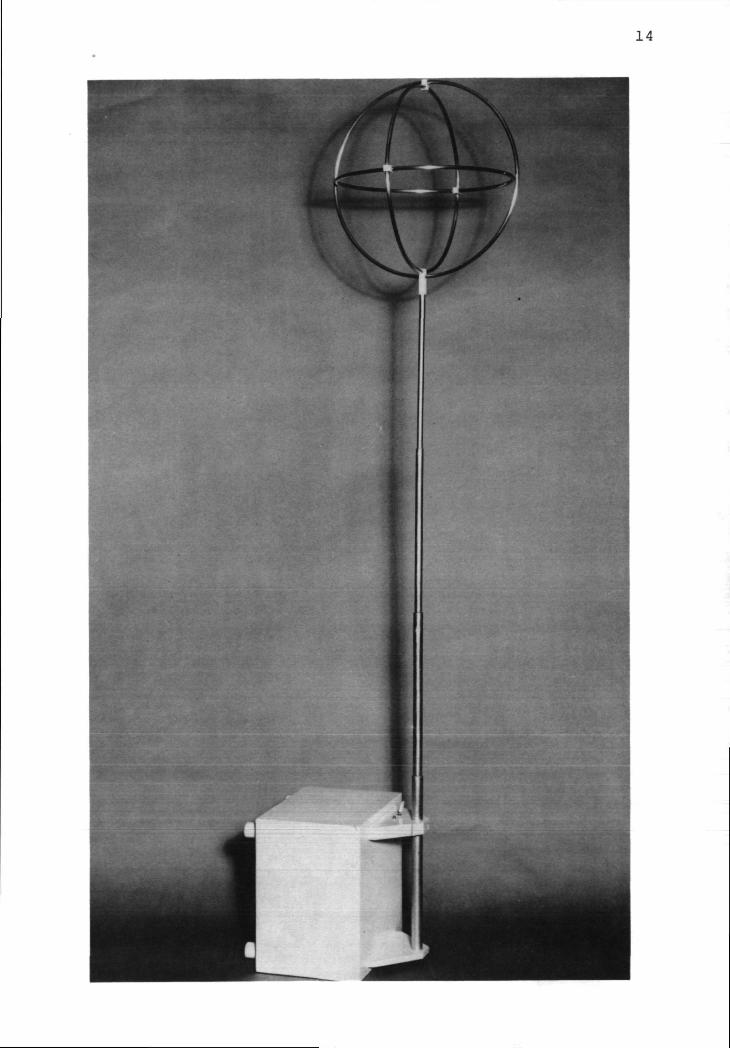
Major assumptions made were that the 4 transmitting antenna
arms would consist of 8 parallel elements of various lengths up
to 70 meters in the form Of a flexible ribbon and that the
receiving antenna would consist of 3 orthogonal common-center
loops about 1 foot in diameter as set forth in the Conceptual"l ' , • -
Design document dated 8 October 1970. A receiver mockup is shown
in Figure 5.1. It was also assumed that the astronaut would
have the physical ability to reach the lunar surface if necessary
during deployment.
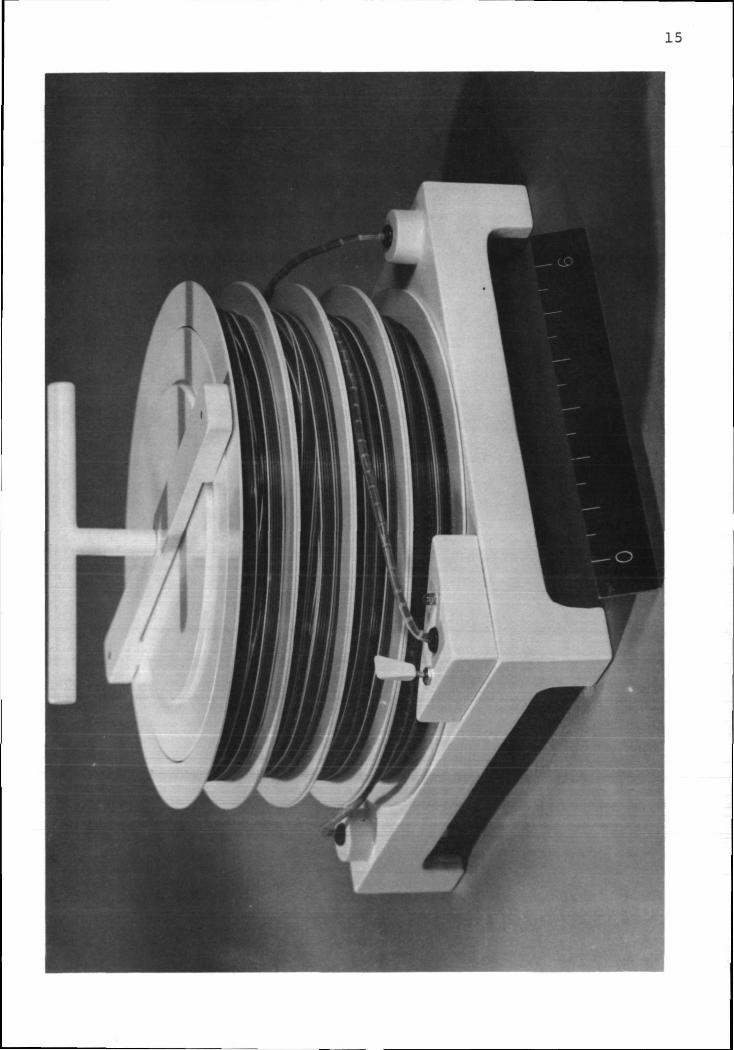
A transmitter mockup is shown in Figure 5.2. This model
does not show a system for attaching the "transmitter feet to
the pallet, but effort was expended in designing a tighter hold-
down system than the oft-used pip pin. The T carrying handle
also doubled as a fastener for holding the crossbar reel
securing device. The reels were made as big in diameter
14
15
as possible to reduce set in the coiled antenna/ The three-
section solar panel was stored in the base of the transmitter.
The electronics in the cylindrical section were suspended from
the top plate which serves as a radiator. The electronics
were packaged employing welded, heat-sinked, cordwood construc-
tion as used in the Apollo Guidance Computer.
5.4 REPORTING OF ENGINEERING DEVELOPMENT ACTIVITIES AND RESULTS
The evolution of the SEP conceptual design leading to
the "Conceptual Design Report" of July 23, 1970 and to the later
SEP Preliminary Technical Specification in August of 1970 may
be traced in SEP memos SEP-4-T, dated 8 June 1970 and SEP-5-T,
dated 12 June 1970, both of which appear in Appendix 5.2.
Interim reporting on the status of the CSDL breadboard ,
effort was covered in Weekly Memos, the most pertinent of
which appear in Appendix 5.3.
A summary report on the status of the engineering develop-
ment effort at the termination of the Study Phase first contract
extension was included in an M.I.T. presentation to MSC on
December ll/ 1970. A collection of presentation Vu-Graphs
comprises Appendix 5.4.
5.5 EMI CONSIDERATIONS
One of the major design uncertainties associated with the
SEP Experiment was the level of electromagnetic interference
produced by the Lunar Rover Vehicle should theT decision~be made to
transport the sensitive SEP receiver by this method. During
the period of the first extension of the Study Phase, two
efforts were mounted to reduce this uncertainty, one being an
17
EMI test of a breadborad LRV traction drive system, and the
second being the design and fabrication of a special EMI- :
receiver for use with the LRV.
5.5.1 INITIAL EMI TESTS
The first tests giving an indication of the possible level
of LRV interference with SEP were conducted by CSDL personnel
on October 26 and'27, 1970 on a breadboard Rover Traction Drive
Motor System located at the Marshall Space Flight Center. A
description of this test activity and its results is given in
CSDL SEP memo SEP-10-T, dated November 2, 1970 which is included
in this report as Appendix 5.5.
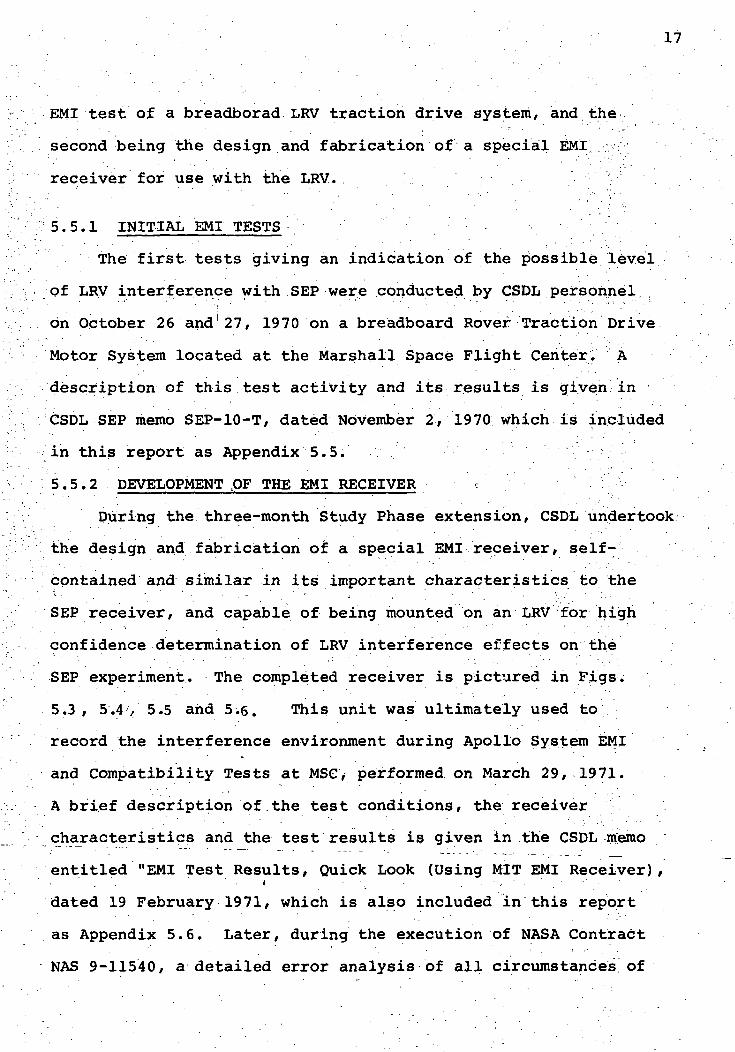
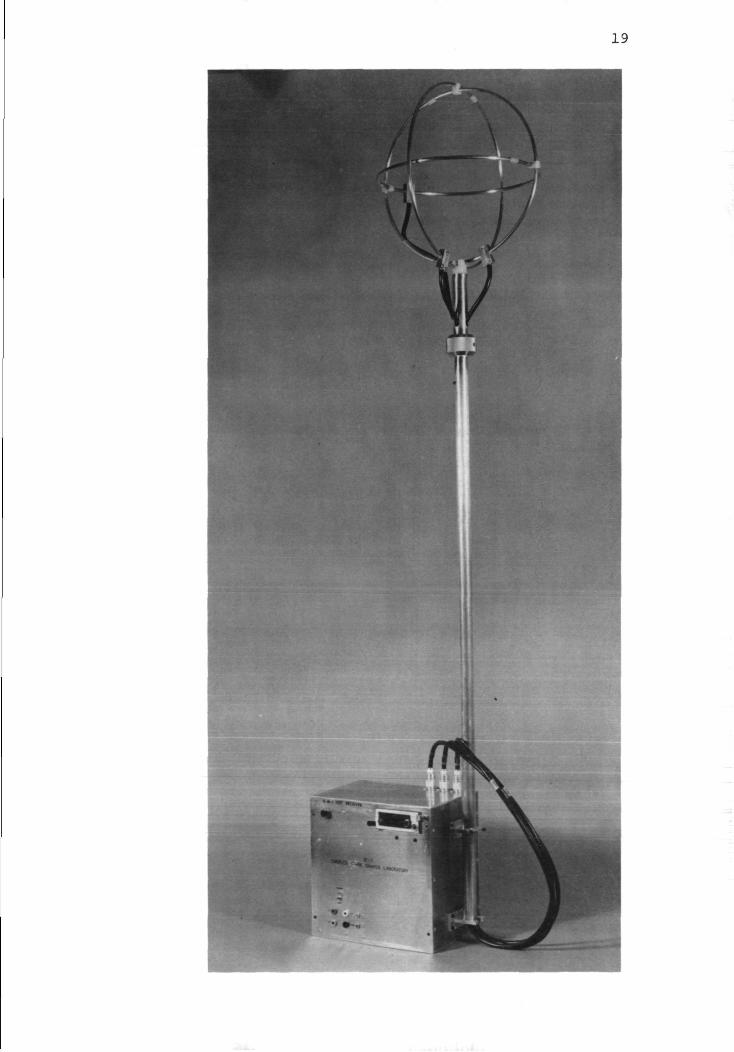
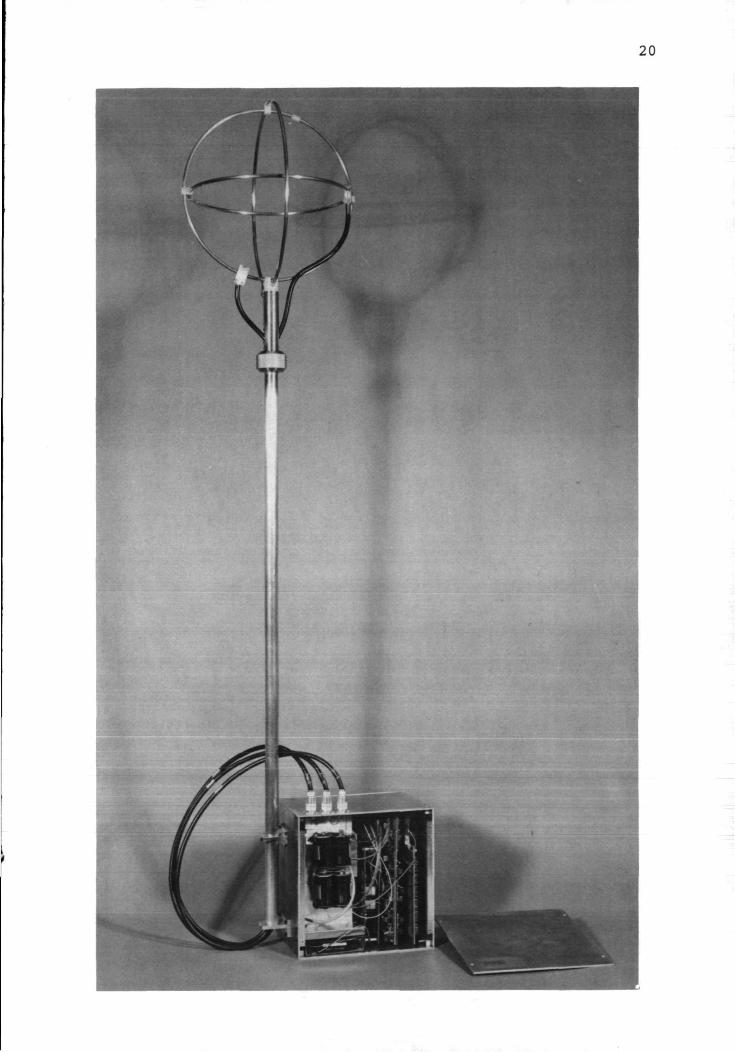
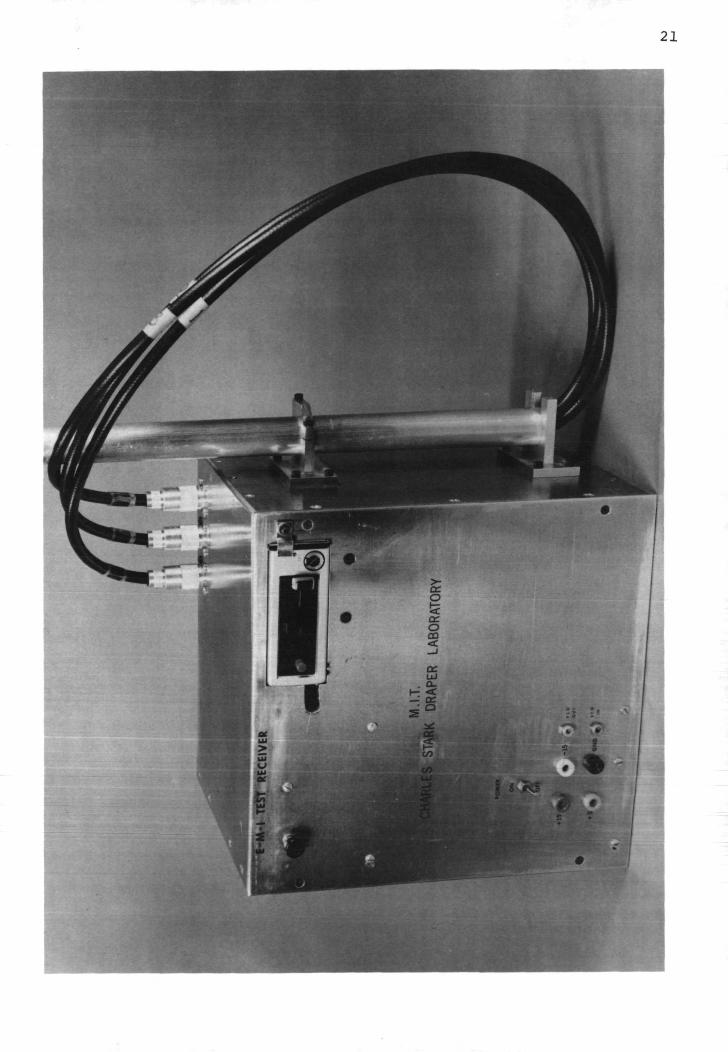
5.5.2 DEVELOPMENT .OF THE EMI RECEIVER
During the three-month Study Phase extension, CSDL undertook
the design and fabrication of a special EMI receiver, self-
contained and similar in its important characteristics to the
SEP receiver, and capable of being mounted on an LRV for high
confidence determination of LRV interference effects on the
SEP experiment. The completed receiver is pictured in Figs.
5.3 , 5.4••'/ 5.5 and 5.6. This unit was ultimately used to
record the interference environment during Apollo System EMI
and Compatibility Tests at MSC, performed on March 29, 1971.
A brief description of the test conditions, the receiver
characteristics and the test results is given in the CSDL memo
entitled "EMI Test Results, Quick Look (Using MIT EMI Receiver),i • • • ' . - ' - ' • ' ' " - ' • '
dated 19 February 1971, which is also included in this report
as Appendix 5.6. Later, during the execution of NASA Contract
NAS 9-11540, a detailed error analysis of all circumstances of

18
the EMI tests as well as extensive post-^test calibration checks
of the EMI receiver led to slight revisions of the "quick
look" results and provided the highest-confidence data to date.
19
20
21

22

23
6.0 PHASE I DOCUMENTATION , .
In addition to design activity, a complementary documenta-
tion effort was pursued by CSDL during the Study Phase resulting
in documentation important to further evolution of experiment
hardware. Among the more significant documents produced were
the following:
(1) A preliminary Hardware Technical Specification
which served as the basis for Part l,of a
preliminary End Item Specification.
(2) Part 1 of a preliminary End Item Specification
(See Appendix 6.1)
(3) A Configuration Management Plan suitable for follow-
on hardware fabrication (See Appendix 6.2).
(4) A Reliability and Quality Assurance Plan suitable
for follow-on production (See Appendix 6.3).
(5) A Procurement Specification for the Data Storage
Electronic Assembly (See Appendix 6.4).
(6) A preliminary parts list for the proposed hardware
design.
24
7.0 CONTRACT AND SUBCONTRACT DEFINITION, PROPOSAL, PREPARATION
AND EVALUATION ;
For CSDL, an objective of the extended Study Phase effort
was the preparation and submission to NASA MSC of a technical
and cost proposal for development and manufacture of the SEP
Experiment hardware, in response to request for Proposal No.
JC931-88-1-165P. The work accomplished under the Study Phase
was applied in the generation of CSDL Proposal No. 70-238
responding to the RFP. In this document, CSDL proposed the in-
house development and manufacture of essentially all the SEP
hardware, except for the ground support equipment and antennas
which would be designed and built by a subcontractor. In
addition, the subcontractor was to furnish resident engineering
support, engineering field support and certain other local
support to supplement the CSDL capability.
The Raytheon Company was invited by GSDL to bid on the
subcontract activity, and requested to prepare supporting
technical and cost proposals. For this purpose, the necessary
contacts were established between M.I.T. and Raytheon personnel
to define the subcontract requirements, identify the tasks and
specify the level of effort.
Several aspects of the completed proposal were regarded as
unsatisfactory by MSC, and the proposal was not accepted in its
original form. Of particular concern to MSC were potential
manpower problems attributable to in-house manufacture of all
SEP hardware requiring a rapid but short-term peaking of produc-
tion manpower to produce the flight hardware.
To meet these objections, CSDL subsequently substantially
revised the original proposal by placing the manufacture of
the Compatibility Unit, the Qualification Unit, and the two
Flight Units with the subcontractor, in addition to the other =
fabricated items and support defined in the original proposal.
Because of the magnitude of the subcontract effort under this
revision, it became necessary for CSDL to solicit competitive
bids from competent potential subcontractors, arid a vigorous
effort was mounted by CSDL to develop the request for proposal
package. Because of the ever-dwindling time remaining before
the Apollo 17 scheduled launch date of July, 1972, an accel-
erated bid effort was dictated and only two industrial contractors
RCA-Camden and Raytheon were solicited. Technical and cost
proposals subsequently received in November of 1970 from both
organizations, were carefully reviewed by CSDL and Raytheon was
selected as the successful bidder. Then followed intensive dis-
cussions with Raytheon to coordinate details of the subcontract
effort with CSDL's revised proposal plan. This effort culminated
late in November 1970 with CSDL "Technical Proposal for the
Surface Electrical Properties Experiment", Proposal Number 70-238,
Revision 1. A copy of the technical portion of this document
appears in appendix 7.1.
MSC was concerned about coordination problems that might
occur.in a program in which, the prototype design was the res-
ponsibility of CSDL and the productizing and manufacture of the
end items was the responsibility of the subcontractor under CSDL
supervision. In addition, the estimated cost of the program was
considered high and MSC foresaw possible coordination problems
. • . . :'", ; . . . . ' • • ; • . . . ' - • . . • • : . ' . , • • • 2 6
within M.I.T. arising from the organizational relationships
outlined in the proposal. The revised proposal was not approved.
This disposition terminated the role of CSDL as prime bidder for
SEP hardware implementation.
A review of the situation by the M.I.T. Administration
eventually resulted in a policy decision to proceed with a
third proposal which placed responsibility for implementatiqn
of the SEP experiment in the hands of the M.I.T. Center for
Space Research supported by a SEP Program Management Office to
administer a major subcontract with an industrial subcontractor
for the design, development, test and manufacture of the SEP •
hardware and supporting equipment. This effort required the
generation of two major documents: (1) A detailed request for
.proposal defining for bid purposes the tasks and responsibilities
of the industrial subcontractor for implementation of SEP, and
(2) a proposal from M.I.T. to NASA responsive to RFP JC931-88-1-
165P and delineating the role of the M.I.T. Center for Space
Research as prime contractor, and as manager and administrator
of a major subcontract. The task of preparing these documents
on an accelerated basis was performed by CSDL and CSR personnel
whose familiarity with the details and problems of the program,
developed through the course of the Phase I effort, offered the
best chance of accomplishing the task within permissible time
limits. .
"During" this period, plans for the operation, organization
and staffing of the Program Management Office were formulated
and activated. Several of the individuals who were expected to
comprise the PMO were brought together to carry on the tasks of
contract and subcontract definition, proposal preparation, and
• : • • • • ' ' . ' • - . . 2 7
subcontract bid response evaluation. Among' these were
Dr. James W. Meyer of the M.I.T. Lincoln Laboratory, who would
assume the role of Program Manager under the Hardware Phase
implementation contract, and L. B. Johnson of CSDL, prospective
Assistant Program Manager, Who would coordinate back-up support
from CSDL. In addition, special assistance was to be available
from Dr. L. J. Ricardi of Lincoln Laboratory on antenna problems
and from Dr. J. A. Kong on questions relating to electromagnetic
propagation. Generation of cost information was accomplished
under the supervision of L. E. Beckley, Administrative Officer
of CSR.
The request for Proposal for the SEP subcontract effort was
completed early in January 1971, and mailed to prospective bidders
on 4 January with a closing date for response of 18 January.
Because of the extremely short time available for preparation of
responses by the bidders and for evaluation of the responses by
CSR, only two industrial organizations were solicited, RCA-Camden
and Raytheon. A bidders conference, supported by CSDL, CSR, and
Lincoln Laboratory personnel, was held 6 January, 1971 at M.I.T.
Subsequently in response to CSR's invitation, each bidder made
an individual interim presentation prior to the proposal deadline.
The CSR technical proposal in response to MSC RFP JC931-88-
165P was completed in early January and copies were forwarded
to MSC prior to an M.I.T. technical proposal and preliminary
budget presentation made "at"MSC "oh January 20/1971. A copy of
the technical proposal is contained in Appendix 7.2.
In the latter part of January, a Proposal Review Committee
comprised of personnel from CSR, LSE, the projected PMO, CSDL
and Lincoln Laboratory, was formed to review the subcontract
• ; . . . • " . • . - . ' • ' . ' • . ' " ' ' 2 8
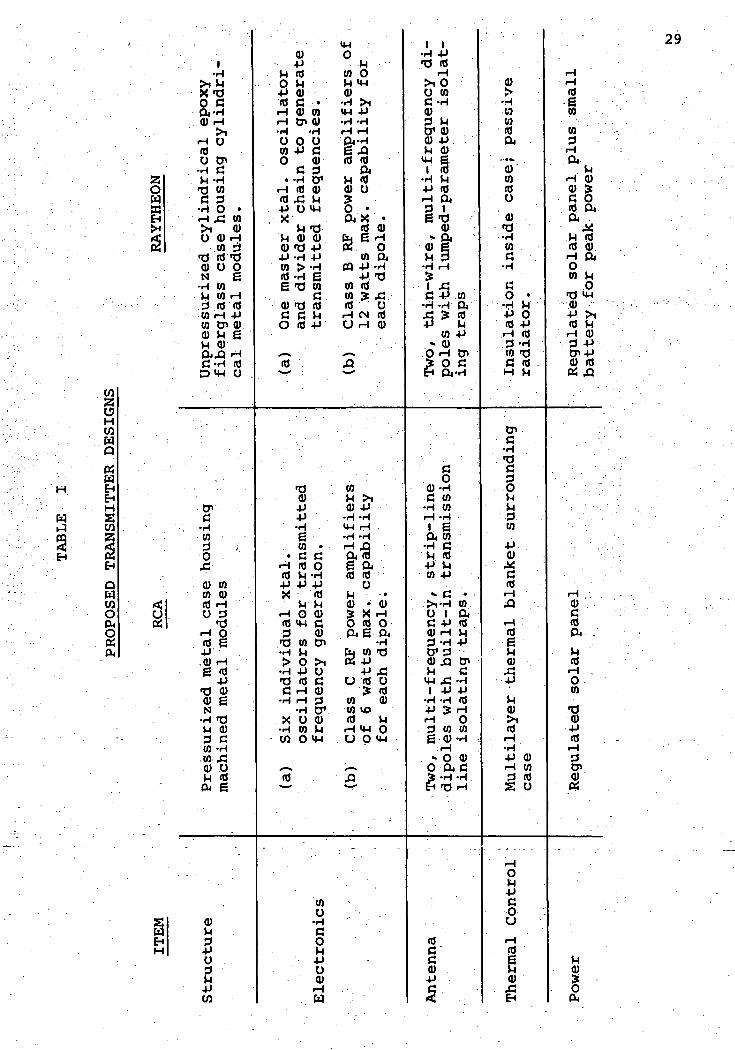
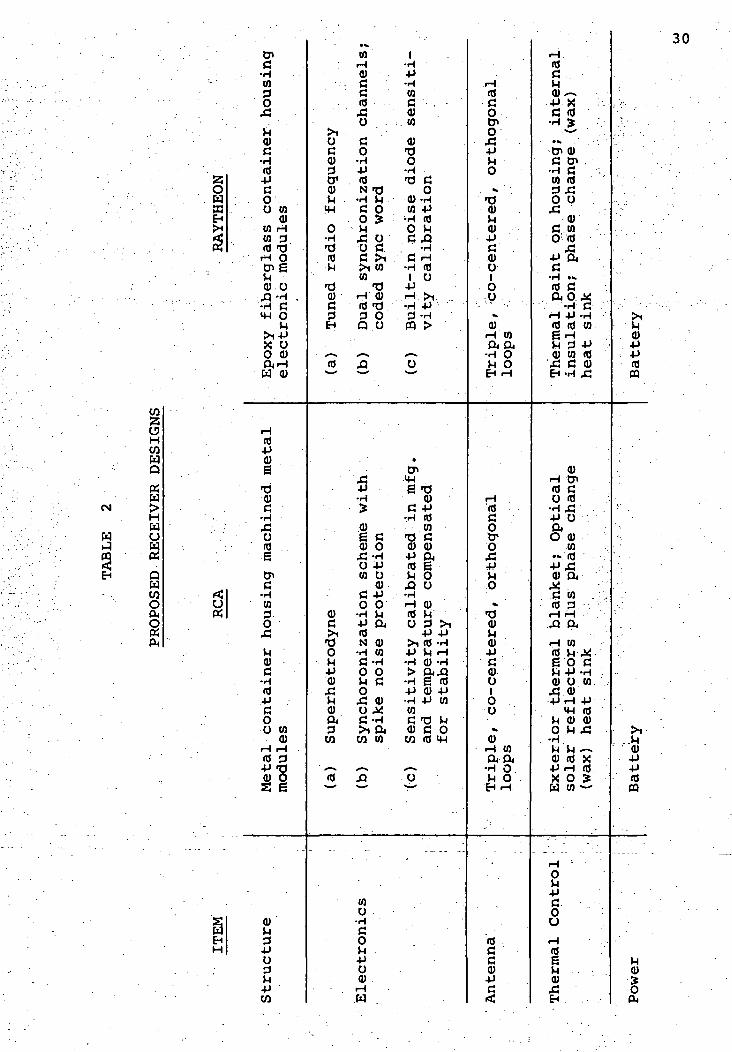
proposals from RCA and Raytheon. The team worked intensively in
the period from January 18 to January 28 to review the designs
as proposed by the two bidders and summarized in Tables 1 and
2, as well as to assess the cost and other factors on which to
base an award decision. On the latter date, the Committee
presented the results of their review to members of M.I.T.
Administration who concurred in the decision to award the SEP
subcontract to Raytheon.
The final efforts under the extended Phase I SEP study
entailed support of MIT-MSC negotiations for Contract NAS 9-11540
and preparation for immediate additional EMI tests.
2O
9-EH
1•H
X *O0 G<D rH
rH O10O CT*•H arl -H
TJ tOC! 3•H O •rH XS M>i 0)O 0) rH
W 3TJ tO 'Oa) o oN g
-H WM W H3 10 1010 rH -PW CP 0)<1) M grl Q)
04 .Q ^C -H 10DMH O .
DV
C. -H
103 tOx:0) 1010 0)tO HO 3
rH O(0 g.p.0) rHg to.pTJ 0)0) gM
•HTJM <D3 C10 -Hto x;<u orl tO
cu g
a)rlM4Jo3rl
4JCO
0)•p
rl 10
O rl
•P Q)
(0 C •H 0) COH OvQ)•H -HO O O10 -P CO (!)
C 3• -H O1
rH 10 0)to x: M-P O «Hx
H TJrl 0) <U
0) TJ -P4J -H -P10 >-H10 -H gg TJ M
. . C ,a; TJ <oo to -P
^^ •
«J
•o0)
-p•Hgto •
• c cH 10 O10 rl-H
-p -p -pX to
rH O <U10 MH C3 <U
TJ to DI*rH H> O >i•H -P OTJ fO CJC H 0)•H H 3
•H O1
X 0 <U•H 10 rlW O MH
_
tO
too•HCoJjo0)rHw
MHO
rl
to or» j^ .
0)H | ^j•H -HrH HQj-Hgxi10 fO
curl Itfa) o3O •ft'X ' •to a)fa g rHPH O
to CUCQ -P -H
•P TJto tOto s xifO OrH M tOCJ rH 0)
^^
^ • '
toM £*i<1J -PrH -HMH rH .•H -HrH i
g p,(0 (0
otj - - •
a; • a)£ X rH
P! g. P|•H
fa W TJK -P
•P X!O tO O
£ 1010 0)to vofO >HrH MH OO O <*H
.fl
•.
1 1•H .p•d to
rH
^i Ou toC-H0)3 MO1 Q)a) -prl 0)II 1 g
1 to•H rl
•P fOrH CU3 1g-a
<u* cu
0) g
•H rH
1 XSC 53 to
•H -H CUJ3 > <04J H
to -Pv Q)
.O rH CT>> o c:EH CU-H
• ' c •• '•o
0) -HC to
•H inrH -H
1 gcu w•H Crl 10
-P Mto -P^ c •
>i-H 10O 1 CUC -P 10Q) H r)
3-H 4JO1 3(1) ,O Q*rl C
<4H XS-H1 -p -p
•H -H 10•P ^ rHrH O3 to tog 0)-rt
rH•. O <IJ
O CU Gi -H -HEH 73 rH
10CC(U4JC -<
0)K*
•HCOwtOcu
.-•^0)totooa)r0•Htoc
-H
13o •
' *H M+J 010 -PrH 103 -Hto TJC fOH rl
c•H•ac3orl
)H; 3.
to4J<ulJctorH43
rHtOg
rj•P"H0)>-itOrH•H•P 0)rH W3 10S 0
rH
9-PcoCJ
rHtoQ<Uj5EH
HrH
10gtoto3HCU-
rl
H <D0) SC OtO CUcu
r^rl (0
fO Q)H CUO0) M
OTJ MH
•' p j -."1 1 ^.tO rl
rH Q)3 -Ptp-p0) 10P^ ^7
H .0)CtOCU
tOH ,OtoTJ0)•PtOH
&0)
rl
(U
ocu
29
2OH
oHCOHQ
«H
HU
COO
C7>G
•HCO3nW
XJ
>_l0)c
•Hid-PCOU CO<DCO Hco 3nj "drH O
rH0) O
•H Cm oj^
i -PX Oo cuM CU
Hid•P0)g
•d0)c•HX!0(0gCr>G
•HCO3.0X!
HCUc
•H(d-pc0O CO
CDrH rH« 3•P -d0) Os g
CU
3.poM•PCO
iOGCUrj
O1
CU
rHHH
O•H•didM
'd(UG3EH
• ,-»id
cuC
*do-PCU
_<*;MCUCU'
CO
Id
COHCUCcid
O
GO
•H4J(dN rrj
,_J tj
C Oo :$XI Ou cK ^1>1 COCO
*drH 0)fl$ 'O3 OQ O
*-*.Q
\ , '5•H
. u
CUg cCU O
04-)CO O
<uG -P0 O
•rH &•!
•P CUidN CU
•H COC-HO OM GOX! Q)O J^C-H
co co
£
-
10O
•HCo}_l-po0)rH.W
1•H-P•HCOC .CUCO
CU-do•H•d G
oCO -P
•rH (dO rHC jQ
•HC rH
*H fd1 O
-prH >1•H -P3 "Hffl >
,-
O
•
u?g-d
cuc: -P•H id
COT3 CCU CU•P CU(d g>H OX) O•HrH Q)rd H" '0 3 >i
-P 4J>i (d -H-P M rH•H CU -H> CUX1
•H g (d-P Q) -P•H -P WCOG 'd MCD COW Id <4H
."o
- - - - - -
rH<doCnOX!
HO
^ ' •T)CUMCU-PgCUO|
O
• *CU
rH COCU CU
•H 0rH O
EH rH
rH'idOtro4J
O
*T3
J^CU4JCCUo1oo ;^
CUH COcucu•H OrH O
- - - -
'(dGGCU-P
<
rH(dgM
•P Xc id•H U
.»-' '• •» .' • • ••
CncUC tx*
•rH Gco id3X!O Ux:
cuC COo id
X!4J p.C
•H .(d ccuo*
• • ' . ' "••H C' .'•'rH -P -Hrd id cogHM 3 -Pcu co idX! G CDEH -H X!
CD^H yiid co « ;
•H X! . .-P 0cuO <D
CO•».' id ,•PXSCD CU :
y. .C CO .:.
id 3. :rH iH<") p,
rH CO<rj ^ ygo crH -P -HCU O CO
X! CD4J rH -P
MH (dM 0) CDO H X!
. -H_ij tj ^
cu id x•PrH flx o &w w~
HOM-Pc.0
HidgcuX!
^1MCU4-)4->id«
,
i..rH
0)-P4Jrd
MCU
O
30
31
8.0 SCIENCE - PRINCIPAL INVESTIGATOR . :;
The efforts of the science team were focused on keeping
the evolution of the experiment hardware consistent with the
objective of deriving the most scientific information from
the experiment when performed on the moon. Inevitably the
.necessity of compromise arises as the.factors of manned;space
flight come to bear on the hardware in addition to the .
requirements imposed by science. The science team consisted
of a mix of scientists and engineers who worked to keep
requirements current and consistent and to develop the
rationale necessary to the choice from among the alternatives
of compromise.
8.1 THEORY
The theoretical treatment of a dipole antenna lying on
the interface between two dielectric media, one of which
may or may not be further stratified as applied to our
experiment is very complex. Ordinary radiation and propagation
theory is neither accustomed to treatment of the boundary
conditions arising out of the experiment configuration or to
the detailed treatment of electromagnetic wave components
in the near and intermediate zones. Yet, experimental data
is to be taken beginning and hopefully ending within the space
occupied by the 'transmitting dipole itself. Therefore in "a
given traverse the receiver would pass from the near through
the intermediate into the far zones of the dipole with the
32
receiving pickup loops a finite distance (probably not an
insignificant fraction of the shortest wavelength) above
the interface.
Because of the difficult nature of the problem several
different approaches to its solution were believed desirable
and hence were undertaken.
8.2 RELATED EXPERIMENTAL DATA
It was also necessary to assay related experimental data
such as tftat obtained on glaciers and the dielectric properties
of samples returned from the moon to make sure that transmitter
power, fo£ example, would be adequate for the experiment b\it
hot excessive which would increase experiment weight. A
significant amount of the science team effort was in the
planning, execution, and analysis of experimental tests carried
out on glacier field trips. Experience with these tests
indicated the need of a field evaluation model of the experi-
ment hardware in the electrical configuration of the flight
model but specially adapted to meet the requirements of
field testing on glaciers.
8.3 TECHNICAL MEMORANDA
Selected technical memoranda written during this phase
of the program are included in1full text in Appendix 8.1
attached to principal copies of this report.
33
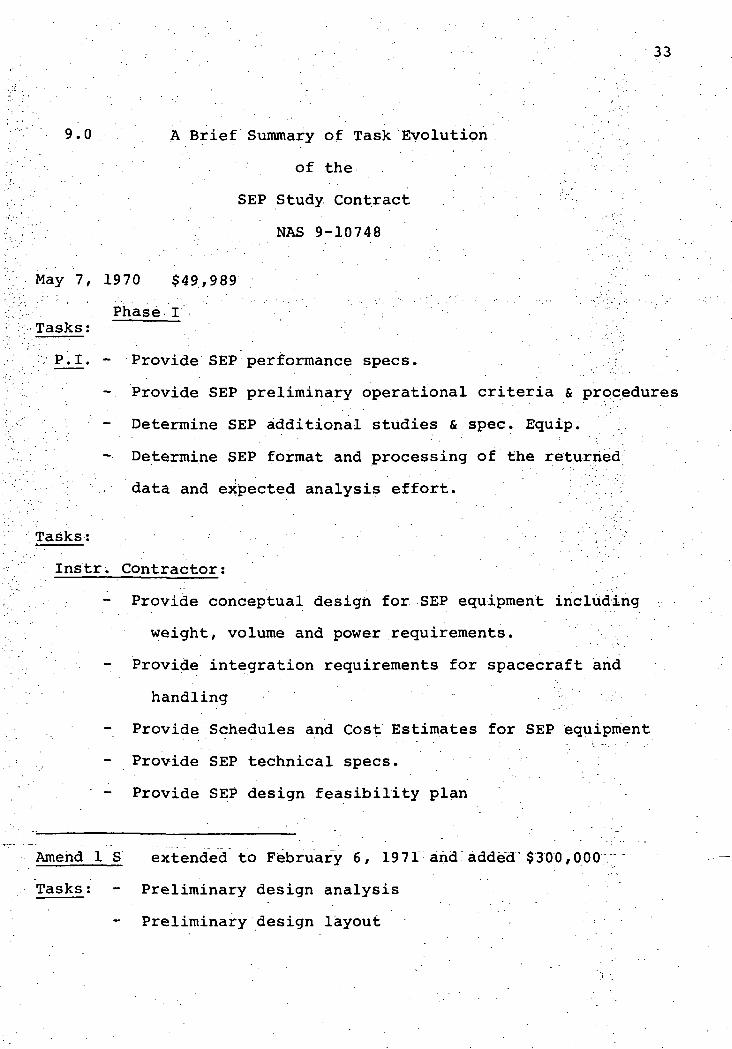
9.0 A Brief Summary of Task Evolution
' . • ' . ' •''. of the- . ' •• •; '• .-"••• ' • .
SEP Study Contract
: NAS 9-10748
May 7, 1970 $49,989
Phase ITasks; •• - . . • •.' • • . .-.'.' .;.";..'
P.I. - Provide SEP performance specs. i
- Provide SEP preliminary operational criteria & procedures
; - Determine SEP additional studies & spec. Equip. ;
- Determine SEP format and processing of the returned
•'•.-• data and expected analysis effort. i
Tasks; . • . . : ' • •' • • - • • ' / V ; .''• ;•"
Instr. Contractor;
- Provide conceptual design for SEP equipment including
weight, volume and power requirements.
Provide integration requirements for spacecraft and
handling
- Provide Schedules and Cost Estimates for SEP equipment
Provide SEP technical specs.
Provide SEP design feasibility plan
Amend 1 S extended to February 6, 1971 and"added"$300,000
Tasks; - Preliminary design analysis
Preliminary design layout
34
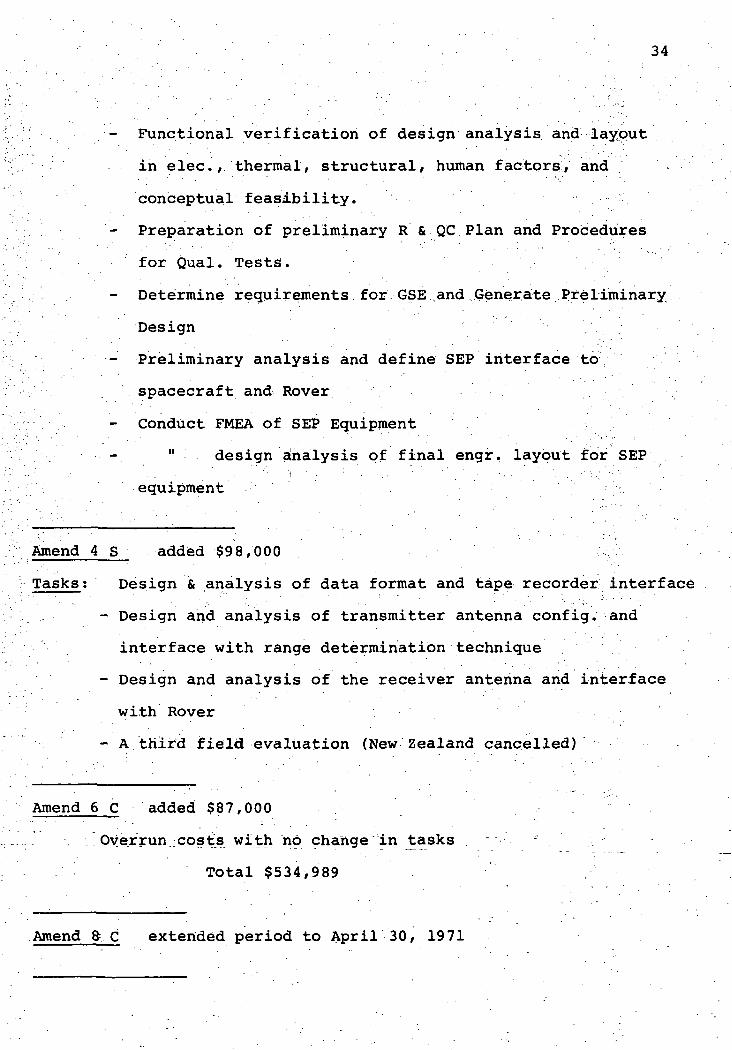
Functional verification of design analysis and layout
in elec., thermal, structural, huitian factors, and
conceptual feasibility.
- Preparation of preliminary R & QC Plan and Procedures
for Qual. Tests.
Determine requirements for.GSE vand Generate Preliminary
Design
— Preliminary analysis and define SEP interface to
spacecraft and Rover
Conduct FMEA of SEP Equipment
- " design analysis of final engr. layout for SEP
equipment
Amend 4 S added $98,000
Tasks; Design & analysis of data format and tape recorder interface
- Design and analysis of transmitter antenna config. and
interface with range determination technique
- Design and analysis of the receiver antenna and interface
wi.th Rover
- A third field evaluation (New Zealand cancelled)
Amend 6 C added $87,000
Over run .icpsts with no change in
Total $534,989
Amend 8= C extended period to April 30, 1971

35
GLACIER TRIPS
No. 1 Athabasca - August & September 1970
No. 2 Athabasca - November- December 1970
'••."• New Zealand - Jan-Feb. 1971(Authorized, but cancelled by M.I.T.).
36
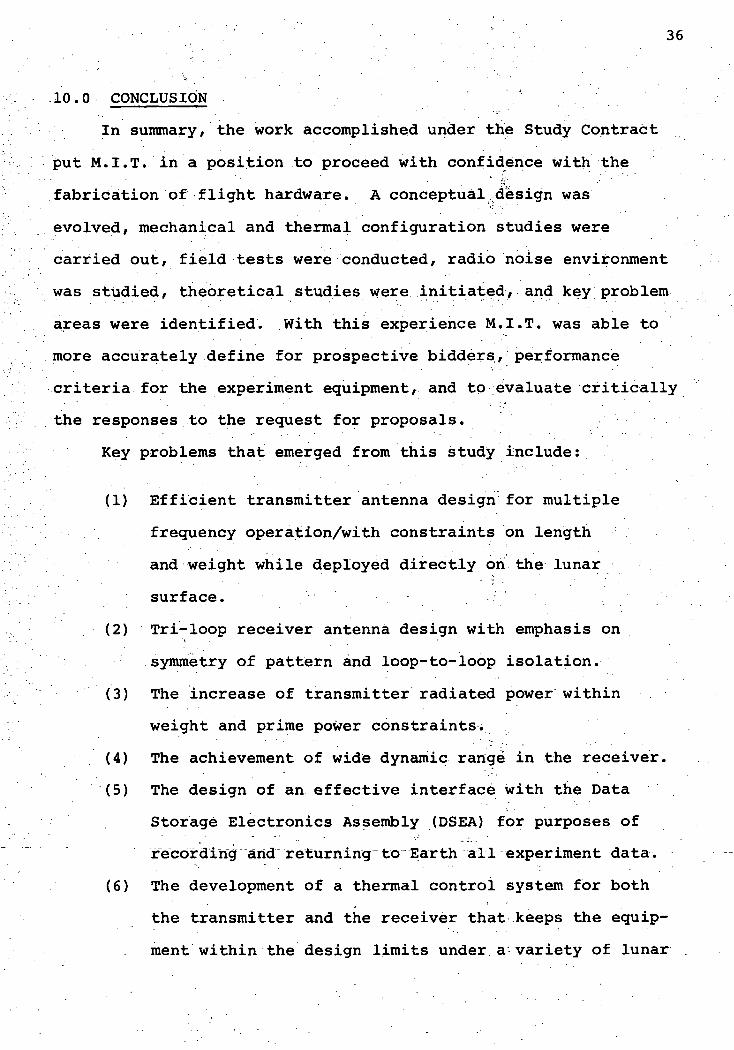
10.0 CONCLUSION
In summary/ the work accomplished under the Study Contract
put M.I.T. in a position to proceed with confidence with the
fabrication of flight hardware. A conceptual design was
evolved, mechanical and thermal configuration studies were
carried out, field tests were conducted, radio noise environment
was studied, theoretical studies were initiated, and key problem
areas were identified. With this experience M.I.T. was able to
more accurately define for prospective bidders, performance
criteria for the experiment equipment, and to evaluate critically
the responses to the request for proposals.
Key problems that emerged from this study include:
(1) Efficient transmitter antenna design for multiple
frequency operation/with constraints on length
and weight while deployed directly on the lunar
surface. V
(2) Tri-loop receiver antenna design with emphasis on
symmetry of pattern and loop-to-loop isolation.
(3) The increase of transmitter radiated power within
weight and prime power constraints.
(4) The achievement of wide dynamic range in the receiver.
(5) The design of an effective interface with the Data
Storage Electronics Assembly (DSEA) for purposes of
recording arid returning to Earth~all experiment data.
(6) The development of a thermal control system for both
the transmitter and the receiver that keeps the equip-
ment within the design limits under a variety of lunar
37
environmental conditions.
(7) The derivation from theoretical studies of a mathe-
matical formalism simple enough to permit solution
yet representing the physical situation adequately for
correlation with field results.
(8) The design of field tests on Earth to provide critical
evaluation of engineering approaches, data for compar-
ison with theory, and data to aid in the interpretation
of that returned from the moon.
The resolution of these problems make up a major share of
the effort necessary to conduct the experiment on the moon along
with the resolution of the problems that inevitably arise in
connection with the design, development, and manufacture of
man-rated space hardware.

APPENDIX 2.1
SURFACE ELECTRICAL PROPERTIES EXPERIMENT
CONCEPTUAL DESIGN
Massachusetts Institute of Technology
Center for Space Research
SURFACE
ELECTRICAL PROPERTIES
EXPERIMENT
• CONCEPTUAL DESIGN
CSR TR 70-7
Principal Investigator: Gene Simmons
Principal Administrator: John V. Harrington
October 28, 1970
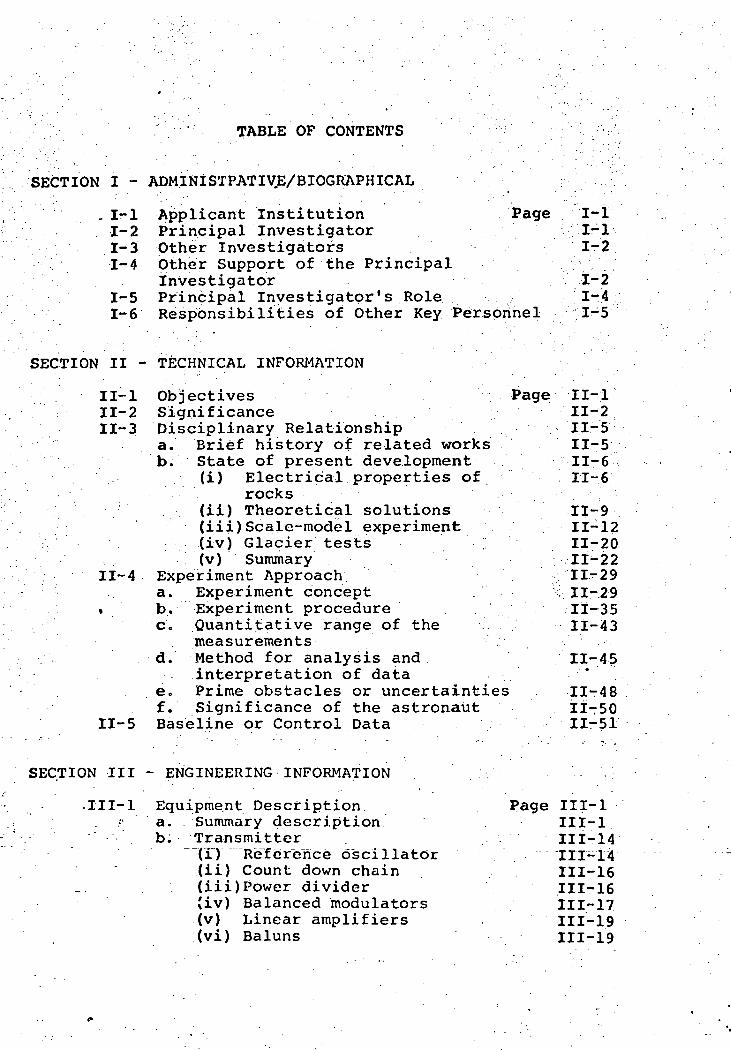
TABLE OF CONTENTS
SECTION I - ADMINISTPATIVE/BIOGRAPHICAL
. 1-1 Applicant Institution Page 1-11-2 Principal Investigator 1-11-3 Other Investigators 1-21-4 Other Support of the Principal
Investigator *~21-5 Principal Investigator's Role 1-41-6 Responsibilities of Other Key Personnel 1-5
SECTION II - TECHNICAL INFORMATION
II-l Objectives PageII-2 SignificanceII-3 Disciplinary Relationship
a. Brief history of related worksb. State of present development
(i) Electrical properties ofrocks
(ii) Theoretical solutions(iii)Scale-model experiment(iv) Glacier tests :(v) Summary
II-4 Experiment Approacha. Experiment concept ." :
. b. Experiment procedurec. Quantitative range of the
measurementsd. Method for analysis and
interpretation of dataev Prime obstacles or uncertaintiesf. Significance of the astronaut
II-5 Baseline or Control Data
II-l11-211-5II-511-6II-6
II-911-1211-2011-2211-2911-2911-3511-43
11-45- •
11-4811-5011-51
SECTION III - ENGINEERING INFORMATION
.111-1 Equipment Description•• a. Summary description
b. Transmitter(i)Reference osciTlator(ii) Count down chain(iii)Power divider(iv) Balanced modulators(v) Linear amplifiers(vi) Baluns
Page III-l
111-14111-14111-16111-16111-17111-19111-19
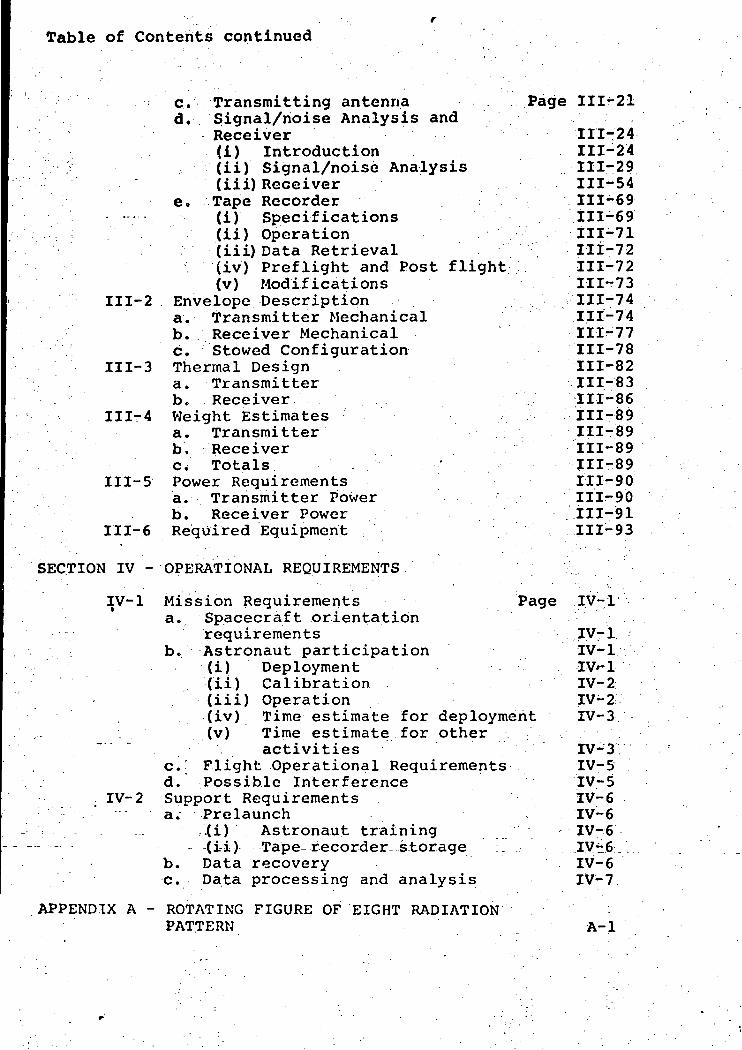
Table of Contents continued
c. Transmitting antenna Page 111-21d. Signal/noise Analysis and
Receiver '111-24-(i) Introduction 111-24(ii) Signal/noise Analysis ..-111-29.(iii) Receiver 111-54
e. Tape Recorder 111-69(i) Specifications 111-69(ii) Operation 111-71(iii) Data Retrieval '-111-72(iv) Preflight and Post flight 111-72(v) Modifications 111-73
III-2 . Envelope Description 111-74a. Transmitter Mechanical .111-74b. Receiver Mechanical 111-77c. Stowed Configuration 111-78
III-3 Thermal Design 111-82a. Transmitter 111-83b. Receiver 111-86
III-4 Weight Estimates 111-89a. Transmitter 111-89b. Receiver 111-89c. Totals ' 111-89
III-5 Power Requirements 111-90a. Transmitter Power 111-90b. Receiver Power . .111-91
III-6 Required Equipment III-93
SECTION IV - OPERATIONAL REQUIREMENTS
IV-1 Mission Requirements Page IV-1a. Spacecraft orientation
requirements IV-1b. Astronaut participation IV-1
(i) Deployment IV l(ii) Calibration IV-2(iii) Operation IV-2(iv) Time estimate for deployment IV-3(v) Time estimate for other
activities IV-3c." Flight Operational Requirements. IV-5d. Possible Interference IV-5
IV-2 Support Requirements IV-6a. Prelaunch IV-6
- - .(i) Astronaut training IV-6:(ii) Tape recorder- storage_ . _IVt6
b. Data recovery IV-6c. Data processing and analysis IV-1
APPENDIX A - ROTATING FIGURE OF EIGHT RADIATIONPATTERN A-l
SECTION I - ADMINISTRATIVE/BIOGRAPHICAL . , - - ,
1-1. APPLICANT INSTITUTION :
' ' .. " : " • ' • • * " ' - -
Massachusetts Institute of Technology Telephone:77 Massachusetts Avenue
,: Cambridge, Massachusetts 02139 (617) 864-6900
Principal Administrator Responsible for Experiment:
John V. Harrington Title: Director, Center.•• ' • • for Space Research
Telephone: (617) 864-6900.ext. 7501
1-2; PRINCIPAL INVESTIGATOR
Name: Title: :
Gene Simmons Professor of Geophysics
Mailing Address: Telephone:
Massachusetts Institute of Technology (617) 864-690054-314 ext. 6393 ;Cambridge, Massachusetts 02139
Biographical Sketch:
The principal investigator has received a B. S..in electrical
engineering, an M.S. in geology, and a Ph.D. in geophysics; He
is a co-investigator on the Lunar Heat Flow Experiment, a part
of ALSEP, and has served on various committees for NASA. He
has experience in collecting and interpreting geophysical
field data as well as laboratory data. Dr. Simmons; is "
currently on leave of absence from MIT and is serving as
Chief Scientist, NASA Manned Spacecraft Center, Houston.
.Page 1-1

"Page missing from available version"
a:-z- — xo.
1-5. Principal Investigator's Role in Relation to thisExperiment .
This experiment is expected to be truly a team effort.
Accordingly/ the principal" investigator will participate in
all of the phases—equipment design and manufacture,
preparation of analog models for data reduction/ collection
of data on the lunar surface/ reduction of data/ and finally,
the interpretation of data. It is anticipated that each of
the other team members will carry their share of the work on
this experiment; their responsibilities are detailed below
in Section i-6. Although the principal investigator will be
responsible for both the engineering and the scientific
aspects of this experiment/ most of the actual engineering
work will be done by the engineers/ or contractors working
for them/ at the MIT Center for Space Research. The.
^scientific aspects of the work will be done by the principal;• ' ' • ' • ' . ' • ' ' • •
investigator and by David Strangway, Tony England/ and their
associates.•
The principal investigator expects to spend an average
of 10 percent of his working time on this experiment in the
early phases. During the execution of the experiment on .the
moon and the early data reduction/ full time will be devoted.
Finally, in the interpretation phases/ about half-time will
be spent on this experiment. It should be possible to phase
the periods of heavy load with those of other work that are
currently expected to be in progress during the next few years/
Page 1-4
namely the continuation of the lunar samples program and the
lunar surface heat flow experiment.
1-6. Responsibilities of other key personnel
Dr., David W. Strangway, a co-investigator/ is an
associate professor of Physics at the University of Toronto',
and will become Chief of the Geophysics Branch of the MSC
in the fall of 1970. He will assist in the general design
of the experiment, and will supervise analog scale-model
studies, field experiments to test prototype apparatus, and
data interpretation. He will devote an average of 20
percent of his time to this project.
Anthony W. England, an astronaut at MSC, also is a
co-investigator. He will assist with the field tests of the
engineering models and will help with the design of the
experiment. He will be particularly valuable in coordinating
the interfaces of the experiment with MSC and with the:
astronaut office/ He will participate in the interpretation
of the data from the moon. It is expected that he will
devote from 5 to .1.0 percent of his time to this experiment.
. ;Dr. John V.. Harrington, Director, MIT Center for Space
Research, will be responsible for administration p.f those
portions of the program concerned with implementation of this
lunar surface experiment, and will devote 5 percent of his
time to this project.
Page 1-5
Richard H. Baker, Head, Laboratory for Space Experiments
within the Center for Space Research, will spend 25 percent,
of his time on administrative functions and technical, - ' ' . - " » - • •
considerations involved in the design and fabrication of the
lunar surface properties experiment.
Lawrence H. Bannister, Staff Member, Center for Space
Research, will be Project Leader for the Experiment Design,
and will devote 50 percent of his time to this project. He
and Mr. Baker will lead the engineering group that designs,
constructs, and tests various models through the engineering
hardware stage.
Dr. Ajit K. Sinha, a postdoctoral fellow at the
University of Toronto, is computing theoretical mastercharts
to demonstrate the effects of various physical parameters
expected on the moon. These will be used with scale-model
and field results to develop methods of interpreting lunar
data. He will devote 100 percent of his time to this project.
Raymond D. Watts is completing his Ph.D. requirements 'at
the University of Toronto and will be a research associate at
the Lunar Science Institute in the fall of 1970. He will
develop computerized techniques to interpret the data .
returned from the moon. He will devote 50 percent of his
time jto this project.
Gerald A. LaTorraca is a graduate student at MIT. He will
work closely with the CSR in developing engineering models
Page 1-6
and will assist in testing these models in the field. He
will devote 75 percent of his time to the project.
James R. Rossiter is a graduate student at the
University of Toronto and will be a graduate fellow of the
Lunar Science Institute in the fall of 1970. He is
conducting analog scale-model studies and will assist in
field tests of apparatus and in data interpretation. He will
devote 75 percent of his time to this project.
The Charles Stark Draper Laboratory of MIT will be
Principal Contractor responsible for detailed design and
fabrication of qualified flight hardware. John V. McKenna,
of the Draper Laboratory, will be Program Manager and will
devote 100% of his time to this project.
Page 1-7
SECTION II -TECHNICAL INFORMATION
II-l. OBJECTIVES
The chief objectives of this experiment are to
determine layering in the lunar subsurface, and to search
for the presence of water at depth., In addition/the
electrical properties of the lunar material will be
measured in situ. Under favorable conditions, it may be
possible to obtain an independent estimate of the lunar
thermal flux and an indication of the number and size of
subsurface scattering bodies.
II - 1

II-2. SIGNIFICANCE
It is difficult to overstate the significance of a
clear demonstration of the presence or absence of water
in the lunar interior. Many of the surface features have
been attributed to past erosion by water or ice. Igneous
processes^ as we know them on earth, depend on the
presence of water to reduce the melting points of silicates.•• -: i , • . • •
But the absence of water in the moon would demonstrate
that igneous processes do not operate on the moon in an
analogous fashion to those on the earth. This would imply
greatly different thermal models for the two bodies. Thus
the search for water in the lunar interior is scientifically
very important.
Examination of the samples returned on Apollo 11 and
Apollo 12 indicated an unusual absence of water. Few .• ' : I • - • ' • " • ' ' . - * '
hydrous minerals were found. The assemblage of .
iron-troillte-ilmenite suggests a very low partial pressure
of H'C) during formation of the rocks which are now residing
on the surface- - This finding is in agreement with radar
measurements made from Earth and from Lunar Orbiters,
which indicate a very low electrical conductivity of the
material at the surface of the moon. Therefore, the amount
of water, either free or bound in crystal lattices, at the
surface of the moon is known to be extremely low. However,
II - 2
the available data leave completely unanswered the critical
question of whether or not water exists at depth in the moon.
It is the purpose of-this experiment to measure the
electrical properties of the lunar subsurface as a function
of depth. Since the presence of even minute amounts of
water in rocks changes the electrical conductivity by
several orders of magnitude/ any moisture present would
be easily detected by this experiment. Thus upper bounds
can be set on the amount of water in the lunar subsurface
to depths of a few Kilometers.
The frequency range of the experiment has been selected
to allow determination of layering over a range of depths
from a few meters to a few Kilometers. Accordingly it may
be possible to determine the thickness of the outer layer,
commonly referred to as the regolith or the 'gardened
layer1/ in the vicinity of the landing site. Such layering
could be detected by the expected change in dielectric .• •
properties and conductivity. This subsurface topographic
information holds considerable implications for the history
of the outer few Kilometers of the moon.
Moreover, the presence of water in the moon would allow
a determination of the amount of heat flowing from the
interior of the-moon to the surface. The electrical
properties experiment, under favorable conditions, could
provide a determination of the depth at which any moisture
• : . . - . - ' • ' " ' i i - 3

present changed from the solid to liquid form. Thus the
approximate depth to the zero-degree isotherm could be
found. This depth, together with the knowledge of thermal .'..
conductivity estimated from lunar samples, could give an
estimate of the lunar thermal flux. This, in turn, would
provide important clues to the nature of' thxe .moon's core.
Recent seismic experiments have indicated .that a large
amount of scattering material may be preserwt in the lunar
:subsurface. Since electromagnetic propagation•in' this
experiment will be sensitive to these scattering bodies,
and since a number of different wavelengths are being used,
a measure .of the size and number of scatt.er.:ing bodies also
might be possible. This would give additional valuable
information on the nature of the outer few Kilometers of
the moon. . ... , ;i * - - " ' " . - . '
The'refore, the experiment will provide a wealth of
information on the properties of the lunar subsurface. It• • • . - . • ' * "
is a valuable experiment which will help to determine the
lunar history better than previously possible, and which
relates to, and complements, other scientific studies of
the moon already in. progress.
II - 4

.11-3, DISCIPLINARY RELATIONSHIP.
a. Brief history of related work.
Most geological environments on earth are too conductive
due to the presence of moisture, to allow penetration of
high frequency electromagnetic radiation. Therefore, radio
frequency interferometry has had little development as a
geophysical tool. However, the idea is not new. It was
suggested by Stern (reported by Evans, 1963) as early as
1927, but was not developed as a field technique. Although
the interpretation of his field results is open to some
question, El-Said (1956) attempted to use the method to
determine the depth to the water table in the Sahara Desert.
For this technique of sounding to be effective, the
medium being probed must have low electromagnetic losses.'fit . • • ' '' • '. . . "
Ice provides one of the few earth environments which meets
this condition. It is highly resistive (Evans, 1965) and
the bottom offers a good contrast. For this reason^ radar
pulses have recently been used to sound large ice sheets and
glaciers (Evans, 1963; Rinker et al, 1964; Bailey et al,
1964; Walford, 1964; Jiraeek, 1967), and glaciers have,
provided suitable sites to test the interferometry technique.
.(Annan, 1970). .
~ There are many indications that the lunar surface-is •'----.
also very resistive. Re.dar measurements have indicated that
lunar surface material has electrical properties similar to
II - 5
those of dry, powdered, terrestrial rocks and is, therefore,
transparent to radio waves (England et al, 1968; Campbell
and Ulrichs, 1969; Strangway, 1969; St. Amant and Strangway,
1970). Initial experiments on lunar samples indicate that
the dielectric constant and loss tangent of lunar rocks are,
1 in fact, similar to those of dried terrestrial rocks (Chung
et al, 1970; Goid et al, 1970).
b. State of present development in the field.
The present state of development of the experiment is
based largely on the research conducted by the group of
investigators who are submitting the proposal, and their• / . : • • • ' • - ' • • , • • • ' • • : r ' ' • • ' . " . - • .
co-workers. This research falls into four main areas:
(i) electrical properties of both terrestrial and lunar
\ •' •. '• .rocks;, "•.'•;_-' ' . ., • ' ' " . . , ' : •.•' :{
'.•'. (ii) theoretical solutions of the various field components
associated with magnetic and electric dipoles above a
dielectric layer, including computed results;
(iii) scale model studies of a dipole over a dielectric '
layer; and
(iv) "field results using prototype apparatus on glaciers.
The state of development of each of these areas will• • ' . - . . ' ' ' • •
< '' be summarized here,
(i) . Electrical properties of rocks. "
Several v/orkers have now completed initial studies of
the. electrical properties of the returned lunar samples.
II -6

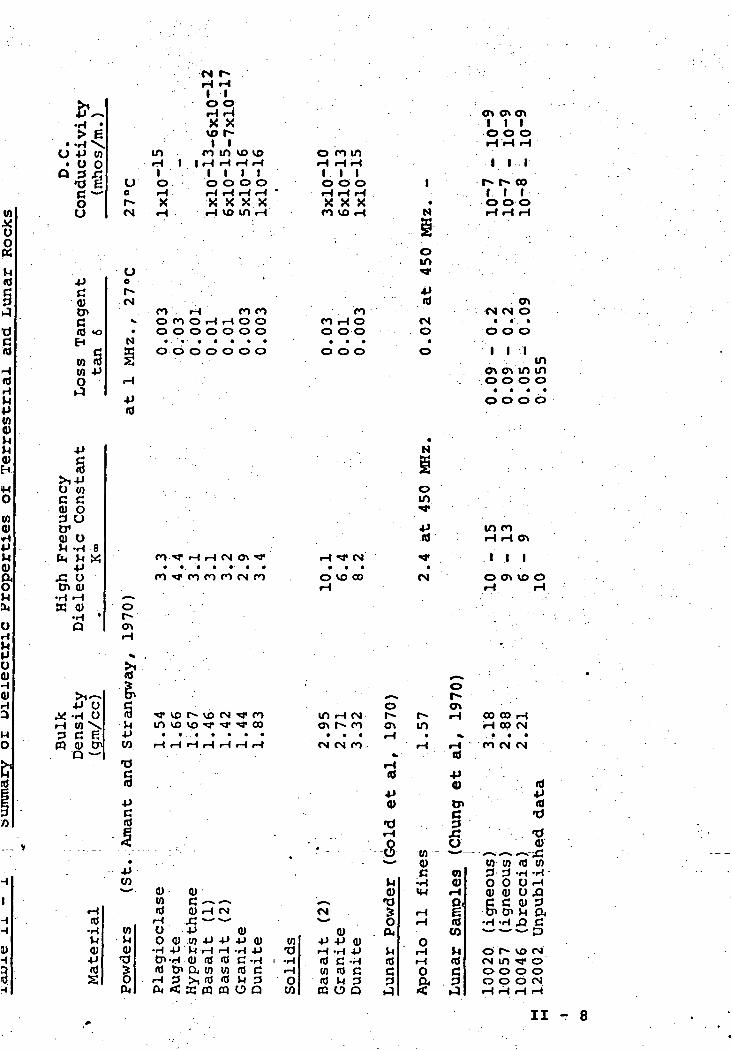
The results of these studies, summarized in Table II-l,
.indicate that the electric properties of lunar rocks are
not much different from those of dried terrestrial rocks.
The losses for a variety of dried terrestrial rocks in a
.vacuum are very low; the loss tangent/ tan 6, typically is
less than 0.01 at 1 Megahertz. The dielectric constant K,
depends largely on the density and ranges from about 3 for
the powders, up to about 10 for the solid rocks.
Gold et al (1970) measured the attenuation distance of
some Apollo 11 fines to be about 10 wavelengths at 450 MHz.,
which is in agreement with many previous radar studies.
\ This gives a loss tangent of about 0.02; the dielectric
constant of these fines was about 2.4. Work on various
.solid samples from Apollo 11 has been completed by Chung
et al (1970). Their lunar breccia has a dielectric constant."' " ' . ' ' ' . . . . - . ' • ' * • • . " • • • ' . ' ' • ' • • ' • '.between >15 and 20 for the frequency range around 1 MHz-.,., and
the igneous sample has a K between 11 and 14. At 25°C. these
samples show a loss tangent of about 0.05 and 0.16
respectively. These losses are somewhat higher than those
of the terrestrial rocks, possibly due to residual moisture
:in the sample. .This is partly confirmed by work done oni . • .
•: Apollo 12 sample 12002 (Chung, 1970) under very dry' t ' • ' " " ' _ _ . ! • _ . • . - . . . .
^conditions, for which k = 10, and tan 6 = 0.055, -at .1-MHz. "--..
at 25°C.
II - 7
CM
r*tjl J L
•H •> E
U -P W• o o
*O &C *""*Ou
4J
g,c(0 «o
to <3tO -Poi-q
4J
>Ju inC C0) O3 UtrQ) U>H -H 8
1 14-1J5 O
•H rH
X O•H •Q
>i —•P^)
.* -H 0rH W \P r* C?C Kfp Q) tP
Q ""
• - - - . - -
rHc0
•HH01
n)S
inrH 11
U o0 rHr- XCM rH
o0
; cov O CO• O O
pr^ f^. c\
rH
C0
CO •**
CO ^*
' »0t"* ' .enrH
5?
'ft
(3 TT VDM m vo
13
*JC(d
-1 :,
(O^ o>(0(0
1— 1W OM O Q)<U -rH 4J
*O D1-"^S (0 CPO rH 30< Cu rtj
1 10 PrH HX X
\O f*»1 1
n in vo voI rH rH rH rHl i l tO 0 O OrH f-» rH rHX X X XrH VO in rH
•
rH CO COO rH rH O OO O O O O
O O O O O
rH rH CM <T> T
CO CO CO CM CO
r^* vo CM ^ covp r r -"a1 oo
0)C ^"^ ^»0) rH CMr; *-* >— '•P Q)0) 4J -P -P (1)M rH rH -H 4JO fd fO C *HQi t/1 W fO CJxi (0 fO V< 333 PQ CQ O O
W'O•r\rH
OCO
o co in•H rHrHI I IO O 0 1rH rH rHX X X
CO \0 rH N
Oin
CO *CO rH O CMO O O O
• • • •000 O
N
Oin
4J«>
rH ^T CM *f
O VO CO CMrH
O*in rH CM r - rG\ t - CO Q\ in
• • • r-| •CM CM CO rH
*r-1
0)
•drH
- - - S to— Q)
Ctl »^J
0) «w'-* -OCM > rH^ O rH
(1) CU4J -P 0) OrH -H *J M rH(0 C -H f0 rHw m c c o( 0 ^ 3 3 {X03 O Q ,J <
I I IO O OrH rH rH
1 II
- ^^ ^^ CO
I I Io o orHH H
CM CM O• • •
O 0 0
1 1 1in
ov en in ino o o o
o o o o
in corH rH ON
II 1o en vo orH rH
O . ' • •
o\rH 00 CO rH
rH CO CM^ . • • •
rH CO CM CMOS
43ft) (0
fe (0C • 'OJj •X -OO ft)
tn in n) tom s a -H ••-<0» O O O rH
rH 0) <U O jQO, C C 0) 3
«0 -H -H X> CCO ^*^w- p
Vi o r^ vo CMr0 CM in ••a1 oC oooo3 0 0 0 CM*3 rH rH rH rH
II - 8

The lunar samples of Chung et al have losses which show
a fairly strong increase with temperature. This effect also
is seen at lower frequencies in terrestrial rocks.
Some work has been done on the magnetic losses of the
lunar samples using pulses (Olhoeft and Strangway, 1970).
There appears to be some magnetic induction effects, but
these are not likely to be pronounced at frequencies around
I MHz.
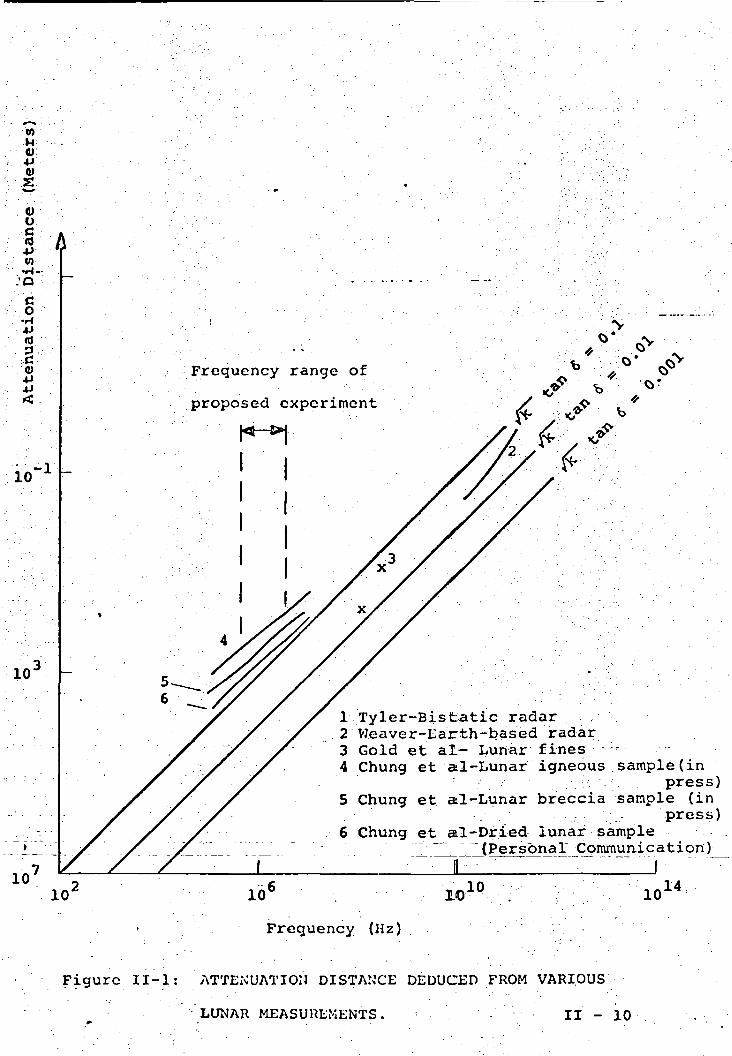
A summary of the attenuation distance of electromagnetic
waves, estimated from various lunar measurements, is shown
in Figure II-l. '
It is concluded from these studies that the
electromagnetic losses to be expected on the moon may be
greater than those for very dry terrestrial rocks, but are
still very low. Typical penetration depths are in the range
of Kilometers for frequencies around 1 MHz.
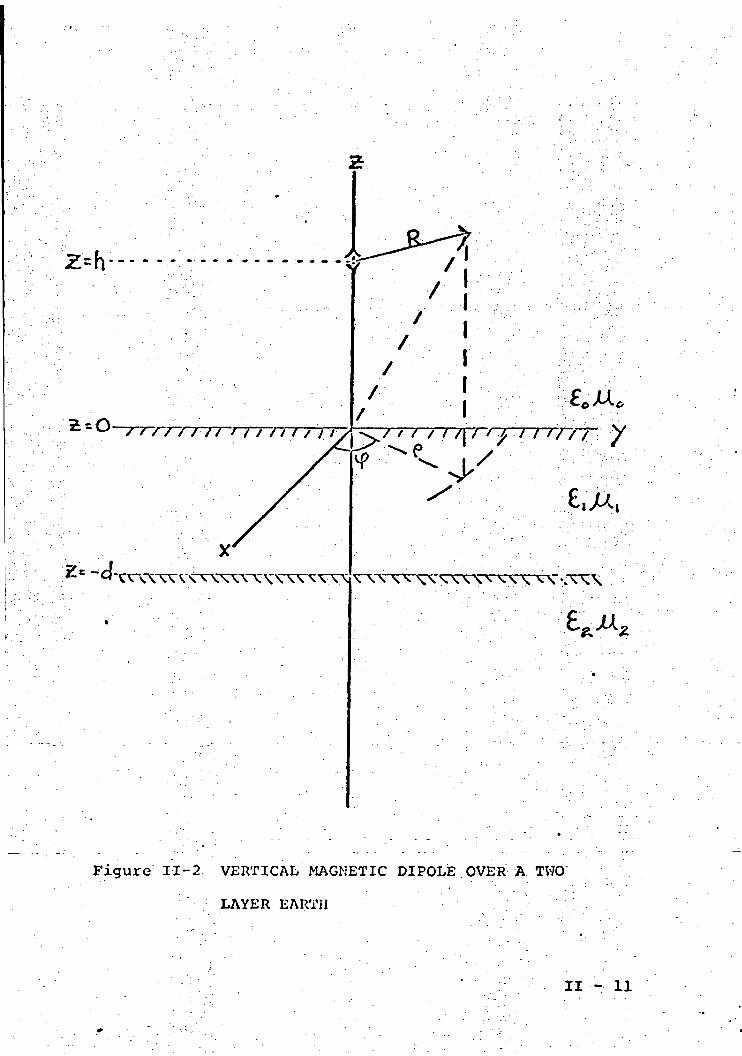
(ii.) Theoretical solutions
Several theoretical results of interest have been derived
by the group of investigators and their co-workers. The
easiest solutions.are for the configuration of a^vertical
magnetic dipole, over a dielectric layer, over a horizontal
reflector, as shown in Figure II-2. The field component of
interest is E<j>, the electric field measured tangential to an
imaginary cylinder which encloses the dipole and has the
same axis. These results are covered by Annan (1970) . Suites
II - 9
wKO4JQ)
<UO
10•H
I'D
•' CO•H
fl)•P
4J
10-1
10"
1010'
Frequency range of
proposed experiment
1 Tyler-Bistatic radar ,2 W.eaver-Earth-based radar3 Gold et al- Lunar fines ;-4 Chung et -al-Lunarigneous.sample(in
/• . : press)5 Chung et al-Lunar breccia sample (in
-'.'•.•' -.'-.,-.• V. press)6 Chung et al-Dried- lunar sample •
— H_IJI:(Pers_onar CQminun.ication). ^ , _. _..
10' 10 1014
Frequency (Hz)
Figure II-l: 'ATTENUATION DISTANCE DEDUCED FROM VARIOUS
LUNAR MEASUREMENTS. - II - 10
2=0- >/ ' f / f /\ / /
\ \\ \\ V
Figure II-2. VERTICAL MAGNETIC DIPOLE OVER A TWO
LAYER EARTH
II — 11
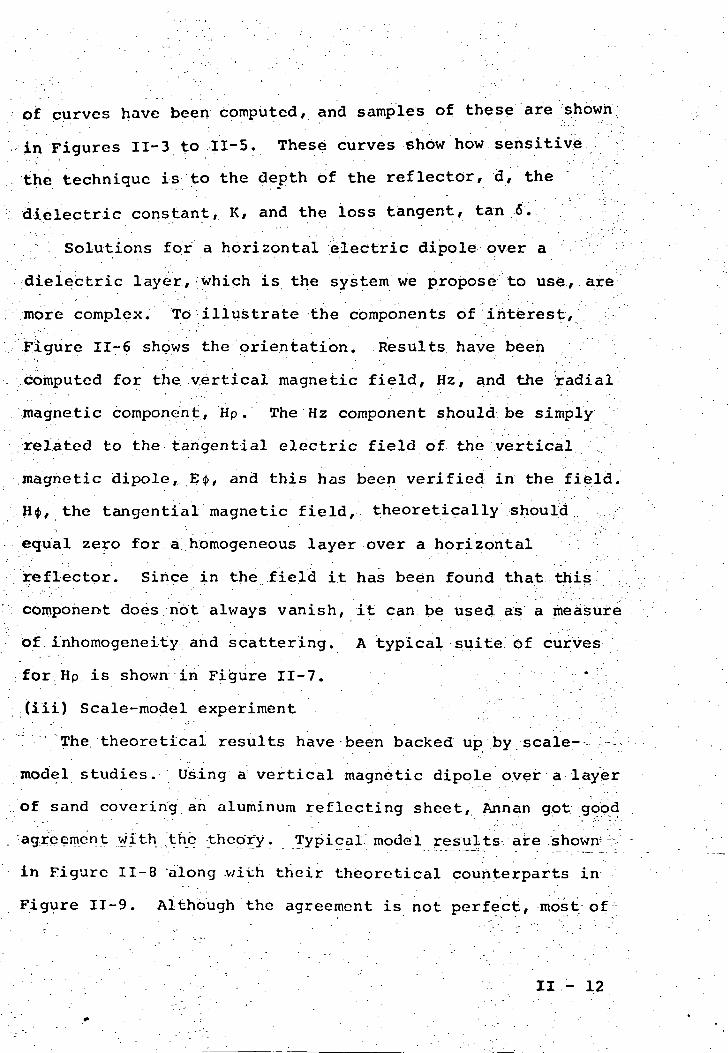
of curves have been computed, and samples of these are shown
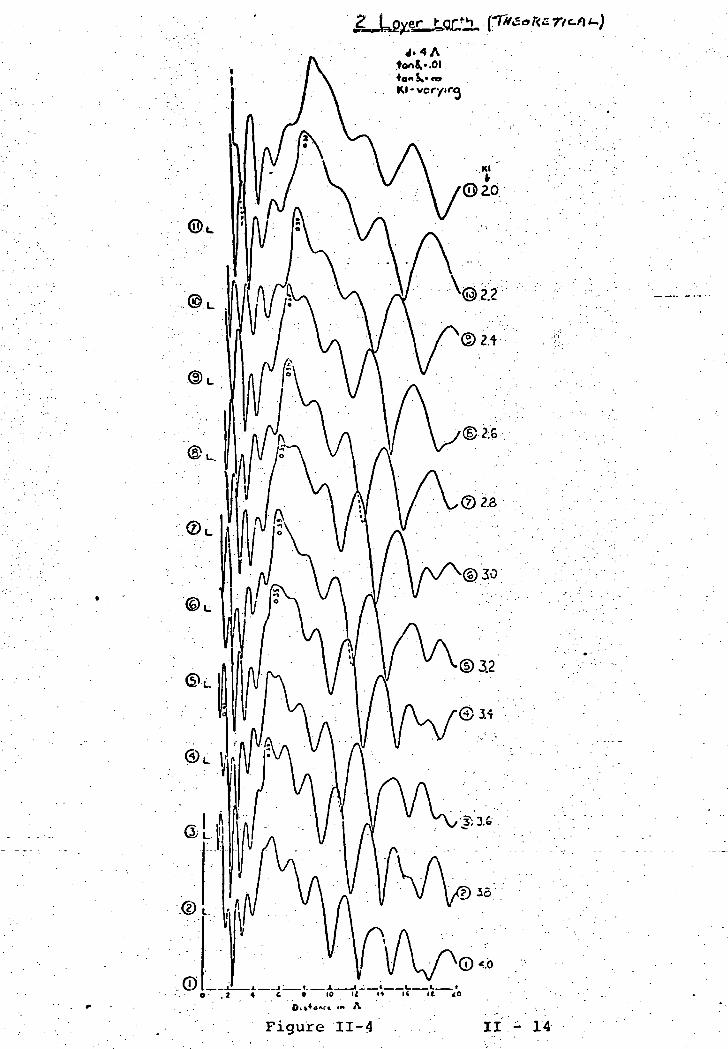
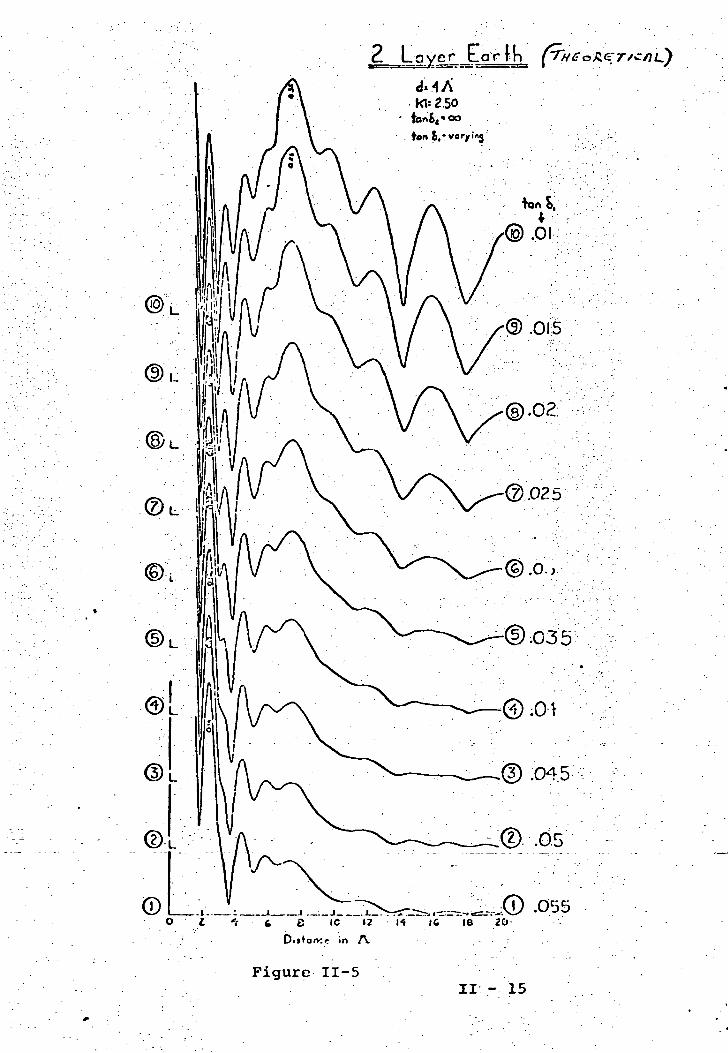
in Figures II-3 to II-5. These curves show how sensitive
the technique is to the depth of the reflector, d, the
dielectric constant, K, and the loss, tangent, tan 6.
Solutions for a horizontal electric dipole over a
dielectric layer, which is the system we propose to use, are
more complex. To illustrate the components of interest,
Figure II-6 shows the orientation. Results have been
computed for the vertical magnetic field, Hz, and the radial
magnetic component, Hp . The Hz component should be simply
related to the tangential electric field of the vertical
magnetic dipole, E4>, and this has been verified in the field.
H$, the tangential magnetic field, theoretically should
ecjual zero for a homogeneous layer over a horizontal
reflector. Since in the field it has been found that this
component does not always vanish, it can be used as a measure
of inhomogeneity and scattering. A typical suite of curves
for Hp is shown in Figure II-7. * •
(iii) Scale-model experiment .
: The. theoretical results have been backed up by scale- --
model studies. Using a vertical magnetic dipole over a layer
of sand covering an aluminum reflecting sheet, Annan got good
.agreement with .the theory. Typical model results are .showrt -,
in Figure II-8 'along .with their theoretical counterparts in
Figure II-9. Although the agreement is not perfect, most of
' • " • ' . . ' • ' ' . ' . - . . - ' • • • • ' . - ' . - • • ' • ' • - . ' II.- 1 2
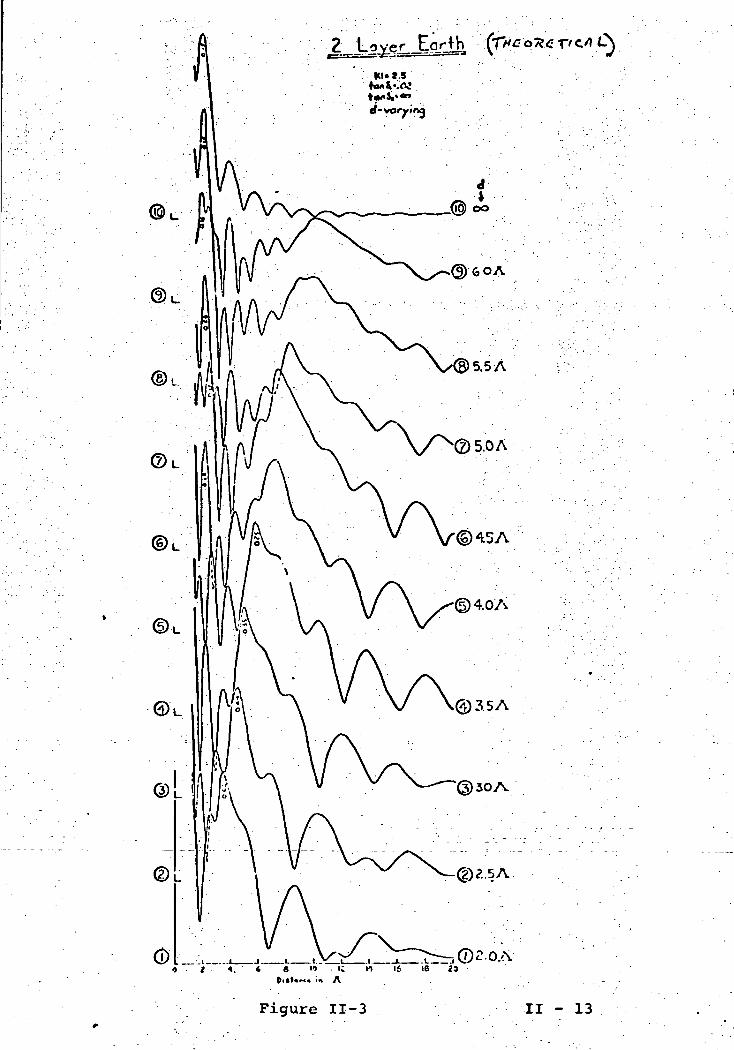
Figure I1-3 II -
2. Lo <e n<-f\ t~)
Figure II-4 II- 14
.055-D>»*a»v:«: in A.
Figure II-5
1C 18 20
II - 15
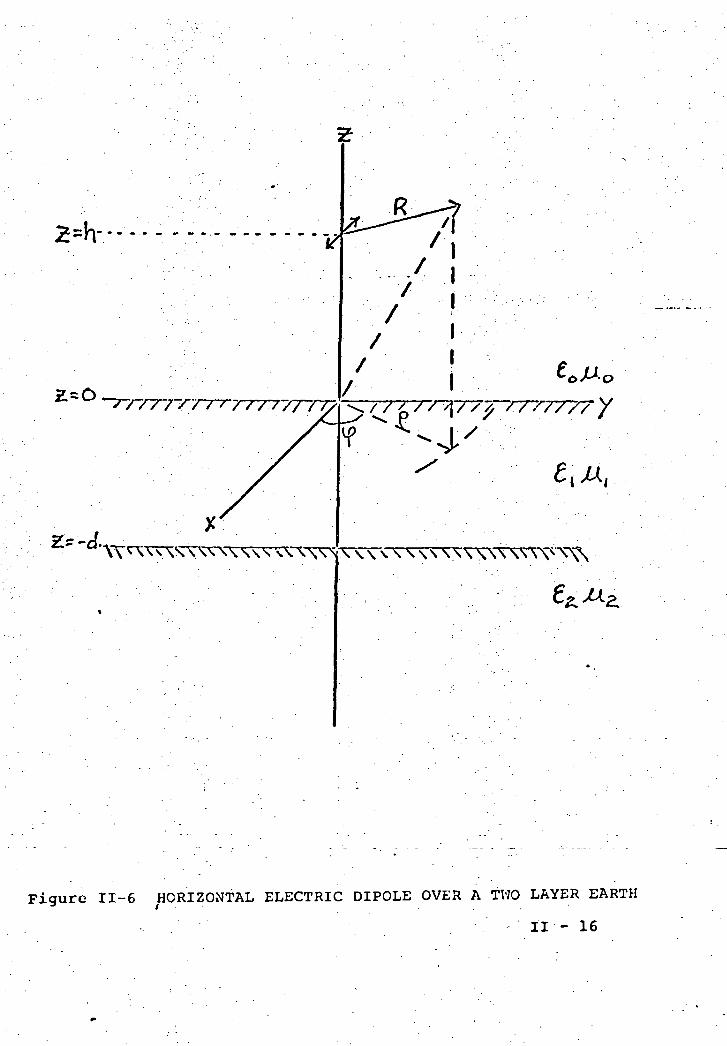
Figure II-6 HORIZONTAL ELECTRIC DIPOLE OVER A TWO LAYER EARTH
11-16
\D•
<N
vot-4
00
Figure II-7 THEORETICAL COMPUTATIONS, Hp
II - 17
2.0A
Figure II-8
II - 18
Theore llco\2 Lover
•fan 5. = .02 5i oo
2)35A
30A
25A
Q ZOA
Figure II-9
II •-••19
the discrepancies can be explained by the limitations of the
experimental model. Work is now in progress to construct a
more sophisticated model,.which will hopefully overcome most
of the observed difficulties and will have the capability of
modeling a larger variety of cases. :
(iv) Glacier tests
The ultimate test of a new method is in the field. In
order to evaluate the interferometry technique/ two major
field tests have been conducted. The first, over the 450
meter deep Corner Glacier, gave conclusive proof that the
method is able to determine the electrical properties of a
dielectric medium in situ. This is shown by Figure 11-10,
where it can be seen that the dielectric constant of ice is
about 3.2 as expected.
Using an engineering breadboard of the transmitter
described in the hardware section of this proposal, a series,
of field trials were made on the shallower, 150 meter deep,
Athabasca Glacier. Although a complete interpretation of
the results is not yet available, the experiment indicated
that the technique .will give the depth to a reflector "in a
geological environment which has low electromagnetic losses.
The transmitter performed flawlessly and the proposed
multiple-frequency:antenna was easily tunable for each
frequency used. The data gave reasonable agreement with the
theoretical results produced so far, in spite of their
II - 20
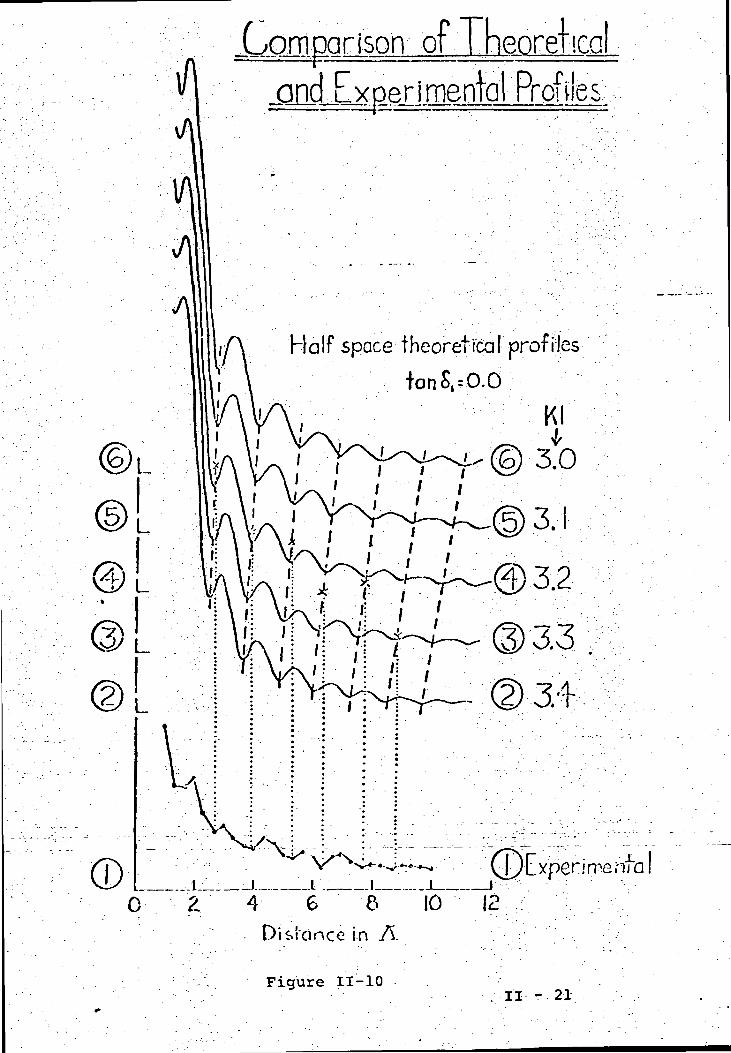
Com par [son of Tneorei -ico.__.... - ...j ___fierme
Half space theoretical profiles
tonS,=0.0
Kl
3.0
_1 __.L '„ I
Distance in A
Figure 11-1011-21
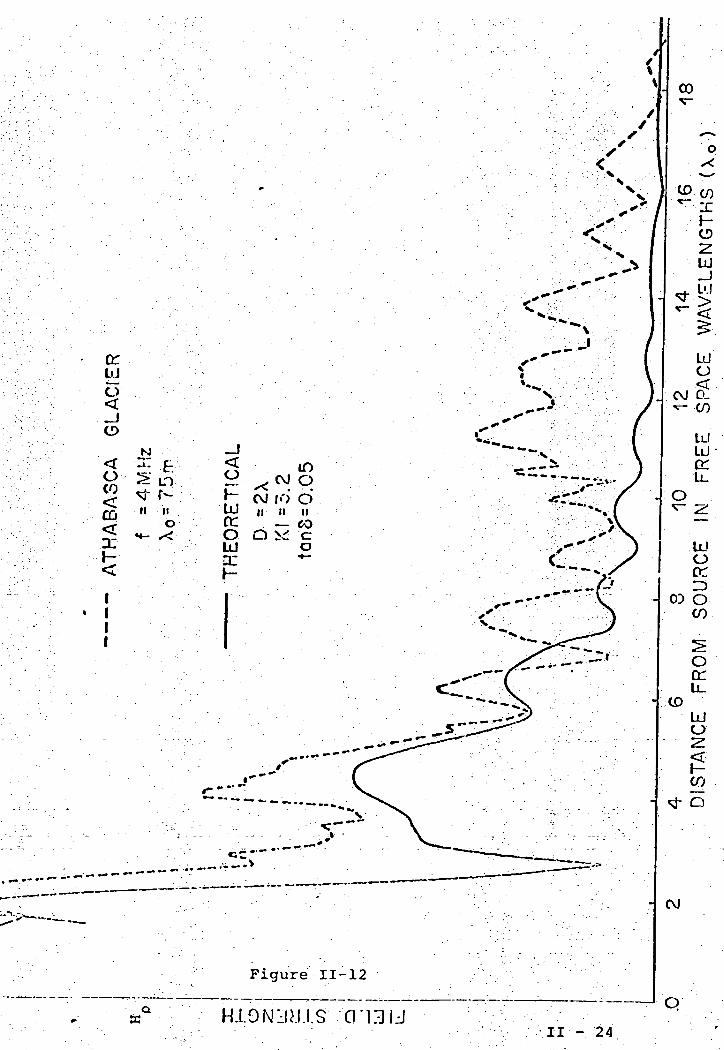
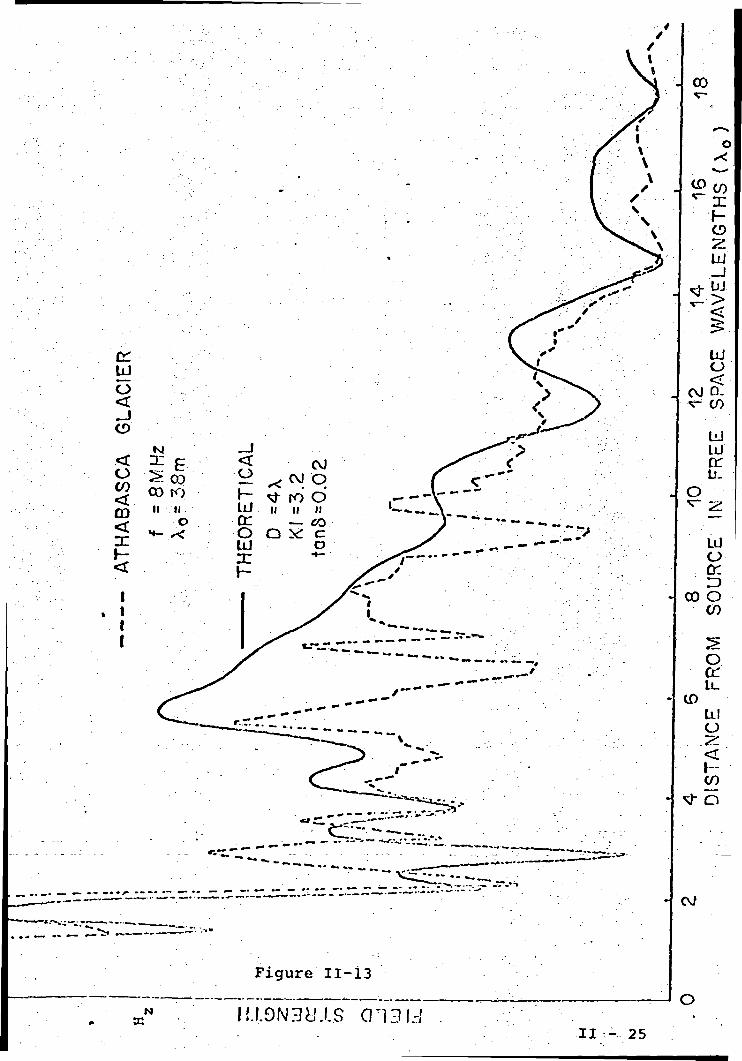
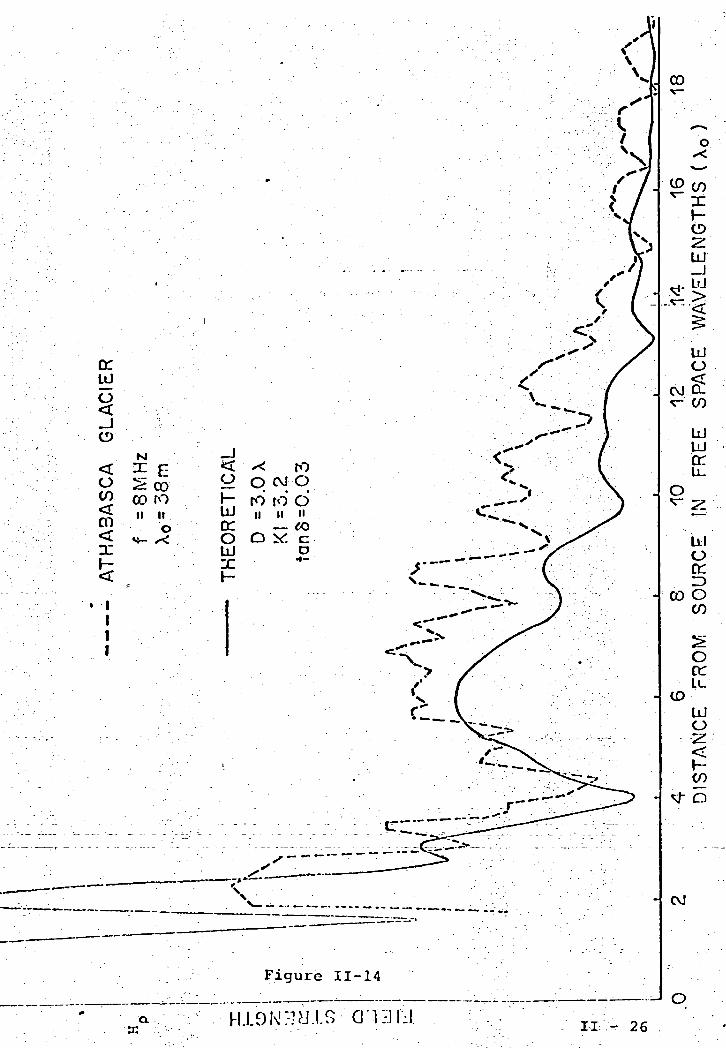
inherent limitations. A few typical comparisons are shown
in Figures 11-11 to 11-14.
(v) Summary of present Developments
Studies of the electrical properties of lunar material
indicate that the electromagnetic losses are adequately
.small in the chosen frequency range. The interferometry
technique has been studied theoretically with scale models ;
and in the field. Although work is continuing, the present
results agree sufficiently well to show that the technique
will give in situ electric properties and the depth to a
subsurface reflector.
II- 22
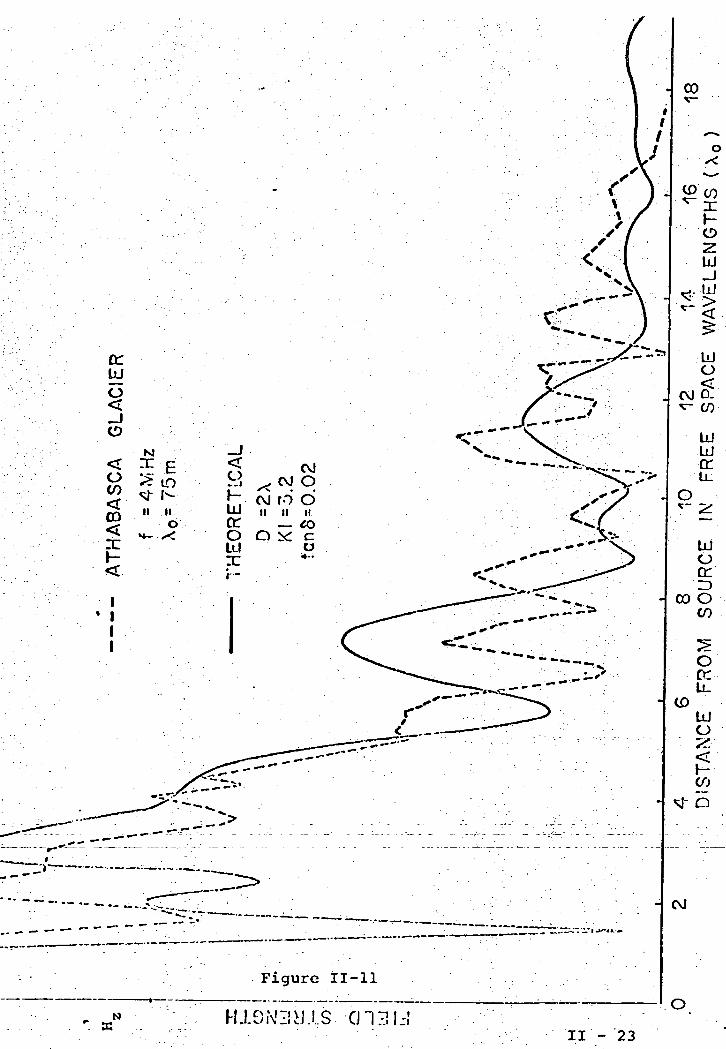
Figure 11-11
*. aN
o
II - 23
o:ujo
• I
I
I
o£J
o-- >: ,&••'< ^ sC O » "^f O •
I
inx< N °.
f~ cj ro 6*U-J n || itK. . — eoO Q ii cLU on: •*-
Figure 11-12
Q.CT13IJ
II — 24
- CO
N IU.9N3LM.S CF13L-III - 25
o:
OM
<io(O
CO
XH<
• 1111
~T r-
:>c<5CO IOII II
o**- *<
. ..
<coh-UJIT0UXh-
Xqrouo
roCM Oro d
X co•«—
Figure 11-14
II - 26
References for Section II-3. ;
Annan, A.P., "Radio Interferometry Depth Sounding," M.Se.:
; Thesis, Dept. of Physics, U. of Toronto, 1970*
Bailey, J.Y., Evans, S., and Robin, G. de Q., "Radio Echo
Sounding of Polar Ice Sheets," Nature, v. 204, pp.
420-421, 1964. ;
Campbell, J.J., and Ulrichs, J., "Electrical Properties of
Rocks and Their Significance for Lunar Radar
:•':;'. ' ;y Observations," J. Geophys. Res. , v. 74, pp.
5876-5881, 1969.
Chung, D.H., Westphal, V7.B., and Simmons, Gene, "Dielectric
Properties of Apollo 11 Lunar Samples and Their
Comparison with Earth Materials ," J. Geophys . '. Rgs'; ,,
'in press, 1970.
El-Said, M.A.H., ''Geophysical Prospection of Underground.-
Water in the Desert by Means of Electromagnetic
Interference Fringes," Proc. T.-R.-E. t- y. 44,
pp. 24-30 & 940, 1956. 0
England, A.W., Simmons, Gene, and Strartgway., D., ."Electrical
Conductivity of the Moon," J. Gedphys^.
pp. 3219-3226. 1968.
II - 27
Evans, S. , "Radio Techniques for the Measurement of Ice
Thickness/' Polar Record, v. 11, pp. 406-410 &
795, 1963. .
Evans, S., "Dielectric Properties of Ice and Snow - A f •
Review," J. Glaciol. , v. 5, pp. 773-792, 1965,
Gold, T., Campbell, M.J., and O'Leary, B.T. , "Optical and
High-frequency Electrical Properties of the Lunar
Sample," Science, v. 167, pp. 707-709, 1970.
Jiracek, G.R., "Radio Sounding of Antarctic Ice," Research
Report Number 67-1, Geophysical and Polar Research
Center, U. of Wisconsin, 1967.
Rinker, J.N., Evans, S., and Robin, G. de Q., ''Radio Ice-
Sounding Techniques," Proceedings of the Fourth \
• Symposium on Remote Sensing of Environment, U. of
Michigan, 1966.
- - • • " , . • ' •
St. Amant, M., and Strangway, David W. , "Dielectric
Properties of Dry, Geologic Materials," Geophysics,
in press, 1970.
Strangv/ay, D.W., "Moon: Electrical Properties of the Upper-
— • : - -" ______ 1 most^ Layers ," S.c i e n cc , v,. , 1 6 5 , ppr— 1 0 1 2 - 1 6 1 3-, 196 .
Walford, M.E.R. , "Radio Echo Sounding through an Ice Shelf,"
Nature, v. 204, pp. 317-319, 1964.
II - 28
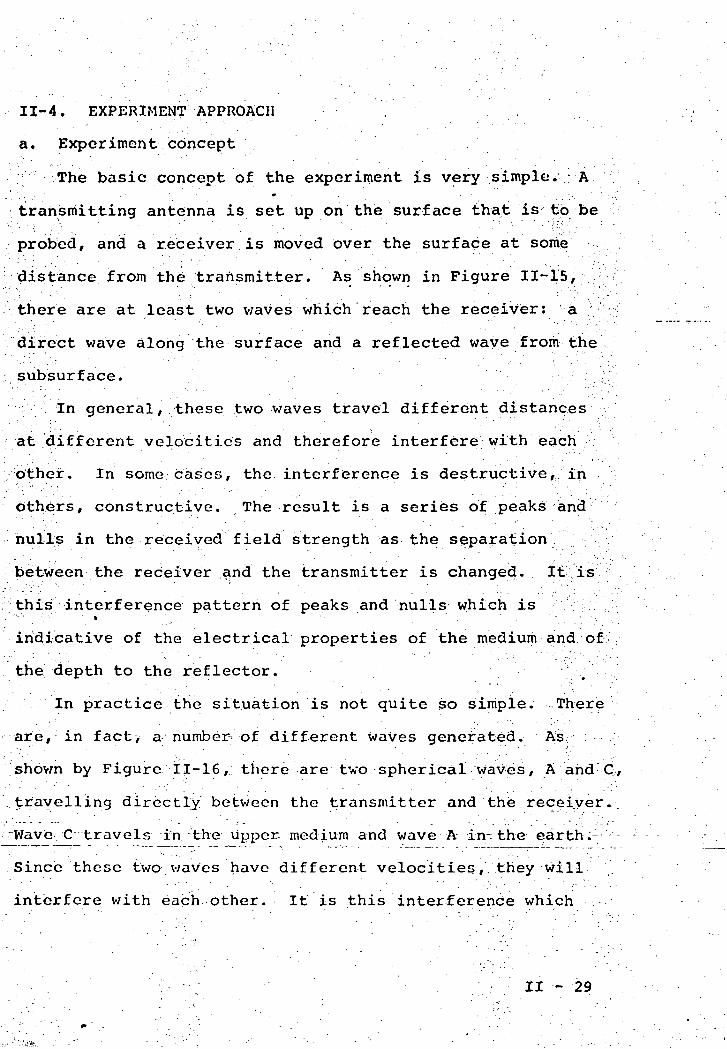
II-4. EXPERIMENT APPROACH
a. Experiment -.concept
The basic concept of the experiment is very simple; : A
transmitting antenna is set up on the surface that is to be
probed, and a receiver is moved over the surface at some ;
distance from the transmitter. As shown in Figure 11-15,
there are at least two waves which reach the receiver: a
direct wave along the surface and a reflected wave from the
subsurface.
In general, these two waves travel different distances
at different velocities and therefore interfere with each
other. In some cases, the interference is destructive, in
bthers, constructive. The result is a series of peaks and
nulls in the received field strength as the separation
between the receiver and the transmitter is changed, it,is
this interference pattern of peaks and nulls which is" ' - • ' - . ; ' • - ' . - . • ' - • . " . - - • - - . . . •indicative of the electrical properties of the medium and of
the depth to the reflector.
In practice the situation is not quite so simple. .There
are,1 in fact, a number- of different WaVes generated. As: :
shown by Figure il-16, there are two spherical waves, A and C,,
travelling directly between the transmitter and the.receiver.
:WaveC travels in the Upper medium and wave A in-the earthi--'•-.-
Since these two waves have different velocities,.they will
interfere with each other. It is this interference which
II -- 29
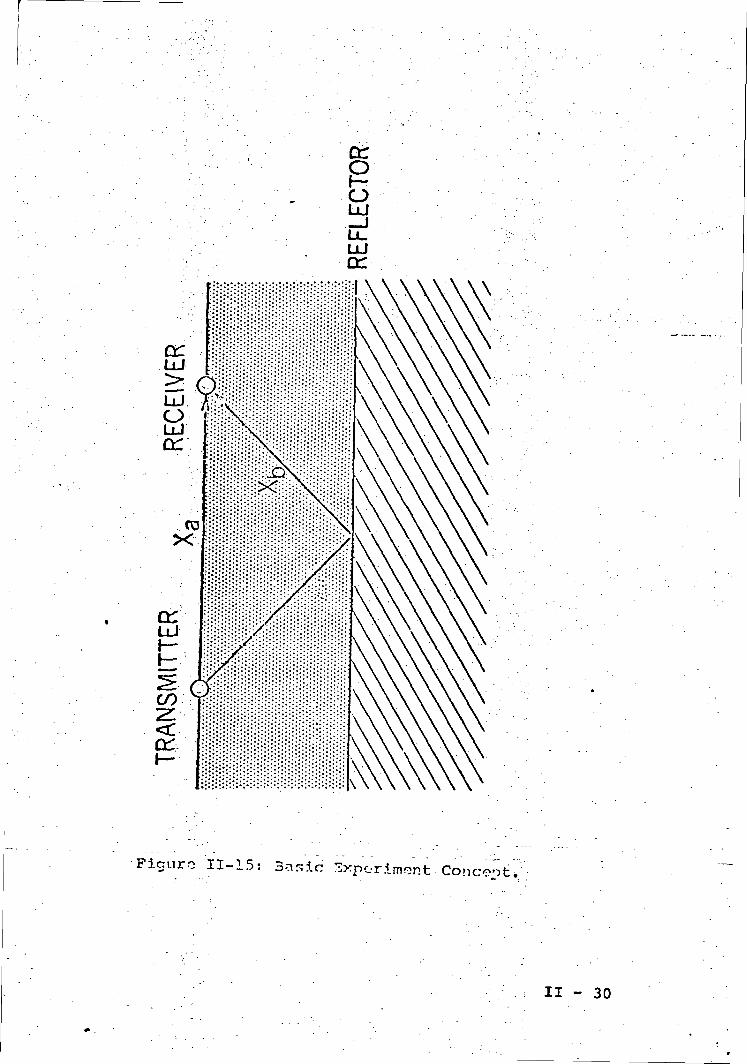
ct
oLU
LUCC
Fiouro 11-15: Basic lExporimont Concept/
II - 30
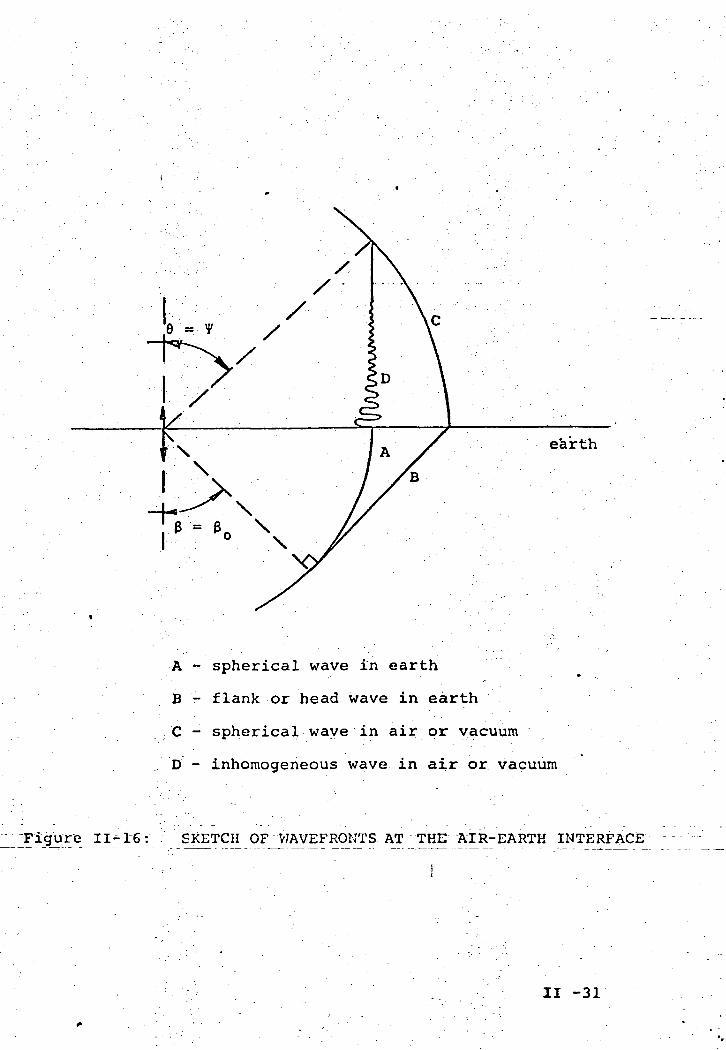
A - spherical wave in earth
B - flank or head wave in earth
C - spherical wave in air or vacuum
, D - inhomogeneous wave in air or vacuum
-Figure II-rG: SKETCH OF V7AVEFRONTS AT THE AIR-EARTH INTERFACE
II -31
gives a measure of the dielectric constant of the lower
medium, since the greater the difference in the velocities
of these two waves, the greater will be their rate of
interference.
Another."wave' Of some importance is the flank, or "head",
wave, B. This wave is responsible for the directionality of
the antenna pattern below the surface. It develops in order
to satisfy the boundary conditions of wave C at the interface,
since the phase velocity of some wave in the earth must be
the same as the phase velocity of wave C, in the upper medium.
This condition is satisfied if plane wave B propagates
downward to some extent. The tilt is given as 3/the angle of
total internal reflection between the two media. Hence,.•'.' . - - / E ~ ' • • ' ' . • . • , • . • • : • . • ' . - . • ' ' , . ' . . ' • ' " ' • ' -sin 3 = /_, Where B is the angle between the z-axis and the
, . . . ^ 1" ' ; . E ..•'.• •'• ; • . 'direction of the wave, and'=^ is the ratio of refractive. :' - • . ' ^ . •" •. 1 ': ' ••"•'' - .-' ''..-' ' '•".' • '.''•'indices across the boundary. The importance of this wave is
• • '•'.•"•' . ;"'••. • •that it effectively gives the antenna radiation pattern a
lobe at angle 8^
The spherical wave A, travelling in the lower medium,
also matches the boundary conditions, but in a different way;
An inhomogeneous v/ave, D, is produced at the surfeice; this
wave is directed upwards and decays exponentially with height
above the .surface..- This .wave -is not as_ significant .as the .
others discussed above.
11-32

Evidently, the practical usefulness of this method for
depth sounding depends upon two major implicit assumptions.
First, the medium being probed must not be too lossy, or the
amplitude of the reflected wave will be too low to interfere
well with the direct waves. And, second, there must exist
some strong electric contrast below the subsurface, or there
will be very little energy reflected.
It has been shown previously that the lunar surface
should be very transparent to radio waves. The contrast
necessary for reflecting energy from depth could come from
a change in dielectric properties, electrical conductivity,
or density. A range of frequencies, with wavelengths from
10 meters to 600 meters is planned, since these wavelengths
correspond to the range of depths under consideration. Hence
there is little fear that these conditions will not be met on
the moon.• .•''•' • • . '
Interpretation of the data evidently requires a knowledge
of the location of the receiver relative to the transmitting
antenna. Position determination will be done in this
•experiment by determining an azimuth and a dlistance.
Two crossed transmitting antennas will be driven with
differing modulations in such a way that first one antenna
wil-1 be- powered and then the other. This will have the effect
of making the radiation pattern rotate. The azimuth will be
determined by measuring the time of occurence of the maximum
II - 33.

received signal. The transmitter will radiate a sequence of
eight discrete frequencies used in the experiment; switching
between these frequencies will be synchronized to occur at a
time coincident with the zero-azimuth aiming of the radiation
pattern. This will provide .the time base for the azimuth
measurement and it is not necessary for the receiver to
contain a clock. Since azimuth determination can be done at
all eight frequencies; the problems of multipath and beam
distortion can be sorted out. It is expected that accurate
directions can be determined in this way.
The second part of the system will consist of analysis
of the field strengths to give distance from the source. In
general, the received field strength will be inversely
proportional to the distance from the source and so can be
used to determine the distance. Although any individual
observation may be disturbed significantly by interference,* • ' ' • ' . ' •
the data can be averaged readily to give smooth curves.
Moreover, this can be done using many frequencies so that .
there is inherent redundancy in the system.
It is planned that,as part of the traverse, the astronaut
will walk along one arm of the transmitter antenna, locating
himself precisely by means of markers along the antenna.
This will give location data for the high frequencies where Jl
precision is required, and also will serve to calibrate the
ranging system. .
II 34
The use of these two approaches is expected to locate the
receiver system at all times with the required accuracy. At
greater distances along the traverse, the low frequencies
are of most interest, so that the accuracy required in
position decreases as the astronaut moves away from the
transmitter. Internal checks using several frequencies will
be available and the use of smoothing along the path will be
most helpful.
fa. Experiment procedure
A schematic diagram: of the procedure is shown in Figure
11-17. The source will be a center-fed half-wave dipole
antenna laid on the surface near the LM. It will be powered
by a small transmitter producing continuous waves at discrete
frequencies of 0.5, 1, 2, 4, 8, 16, 24, and 32 Megahertz
successively. This sequence will be repeated once per second.
As described previously, another identical antenna will be• • • ' ' . ' • • '
laid out at right angles to the source antenna so that a
rotating radiation pattern can be created for the purpose of• • .
azimuth determination.
The receiving antenna will consist of three orthogonal
coils about one foot in diameter. These will detect the
three orthogonal components of the received field at each'. ~ ' . - " *
successive frequency. The strength of the three..-field,
components will be recorded separately on a small tape
recorder. The recorded information will be returned to earth
II - 35
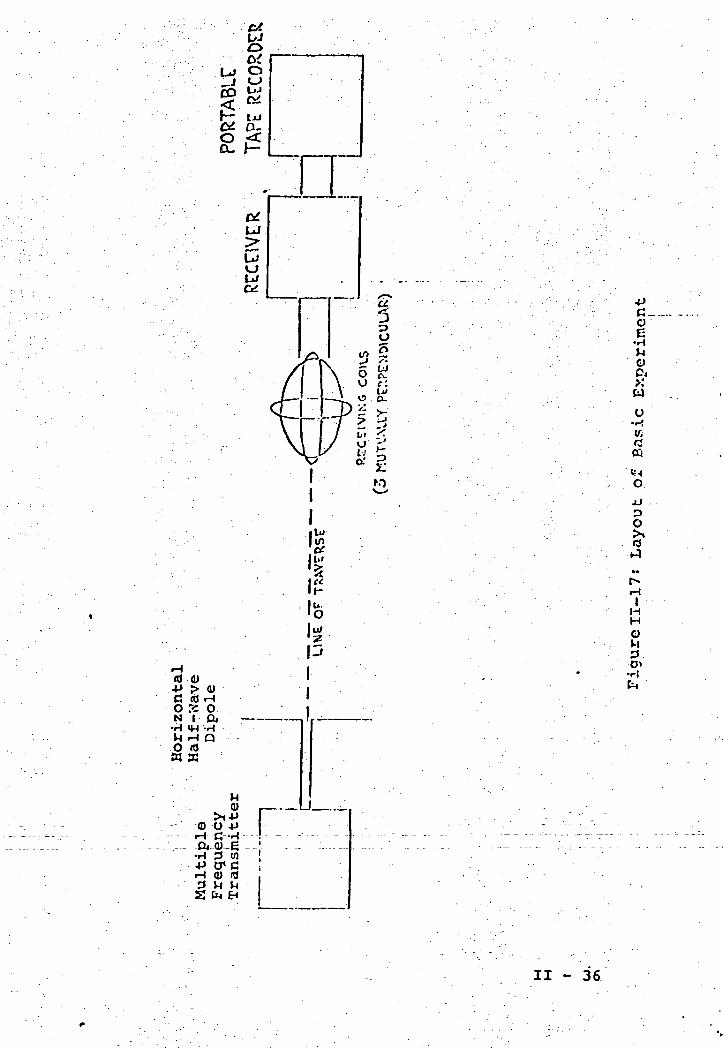
oe•H
O04
XwO•^Vj
IHHOJ-l3O»
•r-l
II - 36
for data analysis.
It is anticipated that the receiving coils will be fixed
to the MET or to the Lunar Rover. Initially, the astronaut
will have to deploy the transmitter and the two associated
dipole antennas. The astronaut then will move away from the
transmitter in a direction that is roughly perpendicular to
one of the, identical, dipoles but will not be constrained
to walk in a straight line. A traverse to a distance of .
three Kilometers or more is desirable, but shorter distances
also can yield useful data at the higher frequencies.
During the first stages of the traverse, the most useful ;>
data will be that derived from the highest frequencies arid
since the position of the receiver must be known within,
about one-fifth of a wavelength, an initial accuracy in
position, of about two meters is necessary. This will be
achieved by having the astronaut walk along any one arm of
the antenna, which will be marked with fixed distance points,
either pausing for about one second at each marked point or •*•-.
reading his position into the voice record. This procedure
also will calibrate the ranging system. "
During the remainder of the traverse, although it is
desirable that the astronaut travels approximately :
perpejn cular jtcr one of the transmitting d poTes, this 'is~— --
not critical. He will be free to roam anywhere in a sector
of about 20 degrees, and entirely free to conduct other
II - 37
studies and activities. The range information also is not
so critical at greater distances so, after the initial stages/
'the experiment will require only a minimal amount of
astronaut attention. '
Three receiving coils are necessary to record information
on both the vertical and horizontal magnetic fields at each
point. Since these two fields create independent interference
patterns, interpretation ambiguities will be reduced by
having both fields recorded separately. Since the horizontal
field propagates in a radial direction from the transmitter
it is not necessary to orient the three coils precisely with
respect to the transmitter, it is only necessary.that the ,
plane of one coil be approximately horizontal. However, if
the coils could be aimed roughly (say within +5 degrees;)
occasionally during the traverse, and so noted by the
astronaut on the voice record, a useful estimate of the.* •' " - ' •, '
amount of lateral inhomogcneity could be made.
The above operating procedure has been determined
largely on the basis of field trials made on glaciers. A one
watt engineering breadboard of the proposed transmitter,
constructed by the MIT Center for Space Research, was used to
feed; a tuned ribbon-wire half-wave dipole antenna.. Receiver
coils of one :and three feet-diameter were used with a
commercial Galaxy R530 communications receiver.
II - 38
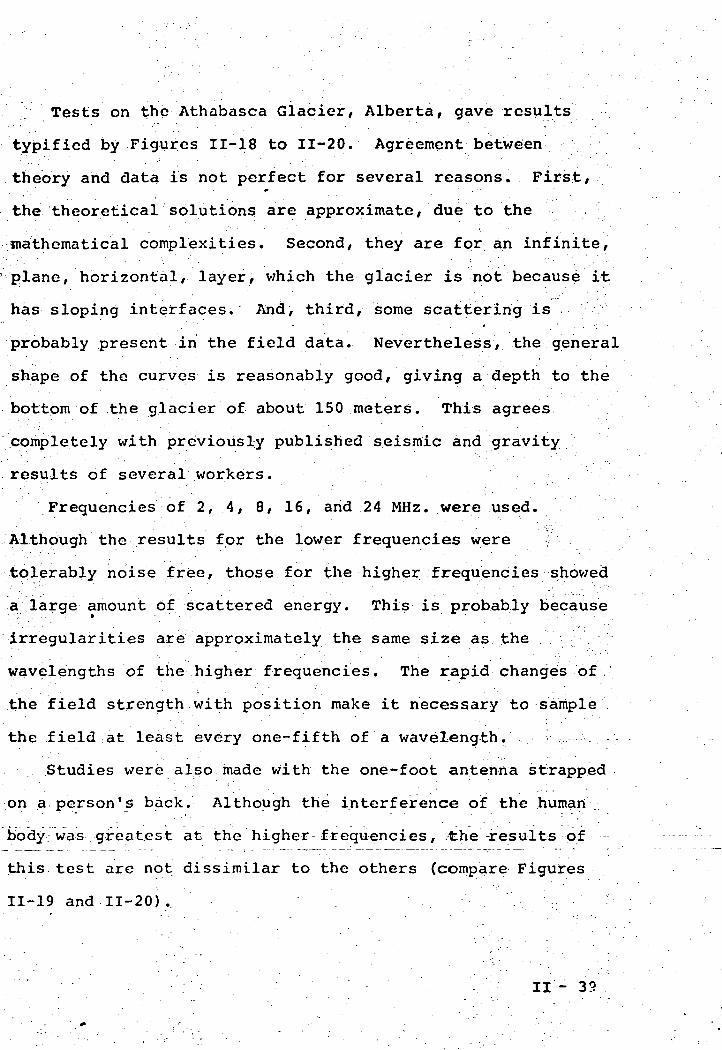
Tests on the Athabasca Glacier/ Alberta, gave results
typified by Figures 11-18 to 11-20. Agreement between
theory and data is not perfect for several reasons. First',.-,
the theoretical solutions are approximate, due to the
mathematical complexities. Second, they are for an infinite,
'plane, horizontal, layer, which the glacier is not because it
has sloping interfaces. And, third, some scattering is
probably present in the field data. Nevertheless, the general
shape of the curves is reasonably good, giving a depth to the
bottom of the glacier of about 150 meters. This agrees
completely with previously published seismic and gravity
results of several workers.
Frequencies of 2, 4, 8, 16, and 24 MHz. were used.
Although the results for the lower frequencies were ;
tolerably noise free, those for the higher frequencies showed
a large amount of scattered energy. This is probably because
irregularities are approximately the same size as the
wavelengths of the higher frequencies. The rapid changes of
the field strength with position make it necessary to sample
the field at least every one-fifth of a wavelength. I.-,:,.--••-..
Studies were also made with the one-foot antenna strapped
.on a person's back. Although the interference of the human
body was.greatest at the higher frequencies, the -results of
this test arc not dissimilar to the others (compare Figures
11-19 and 11-20). : -
II - 39
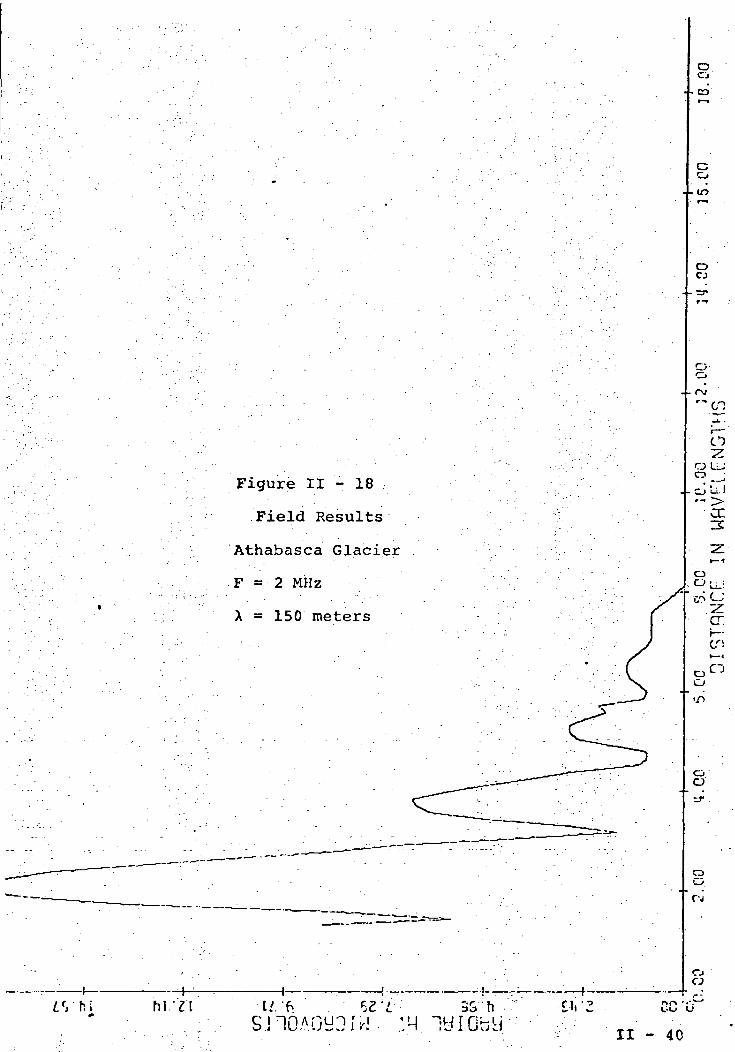
Figure II - 18
Field Results
Athabasca Glacier
F = 2 MHz
X = 150 meters
hl.'Z't vL'.'fc
II - 40
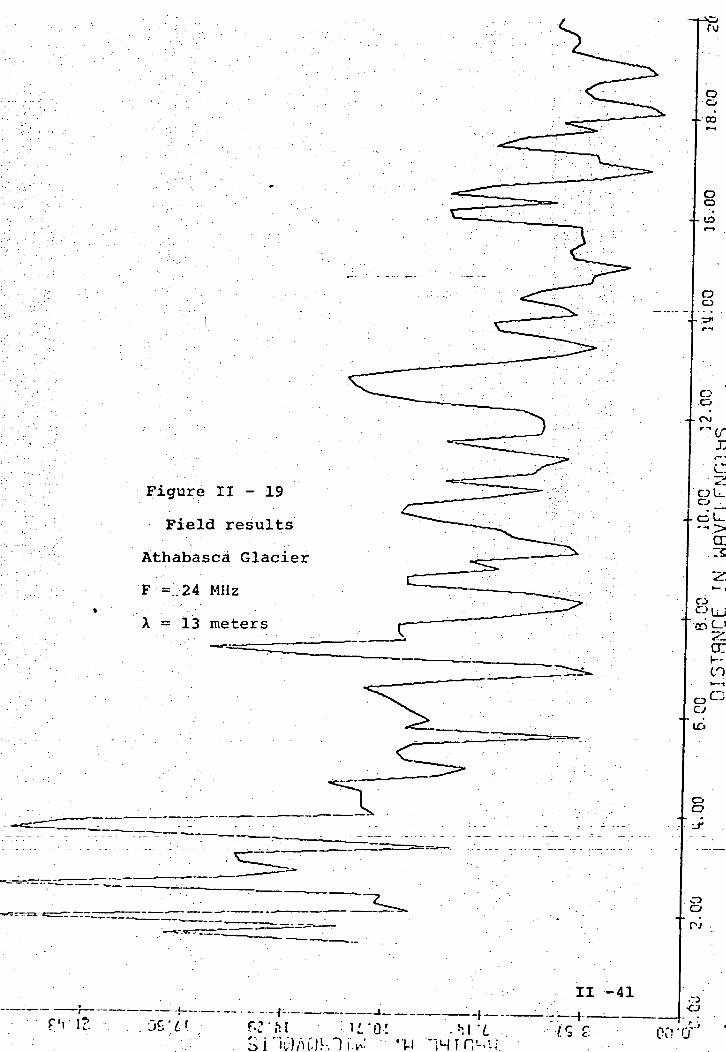
Figure II - 19
Field results
Athabasca Glacier
F = 24 MHz
X = 13 meters
oo• -10
oo
oo
CO'
to
oo
. oo
II -41._: f..
••.-its•o
'00
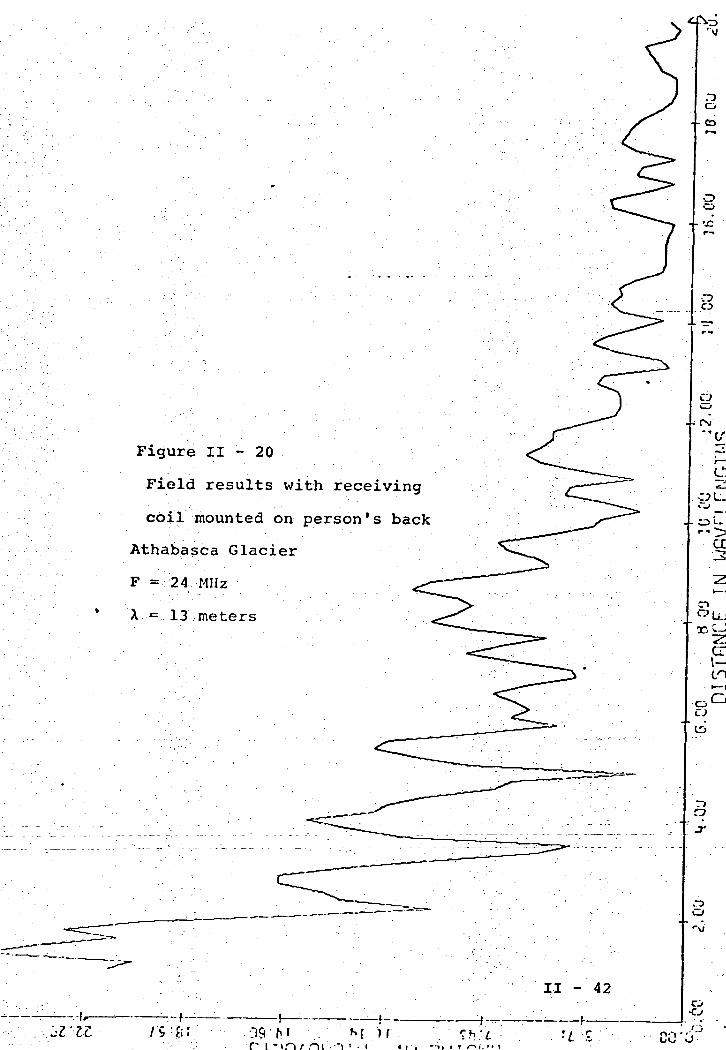
Figure II - 20
Field results with receiving
coil mounted on person's back
Athabasca Glacier
F = :24 MHz
A.- = .. 13 meters
CO'O:
Although this trip gave satisfactory results, much
remains to be done. Only by field trips can the optimum
procedure for taking measurements be determined. Moreover,
the problem of scattering requires more study. As prototype
instruments are.developed, they must be tested in the field
without any significant delay,
c. Quantitative range of the measurements
During the traverse, various measurements will be made,
continuously and recorded automatically on tape. The basic
data are the strengths of two independent components of the
horizontal magnetic field, and the vertical field. Eight
frequencies between 0.5 and 32 MHz will be monitored for the
duration of the traverse, with a complete sequence of the •."....',
eight discrete frequencies repeating once per second. Time
also will be recorded on the magnetic tape.
The dynamic range of possible values for the field
strengths is quite large, due to the large oscillations ,
imposed by the interference technique. Moreover, some of.
the most useful information can be obtained when the received
signal is relatively small, and the values depend on the.
electrical properties of the lunar subsurface. Field
measurements made over glaciers indicate that the probable
range of values of interest at the receiving antenna is from
10 to 0.01 microvolts/meter. This should be measured with
an accuracy of about 1%.
11-43
The distance between the receiver and the transmitter
will range from zero to about 3000 meters, or more if the
Rover vehicle is used. For all signal frequencies, it is
necessary to know the position to approximately one-fifth of
a wavelength. However, the higher frequencies are only
useful nearer the transmitter,while the lower frequencies
are of principal interest further away. Therefore the
ranging measurement will have to be more accurate near the
transmitter than it will at a large distance. A good
estimate of the accuracy needed is about 1% of the actual,
distance.
:For example, the 32 MHz. signal has a wavelength of
approximately 10 meters. It will yield useful information
to about 20 wavelengths from the source, or 200 meters. A
position accuracy of one-fifth of a wavelength is 2 meters,
or about 1% of the maximum useful range at this frequency.' ' i '
The same relative scale applies to the other frequencies.
Therefore, although precise position information is
necessary for the first few hundred meters, this requirement
relaxes with distance. Near the source, the astronaut can
use the distance indicators marked on the antenna arms and ..
read his distance into the voice record. For the remainder
of the: traverse, azimuth and distance information will-be
provided by the data itself.
II r 44
d. Method for analysis and interpretation of data
Analysis of the data will take several steps. First,;
the receiver location data must be translated from a bearing
measurement and range to position versus time information*
It is anticipated that this.will require combining data from
the voice record and photographs/ as well as from the
.experiment itself. The field strengths which will already
be in a measurement versus time format then can be converted
to field strength versus position. The vertical component
will be complete, and the radial component will be the
vector sum of the two horizontal components.
Once the information is in this form, it can be compared-.-. ' - ' ' ' • •• ' ' ' ' " • '
to standard curves computed for a large numbex of expected
conditions. The problem of a horizontal electric dipole on
the surface of a dielectric layer has been tackled
theoretically for several cases of interest.. The half-space. - . • % ••''..'..'• . • • ..."'..•case (i.e. virtually no reflected energy from depth) still
gives an interference pattern, and this has been worked out .
rigorously for both the H and H components. The layered•• » : - . • . ' -..
case is not so simple. Approximate solutions have been
obtained, for both components, for the case <n>f a dielectric,
layer underlain by a horizontal reflecting layer. Families
of: solutions are^ "being "computed for arbitrary? losses, ; ;/_;'•:;
dielectric constant, and depth of the first layer. A few
II - 45
examples of these curves have been shown previously in
Figures II-3 to 11-10.
Many important cases remain unsolved; they must be
studied before satisfactory interpretation of the data from
the moon can be assured. Examples are the cases of sloping
interfaces, arbitrary changes in dielectric properties, more
than two layers, etc. The effect of curvature of the moon's
.surface also is important for the longer wavelengths and
distances. Some of these problems are presently being
tackled theoretically.
However, it is likely that few of these problems will
yield even approximate theoretical solutions. For this
reason scale-model studies must be an essential part of the
interpretation program. A model already has 'been used
successfully to confirm theoretical studies, and to aid
interpretation of field results. A new model is being« • . . ' '• • .' '
constructed which will overcome some of the limitations of :
the previous one.• • • ' - • • . - . " • - . '
The new model will consist of a large bafch of transformer
oil of carefully controlled dielectric proper-ties., and a 5 cm.
wavelength electric dipole source. The tank; will be anechoic
for microwave frequencies, and will allow easy measurement of
many different subsurface configurations -.- Irn addition, the
radiation pattern of the antenna can be measuired in the
dielectric medium, which will aid in theoretx/cal studies.
II - 46
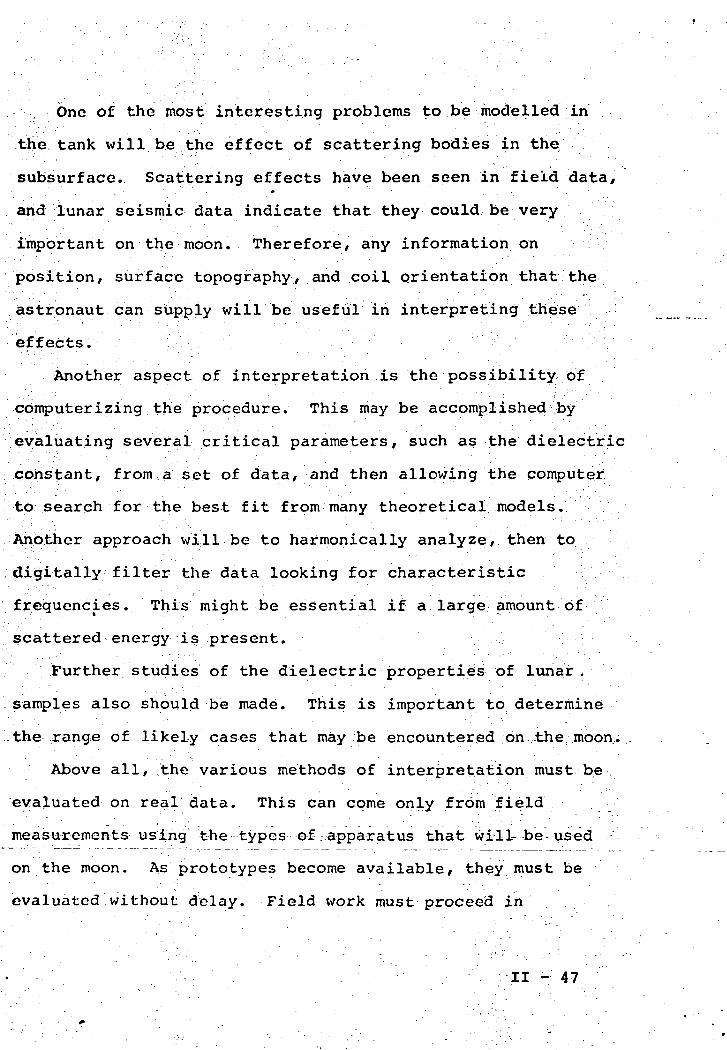
One of the most interesting problems to be modelled in
the tank will be the effect of scattering bodies in the
subsurface. Scattering effects have been seen in field data,' •* ' . • . ' . -
and lunar seismic data indicate that they could be very
important on the moon. Therefore, any information on
position, surface topography, and coil, orientation that the
astronaut can supply will be Useful in interpreting these
'-effects.'- .' "';/..'/ . - ..••'•• / •-' '.' •'••' ' • ','
Another aspect of interpretation is the possibility of
computerizing the procedure. This may be accomplished by
evaluating several critical parameters, such as the dielectric
constant, from a set of data, and then allowing the computer
to search for the best fit from many theoretical models. .
Another approach will be to harmonically analyze, then to
digitally filter the data looking for characteristic
frequencies. This might be essential if a large amount of
scattered energy is present.
Further studies of the dielectric properties of lunar,
samples also should be made. This is important to determine
-the range of likely cases that may be encountered on the, moon..
Above all, the various methods of interpretation must be
evaluated on real data. This can come only from field
measurements using: the types of .apparatus that-will- be- used ^
on the moon. As prototypes become available, they must be
evaluated without delay. Field work must proceed in
• '. -• ' ••'.'-. . .--.•• .- -.". -.-II -•' 47 •"•'
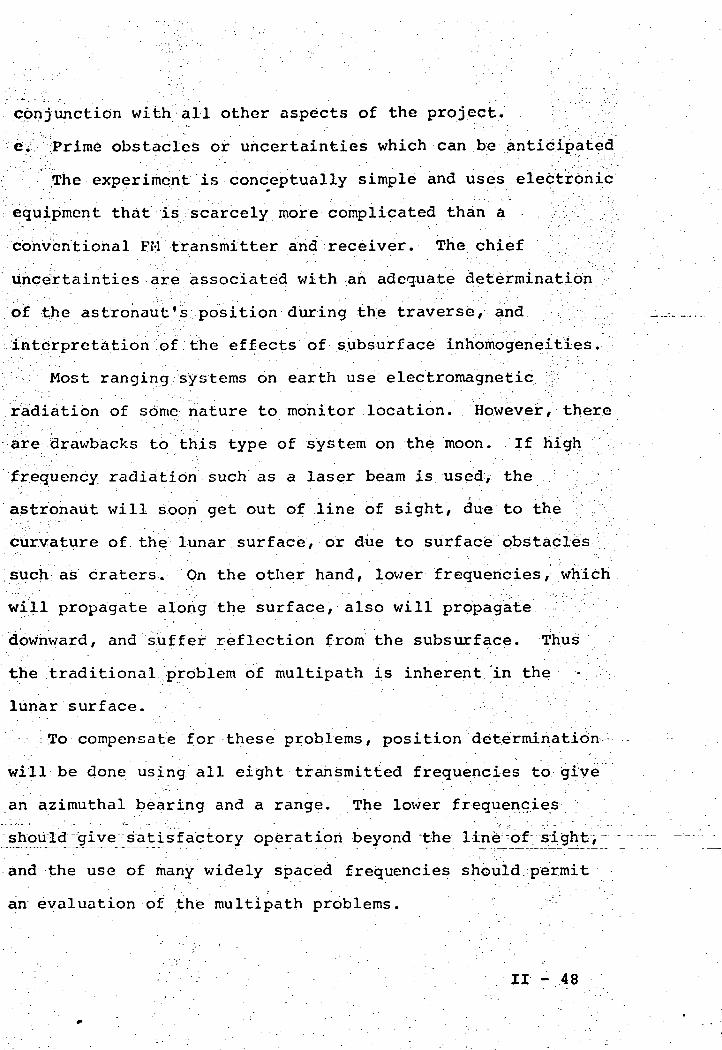
conjunction with all other aspects of the project,
e. Prime obstacles or uncertainties which can be anticipated
The experiment is conceptually simple and uses electronic
equipment that is scarcely more complicated than a
conventional FM transmitter and receiver. The chief
uncertainties are associated with an adequate determination
of the astronaut's position during the traverse, and
interpretation of the effects of subsurface inhomogeneities.
Most ranging systems on earth use electromagnetic
radiation of some nature to monitor location. However, there
are drawbacks to this type of system on the moon. If high
frequency radiation such as a laser beam is used, the
astronaut will soon get out of line of sight, due to the i
curvature of the lunar surface, or due to surface obstacles
such as craters. On the other hand, lower frequencies, which
will propagate along the surface, also will propagate
downward, and suffer reflection from the subsurface. Thus
the traditional problem of multipath is inherent in the • :
lunar surface.
-To compensate for these problems, position determination
will be done using all eight transmitted frequencies to give
an azimuthal bearing and a range. The lower frequencies
shoirld give satisfactory operation beyond ~the~ line ofy sight,—
and the use of many widely spaced frequencies should.permit
an evaluation of the multipath problems.
II - 48
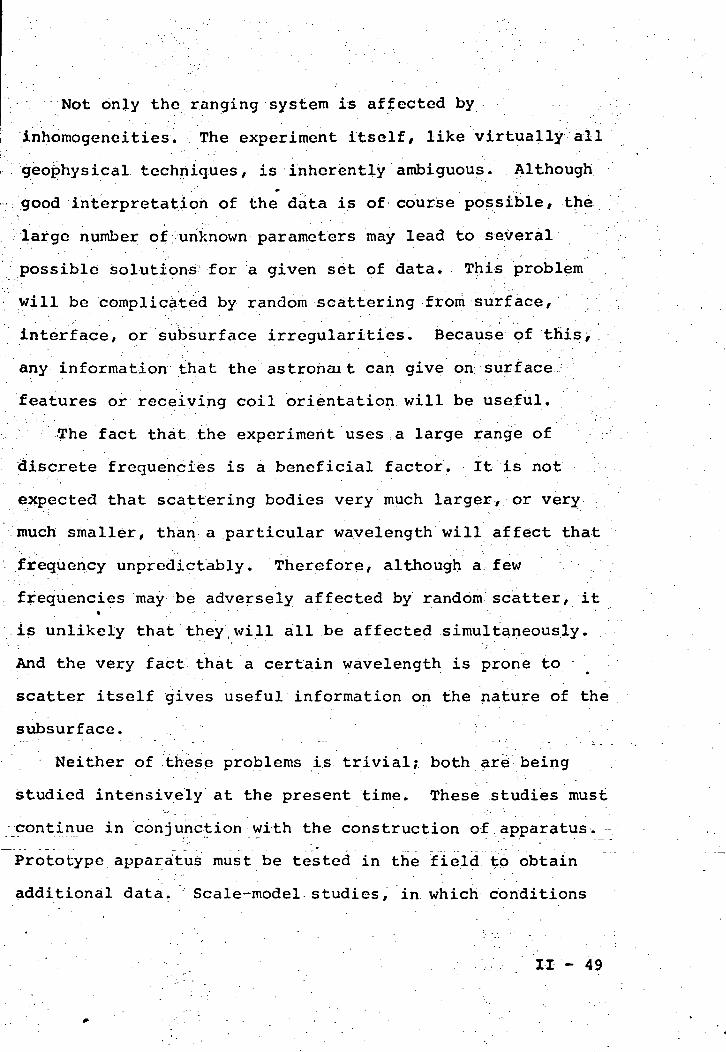
Not only the ranging system is affected by
inhomogeneities. The experiment itself/ like virtually all
geophysical techniques, is inherently ambiguous. Although
good interpretation of the data is of course possible, the
large number of unknown parameters may lead to several
possible solutions for a given set of data. This problem
will be complicated by random scattering from surface/
interface, or subsurface irregularities. Because of this,
any information that the astronait can give on surface
features or receiving coil orientation will be useful.
The fact that the experiment uses ;a large range of
discrete frequencies is a beneficial factor. It is not
expected that scattering bodies very much larger/ or very
much smaller/ than a particular wavelength will affect that
frequency unpredictably. Therefore/ although a few
frequencies may be adversely affected by random scatter, it» . • • ' ' • ' ' ' • ' - • p
is unlikely that they,will all be affected simultaneously.
And the very fact that a certain wavelength is prone to
scatter itself gives useful information on the nature of the
subsurface. :
Neither of these problems is trivial; both are being
studied intensively at the present time. These studies must
^continue in conjunction with the construction of apparatus.
Prototype apparatus must be tested in the field to obtain
additional data. Scale-model studies, in which conditions
' - ' .-•-•' - . ' . / .",...,' " II - 49
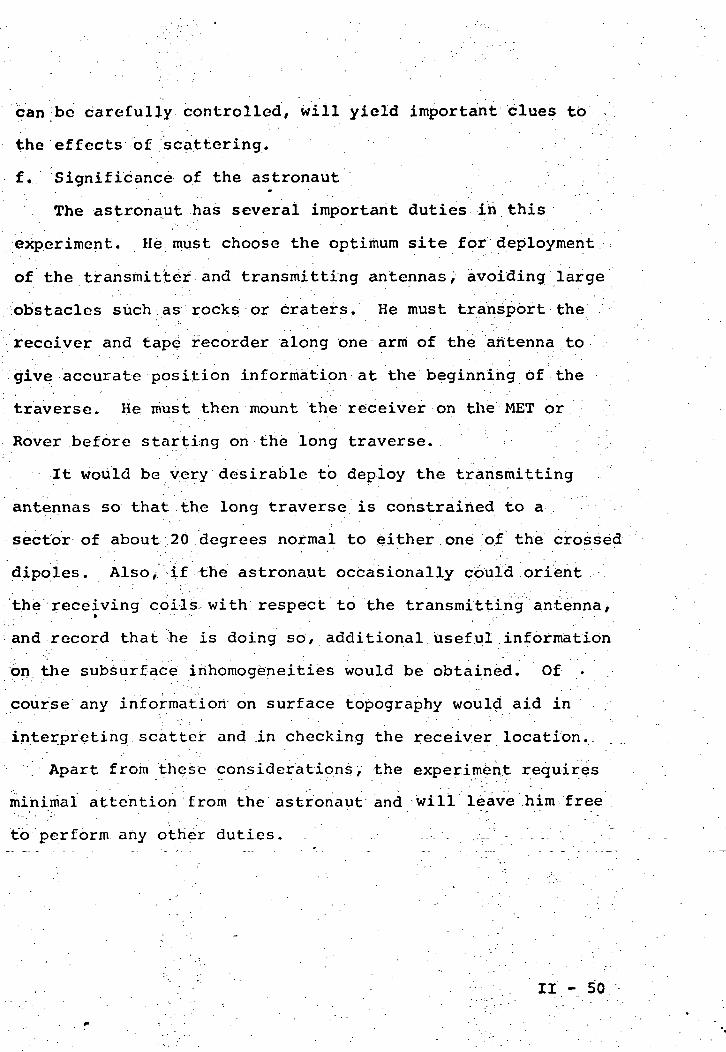
can be carefully controlled, will yield important clues to
the effects of scattering.
f. Significance of the astronaut
The astronaut has several important duties in this
experiment. He. must choose the optimum site for deployment
of the transmitter and transmitting antennas, avoiding large
obstacles such as rocks or craters. He must transport the
receiver and tape recorder along one arm of the antenna to
give accurate position information at the beginning of the
traverse. He must then mount the receiver on the MET or
Rover before starting on the long traverse.
It would be very desirable to deploy the transmitting
antennas so that the long traverse is constrained to a
sector of about 20 degrees normal to either one of the crossed
dipoles. Also,, if the astronaut occasionally could .orient
the receiving coils with respect to the transmitting antenna,. - . ' - ' • • - • . - . • • . . • . ' " _ . . .
and record that he is doing so, additional useful information
on the subsurface irihomogeneities would be obtained. Of ...
course any information on surface topography would aid in
interpreting scatter and in checking the receiver location..
Apart from these considerations, the experiment requires
minimal attention from the astronaut and will leave him free "
to perform any other duties. : v - -. .'. . .
II - 50
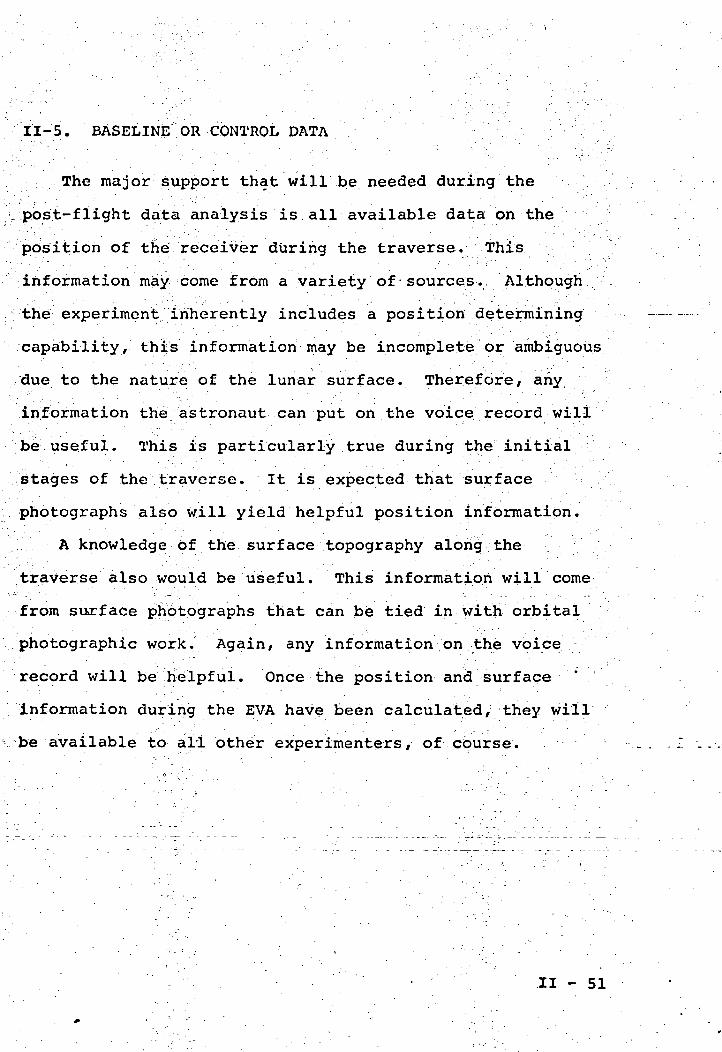
II-5. BASELINE OR CONTROL DATA
The major support that will be needed during the
post-flight data analysis is all available data on the
position of the receiver during the traverse. This
information may come from a variety of-sources. Although
the experiment inherently includes a position determining
capability, this information may be incomplete or ambiguous
due to the nature of the lunar surface. Therefore/ any
information the astronaut can put on the voice record will
be useful. This is particularly true during the initial
stages of the traverse. It is expected that surface
photographs also will yield helpful position information.
. A knowledge of the surface topography along the
traverse also would be useful. This information will come
from surface photographs that can be tied in with orbital
photographic work. Again/ any information on the voice
record will be helpful. Once the position and surface '
information during the EVA have been calculated/ they will
be available to all other experimenters/ of course.
II - 51
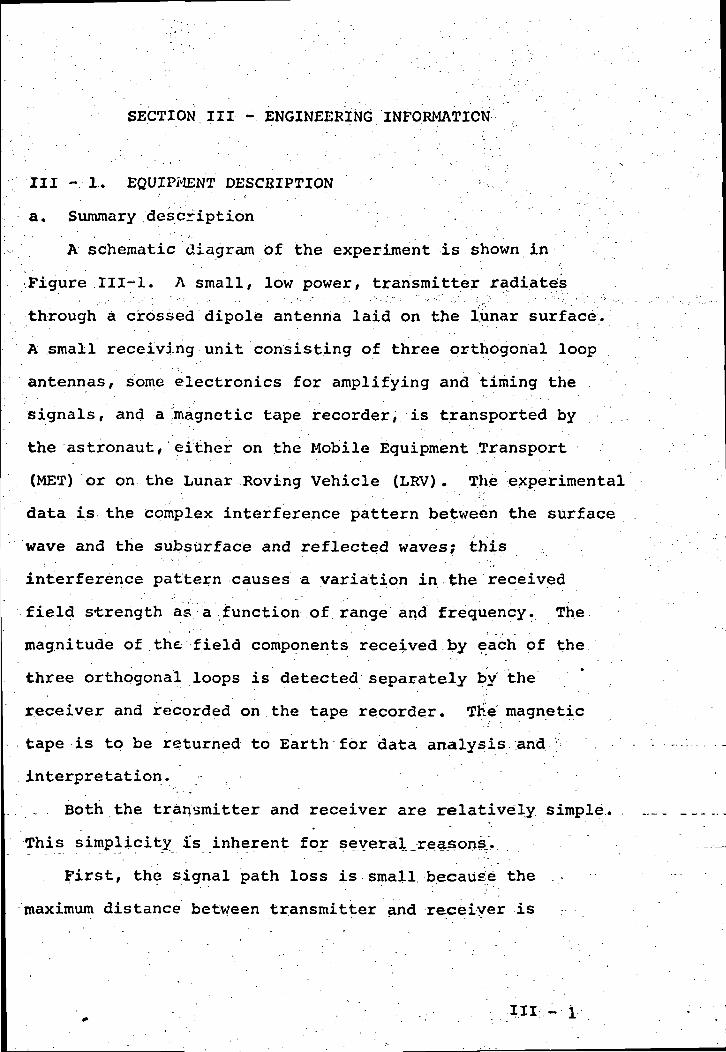
SECTION III— ENGINEERING INFORMATION
III - 1. EQUIPMENT DESCRIPTION ,
a. Summary description .
A schematic diagram of the experiment is shown in
Figure .111-1. A small, low power, transmitter radiates
through a crossed dipole antenna laid on the lunar surface.
A small receiving unit consisting of three orthogonal loop
antennas, some electronics for amplifying and timing the
signals, and a magnetic tape recorder, is transported by
the astronaut, either on the Mobile Equipment Transport
(MET) or on the Lunar Roving Vehicle (LRV). The experimental
data is the complex interference pattern between the surface
wave and the subsurface and reflected waves; this
interference pattern causes a variation in the received
field strength as a function of range and frequency. The
magnitude of the field components received by each of the
three orthogonal loops is detected separately by the
receiver and recorded on the tape recorder. The magnetic
tape is to be returned to Earth for data analysis :and'
interpretation.
Both the transmitter and receiver are relatively simple.. .
This simplicity i's inherent for several_reaspns.
First, the signal path loss is small because the
maximum distance between transmitter and receiver is
in— i
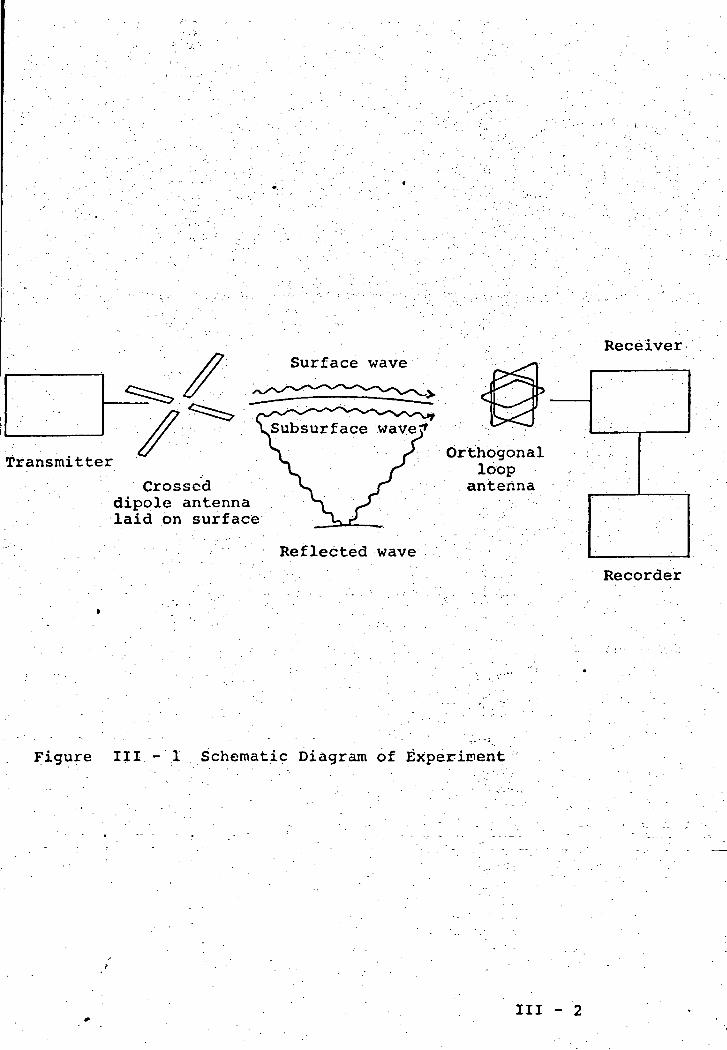
Surface wave
Transmitter
Subsurface wavef
Crosseddipole antennalaid on surface
Orthogonalloop
antenna
Reflected wave
Figure III - 1 Schematic Diagram of Experiment
Receiver
Recorder
III - 2
limited by the astronaut's traverse to a few Kilometers.
With this low path loss/ a transmitted power of one to
two watts is sufficient to create a high field strength
at the receiver; •
Second, the relatively low frequencies required by the
experiment, in the range from 0.5 to 32 Megahertz, can be
generated and manipulated easily in high efficiency circuits.
Third, the amount of auxiliary electronics -required
for timing, formatting, and the like is minimal because the
data is recorded on magnetic tape in analog form.
Fourth, the- duration of the experiment is limited to
the few hours in which the astronaut will operate on the
lunar surface. This means that the thermal design does
not have to accomodate the temperature extremes of both
.lunar day and. night, and also means that both the' • • • ' • ' . ' - • " • ' ' • • ' " ' • • " • - • ' " . .
transmitter and receiver can use internal power supplies.,
The radio frequencies employed range from 0.5 to 32" • ) . • ' . ' ' ' ' . - ' • " • • • . . '
Megahertz, with corresponding free space wavelengths
ranging from 600 to 9.4 meters. Eight discrete frequencies
are used, with sequential one-tenth second bursts at 0.5,
1, 2, 4, 8, 16, 24, 32 MHz; this timing is illustrated by
Figure III-2.. A_complete.cycle lasts for one_second, with
two 100—miITisecond^ intervals reserved ~for'Treceiyer~-~~: "
calibration.
The transmitted signal is amplitude modulated so that
- 3
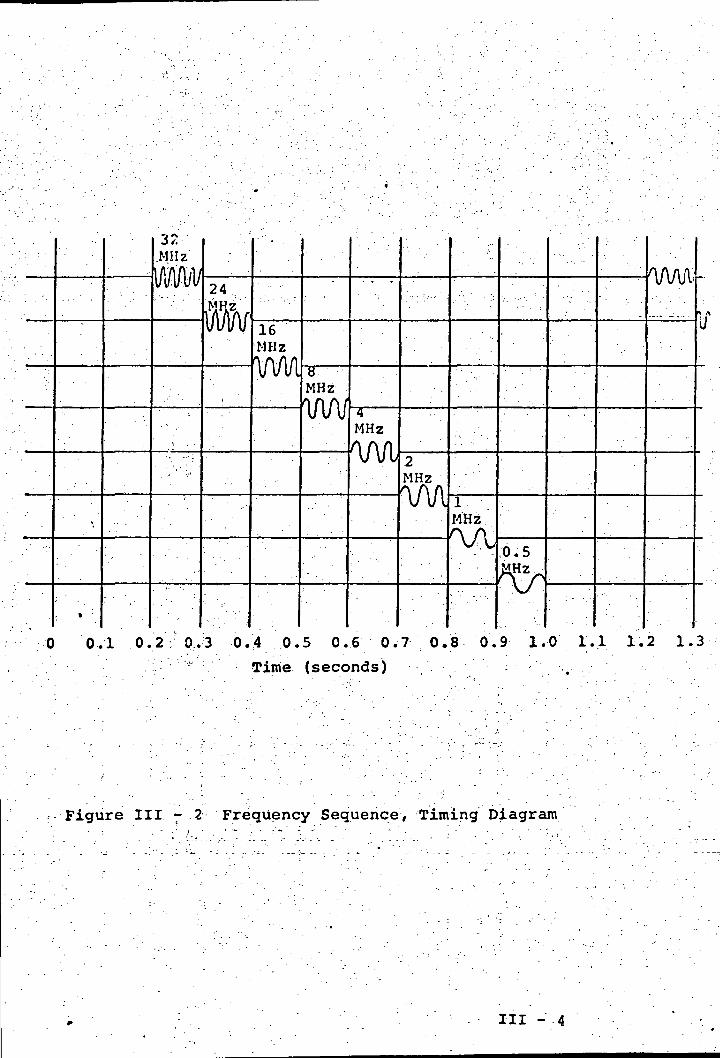
'.
•
3?..MHz
IMffi/Vm 16MHz
VWl 8MHz
WV 4MHz
/\ AO\J ut 2MHz
1AA
. • • •
1MHzA Ay L 0.5
^
-
wyi% «a
0 0.1 0.2. 0.3 0.4 0.5 0.6 0.7 0.8 0.9 1.0 1.1 1.2 1.3
" Time (seconds)
Figure III - 2 Frequency Sequence, Timing Diagram
III - 4
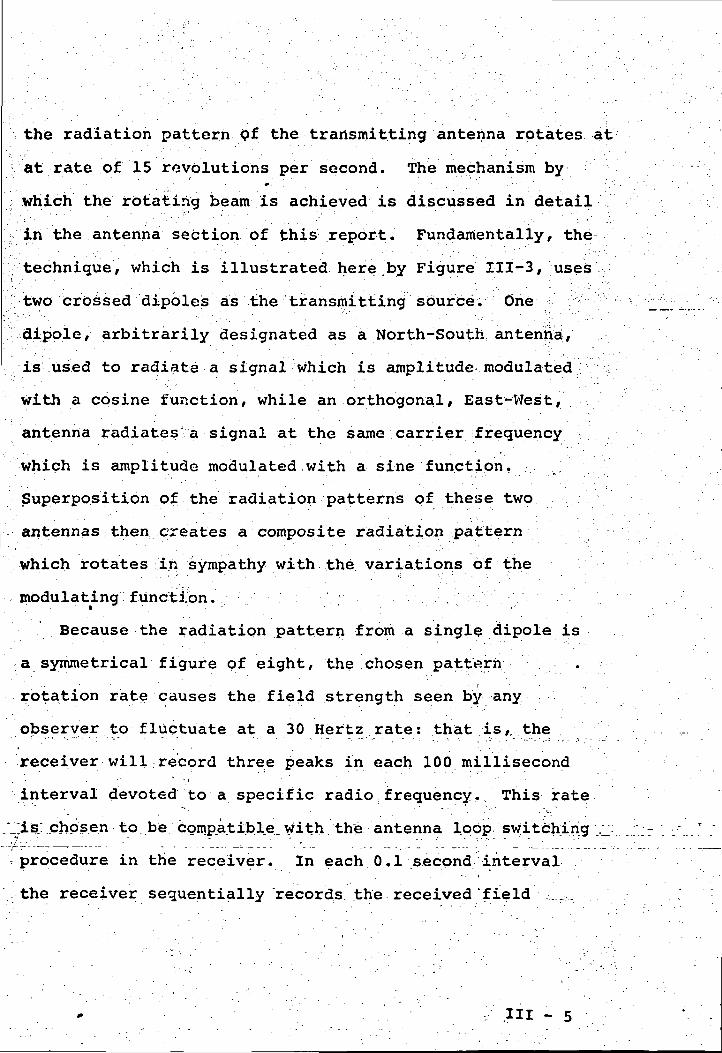
the radiation pattern <?f the transmitting antenna rotates at
at rate of 15 revolutions per second. The mechanism by
which the rotating beam is achieved is discussed in detail
in the antenna section of this report. Fundamentally, the
technique, which is illustrated here by Figure III-3, uses
two ertossed dipolesas the transmitting source. One '•••• .
dipole, arbitrarily designated as a North-South antenna,
is used to radiate a signal which is amplitude modulated ;
with a cosine function, while an orthogonal, East-West,
antenna radiates a signal at the same carrier frequency
which is amplitude modulated with a sine function. ;
Superposition of the radiation patterns of these two
antennas then creates a composite radiation pattern
which rotates in sympathy with the variations of the
modulating function.
Because the radiation pattern from a single dipole is
a symmetrical figure qf eight, the chosen pattern
rotation rate causes the field strength seen by any
observer to fluctuate at a 30 Hertz rate: that is,, the
receiver will record three peaks in each 100 millisecond
interval devoted to a specific radio frequency.. This rate
is; chosen • to_b;e: compatible, with /the antenna loop, switching -1
procedure in the receiver. In each 0.1 second interval
the receiver sequentially 'records the received 'field
.HI - 5
N-S dipolc
Radiation pattern ofN-S dipole
E-W dipole
Radiation pattern of E-W dipole
a) Arrangement of orthogonal dipples
sin wt cos0(t)
N-Sdipole
E-Wdipole
sin wt sin9(t)
b) Transmitted signals
= KT (sin6)
Rotating resultant
c)
|A|"= Kl(cos6)
Spatial relation of transmitted fields
Lgure III-3 ROTATING BEAM CONCEPT
III - 6
strength as seen by each of the three orthogonal receiving
loops so each loop in turn will observe one fu]1 cycle of
variation in the received field strength. This timing ,-v
relation is illustrated by Figure III-4.
This rotating beam system represents a change from the
original hardware proposal, formulated in September 1969,
which included some system components not required for
the main experiment but designed solely to provide the
range and azimuth information needed for proper
interpretation of the experimental data. The prior system
included three transmitters: a main transmitter radiating
through a single dipole laid on the lunar surface/and two
subsidiary transmitters located at the ends of the dipole
to provide position determining information by fairly
conventional range difference, or hyperbolic/ navigation;,•-'• . • » . • • . " , • . ' . . - • • ' • •
techniques. •.•'•••.
The revised system described here has three notable*
advantages. First/ because the crossed dipoles used for
the main transmitter provide an essentially omni-directional
radiation pattern/ the experiment is even less sensitive
to the exact path followed by the astronaut during a lunar
surface traverse. Second, additional; scientific data
becomes available because with the new system it is possible
to obtain a measure of the apparent lateral distortion of' ' " ' ' . . " • - -
the radio beam due to multipath reflections associated
ill -7
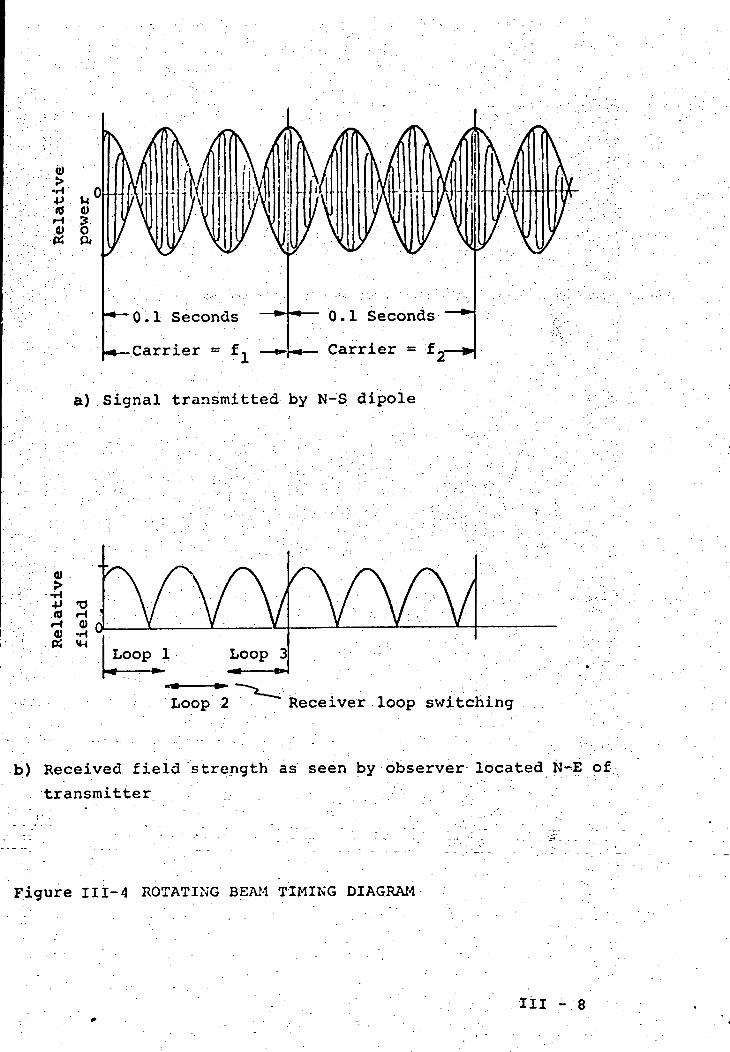
0.1 Seconds *""
Carrier = f~—»•
0.1 Seconds
Carrier = f
a) Signal transmitted by N-S dipole
Loop 2 Receiver loop switching
b) Received field strength as seen by observer located N-E of
transmitter ;.- .
Figure III-4 ROTATING BEAM TIMING DIAGRAM
III - 8
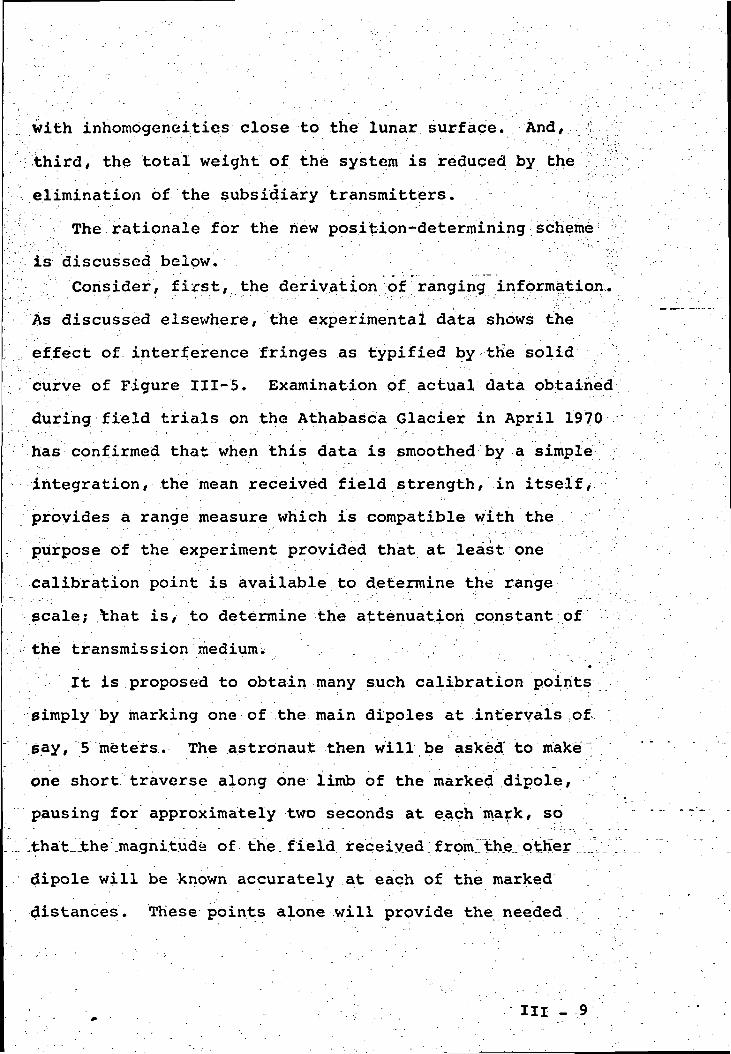
with inhomogeneities close to the lunar surface. And, i
• third/ the total weight of this system is reduced by the
elimination of the subsidiary transmitters.
; The rationale for the new position-determining scheme
is discussed below. ':Consider, first/ the derivation of ranging information.
As discussed elsewhere/ the experimental data shows the
/effect of interference fringes as typified by the solid
curve of Figure III-5. Examination of actual data obtained
during field trials on the Athabasca Glacier in April 1970
has confirmed that when this data is smoothed by a simple
integration/ the mean received field strength/ in itself,
provides a range measure which is compatible with the• : . • ' • - ' • • . • ' • ' • ' ' , ' \ ' • ' " ' . • :purpose of the experiment provided that at least one
calibration point is available to determine the range
scale; that is/ to determine the attenuation constant of
•': the transmission medium. . .-• ', ' •'
It is proposed to obtain many such calibration points
simply by marking one of the main dipoles at intervals :of
say, 5 meters. The astronaut then will be asked"to make~
one short traverse along one limb of the marked dipole,
pausing for approximately two seconds at each mark, so
; jthat_the\magnituds of the. field received;from/'the..-pther :.._
dipole will be known accurately at each of the marked
distances. These points alone will provide the needed
III - 9
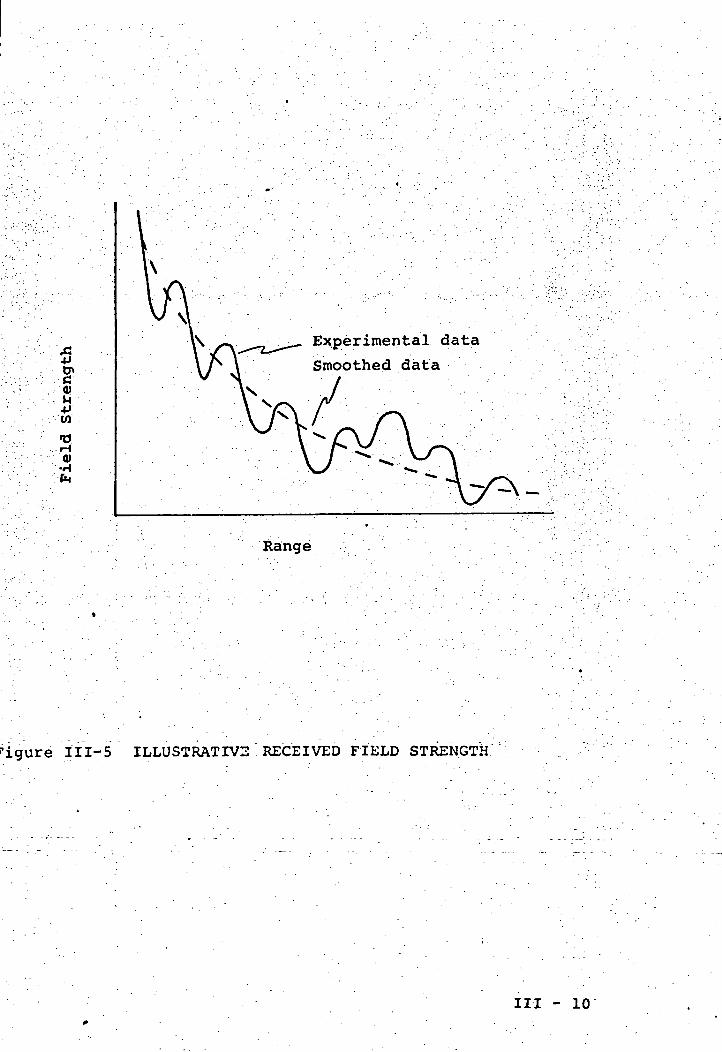
Q)M•PW
•a•H0)•Hfe
Experimental data
Smoothed data
Range
igure III-5 ILLUSTRATIVE RECEIVED FIELD STRENGTH
III - 10
vJmeasure of the attenuation constant of the transmission'.': <; i;i
^ineidium. As a backup/of course, the data also can be, : "
ifitted to other, longer range, calibration points if the .;
^precise distance between the astronaut and the main ' -
': transmitter happens to be known from other sources such
as photographic correlations. .. , / ; : v^;^;7
r Azimuth, or direction, data, by contrast, could not .,
;be derived solely from the central transmitter in the . !
^ystem proposed previously. Although the received field :>
strength will vary in sympathy with the radiation pattern; v:
as the observer departs from a line that is normal to a
dipole, the rate of change of field strength as a function
of angular displacement is too small to provide a meaningful
measure of the relative direction of the observer and, in
any case, could hot be distinguished easily from a change'.'''•""''.': - • • ' ' . ' • • • . ' ' ' "' .- . '' " ' '" . - • . - . • ' . ' ' • : • :
in received field strength caused by a change in range. For
this reason, two subsidiary transmitters were used
previously to provide intersecting sets of hyperbolic lines
so that a pair of range difference measurements could be
used to determine the angular location of the observer with
respect to the main transmitter. . ;_ , . . .: .
: The need for the subsidiary transmitters is eliminated
-by--the-use- of—a-main~antenna -fneed—system^which -causes-the—-----
antenna beam to rotate slowly. Conceptually, the ...
Ill - 11
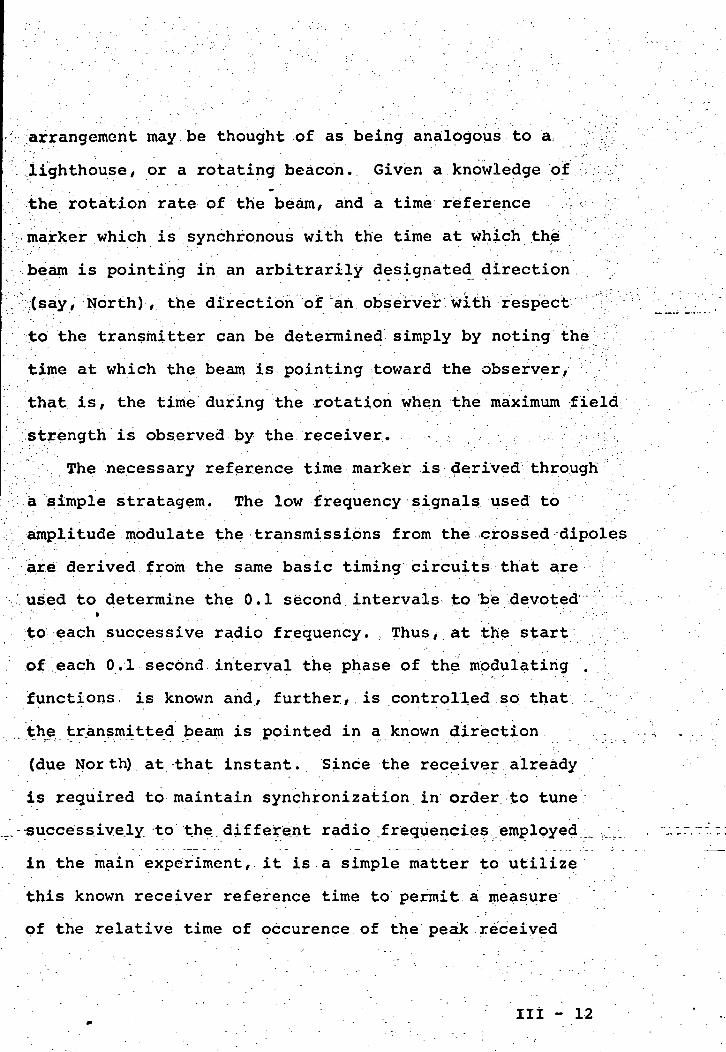
arrangement may be thought of as being analogous to a, ;r
..lighthouse, or a rotating beacon. Given a knowledge of .
the rotation rate of the beam, and a time reference
marker which is synchronous with the time at Which the
beam is pointing in an arbitrarily designated direction
;(say, North), the direction of ah observer with respect
to the transmitter can be determined simply by noting the
time at which the beam is pointing toward the observer,
that is, the time during the rotation when the maximum field
strength is observed by the receiver. ;
The necessary reference time marker is derived through
a simple stratagem. The low frequency signals used to
amplitude modulate the transmissions from the crossed dipoles
are derived from the same basic timing circuits that are
used to determine the 0.1 second intervals to be devoted• • ' • • ' ' • • ' ' '.' . •' '- /••• •"
to each successive radio frequency. : Thus, at the start
of each 0.1 second interval the phase of the modulating .
functions, is known and, further, is controlled so; that
the transmitted beam is pointed in a known direction .
(due Nor th) at that instant. Since the receiver already
is required to maintain synchronization in order to tune
-successively to the different radio frequencies..employed _
in the main experiment, it is a simple matter to utilize
this known receiver reference time to permit a measure
of the relative time of occurence of the peak received
III - 12
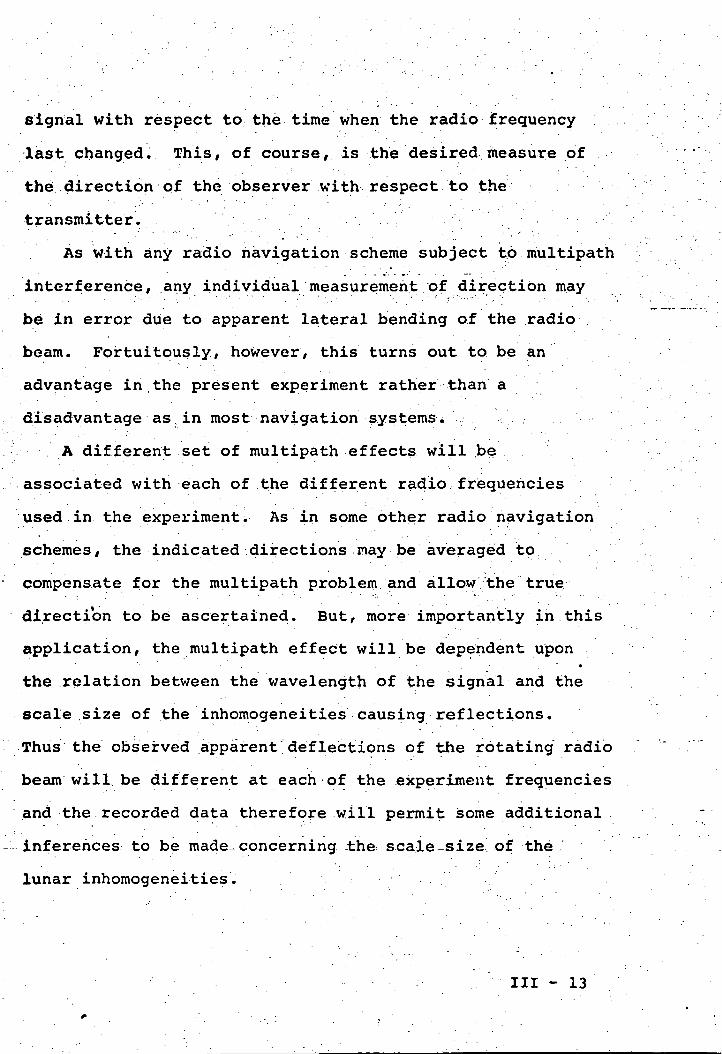
signal with respect to the time when the radio frequency
last changed. This, of course, is the desired measure of
the direction of the observer with respect to the
transmitter.
As with any radio navigation scheme subject to multipath
interference, any individual measurement of direction may
be in error due to apparent lateral bending of the radio
beam. Fortuitously, however, this turns out to be an
advantage in the present experiment rather than a
disadvantage as in most navigation systems.
A different set of multipath effects will .be
associated with each of the different radio frequencies
used in the experiment. As in some other radio navigation
schemes, the indicated directions nay be averaged to
compensate for the multipath problem and allow the true
direction to be ascertained. But, more importantly in this
application, the multipath effect will be dependent upon" • - " - , . • . *
the relation between the wavelength of the signal and the
scale .size of the inhomogeneities causing reflections.
Thus the observed apparent deflections of the rotating radio
beam will be different at each of the experiment frequencies
and the recorded data therefore will permit some additional
inferences to be made-concerning the scale-size of the -
lunar inhomogeneities.
Ill - 13
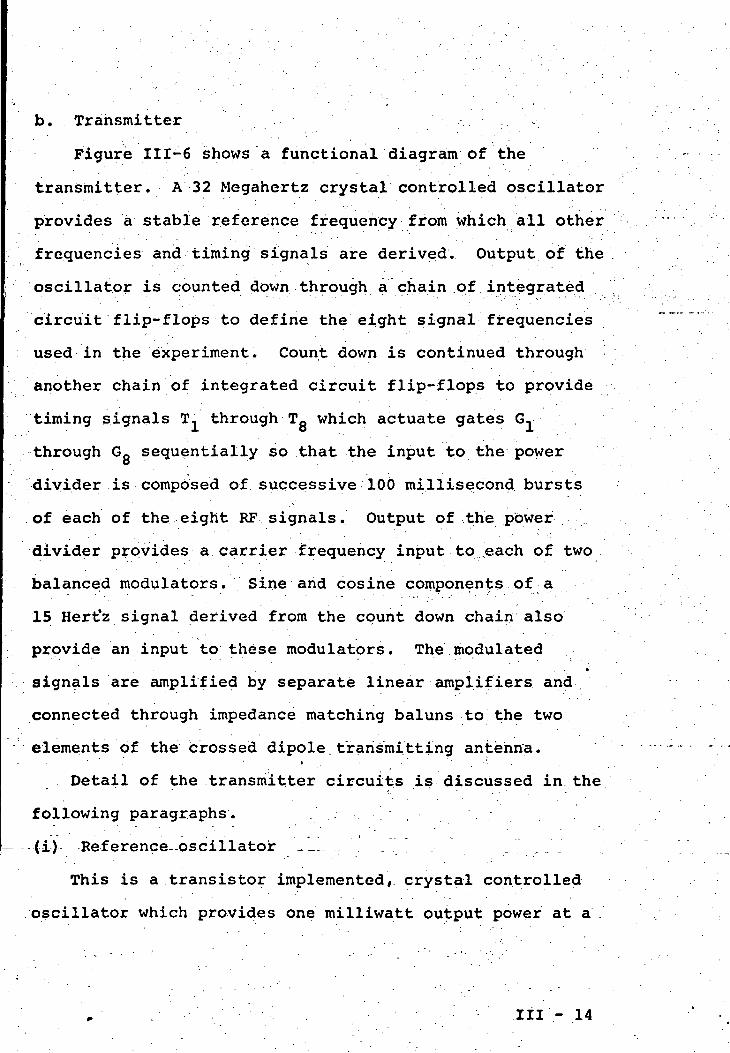
b. Transmitter
Figure III-6 shows a functional diagram of the
transmitter. A 32 Megahertz crystal controlled oscillator
provides a stable reference frequency from which all other
frequencies and timing signals are derived. Output of the
.oscillator is counted down through a chain .of integrated
circuit flip-flops to define the eight signal frequencies
used in the experiment. Count down is continued through
another chain of integrated circuit flip-flops to provide
timing signals T, through T_ which actuate gates G^
through GQ sequentially so that the input to the powerO ' ' . ' • ' • ' '
divider is composed of successive 100 millisecond bursts
of each of the eight RF signals. Output of the power
divider provides a carrier frequency input to .each of two
balanced modulators. Sine and cosine components of a
15 Hert'z signal derived from the count down chain also
provide an input to these modulators. The modulated- . • •
signals are amplified by separate linear amplifiers and
connected through impedance matching baluns to the two
elements of the crossed dipole.transmitting antenna.i • . ' • ' . - . ,
Detail of the transmitter circuits is discussed in the
following paragraphs. . . . . :
- {i-)- Reference-oscillator .. . .
This is a transistor implemented, crystal controlled
oscillator which provides one milliwatt output power at a .
Ill - 14
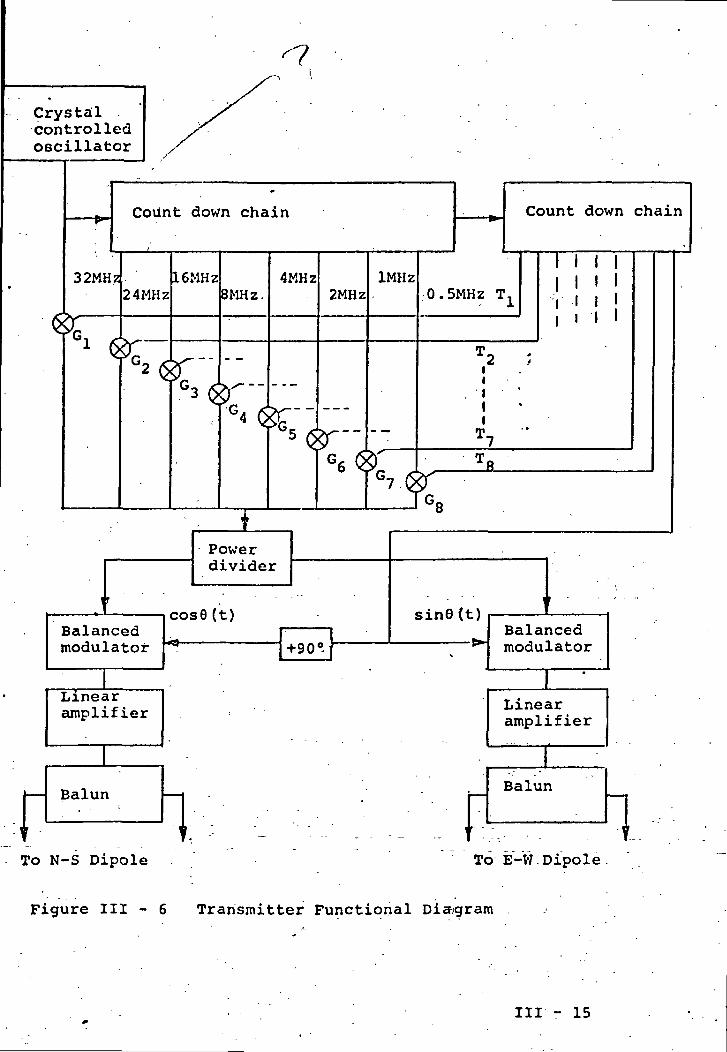
Crystailcontrolledoscillator
Coxlnt down chain
32MHz24MHz
16MHz8MHz,
4MHz2MHz
1MHz
'6
Count down chain
0.5MHz T,
I I I II I ' II I I
iIIIT.
'8
Powerdivider
Balancedmodulator
cos6(t) sin8(t)
>HBalancedmodulator
Linearamplifier
ILinearamplifier
Balun Balun
To N-S Dipole To E-W Dipole
Figure III - 6 Transmitter Functional Diagram
III - 15
frequency of 32 Megahertz. The crystal is chosen to have
a low temperature coefficient so that thermostatic control
is not required. The frequency stability is in .the order9of three parts in 10 over a period of one day, and better
than one part in 10 over a period of one second.
(ii) Count down chain :
This is implemented with conventional monolithic
integrated circuit flip-flops and gates. The total chain
accepts an input signal with a frequency of 32 Megahertz
from the basic oscillator and provides all necessary lower
frequencies ranging down to the 100 millisecond timing
signals used to define the transmission intervals,
(iii) Power divider
RF power at frequencies of 0.5, 1, 2, 4, 8, 16, 24,
and 32 MHz is fed into the power divider which performs an
equal phase, 3dB, power split to provide inputs to the
balanced modulators. The power divider is a passive,
lumped element, network with broad band frequency
characteristics. The divider maintains a phase balance
within 1° and an amplitude balance better than 2 dB over
the full frequency range of the experiment. Isolation
between the output ports is better than .30.dB; the -
insertion loss is less than 0.3 dB
III - 16
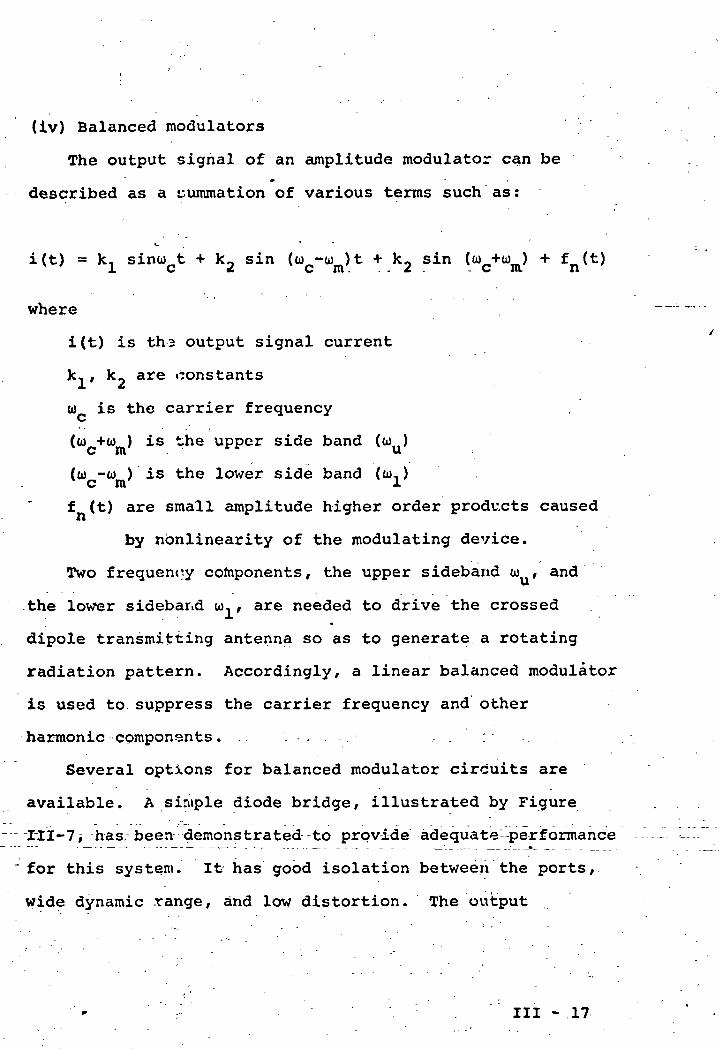
(iv) Balanced modulators
The output signal of an amplitude modulator can be
described as a summation of various terms such as :
i(t) = k, sinu^t + k, sin (u -wm )t + k, sin (w +u ) + f _ ( t )J. w fc C III . - - A - -• C iiL *»
where
i(t) is tha output signal current
k, , k2 are constants
CD is the carrier frequencyC
(oo +w ) is the upper side band (u )
(w -w ) is the lower side band (co, )c m xf (t) are small amplitude higher order products caused
by nbnlinearity of the modulating device.
Two frequency components, the upper sideband <o , and
the lower sideband u>,, are needed to drive the crossed
dipole transmitting antenna so as to generate a rotating
radiation pattern. Accordingly, a linear balanced modulator
is used to suppress the carrier frequency and other
harmonic components . ,
Several options for balanced modulator circuits are
available. A simple diode bridge, illustrated by Figure
III-7, has been demonstrated-to provide adequate1 performance
for this system. It has good isolation between the ports,
wide dynamic range, and low distortion. The output
III - 17

UUULUJUJUUU.nfa>
Figure III - 7 Balanced Modulator
III - 18
carrier suppression exceeds 40 dB. The experimental
circuit uses a matched pair of ultrafast switching hot
carrier diodes', having a forward resistance of less than95 ohms and a reverse-bias.resistance greater than 10 ohms.
This large resistance ratio is responsible for the
relatively good performance quoted above. ;
(v) Linear amplifiers
For this experiment, the linear amplifiers must be*
capable of providing an output power of the order of 2 watts
in the frequency range from 0.5 to 32 Megahertz. Other
important design characteristics include a differential
phase error of less than ± 5° and a gain error of less than
+ 1 dB over the frequency and temperature range of interest.
Experimental circuits have substantially exceeded
these requirements, providing a differential phase error
of less- than 2° and a differential gain error of less than
0.2 dB.
(vi) Baluns
These are broadband, 180° phase shift, lumped circuit
-hybrids which connect the coaxial output of the linear
amplifiers to the feeder lines of the ,dipole antennas.
Commercial elements used in an engineering model provide
an amplitude balance better than 0.2 dB, a phase balance -.--
better than 1°, an insertion loss of less than 0.5 dB,
and isolation exceeding 30 dB. These commercial units,
III .-19

which have a power handling capability of 5 watts, weigh
1.4 ounces each.
Ill - 20
c. Transmitting antenna
. . The configuration of this antenna is shown by Figure
III-8. The identical and orthogonal 'North-South' and
'East-West' dipoles are each composed of eight separate
elements. Seven of these are used as standard half-wave
dipoles at the experiment frequencies ranging from 1 to 32
Megahertz. A loaded quarter-wave dipole is used for the
lowest, 0.5 MHz, experiment frequency in order to keep the
antenna weight and deployment time within reasonable limits.
With the exception of the 24 MHz signal,, which will be
discussed separately, the wavelengths of the RF signals
used in the experiment are related by successive factors
of two. So, when the shortest dipole elememlt is fed at
32 MHz, the 16 MHz dipole antenna and all successively
longer elements are even multiples of the wavelength of
the transmitted signal. These "parasitic dLipoles"
therefore appear as large value inductors across their
respective feed lines. This is true as eacdh successively
longer dipole is fed with its resonant frequency.
Conversely, when the longest antenna is fed! at its resonant
frequency, each of the shorter antennas appears as a small
capacitor across its respective feed lines. In either case,
there is a large reactance in series with the antenna and,
consequently, a very poor impedance match ftwith a VSWR of
the order of 40) so that essentially no sigmal current flows
III - 21
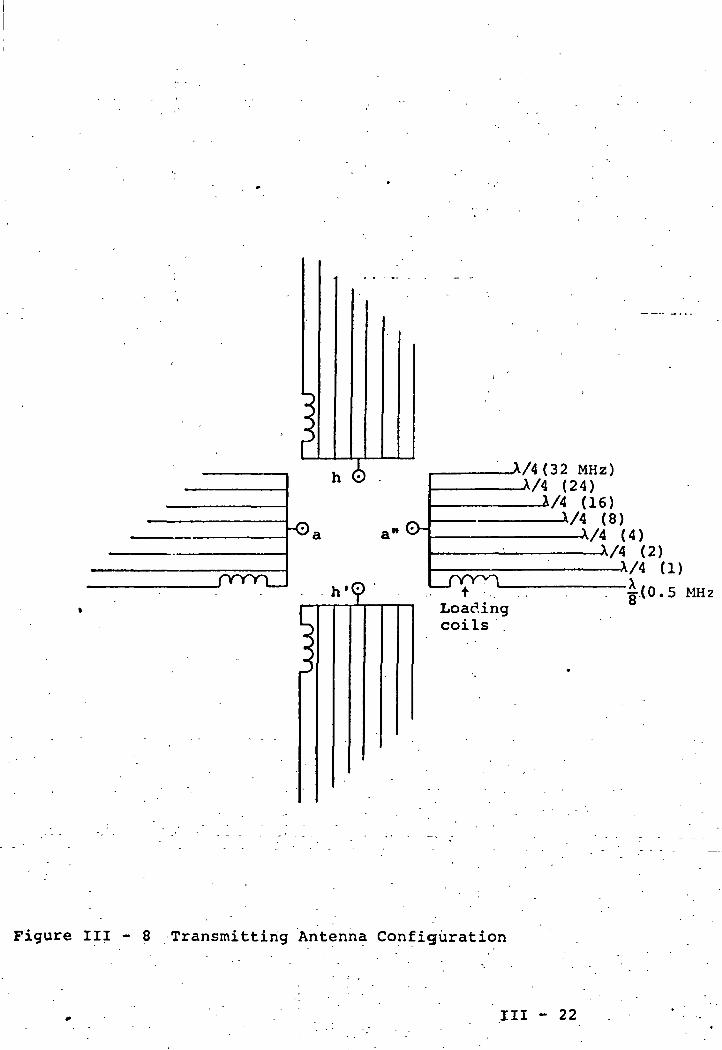
.If »i
h'Q"Loadingcoils
_X/4(32 MHz)—X/4 (24)
(16)X/4 (8)X/4 (4)X/4 (2)X/4 (1)
"£.(0.5 MHz
Figure III - 8 Transmitting Antenna Configuration
III - 22

in any dipole except the one that is resonant to the signal.
In other words, each antenna functions as a simple dipole
and the signal free elements can be placed very close to
the active element with negligible effect on either the
feed line impedance or the radiation pattern. For ease
of deployment, therefore/ each of the four limbs of the
antenna can be formed with a multiple conductor flat
ribbon wire.
There is one exception to the above condition. When
the 24 MHz antenna is excited at its resonant frequency,
the 8 MHz antenna becomes a 3X/2 dipole. Current will
flow in this antenna and the 8 MHz antenna will radiate
with the pattern of a 3X/2 dipole in addition to the 24 MHz
antenna radiating as a A/2 dipole. The result is a six-lobed
pattern with nulls existing between about 10° and 30° . ...
from the axis perpendicular to the dipoles. This condition
might cause the 24 MHz signal data to be marginal at maximum•
range. However, inasmuch as the higher frequencies are for
short ranges anyway, this problem is not considered to be
serious.
Ill - 23
d. Signal/noise Analysis "and Receiver• . "
(i) Introduction/
The basic idea of the SEP experiment receiver is to
record the local magnetic field strength at each frequency
radiated by the transmitter as a function of the receiver
position on the lunar surface.
If the signal,were strong enough/ then in principle
all that would be required for the receiver would be an
antenna/ a diode-resistor-capacitor combination (detector)/
plus a recorder as indicated by Figure III-9. Because this
experiment derives data from interference patterns, however/i - - .
the signals strength are necessarily faint at certain
intervals and strcng at others. This along with assumptions
related to the properties of the lunar subsurface and the
unknown noise environment of the lunar rover vehicle dictate
receiver design concepts that will not only accommodate wide
signal excursions (large dynamic range)-.and handle very low .
111-24
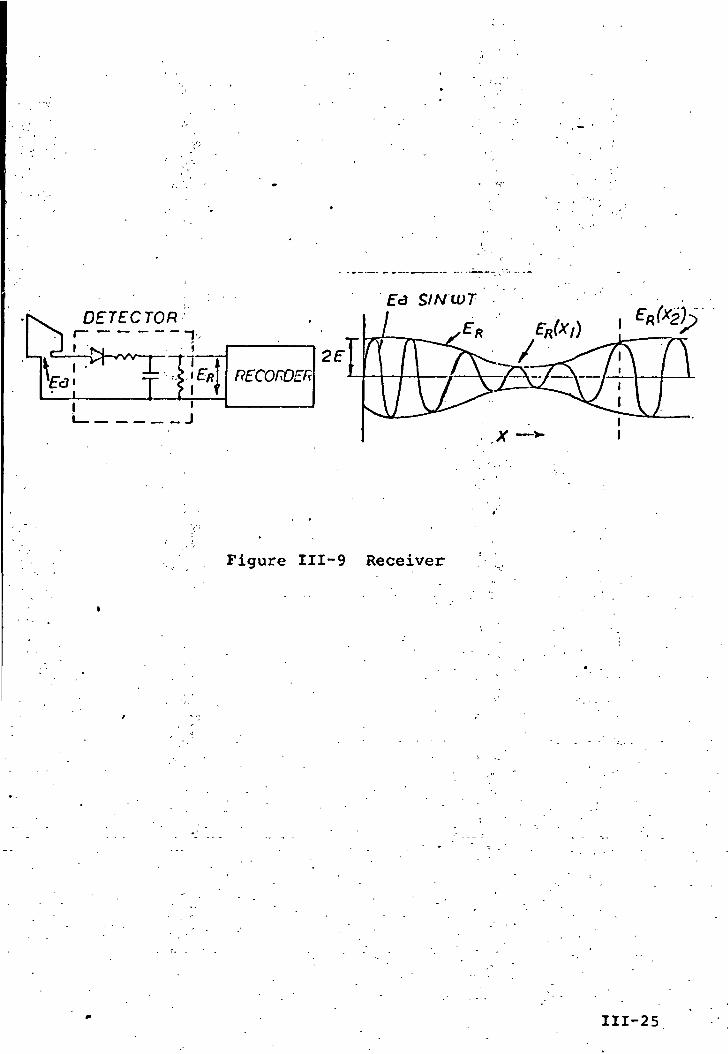
Figure III-9 Receiver
111-25
.signals levels (low noise design) but will as,well, remain
time synchronizer with the transmitter in the event of complete
loss of signals for extended time intervals. In addition,,
the SEP receiver must be designed to meet the following
"constraints: (1) three orthogonal electrostatically shielded
circular loop antennas are required to eliminate receiver
directionality; (2) because the receiver is to be mobile,
the three antennas must be physically small (approximately
1 ft. diameter), and therefore, only a small fraction of a* '
wavelength in diameter and, consequently, are very inefficient;
(3) in order to minimize the required storage capacity,, the
three orthogonal signal components are time multiplexed
onto one tape track; and (4) interpretation of the experiment
data requires an approximate knowledge of the relative range
and azimuth betweeri the transmitter and receiver.
. ', Fron an electrical viewpoint, the receiver functional" " ' ' . * 'requirements are fairly standard. The signal sequence
following the loop antennas is: (1) wideband, low noise
gain, followed by, (2) pre-detection narrowband filtering,
43) detection, (4) signal compression, and finally. .(5)
storage on magnetic' tape. .. . .
There are, of course, several different detailed design
configurations that would meet the SEP requirements. For ,~-V--
example, we have studied two alternative methods to accomplish
the pre-detectiqn ' filtering, namely using individual crystal
filters or a phase locked loop to accomplish the narrowbandv- - ' '.-
filtering. We also have considered different compression
* 111-26
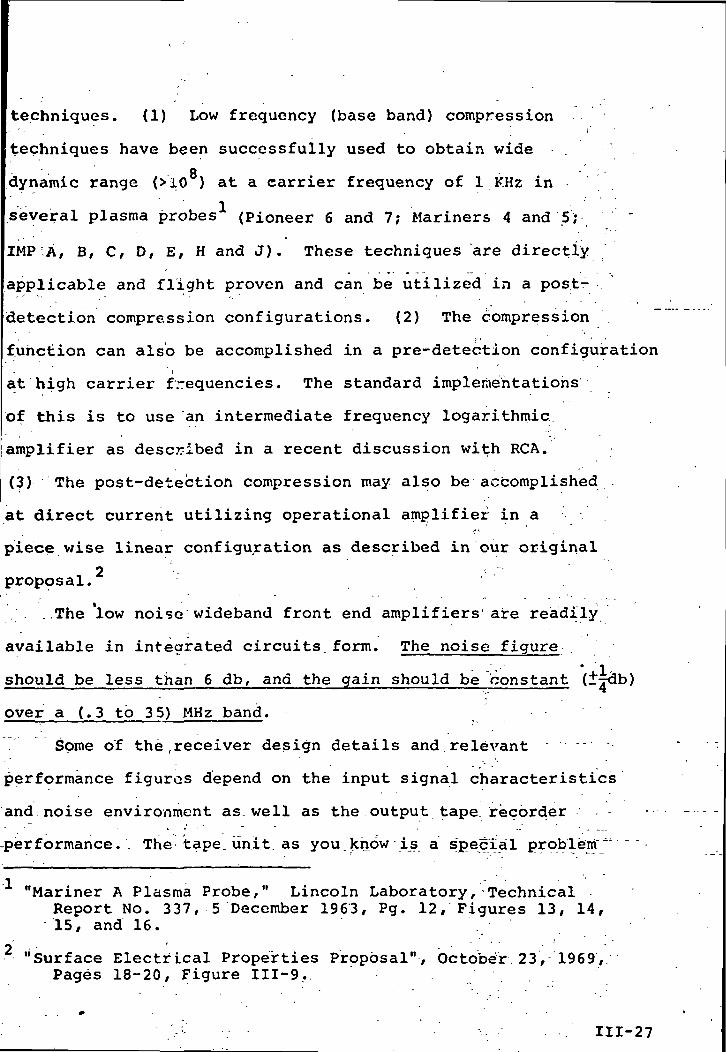
techniques. (1) Low frequency (base band) compression
techniques have been successfully used to obtain wide .
• 8 •dynamic range (>10 ) at a carrier frequency of 1 KHz in
several plasma probes (Pioneer 6 and 7; Mariners 4 and 5;
IMP A, B, C, D, E, H and J). These techniques are directly
applicable and flight proven and can be utilized in a post-
detection compression configurations. (2) The compression
function can also be accomplished in a pre-detection configuration
at high carrier frequencies. The standard implementations
of this is to use an intermediate frequency logarithmic
amplifier as described in a recent discussion with RCA.
(3) The post-detection compression may also be accomplished
at direct current utilizing operational amplifier in a
piece wise linear configuration as described in our originali " * •
proposal.
..The low noise wideband front end amplifiers'are readily
available in integrated circuits.form. The noise figure .
- - ' - ' " * 1should be less than 6 db, and the gain should be constant (3T<3b)
over a (.3 to 35) MHz band.
Some of therreceiver design details and relevant
performance figures depend on the input signal characteristics
and:noise environment as. well as the output tape recorder
performance. The tape.unit.as you.know is a special problem'^
"Mariner A Plasma Probe/" Lincoln Laboratory, TechnicalReport No. 337, 5 December 1963, Pg. 12, Figures 13, 14,15, and 16. .
2 • • ' . - " ' ' • ' •"Surface Electrical Properties Proposal", October 23, 1969,
Pages 18-20, Figure III-9.
111-27

area that has been much discussed (L.H. Bannister's memorandum
August 28, 1970)f and therefore, will not be covered here' ' , •
except in as much as its performance limits the receiver
design. The input signal discussion follows.
111-28
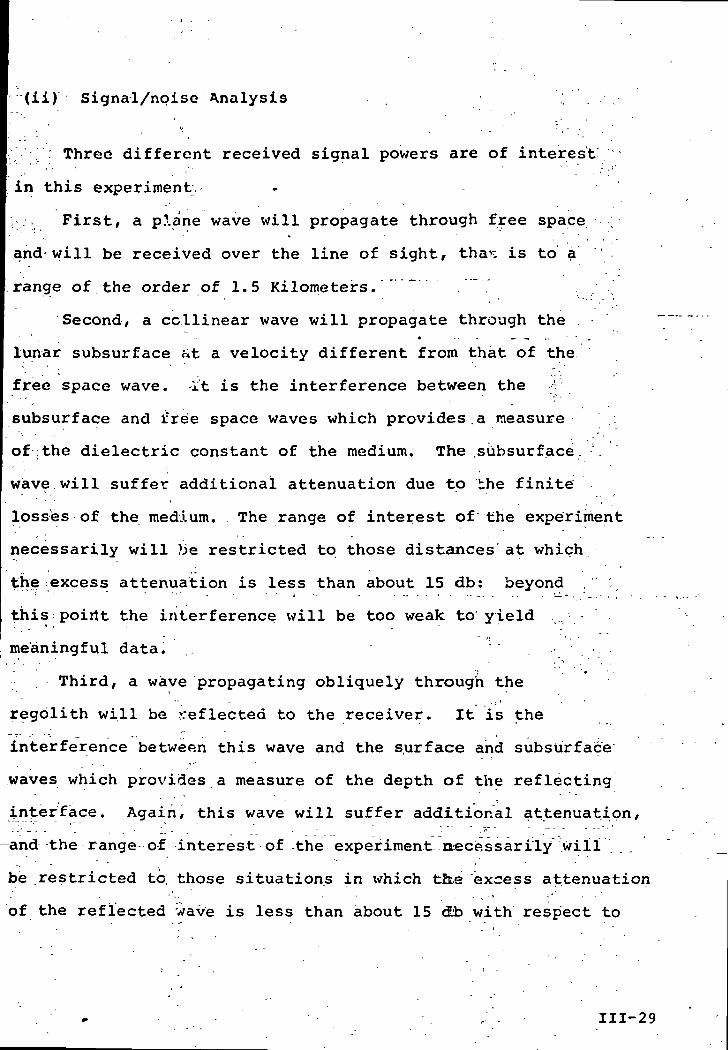
(ii) Signal/noise Analysis . ...
: Three different received signal powers are of interest"
in this experiment.
, /i First, a plane wave will propagate through free space ;
and will be received over the line of sight, thar, is to a
range of the order of 1.5 Kilometers.
Second, a ccllinear wave will propagate through the
lunar subsurface «t a velocity different from that of the
free space wave. it is the interference between the c
subsurface and free space waves which provides.a measure
of the dielectric constant of the medium. The subsurface. ',
wave will suffer additional attenuation due to the finite
losses of the medium. The range of interest of the experiment
necessarily will be restricted to those distances at which
the excess attenuation is less than about 15 db: beyond
this poirtt the interference will be too weak to yield ..
meaningful data. ,.
Third, a wave propagating obliquely through the
regolith will be reflected to the receiver. It is the
interference between this wave and the surface and subsurface
waves which provides a measure of the depth of the reflecting
interface. Again, this wave will suffer additional attenuation,
-and the range of interest of -the experiment necessarily :wiil~• " ! ' "
be .restricted to, those situations in which t&e excess attenuation
of the reflected wave is less than about 15 dito with respect to
111-29
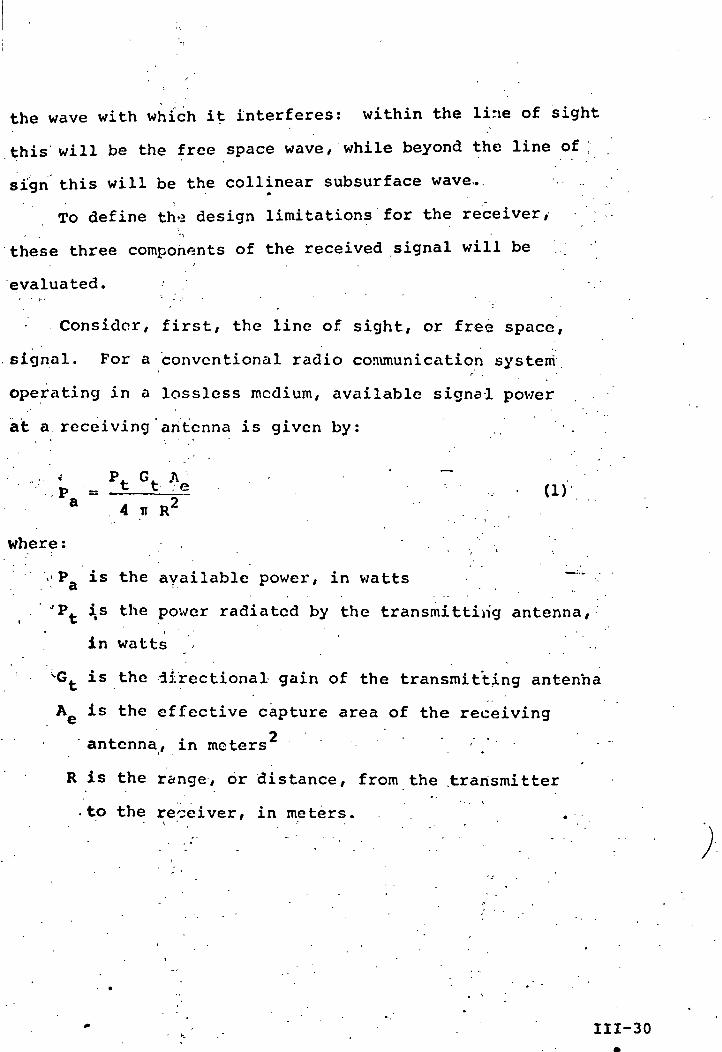
the wave with which it interferes: within the line of sight
this will be the free space wave, while beyond the line of
sign this will be the collinear subsurface wave..
To define th^ design limitations for the receiver/' . "i
these three components of the received signal will be
evaluated.- v . , .1 • _ (
Consider, first, the line of sight, or free space,
signal. For a conventional radio communication system? .
operating in a lossless medium, available signal power
at a receiving antenna is given by: .\ ' , "*
P = ?t G* 1G- (1)4 71 R2
where: .
>• Pa is the available power, in watts ~~"~- ' C* c • -
JPfc i(s the power radiated by the transmitting antenna,* \ ' _ "• ' •
in watts
v-Gt is the directional gain of the transmitting antenna
AC is the effective capture area of the receiving2 •
antenna, in meters " ' ."
R is the range, or distance, from the .transmitter
•to the receiver, in meters.
111-30
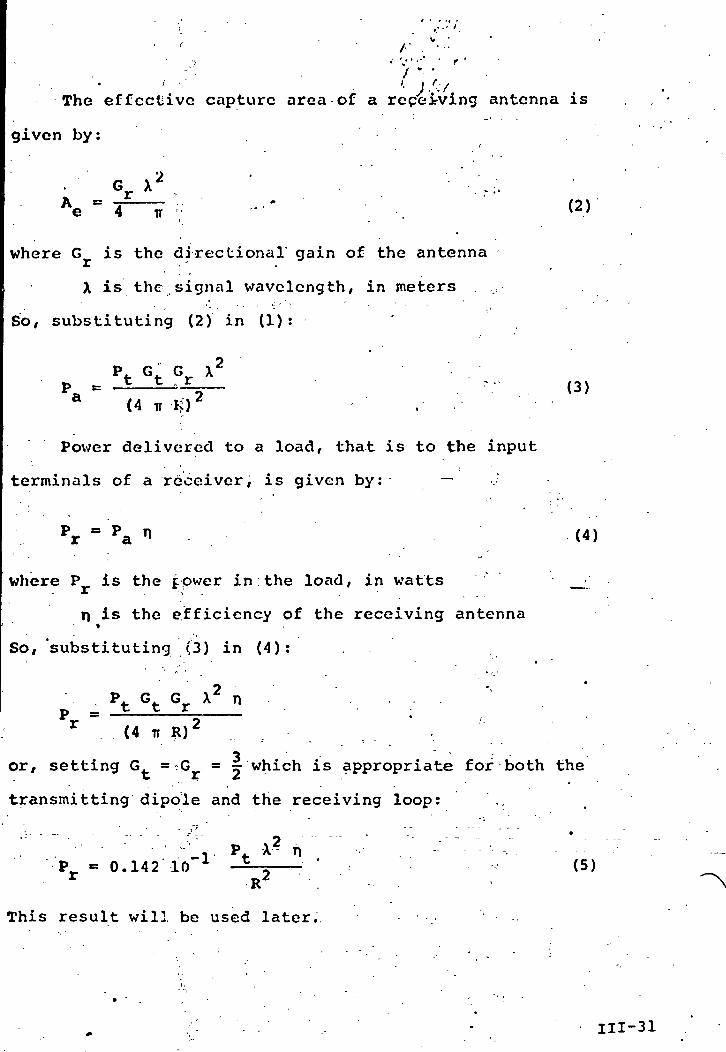
'•J/.YThe effective capture area of a rcpei-ving antenna is
given by:
• «rx2.
Ae = 4 v •"' (2)
where G is the directional' gain of the antenna
X is the signal wavelength, in meters
So, substituting (2) in (1):
P.. G. G^ X2
Pa = '2 "•" (3)a (4 TT i;r .Power delivered to a load, that is to the input
terminals of a receiver, is given by: — J
Pr e pa" (4)
where P is the power in the load, in watts r __
r\ is the efficiency of the receiving antenna
So, substituting (3) in (4):
p- _ Pt ct cr x nr . . (4 ir B)2
or, setting G = :G = which is appropriate for both the
transmitting dipole and the receiving loop:
- •P_ = 0.142 10 A -^ - ' (5)r R^
This result will be used later.
111-31
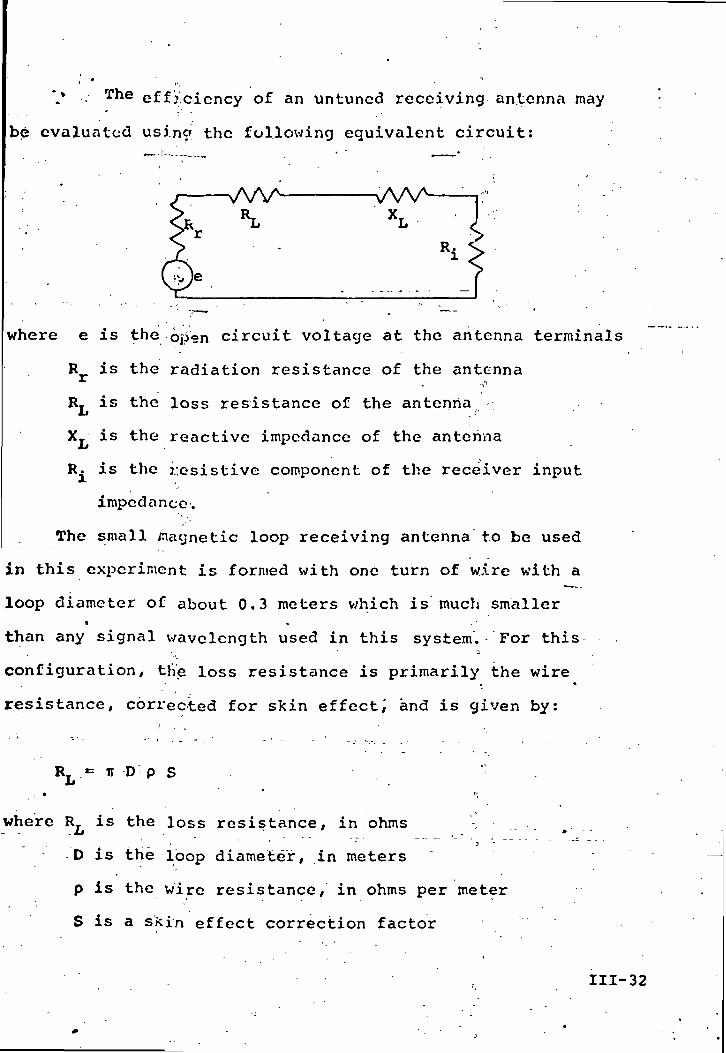
' •
•^» . The efficiency of an untuned receiving antenna may
be evaluated usincr the following equivalent circuit:
vAAAX
Ri
where e is the open circuit voltage at the antenna terminals
Rr is the radiation resistance of the antenna•V1
RT is the loss resistance of the antennaL I . ' . . ' • ' •
XL is the reactive impedance of the antenna
R. is the r.csistive component of the receiver input
impedance.
The small magnetic loop receiving antenna to be used
in this experiment is formed with one turn of wire with a
loop diameter of about 0.3 meters v/hich is much smaller• .
than any signal wavelength used in this system. For this3
configuration/ the loss resistance is primarily the wire
resistance, corrected for skin effect; and is given by:
R_ . = TT D p S ':i» ' .• ';
where R^ is the loss resistance, in.ohms . .. ' ' 3 - - - - - - - - - - - -
D is the loop diameter, in meters
p is the wire resistance/ in ohms per meter
S is a skin effect correction factor
111-32
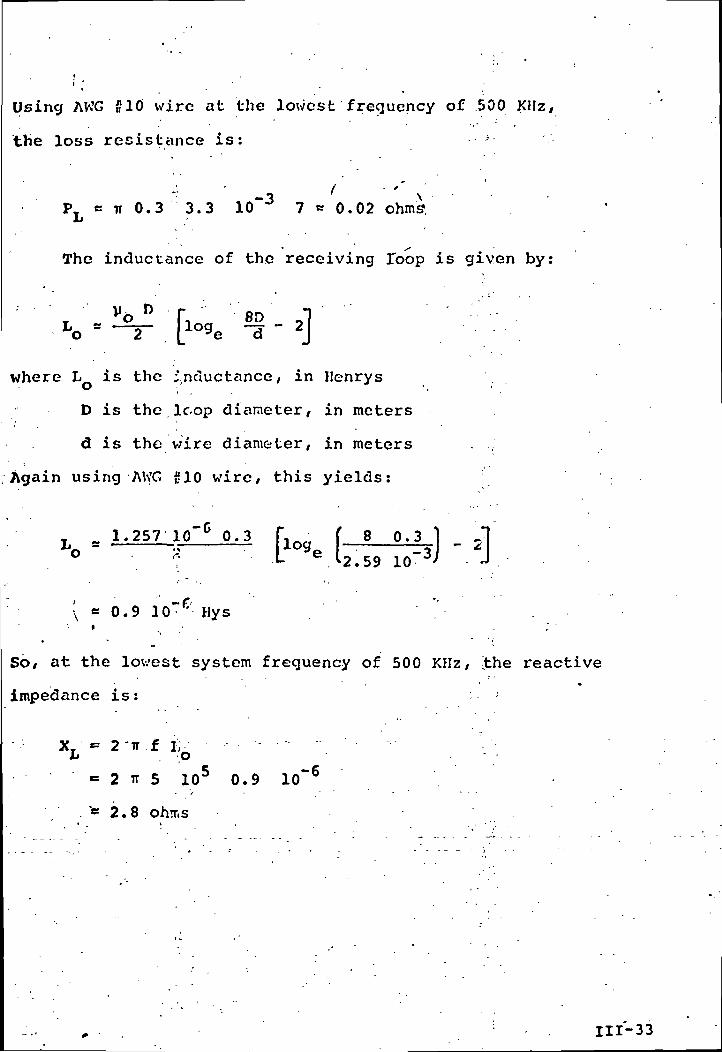
Using AWG §10 wire at the lowest frequency of 500 KHz,
the loss resistance is: -- >-
-• .3 ' ' vPT e it 0.3 3.3 10 ° 7 * 0.02 ohms5.
JL»
The inductance of the receiving loop is given by;
where L is the ;.nductance, in Henrys
D is the loop diameter, in meters
d is the wire diameter, in meters
Again using AWG £10 wire, this yields:
. 1.2S7-10-* 0.3 Plog [ 8 0.3 ] . J0 • « I "e U.5Q in-
3^ J
,-6— |iogft ]I ** A J
'2.59
\ « 0.9 10~ ' Hys .
So, at the lowest system frequency of 500 KHz, £he reactive
impedance is: '• • •
-'•• XL «= 2-ir.f i;o '•,'-
«= 2 TT 5 105 0.9 10"6'/ • " " - - - .
"c 2. 8 ohms
III-33
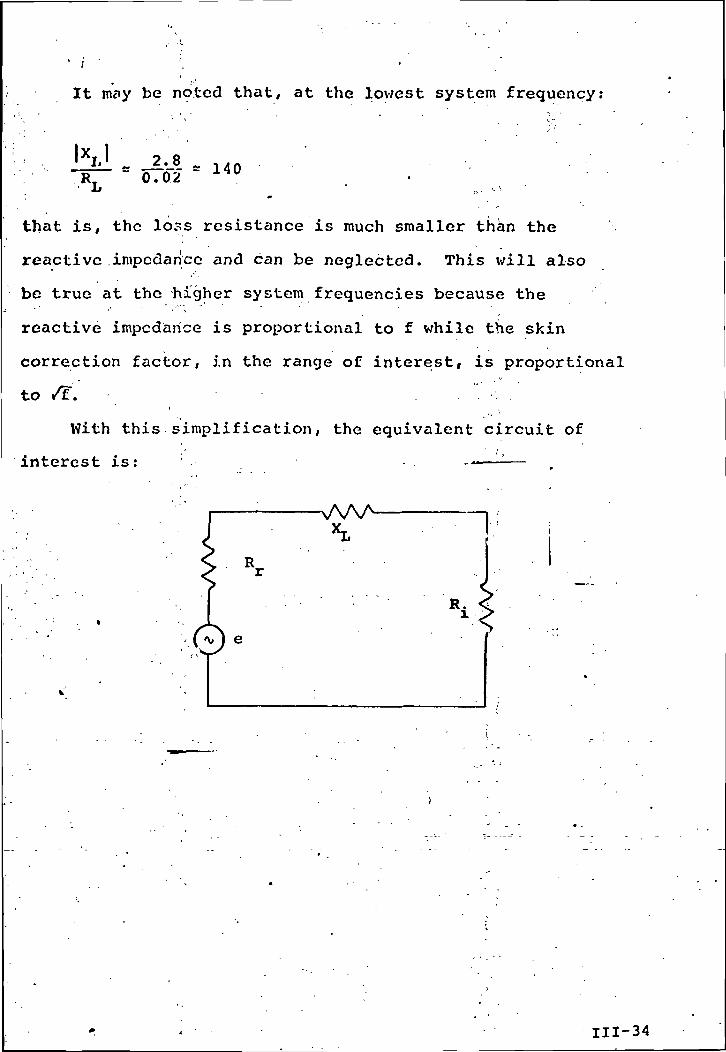
It may be noted that/ at the lowest system frequency:
JXlJ ^ __2_._80.02 140
that is, the loss resistance is much smaller than the
reactive impedance and can be neglected. This will also
be true at the higher system frequencies because the
reactive impedance is proportional to f while the skin
correction factor, in the range of interest, is proportional
to /£. •
With this simplification, the equivalent circuit ofi - '
interest is: ; .*—' —
A/\A
R
R.
111-34
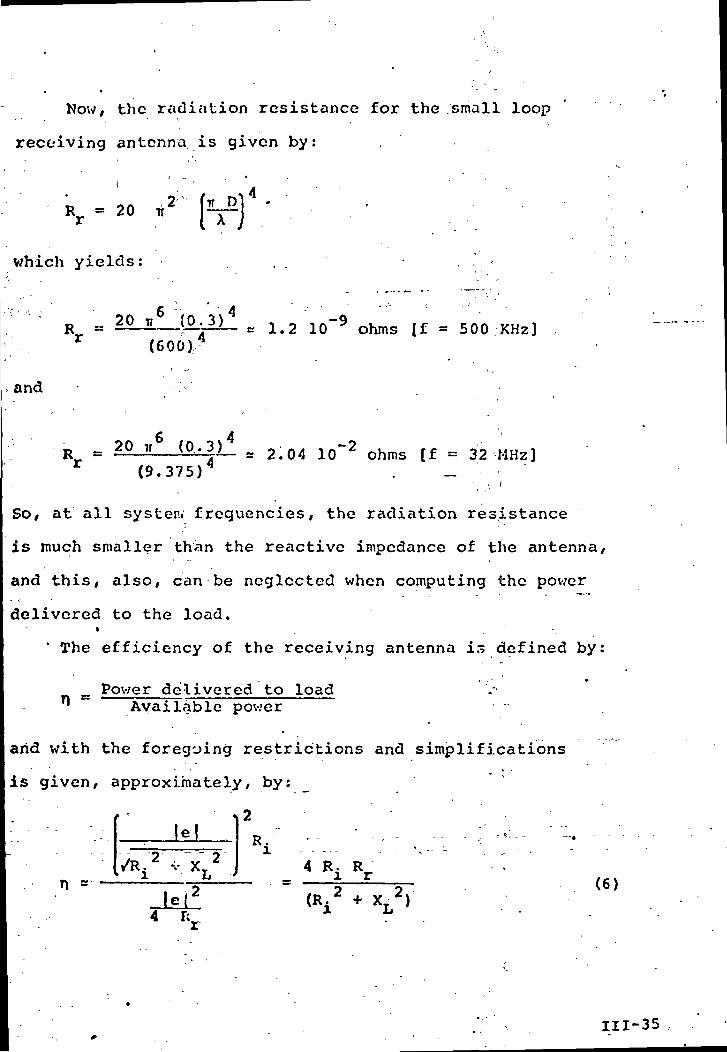
Now, the radiation resistance for the small loop
receiving antenna is given by:
j ' , " ' ' ' - • - ' ' •
Rr = 20 TT2
which yields: .
'•'""•;' 20 it6 (0 3)4 -9R = LJL *—> — * 1.2 10 y ohms (f = 500 KHz]
and
^ 6 ,n ..4 ,R = £iLJI (-^^^— * 2 .04 10 * ohms [f = 32 MHz]
(9.37.5)* . _
So, at all syster.i frequencies, the radiation resistance
is much smaller than the reactive impedance of the antenna,
and this, also, can be neglected when computing the power
delivered to the load.
' The efficiency of the receiving antenna is defined by:
_ Power delivered to load^ Available power
arid with the foregoing restrictions and simplifications
is given, approximately, by:
2
'i4 R± R
= 1—-—5- (6)(R; + X_*)
i Li • •
^— R.
4 Kr
111-35

The resistive component of the receiver input impedance
will be set equal to the magnitude of the antenna reactance
at the lowest system frequency of 500 KHz. That is:
Ri = [500 KHz] 2'8 Ohms
Using this value and substituting (6) in (5) yields the
values shown in Table 1, v;hich defines the power received
over the free space path in terms of carrier frequency,
transmitter power, and range.
fMHz)
0.5
1
2
4
8
16
24
32
A(meters)
600
300
150
75
37.5
18.75
12.5
9.375
Rr(ohms)
0..12 10"8
0.19 10"7
O..U 10*"6
0.50 10"5
0.80 10~4
0.13 10*"2
0.65 10"2
0.20 10"1
(ohms)
2.8
5.6
11.2
22.4
44 .8
89.6
134.4
179.2
n
0.85 10~9
0.54 10~8
0.25 10"7
0.11 10"6
0.45 10~6
0.18 10~5
0.40 10"5
0.70 10~5
(watts)
0:;43 10*" ^ R /
0.69 10"5 _. "
0,79 10"5
0.89 10"5
0.90 10~5 ' "
0.90 10~5
0.90 10"5 "
0.90 1Q~5 »
'.'.' . • - Table 1 . . ; . .Frequency Dependence of Receiver ' -,
Signal Input Pov/er for Free Space Path
111-36
We must also consider the relative magnitudes of
the collinear and reflected subsurface waves. It is these
two signal components that yield data regarding the
lunar subsurface through the nature of the dielectric
losses and dissipative attenuation of RF waves in the
lossy medium.
NATURE OF DIELECTRIC LOSSES
When an electric field is incident on a dielectric
medium, it can cause three types of polarizations, i.e.,
(i) Electronic polarization due to displacement
of orbital electrons
(ii) Atomic polarization
(iii) Molecular polarization
The end result is that electric flux density D (also called
displacement) in the dielectric medium is different from
the incident electric field. For the static electric case,•
it is known that
Ds = Es + 41TP = keEs (7)
where:
D is the displacement or electric flux density ins
- -the medium . . " . . ...
E. is the static electric 'fields
K is a constant (characteristic of the medium)
P is the total polarization of medium, i.e. electric
dipole moment/unit volume
111-37
When an RF ;time harmonic field E is incident,on a,.
dielectric medium, the polarization P also varies with time. > , ' , . ' -- . • • ;
and so does the, displacement D. However, at higher
frequencies P and D may lag behind in phase relative to
E and this hysteresis factor accounts for losses in a
dielectric medium as shown below.. ...._ _ ...
Let E = EQ ejwt (8)
such that displacement D is given by
D = e E e~^ (9)
where:
6 is the lag .angle between the incident field and
displacement D.
e is the per.Tiitiyity ,of the medium.
. E is the maximum amplitude of the incident RF wave
From (9),i •}'
D = (e cos 6 - j esin6) E
D = (e1 - je") E (10)E" '
such that tan <5 = —r (11)
The energy dissipated per unit volume per second in the
medium in form of neat is -----
Re(VI) dt . (12)
where RC(V) is the real part of rf voltage across unitA f1
distance = J R ^ ( E ) - d x = EQ cos tot (13)o _ "
T = ^— is the time period of the incident wave
Re(I) is the real part of the displacement current
111-38
From (12), (13), and (14), the energy dissipation
in the dielectric media is given by:
/p, i 21 ( wEo
W = \ (e" coswt-e'sinwt) coswt dt
02 "
M - W o „,;
Thus losses in the dielectric medium are dependent
on e", the imaginary part of the dielectric constant., i •
The loss tangent i'tano) is a measure of the energy dissipated
to the energy stored in the medium. Furthermore, it can
be said that both e1 (w,9) and e" (w,9) are frequency and
temperature dependent. Physical explanation is that frequency
and temperature variations create disalignment. and lag of
polarized dipoles. For a non-polar medium e' (u) remains/,
practically constant over a wide frequency range and
e" (u) is of relatively small magnitude. The losses in
the dielectric medium are ohmic in nature and can be
associated with'the conductivity, a, of the medium.
DISSIPATIVE ATTENUATION OF RF WAVES IN A LOSSY &EDIUM
A plane R.F. wave propagating in a lossy medium
in the positive z direction is represented as
E(z) = E e"jKz V - (16)
111-39
where: . "
E is the slectric field amplitude at z = 0 :'
K is the propagation constant; a cpmplex number" ' « ''
For a simple case/ it can be assumed that the
medium is homogeneous/ isotropic/ linear and ncn-magnetic.
The propagation constant K is given by
K ^ u/yT (17)
-? * ' ° "
where: •
y = y» - jy" = po for a lossless, non-magnetic medium
. e = e • - je" is the complex permitivity of the lossy
dielectric medium (18')
From (17) and (18) , ,
K = u)/yo(e'-;)£)
= w/yoT7" .-- jw y- tan6 "•-'. - ;- (19)t
where:
A e"tan 6 = loss tangent of medium = ^r
and e"«e'
Substituting
2ir « tan 6 : (20)A e . A e ,
where: : . ..... -.
k is the dielectric 'constant of mediume
X is the Zrse space wavelength
T--VJc~ is the phase constant of the mediumA e ...
tan 6 is the attenuation constant of the mediumA • e .
111-40
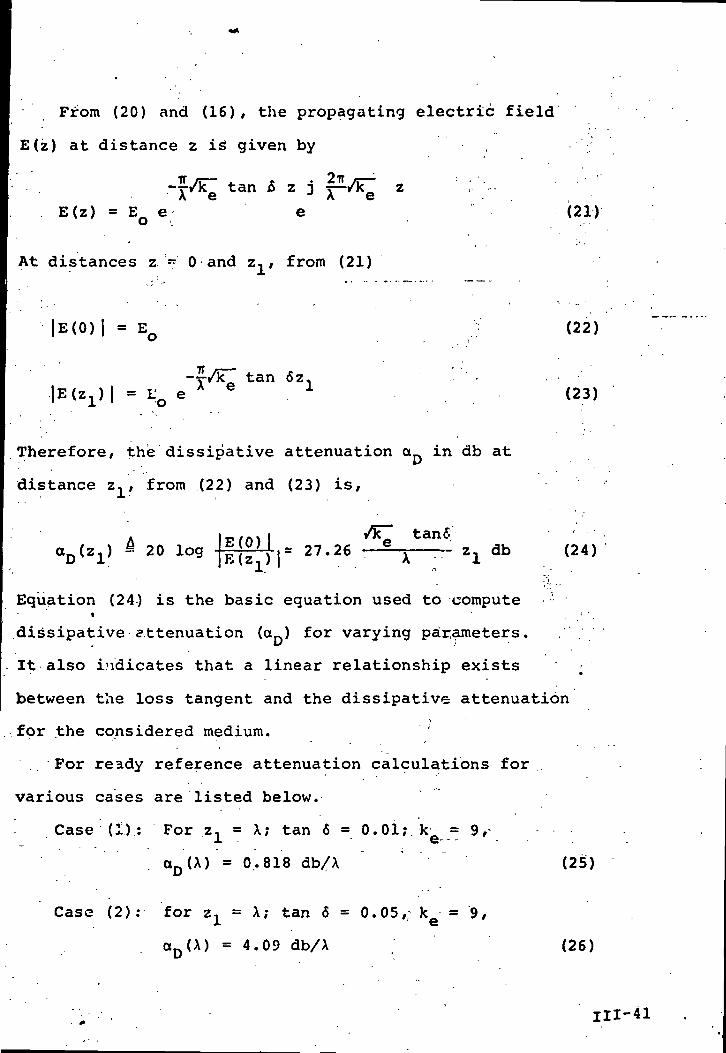
From (20) and (16), the propagating electric field
E(z) at distance z i£ given by • ,
.-J/J£ tan & z j £VK; zE(z) = EQ e e (21)
At distances z - 0 and z,/ from (21)
Therefore, the dissipative attenuation a in db at
distance z,, from (22) and (23) is,
aD(2l) 20 log
(22)
tan 6z.|E(Z;L)| = L'0 e
A e X (23)
27.26 z.db (24)
Equation (24) is the basic equation used to compute •• "' ' .
dissipative attenuation (ctD) for varying parameters.
It also indicates that a linear relationship exists ;
between the loss tangent and the dissipative attenuation
.for the considered medium. ;
For ready reference attenuation calculations for
various cases are listed below.
Case (1): For z, = X; tan 6 = 0.01; k = 9,
aD(X) = 0.818 db/X ' (25)
Case (2): for z, = X; tan 6 = 0.05,; k = 9,
aD(X) =4.09 db/X (26)
111-41
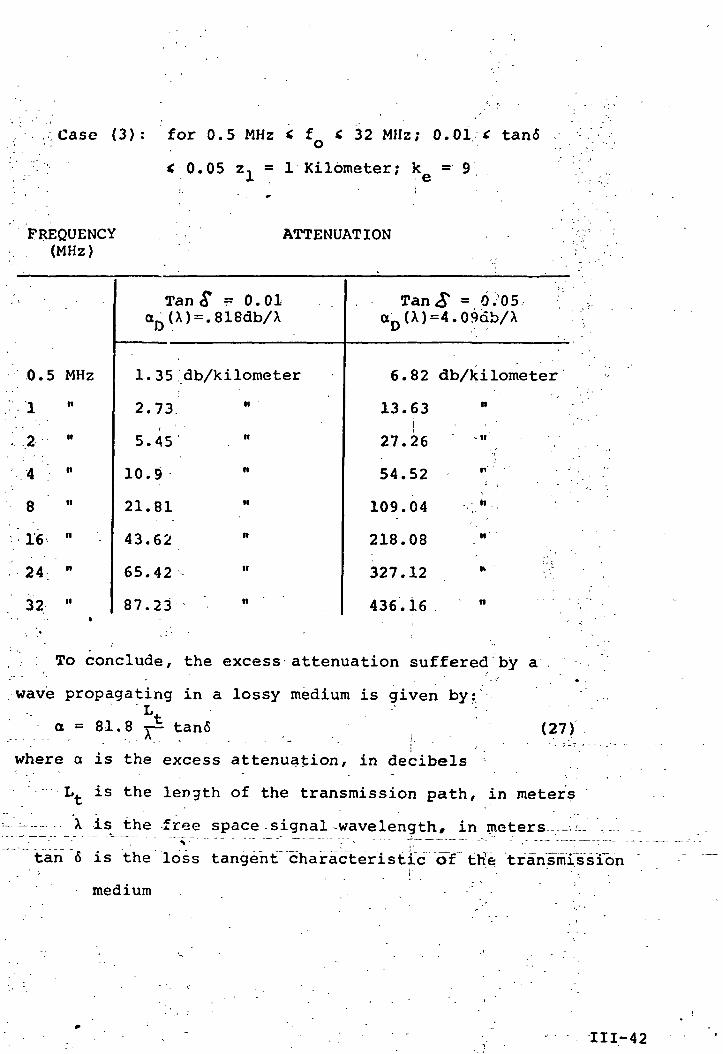
Case (3): for 0.5 MHz < f * 32 MHz; 0.01 < tan6
0.05 1 Kilometer; = 9
FREQUENCY(MHz)
ATTENUATION
0.5 MHz
1
2 "
4 n
8
16 "
24 "
32 "
Tan SaD(X)=.
= 0.01818db/X
1.35 db/kilometer
2.73
5.45
10.9
21.81
43.62
65.42
87.23
„
•'
n
n
n
ii
n
TanaD(X)
6.82
13.63j1
27.26
54.52
109.04
218.08
327.12
436.16
£ = 6; 05=4.09ab/X ! V
db/kilometer
n '
- n
n" ' • ' - -' . _
• ' * ' - ,
n
n ' .'•-
n ' ' ' ' ~,t '
: : To conclude, the excess attenuation suffered by a' - •• • .
wave propagating in a lossy medium is given by:Lta = 81.8 tan6 (27)
-------- ~. A . . . . - - . •. i. . • • .•I •-. "• : - - ; . - - - - - - - -where a is the excess attenuation, in decibels
L^ is the length of the transmission path, in meters
-- X is the free space signal wavelength, in meters -.=- , —N - ~ ~ V ~ v "~ ~ —^— _--___ -, _ . __ __ ,— __
tan 6 is the loss tangent characteristic of thTe transmissibn
medium • -" • ' '. .
111-42
It is expected that the loss tangent for the lunar material,
in situ, will range from 0.01 to 0.05; accordingly, the ',.:'.
.excess attenuation will be: i
0.818 * a * 4.09 db/wavelength (28)
.From Figure IiI-10 one can guess that the received field .
strength which is the complex interference pattern of the •'.'
surface, subsurface and reflected waves will vary as a
function of frequency, range, depth dielectric/propertiesi .
of the lunar material (both electrical and mechanical),
etc. Even the surface wave (air wave component of the
field will most likely be dependent upon the surface
terrain. Accordingly, the signal levels shown in Figures
III-ll through III-19 are only typical of what ihight be expected,
It is on these calculated results, however, that the ;
experiment configuration is based. We are currently .
working to verify these theoretical results with quantitative•
experimental data from glacier trials. , ',
111-43
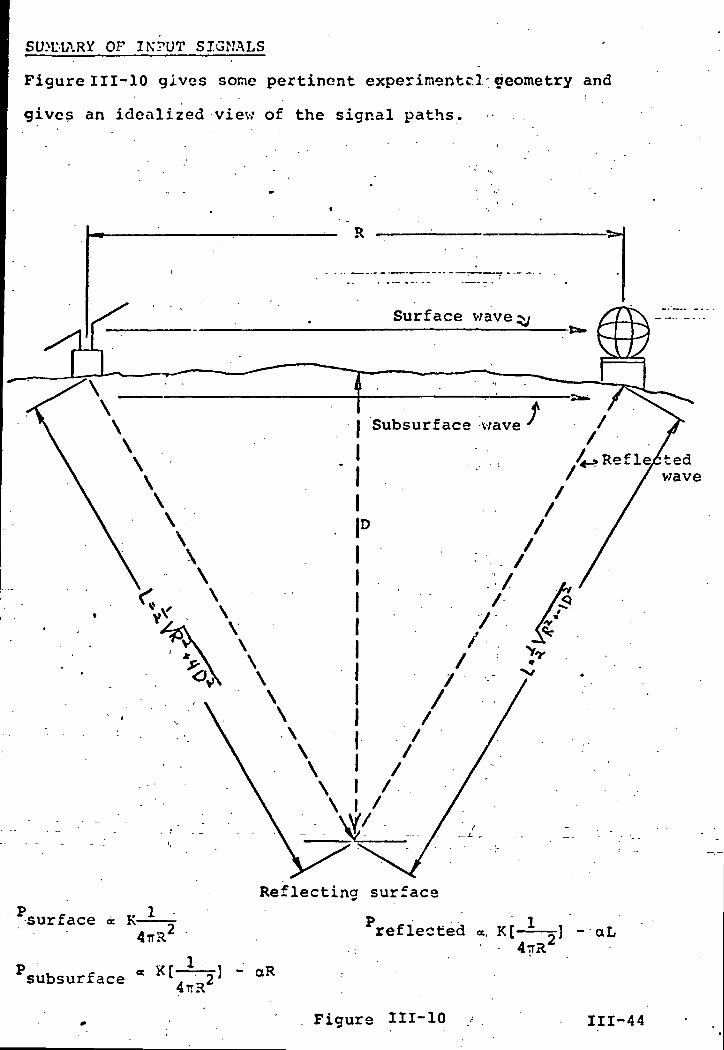
SUMMARY OF IKPUT SIGNALS
Figure 111-10 gives some pertinent experinentcl-geometry and
gives an idealized -view of the signal paths.
R
Surface wave^
Subsurface v;ave
P 1surface « K-
Reflecting surface
Preflected <*, K[ ,] - aL
* t_ c_ _ _ CC IAsubsurface - aR
Figure 111-10 111-44
Pt = 2w, 0.5 MHz, 10 jr.cter depth
Surface Wave
Reflected .Wave
tan < 5 = . C
tan.5=.05
Figure JII-11
J L JL t. L
10 100 200 400
Range (rasters)
1000 2000 4000 10000
111-45
io-8
10-9
10-10
10-12
10-14
10-16
10-18
10
Pt = 2w, f = 0.5 MHz, D = 200 meter depth
100 200 400
Range (meters)
1000 .20CO- .4000 10000
' 111-46

10-8
10-9
10-10
10-12
10-14
10-16
10-18
Pt = 2w, 0.5 MHz,- 1000 meter depth
Surface Vlave
Reflected Wave
100 200 400
Range (meters)
10CO 2000 4000 100CO111-47
10-8
10-9
10
10-i;
10-16
10-18L
2 MHz, .Pt = Iw, 10 meter depth
Reflected Wave'.
Figure 111-14
10 100 200 4CO
Ra'hije (r.etcrs)
1000 j.2000 4000 10000/ 111-48
10-8
10-9
10-1C
10-12
10-14
10-16
10-18
2 MHz, Pt = Iw, 200 meter depth
Surface VTave
Reflected
- Figure 111-15 tan 5=.05
_L _L
10 100 200 400
Range (r.eters)
1000 2000 4000 1000.0111-49
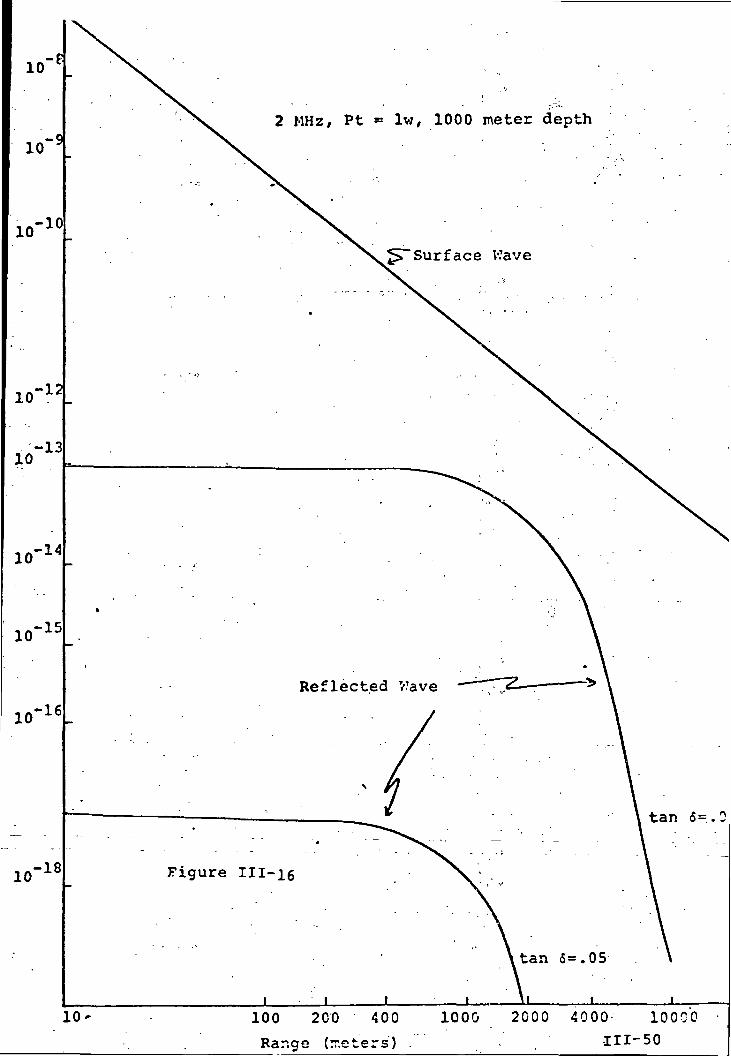
2 MHz, Pt = Iw, 1000 meter depth
Surface Wave
Reflected Wave
100 200 400 1000
Range (rr.eters)
2000 4000 10000
111-50
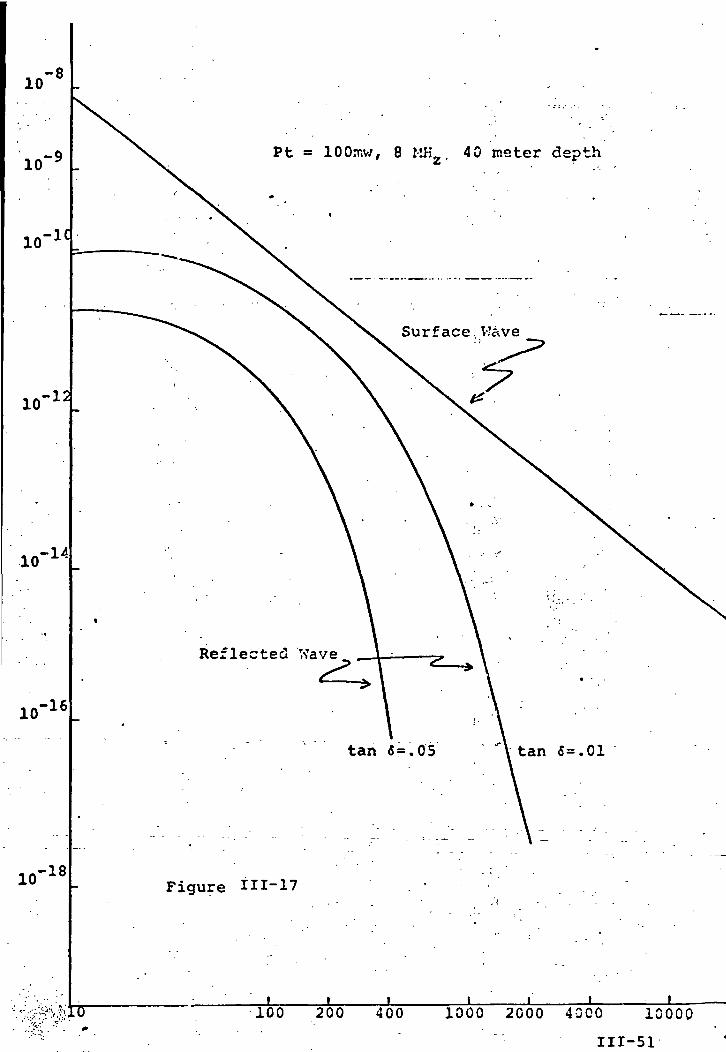
10-8
10
10-1C
10-12
10-14
10-16
Pt = lOOmw, 8 MK 40 meter depth
Reflec
tan 6 =
10-18 Figure ±11-17
_L J_ _L JL JL _L JLnr 100 200 400 1000 2000 4000 10000
111-51
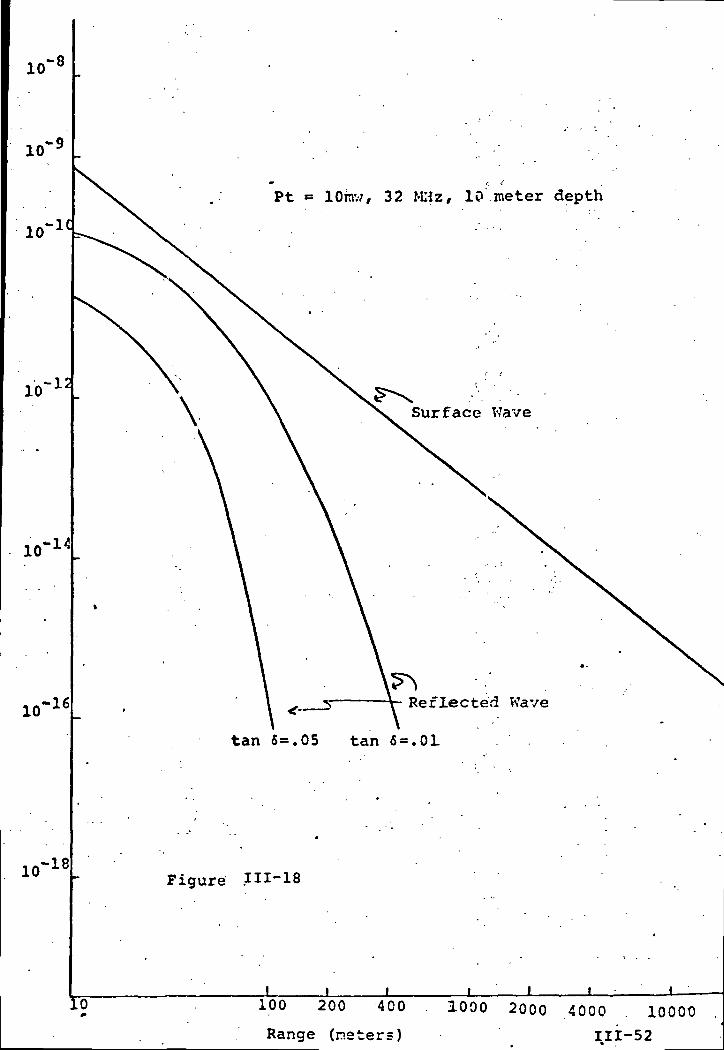
10-8
10-9
10-1C
10
10-16
Pt = lOinv;, 32 MHz, 10 meter depth
Reflected Wave
tan 6=.05 tan 5=.OL
10-18 Figure 111-18
J ! L ' ' L10 100 200 400
Range (neters)
1000 2000 4000 . 10000
111-52
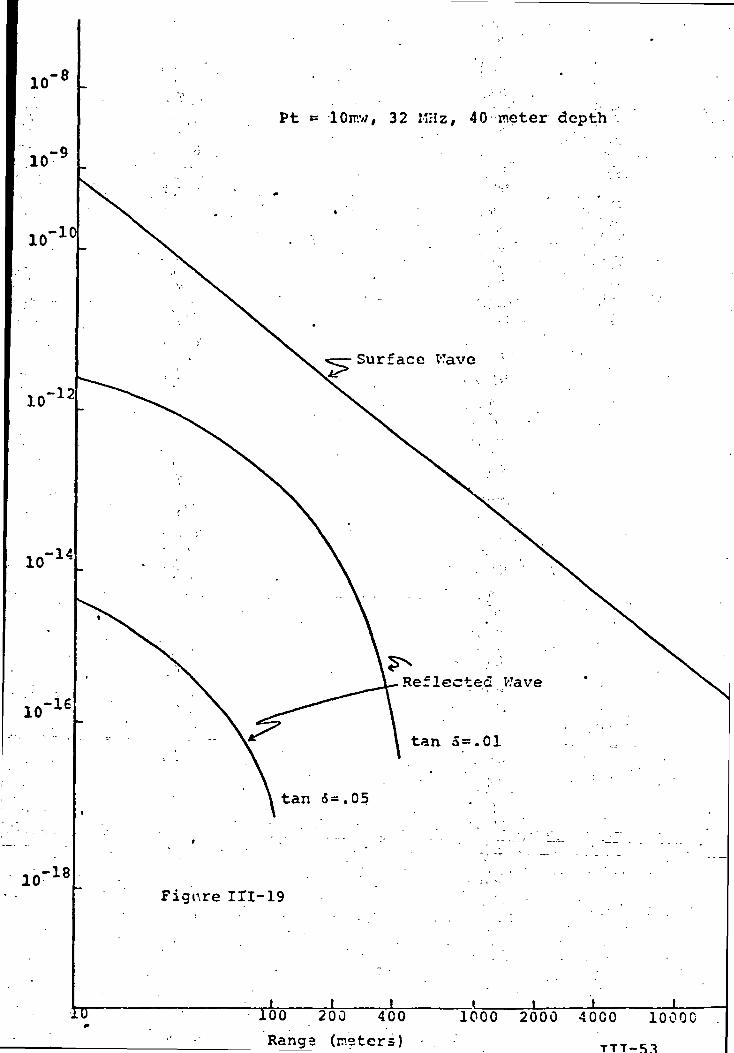
Pt = 10ir.w, 32 MHz, 40 meter depth
ave
100 200 400
Range (neters)
1000 2000 4000 1000C
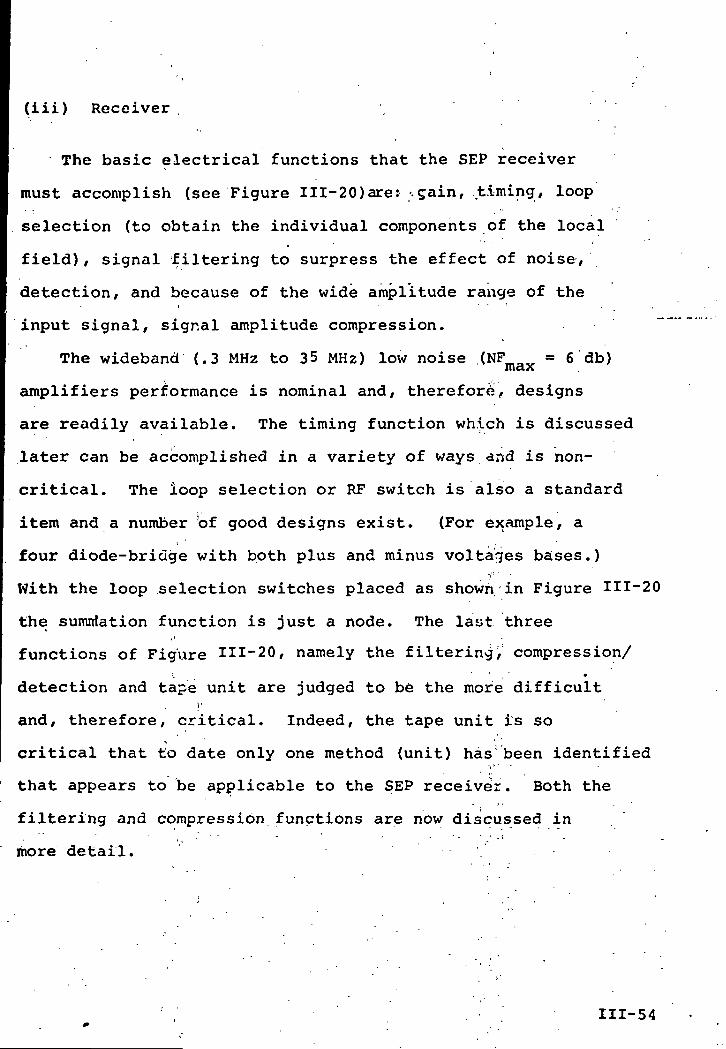
(iii) Receiver
The basic electrical functions that the SEP receiver
must accomplish (see Figure III-20)are: -.gain, timing, loop
selection (to obtain the individual components of the local
field), signal filtering to surpress the effect of noise/
detection, and because of the wide amplitude range of the
input signal, signal amplitude compression.
The wideband (.3 MHz to 35 MHz) low noise (NFmav = 6 db)IUaX
amplifiers performance is nominal and, therefore, designs
are readily available. The timing function which is discussed
later can be accomplished in a variety of ways and is non-
critical. The loop selection or RF switch is also a standard
item and a number !of good designs exist. (For example, aI r
four diode-bridge with both plus and minus voltages bases.)V1
With the loop selection switches placed as shown in Figure 111-20
the Humiliation function is just a node. The layt three
functions of Figure 111-20, namely the filtering, compression/;, ' _ ' •
detection and tape unit are judged to be the more difficulty
and, therefore, critical. Indeed, the tape unit is so
critical that to date only one method (unit) has been identified
that appears to be applicable to the SEP receiver. Both the
filtering and compression functions are now discussed in
more detail.
111-54
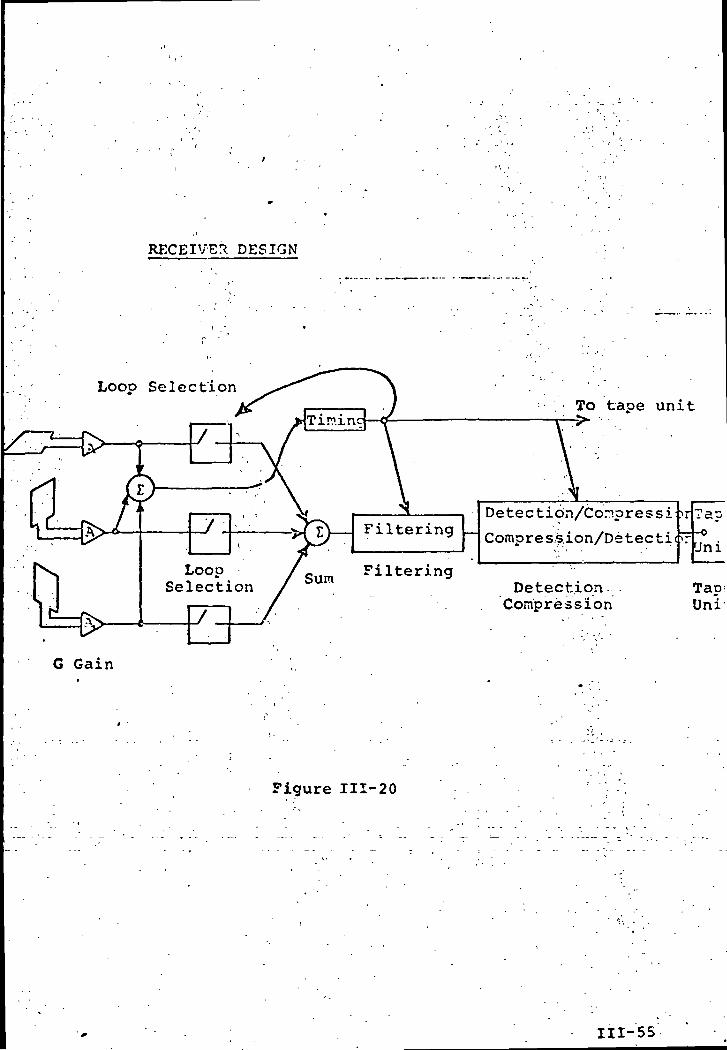
RECEIVER DESIGN
Loop SelectionTo tape unit
G Gain
Figure 111-20
Detectidn/Conpressi
Compression/Detecti
DetectionCompression
rJni
Tap;Uni
111-55
FILTERING;
It is prudent/ in view of the lack of definitive
information regarding the-LRV noise spectrum to limit as
much as practicable the in-band noise. Fortunately, the
experiment signals are discrete frequencies transmitted in
time sequence/ and the experimental configuration has been
defined such that the various modulating (amplitude and
frequency) phenomena are shown varying so that ,the receiver
signals may be processed through very narrowband filters
(=300 Hz).
There are two (known to me) ways of obtaining very
.narrowband pass .filtering with low insertion loss: either
use crystal filters or a phase lock loop. In our originalji
proposal/ we chose the crystal filters because phase locked:', ,
loop tend to become rather complex when dealing (as we are)
with a nhilti-frequency signal that is widely varying in
amplitude. We.have/ by now, studied both systems in some'' : •
detail and conclude that the crystal filter is the best
solution considering the tight time schedule with which
we are now constrained.''tt
Figure m-21 shows three methods of connecting the crystal
filters. The connection of m-21a represents the simplest
hence more reliable. The connection of in—21b has superior
noise performance because the signal of the connected filterj
is not degraded by the noise content in the pass bands of
the other seven. At higher signal levels the connection of
' . , 111-56
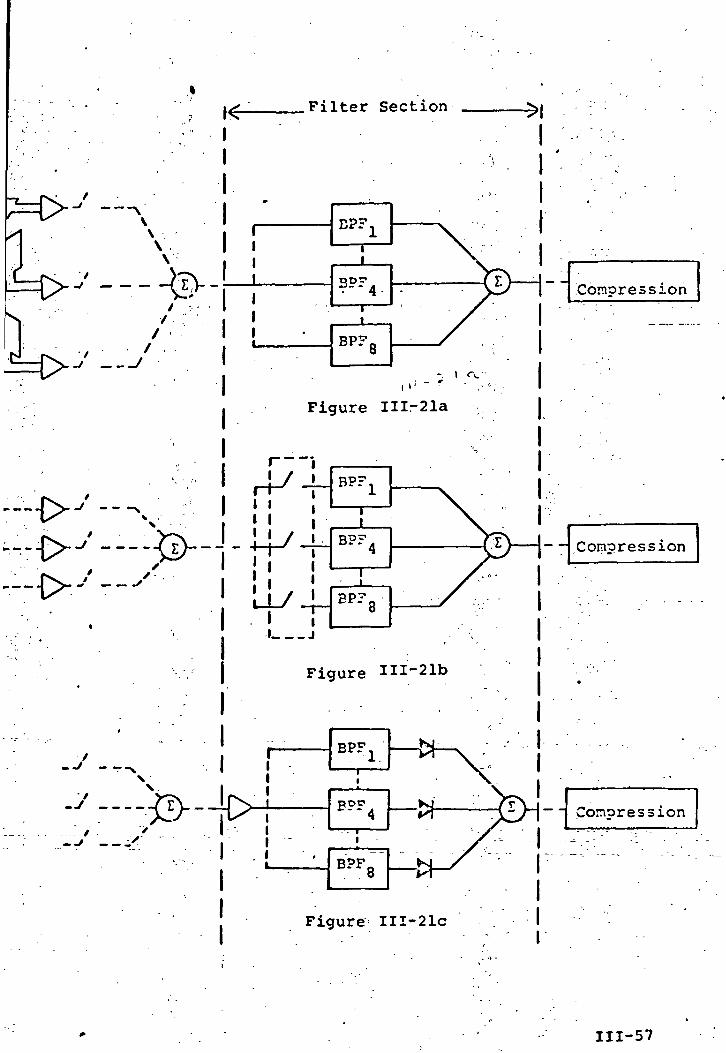
Filter Section
Figure III-21a
Figure IH-21b
-o-
Conoression
Figure III-21c
Compression
Conor e s sion
111-57
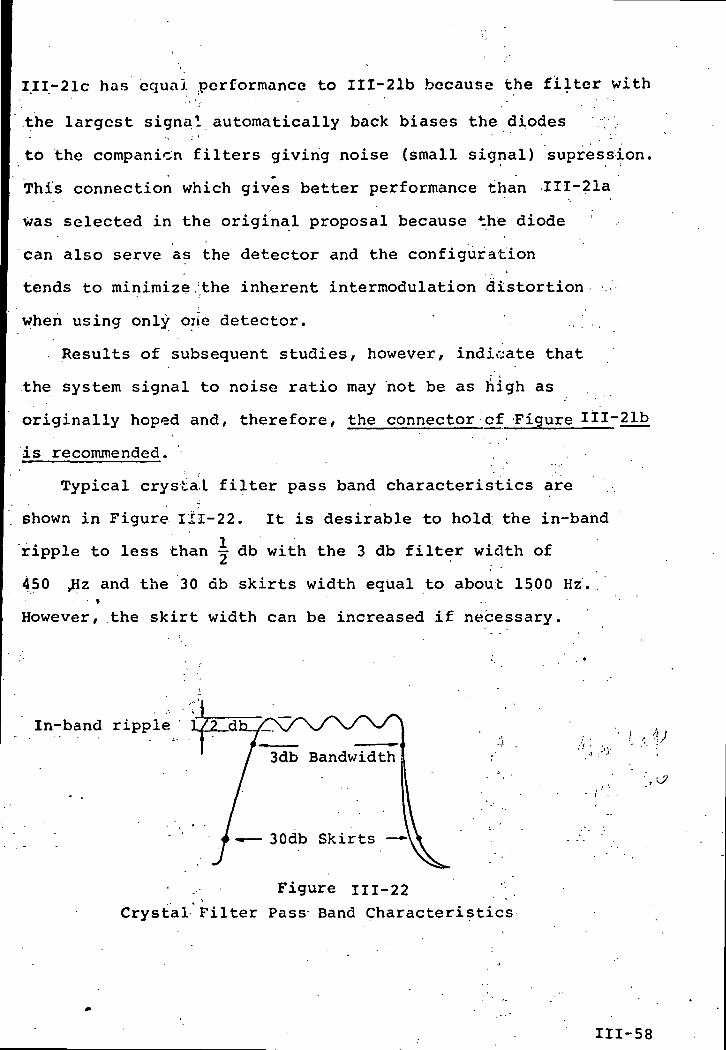
III-21c has equal performance to III-21b because the filter with
.the largest signal automatically back biases the diodes ;
to the companion filters giving noise (small signal) supression.• • *
This connection which gives better performance than III-21a
was selected in the original proposal because the diode
can also serve as the detector and the configuration
tends to minimize/the inherent intermodulation distortion -.
when using only oiie detector.
Results of subsequent studies/ however, indicate that
the system signal to noise ratio may not be as high as
originally hoped and, therefore, the connector of Figure III-21b
is recommended. '•- . ,
Typical crystal filter pass band characteristics are
shown in Figure 111-22. It is desirable to hold the in-bahd
ripple to less than j db with the 3 db filter width of
450 ,Hz and the 30 db skirts width equal to about 1500 Hz..• •
However, the skirt width can be increased if necessary.
In-band ripple 1/2 dL _ _
•i •.•-•
• ..- Figure m-22"* *
Crystal Filter Pass Band Characteristics
111-58
COMPRESSION TECHNIQUES;
Basically what, is to be accomplished in a compressiont .
amplifier is to, design a transfer function that will8 'compress the input signal range of about 10 to some small
range say 1 to 5 volts or for the SEP receiver cause the>
VCO in the tape unit to vary from approximately 300 Hz to
3000 Hz. Figure ui-23 gives the mathematical relationship.
Incidentally, the results of Figure m-23 show that a one8percent reading in a 10 range requires the results from
the tape recorder to be read to a precision of 1.458 Hz
which would seem to be incompatible with the presently
contemplated tape unit. However/ this difficulty can
be overcome somewhat by coding the information irjto
several 300 Hz to 3000 Hz bands where each band is
recorded at a different amplitude.
In general, the three methods (systems) for accomplishing•
logarithmic compression are: (1) a DC or base band
system using operational amplifiers; (2) a low frequency
carrier system, and (3) a high frequency carrier 'system.
For the SEP receiver application, each system has some
merit so each are now briefly discussed. .
DIRECT COUPLED SYSTEM; . '_ "'.. ~- - ;' ' .
This system was used in .the original proposal in the
form of a low frequency amplifier (DC to 3000 Hz) system
111-59
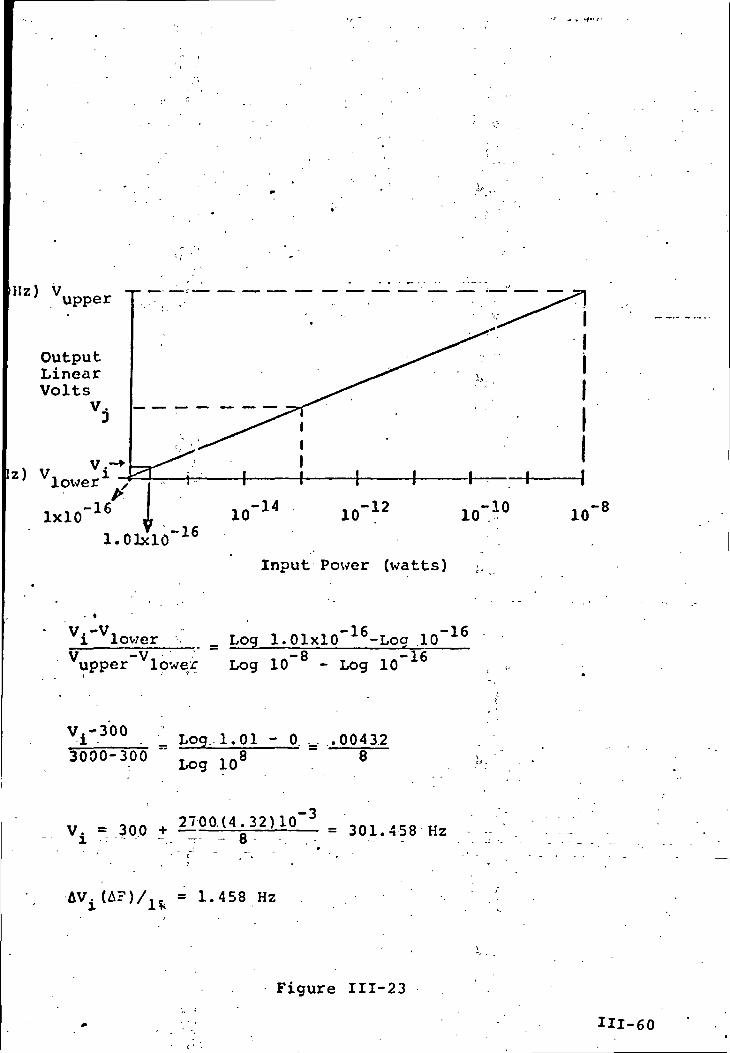
Hz) Vupper
2>
1x10-16
1.01x10-1610 " 10 " 10
Input Power (watts) i.
10
Vi"Vlower _ Log 1.01xlo"16-Log 10"16
V -V •'" "~ -8 -16upper lower Log 10 - Log 10
Vi'300 . _ Log.. 1.01 - 0 _ .004323000-300 8
y = 300 + 1100(4 32)10-3 = 301.458 H2i • - ~ -~ ~~ o '. , - -
AVi(A?)/1?. = 1.458 Hz
Figure 111-23
Hl-60

using operational amplifier and resistor feedback in a
piece-wise linear approach.* This technique is standard
when a non-linear transfer function is needed withr\ ; *• " ' .
operational amplifier. Diodes are required, however, and,
therefore, the break points are difficult to temperature
compensate. One way of getting around this difficulty
is to make the output swing so large that the diode
threshold is negligible by comparison. However, for this
8application where the required compression range (10 ) is
larger than we had originally thought necessary and low
power drain is more important due to the longer EVA duration,
we now recommend that the carrier scheme be used.
LOW FREQUENCY CARRIER SYSTEM;
r - ' " ' .
Figure III--24 shows one method of implementing a low
frequency AC (carrier) compression amplifier. If the
input signal is very small, only the last amplifier in*
the chain is saturated. As .the signal increases in
amplitude successively earlier state saturate (limit) and
the output is formed from each stage properly "weighted"
with a ladder network to give a logarthmic response. This
concept is valid over a range of frequencies limited by
the value of the'coupling capacitor at the low'end
* "Electrical Surface Properties Proposal," October 23, 1969,Figure III-9..
111-61
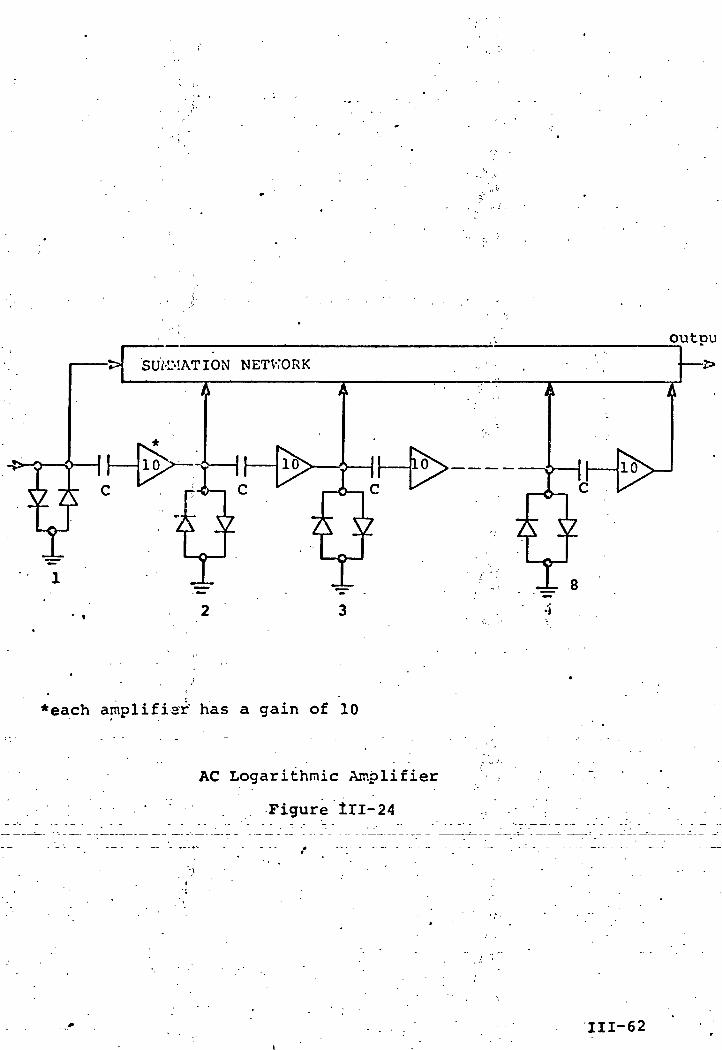
outpu
SUMMATION NETWORK
*each amplifier has a gain of 10
AC Logarithmic Amplifier
Figure tlI-24
111-62
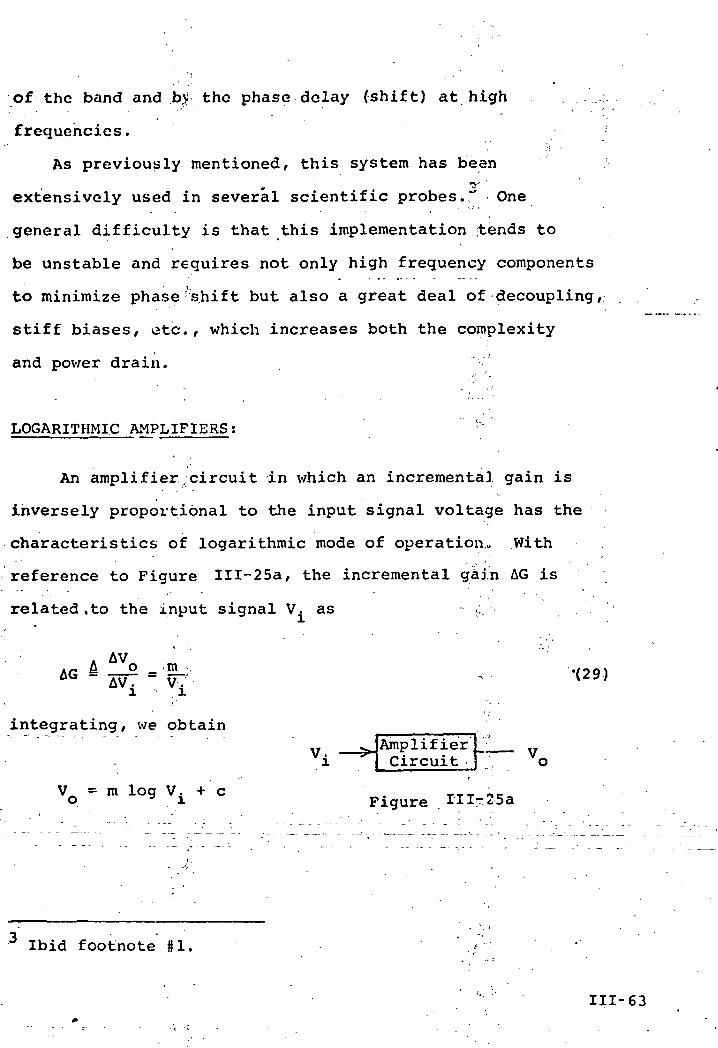
of the band and by the phase delay (shift) at high
frequencies.
As previously mentioned, this system has be^n**' '
extensively used in several scientific probes." One
general difficulty is that this implementation tends to
be unstable and requires not only high frequency components
to minimize phase'shift but also a great deal of decoupling/
stiff biases/ otc., which increases both the complexity
and power drain.
LOGARITHMIC AMPLIFIERS; s "
An amplifier;circuit in which an incremental gain is
inversely proportional to the input signal voltage has the
characteristics of logarithmic mode of operation* With
reference to Figure III-25a/ the incremental gain AG is
related ,to the input signal V. as ...
AG 8 o _ mAV. - V. '(29)
integrating/ we obtain
V = m log V. + co i
ViAmplifierCircuit
Figure II I* 25 a
Ibid footnote fl,
111-63

where c = constant of integration '
V. and V , = are input and output voltages .respectively
m = slope of the curve
Three main circuit design approaches are available to
correlate the input and output voltages logarithmically in
order to achieve high dynamic range capability.. These approaches
are, . . . . . °
(1) Non-linear feedback circuits (piece-wise linear)
(2) Circuits using non-linear loads (Reference #1)
(3) Successive detection circuits
The first two which have been discussed and the
successive detection method is commonly used for high^
frequency logarithmic compression amplifiers.
1 i
DESCRIPTION OF SUCCESSIVE DETECTION METHODI ,
Fig'ure III-25b describes the typical functional diagram of
a logarithmic amplifier circuit using a successive detection, •
approach wherein A's are the amplifier stages/ D's are the
detector stages feeding the delay line.
The individual output of each detector stage is shown
in the lower portion of Figure III-25c. Since the time delays
in each delay section are the same as those of amplifier
stage/ the output sun -is as-shown—in upper portion of-, - .r
Figure III-25c/ v/hereby the input and output voltage bear a
logarithmic relationship. . . . .
111-64
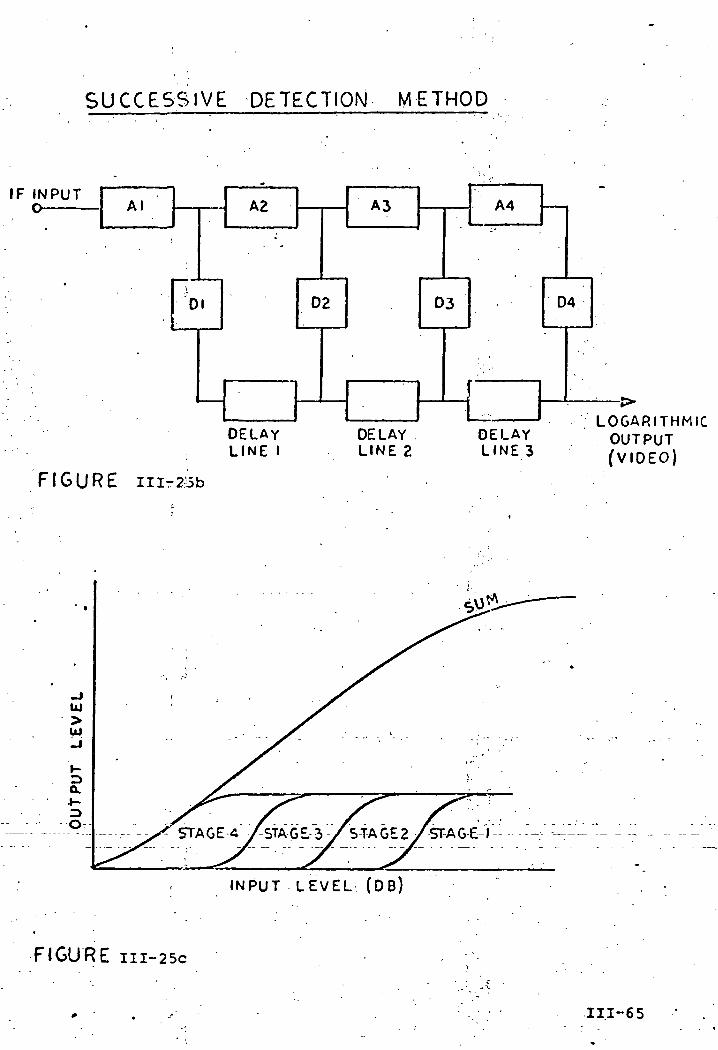
SUCCESSIVE DETECTION METHOD
IF INPUTO Al
FIGURE
A2
01 02
DELAYLINE I
A4
04
DELAYLINE 2
DELAYLINE 3
LOGARITHMICOUTPUT(VIDEO)
>UJ
STAGE A /STAGE-3 / 5-TAGE2 /STAGE |
INPUT LEVEL (OB)
FIGURE III-25C
111-65 ' .
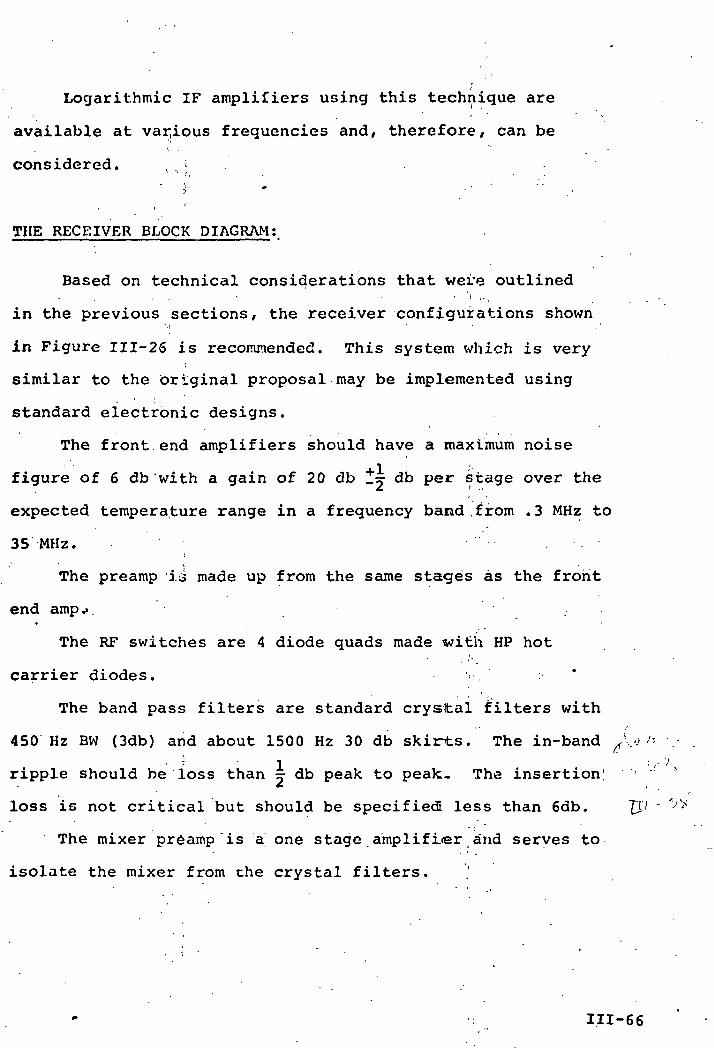
Logarithmic IF amplifiers using this technique are
available at various frequencies and/ therefore/ can be
considered. , ,'; --} *
THE RECEIVER BLOCK DIAGRAM;
Based on technical considerations that wei'e outlined
in the previous sections/ the receiver configurations shown
in Figure 111-26 is recommended. This system which is very
similar to the original proposal may be implemented using
standard electronic designs.
The front end amplifiers should have a maximum noise
figure of 6 db with a gain of 20 db tj db per stage over the
expected temperature range in a frequency band from .3 MHz to
35 MHz. .
The preamp is made up from the same stages as the front
end amp.-.
The RF switches are 4 diode quads made with HP hot
carrier diodes.
The band pass filters are standard crystal filters with
450 Hz BW (3db) and about 1500 Hz 30 db skirts. The in-band ^U>
ripple should be loss than =" db peak to peak. The insertion!
loss is not critical but should be specified! less than 6db. "p./
The mixer preamp is a one stage amplifier and serves to
isolate the mixer from che crystal filters.
111-66
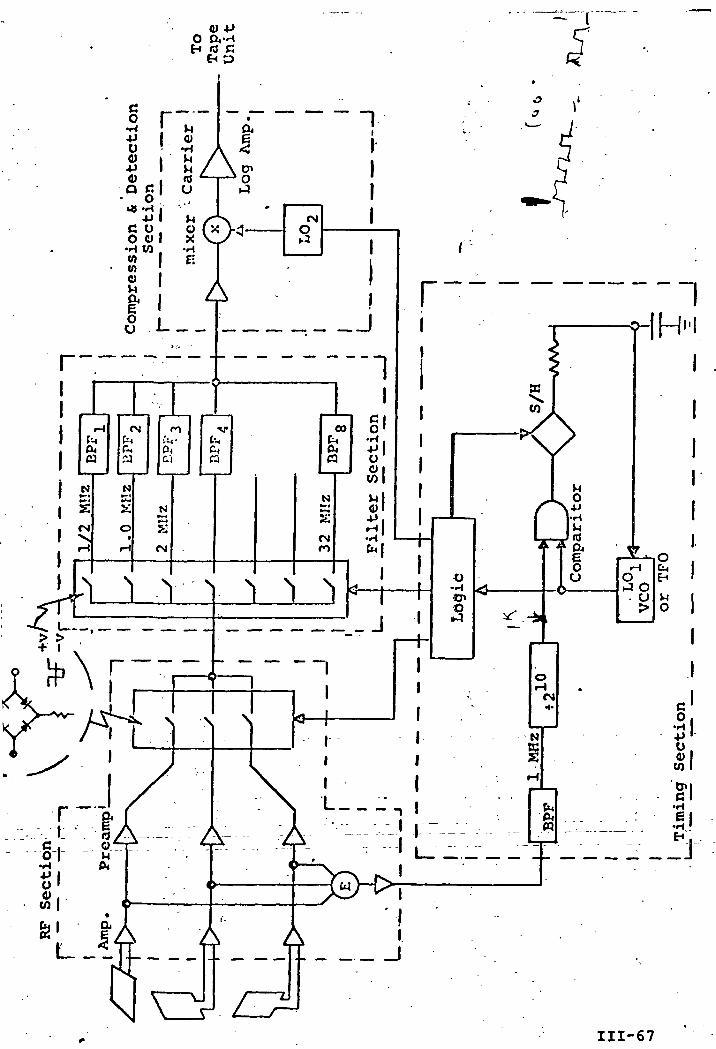
^2s
_!
111-67

The operating frequency of the logarithmic amplifier
and its companion local oscillator is not critical and the
choice should be .governed by performance and delivery of
-qualified comme'rical designs. *
The receiver timing may be accomplished in a number of
ways the exact system choice should be based oh simplicity
of components. The RCS proposed timing system would appear
to be overly complex, but it would certainly suffice. I
believe the systeca indicated in Figure .111-26 is simpler.
Functionally, the timing section must generate the necessary
control signals to sequencially switch the three loop
antennas, the band pass filters and the proper localc
oscillator synchronously with the transmitter. Analysis
of the timing error analysis indicated that without'i
^synchronization in the required stability of the local
oscillator (LO#lj would be one part in 10 per day with
* 7a frequency offset of one part in 10 . We believe that
to obtain this offset would require a crystal oven and.,
should be, therefore, avoided. The feedback loop shown
allows direct frequency comparison with .the transmitterM
1— •
one per second and should.suffice. , .
III-68
c. Tape Recorder !
A typical late Apollo mission could involve three
EVA's, each of six-hour "duration,-with traverses lasting
four or five hours. A minimum of ten hours of recording
time is desired to allow the receiver to operate without
attention during two traverses. .
For this application, power consumption .and operating
time directly affedt battery weight. Since a relatively
long operating time is desired, power consumption should
be small. Additionally the recorder should be small and
light-weight, it should contain enough tape so that tapes
need not be changed, and it should be sealed to maintain*
a proper environment for the mechanical parts and lubricants,
Provisionally, the tape recorder selected"to meet
these requirements is the Leach 11-14000 Data Storage•
Electronics Assembly (DSEA). This unit was designed as
a voice recorder for use aboard the LM, and has been•
qualified for use in the LM and for return to earth in
the CM cabin'environment. The unit is used in the Lunar .
Module to record voice-keyed audio with superimposed
time information. A reference frequency is recorded for
operating the speed-control servo in the reproduce
transport.
(i) Specifications .
Specifications for the existing, qualified, tapec
III - 69
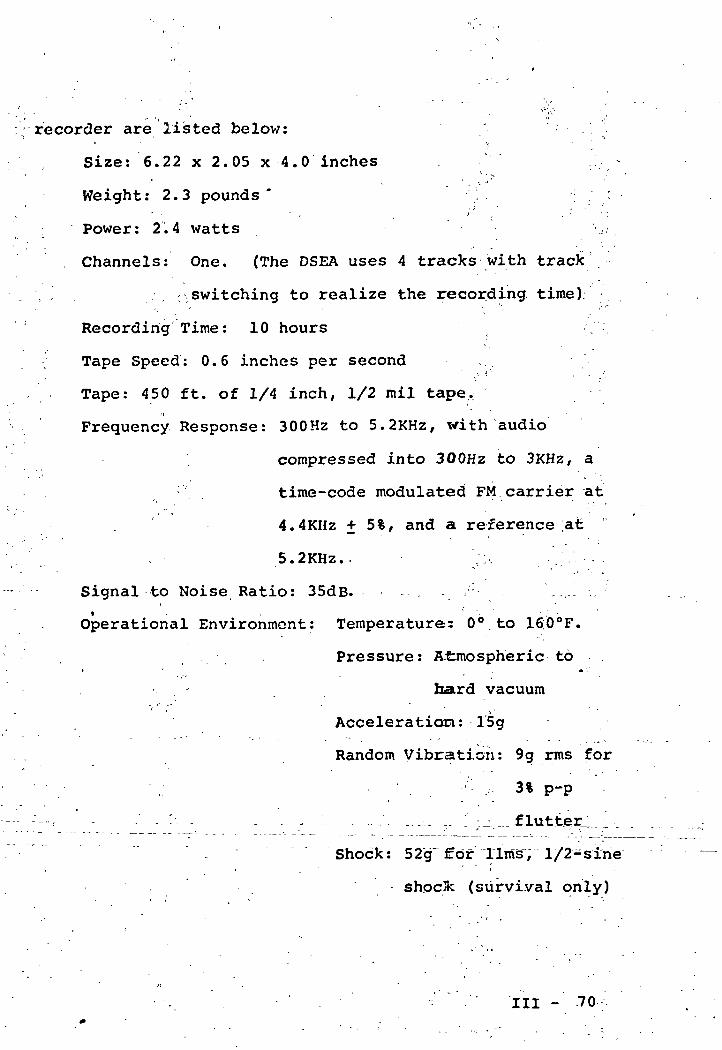
recorder are listed below:
Size: 6.22 x 2.05 x 4.0 inches ^
Weight: 2.3 pounds" : :i j ,
: Power: 2.4 watts
Channels: One. (The DSEA uses 4 tracks with track
; .switching to realize the recording time)
Recording Time: 10 hours
Tape Speed: 0.6 inches per second
Tape: 450 ft. of 1/4 inch, 1/2 mil tape.;
Frequency Response: 300Hz to 5.2KHz, with audio
compressed into 300Hz to 3KHz, a
: time-code modulated FM carrier at
4.4KHz + 5%, and a reference at
5.2KHz. V;
Signal to Noise Ratio: 35dB. ,
Operational Environment: Temperature: 0°_to 16;0°F.
Pressure: A.tmospheric toi • , • " • . '
. j hard vacuum
Acceleration: 15g
Random Vibration: 9g rms for
,- 3% p-p: . . . : . . . . , : . . _ _ ' . ...... „ ' i_...... flutjt.e.r_i..i-.
- Shock: 52g^fdr Tims, 1/2-sine
(survival only)
III - 70

Non-Operational Temperature: -20°F to 160°F
Start Time: 50 milliseconds ;,'.
Track Switching and Reversal Time: 100 milliseconds ,i
Life: 5000 hours.
Storage: 5 years, provided recorder is operated at
least once every 120 days for a -minimum
of bne minute.
Survival Probability for 10-hr, mission: 0.9998
(ii) Operation :
Once loaded and initialized for operation, the DSEA
operates automatically for up to 10 hours, with track ;
switching and tape motion reversal accomplished by logic .
circuitry using latching relays. Track switching at the
end of each of the 2.5 hour passes occurs in less than
100 milliseconds. The latching relays provide a memory
function and ensure that recording will resume on the
same track in the same direction after a power interruption
so that no special attention need be given the, tape unit
before or after the shut-down between traverses^
An indication of recorder operation is given by a '
tape motion amplifier which provides a relay closure when
signals .are sensed on the tape in the range of 300Hz to.
3KHz; this signal may be used to drive a go/np-go indicator,
since the VCO will continuously supply a signal to the
recorder regardless of the received signal strength.
'/ -; t
. Ill - 71
,;(iii) Data Retrieval • .,., .
Following the final traverse, the recorder is removed
from the receiver package and returned to earth. No :
attempt at handling the tape magazine need be made and> ) . ' , *
the seal need riot be opened/ alleviating the problems of
dust and mishandling. The weight of the recorder is small
(2.3 Ib.) and the recorder itself serves as a protective>
carrying case "for the return trip. This procedure is
essentially the same as that used to return the LM's
PSEA, and experience has indicated that the tape is
suitably protected by the recorder.
(iv) Preflight and Postflight
The DSEA is intended for use as a recorder only,
although a monitoring signal is available for each tape
track. Playback after recording is done with a reproduce
.transport in a testtset provided by the manufacturer; .
Leach, NASA/MSC'and KSC have playback equipment for the
DSEA as configured for the LM, so it is obviously
desirable to maintain interface compatibility!.,
"." " " " The DSEA is tested by recording a test tape magazine-
for playback in the reproduce transport. Following test, .
a clean tape magazine is installed, the head shield
.realigned',. and _the_"DSEA "is sealed using ~aT f're's'jV'O'- ring "- ""
and a coat of sealant. A 'reset1 pulse is applied to set .
the control logic to track 1 forward (this need be done :
III'- 72

•only on the ground) to prepare the recorder for operation;
After the fourth pass is completed the DSEA will stop until
another reset is applied; thus preventing overwriting of
data.
(v) Modifications
The DSEA will work in this application with minimal .
modification; indeed it will operate satisfactorily with
no modification at all, although a few simple changes may
be desirable.
Since the voice operated keying feature of the DSEA is
not required in this application, it may be desirable to "
eliminate this feature to save some weight and power• .x '.' . •
consumption.
The input power level required for the existing DSEA is
115 volts, 400 Hertz; this is transformed down to 26 volts to
:operate* the drive motor. Since this input power must be
provided by a battery driven inverter in the experiment, it
may be desirable to modify the DSEA to accept 26 volts, 400i
Hertz directly.
Discussions with the manufacturer of the 'DSEA, are
continuing to define the desirability of those and other
minor modifications which can be accomplished without
'requiring" extensive requalification. •----
-y
III - 73
III-2. Envelope Descriptioni-
The experiment package consists of two assemblies,
a transmitter (assembly J) and a receiver (assembly II).
Before deployment the transmitter assembly contains the
transmitting antennas on four reels, and the 'receiver
assembly contains the receiving loops folded in a flat
configuration. , The transmitter is to be deployed a short
distance from -,the LM and the receiver may be mounted on
the Mobile Equipment Transport, on the Lunar Roving
Vehicle, or may be hand carried for a walking'traverse.
a. Transmitter Mechanical J
The transmitter assembly contains the transmitter
electronics, the antennas reels, and a solar panel for a
power source. The transmitter case is a cylinder of
6-inch_diameter mounted on a 9x9 inch base which serves
as a protective cover for the solar panel Jbefore deployment,
and as a foot for the assembly after deplo?yment.
The four elements of the transmitting; antennas mount
on four reels stowed around the transmitter:. Each reel
measures 6.25 iri ID, 8.5 in OD, and 1 inchi thick, and
weighs less than.l/3-lb without wire. Handling of the* - " ' . " '
.reels_may be done using a universal handling tool or a
special tool .may be supplied to interface conveniently^ wirtir ~
the reel hubs. . .
I ;,• ;.-/•"• . ••'•'- "i "lo '• .' ' " ' -
III - 74
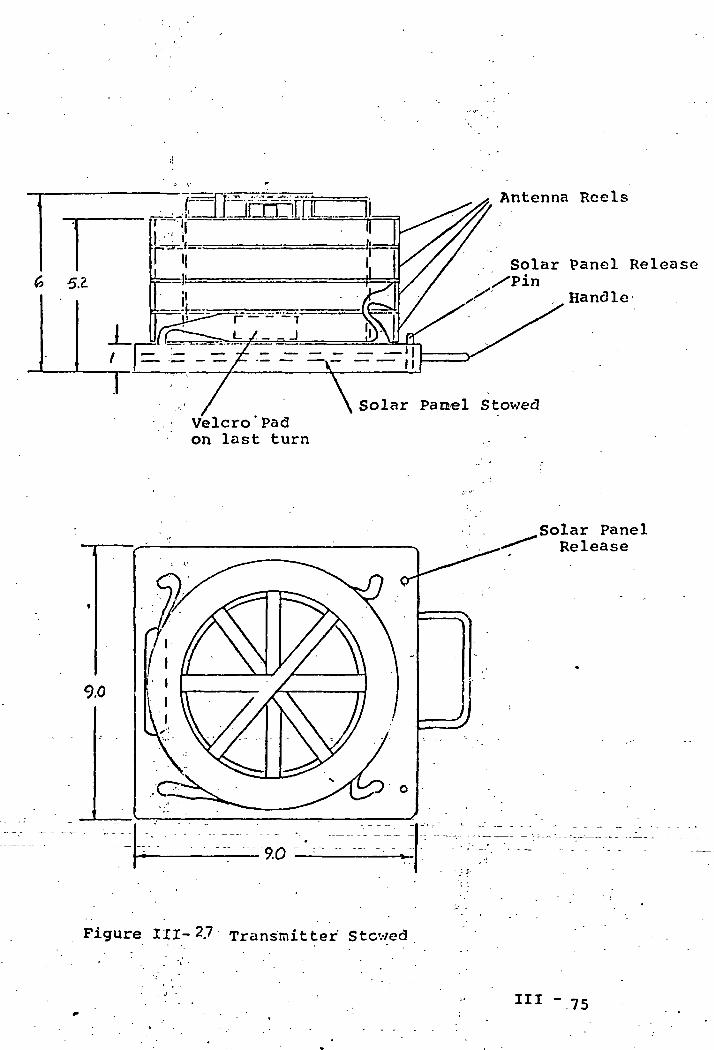
5.2.
r ii.
rt=ib
L y i
Antenna Reels
Solar panel Release/Pin
Handle
Velcro'Padon last turn
Solar Panel Stowed
9.0
.Solar PanelRelease
Figure III-2.7 Transmitter Stcv/ed
III - 75
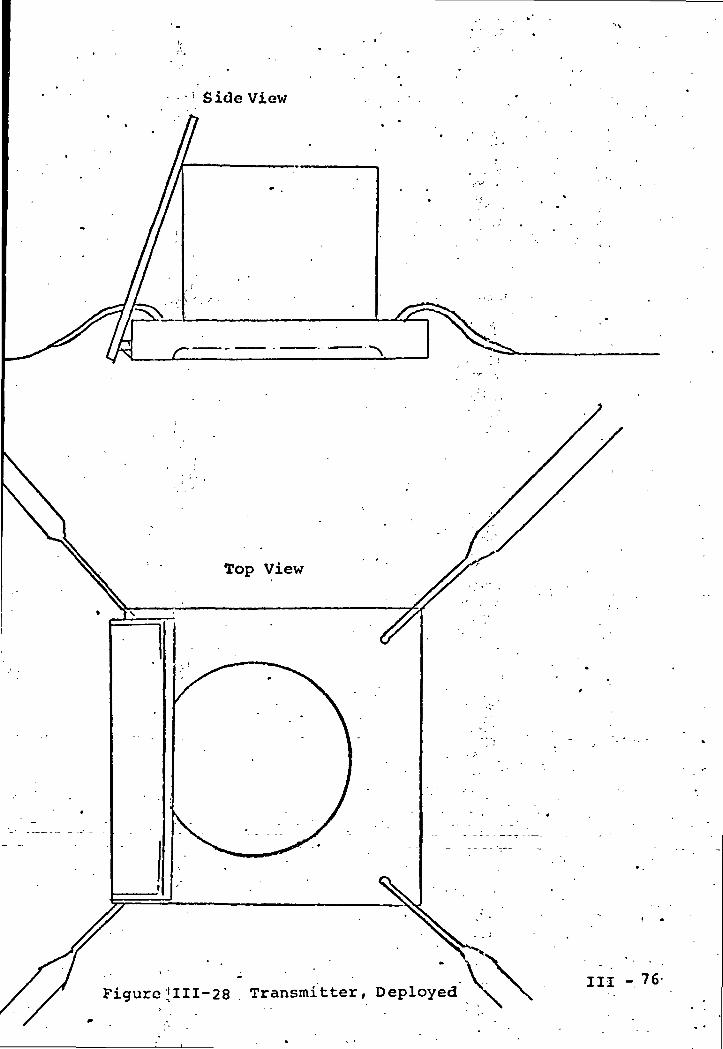
Side View
Figure'111-28 Transmitter, DeployedIII -76

The solar panel provides continuous power to the
transmitter and also serves as a sun screen for the
transmitter's radiating _(top) surface. The pane^l measures
9x9 inches and weighs approximately 1 Ib with its fixtures,
Essentially all the volume in the transmitter case is
allotted for the transmitter electronics. The interior
dimensions, after thermal blanketing, are 5.5 dia x 4.5
inches high or 107 in .
b. Receiver Mechanical
The major features of the receiver assembly are the
case (a), containing the electronics/ tape recorder, and
batteries, the antenna assembly (b) , and an extendable •-,
mast (c) for Rover use. The antennas and mast will be
sufficiently strong to permit handling of the package by
the antennas.
The space remaining in the receiver case after the
3thermal blanketing is 4.5 x 8 x 8 in. (256 in ). The
allocation of this volume is as follows:(
Recorder with interconnect block: 2.1x5x7 (73.5 in )
Energy source - - . . - . _ . g -(Silver-Zinc battery): 2x4x7 .(56 in )
Receiver Electronics: 2x5x7 (70 in )
-• -.Within, the .-case, a central.web serves as'the medium
for conducting heat from the suba~ssemblres~tp the heat
switch. The tape recorder is mounted by means of slide
: III - 77
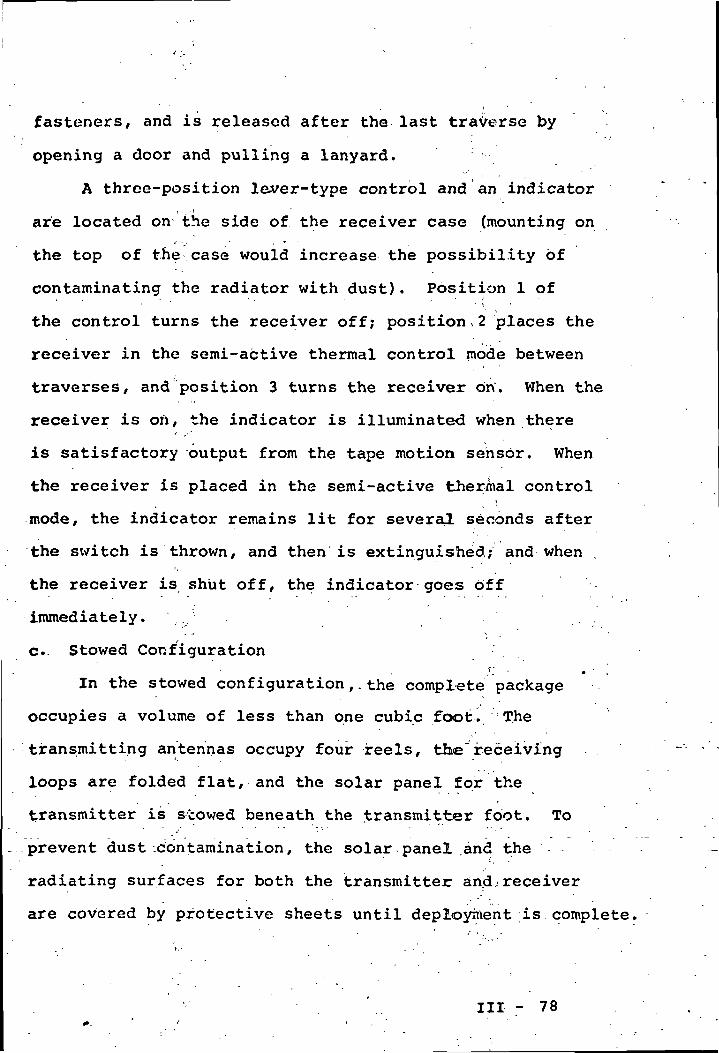
fasteners, and is released after the last traverse by
opening a door and pulling a lanyard.
A three-position lever-type control and an indicator
are located on the side of the receiver case (mounting on
the top of the case would increase the possibility of
contaminating the radiator with dust). Position 1 of. " • \
the control turns the receiver off; position>2 places the
receiver in the semi-active thermal control mode between
traverses/ and position 3 turns the receiver on. When the
receiver is oh, the indicator is illuminated when there
is satisfactory output from the tape motion sensor. When
the receiver is placed in the semi-active thermal control
mode, the indicator remains lit for several seconds after
the switch is thrown, and then is extinguished; and when ,
the receiver is shut off, the indicator goes off
immediately. . . .
c.. Stowed Configuration.*-" • • ' .
In the stowed configuration,.the complete package
occupies a volume of less than one cubic foot. The
transmitting antennas occupy four reels, the~receiving
loops are folded flat, and the solar panel for the
transmitter is stowed beneath the transmitter foot. To
prevent dust .contamination, the solar panel .and the
radiating surfaces for both the transmitter and.? receiver
are covered by protective sheets until deployment is complete,
III - 78
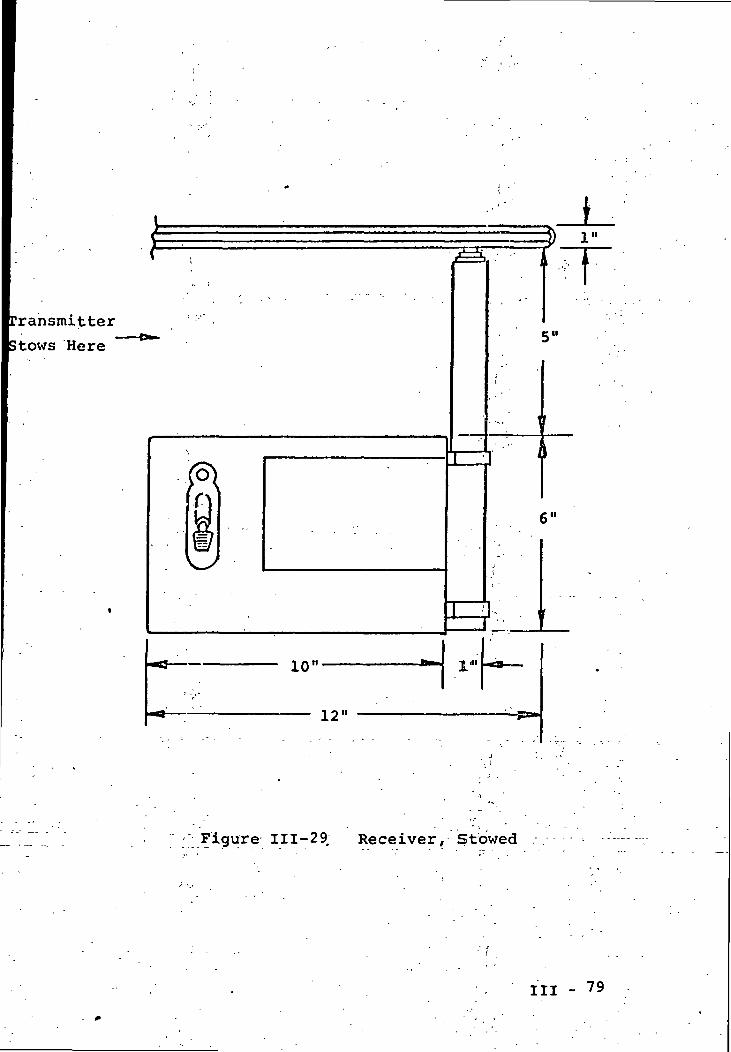
transmitter
Jtows Here
10"
12"
3)i
f
5"
6"
•hFigure 111-29 Receiver, Stowed
III - 79
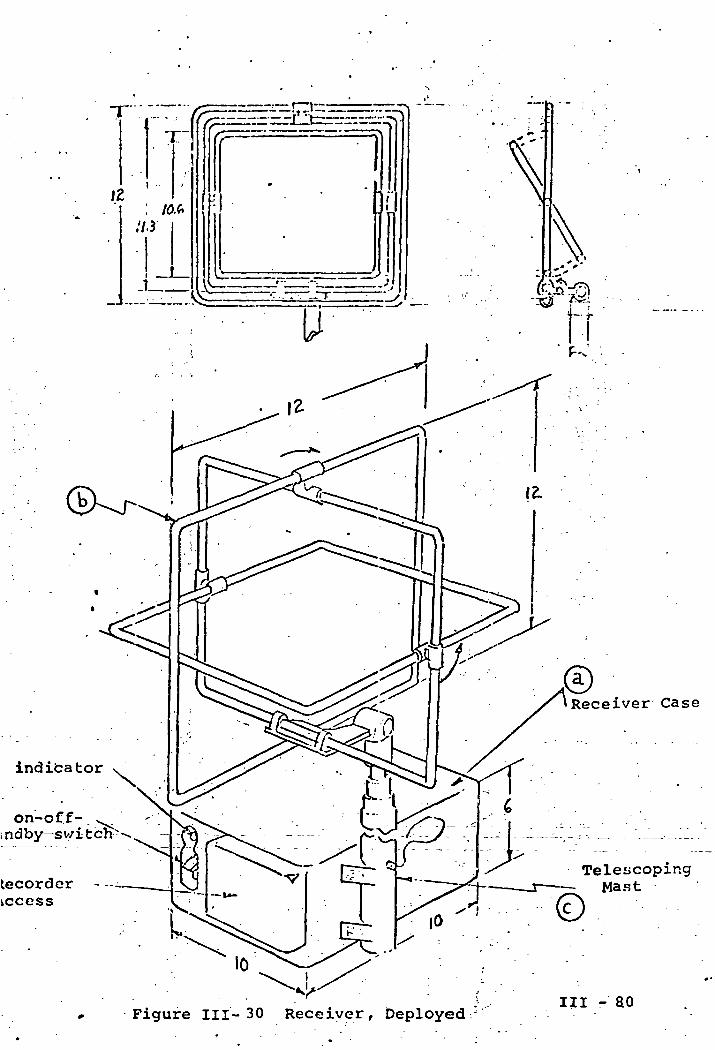
indicator
on-off-mdby
Recorderkccess
Receiver Case
TelescopingMast
Figure III-30 Receiver, Deployed/III - 80
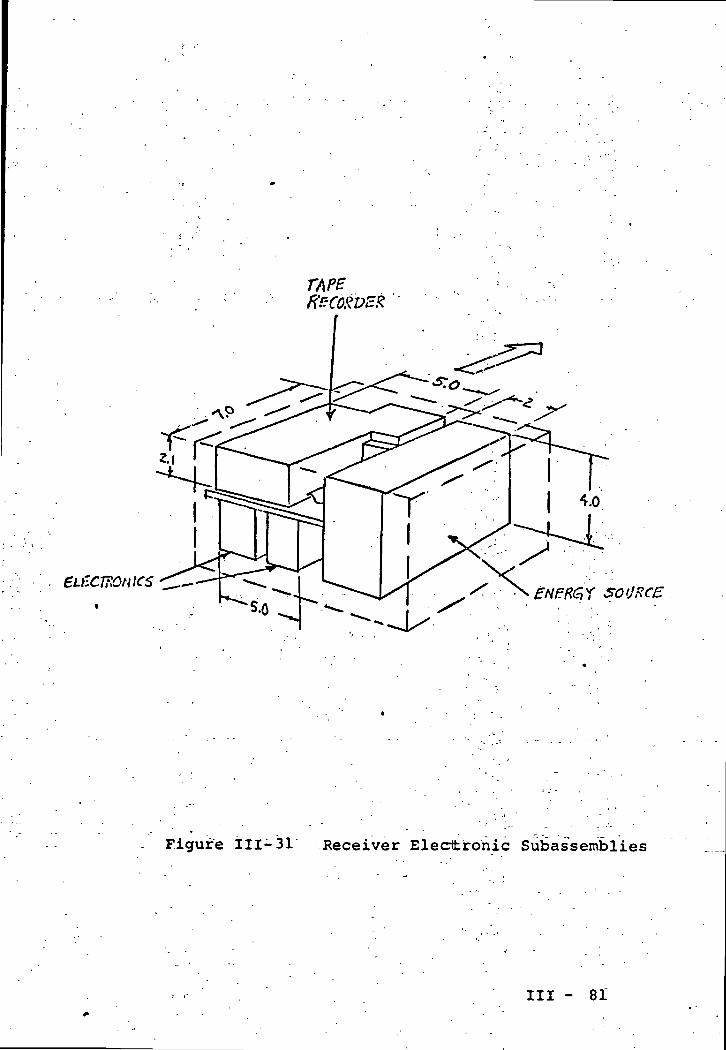
TAPE
Figure ill-31 Receiver Electronic Subassemblies
III - 81
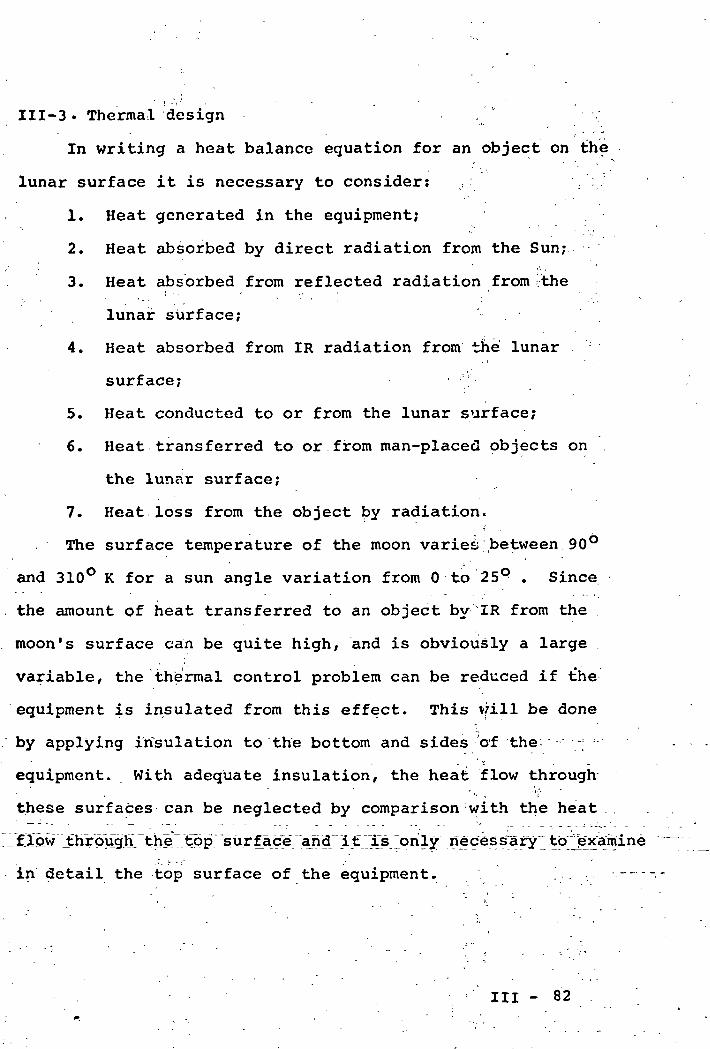
III-3 . Thermal design
In writing a heat balance equation for an object on the
lunar surface it is necessary to consider: , ;
1. Heat generated in the equipment;
2. Heat absorbed by direct radiation from the Sun;
3. Heat absorbed from reflected radiation from Jthe
lunar surface;
4. Heat absorbed from IR radiation from the lunar
surface; ;
5. Heat conducted to or from the lunar surface;
6. Heat transferred to or from man-placed objects on
the lunar surface;
7. Heat loss from the object by radiation.
The surface temperature of the moon varies between 90°
and 310° K for a sun angle variation from 0 to 25° . Since
the amount of heat transferred to an object by IR from the
moon's surface can be quite high/ and is obviously a large
variable, the thermal control problem can be reduced if the
equipment is insulated from this effect. This will be done
by applying insulation to the bottom and sides of the ;
equipment. With adequate insulation, the heat flow through
these surfaces can be neglected by comparison :with the heat .
'flow J:hr6ujgtt
in detail the top surface of the equipment. '...-
III - 82
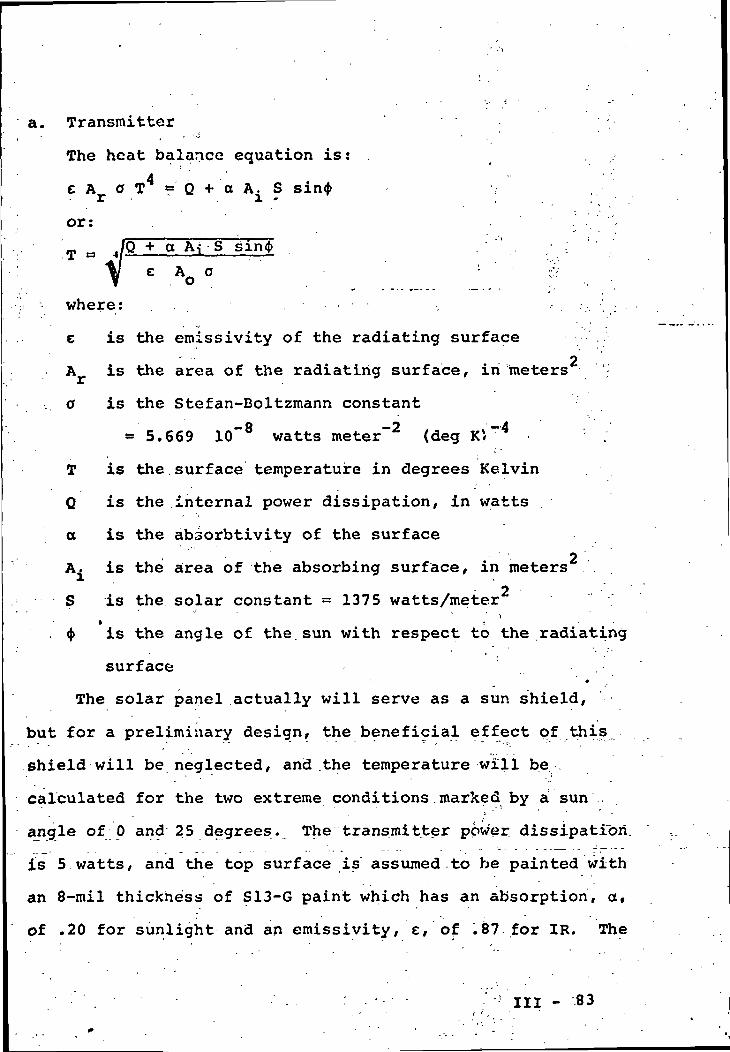
a. Transmitter
The heat balance equation is:4€ A a T *= Q + a A. S sin<|>
or:
,/Q + a Aj SJ
V e A^ ooi where: , \ :
e is the emissivity of the radiating surface2A is the area of the radiating surface, in meters
<j is the Stefan-Boltzmann constant
= 5.669 10~8 watts meter"2 (deg K)"4
T is the,surface temperature in degrees Kelvin
Q is the internal power dissipation, in watts
o is the absorbtivity of the surface• • '• 2A. is the area of the absorbing surface, in meters
2S is the solar constant = 1375 watts/meter• t
. <J> is the angle of the sun with respect to the radiating
surface*
The solar panel actually will serve as a sun shield,
but for a preliminary design, the beneficial effect of this
shield will be neglected, and .the temperature will be
calculated for the two extreme conditions marked by a sun .
angle of 0 and 25 degrees. The transmitter power dissipation
is 5 watts, and the top surface is assumed to be painted with
an 8-mil thickness of S13-G paint which has an absorption, a,
of .20 for sunlight and an emissivity, e, of .87 for IR. The
- 83
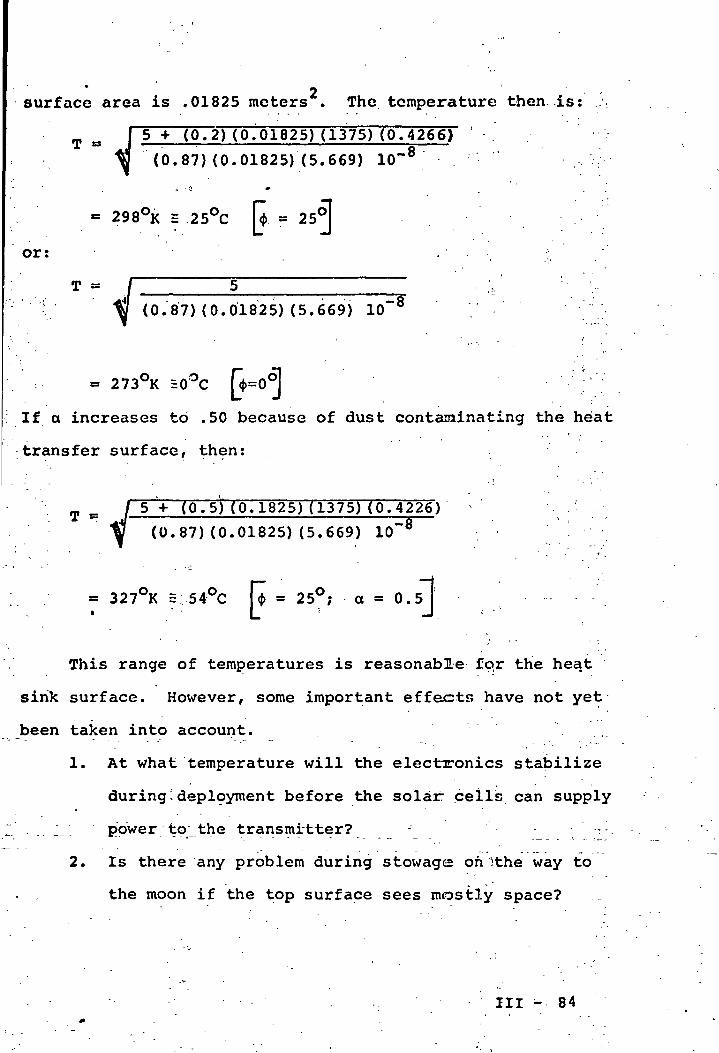
2surface area is .01825 meters . The temperature then is:
5 + (0.2) (0.01825) (1375) (0.42"66f
(0.87)(0.01825)(5.669) 10~8
°«= 298°K = 25°C [$ =
or:
T =
(0.87)(0.01825)(5.669)
= 273°K =0°C
If a increases to .50 because of dust contaminating the heat
transfer surface, then:
V 5+ (0.5) (0.
(0.87) (0.01
1825)(1375)(0.4226)
01825)(5.669) 10~8
= 327°K = 54°C * = 25°; a = 0.5 |
This range of temperatures is reasonable fqr the heat
sink surface. However, some important effects have not yet
been taken into account.
1. At what temperature will the electronics stabilize
during;deployment before the solar; cells can supply
power to the transmitter?
2. Is there any problem during stowage oh ?the way to
the moon if the top surface sees mostly space?
Ill -• 84
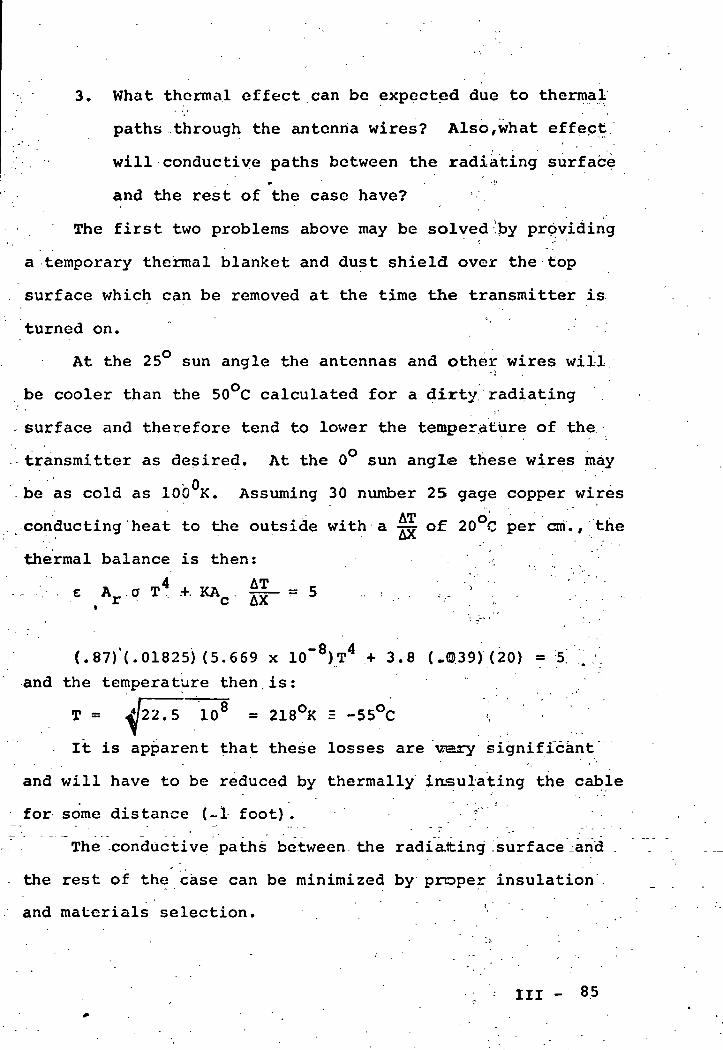
3. What thermal effect can be expected due to thermal
paths through the antenna wires? Also, what effect
will conductive paths between the radiating surface
and the rest of the case have?
The first two problems above may be solved by providing
a temporary thermal blanket and dust shield over the top
surface which can be removed at the time the transmitter is
turned on.
At the 25° sun angle the antennas and other wires will
be cooler than the 50°C calculated for a dirty radiating
surface and therefore tend to lower the temperature of the
transmitter as desired. At the 0 sun angle these wires may
be as cold as 100 K. Assuming 30 number 25 gage copper wires
conducting heat to the outside with a -rrr of 20 C per cni. , the. £XA
thermal balance is then: :
' e Ar aT4.+. KAc. |f = 5 ',, ; '
(.87)'(. 01825) (5.669 x 10"8)T4 .+ 3.8 (.0.39)' (20) = 5
and the temperature then. is:
T = /22.5 108 = 218°K = -55°C
It is apparent that these losses are \rery significant
and will have to be reduced by thermally insulating the cable
for some distance (-1 foot) . • '"' '
The conductive paths between the radiating .surface-and
the rest of the case can be minimized by proper insulation
and materials selection.
-^
III - 85
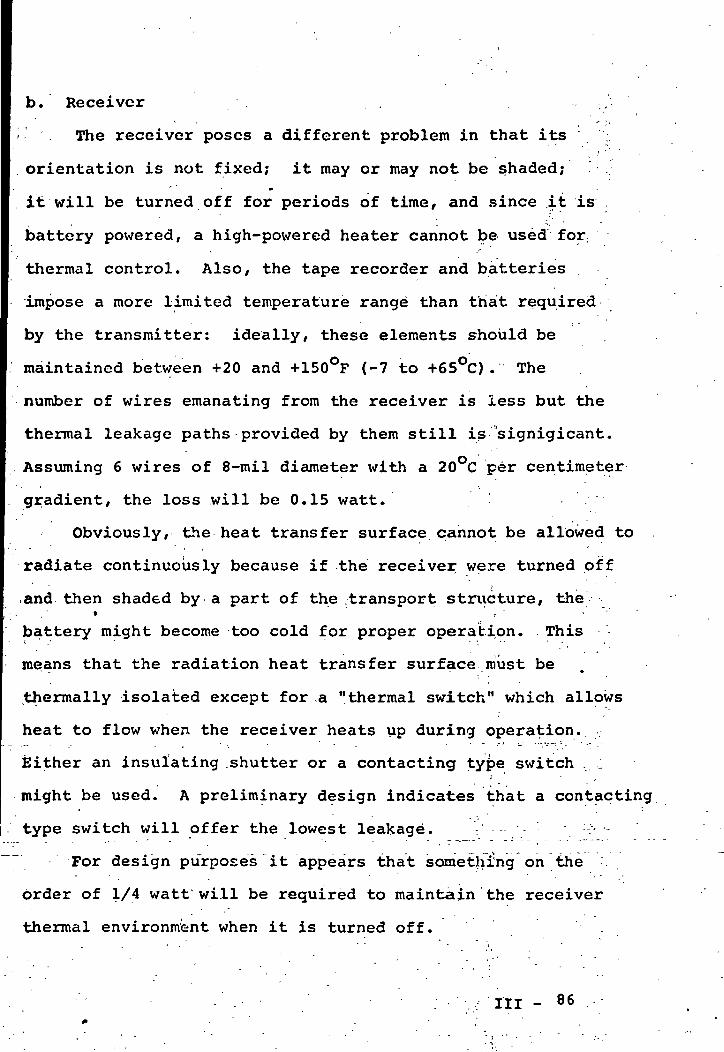
b. Receiver . /
'>'• The receiver poses a different problem in that its ";.
orientation is not fixed; it may or may not be shaded;
it will be turned off for periods of time, and since .it is
battery powered, a high-powered heater cannot be used for
thermal control. Also, the tape recorder and batteries
impose a more limited temperature range than that required
by the transmitter: ideally, these elements should be
maintained between +20 and +150°F (-7 to +65°C). The
number of wires emanating from the receiver is less but the
thermal leakage paths provided by them still is "signigicant.
Assuming 6 wires of 8-mil diameter with a 20°C per centimeter
gradient, the loss will be 0.15 watt.
Obviously, the heat transfer surface cannot be allowed to .
radiate continuously because if the receiver were turned offj '
.and then shaded by a part of the transport structure, the• n '
battery might become too cold for proper operation. This
means that the radiation heat transfer surface must be
thermally isolated except for ,a "thermal switch" which allows
heat to flow when the receiver heats up during operation.
Either an insulating .shutter or a contacting type switch , ;
might be used. A preliminary design indicates that a contacting
type switch will offer the lowest leakage. V - :-'"-•-
For design purposes it appears that something on the
order of 1/4 watt will be required to maintain the receiver
thermal environment when it is turned off. .
. • ' • : • • - . > i n - 86
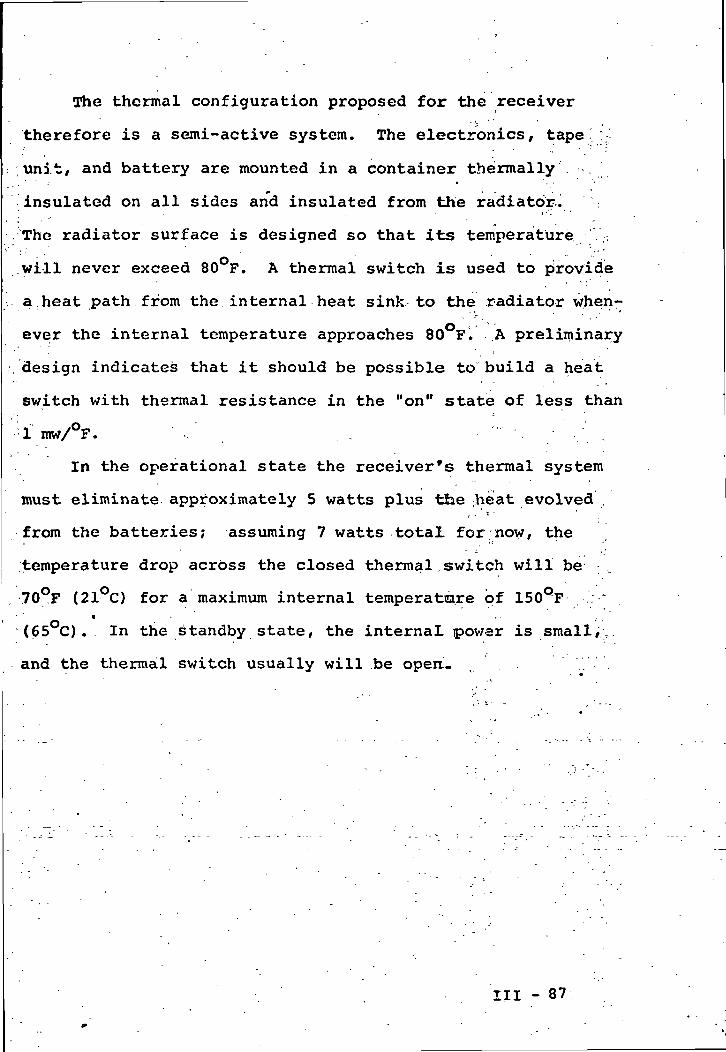
The thermal configuration proposed for the receiver
therefore is a semi-active system. The electronics, tape '.. :
unit, and battery are mounted in a container thermally .
insulated on all sides and insulated from the radiator.
The radiator surface is designed so that its temperature ,.
will never exceed 80 F. A thermal switch is used to provide
a heat path from the internal heat sink to the radiator when-
ever the internal temperature approaches 80°Fi. A preliminary
design indicates that it should be possible to build a heat
switch with thermal resistance in the "on" state of less than
1 mw/°F.
In the operational state the receiver's thermal system
must eliminate approximately 5 watts plus the ;heat evolved* ' '
from the batteries; assuming 7 watts total for now, the
temperature drop across the closed thermal switch will be
70°F (21 C) for a maximum internal temperatare pf 150°F .-.';•'
(65°C). In the standby state, the internal power is small,,
and the thermal switch usually will .be open..
Ill - 87
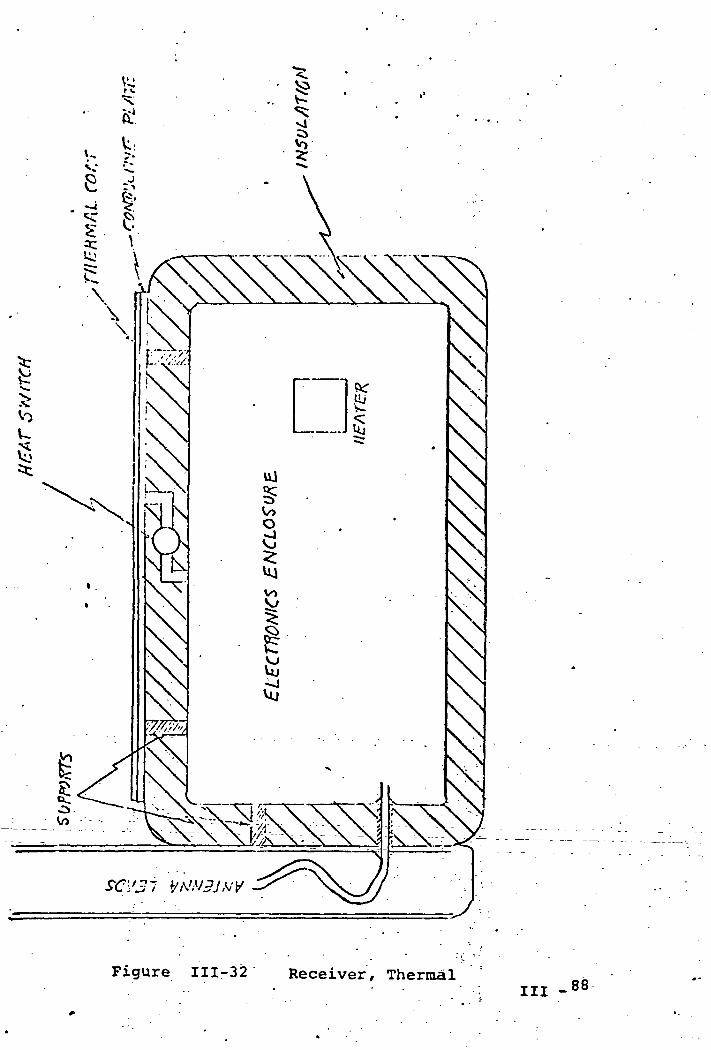
Figure 111-32 Receiver, ThermalIll -•
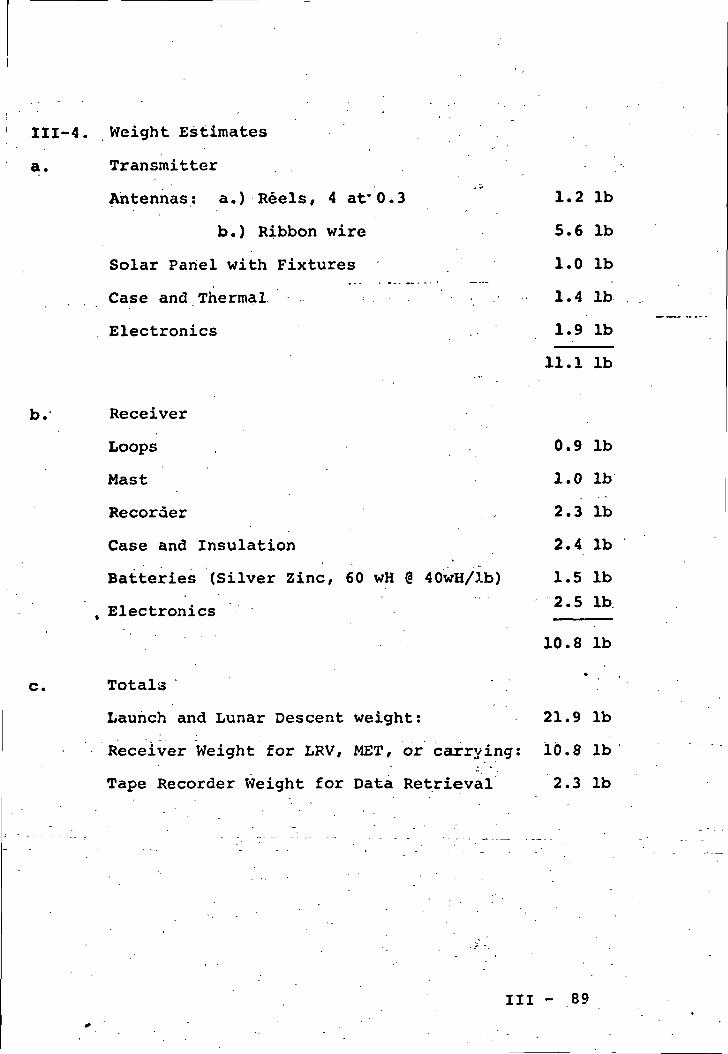
III-4. Weight Estimates
a. Transmitter' '**
Antennas: a.) Reels, 4 at'0.3 1.2 Ib
b.) Ribbon wire 5.6 Ib
Solar Panel with Fixtures 1.0 Ib
Case and Thermal. 1.4 Ib
Electronics . 1.9 Ib
Electronics
11.1 Ib
b. Receiver
Loops 0.9 Ib
Mast 1.0 Ib
Recorder . , 2.3 Ib
Case and Insulation 2.4 Ib
Batteries (Silver Zinc, 60 wH @ 40wH/lb) 1.5 Ib2.5 Ib
10.8 Ib
Totals
Launch and Lunar Descent weight: 21.9 Ib
Receiver Weight for LRV, MET, or carrying: 10.8 Ib
Tape Recorder Weight for Data Retrieval 2.3 Ib
III - 89
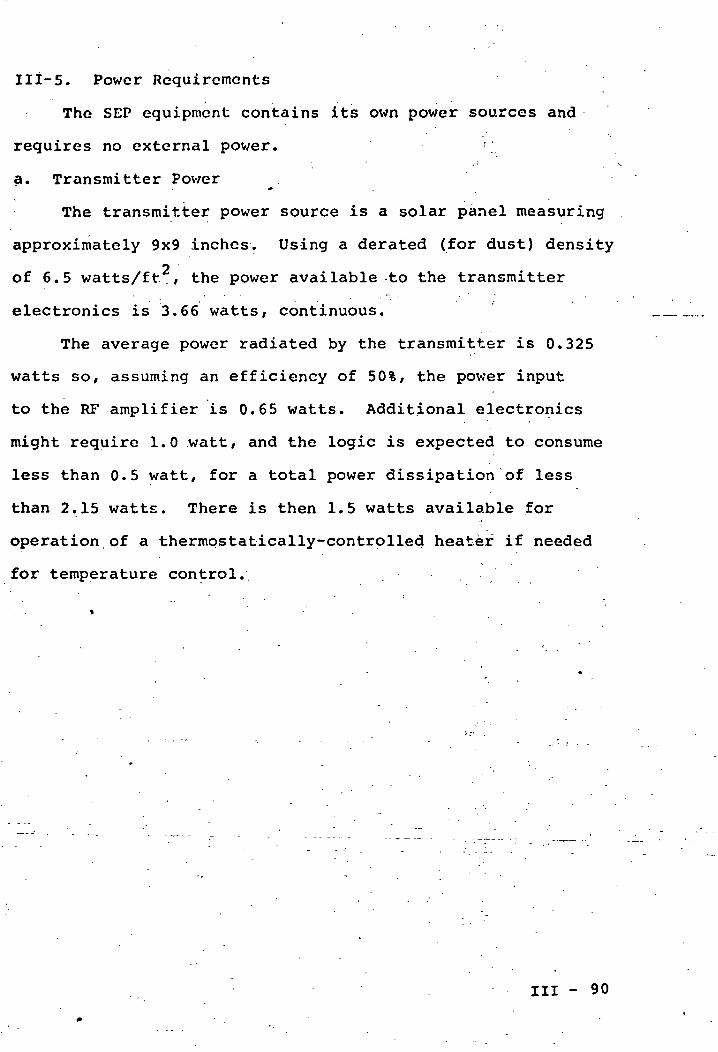
IIi-5. Power Requirements
The SEP equipment contains its own power sources and
requires no external power.
a. Transmitter Power
The transmitter power source is a solar panel measuring
approximately 9x9 inches. Using a derated (for dust) densityo
of 6.5 watts/ft ., the power available to the transmitter
electronics is 3.66 watts, continuous.
The average power radiated by the transmitter is 0.325
watts so, assuming an efficiency of 50%, the power input
to the RF amplifier is 0.65 watts. Additional electronics
might require 1.0 watt, and the logic is expected to consume
less than 0.5 watt, for a total power dissipation of less
than 2.15 watts. There is then 1.5 watts available for
operation of a thermostatically-controlled heater if needed
for temperature control.
Ill - 90
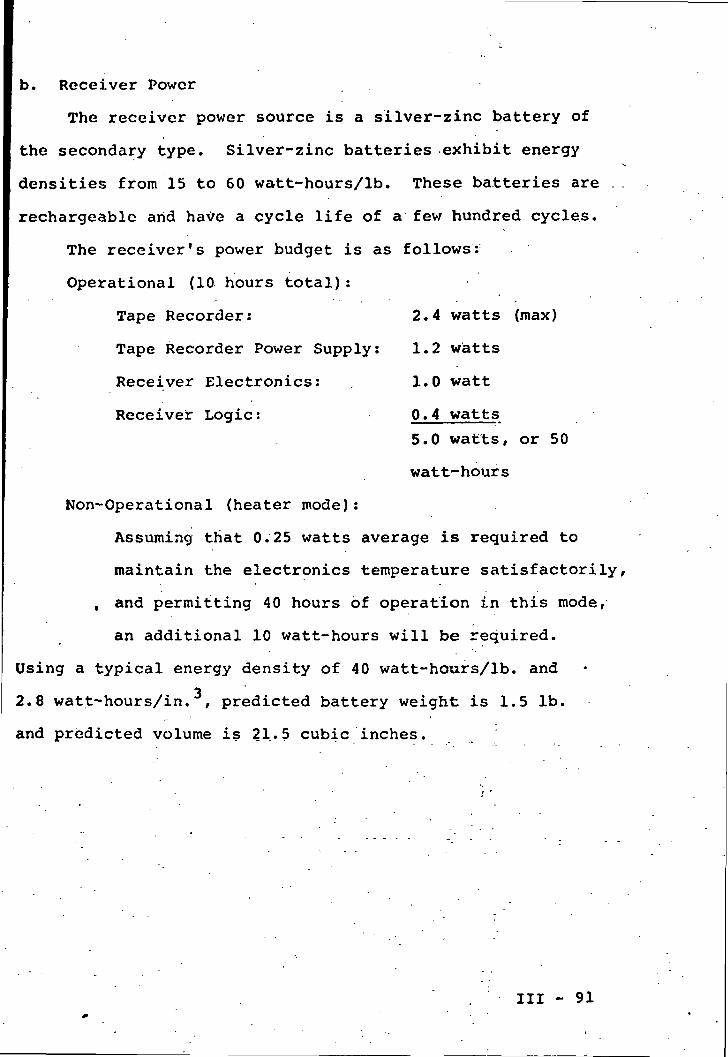
b. Receiver Power
The receiver power source is a silver-zinc battery of
the secondary type. Silver-zinc batteries exhibit energy
densities from 15 to 60 wa-tt-hours/lb. These batteries are . .
rechargeable arid have a cycle life of a few hundred cycles.
The receiver's power budget is as follows:
Operational (10 hours total):
Tape Recorder: 2.4 watts (max)
Tape Recorder Power Supply: 1.2 watts
Receiver Electronics: 1.0 watt
Receiver Logic: 0.4 watts
5.0 watts, or 50
watt-hours
Non-Operational (heater mode):
Assuming that 0.25 watts average is required to
maintain the electronics temperature satisfactorily,
, and permitting 40 hours of operation in this mode,
an additional 10 watt-hours will be required.
Using a typical energy density of 40 watt-hours/lb. and
2.8 watt-hours/in. , predicted battery weight is 1.5 Ib.
and predicted volume is 21.5 cubic inches.
Ill - 91
A number of available cells fit this application
closely. The Eagle-Picher SZLR 20.0 cell is a 20A-hour
device at the 10-hour discharge rate with initial energy
densities of 60 watt-hours/lb. and 4.05 wH/in . Each cell
measures 0.89 x 2.20 x 3.7*5 inches and weighs 8.1 oz. The cell
voltage, at a low discharge rate, is fairly constant at 1.5
volts so one such cell will supply 30 watt-hours. Three
cells/ then, will give a battery with an initial available
energy of 90 watt hours, 50% more than required. The
additional capacity covers the effects .of self-discharge
during wet stand, and low temperature.
Ill - 92
III-6. Required Equipment . .
A. Breadboards
To assist in early design efforts and preliminary concept
evaluation.
B. Engineering Unit
A non-production electrical equivalent of the SEP apparatus
to be used for design verification and evaluation changes.
C. Structural/Thermal Mockups
As required for proof of the mechanical and thermal design.
The primary thermal mockup unit is to be used for thermal/
vacuum testing, and requires internal heat sources (in lieu
of electronics and tape recorder) and sufficient
instrumentation (i.e., temperature sensors) to prove the
soundness of the thermal design.
D. System Interface Mockups
For simulation and demonstration of S/C and lunar vehicle• -
interfacing. The following are contemplated:
a. A stowed configuration mockup for the LM.
b. A receiver mockup for the LRV or MET.
... c.. .A mockup of the tape recorder.
E. Astronaut Training Mockup
Since the operation of the SEP equipment requires
minimal attention -and -there, are no feal^time dispray_ori. H
operational requirements, the training equipment may be
functionally simple and may be made one-sixth the weight
III - 93
of the flight hardware to simulate lunar gravity. To
demonstrate the transmitting antenna deployment/ this unit
will require reels and ribbons identical to those designed
for the flight equipment. The form factor and handling
will be exactly that of the flight equipment, although
this unit will contain no actual electronics or tape
recorder.
P. Prototype Unit
This unit is ;a non-production prototype fabricated
insofar as possible to the flight hardware design. The
unit is intended for a glacier test of the experiment
concept and design in March, 1971/ and will require a
tape recorder and full electronics, although not
necessarily flyable hardware. The equipment will be
identical to the flight equipment as defined by October,
1970. •
G. System Compatibility Model
This is the first production equipment; following
evaluation it will be delivered for compatibility testing
as directed by the Contracting Officer. ,. - . .
H. Qualification Unit
The second production unit is intended for qualification
testing, following acceptance, testing; this is the first
unit requiring all flight-qualified components.
Ill - 94
J. Flight Unit .
K. Flight Spare
L. Flight Unit
M. Flight Spare
a. Ground Support Equipment
The equipment required to evaluate.the transmitter and
receiver must perform the following:
a. For the transmitter
1. Provide adjustable metered power to the
transmitter electronics.
2. Provide adjustable or switchable dummy loads.
3. Measure and display power output at each
frequency as a function of time.
4. Measure transmitter clock frequency.
b. For the receiver
1. Provide adjustable metered power.
2. Measure battery voltage for determination of
state of charge.
3. Provide to the antenna terminals adjustable
signals simulating those, .transmitted for
evaluation of sensitivity/ noise figure/ and
frequency characteristics. Sufficient adjustment
------ should exist to permit-receiver .calibration;;
4. Provide a battery-charging capability.
5. Display recorder VCO output and input.
Ill . 95
6. Provide facilities for evaluating the tape
recorder and for reproducing tapes.
The GSE will consist,largely of rack-mounted commercial
instruments. Specialized hardware will be required for
commutating and decommutat'ing signals, simulating loads,
and switching among the various functions.
The transmitter and receiver will have test connectors
for interfacing with the GSE.
Three sets of GSE are proposed; two for delivery (to
MSC and KSC) and one to be used at MIT for acceptance,
qualification, and production final testing.
Ill - 9.6
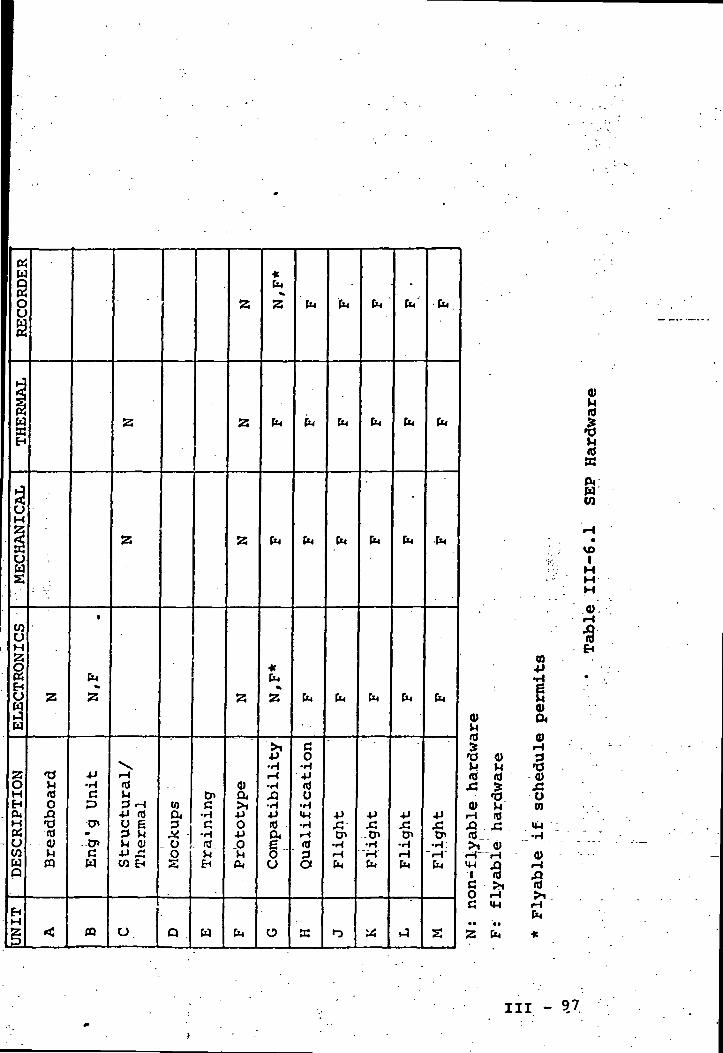
EICKC
tK
2
&aH
.aoH
. |
Uws
COuHzoP<HCJ
W
ZoHHQ4
"' Hp£
- UCOwQ
-^HZp
; v
Z
13Mn)O(
•O~nj
- <U-W«
<
•
EM*
Z
4-1•HCP
~o^•
o^cw
to
g;
z
^^_
r-<T3V43 H4J njo e3 ^M CJ4J XCO EH
O
U)
3Ai0Os
Q .
CT>C
•HC
•HmMEH
W
Z
Z
z
z
0)a^jo4JQ
V
EM
EMV
Z
EM
EM
*EM
Z
4J•H
•H
•H4J
CU£0O
O
EM
CM
EM
EM
CO•H4J
U•H
•H•H
3a
K
EM
EM
EM
EM
4J
Cn.,_{HEM
1-3
EM
EM
EM
EM
4J
CT*•Hr-lEM
u:
.
EM
CM
,
EM
EM
4J
CT*•H>HEM
,_}
EM
CM
EM
EM
4-)
CT*•H:
EM
S
0)frt•O
tJ «)M M^0 (d
'Od) J^iH n)
C5^t (jj
"tH rH
V -3C >iO r-if< MJ•• '•«Z EM
n
Q)Oi0)
0)x:o(0
M-l
0)i-4
•s
C)Mn)
(0
(VEOCO
\DIHHH
«H
«•E-t
III - ?7.
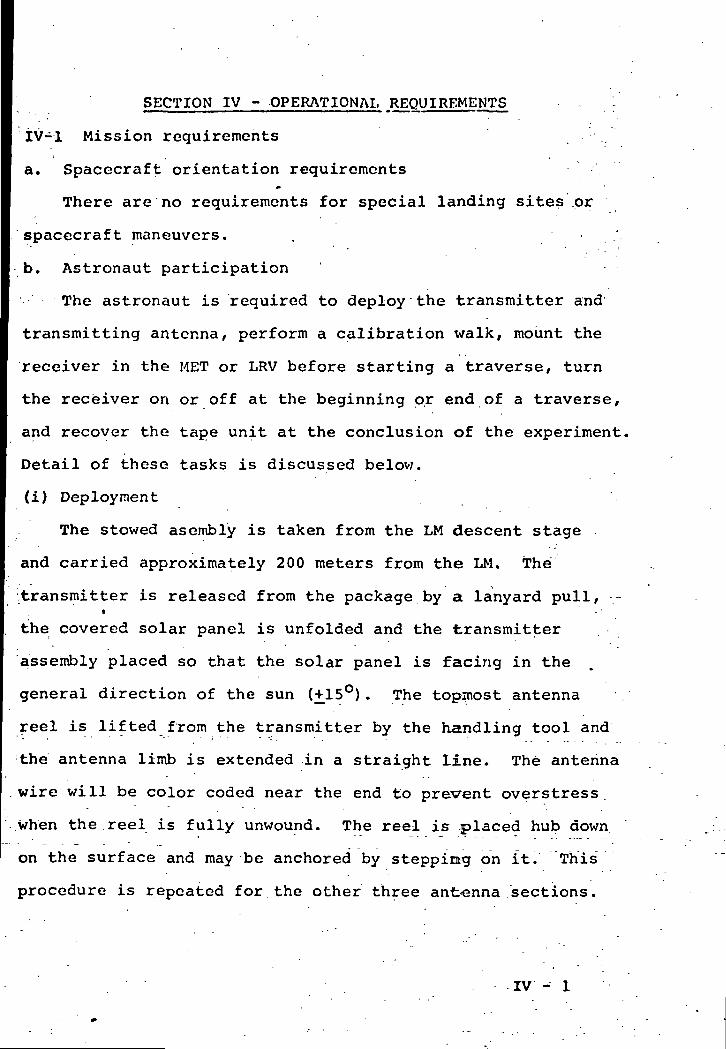
SECTION IV - OPERATIONAL REQUIREMENTS - , :
iv-l Mission requirements
a. Spacecraft orientation requirements
There are no requirements for special landing sites or
spacecraft maneuvers.
b. Astronaut participation
The astronaut is required to deploy the transmitter and
transmitting antenna, perform a calibration walk, mount the
receiver in the MET or LRV before starting a traverse, turn
the receiver on or off at the beginning or end of a traverse,
and recover the tape unit at the conclusion of the experiment,
Detail of these tasks is discussed below.
(i) Deployment
The stowed asembly is taken from the LM descent stage
and carried approximately 200 meters from the LM. The
'.transmitter is released from the package by a lanyard pull,i "
the covered solar panel is unfolded and the transmitter
assembly placed so that the solar panel is facing in the
general direction of the sun (+15°) . The topinost antenna
reel is lifted from the transmitter by the handling tool and
the antenna limb is extended .in a straight line. The antenna
.wire will be color coded near the end to prevent overstress
.when the.reel is fully unwound. The reel is .placed hub down
on the surface and may be anchored by stepping on it. This
procedure is repeated for. the other three anfc<enna .sections.
IV - 1
The astronaut then returns to the transmitter, and removes
the protective covering on the transmitter radiator surface
and solar panel.
Attention then is directed to the receiver. The
receiving loops are unfolded/ the mast is extended, and the
- protective cover removed from the radiator. The receiver
then is turned on and its operation verified by observing
the indicator. The astronaut should indicate v/hen the
receiver is turned on over the voice link.
(ii) Calibration .
The receiver then is carried along one limb of the
antenna, and pauses are made at several points indicated by
markings on the antenna. The receiver then is placed in
the thermal-control mode until the first traverse.
(iii) Operation
Following the calibration, the receiver is mounted int •
the MET or on the LRV. When the first traverse is to be
made, the receiver is turned on and left on until the traverse•
is complete. Again, for data correlation purposes, the
astronaut should indicate, by voice, the time at which the
receiver is turned on. Following the traverse, the receiver
is returned to the thermal-control mode. -
The above procedure is repeated for each traverse but
the last. Following the final traverse, the receiver is
turned off and the tape recorder is removed for return to
earth.
IV - 2
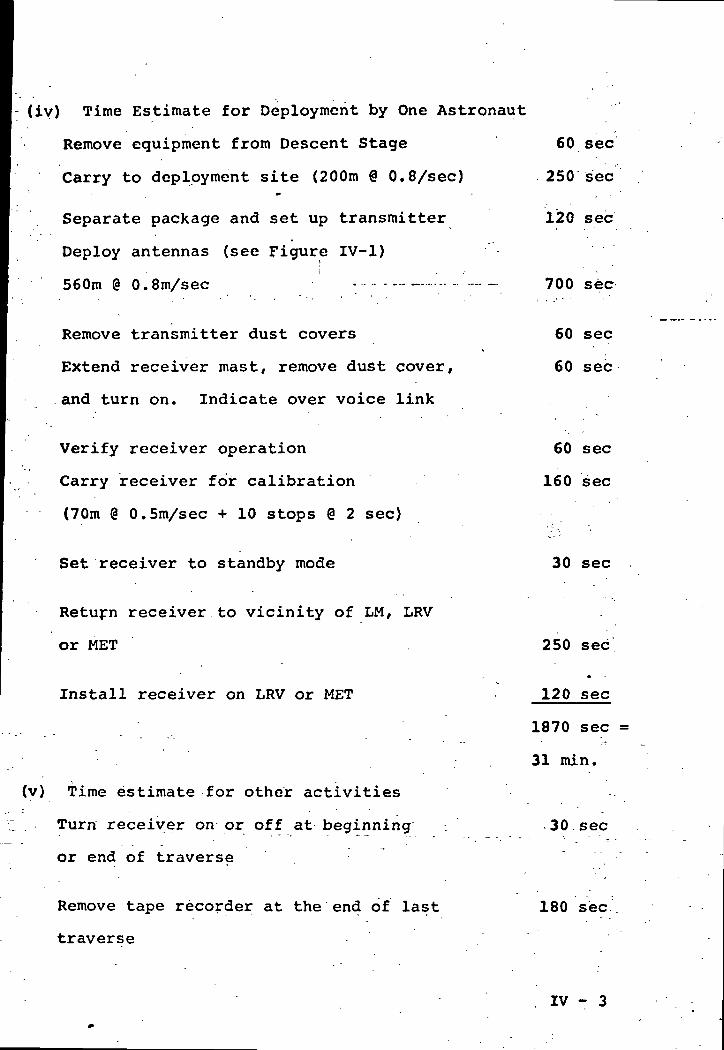
(iy) Time Estimate for Deployment by One Astronaut
Remove equipment from Descent Stage 60 sec
Carry to deployment site (200m @ 0.8/sec) 250 sec
Separate package and set up transmitter 120 sec
Deploy antennas (see Figure IV-1)
560m @ 0.8m/sec — 700 sec
Remove transmitter dust covers 60 sec
Extend receiver mast, remove dust cover, 60 sec
and turn on. Indicate over voice link
Verify receiver operation 60 sec
Carry receiver for calibration 160 sec
(70m @ 0.5m/sec + 10 stops @ 2 sec)
Set receiver to standby mode 30 sec
Return receiver to vicinity of LM, LRV
or MET 250 sec
•
Install receiver on LRV or MET 120 sec
1870 sec
31 min.
(v) Time estimate for other activities
Turn receiver on or off at beginning 30 sec
or end of traverse
Remove tape recorder at the end of last 180 sec
traverse
IV - 3
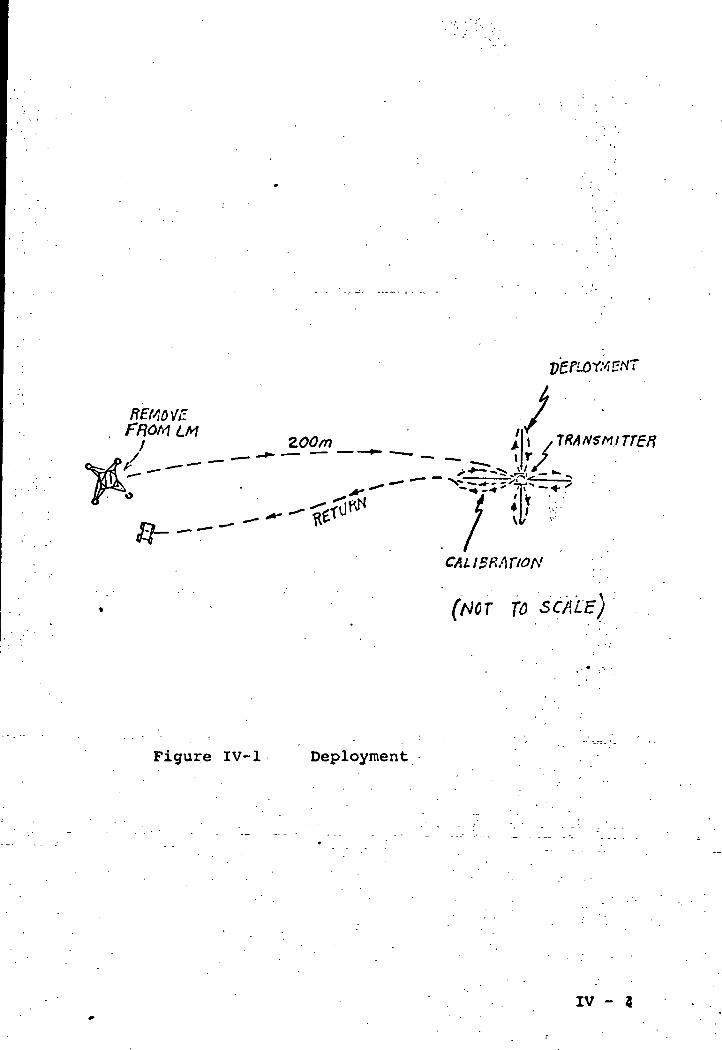
ZOOm/
TRANSMITTER
/
:-.* f •*-+?
I.CALIBRATION
(NOT TO
Figure IV-1 Deployment
IV - 3
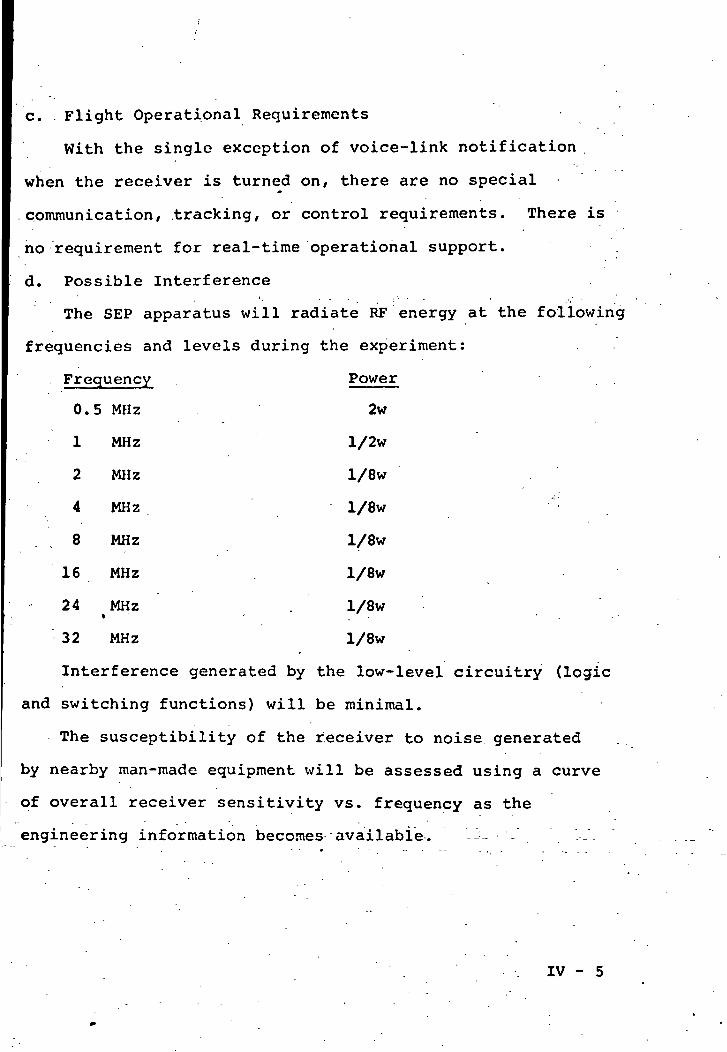
c. . Flight Operational Requirements
With the single exception of voice-link notification
when the receiver is turned on/ there are no special
communication, tracking/ or control requirements. There is
no requirement for real-time operational support.
d. Possible Interference
The SEP apparatus will radiate RF energy at the following
frequencies and levels during the experiment:
Frequency Power
0.5 MHz 2w
1 MHz l/2w
2 MHz l/8w
4 MHz l/8w
.8 MHz l/8w
16 MHz l/8w
24 ^MHz . l/8w
32 MHz l/8w
Interference generated by the low-level circuitry (logic
and switching functions) will be minimal.
The susceptibility of the receiver to noise generated
by nearby man-made equipment will be assessed using a curve
of overall receiver sensitivity vs. frequency as the
engineering information becomes available. --:- . '•-"-
IV - 5

IV-2 Support requirements
a. Prelaunch
(i) Astronaut training»
A moderate amount of crev; training will be required to
successfully perform the SEP operational tasks described
above. Crew training will be accomplished through use of a
crew training manual and a training mockup.
The training manual will provide a description of all
handling and control interfaces with the crew. It will
provide step by step details of SEP handling, deployment/
activation, calibration, etc. The external features of the
training mockup will be sufficiently complete to train the
crew in SEP handling and operation.
(ii) Tape recorder storage
To maintain a proper distribution of lubricant in the
tape recorder it is necessary that this unit be exercised
for a, minimum of one minute at least once every 120 days.
b. Data recovery
Following the experiment, the collected data is stored on
magnetic tape in the tape recorder. The- tape recorder is ..
removed from the receiver assembly as discussed previously,
and brought aboard the LM. Preliminary calculations indicate
that no special -handling will be required during- the per i6d"_l"_"_
that the recorder may be exposed on the lunar surface.
Special handling or stowage for the return trip should not ,
be required.
- 6
c. Data processing and analysis
For safety reasons, it will be desirable to make copies .
of the returned magnetic tape as soon as possible. These ,
copies then will be converted in special purpose data
processing equipment to conventional digital computer
magnetic tape format. -.'•- .
Subsequent analysis will require a good deal of computer
examination of the converted data tapes/ along with comparison
of theoretical and analog scale models as described in
Section II of this report.
IV - 7

APPENDIX A
ROTATING FIGURE-OF-EIGHT RADIATION PATTERN
A rotating figure-of-eight pattern can be generated
by modulating the excitation currents of two orthogonal
dipole antennas. Let ifl, i, be the excitation currents
of such a set of dipole antennas aa and bb, shown in
Figure 1, such that,
ia = cos a ejwt (1)
i b~sina e (2)
where:
a) is the carrier frequency
A is the relative phase shift at the carrier frequency
o is the modulating angle; |a (t)«wt|i
The corresponding normalized far electric-field components
E and E, will be,a b •
E (t,8) = cos a.sin.8 ejwu (3)" - C l ' ' - . ' . • - ,
Eb(t,6) =-sin a cos 8 e (4)
where: 6 is the azimuthal -angle defined in Figure 1.
From (3) and (4), the resultant field pattern ET is/
ET = Ea + Eb = cos a sine-sino cos 8
A-l
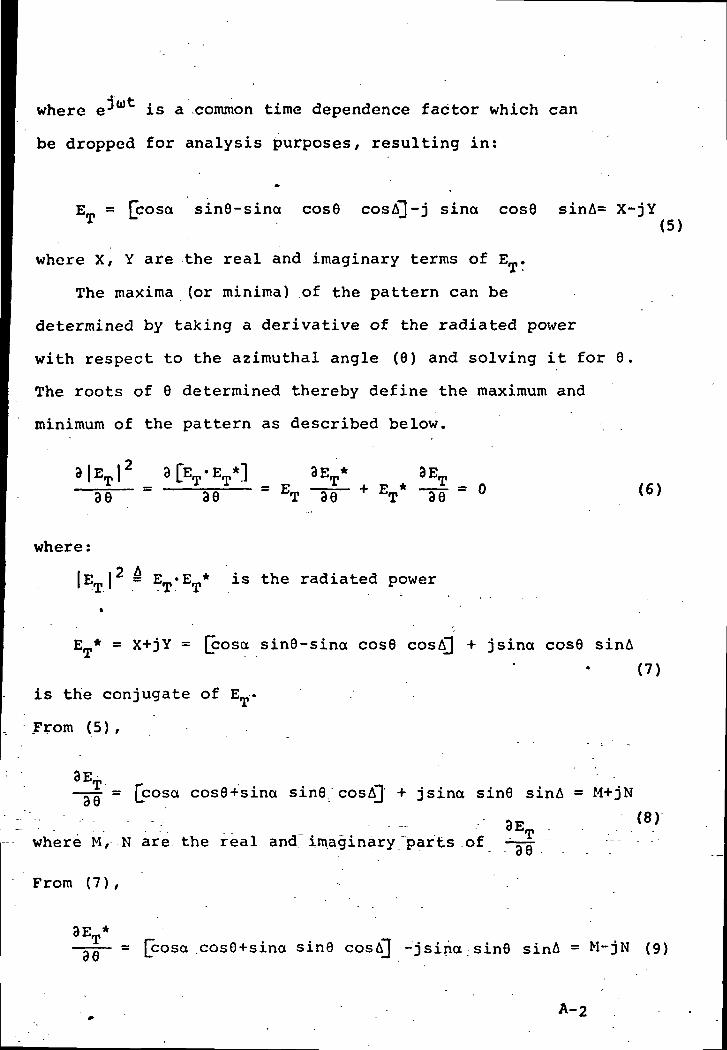
where ej is a common time dependence factor which can
be dropped for analysis purposes, resulting in:
Em = [cosa sin6-sina cos0 cosAl-j sina cos0 sinA= X-jYT (5)
where X, Y are the real and imaginary terms of E_.
The maxima (or minima) of the pattern can be
determined by taking a derivative of the radiated power
with respect to the azimuthal angle (0) and solving it for 0.
The roots of 0 determined thereby define the maximum and
minimum of the pattern as described below.
3ET* 3ET"' *-*/n *\ r\ * f'•••30 36 ~T 36 ' *T 36 "
where:
[ET| = E *E * is the radiated power
E * = X+jY = [cosa sin0-sina cos0 cosAj + jsina cos0 sinA
(7)
is the conjugate of E_.
From (5),
—vg- = [cosa cos0+sina sin0 cosA] + jsina sin0 sinA = M+jN
— 3E_,where M, N are the real and imaginary "parts .of —5-do
From (7) ,
36 = [cosa cos0-fsina sine cosAj -jsina sin0 sinA = M-jN (9)
A-2
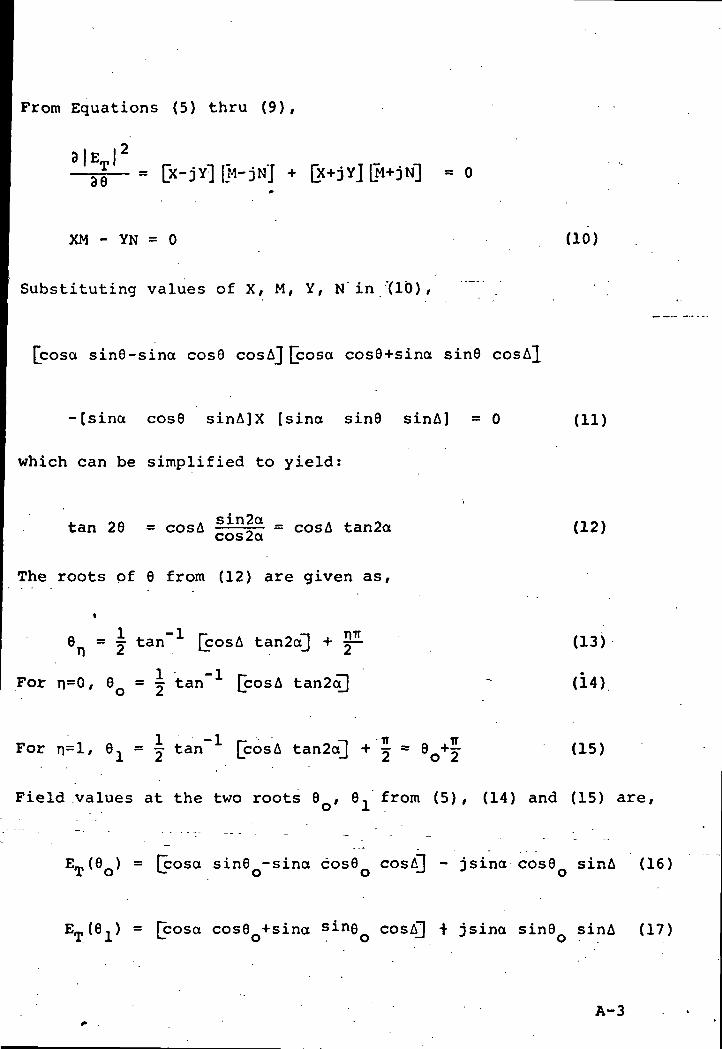
From Equations (5) thru (9),
= [X-JY] |M- jN'J + (X+JY] [M+JN] = oae
XM - YN = 0 (10)
Substituting values of X, M, Y, N'in '(10) , ~ .
[cosa sine-sina cos6 cos Aj [cosa cos6+sina sine cosA}
-[sina cos6 sinA]X [sina sin6 sinA] = 0 (11)
which can be simplified to yield:
tan 28 * cosA sin2" = cosA tan2a (12)cos^a
The roots of 8 from (12) are given as,
e=| tan"1 [cosA tan2a] + 2JL (13)
For n=0, 9 = j tan" [cosA tan2o] ' (14)
For n=l/ 9i = | tan"1 [cos A tan2ct] + | * 8Q+| (15)
Field values at the two roots 6 , 6, from (5), (14) and (15) are,
E_(6o) = [cosa sin8 -sina cos6 cosA] - jsina cos8 sinA (16)
^01* = [?osa cos60+sina sin8Q cosA] i jsina sin8o sinA (17)
A-3
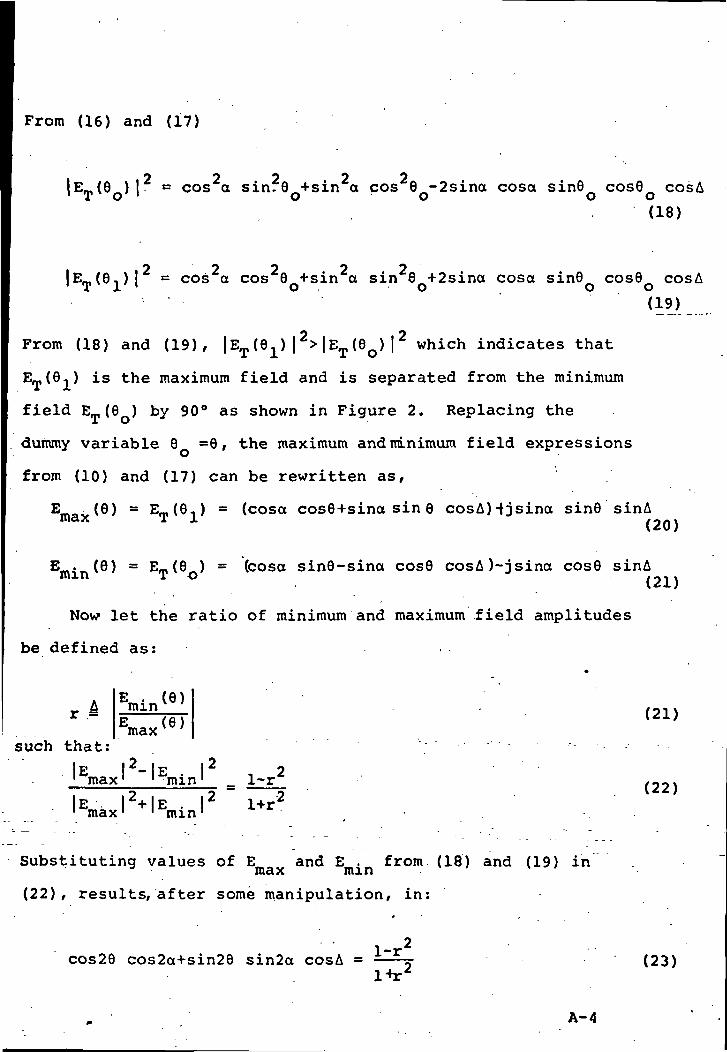
From (16) and (17)
*y O O O O|E_,(9 )| = cos a sin. 9 + sin a cos 8 -2sina cosa sin9 cos0 cosA
(18)
o o o o o|Em(8,)| = cos a cos 8 +sin a sin 8 +2sina cosa sin9 cos8 cosA1 T 1 ' o o o o
(19)
From (18) and (19), |ET(8 \2>\Ey(8Q)\2 which indicates that
ET(8,) is the maximum field and is separated from the minimum
field E_,(8 ) by 90° as shown in Figure 2. Replacing the
dummy variable 8 =8, the maximum and minimum field expressions
from (10) and (17) can be rewritten as,
E^ - (8) = Em(9,) = (cosa cos8+sina sin 8 cosAHjsina sin6 sinAmax T 1 (2Q)
= Em(e~) = (cosa sin8-sina cos8 cosA)-jsina cos8 sinAi o io~\ \
Now let the ratio of minimum and maximum field amplitudes
be defined as:
r
such that:IP 1 _E '
min (21)E (8) l ;
maxv '
max min' _ 1-r (22)"
Substituting values of E and E . from (18) and (19) inniaX nun( 2 2 ) , results, after some manipulation, in:
2cos29 cos2a+sin26 sin2a cosA = r, (23)
A-4

Substituting cosA from (12) , in (23) then yields:
1-r2cos2a = ±-£=- cos29 v (24)
Equations (12) and (24) relate the four variables r,
6, a and A controlling the behavior of the rotating radiation
pattern. The plots of these equations are periodic in
nature and possess symmetry about A = y and a = j axes as
shown in Figure 3. Because of symmetry, all pertinent
information is contained in the range 0<a<j and (KA* .
Furthermore, it can be seen that for any two prescribed
parameters of the required rotating pattern, the remaining
variables can be determined from Figure 3.
For example, suppose it is required to generate a
rotating pattern with a rotation rate of 15 revolutions
per second and with 80% modulation (r=0.2). in such a• - '
-2case, the azimuth angle 9(t)=2Tr is scanned in 6.66x10
seconds. For graphical convenience, let this time interval
be divided into 32 intervals each of duration t=2.062 x 10
seconds corresponding to an angular change of ~. UsingJ.D
the plots of Figure 3, the corresponding values of A and a
can be determined and are drawn in Figure 4. An electronic
-implementation.. of these values will generate the desired
15 revolutions per .second rotation rate.
Two special cases of interest can be inferred directly
from Figures 2 and 3.
A-5
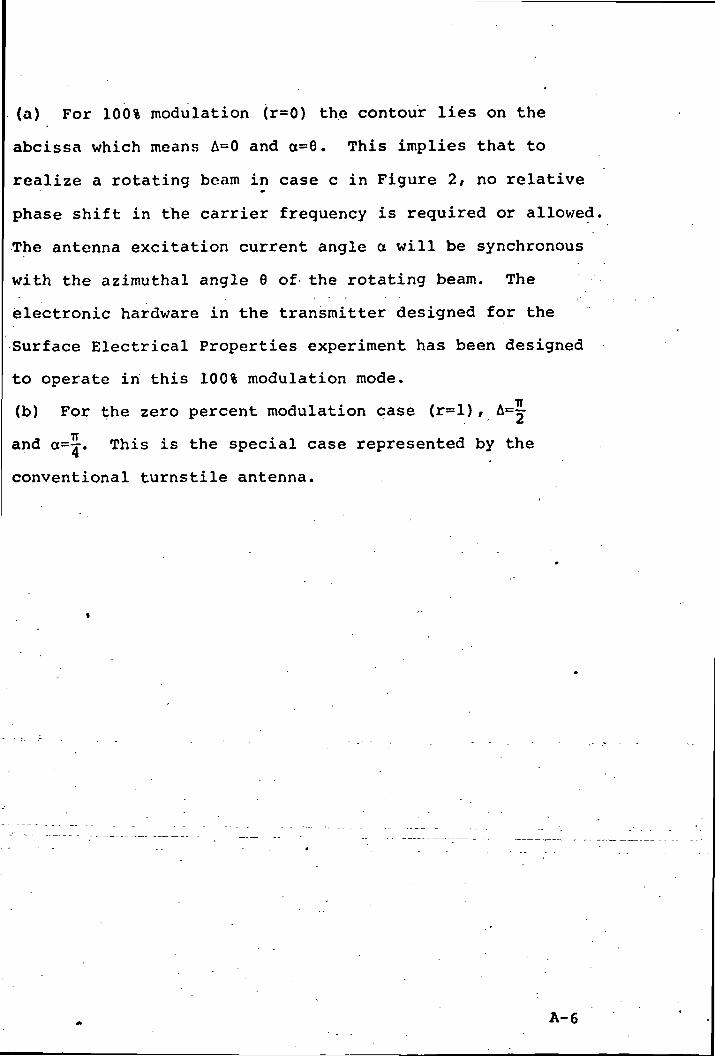
(a) For 100% modulation (r=0) the contour lies on the
abcissa which means A=0 and a=8. This implies that to
realize a rotating beam in case c in Figure 2, no relative
phase shift in the carrier frequency is required or allowed,
The antenna excitation current angle a will be synchronous
with the azimuthal angle 9 of the rotating beam. The
electronic hardware in the transmitter designed for the
Surface Electrical Properties experiment has been designed
to operate in this 100% modulation mode.
(b) For the zero percent modulation case (r=l), A=j
and <x=j. This is the special case represented by the
conventional turnstile antenna.
A-6
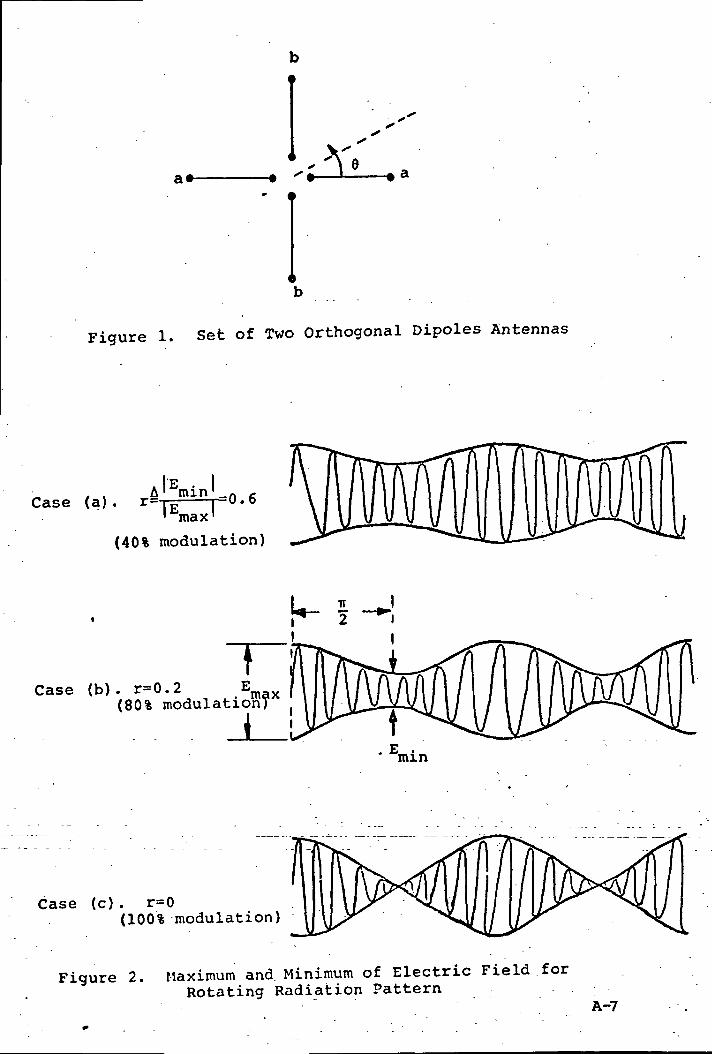
b1
i
i
>
UvX^
Figure 1. Set of Two Orthogonal Dipoles Antennas
* IE . ICase (a). r& E
min.1 '
min.-0.6max. '
(40% modulation)
TCase (b). r=0.2 Emav
(80% modulation?
. . . J_
Case (c). r=0(100% modulation)
Figure 2. Maximum and Minimum of Electric Field forRotating Radiation Pattern
A-7
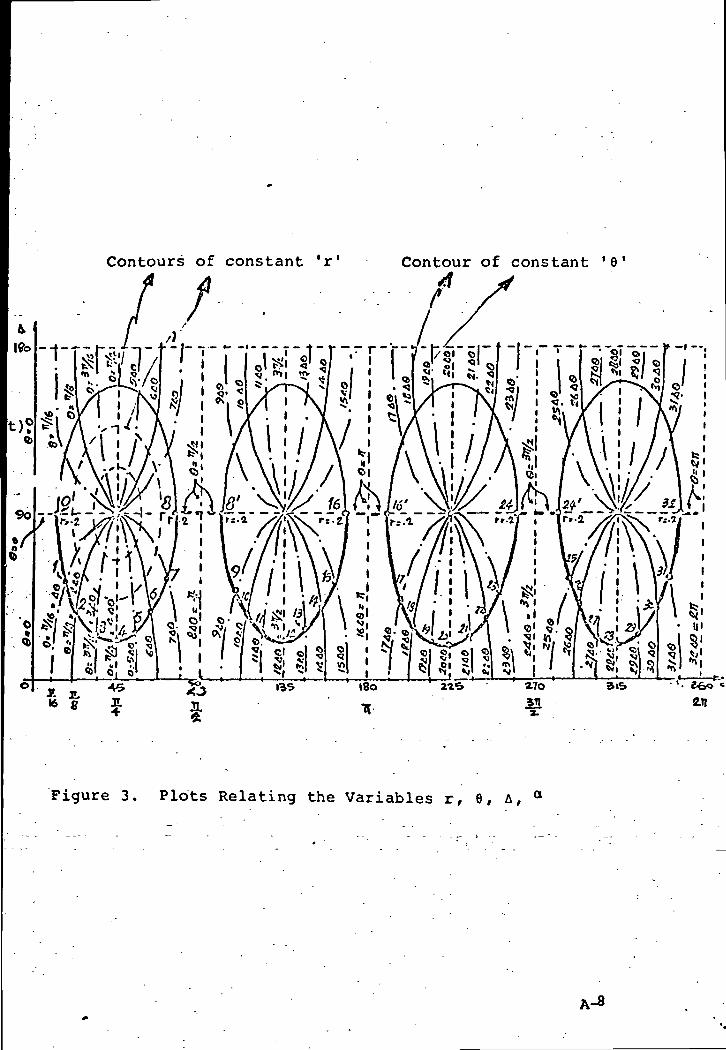
Contours of constant 'r1 Contour of constant '9
Figure 3. Plots Relating the Variables r, 6, A, a
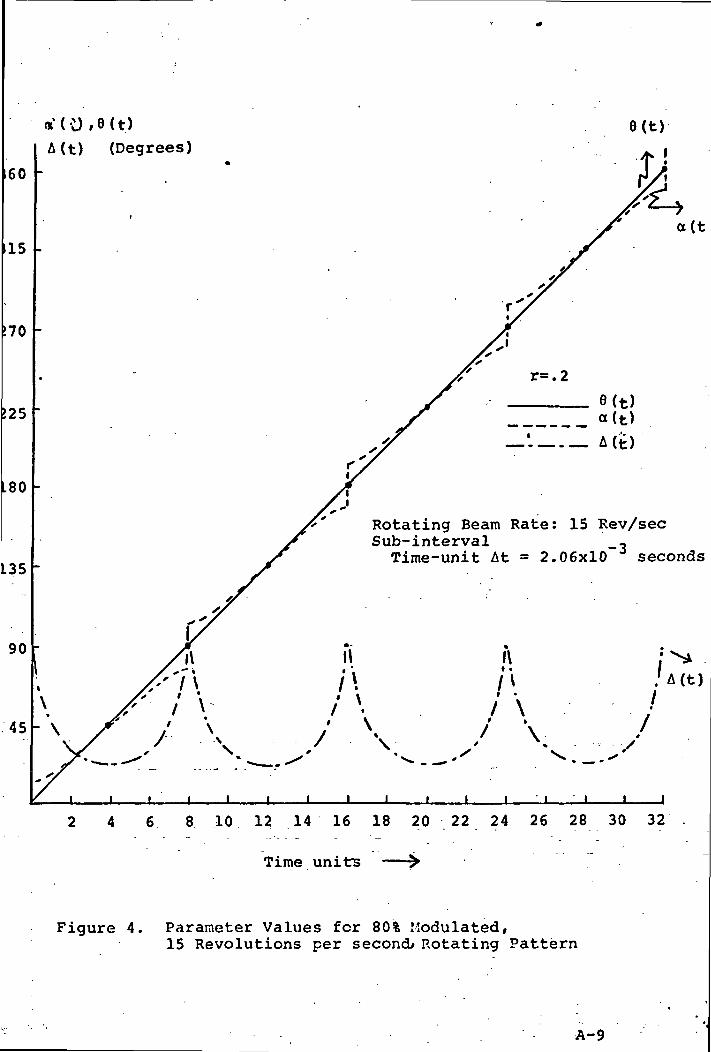
60
15
70
A(t) (Degrees)6(t)
a(t
25
r=.2
e(t)a(t)A(t)
80
L35
Rotating Beam Rate: 15 Rev/secSub-interval -Time-unit At = 2.06x10 seconds
90 T\ II
i\ftM
45 • \
2 4 6 8 10 12 14 16 18 20 22 24 26 28 30 32
Time units
Figure 4. Parameter Values for 80% Modulated,15 Revolutions per second/ Rotating Pattern
A-9