Embed Size (px)
Citation preview

A publication of Portland State University Center for Real Estate Available for download at: http://www.pdx.edu/realestate/research_quarterly.html
CENTER FOR REAL ESTATE Quarterly Report
Volume 8, Number 3 Summer 2014

CENTER FOR REAL ESTATE Quarterly Report A publication of Portland State University Center for Real Estate PO Box 751-SBA Portland, Oregon 97207-0751 Publisher Gerard C.S. Mildner, Ph.D. Editor Eric Fruits, Ph.D. Staff Carly Harrison Synkai Harrison Scott Holden Editorial Advisers Mark Childs Robert L. Lefeber Thomas Potiowsky, Ph.D. Randall J. Pozdena, Ph.D. Patricia Raicht Bill Reid Justin Wood Craig Zell

CONTENTS
Summary and Editorial 3 State of the Economy 4 Carly Harrison Residential Market Analysis 17 Scott Holden
Multifamily Market Analysis 37 Scott Holden
Office Market Analysis 43 A. Synkai Harrison
Industrial Market Analysis 50 A. Synkai Harrison
Retail Market Analysis 56 A. Synkai Harrison

■ Eric Fruits, Ph.D. is editor of the Center for Real Estate Quarterly Report and an adjunct professor at Portland State University. He is president and chief economist at Economics International Corp., a Portland-based consulting firm. Any errors or omissions are the author’s responsibility. Any opinions expressed are those of the author solely and do not represent the opinions of any other person or entity. Center for Real Estate Quarterly Report, vol. 8, no. 3. Summer 2014 3
SUMMARY AND EDITORIAL
ERIC FRUITS
Editor and Adjunct Professor, Portland State University
In this issue of the Quarterly Report, we welcome Carly Harrison and Synkai Harrison, both of whom are Master of Real Estate Development candidates and have been awarded the Center for Real Estate Fellowship. Carly will provide an re-view of the state of the economy and periodic feature articles. Synkai will cover the office, industrial, and retail markets.
With this issue we have added a board of advisers to help guide our student au-thors with insight and information that can only come from first hand and on-the-ground experience in real estate markets. Our board includes Mark Childs, Robert L. Lefeber, Thomas Potiowsky, Ph.D., Randall J. Pozdena, Ph.D., Patricia Raicht, Bill Reid, Justin Wood, and Craig Zell. We greatly appreciate the time and energy they have generously provided.
I hope you enjoy this latest issue of the Center for Real Estate Quarterly Report and find it useful. The Report is grateful to the Oregon Association of Realtors (OAR) for their continued support. n
■ Carly Harrison is a Master of Real Estate Development candidate and has been awarded the Center for Real Estate Fellowship. Any errors or omissions are the author’s responsibility. Any opinions expressed are those of the author solely and do not represent the opinions of any other person or entity. Center for Real Estate Quarterly Report, vol. 8, no. 3. Summer 2014 4
THE STATE OF THE ECONOMY
CARLY HARRISON
Portland State University
Following data revisions, the economy continues to grow steadily, but slowly, in line with expectations. Gross domestic product has increased, interest rates remain low, and the unemployment rate has continued to decrease while labor force participation has also decreased. Economists continue to affirm that there is low risk of recession on the horizon.
After a seemingly slow start to the year, the United States economy has been stronger in the second quarter, with a seasonally adjusted annualized growth rate of 4.0 percent. This is in contrast to the first quarter, which saw a shrinking of 2.1 percent, however, this was largely attributed to a severe winter and inventory overhang from the end of 2013.
Unemployment continued to improve in the second quarter, decreasing from 6.7 percent to 6.1 percent. According to Federal Reserve Chairwoman, Janet Yellen, there is still much room to improve, as millions of these workers have part-time jobs but want full-time work while others have stopped looking for work. Overall consensus, however, is that the job market is improving.

STATE OF THE ECONOMY HARRISON 5
THE WORLD ECONOMY
The International Monetary Fund reports in their July update that global growth is still relatively strong for 2014 with slightly higher projections for 2015. The world economy is projected to grow by 3.4 percent, which reflects a downward revision of 0.3 percent from earlier projections. Nevertheless, the IMF projections 4 percent growth in 2015.
A large portion of world economic growth is expected to be from emerging markets. Emerging markets are projected to grow 4.6 percent, while advanced economies are expected to grow at 1.8 percent in 2014, with smaller increases projected in 2015. Many emerging economies are vulnerable to a decrease in capital investment, due to perceived or actual instability.
In China, in order to prevent a real estate bubble, officials have tapered credit growth, leading to a slight decrease in domestic demand for the world’s second largest economy. According to the Wall Street Journal, the decrease in economic growth is pressuring local governments to spend their budgets quickly, and has led Chinese authorities to support policy measures that accelerate fiscal and infrastructure investment, tax relief for small and medium businesses, and lower reserve ratio requirements. The projected growth for 2014 is 7.4 percent and is expected slow slightly to 7.1 percent as the Chinese economy becomes more consumer-driven rather than export-driven.
Figure 1: Gross Domestic Product, United States, Annualized Percent Change, 2007–2015
Source: Bureau of Economic Analysis and Wall Street Journal Economic Forecasting Survey
-10%
-8%
-6%
-4%
-2%
0%
2%
4%
6%
2007 2008 2009 2010 2011 2012 2013 2014 2015

STATE OF THE ECONOMY HARRISON 6
THE UNITED STATES ECONOMY
Coming out of the first quarter with negative growth in GDP, the United States Bureau of Economic Analysis reports a relatively strong second quarter, with a growth rate of 4.0 percent (Figure 1), following the first quarter’s decline of 2.1 percent. This increase primarily reflects an increase in personal consumption expenditures, private inventory investment, exports, nonresidential and residential fixed investment, and state and local government spending.
While the stronger second quarter shows positive signs, economists believe that 2014 will be another “disappointing” year for growth, according to the Wall Street Journal’s survey. There appear to be no overwhelmingly positive changes on the horizon, and several potential downside risks, one being the Fed’s tapering, which would lead to higher real rates.
In addition to the increase in GDP, unemployment decreased from 6.7 percent to 6.1 percent in the second quarter, with 288,000 nonfarm payroll jobs added in June alone.
Industry sectors with the most absolute growth in jobs were:
• Professional and Business Services (+67,000); employment growth in this industry averaged 53,000 per month over the prior 12 months;
• Retail Trade (+40,000); employment growth in this industry averaged 26,000 per month over the prior 12 months;
• Food Service and Drinking Places (+33,000); and has increased by 314,000 over the past year;
• Health Care (+21,000); with a trend up in ambulatory health care services.
There was also modest growth in jobs in Transportation and Warehousing, Financial activities, and Manufacturing.
STATE OF THE ECONOMY HARRISON 7
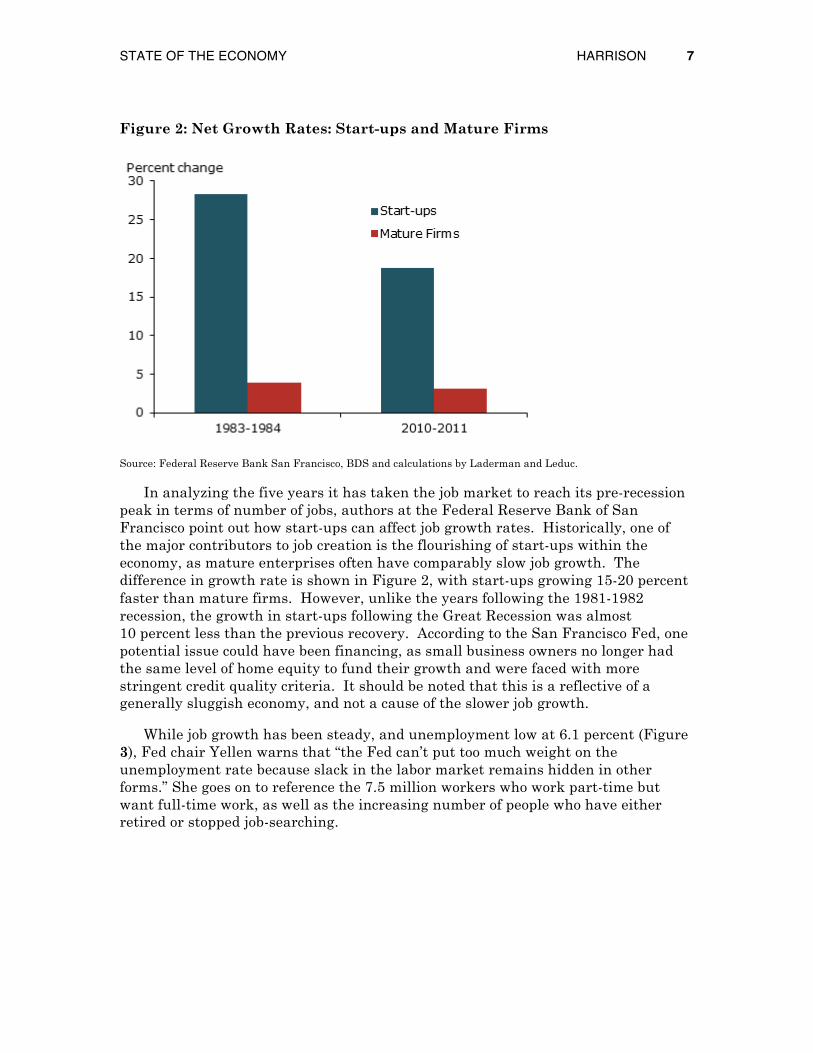
Figure 2: Net Growth Rates: Start-ups and Mature Firms
Source: Federal Reserve Bank San Francisco, BDS and calculations by Laderman and Leduc.
In analyzing the five years it has taken the job market to reach its pre-recession peak in terms of number of jobs, authors at the Federal Reserve Bank of San Francisco point out how start-ups can affect job growth rates. Historically, one of the major contributors to job creation is the flourishing of start-ups within the economy, as mature enterprises often have comparably slow job growth. The difference in growth rate is shown in Figure 2, with start-ups growing 15-20 percent faster than mature firms. However, unlike the years following the 1981-1982 recession, the growth in start-ups following the Great Recession was almost 10 percent less than the previous recovery. According to the San Francisco Fed, one potential issue could have been financing, as small business owners no longer had the same level of home equity to fund their growth and were faced with more stringent credit quality criteria. It should be noted that this is a reflective of a generally sluggish economy, and not a cause of the slower job growth.
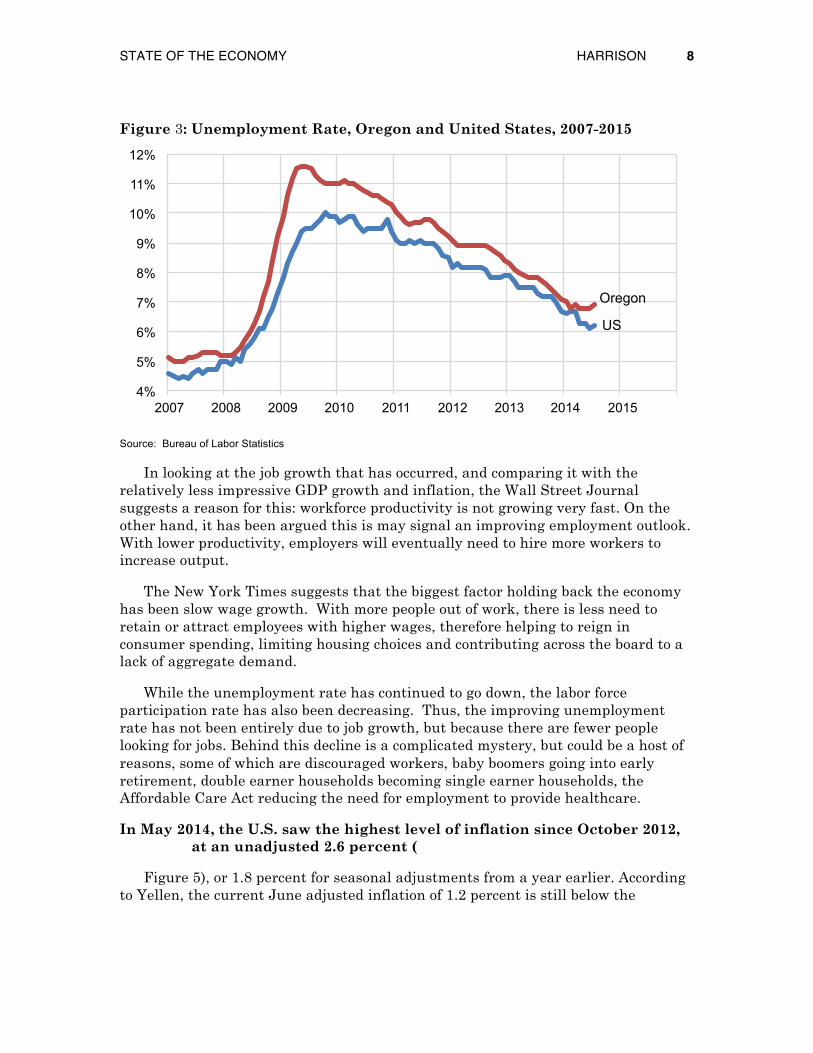
While job growth has been steady, and unemployment low at 6.1 percent (Figure 3), Fed chair Yellen warns that “the Fed can’t put too much weight on the unemployment rate because slack in the labor market remains hidden in other forms.” She goes on to reference the 7.5 million workers who work part-time but want full-time work, as well as the increasing number of people who have either retired or stopped job-searching.
STATE OF THE ECONOMY HARRISON 8
Figure 3: Unemployment Rate, Oregon and United States, 2007-2015
Source: Bureau of Labor Statistics
In looking at the job growth that has occurred, and comparing it with the relatively less impressive GDP growth and inflation, the Wall Street Journal suggests a reason for this: workforce productivity is not growing very fast. On the other hand, it has been argued this is may signal an improving employment outlook. With lower productivity, employers will eventually need to hire more workers to increase output.
The New York Times suggests that the biggest factor holding back the economy has been slow wage growth. With more people out of work, there is less need to retain or attract employees with higher wages, therefore helping to reign in consumer spending, limiting housing choices and contributing across the board to a lack of aggregate demand.
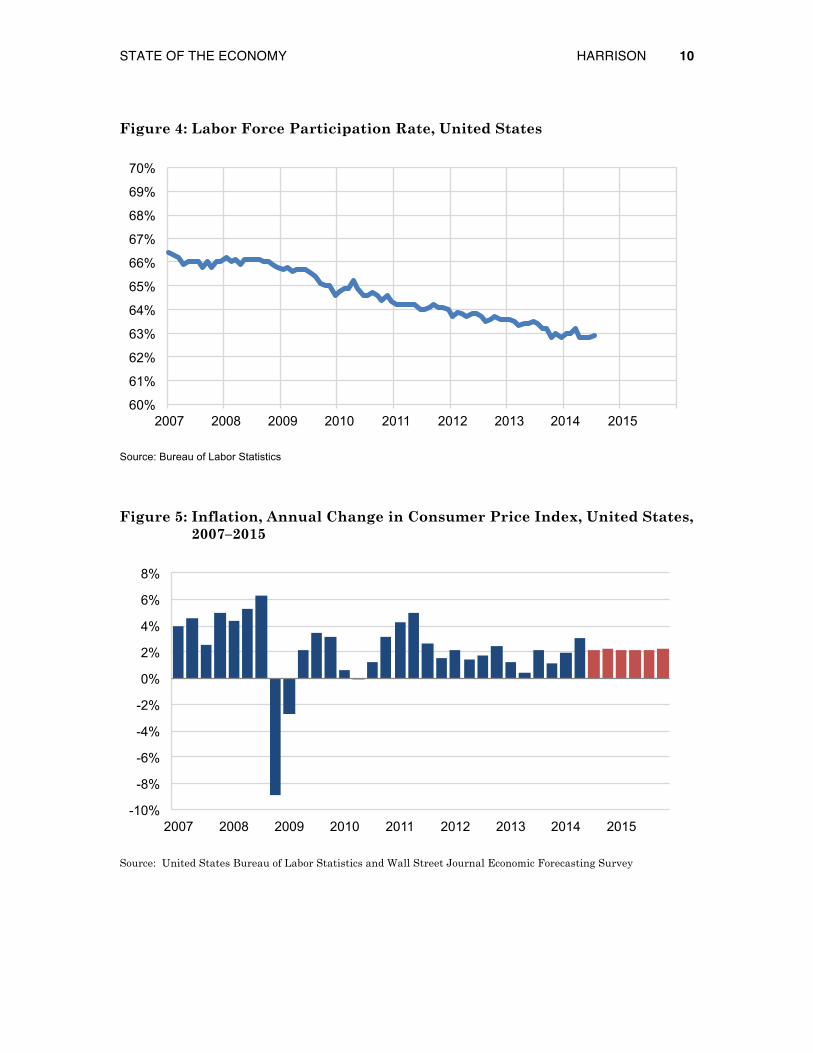
While the unemployment rate has continued to go down, the labor force participation rate has also been decreasing. Thus, the improving unemployment rate has not been entirely due to job growth, but because there are fewer people looking for jobs. Behind this decline is a complicated mystery, but could be a host of reasons, some of which are discouraged workers, baby boomers going into early retirement, double earner households becoming single earner households, the Affordable Care Act reducing the need for employment to provide healthcare.
In May 2014, the U.S. saw the highest level of inflation since October 2012, at an unadjusted 2.6 percent (
Figure 5), or 1.8 percent for seasonal adjustments from a year earlier. According to Yellen, the current June adjusted inflation of 1.2 percent is still below the
4%
5%
6%
7%
8%
9%
10%
11%
12%
2007 2008 2009 2010 2011 2012 2013 2014 2015
Oregon
US

STATE OF THE ECONOMY HARRISON 9
2.0 percent objective by the Fed, but this is much higher than in the first quarter. Fed officials still do not anticipate a large uptick in inflation in the near future.
STATE OF THE ECONOMY HARRISON 10
Figure 4: Labor Force Participation Rate, United States
Source: Bureau of Labor Statistics
Figure 5: Inflation, Annual Change in Consumer Price Index, United States, 2007–2015
Source: United States Bureau of Labor Statistics and Wall Street Journal Economic Forecasting Survey
60%
61%
62%
63%
64%
65%
66%
67%
68%
69%
70%
2007 2008 2009 2010 2011 2012 2013 2014 2015
-10%
-8%
-6%
-4%
-2%
0%
2%
4%
6%
8%
2007 2008 2009 2010 2011 2012 2013 2014 2015

STATE OF THE ECONOMY HARRISON 11
Figure 6: Standard & Poor’s 500 Index, 2007–2014
Source: S&P Dow Jones Indices, McGraw Hill Financial
The U.S. Stock Market has continued to get stronger, with the second quarter increase much higher than the previous change in the last quarter. The Wall Street Journal reports a current second quarter increase in revenue for S&P 500 companies of 4.3 percent over the previous year, and a 7.7 percent increase in earnings, showing the fastest growth since the fourth quarter of 2013. With fixed-income yields at record lows, it is not surprising that share prices have benefitted as investors scramble for higher yields.
From
-60%
-40%
-20%
0%
20%
40%
60%
80%
2007 2008 2009 2010 2011 2012 2013 2014 2015
Including Dividends
Excluding Dividends

STATE OF THE ECONOMY HARRISON 12
Figure 6, it is clear much of the gains in equities has been from increasing dividends. Since 2007, the S&P 500 has grown by 34 percent. Including dividends, S&P 500 stocks have delivered a 58 percent return since 2007.
As was announced in April, the Fed decreased its monthly bond purchases to $45 billion from its previous $85 billion, with its monthly mortgage bond purchases now at $20 billion and its Treasury purchases at $25 billion. Yield rates for both 10-year Treasury bonds (2.60 percent) and conventional mortgages (4.16 percent) have dropped slightly in response, instead of rising as is expected. This is a bit of a mystery to economists, but may represent the flight of overseas investors to a relatively safe investment in the United States. While most Fed officials still do not expect interest rates to rise until 2015, the quantitative easing that has been flushing the economy with money is likely to come to end in October.
Figure 7: 10 Year U.S. Treasuries vs. Conventional 30-Year Mortgages, 2007–2014
Source: Federal Reserve Bank
0%
1%
2%
3%
4%
5%
6%
7%
8%
2007 2008 2009 2010 2011 2012 2013 2014 2015
30 Year Mortgage
10 Year Treasury

STATE OF THE ECONOMY HARRISON 13
Figure 8: Spread Between 10 Year U.S. Treasuries and Conventional 30-Year Mortgages, 2007–2014
Source: Federal Reserve Bank
OREGON AND THE PORTLAND AREA
The state of Oregon has continued to experience the economic acceleration in 2014 as it had in 2013. Avoiding some of the weather-related problems that slowed the economy in early 2014, the Oregon job market is at its highest level since 2006, according to the Oregon Office of Economic Analysis, with two main drivers in job growth of housing and government. These two sectors historically show job growth when the economy comes out of a recession, but were absent in the earlier stages of the recovery. This has likely increased job growth rates with these sectors “catching up.”
The OEA continues to forecast a decrease in unemployment, a steady population growth rate of 1.1 percent, and an increase in in wages and salaries in the next couple years.
In looking over the last year, the sectors of nonfarm employment that have shown the most growth are educational and health services (11.3 percent), construction (5.7 percent), professional and business services (4.7 percent) and manufacturing (2.5 percent). As is indicated in Figure , 3.8 percent of the growth in Construction in in June 2014 alone, bringing an additional 3,800 jobs as a result of the housing recovery.
In addition to Oregon’s job growth, the Bureau of Labor Statistics reports that Oregon’s unemployment rate has remained largely stable in the second quarter in the 6.9 percent range.
0.0%
0.5%
1.0%
1.5%
2.0%
2.5%
3.0%
3.5%
2007 2008 2009 2010 2011 2012 2013 2014 2015

STATE OF THE ECONOMY HARRISON 14
Figure 9: Oregon Job Growth, Nonfarm Payroll Employment, Seasonally Adjusted (thousands)
Change From % Change From Jun-14 May-14 Jun-13 May-14 Jun-13 May-14 Jun-13
Mining and Logging 7.8 7.8 7.7 0.0 0.1 0.0% 1.3%
Construction 78.2 74.4 74.0 3.8 4.2 5.1% 5.7%
Manufacturing 179.2 178.1 174.9 1.1 4.3 0.6% 2.5%
Trade, Transport and Utilities 324.0 323.7 318.1 0.3 5.9 0.1% 1.9%
Financial Activities 91.2 91.4 91.4 -0.2 -0.2 -0.2% -0.2%
Professional and Business Services 213.8 214.9 209.1 -1.1 4.7 -0.5% 2.2%
Educational and Health Services 252.1 248.6 240.8 3.5 11.3 1.4% 4.7%
Leisure and Hospitality 181.1 182.2 176.9 -1.1 4.2 -0.6% 2.4%
Other Services 59.8 59.5 57.9 0.3 1.9 0.5% 3.3%
Government 289.7 291.2 288.1 -1.5 1.6 -0.5% 0.6%
Total 1,710.10 1,714.40 1,670.70 -4.3 39.4 -0.3% 2.4%
Source: Oregon Employment Department
Figure 10: Portland-Vancouver-Hillsboro MSA, Nonfarm Payroll Employment, Not Seasonally Adjusted
Feb 2014 March 2014 April 2014 May 2014 June 2014
Total Non-farm Employment 1,043,000 1,049,700 1,061,800 1,068,200 1,073,900
Unemployment rate 6.4% 6.4% 6.3% 6.3% 6.1%
Mining and Logging 900 0.0% 900 0.0% 900 0.0% 1,000 11.1% 1,000 0.0%
Construction 50,800 -0.2% 52,000 2.4% 55,300 6.3% 55,300 0.0% 56,200 1.6%
Manufacturing 116,000 0.5% 116,600 0.5% 118,500 1.6% 118,500 0.0% 119,300 0.7%
Trade, Transportation, & Utilities 194,900 -0.5% 194,300 -0.3% 195,900 0.8% 197,600 0.9% 198,800 0.6%
Information 22,700 -0.4% 22,900 0.9% 22,600 -1.3% 22,700 0.4% 23,000 1.3%
Financial Activities 62,600 0.6% 63,100 0.8% 63,400 0.5% 63,900 0.8% 64,400 0.8%
Professional & Business Services 153,100 0.4% 154,000 0.6% 158,000 2.6% 158,200 0.1% 159,500 0.8%
Educational & Health Services 154,200 2.1% 155,900 1.1% 157,900 1.3% 156,900 -0.6% 154,600 -1.5%
Leisure and Hospitality 103,200 -0.4% 105,000 1.7% 105,600 0.6% 107,800 2.1% 109,300 1.4%
Other Services 37,700 2.2% 37,600 -0.3% 37,100 -1.3% 37,500 1.1% 38,300 2.1%
Government 146,900 0.6% 147,400 0.3% 147,700 0.2% 148,800 0.7% 149,500 0.5%
STATE OF THE ECONOMY HARRISON 15
Source: Oregon Employment Department
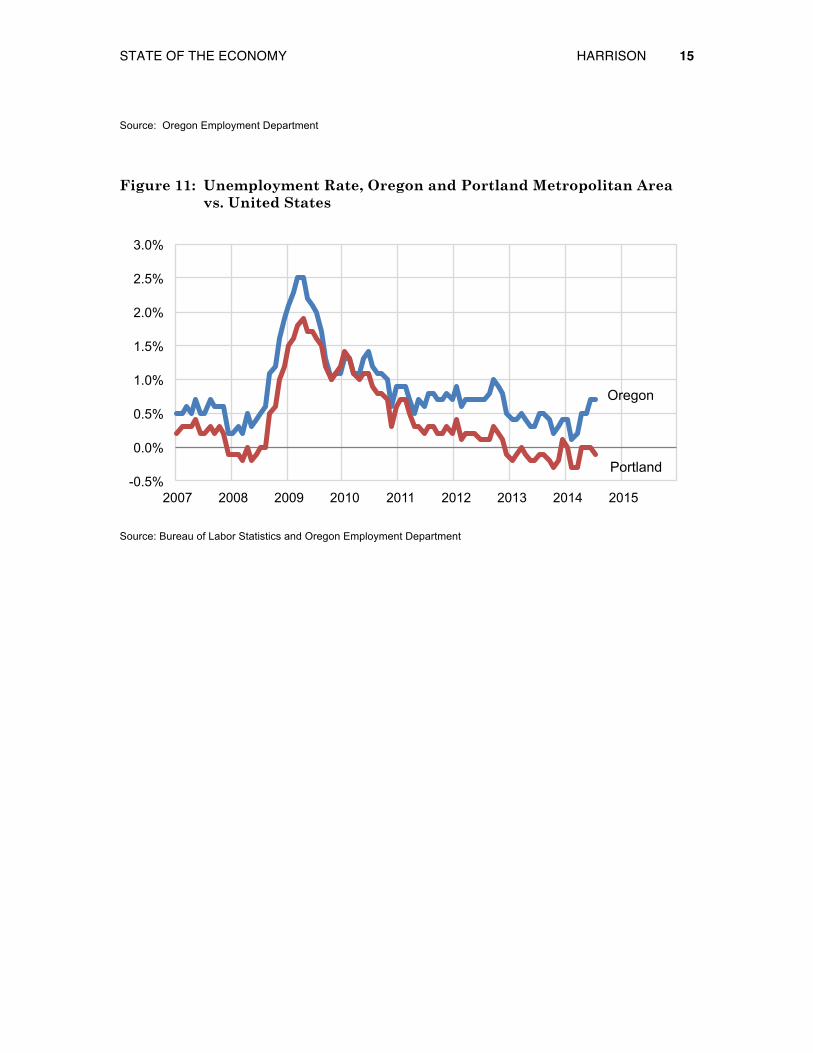
Figure 11: Unemployment Rate, Oregon and Portland Metropolitan Area vs. United States
Source: Bureau of Labor Statistics and Oregon Employment Department
-0.5%
0.0%
0.5%
1.0%
1.5%
2.0%
2.5%
3.0%
2007 2008 2009 2010 2011 2012 2013 2014 2015
Oregon
Portland
STATE OF THE ECONOMY HARRISON 16
In looking closer at the Portland-Vancouver-Hillsboro MSA, there has been robust employment growth of 2.9 percent over the last 12 months, far surpassing the national growth. Since March, the sectors that have brought the highest number of jobs are Leisure and Hospitality (+3,700), Trade, Transportation, & Utilities (+2,900), and Government (+1,800).
With the exception of a short time in 2008, Oregon and Portland’s unemployment rate have typically trended above the national rate since 1998, that is, until December 2012, when the Portland-Vancouver-Hillsboro MSA rate fell. It has since been with equal to or lower than the national rate, with no exception in June 2014, when it ties with the national rate at 6.1 percent, a drop of 0.3 percent since March.
The Portland-Vancouver-Hillsboro MSA has typically trended above the national average, with Oregon’s rate even higher. However, since December 2012, the MSA unemployment rate has remained equal or lower than the national average at 6.1 percent, dropping slightly since the previous quarter.
CONCLUSION
Overall, the national and local economy is not showing drastic signs of improvement nor further recession, and instead continues to grow steadily. Interest rates are low, unemployment rate is a little lower, GDP is expected to grow slightly, with no overwhelmingly positive changes in the near future. n

■ Scott Holden is a Senior Relationship Manager at First Republic Bank. He is currently working towards the Master of Real Estate Development degree through a joint program of the School of Business Administration and the School of Urban Studies and Planning where he is an RMLS Student Fellow. Any errors or omissions are the author’s responsibility. Any opinions expressed are those of the author solely and do not represent the opinions of any other person or entity. Center for Real Estate Quarterly Report, vol. 8, no. 3. Summer 2014 17
RESIDENTIAL MARKET ANALYSIS
SCOTT HOLDEN
RMLS Student Fellow Master of Real Estate Development Graduate Student
Nationally, existing homes sales increased by 2.6 percent to a seasonally adjusted annual rate of 5.04 million in June as reported by the National Association of Real-tors. This is the fastest pace since October 2013, but 2.3 percent below the second quarter of 2013.
Lawrence Yun, NAR Chief Economist, stated housing fundamentals are moving in the right direction. “Inventories are at their highest level in over a year and price gains have slowed to much more welcoming levels in many parts of the country. This bodes well for rising home sales in the upcoming months as consumers are provided with more choices,” Yun said. “On the contrary, new home construction needs to rise by at least 50 percent for a complete return to a balanced market because supply shortages—particularly in the West—are still putting upward pressure on prices.”
Interest rates continue to stay low and under normal economic and lending conditions the market could be stronger. While job growth is better in 2014 the NAR reports wages are stagnant. “Hiring has been a bright spot in the economy this year, adding an average of 230,000 jobs each month,” Yun said. “However, the lack of

RESIDENTIAL MARKET ANALYSIS HOLDEN 18
wage increases is leaving a large pool of potential homebuyers on the sidelines who otherwise would be taking advantage of low interest rates. Income growth below price appreciation will hurt affordability.”
Also, cited by the NAR in relationship to affordability is the difficulty in which young potential homebuyer’s area having raising the larger down payments that are required to qualify. While there are loans like the FHA mortgage that require a smaller down payment, the high cost of the mortgage insurance is a barrier to most first time homebuyers.
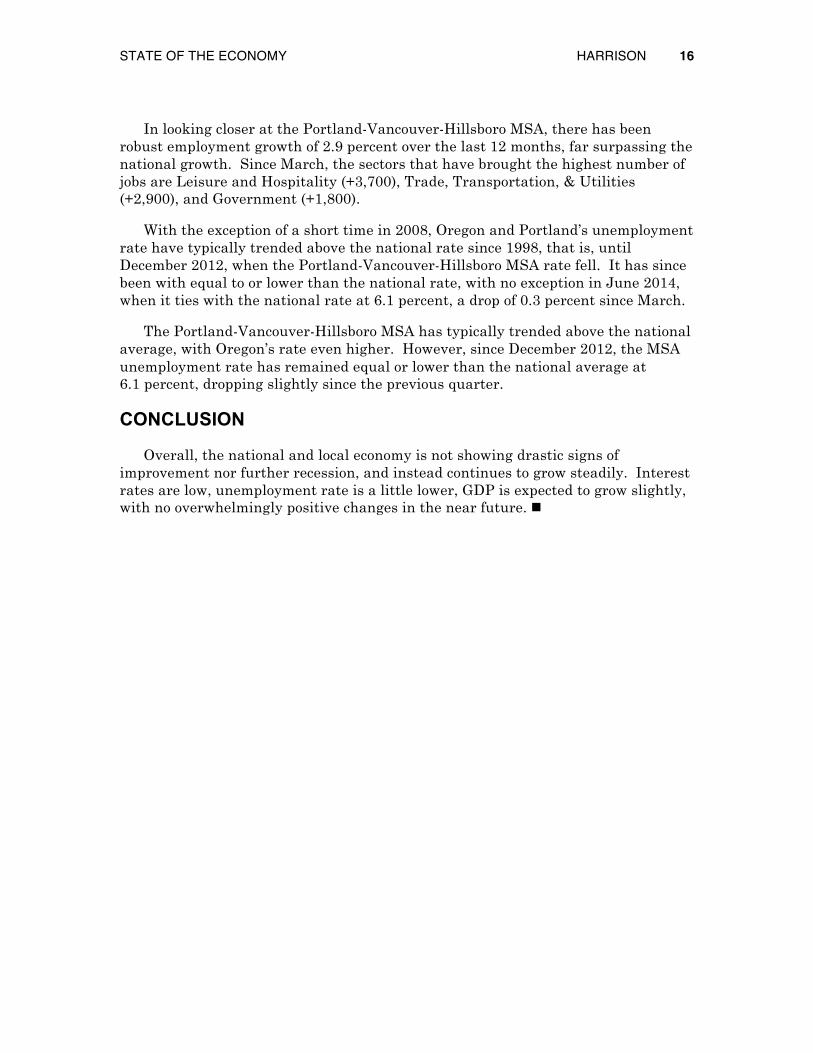
Single family building permits were up 599 units in the second quarter of 2014 compared to the second quarter of 2013 in the Portland metro area. Permits issued rose from 2,840 to 3,439 a 19 percent increase. This was the second strongest quar-ter since the first quarter of 2007. Only the third quarter of 2013 had more permits issued with 3,970.
During the same time permitting the state as a whole was virtually unchanged at 4,535 permits issued. Bend and Medford both saw declines in the number of per-mit issued. Bend saw the largest decline falling from 580 permits issued in the se-cond quarter of 2013 to 329 in the second quarter of 2014, a 43 percent drop. Med-ford dropped 51 units from 260 to 209. Eugene held steady with a slight decline from 290 to 280.
Source: U.S. Census Bureau
4535
0 1,000 2,000 3,000 4,000 5,000 6,000 7,000 8,000 9,000
2003
2004
2005
2006
2007
2008
2009
2010
2011
2012
2013
2014
Building permits for new private housing Oregon, statewide
RESIDENTIAL MARKET ANALYSIS HOLDEN 19
Source: U.S. Census Bureau
Source: U.S. Census Bureau
3439
0 500
1,000 1,500 2,000 2,500 3,000 3,500 4,000 4,500 5,000
2003
2004
2005
2006
2007
2008
2009
2010
2011
2012
2013
2014
Building permits for new private housing Portland-Vancouver-Beaverton MSA
329
0
200
400
600
800
1,000
1,200
1,400
2003
2004
2005
2006
2007
2008
2009
2010
2011
2012
2013
2014
Building permits for new private housing Bend

RESIDENTIAL MARKET ANALYSIS HOLDEN 20
Source: U.S. Census Bureau
Source: U.S. Census Bureau
280
0
100
200
300
400
500
600
700
800
2003
2004
2005
2006
2007
2008
2009
2010
2011
2012
2013
2014
Building permits for new private housing Eugene-Springfield
209
0
100
200
300
400
500
600
700
2003
2004
2005
2006
2007
2008
2009
2010
2011
2012
2013
2014
Building permits for new private housing Medford

RESIDENTIAL MARKET ANALYSIS HOLDEN 21
PORTLAND
Portland saw 6,762 closed existing single family transaction in the second quar-ter of 2014 that is a decrease of 5.7 percent over the 7,175 transaction in the second quarter of 2013 but the second best quarter since 2006. The median sales price for existing homes was $284,000, up 7.1 percent from $265,000 in the first quarter. Marketing time also fell from an average of 69 days to 47 days. RMLS reports that inventory held steady at 2.8 months for three months in a row.
New construction is also seeing gains. Transactions are up from 308 transactions in the second quarter of 2013 to 594 in the second quarter of 2014. The median sales price increased $10,829 from $350,146 in the first quarter of 2014 to 360,975 in the second quarter.
Source: RMLS
6762
0 1,000 2,000 3,000 4,000 5,000 6,000 7,000 8,000 9,000
2003
2004
2005
2006
2007
2008
2009
2010
2011
2012
2013
2014
Number of transactions Portland metro, existing homes

RESIDENTIAL MARKET ANALYSIS HOLDEN 22
Source: RMLS
Source: RMLS
$284,000
$150,000
$200,000
$250,000
$300,000
$350,000
$400,000 20
03
2004
2005
2006
2007
2008
2009
2010
2011
2012
2013
2014
Median sales price Portland metro, existing homes
594
0
200
400
600
800
1,000
1,200
2003
2004
2005
2006
2007
2008
2009
2010
2011
2012
2013
2014
Number of transactions Portland metro, new detached homes

RESIDENTIAL MARKET ANALYSIS HOLDEN 23
Source: RMLS
Source: RMLS
$360,975
$150,000
$200,000
$250,000
$300,000
$350,000
$400,000 20
03
2004
2005
2006
2007
2008
2009
2010
2011
2012
2013
2014
Median sales price Portland metro, new homes
98%
85%
90%
95%
100%
105%
2003
2004
2005
2006
2007
2008
2009
2010
2011
2012
2013
2014
Ratio of sales price to list price Portland metro, existing homes

RESIDENTIAL MARKET ANALYSIS HOLDEN 24
Source: RMLS
VANCOUVER/CLARK COUNTY
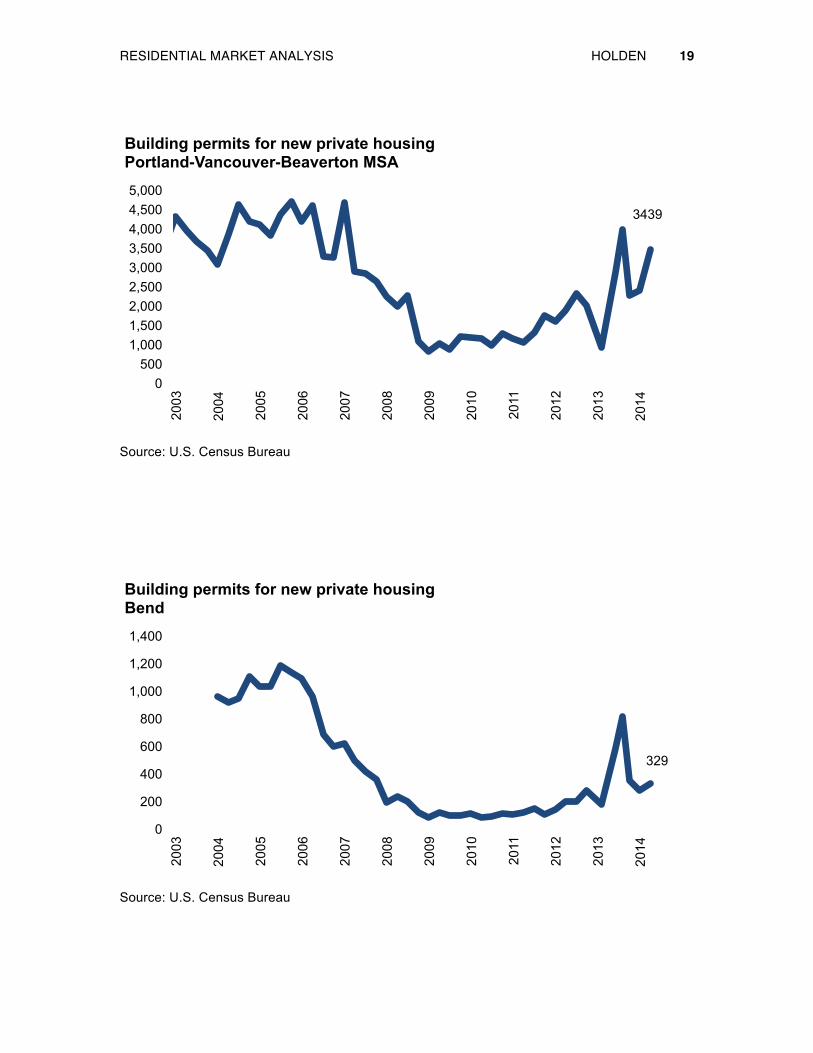
Vancouver‘s median house price rose 6.6 percent to $218,000 from the first quar-ter’s median of $204,450. Even though the number of transactions dropped from 1,185 in the second quarter of 2013 to 1,042 in the second quarter of 2014, it was still the second best quarter since prior to 2007. Average number of days on the market dropped from 84 days in the first quarter to 58 days in the second quarter of 2014.
Clark County excluding Vancouver fared similarly. The median house price climbed from $250,000 the previous quarter to $256,475 in the second quarter of 2014, the number of overall sales was down. Sales fell from 880 in the second quar-ter of 2013 to 684 in the second quarter of 2014 a 22 percent decline. Days on market dropped from 94 to 83.
47
0
15
30
45
60
75
90
105
2003
2004
2005
2006
2007
2008
2009
2010
2011
2012
2013
2014
2015
Days on market Portland metro, existing homes
RESIDENTIAL MARKET ANALYSIS HOLDEN 25
Source: RMLS
Source: RMLS
1042
0
250
500
750
1,000
1,250
1,500 20
03
2004
2005
2006
2007
2008
2009
2010
2011
2012
2013
2014
Number of transactions Vancouver, existing homes
$218,000
$150,000
$200,000
$250,000
$300,000
$350,000
2003
2004
2005
2006
2007
2008
2009
2010
2011
2012
2013
2014
Median sales price Vancouver, existing homes

RESIDENTIAL MARKET ANALYSIS HOLDEN 26
Source: RMLS
Source: RMLS
58
0
15
30
45
60
75
90
105
120
2003
2004
2005
2006
2007
2008
2009
2010
2011
2012
2013
2014
Days on market Vancouver, existing homes
684
0
250
500
750
1,000
2003
2004
2005
2006
2007
2008
2009
2010
2011
2012
2013
2014
Number of transactions Clark County, excluding Vancouver, existing homes

RESIDENTIAL MARKET ANALYSIS HOLDEN 27
Source: RMLS
Source: RMLS
$256,475
$150,000
$200,000
$250,000
$300,000
$350,000 20
03
2004
2005
2006
2007
2008
2009
2010
2011
2012
2013
2014
Median sales price Clark County, excluding Vancouver, existing homes
83
0 15 30 45 60 75 90
105 120 135
2003
2004
2005
2006
2007
2008
2009
2010
2011
2012
2013
2014
Days on market Clark County, excluding Vancouver, existing homes

RESIDENTIAL MARKET ANALYSIS HOLDEN 28
CENTRAL OREGON
Bend continues its rebound and median prices show it rising 16 percent in the second quarter of 2014 to $290,000 compared to $250,000 in the first quarter of 2014. Transactions were down slightly to 624 in the second quarter of 2014 com-pared to 670 in the second quarter of 2013. Average days on the market dropped from 126 to 120 days.
Redmond recorded its highest number of transactions at 221 since prior to 2007. That is an increase of 15 percent over the second quarter of 2013 at 191. Median price rose from $179,945 in the first quarter of 2014 to $192,750 in the second quar-ter of 2014 a7 percent increase. Average marketing time remained steady at 137 days.
Source: RMLS
624
0
100
200
300
400
500
600
700
800
2003
2004
2005
2006
2007
2008
2009
2010
2011
2012
2013
2014
Number of transactions Bend, under 1 acre

RESIDENTIAL MARKET ANALYSIS HOLDEN 29
Source: RMLS
Source: RMLS
$290,000
$100,000
$150,000
$200,000
$250,000
$300,000
$350,000
$400,000 20
03
2004
2005
2006
2007
2008
2009
2010
2011
2012
2013
2014
Median sales price Bend, under 1 acre
221
0
50
100
150
200
250
300
2003
2004
2005
2006
2007
2008
2009
2010
2011
2012
2013
2014
Number of transactions Redmond, under 1 acre

RESIDENTIAL MARKET ANALYSIS HOLDEN 30
Source: RMLS
$192,750
$100,000
$150,000
$200,000
$250,000
$300,000
$350,000
$400,000 20
03
2004
2005
2006
2007
2008
2009
2010
2011
2012
2013
2014
Median sales price Redmond, under 1 acre

RESIDENTIAL MARKET ANALYSIS HOLDEN 31
WILLAMETTE VALLEY
With the exception of Keizer, the valley areas were all up over the first quarter and only Eugene failed to post year over year gains from the second quarter of 2013. Marion and Lane Counties showed the largest increase in the second quarter over the first quarter of 2014 with a 13 percent increase in the median house price from $184,950 to $209,000. Marion (18.6 percent), Salem (11.7 percent), Polk (15 percent), and Keizer (12.7 percent) All counties showed double digit gains in median price from the second quarter of 2013 to the second quarter of 2014.
Source: RMLS
$100,000
$150,000
$200,000
$250,000
$300,000
2003
2004
2005
2006
2007
2008
2009
2010
2011
2012
2013
2014
Median sales price Willamette Valley, existing detached homes
Benton
Lane
Marion
Polk
Linn

RESIDENTIAL MARKET ANALYSIS HOLDEN 32
SALEM
Compared to the second quarter of 2013 the Salem median house price rose 12 percent to $184,400. The number of sales transactions held steady at 514 while average days on the market dropped to 108 in the second quarter of 2014 relative to 128 days in the first quarter of 2014.
514
0
100
200
300
400
500
600
700
800
2003
2004
2005
2006
2007
2008
2009
2010
2011
2012
2013
2014
Number of transactions Salem, existing homes

RESIDENTIAL MARKET ANALYSIS HOLDEN 33
Source: RMLS
Source: RMLS
$184,400
$100,000
$150,000
$200,000
$250,000 20
03
2004
2005
2006
2007
2008
2009
2010
2011
2012
2013
2014
Median sales price Salem, existing homes
108
0
30
60
90
120
150
180
210
2003
2004
2005
2006
2007
2008
2009
2010
2011
2012
2013
2014
Days on market Salem, existing homes

RESIDENTIAL MARKET ANALYSIS HOLDEN 34
EUGENE/SPRINGFIELD
The median sales price in Eugene continues to rise, up 7 percent to $225,000 in the second quarter of 2014 from the first quarter of 2014. The number of transac-tions fell from 908 in the second quarter of 2013 to 713 in the second quarter of 2013. Average days on the market also dropped from 82 to 64.
Source: RMLS
713
0
200
400
600
800
1,000
1,200
2003
2004
2005
2006
2007
2008
2009
2010
2011
2012
2013
2014
Number of transactions Eugene-Springfield, existing homes

RESIDENTIAL MARKET ANALYSIS HOLDEN 35
Source: RMLS
Source: RMLS
$225,000
$100,000
$150,000
$200,000
$250,000
$300,000 20
03
2004
2005
2006
2007
2008
2009
2010
2011
2012
2013
2014
Median sales price Eugene-Springfield, existing homes
64
0 15 30 45 60 75 90
105 120 135
2003
2004
2005
2006
2007
2008
2009
2010
2011
2012
2013
2014
Days on market Eugene-Springfield, existing homes
RESIDENTIAL MARKET ANALYSIS HOLDEN 36
SOUTHERN OREGON
Josephine County had a decrease in existing home sales from 127 in the second quarter of 2013 to 103 in the second quarter of 2014. Average number of days on the market increased from 63 to 72. The median price rose 7.9 percent from $164,000 to $177,000.
Jackson County had an increase in existing home sales from 569 in the second quarter of 2013 to 575 in the first quarter of 2014. Average days on the market fell from 52 to 42days. The median price rose 9.5 percent to $207,000. n

■ Scott Holden is a Senior Relationship Manager at First Republic Bank. He is currently working towards the Master of Real Estate Development degree through a joint program of the School of Business Administration and the School of Urban Studies and Planning where he is an RMLS Student Fellow. Any errors or omissions are the author’s responsibility. Any opinions expressed are those of the author solely and do not represent the opinions of any other person or entity. Center for Real Estate Quarterly Report, vol. 8, no. 3. Summer 2014 37
MULTIFAMILY MARKET ANALYSIS
SCOTT HOLDEN
RMLS Student Fellow Master of Real Estate Development Graduate Student
Portland ranked ninth in the U.S. at 2.3 percent in rent growth during the second quarter of 2014 and ranked fourth at 7.4 percent in annual growth rent for the year ending in the second quarter of 2014 according to RealPage® MPF Research Division Report.
“Apartment owners and operators continue to have strong pricing power right now,” said MPF Research Vice President, Greg Willett. “Sizable rent hikes are occurring, especially in middle-market to bottom-tier properties, reflecting the especially tight occupancy rates seen for those units. If there’s a surprise in recent results, it’s that significant rent growth is also being generated at the very top of the apartment product spectrum. Even in projects finished just a year or so ago, higher rents are being realized when leases turn over, despite the fact that there’s competition from additional brand new developments just entering the market.”
According to Freddie Mac Executive, David Brinkman, citing the Joint Center on Housing Studies of Harvard University report, 2014 State of the Nation's Housing, “Demographic forces alone could create as many as 4.7 million more renter
MULTIFAMILY MARKET ANALYSIS HOLDEN 38
households by 2023.” Additionally Brinkman notes “Construction starts of new multifamily units have rebounded, following a building drought during the financial crises. In the last few quarters, starts hit historical averages—an annualized rate of around 330,000 units. As completions begin flowing into inventory at levels consistent with historical averages in the next couple of years, we're looking at about 3.1 million new units over the next 10 years.” This falls short of the 4.7 million renter households projected. Portland is in great shape to be the beneficiary of the continued rental demand. Higher cap rates than any other major west coast city, employment growth and the destination de jour for millennial’s puts Portland on the national map for investment dollars.
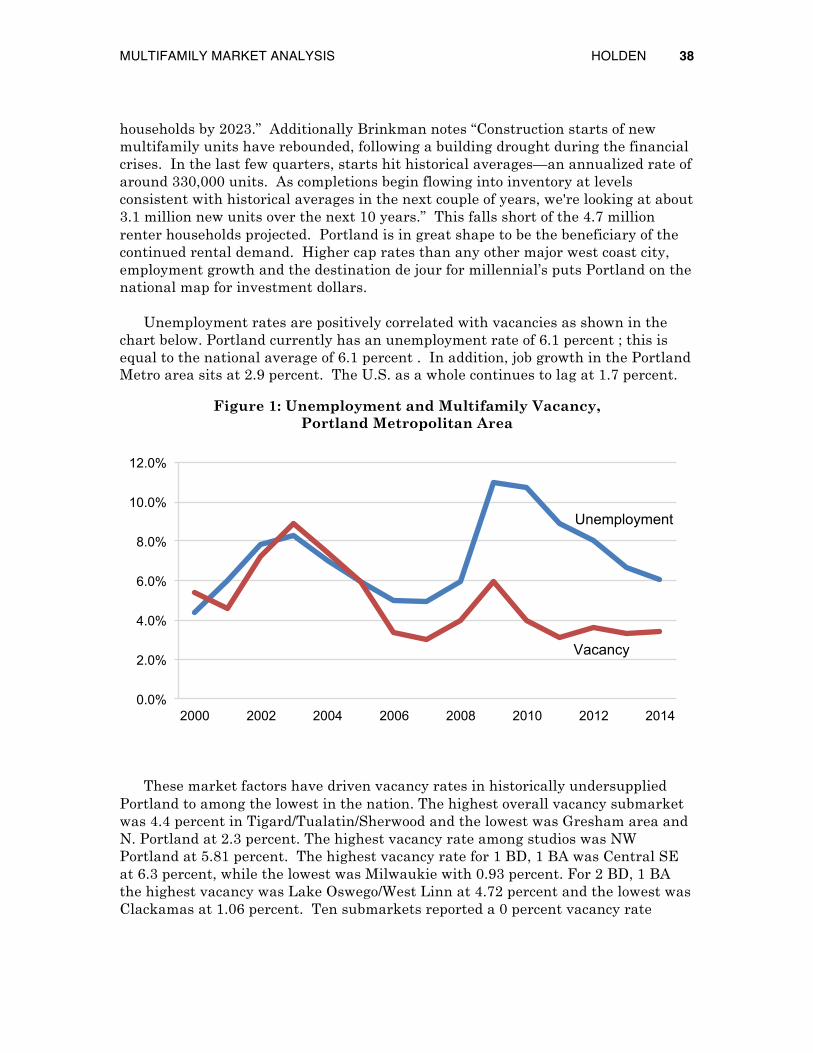
Unemployment rates are positively correlated with vacancies as shown in the chart below. Portland currently has an unemployment rate of 6.1 percent ; this is equal to the national average of 6.1 percent . In addition, job growth in the Portland Metro area sits at 2.9 percent. The U.S. as a whole continues to lag at 1.7 percent.
Figure 1: Unemployment and Multifamily Vacancy, Portland Metropolitan Area
These market factors have driven vacancy rates in historically undersupplied Portland to among the lowest in the nation. The highest overall vacancy submarket was 4.4 percent in Tigard/Tualatin/Sherwood and the lowest was Gresham area and N. Portland at 2.3 percent. The highest vacancy rate among studios was NW Portland at 5.81 percent. The highest vacancy rate for 1 BD, 1 BA was Central SE at 6.3 percent, while the lowest was Milwaukie with 0.93 percent. For 2 BD, 1 BA the highest vacancy was Lake Oswego/West Linn at 4.72 percent and the lowest was Clackamas at 1.06 percent. Ten submarkets reported a 0 percent vacancy rate
0.0%
2.0%
4.0%
6.0%
8.0%
10.0%
12.0%
2000 2002 2004 2006 2008 2010 2012 2014
Unemployment
Vacancy

MULTIFAMILY MARKET ANALYSIS HOLDEN 39
among 3 BD, 1 BA, but many of these were based on less than 100 units surveyed. Lake Oswego/West Linn and Wilsonville reported 9.56 percent and 7.02 percent vacancy respectively for 3 BD, 2 BA units which are significantly higher than other areas.
Figure 2: Vacancy Rates by Submarket Spring 2014Portland Metropolitan Area
Source: MMHA
The submarket with the highest overall rent/SF is downtown Portland with a $1.93 average, followed by NW Portland at $1.77. The lowest overall rent/SF is shared between Outer NE at $0.87 per square foot and Gresham at $0.88 per square foot. The highest rent/SF for studios was NW Portland at $2.09 and the lowest was Hillsboro/N of HWY 26 at $1.14. The highest rent/SF for 1 BD, 1 BA was Downtown at $1.93 and the lowest was Outer Northeast at $0.96. The highest rent/SF for 2 BD, 1 BA was Downtown at $1.98 per SF and the lowest was $0.81 per SF in Troutdale/Fairview/Wood Village/Gresham.
3.5%
4.3% 3.9%
2.4% 2.3% 2.8%
3.7%
2.4% 2.3% 2.7%
4.0%
2.5%
3.8% 3.7% 4.1%
3.0% 3.1%
4.4%
3.3% 3.0%
0.0% 0.5% 1.0% 1.5% 2.0% 2.5% 3.0% 3.5% 4.0% 4.5% 5.0%

MULTIFAMILY MARKET ANALYSIS HOLDEN 40
Figure 3: Rent / SF by Submarket Spring 2014 Portland Metropolitan Area
Source: MMHA
According to data provided by Steve Morris, Senior Advisor with Sperry Van Ness|Bluestone & Hockley, there were 42 multifamily sales over $450,000 in the Portland Metro area in the second quarter of 2014. The average unit size was 50.22 units and the average price per unit was $151,700. Real Capital Analytics reports Cap rates in Portland for multifamily properties have dropped from the previous quarters 6.81 percent to 6.5 percent in the second quarter. Portland’s cap rate of 6.5 percent puts it at the highest yield for all major west coast MSA’s. It is a full 2 percent higher than San Francisco with the lowest average cap of 4.3 percent and 0.6 percent above Sacramento, CA at 5.9 percent.
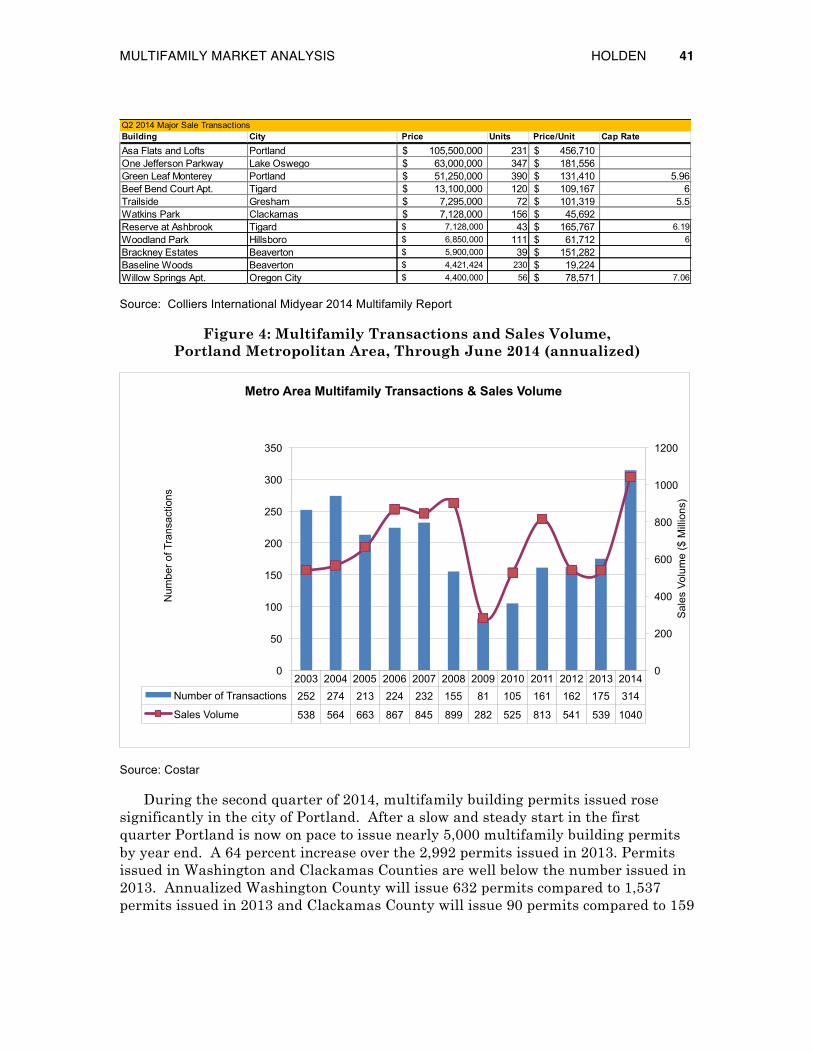
There were four deals over $10 million in the second quarter. Asa Flats and Lofts (231 units) sold for $105.5 million, One Jefferson Parkway (347 units) sold for $63 million, Green Leaf Monterey (390 units) sold for $51.2 million and Beef Bend Court Apartments (120 units) sold for $13.1
Portland continues to attract out of state buyers with roughly one-third of all buyers in the second quarter of 2014 having listed an address other than Oregon. It is clear with continued population and job growth the market will remain active.
$1.93 $1.77
$1.26 $1.29 $1.34 $1.41
$0.98 $0.87 $0.88 $0.97 $1.20
$1.01 $0.94 $1.05 $1.08 $1.06 $1.12 $1.09 $0.93 $0.97
$0.00 $0.20 $0.40 $0.60 $0.80 $1.00 $1.20 $1.40 $1.60 $1.80 $2.00
MULTIFAMILY MARKET ANALYSIS HOLDEN 41
Source: Colliers International Midyear 2014 Multifamily Report
Figure 4: Multifamily Transactions and Sales Volume, Portland Metropolitan Area, Through June 2014 (annualized)
Source: Costar
During the second quarter of 2014, multifamily building permits issued rose significantly in the city of Portland. After a slow and steady start in the first quarter Portland is now on pace to issue nearly 5,000 multifamily building permits by year end. A 64 percent increase over the 2,992 permits issued in 2013. Permits issued in Washington and Clackamas Counties are well below the number issued in 2013. Annualized Washington County will issue 632 permits compared to 1,537 permits issued in 2013 and Clackamas County will issue 90 permits compared to 159
Q2 2014 Major Sale TransactionsBuilding City Price Units Price/Unit Cap RateAsa Flats and Lofts Portland 105,500,000$ 231 456,710$ One Jefferson Parkway Lake Oswego 63,000,000$ 347 181,556$ Green Leaf Monterey Portland 51,250,000$ 390 131,410$ 5.96Beef Bend Court Apt. Tigard 13,100,000$ 120 109,167$ 6Trailside Gresham 7,295,000$ 72 101,319$ 5.5Watkins Park Clackamas 7,128,000$ 156 45,692$ Reserve at Ashbrook Tigard 7,128,000$ 43 165,767$ 6.19Woodland Park Hillsboro 6,850,000$ 111 61,712$ 6Brackney Estates Beaverton 5,900,000$ 39 151,282$ Baseline Woods Beaverton 4,421,424$ 230 19,224$ Willow Springs Apt. Oregon City 4,400,000$ 56 78,571$ 7.06
2003 2004 2005 2006 2007 2008 2009 2010 2011 2012 2013 2014 Number of Transactions 252 274 213 224 232 155 81 105 161 162 175 314
Sales Volume 538 564 663 867 845 899 282 525 813 541 539 1040
0
200
400
600
800
1000
1200
0
50
100
150
200
250
300
350
Sal
es V
olum
e ($
Mill
ions
)
Num
ber o
f Tra
nsac
tions
Metro Area Multifamily Transactions & Sales Volume

MULTIFAMILY MARKET ANALYSIS HOLDEN 42
permits issued in 2013. Prior to the downturn the Portland Metro area was building about 4000 new multifamily units per year.
Metro is projecting that Portland alone will require 5,000 multifamily units per year through 2035to accommodate growth of 205,594 people within the city limits. n
Figure 5: Multifamily Building Permits Issued, March 2014
Number of permits through June 2014 is annualized
Source: US Census
2003 2004 2005 2006 2007 2008 2009 2010 2011 2012 2013 2014 City of Portland 1793 1623 2466 2038 2802 2103 345 622 852 1,612 2,992 4908
Multnomah Co. (excluding Portland) 1062 288 46 119 56 24 125 47 0 0 12 4
Washington Co. 1040 1279 664 1364 674 572 319 212 473 630 1,537 632
Clackamas County 81 181 226 564 100 0 128 5 371 435 159 90
0
1000
2000
3000
4000
5000
6000

n A. Synkai Harrison is a Master of Real Estate Development candidate and has been awarded the Center for Real Estate Fellowship. Any errors or omissions are the author’s responsibility. Any opinions are those of the author solely and do not represent the opinions of any other person or entity.. Center for Real Estate Quarterly Report, vol. 8, no. 3. Summer 2014 43
OFFICE MARKET ANALYSIS
A. SYNKAI HARRISON
Portland State University
Portland is reporting the lowest metro area office vacancy rates in the county. The area’s economy continues to grow with unemployment dropping to 6.1 percent, in June, it’s the lowest level since mid-2008. Professional and business services are showing the largest number of jobs gained year-over-year with, education and health services as well as trade, transportation and utilities sectors showing significant growth as well.
VACANCY
Jones Lang LaSalle reports that the technology sector is driving demand for office space in the Portland area, particularly within the Central Business District, which has led in part to Portland having the lowest office vacancy rate in the nation. According to CoStar, tech firms are leaving areas like San Francisco for cheaper office rental rates in Portland’s Central Business District and suburbs.
According to Jones Lang LaSalle, 30 percent of the demand for office space is coming from high tech and professional services companies and reports a total vacancy rate of 10.5 percent. CoStar reported a total vacancy rate of 8.6 percent at the end of the second quarter of 2014. Colliers reported a rate of 9.7 percent down from 10.4 percent in the second quarter of 2013. Kidder Mathews is reporting the lowest average vacancy rate for the Portland market at 8.7 percent
According to CoStar, Class A, as of the end of the second quarter of 2014, reported a vacancy rate of 10.3 percent. This was a slight decrease over last quarter

OFFICE MARKET ANALYSIS HARRISON 44
of 10.4 percent. The Class B market fared somewhat better at 8.6 percent equaling the overall market average according to CoStar. This was a significant improvement over the last quarter which ended at 9.2 percent. Class C properties had the lowest vacancy rate at the end of second quarter at 6.7 percent. Rates in the CBD averaged 9.6 percent at the end of the second quarter with Portland’s suburban office market experiencing somewhat lower vacancy rates than the CBD, averaging 8.2 percent. According to Colliers, Portland’s suburban vacancy rate is one of the lowest in country, surpassing areas such as Silicon Valley, Seattle, Houston, Dallas and Los Angeles.
Figure 1: Portland Office Market Vacancy Rate, 2007–2014
Source: Kidder Mathews
RENTAL RATES
Portland’s annual job growth rate, at 2.8 percent, is beating the national average of 1.8 percent. As the area’s economy continues to grow and unemployment falls, this will continue to drive demand for more office space. Colliers estimates that the supply of new construction over the next two years may not meet the growing demand which should continue to put upward pressure on rental rates.
CoStar reports a slight improvement in average office rental rates from the first quarter. At the end of the first quarter of 2014, rents averaged $20.44 per square foot whereas at the end of the second quarter, rates averaged $20.59. CBRE reports an average rental rate of $21.89 topping a fourth quarter 2008 peak of $21.86. Colliers reported an average annual rental rate of $21.07 per square foot. Jones
5.00%
6.00%
7.00%
8.00%
9.00%
10.00%
11.00%
12.00%
13.00%
14.00%
15.00%
2007 2008 2009 2010 2011 2012 2013 2014 2015

OFFICE MARKET ANALYSIS HARRISON 45
Lang LaSalle reported the highest average market rental rate of $ 21.87. According to CoStar Class A averaged $24.95 per square foot with Class B and C averaging $19.18 and $16.15 respectively.
CoStar reports that the average rate in Portland’s Central Business District came in at $24.26 compared to the suburban market’s average of $19.30 at the end of the second quarter.
Figure 2: Portland Office Market Average Asking Rents, 2007–2014
Source: Kidder Mathews
$18.00
$18.50
$19.00
$19.50
$20.00
$20.50
$21.00
$21.50
$22.00
2007 2008 2009 2010 2011 2012 2013 2014 2015

OFFICE MARKET ANALYSIS HARRISON 46
Figure 3: Office Market Average Asking Rents in Portland Area Submarkets, 2007–2014
Source: CoStar/Colliers International
ABSORPTION AND LEASING
According to CoStar, at the end of the second quarter of 2014, the Portland Office market experienced 358,112 square feet of positive absorption. This is a slight decrease compared to the first quarter of 2014 when the market experienced positive absorption of 429,407 square feet.
According to Colliers, the Portland office market absorbed over 787,000 square feet of space last year. Year to date total absorption at the end of the second quarter of 2014 was 671,577 square feet, so it would appear that Portland’s office market is on track to exceed last year’s totals.
$26.70
$24.26
$22.67 $22.07
$20.40 $20.20 $19.39
$18.68 $18.51 $18.17 $17.99 $17.95
$14.78
$0.00
$5.00
$10.00
$15.00
$20.00
$25.00
$30.00
Kru
se W
ay
Por
tland
CB
D
I-5 S
outh
Cor
ridor
N. B
eave
rton
Cla
ck. /
Milw
.
Lloy
d D
istri
ct
Sun
set C
orrid
or
Vanc
ouve
r Mal
l
SW
Clo
se-In
217
Cor
ridor
/Bea
v.
Clo
se-in
Eas
tsid
e
Nor
thw
est
Airp
ort W
ay
OFFICE MARKET ANALYSIS HARRISON 47
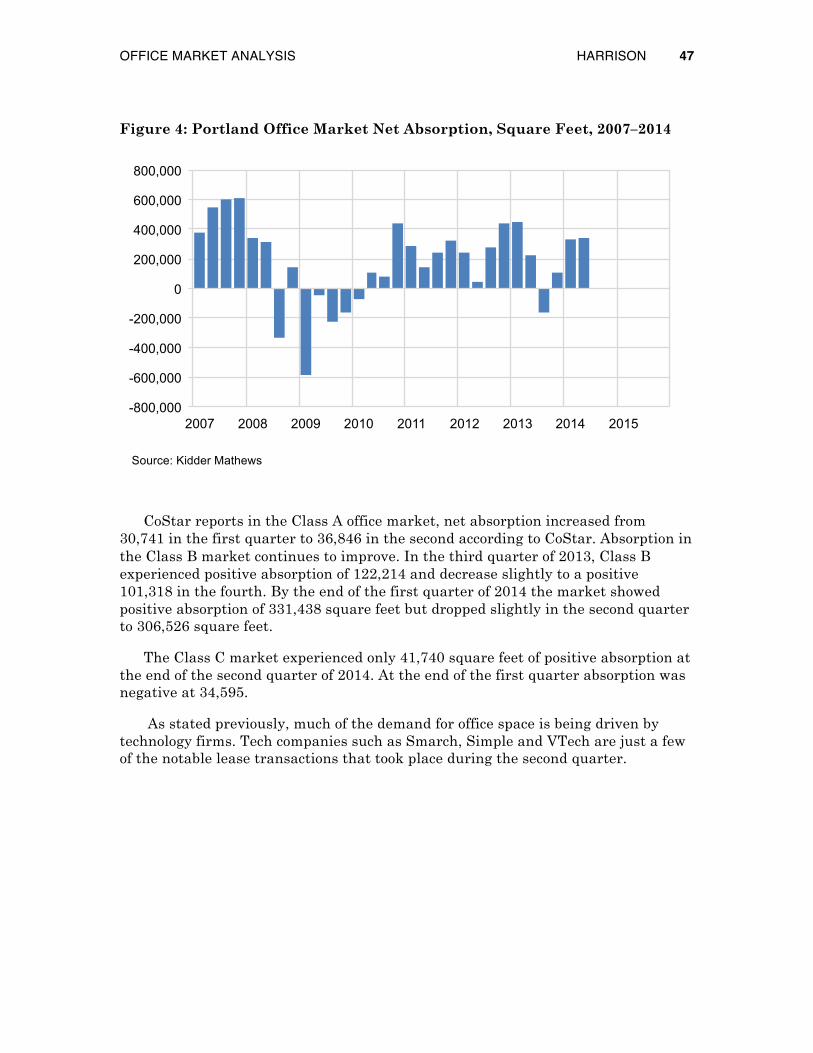
Figure 4: Portland Office Market Net Absorption, Square Feet, 2007–2014
Source: Kidder Mathews
CoStar reports in the Class A office market, net absorption increased from 30,741 in the first quarter to 36,846 in the second according to CoStar. Absorption in the Class B market continues to improve. In the third quarter of 2013, Class B experienced positive absorption of 122,214 and decrease slightly to a positive 101,318 in the fourth. By the end of the first quarter of 2014 the market showed positive absorption of 331,438 square feet but dropped slightly in the second quarter to 306,526 square feet.
The Class C market experienced only 41,740 square feet of positive absorption at the end of the second quarter of 2014. At the end of the first quarter absorption was negative at 34,595.
As stated previously, much of the demand for office space is being driven by technology firms. Tech companies such as Smarch, Simple and VTech are just a few of the notable lease transactions that took place during the second quarter.
-800,000
-600,000
-400,000
-200,000
0
200,000
400,000
600,000
800,000
2007 2008 2009 2010 2011 2012 2013 2014 2015

OFFICE MARKET ANALYSIS HARRISON 48
Table 1: Notable Lease Transactions
Tenant Address Market Size Genesis Financial Solutions The Atrium Sunset/HBO 72,574 Smarsh Pacific Tower CBD 47,640 Survey Monkey US Bancorp Tower CBD 38,288 Simple 905 NW 12th CBD 37,441 Audio Precision, Inc 5750 SW Arctic 217 Corridor 27,900 VTech Comm. Inc Nimbus Corp Ctr-Bld 3 217 Corridor 26,658 Lifewise Insurance CH2M/ Parkside Center CBD 20,301 Inovation Inc US Bancorp Tower CBD 18,426 Source: Colliers International
Table 2: Notable Sales Transactions
Tenant City Price Cascade Station I & II Portland $30,000,000 Washington Center Portland $9,000,000 811 NW Naito Parkway Portland $8,550,000 Woodlark Bldg Portland $6,850,000 Columbia Shores Off Bldg Vancouver $6,750,000 George Lawrence Bldg Portland $6,210,000 Orchards Center Orchards $5,650,000 Source: Colliers International

OFFICE MARKET ANALYSIS HARRISON 49
Figure 5: Portland Office Market Deliveries, Rentable Building Area, Square Feet, 2007–2014
Source: Kidder Mathews
DELIVERIES AND CONSTRUCTION
CoStar reports only 24,257 square feet of office space was delivered by the end of the second quarter compared to 119,521 in the first quarter of 2014. The market saw no deliveries during the fourth quarter of last year and only 20,000 at the end of the third according to CoStar. According to Jones Lang LaSalle, less than 100,000 square feet of space has come online this year and only 350,000 square feet will be delivered by the end of the year. With so little supply being delivered, if the trend of positive absorption continues this should continue to put upward pressure on rents which in turn could spur new development in the future.
CoStar identifies two notable projects in the works. The One North Radiator Building and the Park Avenue West Tower. Park Avenue West Tower reported being 69 percent pre-leased at the end of the quarter. One North-Radiator Building was reported as 54 percent pre-leased. Jones Lang LaSalle reports that Pearl West should break ground during the third quarter of this year. Also the renovation of 2&Taylor (the former Yamhill Marketplace) continues and should be completed by the end of this year. n
0
100,000
200,000
300,000
400,000
500,000
600,000
700,000
800,000
2007 2008 2009 2010 2011 2012 2013 2014 2015

n A. Synkai Harrison is a Master of Real Estate Development candidate and has been awarded the Center for Real Estate Fellowship. Any errors or omissions are the author’s responsibility. Any opinions are those of the author solely and do not represent the opinions of any other person or entity.. Center for Real Estate Quarterly Report, vol. 8, no. 3. Summer 2014 50
INDUSTRIAL MARKET ANALYSIS
A. SYNKAI HARRISON
Portland State University
CoStar reports that speculative development in the industrial market in Portland is on the rise due to a lack of inventory. Many of these new sites are being used to satisfy supply chain needs of e-commerce. In a recent article, the Portland Business Journal reports that finding suitable industrial land will become a challenge in the future as Portland city officials predict that the city will run out of industrial sites by 2025.
VACANCY
According to CoStar, at the end of the second quarter, Portland saw a vacancy rate in the industrial market of 5.9 percent compared to 6 percent in the first quarter of this year and the fourth quarter of 2013. During third quarter of 2013, the market experienced a 6.6 percent vacancy rate. Colliers reports a slightly lower total vacancy rate of 5.6 percent at the end of the second quarter compared to 6.6 percent one year ago.
Jones Lang LaSalle states that 2014 could be a record setting year for Portland’s industrial market. Portland’s submarkets, such as the Sunset Corridor, the I-5 Corridor and the NE Corridor, have vacancy rates below 5.5 percent, according to Jones Lang LaSalle. This will surely benefit owners and landlords as potential tenants continue to search for locations their operations.

INDUSTRIAL MARKET ANALYSIS HARRISON 51
Figure 1: Portland Industrial Market Vacancy Rate, 2007–2014
Source: Kidder Mathews
CoStar also reported an 11.1 percent vacancy rate for the flex market at the end of the second quarter which was a slight rise compared to last quarter’s rate of 11 percent. Flex vacancy was 11 percent in the fourth of 2013 and 13.2 percent in the third. Colliers reports a total vacancy rate for the flex market of 11.7 percent down from 14.5 percent at the end of the second quarter of 2013.
RENTAL RATES
Colliers reports an average asking rental rate $0.44 at the end of the second quarter. This rate has changed little over the past four quarters. During the second and fourth quarters of 2013 the rate remained at $0.44 but rose only slightly in the third quarter to $0.45.
Kidder Mathews reports an average asking rate of $0.45 for the second quarter of 2014 and $0.45 for the first quarter. At the end of the second quarter of 2013, Kidder Mathews reported an average asking rate of $0.45. Rental rates are expected to rise as the market waits for new construction to come online. Some see this as positive due to the limited number of properties that are available for lease or purchase.
Rental rates have remained flat over the past six quarters hovering around $0.44 per square foot. This could be the reason why there has been only modest speculative development so far this year.
5%
6%
7%
8%
9%
10%
2007 2008 2009 2010 2011 2012 2013 2014 2015

INDUSTRIAL MARKET ANALYSIS HARRISON 52
Figure 2: Portland Industrial Market Average Quoted Rates, 2007–2014
Source: Kidder Mathews
ABSORPTION AND LEASING
There was positive absorption of 679,717 square feet in the second quarter, up from 115,127 in the last quarter according to CoStar. Colliers reports a slightly higher number of 687,359 square feet by the end of the second quarter, 206,118 square feet at the end of the first quarter for a total of 893,477 square feet year to date.
CoStar reports that the flex market experienced negative absorption of 6,671 in the second quarter. The flex market only absorbed 532 square feet during the previous quarter. Colliers also reports negative absorption of 5,114 square feet for the second quarter of this year down from 4,417 square feet during the first quarter of 2014.
Industrial employment is doing well and is continuing to experience growth. Portland’s growing industrial sector has led to increased absorption, over 3 million square feet this year to date according to Jones Lang LaSalle, and continues to put pressure on the demand for industrial land. Limited supply is spurring new construction with much of it being speculative.
$0.40
$0.45
$0.50
$0.55
$0.60
2007 2008 2009 2010 2011 2012 2013 2014 2015

INDUSTRIAL MARKET ANALYSIS HARRISON 53
Figure 3: Portland Industrial Market Net Absorption, Square Feet, 2007–2014
Source: Kidder Mathews
Figure 4: Portland Industrial Market Deliveries, Rentable Building Area, Square Feet, 2007–2014
Source: Kidder Mathews
-2,000,000
-1,500,000
-1,000,000
-500,000
0
500,000
1,000,000
1,500,000
2,000,000
2,500,000
3,000,000
2007 2008 2009 2010 2011 2012 2013 2014 2015
0
200,000
400,000
600,000
800,000
1,000,000
1,200,000
1,400,000
1,600,000
2007 2008 2009 2010 2011 2012 2013 2014 2015
INDUSTRIAL MARKET ANALYSIS HARRISON 54
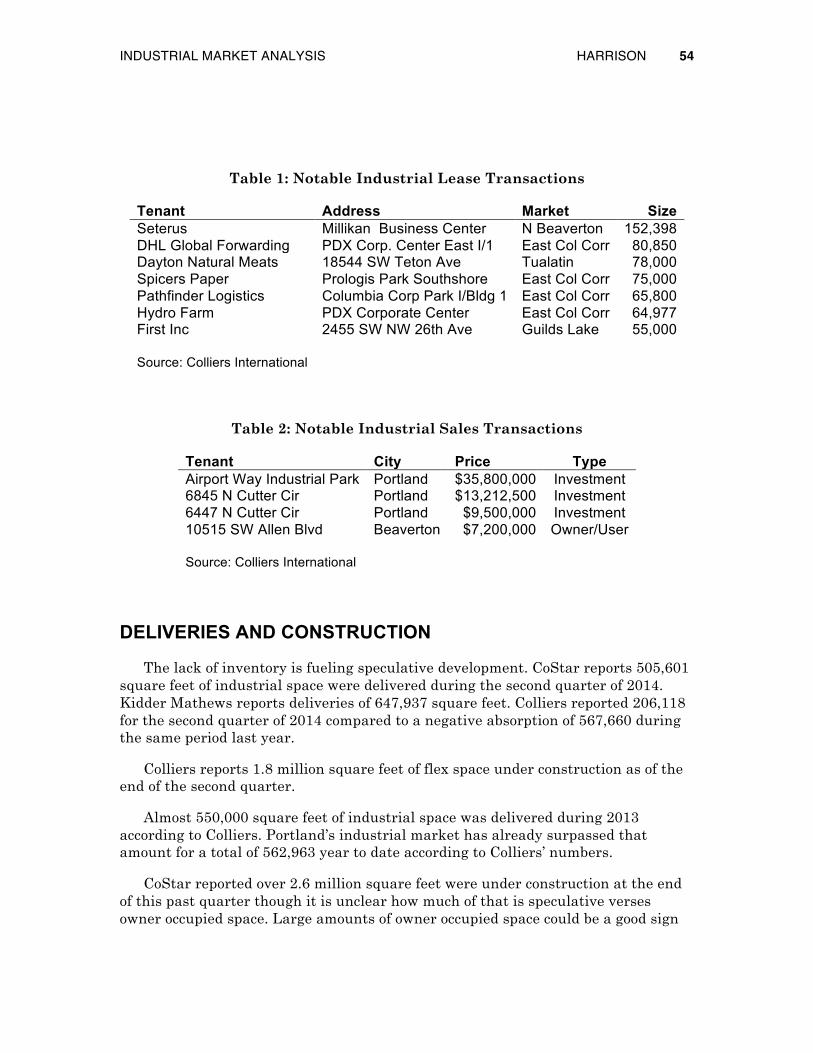
Table 1: Notable Industrial Lease Transactions
Tenant Address Market Size Seterus Millikan Business Center N Beaverton 152,398 DHL Global Forwarding PDX Corp. Center East I/1 East Col Corr 80,850 Dayton Natural Meats 18544 SW Teton Ave Tualatin 78,000 Spicers Paper Prologis Park Southshore East Col Corr 75,000 Pathfinder Logistics Columbia Corp Park I/Bldg 1 East Col Corr 65,800 Hydro Farm PDX Corporate Center East Col Corr 64,977 First Inc 2455 SW NW 26th Ave Guilds Lake 55,000 Source: Colliers International
Table 2: Notable Industrial Sales Transactions
Tenant City Price Type Airport Way Industrial Park Portland $35,800,000 Investment 6845 N Cutter Cir Portland $13,212,500 Investment 6447 N Cutter Cir Portland $9,500,000 Investment 10515 SW Allen Blvd Beaverton $7,200,000 Owner/User Source: Colliers International
DELIVERIES AND CONSTRUCTION
The lack of inventory is fueling speculative development. CoStar reports 505,601 square feet of industrial space were delivered during the second quarter of 2014. Kidder Mathews reports deliveries of 647,937 square feet. Colliers reported 206,118 for the second quarter of 2014 compared to a negative absorption of 567,660 during the same period last year.
Colliers reports 1.8 million square feet of flex space under construction as of the end of the second quarter.
Almost 550,000 square feet of industrial space was delivered during 2013 according to Colliers. Portland’s industrial market has already surpassed that amount for a total of 562,963 year to date according to Colliers’ numbers.
CoStar reported over 2.6 million square feet were under construction at the end of this past quarter though it is unclear how much of that is speculative verses owner occupied space. Large amounts of owner occupied space could be a good sign

INDUSTRIAL MARKET ANALYSIS HARRISON 55
for the overall market as this could spur increased speculative development. Colliers reports a more modest amount of 592,750 square feet under construction and states that it appears that supply, at least for the foreseeable future, will not meet market demand. If this turns out to be the case, perhaps rates will finally begin to rise as the market tightens. n

n A. Synkai Harrison is a Master of Real Estate Development candidate and has been awarded the Center for Real Estate Fellowship. Any errors or omissions are the author’s responsibility. Any opinions are those of the author solely and do not represent the opinions of any other person or entity.. Center for Real Estate Quarterly Report, vol. 8, no. 3. Summer 2014 56
RETAIL MARKET ANALYSIS
A. SYNKAI HARRISON
Portland State University
Colliers reports that in today’s retail market, millennials are setting trends that not only have retailers taking a closer look at their presence in the market but how they are viewed by this influential demographic. This group is playing a major role in the demand for more pedestrian and transit friendly urban neighborhoods.
As the influence of millennials continues to grow in the retail market, retailers are looking for ways to attract this demographic. Big box stores are testing smaller formats in urban areas, with mixed results, but centers with specialty stores like Trader Joe’s continue to do well. According to Colliers, the amenity of convenience has begun to trump price with millennials and retailers are responding by securing space in pedestrian friendly districts.
As Portland’s growing employment numbers continue to improve, the retail market is attracting the attention of national retailers. According to Marcus and Millichap, Portland’s retail market continues to attract investors from largest west coast markets who are seeking higher yields from retail assets.
RETAIL MARKET ANALYSIS HARRISON 57
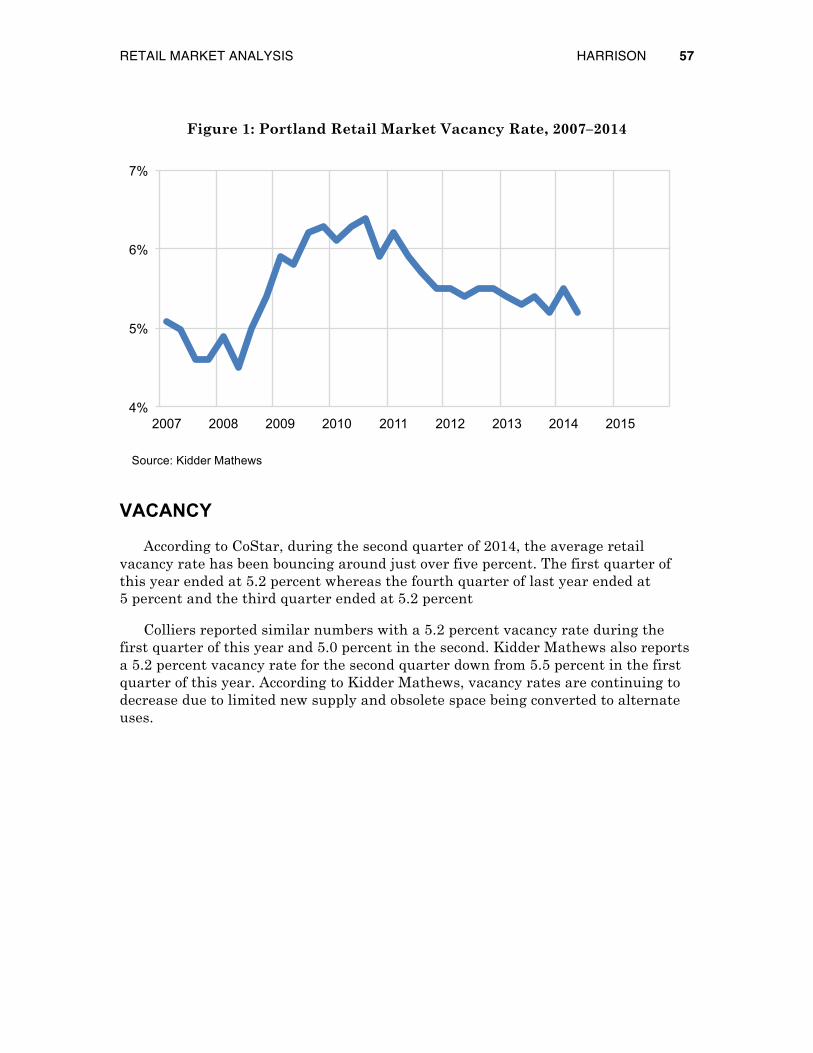
Figure 1: Portland Retail Market Vacancy Rate, 2007–2014
Source: Kidder Mathews
VACANCY
According to CoStar, during the second quarter of 2014, the average retail vacancy rate has been bouncing around just over five percent. The first quarter of this year ended at 5.2 percent whereas the fourth quarter of last year ended at 5 percent and the third quarter ended at 5.2 percent
Colliers reported similar numbers with a 5.2 percent vacancy rate during the first quarter of this year and 5.0 percent in the second. Kidder Mathews also reports a 5.2 percent vacancy rate for the second quarter down from 5.5 percent in the first quarter of this year. According to Kidder Mathews, vacancy rates are continuing to decrease due to limited new supply and obsolete space being converted to alternate uses.
4%
5%
6%
7%
2007 2008 2009 2010 2011 2012 2013 2014 2015
RETAIL MARKET ANALYSIS HARRISON 58
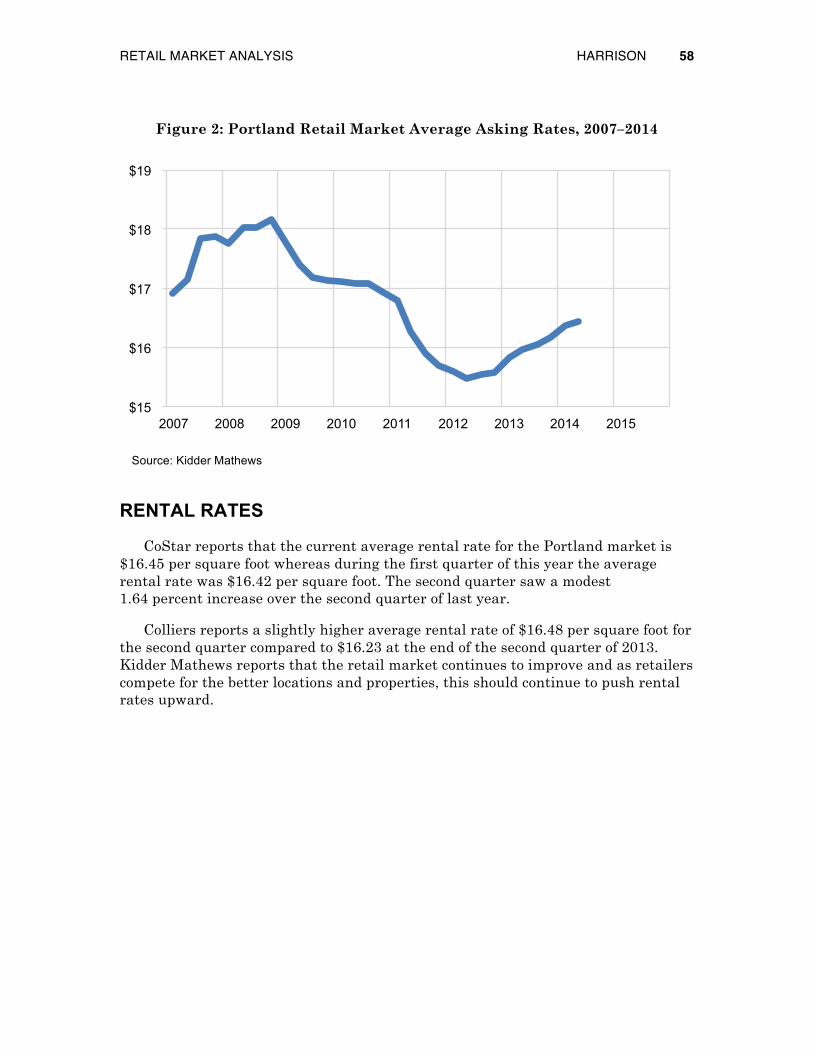
Figure 2: Portland Retail Market Average Asking Rates, 2007–2014
Source: Kidder Mathews
RENTAL RATES
CoStar reports that the current average rental rate for the Portland market is $16.45 per square foot whereas during the first quarter of this year the average rental rate was $16.42 per square foot. The second quarter saw a modest 1.64 percent increase over the second quarter of last year.
Colliers reports a slightly higher average rental rate of $16.48 per square foot for the second quarter compared to $16.23 at the end of the second quarter of 2013. Kidder Mathews reports that the retail market continues to improve and as retailers compete for the better locations and properties, this should continue to push rental rates upward.
$15
$16
$17
$18
$19
2007 2008 2009 2010 2011 2012 2013 2014 2015

RETAIL MARKET ANALYSIS HARRISON 59
Figure 3: Portland Retail Market Net Absorption, Square Feet, 2007–2014
Source: Kidder Mathews
ABSORPTION AND LEASING
CoStar reports positive net absorption of 209,504 square feet at the end of the second quarter of 2014 up from negative 36,874 in the previous quarter. Colliers reports positive absorption of 216,310 square feet for the second quarter and negative 56,063 for the first quarter of this year. Kidder Mathews comes in slightly lower, reporting 194,133 square feet of absorption for the second quarter. During the second quarter of last year, Colliers reported only 83,033 square feet of absorption. By the end of the fourth quarter of 2013 Portland’s retail market had absorbed a total of 931,451 square feet for the year. If this trend continues, Portland’s retail market may not meet last year’s numbers.
-600,000
-400,000
-200,000
0
200,000
400,000
600,000
800,000
1,000,000
2007 2008 2009 2010 2011 2012 2013 2014 2015
RETAIL MARKET ANALYSIS HARRISON 60
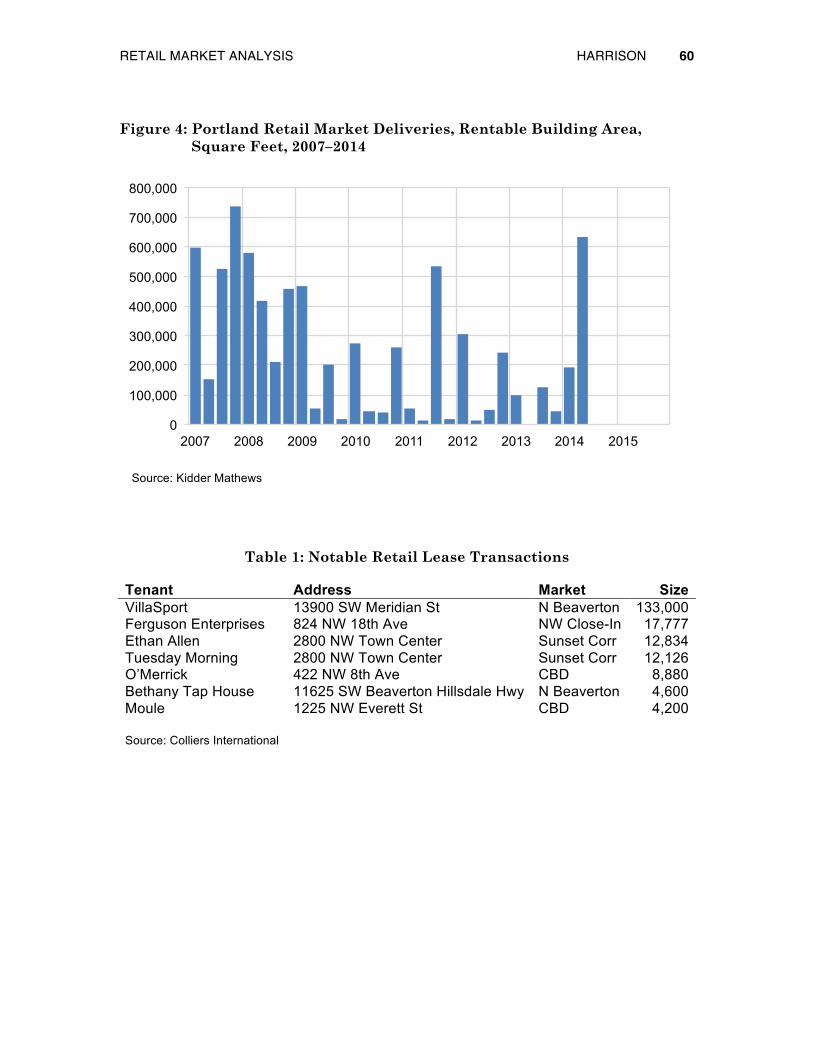
Figure 4: Portland Retail Market Deliveries, Rentable Building Area, Square Feet, 2007–2014
Source: Kidder Mathews
Table 1: Notable Retail Lease Transactions
Tenant Address Market Size VillaSport 13900 SW Meridian St N Beaverton 133,000 Ferguson Enterprises 824 NW 18th Ave NW Close-In 17,777 Ethan Allen 2800 NW Town Center Sunset Corr 12,834 Tuesday Morning 2800 NW Town Center Sunset Corr 12,126 O’Merrick 422 NW 8th Ave CBD 8,880 Bethany Tap House 11625 SW Beaverton Hillsdale Hwy N Beaverton 4,600 Moule 1225 NW Everett St CBD 4,200 Source: Colliers International
0
100,000
200,000
300,000
400,000
500,000
600,000
700,000
800,000
2007 2008 2009 2010 2011 2012 2013 2014 2015
RETAIL MARKET ANALYSIS HARRISON 61
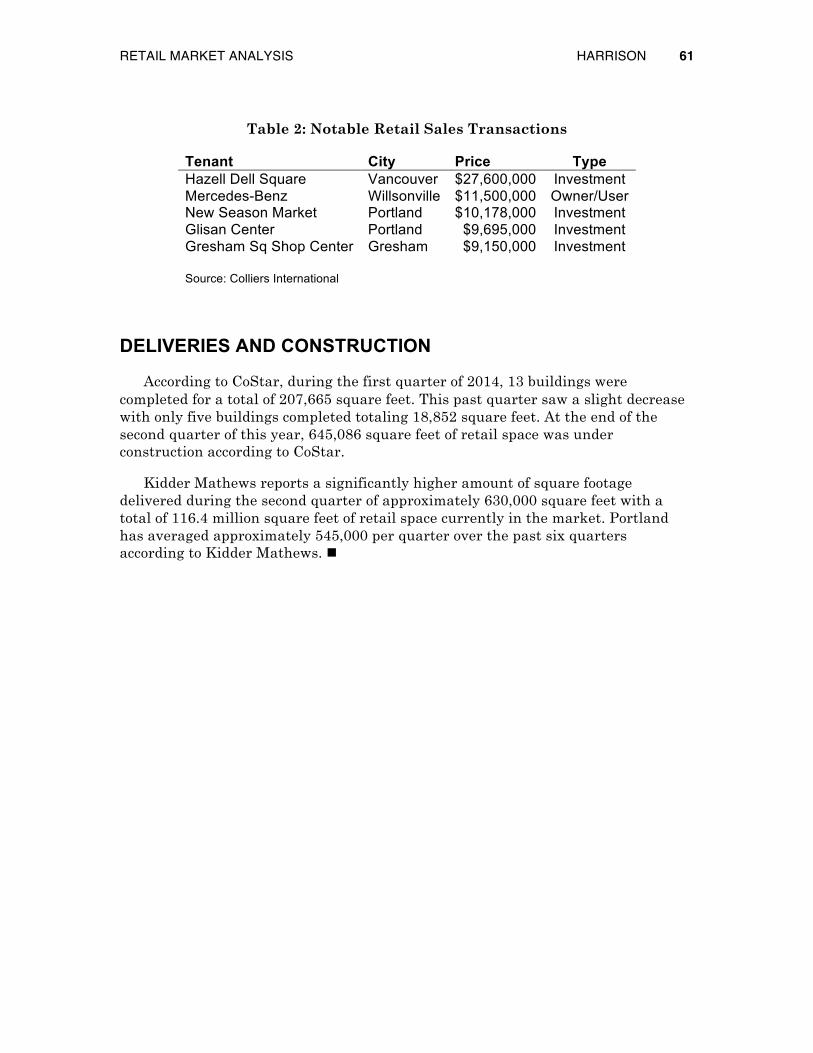
Table 2: Notable Retail Sales Transactions
Tenant City Price Type Hazell Dell Square Vancouver $27,600,000 Investment Mercedes-Benz Willsonville $11,500,000 Owner/User New Season Market Portland $10,178,000 Investment Glisan Center Portland $9,695,000 Investment Gresham Sq Shop Center Gresham $9,150,000 Investment Source: Colliers International
DELIVERIES AND CONSTRUCTION
According to CoStar, during the first quarter of 2014, 13 buildings were completed for a total of 207,665 square feet. This past quarter saw a slight decrease with only five buildings completed totaling 18,852 square feet. At the end of the second quarter of this year, 645,086 square feet of retail space was under construction according to CoStar.
Kidder Mathews reports a significantly higher amount of square footage delivered during the second quarter of approximately 630,000 square feet with a total of 116.4 million square feet of retail space currently in the market. Portland has averaged approximately 545,000 per quarter over the past six quarters according to Kidder Mathews. n