Embed Size (px)
Citation preview
Center for Economic Studies Research Report: 2019Research and Methodology Directorate
Issued June 2020
MISSION The Center for Economic Studies partners with stakeholders within and outside the U.S. Census Bureau to improve measures of the economy and people of the United States through research and the development of innovative data products.
HISTORY The Center for Economic Studies (CES) was established in 1982 on a foundation laid by a generation of visionaries both inside and outside the Census Bureau. CES’s early mission was to house data-bases on businesses, link them cross-sectionally and longitudinally, conduct economic research with them, and make them available to researchers.
Pioneering CES staff and visiting academic researchers began fulfill-ing that vision. Using these new data, their analyses sparked a revo-lution of empirical work in the economics of industrial organization.
Researcher access to these restricted-access data grew with the establishment of secure research data centers, the first of which was opened by CES in Boston in 1994. Today, there are such facilities located at dozens of universities and research organizations across the country.
In time, CES expanded its focus from data and research on busi-nesses to also include workers and households. Today, CES staff carry out empirical research on a wide array of subjects, leading to important discoveries in economics and other social sciences, improvements in existing Census Bureau surveys and data products, enhanced research databases, and new statistics and information products for public use.
ACKNOWLEDGMENTS Randy Becker coordinated the production of this report and wrote, compiled, or edited its various parts. John Voorheis and Nikolas Pharris-Ciurej authored Chapter 2. Andrew Foote and Lee Tucker authored Chapter 3. Other CES staff contributed updates used throughout.
Linda Chen and Faye Brock of the Public Information Office provided publication management, graphics design and composi-tion, and editorial review for print and electronic media. The Census Bureau’s Administrative and Customer Services Division provided printing management.
DISCLAIMER Research summaries in this report have not undergone the review accorded Census Bureau publications, and no endorsement should be inferred. Any opinions and conclusions expressed herein are those of the author(s) and do not necessarily represent the views of the Census Bureau or other organizations. All results have been reviewed to ensure that no confidential information is disclosed.
U.S. Department of Commerce Wilbur Ross,
Secretary
Karen Dunn Kelley, Deputy Secretary
U.S. CENSUS BUREAU Steven D. Dillingham,
Director
Center for Economic Studies Research Report: 2019
Research and Methodology DirectorateIssued June 2020
SUGGESTED CITATION U.S. Census Bureau,
Center for Economic Studies Research Report: 2019,
U.S. Government Printing Office, Washington, DC, 2020.
U.S. CENSUS BUREAU
Steven D. Dillingham, Director
Ron S. Jarmin, Deputy Director and Chief Operating OfficerJohn M. Abowd, Associate Director for Research and Methodology
John L. Eltinge, Assistant Director for Research and Methodology
Lucia S. Foster, Chief, Center for Economic Studies
CONTENTS
A Message From the Chief Economist. . . . . . . . . . . . . . . . . . . . . . . . . . . 1
Chapters
1. 2019 News . . . . . . . . . . . . . . . . . . . . . . . . . . . . . . . . . . . . . . . . . . . . . . . 3
2. Improving Census Bureau Demographic Surveys Using Administrative Records. . . . . . . . . . . . . . . . . . . . . . . . . . . . . . . . . . . 13
3. Transitions Into the Labor Force: Using the Census Bureau’s National Jobs Frame to Measure College Graduates’ and Veterans’ Outcomes . . . . . . . . . . . . . . . . . . . . . . . . . . . . . . . . . . . . . 21
Appendixes
1. Overview of the Center for Economic Studies. . . . . . . . . . . . . . . . 29
2. Publications and Working Papers by Center for Economic Studies Staff: 2019 . . . . . . . . . . . . . . . . . . . . . . . . . . . . . . . . . . . . . . . 31
3 Abstracts of Center for Economic Studies Working Papers by Census Bureau Staff: 2019. . . . . . . . . . . . . . . . . . . . . . . . . . . . . . . . 37
4. Center for Economic Studies Working Papers: 2019 . . . . . . . . . . 51
5. Longitudinal Employer-Household Dynamics (LEHD) Partners . . . . . . . . . . . . . . . . . . . . . . . . . . . . . . . . . . . . . . . . . . . . . . . . 55
6. Center for Economic Studies Organizational Chart (February 2020) . . . . . . . . . . . . . . . . . . . . . . . . . . . . . . . . . . . . . . . . . 59

This page is intentionally blank.
U.S. Census Bureau Center for Economic Studies Research Report: 2019 1
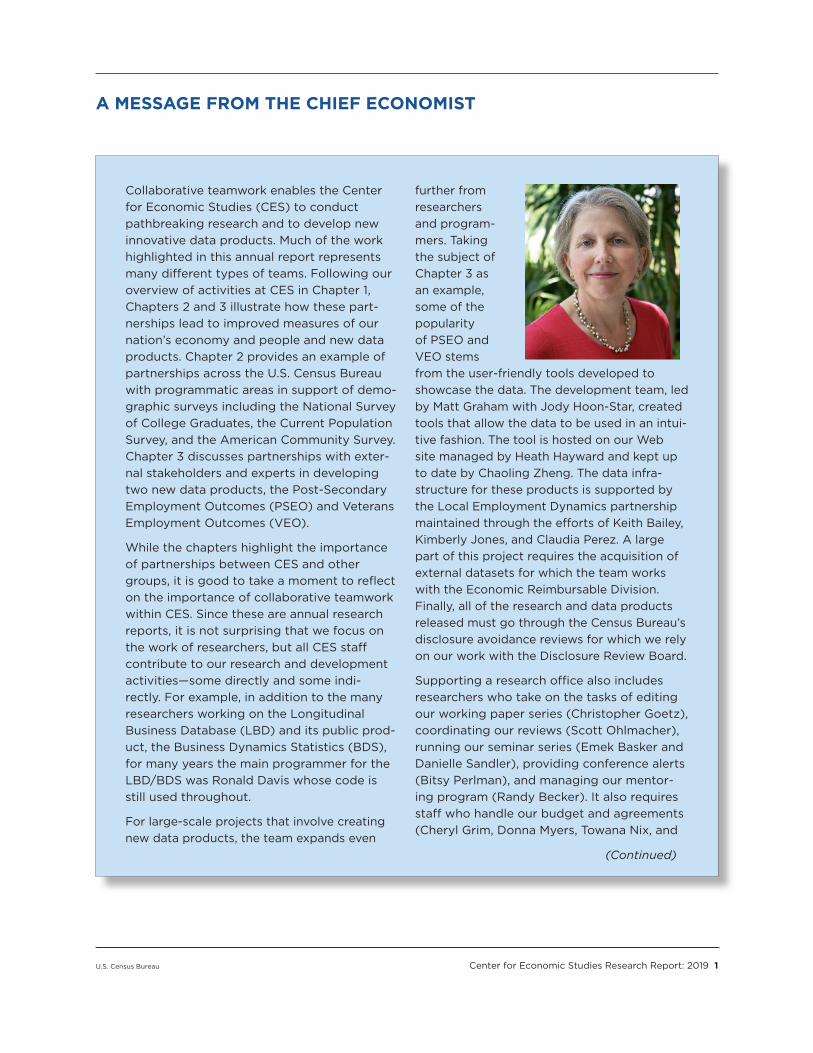
A MESSAGE FROM THE CHIEF ECONOMIST
Collaborative teamwork enables the Center for Economic Studies (CES) to conduct pathbreaking research and to develop new innovative data products. Much of the work highlighted in this annual report represents many different types of teams. Following our overview of activities at CES in Chapter 1, Chapters 2 and 3 illustrate how these part-nerships lead to improved measures of our nation’s economy and people and new data products. Chapter 2 provides an example of partnerships across the U.S. Census Bureau with programmatic areas in support of demo-graphic surveys including the National Survey of College Graduates, the Current Population Survey, and the American Community Survey. Chapter 3 discusses partnerships with exter-nal stakeholders and experts in developing two new data products, the Post-Secondary Employment Outcomes (PSEO) and Veterans Employment Outcomes (VEO).
While the chapters highlight the importance of partnerships between CES and other groups, it is good to take a moment to reflect on the importance of collaborative teamwork within CES. Since these are annual research reports, it is not surprising that we focus on the work of researchers, but all CES staff contribute to our research and development activities—some directly and some indi-rectly. For example, in addition to the many researchers working on the Longitudinal Business Database (LBD) and its public prod-uct, the Business Dynamics Statistics (BDS), for many years the main programmer for the LBD/BDS was Ronald Davis whose code is still used throughout.
For large-scale projects that involve creating new data products, the team expands even
further from researchers and program-mers. Taking the subject of Chapter 3 as an example, some of the popularity of PSEO and VEO stems from the user-friendly tools developed to showcase the data. The development team, led by Matt Graham with Jody Hoon-Star, created tools that allow the data to be used in an intui-tive fashion. The tool is hosted on our Web site managed by Heath Hayward and kept up to date by Chaoling Zheng. The data infra-structure for these products is supported by the Local Employment Dynamics partnership maintained through the efforts of Keith Bailey, Kimberly Jones, and Claudia Perez. A large part of this project requires the acquisition of external datasets for which the team works with the Economic Reimbursable Division. Finally, all of the research and data products released must go through the Census Bureau’s disclosure avoidance reviews for which we rely on our work with the Disclosure Review Board.
Supporting a research office also includes researchers who take on the tasks of editing our working paper series (Christopher Goetz), coordinating our reviews (Scott Ohlmacher), running our seminar series (Emek Basker and Danielle Sandler), providing conference alerts (Bitsy Perlman), and managing our mentor-ing program (Randy Becker). It also requires staff who handle our budget and agreements (Cheryl Grim, Donna Myers, Towana Nix, and
(Continued)
2 Center for Economic Studies Research Report: 2019 U.S. Census Bureau
A MESSAGE FROM THE CHIEF ECONOMIST—Con.
Sierra Noland) and administrative staff (Dawn Anderson, Rebecca Turner, and Deborah Wright). Appendix 6 of this report provides the complete listing of CES staff.
We will continue research and development activities to improve our existing data prod-ucts over the coming year. We are working to produce an enhanced version of the BDS. The team working on business technology adoption continues to develop modules for use in the Annual Business Survey. Teams also continue their work on measures of pro-ductivity dispersion; business expectations and uncertainty; nonemployer statistics by demographics; income and mobility statistics;
and eligibility for and participation in the Supplemental Nutrition Assistance Program (SNAP) and Special Supplemental Nutrition Assistance Program for Women, Infants, and Children (WIC). Our work to provide mortality statistics to qualified researchers on approved projects continues as usual.
Thank you to everyone who contributed to our annual report. Randy Becker compiled and edited all of the material. Editorial review was performed by Faye Brock, and design services and cover art production by Linda Chen, both of the Public Information Office. Other contributors are acknowledged on the inside cover.
Lucia S. Foster, Ph.D. Chief Economist and Chief of the Center for Economic Studies
U.S. Census Bureau Center for Economic Studies Research Report: 2019 3
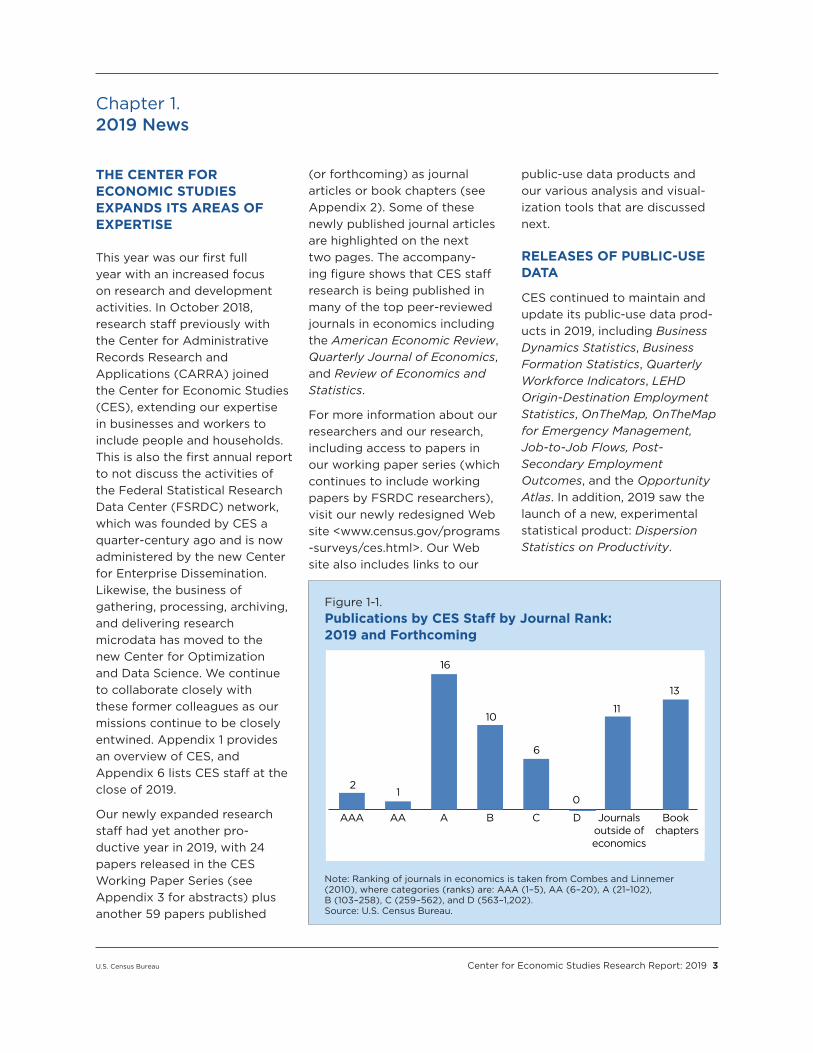
Chapter 1. 2019 News
THE CENTER FOR ECONOMIC STUDIES EXPANDS ITS AREAS OF EXPERTISE
This year was our first full year with an increased focus on research and development activities. In October 2018, research staff previously with the Center for Administrative Records Research and Applications (CARRA) joined the Center for Economic Studies (CES), extending our expertise in businesses and workers to include people and households. This is also the first annual report to not discuss the activities of the Federal Statistical Research Data Center (FSRDC) network, which was founded by CES a quarter-century ago and is now administered by the new Center for Enterprise Dissemination. Likewise, the business of gathering, processing, archiving, and delivering research microdata has moved to the new Center for Optimization and Data Science. We continue to collaborate closely with these former colleagues as our missions continue to be closely entwined. Appendix 1 provides an overview of CES, and Appendix 6 lists CES staff at the close of 2019.
Our newly expanded research staff had yet another pro-ductive year in 2019, with 24 papers released in the CES Working Paper Series (see Appendix 3 for abstracts) plus another 59 papers published
(or forthcoming) as journal articles or book chapters (see Appendix 2). Some of these newly published journal articles are highlighted on the next two pages. The accompany-ing figure shows that CES staff research is being published in many of the top peer-reviewed journals in economics including the American Economic Review, Quarterly Journal of Economics, and Review of Economics and Statistics.
For more information about our researchers and our research, including access to papers in our working paper series (which continues to include working papers by FSRDC researchers), visit our newly redesigned Web site <www.census.gov/programs -surveys/ces.html>. Our Web site also includes links to our
public-use data products and our various analysis and visual-ization tools that are discussed next.
RELEASES OF PUBLIC-USE DATA
CES continued to maintain and update its public-use data prod-ucts in 2019, including Business Dynamics Statistics, Business Formation Statistics, Quarterly Workforce Indicators, LEHD Origin-Destination Employment Statistics, OnTheMap, OnTheMap for Emergency Management, Job-to-Job Flows, Post-Secondary Employment Outcomes, and the Opportunity Atlas. In addition, 2019 saw the launch of a new, experimental statistical product: Dispersion Statistics on Productivity.
Figure 1-1. Publications by CES Staff by Journal Rank: 2019 and Forthcoming
Book chapters
Journalsoutside ofeconomics
DCBAAAAAA
21
6
16
1011
0
13
Note: Ranking of journals in economics is taken from Combes and Linnemer (2010), where categories (ranks) are: AAA (1–5), AA (6–20), A (21–102), B (103–258), C (259–562), and D (563–1,202). Source: U.S. Census Bureau.
4 Center for Economic Studies Research Report: 2019 U.S. Census Bureau
NOTABLE 2019 PUBLICATIONS BY CES STAFF
“Do Institutions Determine Economic Geography? Evidence from the Concentration of Foreign Suppliers”
Fariha Kamal and Asha Sundaram Journal of Urban Economics Volume 110, March 2019, pp. 89–101
Do institutions shape the geographic concentra-tion of industrial activity? We explore this ques-tion in an international trade setting by examining the relationship between country-level institu-tions and patterns of spatial concentration of global sourcing. A priori, weak institutions could be associated with either dispersed or concen-trated sourcing. We exploit location and transac-tion data on imports by U.S. firms and adapt the Ellison and Glaeser (1997) index to construct a
product- country-specific measure of supplier concentration for U.S. importers. Results show that U.S. importers source in a more spatially concentrated manner from countries with weaker contract enforcement. We find support for the idea that, where formal contract enforcement is weak, local supplier networks compensate by sharing information to facilitate matching and transactions.
“Local Labor Demand and Program Participation Dynamics: Evidence from New York SNAP Administrative Records”
Erik Scherpf and Benjamin Cerf Journal of Policy Analysis and ManagementVolume 38, Issue 2, Spring 2019, pp. 394–425
This study estimates the effect of local labor demand on the likelihood that Supplemental Nutrition Assistance Program (SNAP) beneficia-ries are able to transition out of the program. Our data include SNAP administrative records from New York (2007 to 2012), linked at the person-level to the 2010 Census and linked at the county-month-level to industry-specific, labor market conditions. We find that local labor markets matter for the length of time spent on SNAP, but there is substantial heterogeneity in estimated effects across local industries. Using Bartik-style instruments to isolate the effect of labor demand and controlling for the changing composition of
entrants and program rules brought on by the Great Recession, we find that fluctuations in labor demand in industries with high shares of SNAP participants—especially food service and retail—change the likelihood of exiting the program. Notably, estimated industry effects vary across race and parental status, with Black participants being most sensitive to changes in local labor market conditions and mothers benefiting less from growth in local labor demand than fathers and nonparents. We confirm that our results are not driven by endogenous intercounty mobility or New York City labor markets and are robust to multiple specifications.
“Modeling Endogenous Mobility in Earnings Determination”
John M. Abowd, Kevin L. McKinney, and Ian M. Schmutte Journal of Business and Economic Statistics Volume 37, Issue 3, pp. 405–418
We evaluate the bias from endogenous job mobility in fixed-effects estimates of worker- and firm-specific earnings heterogeneity using
longitudinally linked employer-employee data from the Longitudinal Employer-Household Dynamics infrastructure file system of the
U.S. Census Bureau Center for Economic Studies Research Report: 2019 5
U.S. Census Bureau. First, we propose two new residual diagnostic tests of the assumption that mobility is exogenous to unmodeled determi-nants of earnings. Both tests reject exogenous mobility. We relax exogenous mobility by mod-eling the matched data as an evolving bipartite graph using a Bayesian latent-type framework. Our results suggest that allowing endogenous mobility increases the variation in earnings
explained by individual heterogeneity and reduces the proportion due to employer and match effects. To assess external validity, we match our estimates of the wage components to out-of-sample estimates of revenue per worker. The mobility-bias-corrected estimates attribute much more of the variation in revenue per worker to variation in match quality and worker quality than the uncorrected estimates.
“Race Matters: Income Shares, Income Inequality, and Income Mobility for All U.S. Races”
Randall Akee, Maggie R. Jones, and Sonya R. Porter Demography Volume 56, Issue 3, June 2019, pp. 999–1021
Using unique linked data, we examine income inequality and mobility across racial and ethnic groups in the United States. Our data encompass the universe of income tax filers in the United States for the period 2000–2014, matched with individual-level race and ethnicity infor-mation from multiple censuses and American Community Survey data. We document both income inequality and mobility trends over the period. We find significant stratification in terms of average incomes by racial/ethnic group and distinct differences in within-group income inequality. The groups with the highest incomes—Whites and Asians—also have the highest levels of within-group inequality and the lowest levels of within-group mobility. The reverse is true for
the lowest-income groups: Blacks, American Indians, and Hispanics have lower within-group inequality and immobility. On the other hand, low-income groups are also highly immobile in terms of overall, rather than within-group, mobility. These same groups also have a higher probability of experiencing downward mobility compared with Whites and Asians. We also find that within-group income inequality increased for all groups between 2000 and 2014, and the increase was especially large for Whites. The pic-ture that emerges from our analysis is of a rigid income structure, with mainly Whites and Asians positioned at the top and Blacks, American Indians, and Hispanics confined to the bottom.
“What Drives Differences in Management Practices?”
Nicholas Bloom, Erik Brynjolfsson, Lucia Foster, Ron Jarmin, Megha Patnaik, Itay Saporta-Eksten, and John Van ReenenAmerican Economic Review Volume 109, Issue 5, May 2019, pp. 1648–1683
Partnering with the U.S. Census Bureau, we implement a new survey of "structured" man-agement practices in two waves of 35,000 man-ufacturing plants in 2010 and 2015. We find an enormous dispersion of management practices across plants, with 40 percent of this variation across plants within the same firm. Management practices account for more than 20 percent of the variation in productivity, a similar, or greater, percentage as that accounted for by research
and development, information and communica-tion technologies, or human capital. We find evidence of two key drivers to improve manage-ment. The business environment, as measured by right-to-work laws, boosts incentive manage-ment practices. Learning spillovers, as measured by the arrival of large "Million Dollar Plants" in the country, increase the management scores of incumbents.
6 Center for Economic Studies Research Report: 2019 U.S. Census Bureau
In October 2018, the U.S. Census Bureau released the 2016 Business Dynamics Statistics (BDS), which provides annual statistics from 1976 to 2016 on establishment openings and closings, firm startups and shut-downs, employment, job creation, and job destruction by firm (or establishment) size, age, indus-trial sector, state, and metropoli-tan area. In 2019, the BDS team focused its efforts on modern-izing the methodology used to generate BDS estimates. Among the enhancements planned for the next release is a switch from the Standard Industrial Classification system to the North American Industry Classification System (NAICS). More informa-tion about the BDS can be found at <www.census.gov/programs -surveys/bds.html>.
In 2018, the Census Bureau launched the Business Formation Statistics (BFS)—an experimental public-use data series on business startups. In particular, the BFS provides timely, quarterly measures of new business applications and business formations. Business applications are indicated by applications for an Employer Identification Number (EIN), while business formations (actual and projected) originat-ing from such business appli-cations are based on the first recorded payroll tax liability for an EIN. Delays in business formation are measured by the average duration between busi-ness application and business formation. All BFS series are available for the United States and by state beginning with the
third quarter of 2004. With the release in October 2019, the series now extends to the third quarter of 2019.
For further details on the BFS and to access the latest data, visit <www.census.gov/econ /bfs/>. See Chapter 3 of our 2018 annual report for an intro-duction to the BFS.
The BFS is a product of CES, developed in research col-laboration with economists from the Board of Governors of the Federal Reserve System, Federal Reserve Bank of Atlanta, University of Maryland, and University of Notre Dame. Started in 2012, the BFS is an excellent example of a success-ful new statistical product that relies entirely on administrative data and, therefore, creates no additional response burden on businesses.
In September, the Census Bureau and the Bureau of Labor Statistics (BLS) jointly unveiled a new set of productivity statis-tics on the U.S. manufacturing sector. The Dispersion Statistics on Productivity (DiSP) include annual measures of within-industry dispersion in produc-tivity (i.e., output per hour and multifactor productivity) for each 4-digit NAICS manufacturing industry. The measures of disper-sion include standard deviation, interquartile range (75–25), and interdecile range (90–10). This first experimental release covers 1997 through 2015.
For more details on the DiSP and to access the data, visit <www.census.gov/disp/>.
The DiSP is the product of the expertise of BLS staff in measur-ing productivity and that of CES staff in working with business-level microdata. The accompa-nying text box illustrates these data in use.
The Quarterly Workforce Indicators (QWI) is a set of economic indicators—including employment, job creation, earn-ings, worker turnover, and hires/separations—available by differ-ent levels of geography, industry, business characteristics (firm age and size), and worker demo-graphics (age, sex, educational attainment, race, and ethnic-ity). In 2015, the Census Bureau first introduced the National Quarterly Workforce Indicators, which provide a consistent reference point for users of the state-level QWI. These data are available via the LED Extraction Tool at <https://ledextract.ces .census.gov>.
These data are also available through QWI Explorer, a Web-based analysis tool that enables comprehensive access to the full depth and breadth of the QWI data set. Through an easy-to-use dashboard interface, users can construct tables and charts to compare, rank, and aggregate indicators across time, geography, and/or firm and worker characteristics. Users can download their analy-ses to an Excel spreadsheet, a PNG/SVG chart image, or a PDF report, or they can share data tables and visualizations via URLs and through social media. To use QWI Explorer, visit <https://qwiexplorer.ces.census .gov>.
U.S. Census Bureau Center for Economic Studies Research Report: 2019 7
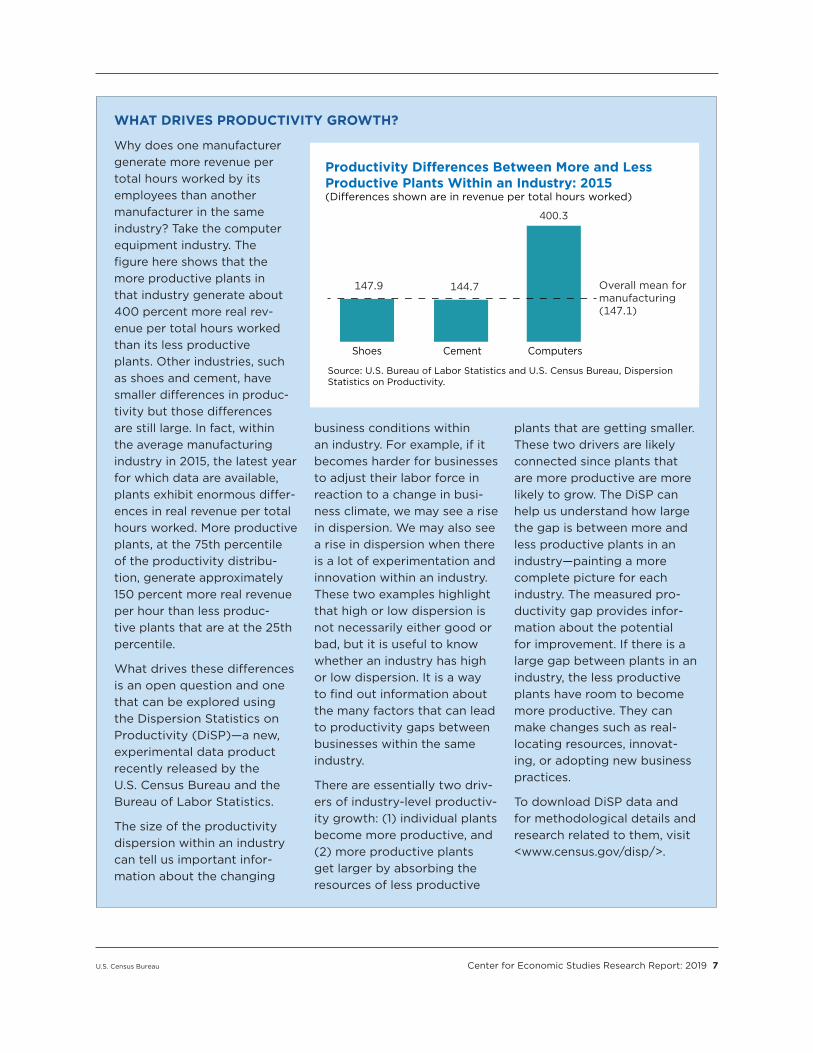
WHAT DRIVES PRODUCTIVITY GROWTH?
Why does one manufacturer generate more revenue per total hours worked by its employees than another manufacturer in the same industry? Take the computer equipment industry. The figure here shows that the more productive plants in that industry generate about 400 percent more real rev-enue per total hours worked than its less productive plants. Other industries, such as shoes and cement, have smaller differences in produc-tivity but those differences are still large. In fact, within the average manufacturing industry in 2015, the latest year for which data are available, plants exhibit enormous differ-ences in real revenue per total hours worked. More productive plants, at the 75th percentile of the productivity distribu-tion, generate approximately 150 percent more real revenue per hour than less produc-tive plants that are at the 25th percentile.
What drives these differences is an open question and one that can be explored using the Dispersion Statistics on Productivity (DiSP)—a new, experimental data product recently released by the U.S. Census Bureau and the Bureau of Labor Statistics.
The size of the productivity dispersion within an industry can tell us important infor-mation about the changing
business conditions within an industry. For example, if it becomes harder for businesses to adjust their labor force in reaction to a change in busi-ness climate, we may see a rise in dispersion. We may also see a rise in dispersion when there is a lot of experimentation and innovation within an industry. These two examples highlight that high or low dispersion is not necessarily either good or bad, but it is useful to know whether an industry has high or low dispersion. It is a way to find out information about the many factors that can lead to productivity gaps between businesses within the same industry.
There are essentially two driv-ers of industry-level productiv-ity growth: (1) individual plants become more productive, and (2) more productive plants get larger by absorbing the resources of less productive
plants that are getting smaller. These two drivers are likely connected since plants that are more productive are more likely to grow. The DiSP can help us understand how large the gap is between more and less productive plants in an industry—painting a more complete picture for each industry. The measured pro-ductivity gap provides infor-mation about the potential for improvement. If there is a large gap between plants in an industry, the less productive plants have room to become more productive. They can make changes such as real-locating resources, innovat-ing, or adopting new business practices.
To download DiSP data and for methodological details and research related to them, visit <www.census.gov/disp/>.
Productivity Di�erences Between More and Less Productive Plants Within an Industry: 2015(Di�erences shown are in revenue per total hours worked)
ComputersCementShoes
Source: U.S. Bureau of Labor Statistics and U.S. Census Bureau, Dispersion Statistics on Productivity.
147.9 144.7 Overall mean for manufacturing (147.1)
400.3
8 Center for Economic Studies Research Report: 2019 U.S. Census Bureau
This year’s releases update the base geography to TIGER 2018. They also implement an auto-mated mechanism to identify single-quarter firm underreport-ing issues and impute miss-ing worker earnings microdata records. Imputations are applied to the historical data series as well as current data.
CES staff continue to main-tain and improve the LEHD Origin-Destination Employment Statistics (LODES) and the OnTheMap application. LODES is a partially synthetic data set that describes the geographic patterns of jobs by their employ-ment locations and residential locations and the connections between the two locations, and OnTheMap is the award-winning online mapping and reporting application that utilizes LODES data to show where people work and where workers live. The easy-to-use interface allows the creation, viewing, printing, and downloading of workforce-related maps, profiles, and underlying data. An interactive map viewer displays workplace and residential distributions by user-defined geographies at census block-level detail. The application also provides companion reports on worker characteristics and firm charac-teristics, employment and resi-dential area comparisons, worker flows, and commuting patterns. In OnTheMap, statistics can be generated for specific segments of the workforce, including age, earnings, sex, race, ethnicity, educational attainment, or indus-try groupings. One can also find firm age and firm size, allowing
analysis of the impacts of young/old firms or small/large firms in relation to commuting patterns and worker characteristics. Both LODES and OnTheMap can be used to answer a variety of ques-tions on the spatial, economic, and demographic aspects of workplaces and home-to-work flows.
In August, version 6.7 of OnTheMap was released, adding an additional 2 years of LODES data, extending availability from 2002 through 2017. This release also updates the base geogra-phy to TIGER 2018.
OnTheMap can be accessed at <https://onthemap.ces.census .gov>, and LODES data can be directly downloaded at <https://lehd.ces.census.gov /data/#lodes>.
In July, version 4.4.2 of OnTheMap for Emergency Management (OTMEM) was released. First introduced in 2010, OTMEM is an online data tool that provides unique, real-time information on the popu-lation and workforce for areas affected by hurricanes, floods, wildfires, and winter storms, and for federal disaster declara-tion areas. Through an intuitive interface, users can easily view the location and extent of cur-rent and forecasted emergency events on a map and retrieve detailed reports containing population and labor market characteristics for these areas. These reports provide the num-ber of affected residents by age, race, ethnicity, sex, and housing characteristics. The reports also provide the number and location
of jobs by industry, worker age, earnings, and other worker char-acteristics. To provide users with the latest information on rapidly changing events, OTMEM auto-matically incorporates real-time data updates from the National Weather Service, Departments of Interior and Agriculture, and the Federal Emergency Management Agency. See Chapter 2 of our 2013 annual report for a more detailed overview of OTMEM.
The latest release updates the American Community Survey data to the 2013–2017 5-year estimates and updates the underlying LODES data to 2017. OTMEM can be accessed at <https://onthemap.ces.census .gov/em/>.
Both OnTheMap and OTMEM are supported by the state partners under the Local Employment Dynamics (LED) partnership with the Census Bureau, as well as the Employment and Training Administration of the U.S. Department of Labor.
CES staff continue to update Job-to-Job Flows (J2J), a set of statistics on the movements of workers between jobs including information on the job-to-job transition rate, hires and separa-tions from and to nonemploy-ment, earnings changes due to job change, and characteristics of origin and destination jobs for workers changing jobs. These statistics are available at the national, state, and metropolitan area levels and by (origin and destination) NAICS sector, firm age and size, and worker demo-graphic characteristics including
U.S. Census Bureau Center for Economic Studies Research Report: 2019 9
sex, age, education, race, and ethnicity. This year’s releases incorporate data to the first quarter of 2019.
These J2J data files and asso-ciated documentation are available for download at <https://lehd.ces.census.gov /data/#j2j>.
Meanwhile, after 2 years of development and beta testing, 2019 saw the release of version 1.0 of Job-to-Job Flows Explorer. This interactive, Web-based analysis and visualization tool allows users to construct tables, maps, and charts to compare, aggregate, and analyze J2J statistics by worker and firm characteristics. The 1.0 update also provides access to met-ropolitan area tabulations and earnings indicators, as well as rankings and data normalization functionality.
To use J2J Explorer, visit <https://j2jexplorer.ces .census.gov>. Documentation can be found at <https://lehd .ces.census.gov/applications /help/j2j_explorer.html>.
This year also saw the fur-ther expansion and develop-ment of the experimental Post-Secondary Employment Outcomes (PSEO) statistics and visualization tool. First intro-duced in 2018, PSEO provides earnings and employment out-comes of post-secondary gradu-ates, by institution, degree field, and degree level for 1, 5, and 10 years after graduation. This year, the University of Michigan–Ann Arbor and University of
Wisconsin–Madison were added, joining the University of Texas system and public institutions in Colorado. Newly introduced tabulations include the destina-tion industry and geography of employed graduates. In November, the PSEO Explorer was released, providing users with an easy way to visualize graduates’ earnings outcomes and employment flows. For more information about the PSEO and examples of its use, see Chapter 3 of this annual report.
PSEO data and documentation are available at <https://lehd.ces .census.gov/data/pseo _experimental.html>. To begin using PSEO Explorer, visit <https://lehd.ces.census.gov /data/pseo_explorer.html>.
A list of partners who make our QWI, LODES, OnTheMap, OTMEM, J2J, and PSEO prod-ucts possible can be found in Appendix 5.
In 2018, in collaboration with researchers at Harvard University and Brown University, the Census Bureau launched the Opportunity Atlas, a new interactive tool providing access to highly localized data on social mobility. Using ano-nymized data covering nearly the entire U.S. population, the Opportunity Atlas contains tract-level information on chil-dren’s outcomes in adulthood including income and incarcera-tion rates by parental income, race, and gender. Visitors to <https://opportunityatlas.org> can explore the data through the online visualization tool, overlay their own data of inter-est, and download the resulting measures into a data set for their own analyses. See Chapter 2 of our 2018 annual report for a more in-depth discussion of the Opportunity Atlas and its potential for policymakers and researchers interested in inter-generational mobility.
THE CES DISSERTATION MENTORSHIP PROGRAM
Many graduate students use restricted-use U.S. Census Bureau microdata in the Federal Statistical Research Data Centers for their Ph.D. dissertation research, and many of these doctoral candidates are eligible to apply to the Center for Economic Studies (CES) Dissertation Mentorship Program. Program participants are assigned one or more CES researchers as mentors, who advise students on the use of Census Bureau microdata. Students are also given the opportunity to visit CES to meet with our research staff and present research in prog-ress. This year, CES accepted two new participants into the program and, at the close of 2019, mentored 46 students from 25 different universities and a variety of different disciplines since the program began in 2008.
10 Center for Economic Studies Research Report: 2019 U.S. Census Bureau
STATISTICAL AGENCIES COLLABORATE ON RESEARCH WORKSHOPS
BLS-CENSUS Research Workshop
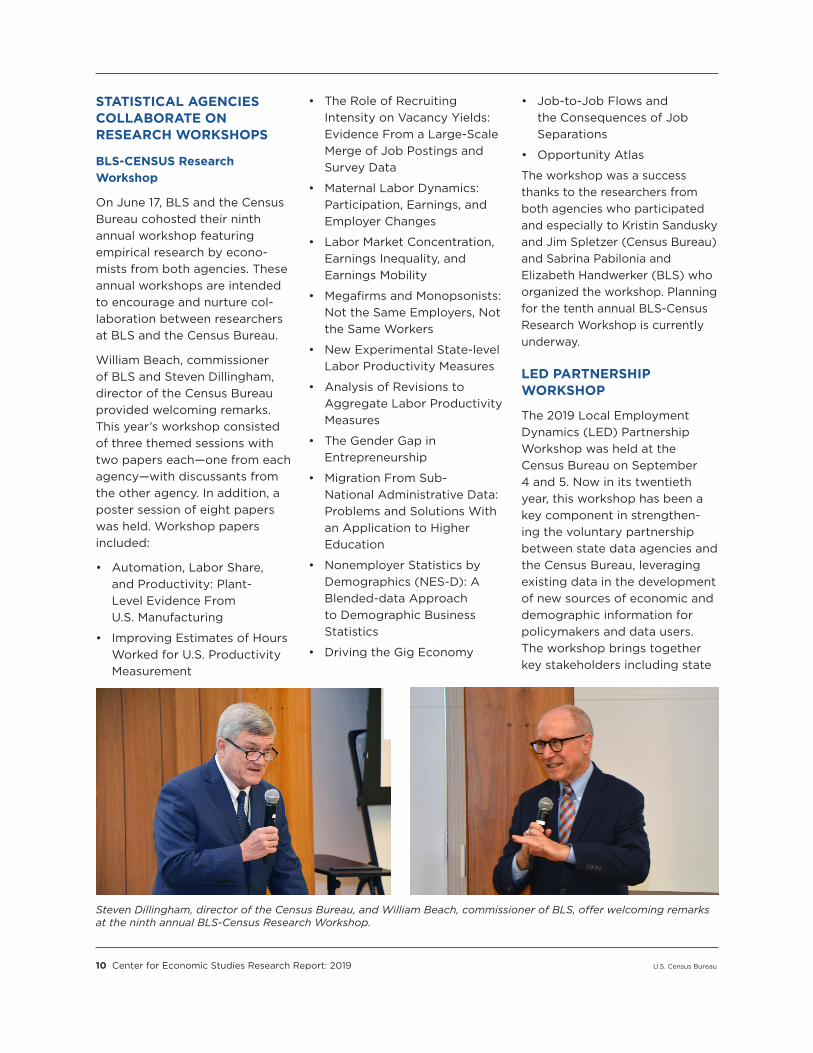
On June 17, BLS and the Census Bureau cohosted their ninth annual workshop featuring empirical research by econo-mists from both agencies. These annual workshops are intended to encourage and nurture col-laboration between researchers at BLS and the Census Bureau.
William Beach, commissioner of BLS and Steven Dillingham, director of the Census Bureau provided welcoming remarks. This year’s workshop consisted of three themed sessions with two papers each—one from each agency—with discussants from the other agency. In addition, a poster session of eight papers was held. Workshop papers included:
• Automation, Labor Share, and Productivity: Plant- Level Evidence From U.S. Manufacturing
• Improving Estimates of Hours Worked for U.S. Productivity Measurement
• The Role of Recruiting Intensity on Vacancy Yields: Evidence From a Large-Scale Merge of Job Postings and Survey Data
• Maternal Labor Dynamics: Participation, Earnings, and Employer Changes
• Labor Market Concentration, Earnings Inequality, and Earnings Mobility
• Megafirms and Monopsonists: Not the Same Employers, Not the Same Workers
• New Experimental State-level Labor Productivity Measures
• Analysis of Revisions to Aggregate Labor Productivity Measures
• The Gender Gap in Entrepreneurship
• Migration From Sub-National Administrative Data: Problems and Solutions With an Application to Higher Education
• Nonemployer Statistics by Demographics (NES-D): A Blended-data Approach to Demographic Business Statistics
• Driving the Gig Economy
• Job-to-Job Flows and the Consequences of Job Separations
• Opportunity Atlas
The workshop was a success thanks to the researchers from both agencies who participated and especially to Kristin Sandusky and Jim Spletzer (Census Bureau) and Sabrina Pabilonia and Elizabeth Handwerker (BLS) who organized the workshop. Planning for the tenth annual BLS-Census Research Workshop is currently underway.
LED PARTNERSHIP WORKSHOP
The 2019 Local Employment Dynamics (LED) Partnership Workshop was held at the Census Bureau on September 4 and 5. Now in its twentieth year, this workshop has been a key component in strengthen-ing the voluntary partnership between state data agencies and the Census Bureau, leveraging existing data in the development of new sources of economic and demographic information for policymakers and data users. The workshop brings together key stakeholders including state
Steven Dillingham, director of the Census Bureau, and William Beach, commissioner of BLS, offer welcoming remarks at the ninth annual BLS-Census Research Workshop.
U.S. Census Bureau Center for Economic Studies Research Report: 2019 11
Labor Market Information direc-tors, data analysts and data providers at state and federal agencies, nonprofit organiza-tions, businesses, and other users of Longitudinal Employer-Household Dynamics (LEHD) data products. They discuss the latest product enhancements, discover how their peers are using the data, and learn about the research that will shape future improvements.
Topics addressed by presenta-tions, panel discussions, and roundtable sessions at this year’s workshop included the manu-facturing sector, transportation planning, various other state and local uses of LEHD data, and making the most of published LEHD data. CES staff also dis-cussed newly available public-use data and tools, products under development, and measurement-related research as well as
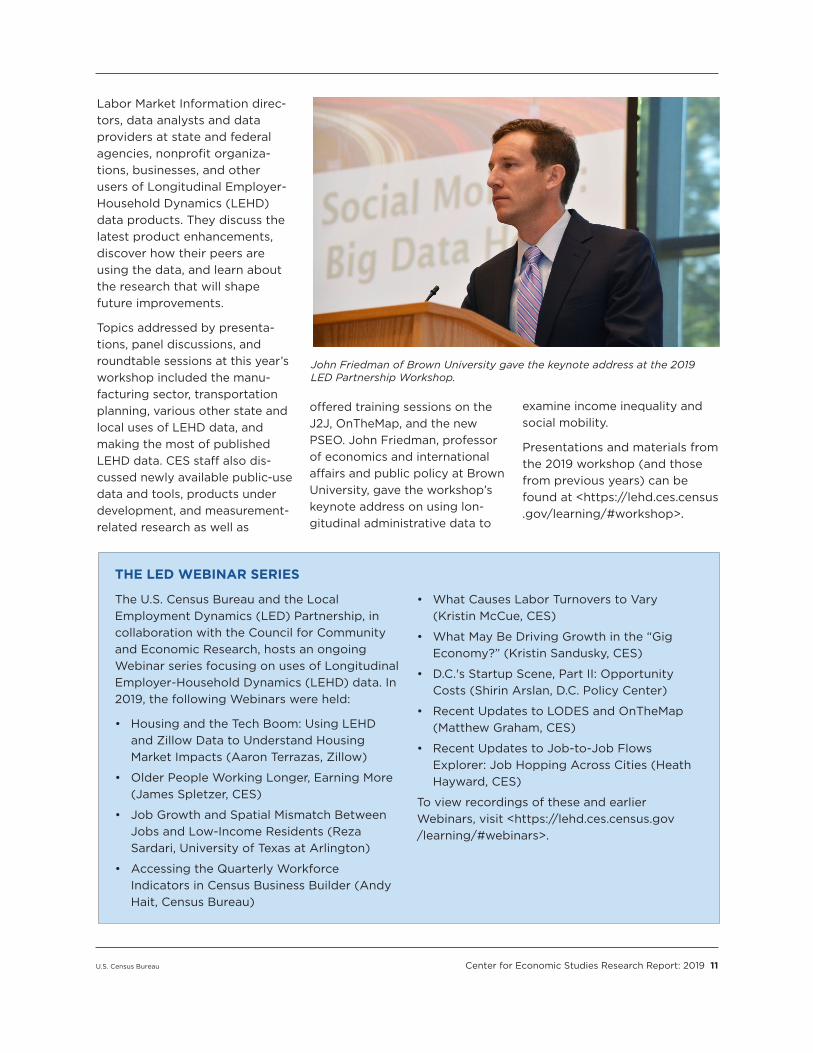
offered training sessions on the J2J, OnTheMap, and the new PSEO. John Friedman, professor of economics and international affairs and public policy at Brown University, gave the workshop’s keynote address on using lon-gitudinal administrative data to
examine income inequality and social mobility.
Presentations and materials from the 2019 workshop (and those from previous years) can be found at <https://lehd.ces.census .gov/learning/#workshop>.
John Friedman of Brown University gave the keynote address at the 2019 LED Partnership Workshop.
THE LED WEBINAR SERIES
The U.S. Census Bureau and the Local Employment Dynamics (LED) Partnership, in collaboration with the Council for Community and Economic Research, hosts an ongoing Webinar series focusing on uses of Longitudinal Employer-Household Dynamics (LEHD) data. In 2019, the following Webinars were held:
• Housing and the Tech Boom: Using LEHD and Zillow Data to Understand Housing Market Impacts (Aaron Terrazas, Zillow)
• Older People Working Longer, Earning More (James Spletzer, CES)
• Job Growth and Spatial Mismatch Between Jobs and Low-Income Residents (Reza Sardari, University of Texas at Arlington)
• Accessing the Quarterly Workforce Indicators in Census Business Builder (Andy Hait, Census Bureau)
• What Causes Labor Turnovers to Vary (Kristin McCue, CES)
• What May Be Driving Growth in the “Gig Economy?” (Kristin Sandusky, CES)
• D.C.'s Startup Scene, Part II: Opportunity Costs (Shirin Arslan, D.C. Policy Center)
• Recent Updates to LODES and OnTheMap (Matthew Graham, CES)
• Recent Updates to Job-to-Job Flows Explorer: Job Hopping Across Cities (Heath Hayward, CES)
To view recordings of these and earlier Webinars, visit <https://lehd.ces.census.gov /learning/#webinars>.
12 Center for Economic Studies Research Report: 2019 U.S. Census Bureau
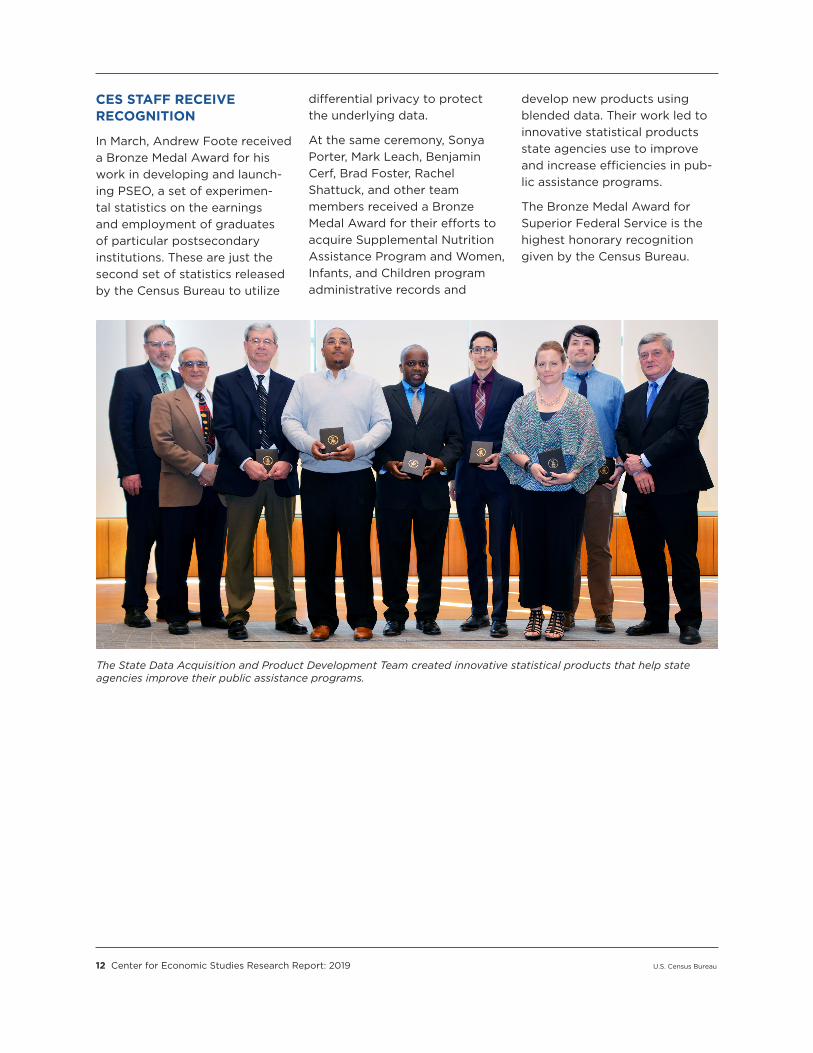
The State Data Acquisition and Product Development Team created innovative statistical products that help state agencies improve their public assistance programs.
CES STAFF RECEIVE RECOGNITION
In March, Andrew Foote received a Bronze Medal Award for his work in developing and launch-ing PSEO, a set of experimen-tal statistics on the earnings and employment of graduates of particular postsecondary institutions. These are just the second set of statistics released by the Census Bureau to utilize
differential privacy to protect the underlying data.
At the same ceremony, Sonya Porter, Mark Leach, Benjamin Cerf, Brad Foster, Rachel Shattuck, and other team members received a Bronze Medal Award for their efforts to acquire Supplemental Nutrition Assistance Program and Women, Infants, and Children program administrative records and
develop new products using blended data. Their work led to innovative statistical products state agencies use to improve and increase efficiencies in pub-lic assistance programs.
The Bronze Medal Award for Superior Federal Service is the highest honorary recognition given by the Census Bureau.
U.S. Census Bureau Center for Economic Studies Research Report: 2019 13
Chapter 2. Improving Census Bureau Demographic Surveys Using Administrative RecordsJohn Voorheis and Nikolas Pharris-Ciurej, Center for Economic Studies
The U.S. Census Bureau con-ducts dozens of household surveys covering a wide variety of topics, including housing, education, health, and expen-ditures. These surveys provide the backbone for measuring the people and households of the United States, providing vital information to policymakers, researchers, and other stake-holders. Conducting these surveys, however, has become increasingly challenging as response rates have declined, costs have increased, and wor-ries about measurement error have compounded.
While no singular approach can fully reverse these trends, the use of administrative records and third-party data in the sur-vey production process is a very promising avenue for improv-ing survey measurement and reducing respondent burden and survey costs. Indeed, the use of administrative records is a prior-ity not just for convenience, but because Title 13 of the U.S. Code mandates their maximum use where possible. Here, adminis-trative records generally refer to microdata records contained in files collected and maintained by government agencies and commercial entities for the purpose of administering pro-grams and providing services. Data acquired from commercial entities specifically are often referred to as “third party” data.
The Demographic Research Area in the Center for Economic Studies (CES) has been at the forefront of efforts to utilize administrative records, in coor-dination with survey produc-tion teams and subject-matter experts in the Census Bureau’s Demographic Directorate.1 This chapter provides an overview of some of our efforts to improve survey measurement. In general, our approach involves: (1) work-ing with survey operations staff to identify areas where admin-istrative records could be used, (2) performing basic research on administrative records’ fitness for use, (3) prototyping potential uses for administrative records, and (4) providing support for survey operations staff to incor-porate administrative records, first experimentally and then as ongoing production activities.
In this chapter, we will describe several case studies illustrating this approach. Cases fall into one of two categories. In one cat-egory, administrative records are used to enhance precollection activities through better sam-pling, and here we will highlight our work on the National Survey of Children’s Health. In the other category, administrative records are used to enhance postcollec-tion activities through improve-ments in editing, imputation,
1 Some of the work described in this chapter began in the Center for Administrative Records Research and Applications, which merged with the Center for Economic Studies in October 2018.
weighting, and data production. Here we will discuss our work on several surveys, includ-ing the National Survey of College Graduates, the Current Population Survey (CPS), and the American Community Survey (ACS).
USING ADMINISTRATIVE RECORDS IN SAMPLING
Most household surveys con-ducted by the Census Bureau use the Census Bureau’s Master Address File (MAF) as their sampling frame. However, many surveys have either a nar-rower target universe than all U.S. households or a need to oversample certain sociode-mographic subgroups. In these cases, it is possible to use administrative records to flag households that are in these tar-get groups and thereby improve sampling efficiency. Our work on the National Survey of Children’s Health (NSCH) is one case study of this approach.
The NSCH is a survey fielded by the Census Bureau and sponsored by the Maternal and Child Health Bureau of the Health Resources and Services Administration, a unit in the Department of Health and Human Services. The NSCH is designed to provide nationally and state-representative data on the physical and emotional health of children under the age of 18. Until 2015, the NSCH was conducted as a random-digit
14 Center for Economic Studies Research Report: 2019 U.S. Census Bureau
dial phone survey, conducted about every 4 years by the National Center for Health Statistics. Since 2015, the Census Bureau has been the data col-lector, and the survey has been substantially redesigned. Most notably, after 2015 the NSCH became an address-based survey, conducted annually, and consolidating questions from the related National Survey of Children with Special Health Care Needs.
Since 2015, the NSCH has been conducted in two parts. First, sampled addresses are sent a short “screener” survey to determine if there is a child in the household. Then, households that return these screeners and have a child present are sent a more in-depth topical survey module that can be either done online or returned via a paper form.
The difficulty in conducting the NSCH as an address-based survey is mainly due to its target population. The NSCH is designed to cover only individu-als under the age of 18, how-ever only about a quarter of all households nationwide have a child. Because of this, sim-ply sampling from the Census Bureau’s master list of all unique addresses in the United States (i.e., the MAF) is very ineffi-cient—requiring the mailing of many screeners relative to the desired number of completed surveys. The relative scarcity of households with children is further complicated by the fact that households with children have higher-than-average rates of residential mobility. In addi-tion, very young children are a hard-to-count population;
they are often undercounted in traditional household surveys or censuses, requiring additional efforts to accurately capture them in survey or census data collections.
In order to improve the effi-ciency of the NSCH sampling process, we use administrative records to assign addresses to different strata that can be sampled at different rates based on the likelihood that a child is in the household. Of course, the first and most powerful way of identifying households likely to have children is to use administrative records contain-ing information on the location of children, which we do by combining three different data sources.
First, we use the Numident—an administrative records file sourced from the Social Security Administration that provides information on the birthplace, birthdate, and other demo-graphic characteristics for all individuals with social security numbers—to identify all chil-dren under the age of 18 at the start of survey data collection. Second, we use a composite administrative records data set called the Census Household Composition Key (CHCK), which combines family relationship information from the Numident, IRS Form 1040 data, and the decennial census, to identify the parents of each child in the Numident. Finally, we link each child (and their parents) to the Master Address File Auxiliary Reference File (MAF-ARF) to obtain their address in the year of data collection.
The MAF-ARF is another com-posite administrative records file, produced annually, which combines information on addresses (MAFIDs) from multiple sources, including the National Change of Address data set from the U.S. Postal Service, IRS Form 1040s and IRS Form 1099 and W-2 information returns, Medicare enrollment data, and multiple data sets from the Department of Housing and Urban Development. After linking the Numident to the CHCK and to the MAF-ARF, we flag all addresses that have at least one child and assign them to stratum 1. We additionally retain information on the count of children at each address, by age bins that is then used for designing oversampling rates.
Although stratum 1 is a very powerful tool for identifying households with children, it is not perfect, nor does it com-pletely identify all children. Specifically, in 2018, only about 80 percent of ACS households flagged as stratum 1 actually had a child under 18 years, and only about 70 percent of all house-holds with children in the ACS were in stratum 1.2 Therefore, relying on stratum 1 alone would be less than ideal for coverage purposes, and randomly sam-pling from nonstratum 1 house-holds would present the same cost concerns that necessitated the creation of stratum 1 in the first place. To bridge this gap, we have developed a modeling and optimization approach to
2 The Census Bureau Disclosure Review Board has cleared the statistics in this paper for public dissemination, DRB approval numbers CBDRB-FY2020-CES010-008, CBDRB-FY2020-CES010-001, and CBDRB-FY18-433, respectively.
U.S. Census Bureau Center for Economic Studies Research Report: 2019 15
are any adults between the ages of 20 and 50, whether there are opposite-sex coresi-dents in the household between the ages of 20 and 50, hous-ing tenure, number of children in the census block group, and the number of IRS Form 1040 child exemptions in the household and in the 9-digit ZIP Code. We then train this model separately for each state on the most recently available ACS microdata, augmented with information from adminis-trative records and third-party data. We then use this model to calculate a “child-present” score for all addresses on the MAF.
Our goal is to create a stratum 2a that is as small as possible with the constraint that 95 percent of children in each state are covered by stratum 1 and 2a (or that no more than 5 percent of children are in stratum 2b). To do so, we identify the value
allow for efficient sampling of the nonstratum 1 households while maintaining adequate coverage. Specifically, we divide the nonstratum 1 households into two substrata (2a and 2b) so that stratum 2b contains fewer than 5 percent of all chil-dren. Sampling can then pro-ceed using only stratum 1 and 2a, which, together, contain 95 percent of all children.
To do this, we developed a statistical model that leverages data from previously mentioned administrative records (includ-ing the MAF-ARF and IRS Form 1040s), third-party data from several commercial vendors, and aggregate neighborhood (census block group) informa-tion from the ACS to predict whether a household has one or more children. This model considers whether there are women of childbearing age in the household, whether there
of the child-present score for each state that makes this true and apply these cutoff values to the entire MAF. After con-structing the stratum flags, we then pass them to the NSCH survey operations team, who then design (high) sampling rates from stratum 1 and (lower) sampling rates from stratum 2a, while ignoring stratum 2b.
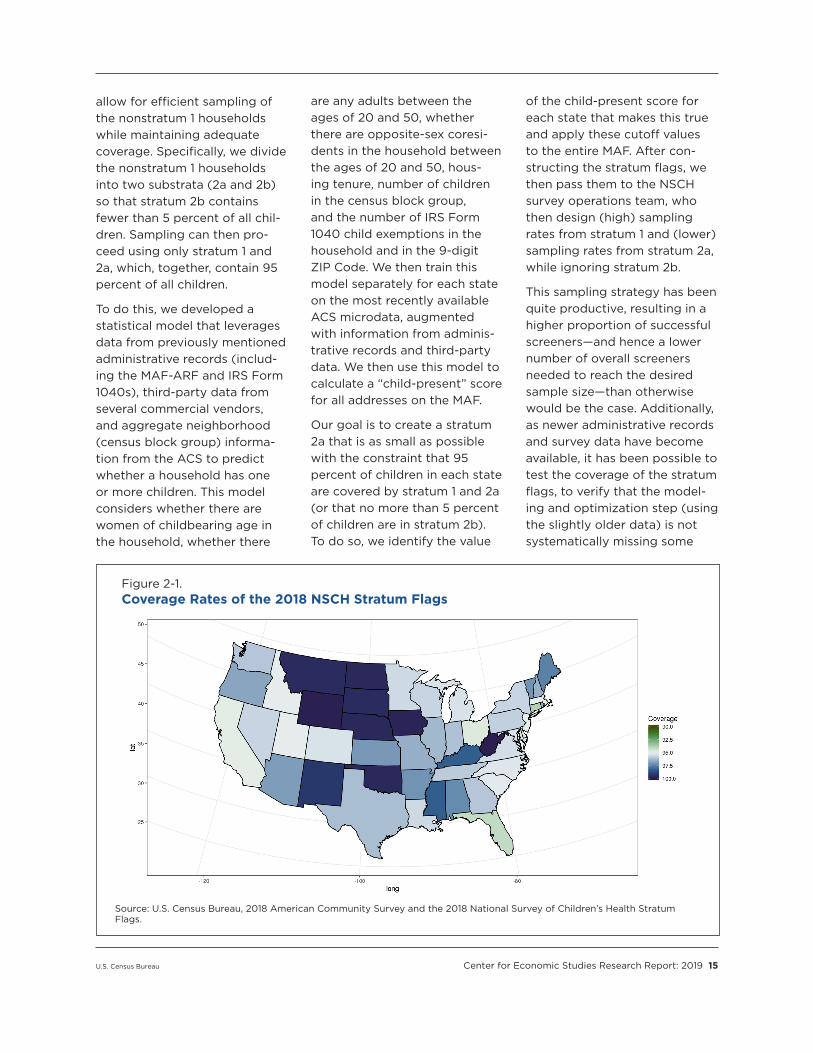
This sampling strategy has been quite productive, resulting in a higher proportion of successful screeners—and hence a lower number of overall screeners needed to reach the desired sample size—than otherwise would be the case. Additionally, as newer administrative records and survey data have become available, it has been possible to test the coverage of the stratum flags, to verify that the model-ing and optimization step (using the slightly older data) is not systematically missing some
Figure 2-1.Coverage Rates of the 2018 NSCH Stratum Flags
Source: U.S. Census Bureau, 2018 American Community Survey and the 2018 National Survey of Children’s Health Stratum Flags.
16 Center for Economic Studies Research Report: 2019 U.S. Census Bureau
children. For example, Figure 2-1 summarizes the results of one such audit, comparing the coverage of the 2018 NSCH stra-tum flags to the 2018 ACS. Of households with children at valid (deliverable) addresses in the ACS, in most states, more than 95 percent were in stratum 1 or 2a, indicating that the stratum flags are performing in line with expectations.
Going forward, there are two key areas for further refine-ments to our methodology. First, postcollection analysis has suggested that, although the stratum flags have good cover-age overall, they appear to cover very young children at lower rates than older children. Efforts to either improve coverage or adjust for this undercover-age are the subject of ongoing research. A second, somewhat related interest involves incor-porating an even larger array of administrative records and third-party data sources into our process, such as informa-tion from state-administered social safety net programs like Supplemental Nutrition Assistance Program, as well as newly available housing data on home values, mortgages, and housing characteristics.
While we have focused here on just one survey, the essence of this approach—flagging house-holds of interest by combining information on the characteris-tics of individuals with admin-istrative records on individual residences—offers a flexible way to improve sampling for a
number of surveys. Even surveys with a broader target universe than the NSCH may benefit, as even nationally representative surveys often need to overs-ample certain subpopulations—a task that can be improved through the use of appropriate administrative records.
USING ADMINISTRATIVE RECORDS IN DATA VALIDATION
Besides the use of administra-tive records to improve survey sampling, CES staff have also applied administrative records to the task of improving surveys post data collection. One post-collection activity includes data quality and validation exercises. In particular, we have linked administrative records data to various surveys to understand how the two data sources align. This can be a first step toward possibly removing questions from a survey, for some or all respondents, or using the linked administrative records values in editing or imputation proce-dures. To take one example, we have collaborated with other Census Bureau staff on research examining the feasibility of replacing housing questions on the ACS and American Housing Survey with available third-party data.
So far, most of our efforts in this area have focused on data validation work, examining a wide variety of topical areas on numerous surveys including demographic measures, edu-cational attainment, income,
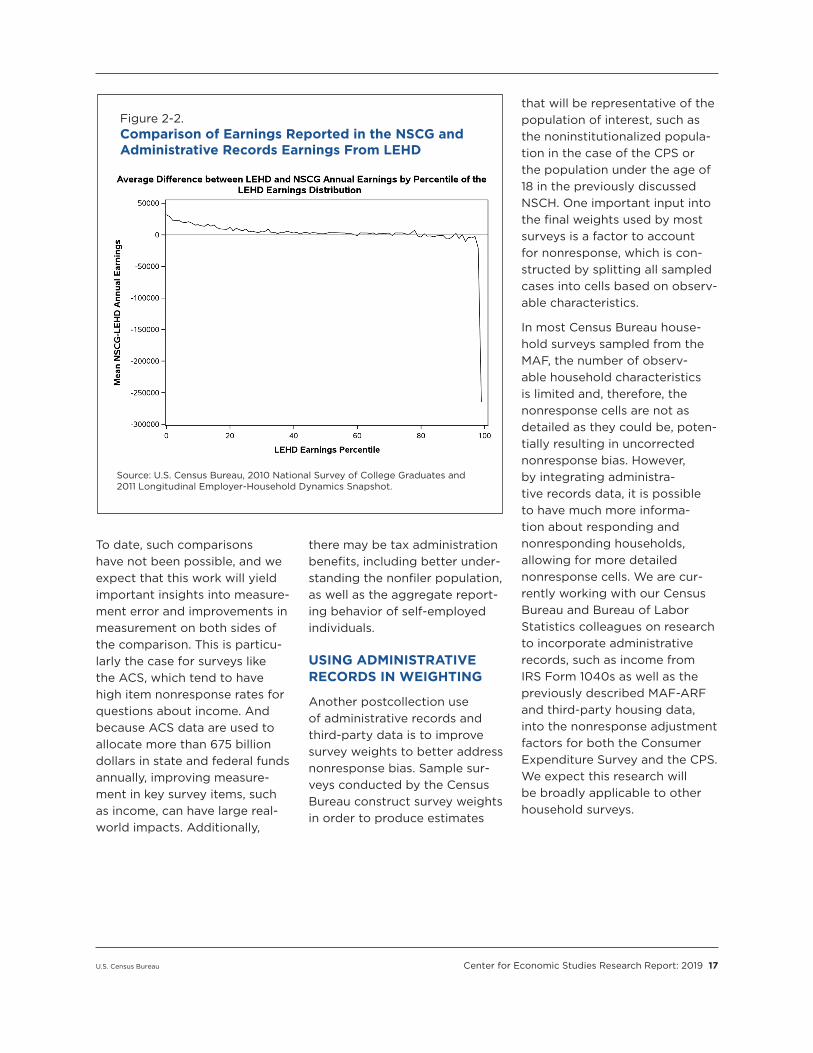
occupation, employment, and social safety net programs to name a few. An excellent exam-ple of this work is our efforts to link the National Survey of College Graduates (NSCG) and administrative records contained in the Longitudinal Employer-Household Dynamics (LEHD) files, which gives us the ability to compare NSCG responses to questions about earnings, employment, and employer char-acteristics, such as industry and number of employees, to values reported by employers to their states’ unemployment insurance system. Our comparison of earn-ings across the earnings distribu-tion reveals a striking pattern, as seen in Figure 2-2. We find that individuals with low admin-istrative records earnings report relatively higher earnings on the survey, while individuals at the top of the income distribution report substantially lower earn-ings on the survey.
Related validation and alignment work is currently underway that examines income measurement in the ACS. Using an expanded set of tax information made accessible through a joint sta-tistical project with the Internal Revenue Service (IRS), CES researchers, in collaboration with Census Bureau colleagues in the Demographic and Decennial directorates, are investigat-ing how responses to the ACS income questions (specifically self-employment, investment income, earnings, and retirement income) compare with detailed information from tax records.
U.S. Census Bureau Center for Economic Studies Research Report: 2019 17
To date, such comparisons have not been possible, and we expect that this work will yield important insights into measure-ment error and improvements in measurement on both sides of the comparison. This is particu-larly the case for surveys like the ACS, which tend to have high item nonresponse rates for questions about income. And because ACS data are used to allocate more than 675 billion dollars in state and federal funds annually, improving measure-ment in key survey items, such as income, can have large real-world impacts. Additionally,
there may be tax administration benefits, including better under-standing the nonfiler population, as well as the aggregate report-ing behavior of self-employed individuals.
USING ADMINISTRATIVE RECORDS IN WEIGHTING
Another postcollection use of administrative records and third-party data is to improve survey weights to better address nonresponse bias. Sample sur-veys conducted by the Census Bureau construct survey weights in order to produce estimates
that will be representative of the population of interest, such as the noninstitutionalized popula-tion in the case of the CPS or the population under the age of 18 in the previously discussed NSCH. One important input into the final weights used by most surveys is a factor to account for nonresponse, which is con-structed by splitting all sampled cases into cells based on observ-able characteristics.
In most Census Bureau house-hold surveys sampled from the MAF, the number of observ-able household characteristics is limited and, therefore, the nonresponse cells are not as detailed as they could be, poten-tially resulting in uncorrected nonresponse bias. However, by integrating administra-tive records data, it is possible to have much more informa-tion about responding and nonresponding households, allowing for more detailed nonresponse cells. We are cur-rently working with our Census Bureau and Bureau of Labor Statistics colleagues on research to incorporate administrative records, such as income from IRS Form 1040s as well as the previously described MAF-ARF and third-party housing data, into the nonresponse adjustment factors for both the Consumer Expenditure Survey and the CPS. We expect this research will be broadly applicable to other household surveys.
Figure 2-2.Comparison of Earnings Reported in the NSCG and Administrative Records Earnings From LEHD
Source: U.S. Census Bureau, 2010 National Survey of College Graduates and 2011 Longitudinal Employer-Household Dynamics Snapshot.
18 Center for Economic Studies Research Report: 2019 U.S. Census Bureau
USING ADMINISTRATIVE RECORDS TO CREATE NEW STATISTICS
A final area of focus for CES is the production of entirely new statistics by blending data from household surveys, the decennial census, third-party data, and various administra-tive records sources, thereby expanding the scope of information available in any one source without increas-ing respondent burden or survey length. One way to construct such blended data products is to combine the rich cross-sectional informa-tion in a household survey with the extensive longitudinal
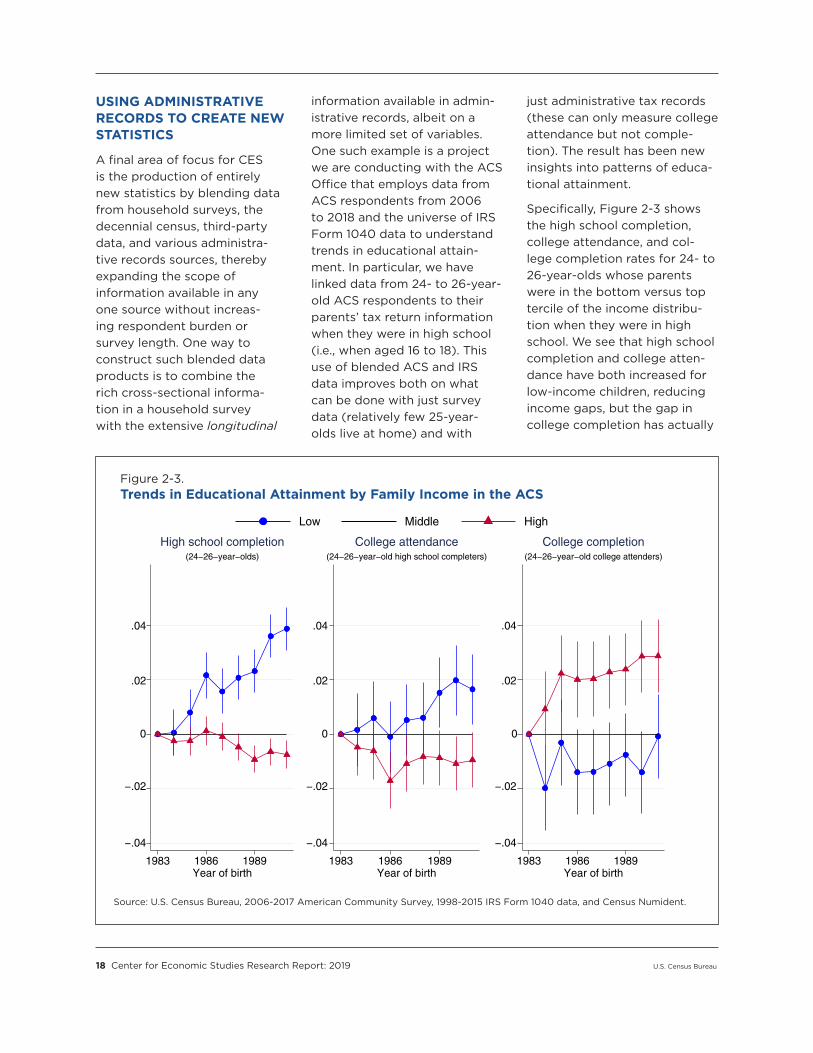
information available in admin-istrative records, albeit on a more limited set of variables. One such example is a project we are conducting with the ACS Office that employs data from ACS respondents from 2006 to 2018 and the universe of IRS Form 1040 data to understand trends in educational attain-ment. In particular, we have linked data from 24- to 26-year-old ACS respondents to their parents’ tax return information when they were in high school (i.e., when aged 16 to 18). This use of blended ACS and IRS data improves both on what can be done with just survey data (relatively few 25-year-olds live at home) and with
just administrative tax records (these can only measure college attendance but not comple-tion). The result has been new insights into patterns of educa-tional attainment.
Specifically, Figure 2-3 shows the high school completion, college attendance, and col-lege completion rates for 24- to 26-year-olds whose parents were in the bottom versus top tercile of the income distribu-tion when they were in high school. We see that high school completion and college atten-dance have both increased for low-income children, reducing income gaps, but the gap in college completion has actually
−.04
−.02
0 0 0
.02
.04
−.04
−.02
.02
.04
−.04
−.02
.02
.04
1983 1986 1989Year of birth
(24−26−year−olds)
High school completion
1983 1986 1989Year of birth
(24−26−year−old high school completers)
College attendance
1983 1986 1989Year of birth
(24−26−year−old college attenders)
College completion
Low Middle High
Figure 2-3.Trends in Educational Attainment by Family Income in the ACS
Source: U.S. Census Bureau, 2006-2017 American Community Survey, 1998-2015 IRS Form 1040 data, and Census Numident.
U.S. Census Bureau Center for Economic Studies Research Report: 2019 19
widened slightly. Additional work examines how these income gradients in educational attain-ment vary by socio demographic and neighborhood character-istics. This work complements both existing data products from the National Center for Education Statistics, as well as other Census Bureau blended data products, such as the Opportunity Atlas, which was highlighted in last year’s annual report.
Another type of blended data product combines survey con-tent and administrative records at a single point in time. An example of this that we are currently working on uses ACS and federal income tax data to produce new subnational statistics on the distribution of income. One limitation of administrative tax data is that it only provides information on income that is relevant to the tax authorities. On the other hand, household surveys, such as the ACS, provide broader definitions of income—including in-kind and cash transfers—and also allow for the study of household or family income, although there
are concerns about misreporting on surveys.
A second limitation of admin-istrative tax data is that it only provides information for resource-sharing groups as defined by tax law. That is, an IRS tax unit, i.e., everyone appearing on a single IRS Form 1040, can differ from usual household or family concepts. For example, two cohabiting unmarried partners will not share a tax return, but they would be in the same survey household or family. By combining the best features of these two data sources, it is possible to con-struct a conceptually attractive blended measure of household pretax posttransfer income. With these new blended income data, we have begun to construct new statistics on the distribution of income for states and other subnational geographies.
CONCLUSION
Throughout this chapter, we have highlighted various efforts to develop new and innovative ways to incorporate administra-tive records into survey mea-surement. These efforts focus on all phases of the survey life
cycle and lead to less costly data collection, better data quality, and/or richer data, all without increasing respondent burden or even decreasing such burden.
Despite our successes, there is still much research and planning that must occur before we are able to exploit the full potential of these innovative administra-tive records-based approaches. We look forward to continuing our work with collaborators within the Census Bureau and across the federal government, as we incorporate administrative records into survey operations and create blended data prod-ucts that provide new, timely, valuable information to the American public.
The Census Bureau is tasked with providing data on the nation’s people and economy, and administrative records have proven to be an increasingly important way for us to fulfill this mission. As the Census Bureau continues to explore the full potential of administrative records, CES will continue to be at the forefront of these efforts.

This page is intentionally blank.
U.S. Census Bureau Center for Economic Studies Research Report: 2019 21
Chapter 3. Transitions Into the Labor Force: Using the Census Bureau’s National Jobs Frame to Measure College Graduates’ and Veterans’ OutcomesAndrew Foote and Lee Tucker, Center for Economic Studies
Through the Local Employment Dynamics (LED) partner-ship with states, the District of Columbia, and U.S. territo-ries, the U.S. Census Bureau has developed a national jobs frame and data products includ-ing the Quarterly Workforce Indicators, OnTheMap, and Job-to-Job Flows. Moreover, the unique features of this data infrastructure, based on worker-level employment and earnings data from state unemployment insurance records, have allowed researchers, both within the Census Bureau and through the Federal Research Statistical Data Center network, to study numer-ous important economic ques-tions that might otherwise be unanswerable. While other large data sets permit researchers to construct limited snapshots of labor market outcomes for par-ticular subpopulations of inter-est, few provide the longitudinal information needed to analyze job transitions or career trajecto-ries, while being comprehensive enough to examine those key subpopulations.
Because of its unique advan-tages, these data have long been used to analyze short-term labor market trends. For exam-ple, Job-to-Job Flows allows users to easily construct detailed analyses of job transitions. Yet, there is abundant evidence that earnings upon entry into the labor market, and subsequent long-run career trajectories, are important as well. In particular,
a number of research stud-ies have shown that the initial entry conditions of workers have long-run impacts on earn-ings outcomes for both college graduates and veterans (e.g., Oreopolous et al., 2012 and Zou 2018). Furthermore, some of this research has examined how career trajectories differ based on an individual’s field of study or training background (Altonji et al., 2016). Until recently, Census Bureau public-use data products provided no informa-tion on these long-run out-comes. Moreover, because the demographic data contained in administrative records obtained through the LED partnership are limited, policymakers (including our LED partners) have been unable to analyze and under-stand the career trajectories of the groups of individuals of importance to them.
Two new public-use data prod-ucts developed by Center for Economic Studies (CES) researchers fill this void of
information on long-run earnings and employment outcomes. In particular, the Post-Secondary Employment Outcomes (PSEO) contains data on the career outcomes for graduates of post-secondary institutions, while the Veterans Employment Outcomes (VEO) contains earnings out-comes for veterans who have left the armed forces. These data products are possible through new partnerships with univer-sity and military stakeholders, respectively, expanding on the Census Bureau’s long history of fostering productive part-nerships. Moreover, through the novel application of formal differential privacy techniques, each product is able to provide detailed information of interest to our partners, policymakers, and the general public, while also upholding our legal obliga-tions to protect individuals’ pri-vacy. In what follows, we provide an overview of the history, goals, and techniques associated with these new data products.
The PSEO and VEO provide critical information to better understand labor market outcomes. These experimental data products resulted from new partnerships the Census Bureau has developed with colleges, universities, and the U.S. military. Importantly, the PSEO and VEO directly inform household decision making about career planning and educational invest-ments. Moreover, these products are based entirely on existing information, requiring no additional burden on individuals. We look forward to scaling these products to cover all higher edu-cational institutions and all branches of the armed forces.
Ron Jarmin, Deputy Director of the Census Bureau
22 Center for Economic Studies Research Report: 2019 U.S. Census Bureau
DEVELOPING THE PSEO
Until recently, data on the employment outcomes of gradu-ates of postsecondary institu-tions have had limitations. A number of states have matched data on workers in their indi-vidual state (from their state’s unemployment insurance pro-gram) to data on graduates from their universities. While this pro-vides useful information, it misses graduates who move to a differ-ent state—an issue that grows worse over a longer time horizon. Schools now have earnings out-comes at the program level (i.e., degree level and major) through the Department of Education’s College Scorecard. However, the College Scorecard data are lim-ited to graduates who received Title IV financial aid as students and only include earnings for the first year after graduation, which typically do not reflect long-run earnings outcomes.
The PSEO addresses the need for both national earnings and employment outcomes data and a longer time horizon. Though there are many data sources containing college graduate out-comes, PSEO is the only source that contains all graduates of a postsecondary institution. The PSEO also calculates consistent earnings outcomes across majors and institutions, enabling direct comparisons.
The PSEO began as a partner-ship with the University of Texas (UT) System. The Census Bureau benefited from the expertise of UT staff who had previously developed a similar set of mea-sures and who could help us to understand how students and administrators interact with such
data. Their input also enabled us to choose the most consistent measure of earnings, the appro-priate levels of aggregation, and the acceptable level of “noise” to infuse into estimates (to pro-tect privacy). Our partners also helped us develop the original PSEO data visualization tool.
The UT System has been one of the main public advocates for PSEO and has generated much publicity and visibility for this use-ful product. Their advocacy and support for the broader Census Bureau effort helped expand this partnership to other states.
THE PSEO IN ACTION
The PSEO consists of two sets of tables about graduates. The first set provides statistics on earn-ings by postsecondary institu-tion, degree level, degree field, and graduation cohort at 1, 5, and 10 years after graduation.
Here earnings for the 25th, 50th, and 75th percentiles of each cell as well as higher-level aggrega-tions are reported. These data are useful for assessing the initial earnings of graduates, compar-ing different types of degrees, and examining the earnings tra-jectory of degrees over time.
The second set of PSEO statis-tics are the employment flows table, which show census divi-sion and industry sector of a graduate’s main job at 1, 5, and 10 years after graduation. These tabulations allow users to see where graduates work imme-diately following graduation as well as their employment in the middle of their careers.
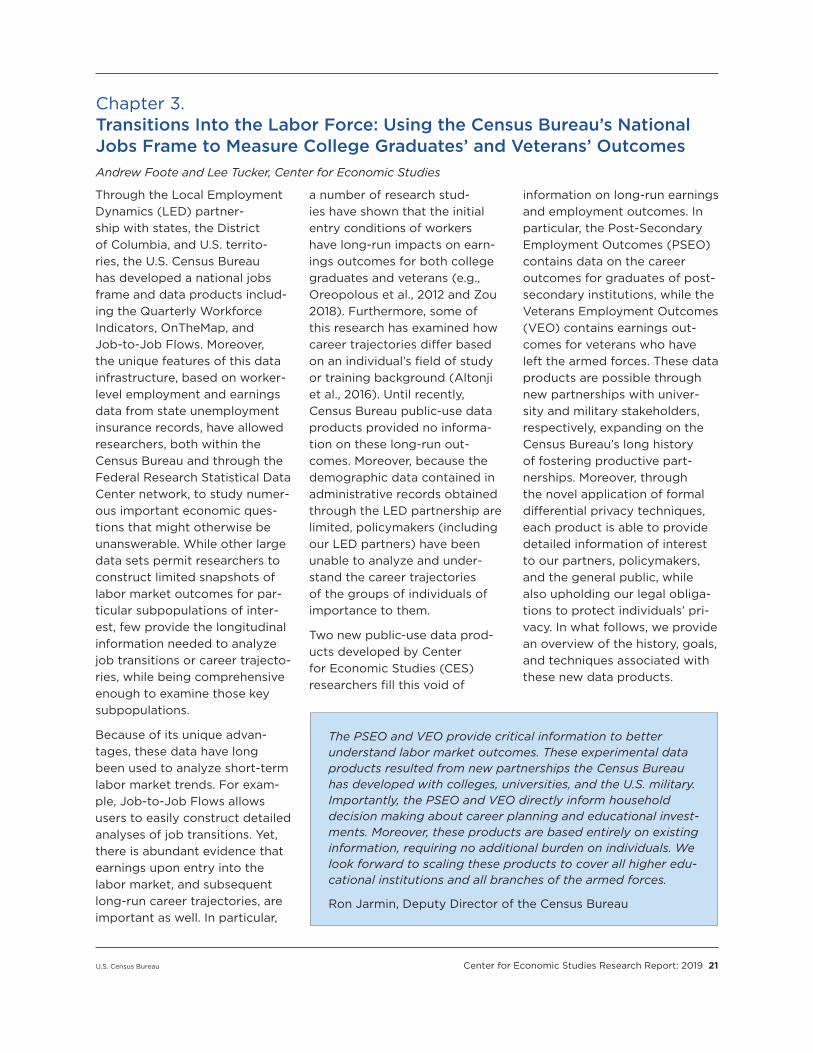
As noted above, an advantage of the PSEO over similar data is its ability to compare longer-run earnings outcomes across fields of study. Figure 3-1 shows the median earnings at 1 and 10
PETROLEUM ENG.
BIOLOGYBIOCHEMISTRY
LIBERAL ARTS & SCI., GEN. STUDIES & HUMANITIESPHYSICS
PHILOSOPHYBUSINESS, GENERAL
MICROBIOLOGY & IMMUNOLOGYFINANCE
ACCOUNTINGCOMMUNICATION & MEDIA STUDIES
ECONOMICS
PSYCHOLOGYHISTORYRADIO
JOURNALISM MECHANICAL ENG.MATHENGLISH
ELECTRICAL ENG.HEALTH & PHYS. ED.COMPUTER & INFO. SCI.ANTHROPOLOGY
ARCHITECTURESOCIAL WORK REGISTERED NURSING
MULTI/INTERDISCIPLINARY STUDIES
050
100
150
200
Per
cent
age
gain
in m
edia
n ea
rnin
gs a
t 10
year
s
20,000 40,000 60,000 80,000Median earnings 1 year after graduation
Figure 3-1.
Initial Earnings and 10-Year Earnings Growth for 2001–2003 University of Texas at Austin Graduates by Degree Field(Earnings are in 2016 dollars)
Source: U.S. Census Bureau, Post-Secondary Employment Outcomes.
U.S. Census Bureau Center for Economic Studies Research Report: 2019 23
years after graduation for select graduates from the University of Texas at Austin. While gradu-ates in a number of fields earn around $40,000 in their first year, subsequent earnings growth varies from less than 25 percent to almost 200 percent. For example, biology and bio-chemistry majors in their tenth year earn over 150 percent more than what they earned in their first year, while the earnings of social work and anthropology graduates grew less than 50 percent over the same period. Meanwhile, registered nursing graduates have very high median earnings (over $60,000) in their first year, but very low earnings
growth—on par with social work. Thus, when making decisions about borrowing against future income, information on long-run earnings is much more relevant than first-year earnings.
For state policymakers, a pri-mary interest is the retention of university graduates within the state, which depends on the match between employment opportunities and training. The PSEO employment flows data sheds light on the job mobility of graduates over time.
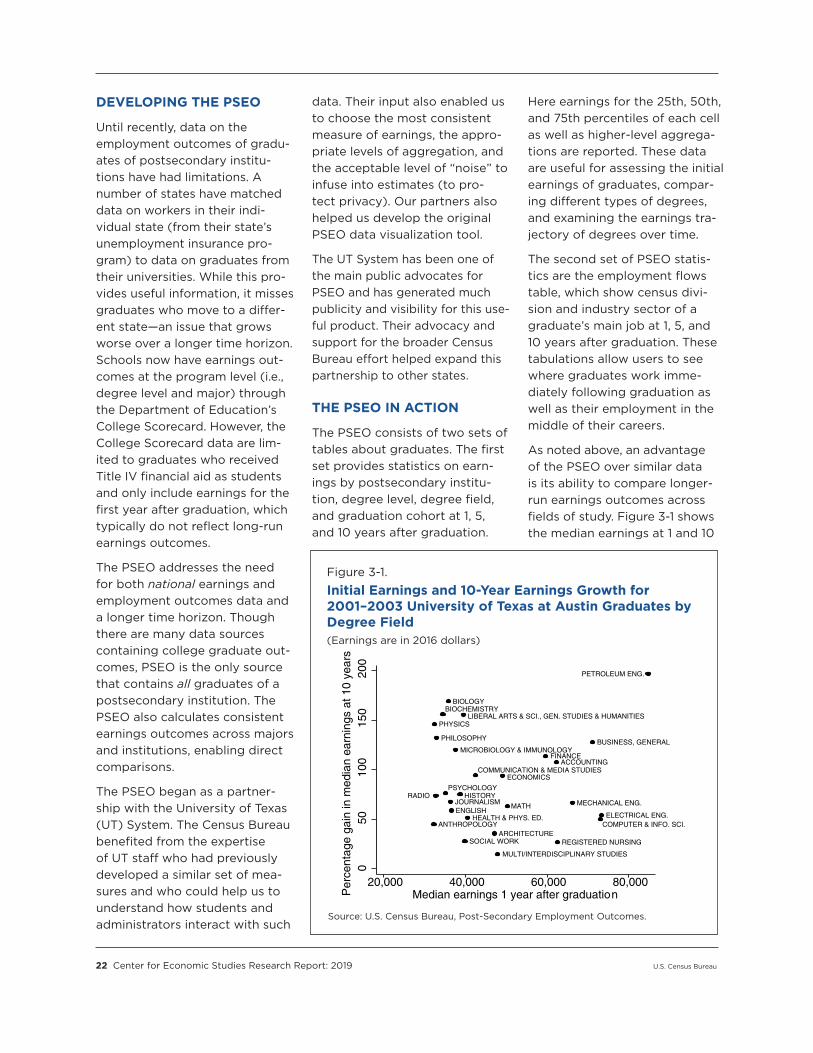
Figure 3-2 shows where gradu-ates work 1 year after graduating from the four flagship institu-tions currently in the PSEO data.
There are some large differences across these schools. In particu-lar, graduates from the University of Texas at Austin are much more likely to stay in Texas (80.4 percent), while University of Michigan Ann Arbor graduates are much more likely to leave Michigan (58.6 percent). Besides out-of-state mobility rates, there are also significant differences in regional destinations. For exam-ple, while both schools are in the Midwest, University of Michigan Ann Arbor graduates are almost twice as likely to be employed in the Pacific Division as University of Wisconsin Madison graduates, while they have similar rates of remaining in the Midwest.
University of Colorado Boulder
University of Wisconsin-Madison
University of Texas at Austin
University of Michigan
0.9
4.43.9
2.0
3.80.7
3.2
2.612.965.6
0.4
4.12.1
0.9
2.80.7
1.1
1.56.0
80.4
1.7
15.0
15.4
2.4
7.41.3
3.3
2.310.0
41.4
0.7
5.7
15.0
9.3
4.10.8
2.1
2.25.2
54.9
Figure 3-2.Where Graduates With a Bachelor’s Degree From Four Flagship Institutions Work by Region(In percent)
Source: U.S. Census Bureau, Post-Secondary Employment Outcomes.
24 Center for Economic Studies Research Report: 2019 U.S. Census Bureau
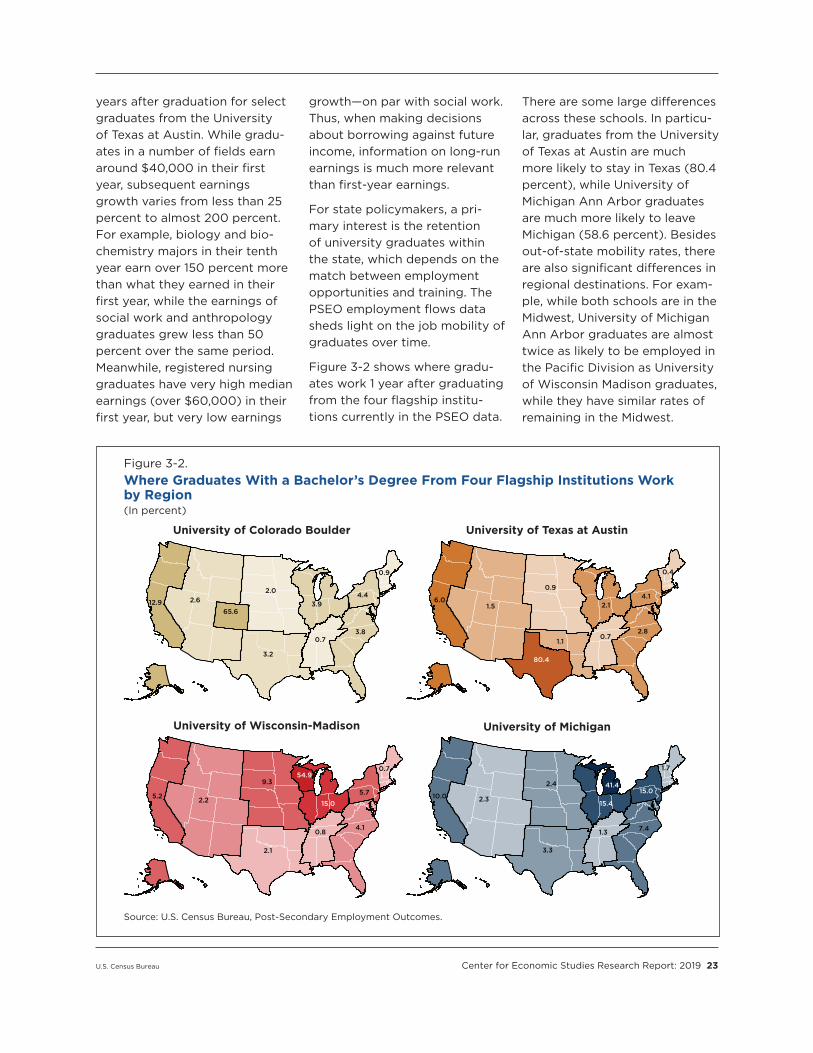
The PSEO employment flows data also sheds light on the industry of employment and how those employment pat-terns differ by field of study and institution. Figure 3-3 compares the relative flow of graduates into different industry sectors for three of the most popular bachelor degree fields: business, social sciences, and communica-tions. Not surprisingly, a large proportion of business graduates become employed in the finance and insurance sector, while com-paratively few go into educa-tion. Meanwhile, social science majors are much more likely to be employed in the health and education sectors than in other sectors of the economy. These examples illustrate the PSEO’s utility for understanding the transition of college graduates into the labor market, filling a void that had existed in available data.
To learn more about the PSEO and to download data, visit <https://lehd.ces.census.gov /data/pseo_experimental.html>, or use the PSEO Explorer visual-ization tool at <https://lehd.ces .census.gov/data/pseo_explorer .html>.
VEO AND THE CAREER TRAJECTORIES OF VETERANS
With the successful launch of the PSEO, it was natural to envision other, similar data products. Much like higher education, military service often occurs before entering the labor market, and it also has the potential to impact labor market outcomes in the long run. An understand-ing of these outcomes for
veterans is not only of interest to the military, but also to other policymakers and to individuals themselves. As with the PSEO, the VEO began when CES found an outside data provider—in this case, the Office of Economic and Manpower Analysis of the U.S. Army—who was interested in partnering with us to create new and useful information. CES staff received information on the set of individuals who served in the U.S. Army at any time from 1990 through 2017. These Army data include enlistment and separation dates, a wide range of demographic information, and various characteristics of military service. This information was combined with worker-level employment and earnings data to create the VEO, covering all
enlisted veterans who completed their initial term of service and then separated from active duty military service in the years 2000–2015.
Similar to the PSEO, the VEO reports industry of employment and earnings percentiles for mili-tary veterans 1, 5, and 10 years after they leave active duty ser-vice. In addition, VEO is able to report statistics by a wide range of demographics and character-istics of military service, includ-ing age, sex, race and ethnicity, military occupation, rank, years of military service, education at enlistment, and Armed Forces Qualifying Test scores.
One of the many useful fea-tures of the VEO is the ability to observe the career trajectories
Communication, journalism, and related programsSocial sciences
0 5 10 15 20
Health
Education
Professional
Finance/insurance
Information
Retail
Business, management, marketing, and related support services
Figure 3-3.Percentage of Graduates by Industry
Source: U.S. Census Bureau, Post-Secondary Employment Outcomes.
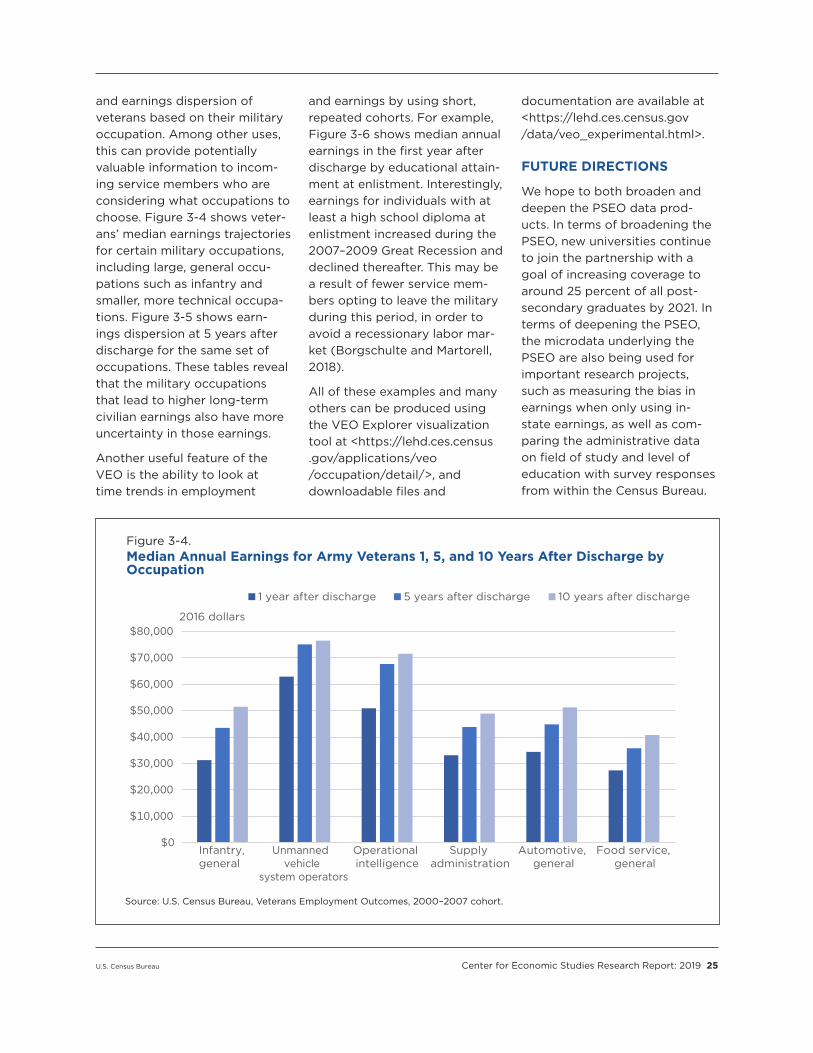
U.S. Census Bureau Center for Economic Studies Research Report: 2019 25
and earnings dispersion of veterans based on their military occupation. Among other uses, this can provide potentially valuable information to incom-ing service members who are considering what occupations to choose. Figure 3-4 shows veter-ans’ median earnings trajectories for certain military occupations, including large, general occu-pations such as infantry and smaller, more technical occupa-tions. Figure 3-5 shows earn-ings dispersion at 5 years after discharge for the same set of occupations. These tables reveal that the military occupations that lead to higher long-term civilian earnings also have more uncertainty in those earnings.
Another useful feature of the VEO is the ability to look at time trends in employment
and earnings by using short, repeated cohorts. For example, Figure 3-6 shows median annual earnings in the first year after discharge by educational attain-ment at enlistment. Interestingly, earnings for individuals with at least a high school diploma at enlistment increased during the 2007–2009 Great Recession and declined thereafter. This may be a result of fewer service mem-bers opting to leave the military during this period, in order to avoid a recessionary labor mar-ket (Borgschulte and Martorell, 2018).
All of these examples and many others can be produced using the VEO Explorer visualization tool at <https://lehd.ces.census .gov/applications/veo /occupation/detail/>, and downloadable files and
documentation are available at <https://lehd.ces.census.gov /data/veo_experimental.html>.
FUTURE DIRECTIONS
We hope to both broaden and deepen the PSEO data prod-ucts. In terms of broadening the PSEO, new universities continue to join the partnership with a goal of increasing coverage to around 25 percent of all post-secondary graduates by 2021. In terms of deepening the PSEO, the microdata underlying the PSEO are also being used for important research projects, such as measuring the bias in earnings when only using in-state earnings, as well as com-paring the administrative data on field of study and level of education with survey responses from within the Census Bureau.
$0
$10,000
$20,000
$30,000
$40,000
$50,000
$60,000
$70,000
$80,000
Infantry, general
Unmanned vehicle
system operators
Operational intelligence
Supply administration
Automotive, general
Food service, general
1 year after discharge
2016 dollars
5 years after discharge 10 years after discharge
Source: U.S. Census Bureau, Veterans Employment Outcomes, 2000–2007 cohort.
Figure 3-4.Median Annual Earnings for Army Veterans 1, 5, and 10 Years After Discharge by Occupation
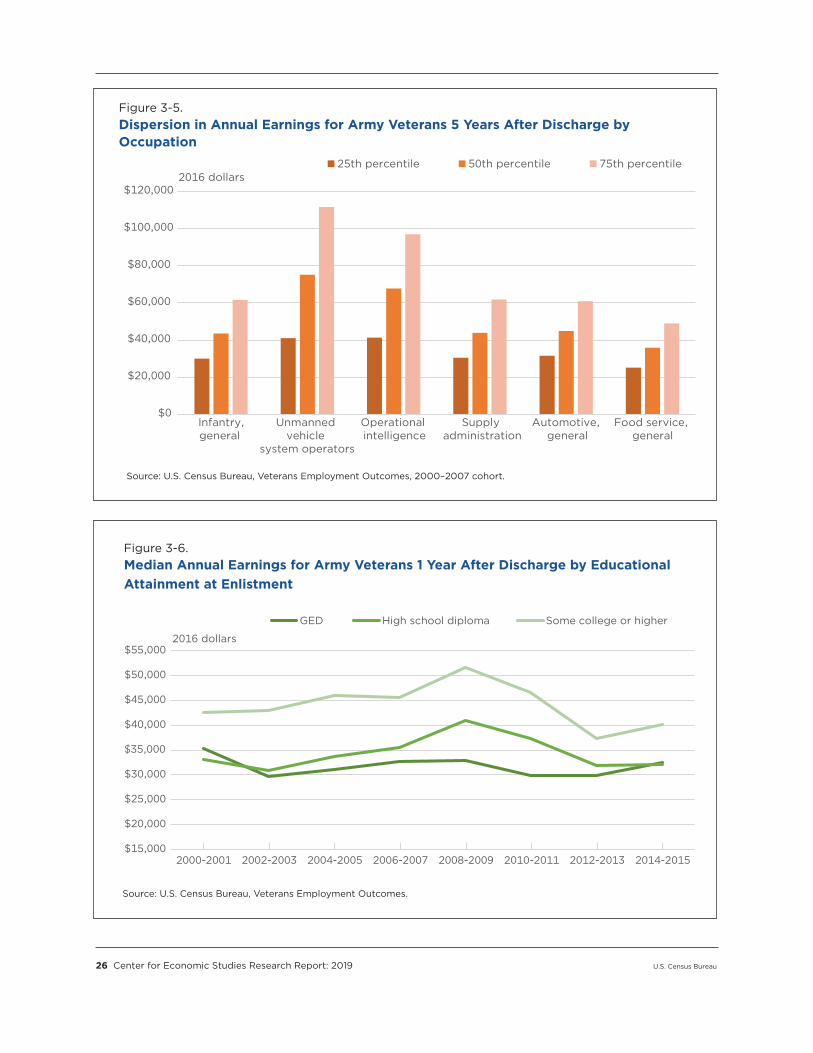
26 Center for Economic Studies Research Report: 2019 U.S. Census Bureau
$0
$20,000
$40,000
$60,000
$80,000
$100,000
$120,000
Infantry,general
Unmanned vehicle
system operators
Operational intelligence
Supply administration
Automotive, general
Food service, general
25th percentile2016 dollars
50th percentile 75th percentile
$15,000
$20,000
$25,000
$30,000
$35,000
$40,000
$45,000
$50,000
$55,000
2000-2001 2002-2003 2004-2005 2006-2007 2008-2009 2010-2011 2012-2013 2014-2015
GED
2016 dollars
High school diploma Some college or higher
Figure 3-6.Median Annual Earnings for Army Veterans 1 Year After Discharge by Educational Attainment at Enlistment
Source: U.S. Census Bureau, Veterans Employment Outcomes, 2000–2007 cohort.
Source: U.S. Census Bureau, Veterans Employment Outcomes.
Figure 3-5.Dispersion in Annual Earnings for Army Veterans 5 Years After Discharge by Occupation
U.S. Census Bureau Center for Economic Studies Research Report: 2019 27
We are also using PSEO as a pilot for incorporating Internal Revenue Service earnings data into the LED data infrastruc-ture, as a secondary source of earnings and employment information.
We are also investigating opportunities to expand the VEO and analyzing its potential for research that improves our understanding of labor market outcomes for military veterans, including veterans from other
branches of the armed forces. As we continue our research and development efforts, we expect new partnerships that will yield similarly valuable data products.
PSEO AND VEO: THE PRIVACY CHALLENGES AND SOLUTIONS
The rise of administrative data sources and their use by statistical agencies, as well as data partnerships, have led to a proliferation of new and valuable information on the population and the economy. However, it has also created many new challenges for statistical agencies, which have a legal obligation to ensure indi-vidual privacy. Increasingly, statistical agencies must face the reality that outside entities have access to large portions of the data underlying their public-use outputs. When partnering with an outside data provider, such as in the cases of PSEO and VEO, this is obviously explicitly true. The Census Bureau must always ensure that the statistics it publishes are robust to any outside attempts to combine those statistics with exter-nal data to identify the existence or attributes of any given individual. Many of the traditional privacy protection measures employed by statistical agencies are not well-suited to this particular challenge because they were devel-oped for survey-based statistics, where only the statistical agency possesses the underlying microdata.
To address these new privacy challenges, the Census Bureau has become a leader in the application of “differential privacy” techniques. At their core, these techniques allow the Census Bureau to quantify the worst-case loss to individual-level privacy associated with each statistic that it releases and therefore formally (in a mathematical sense) guarantee that the risk of privacy loss is appropriately limited. While PSEO and VEO are not the first Census Bureau data products to employ differential privacy methods, they provide a clear demon-stration of how the innovative use of differential privacy enables the production and release
of public-use data that might otherwise have been impossible without sacrificing individual privacy.
The specific issue with both PSEO and VEO is that the partners who provide us the data have access to the complete frame of individu-als—graduates and veterans, respectively—that is used to produce our statistics. In the case of PSEO, our partners also observe earnings for the subset of graduates employed within the state. So, in the worst case, where just one graduate is employed outside the state, the earnings of an individual graduate could be inferred from a single aggregate statistic such as median earnings. Meanwhile, detailed tabulations by, say, college major are especially difficult to protect using traditional statistical disclosure limitation methods because out-side data users can create implicit samples that threaten the privacy of individuals in the microdata. Yet these tabulations are also of particular interest to our partners and to the general public.
One solution is to add sufficient “noise” to the underlying statistic so that it is more difficult to identify any one individual, no matter what information the end user has. However, any introduction of noise comes with an inevitable trade-off in the accuracy of the information that is released. The differential privacy tech-niques applied to both the PSEO and VEO have allowed us to quantify this trade-off and therefore maximize our ability to release useful statistics without creating unacceptable risks to individual privacy.
See page 28
28 Center for Economic Studies Research Report: 2019 U.S. Census Bureau
REFERENCES
Abowd, John M., and Ian M. Schmutte, “An Economic Analysis of Privacy Protection and Statistical Accuracy as Social Choices," American Economic Review, 109(1):171-202, 2019.
Altonji, Joseph G., Lisa B. Kahn, and Jamin D. Speer, “Cashier or Consultant? Entry Labor Market Conditions, Field of Study, and Career Success,” Journal of Labor Economics, 34(S1):S361-S401, 2016.
Borgschulte, Mark, and Paco Martorell, “Paying to Avoid Recession: Using Reenlistment to Estimate the Cost of Unemployment,” American Economic Journal: Applied Economics, 10(3):101-127, 2018.
Foote, Andrew David, Ashwin Machanavajjhala, and Kevin McKinney, “Releasing Earnings Distributions using Differential Privacy: Disclosure Avoidance System for Post-Secondary Employment Outcomes
(PSEO),” Journal of Privacy and Confidentiality, 9(2), 2019.
Oreopoulos, Philip, Till von Wachter, and Andrew Heisz, “The Short- and Long-Term Career Effects of Graduating in a Recession,” American Economic Journal: Applied Economics, 4(1):1-29, 2012.
Zou, Ben, “The Local Economic Impacts of Military Personnel,” Journal of Labor Economics, 36(3):589-621, 2018.
The VEO also utilizes the above code and built on the innovations from the PSEO by address-ing another significant challenge. Differential privacy methods, such as the histogram method, incur a privacy loss for each tabula-tion that is produced, while the overall loss to privacy is not permitted to exceed a threshold “budget” beyond which the privacy loss is con-sidered unacceptable. The VEO team wished to provide statistics on earning percentiles across several demographic and economic dimensions such as occupation, industry, and geography. This meant that, in addition to limiting the over-all loss to privacy, the project team needed to balance the trade-off between privacy loss and statistical accuracy for each individual table and efficiently allocate its privacy budget across the numerous desired tables. To accomplish this, the team first developed new metrics to quantify the accuracy of privacy-protected data that could be compared across tables. Then, in keeping with the research of Abowd and Schmutte (2019), the team built an optimization method that determined which combination of individual table budgets would ensure desired minimum accuracy for each table without exceeding the overall privacy loss budget and without having to omit detailed tabulations that might be of benefit to users. Besides the VEO, this method is useful for any similar product that involves multiple tables.
Continue from page 27...
A major contribution of both the PSEO and VEO is that they provide earnings percentiles for many subsets of college graduates and veterans, respectively. Earnings percentiles are typically difficult to publish because true percentiles correspond to specific individu-als. Previous methods for releasing percentiles using differential privacy produced estimates that were too noisy to be useful in this setting. In a key methodological innovation, the PSEO team first used public information about the earnings distribution to construct a histogram of earnings and then added geometric noise to the counts associated with each bin in the histogram. This approach has two advantages over previous methods. First, the use of public information permitted more accurate ranges on the possible values for the earnings percentile. Second, the method injects noise across the entire histogram, allowing the release of multi-ple percentiles while only incurring one instance of privacy loss. See Foote et al. (2019) for more detail and for comparisons to other method-ologies. The code is posted on GitHub for use by other statistical agencies. Given the dearth of off-the-shelf implementations of differential privacy, we hope that providing these resources is helpful to others seeking to implement formal privacy protections.
U.S. Census Bureau Center for Economic Studies Research Report: 2019 29
Appendix 1. OVERVIEW OF THE CENTER FOR ECONOMIC STUDIES
The Center for Economic Studies (CES) partners with stakeholders within and outside the U.S. Census Bureau to improve measures of the economy and people of the United States through research and the development of innova-tive data products.
RESEARCH
CES research staff use confi-dential microdata from Census Bureau censuses and surveys of businesses and households, linked employer-employee data, and administrative records from federal and state agencies and other sources to carry out empirical research that leads to:
• Discoveries in economics and other social sciences not pos-sible using publicly available data.
• Improvements in existing Census Bureau surveys and data products.
• Enhancements to micro-level data sets for researcher-use in the Federal Statistical Research Data Center (FSRDC) network.
• New statistics and information products for public use.
Research findings are dissemi-nated through publications (see Appendix 2), CES working papers (see Appendixes 3 and 4), confer-ences, seminars, workshops, and this annual report.
PRODUCTS
CES uses microdata from exist-ing censuses and surveys, and from administrative sources, to create innovative public-use data products, including:
• Business Dynamics Statistics (BDS). Tabulations of estab-lishment openings and closings, firm startups and shutdowns, and job creation and destruction with unique information on firm age and firm size.
• Business Formation Statistics (BFS). Quarterly statistics on business applications and for-mations including projections for recent and future quarters.
• Dispersion Statistics on Productivity (DiSP). Annual statistics on within-industry dispersion of productivity for the manufacturing sector.
• Job-to-Job Flows (J2J). Statistics on worker realloca-tion, including job change, hires and separations from and to nonemployment, and characteristics of origin and destination jobs.
• National Longitudinal Mortality Study (NLMS). Database for studying the effects of demographic and socioeconomic characteristics on differential in mortality rates.
• OnTheMap. Online mapping and reporting application showing where people work and workers live, with infor-mation on worker and busi-ness characteristics.
• OnTheMap for Emergency Management. Intuitive Web-based interface for accessing U.S. population and workforce statistics, in real time, for areas being affected by natu-ral disasters.
• Opportunity Atlas. Interactive mapping tool showing mea-sures of social mobility for every Census tract in the United States.
• Post-Secondary Employment Outcomes (PSEO). Statistics on the earnings and employ-ment outcomes for college graduates by institution, degree field, and degree level.
• Quarterly Workforce Indicators (QWI). Workforce statistics, including employ-ment, earnings, job creation, and turnover, by demography, geography, and industry for each state.
• Synthetic Longitudinal Business Database (SynLBD). Experimental synthetic microdata on all U.S. estab-lishments including employ-ment, payroll, and age.
30 Center for Economic Studies Research Report: 2019 U.S. Census Bureau
HISTORY
CES was established in 1982 to house databases on businesses, link them cross-sectionally and longitudinally, conduct economic research with them, and make them available to researchers. In his 1991 Nobel Prize lecture, economist Ronald Coase noted, “We can also hope to learn much more in the future from the stud-ies of the activities of firms which have recently been initiated by the Center for Economic Studies of the Bureau of the Census of the United States.”
Elaborating on these thoughts in a letter sent to CES following a visit there in June 1993, Coase states:
“It must be a matter of pride for all in the Bureau of the Census to have a unit which, through its research activities, is playing such a valuable role in increasing our understanding of the working of our economic system. Of course, no individual or institution can do everything. The Center will have to depend on research conducted elsewhere (particularly in universi-ties) . . . to develop a more com-plete and more accurate picture of the structure of the economy. For this reason I greatly welcome the initiative of the Bureau of the Census in establishing an office of the Center in Boston . . . and I hope, after assessing your expe-rience in Boston, that it will be found desirable to establish simi-lar offices in other places.”
Indeed, CES opened the first research data center in Boston in 1994 and continued to grow the network over the next quarter century. Today, there are FSRDCs located at dozens of universities
and research organizations across the country. In addition to restricted-use data on businesses and households from the Census Bureau, the FSRDCs now also pro-vide secure access to restricted-use data from other federal statistical agencies. As of 2018, the FSRDCs are administered by the newly established Center for Enterprise Dissemination.
With time, CES’ focus evolved from a near-exclusive focus on the manufacturing sector to include nonmanufacturing sectors and data on workers and house-holds. In 2008, the Longitudinal Employer-Household Dynamics (LEHD) program joined CES from the Census Bureau’s Demographic Directorate, and in 2018, researchers from the former Center for Administrative Records Research and Applications (CARRA) joined CES.
Today, CES is comprised of several dozen researchers with doctorates in economics, sociology, demog-raphy, public policy, statistics, and history and with research that is even more diverse.
PARTNERSHIPS
CES relies on many partners within and outside the Census Bureau, including:
• Census Bureau divisions that collect, process, and produce the business and household microdata at the heart of our research and that provide us their expert knowledge of the methodologies underlying those surveys and censuses.
• Our colleagues in other cen-ters within the Research and Methodology Directorate.
• Those with whom we are col-laborating on joint research and development including:
○ Fellow statistical agen-cies including the Bureau of Economic Analysis, Bureau of Justice Statistics, Bureau of Labor Statistics, Economic Research Service, and National Center for Science and Engineering Statistics.
○ Other federal agencies including the Agency for Healthcare Research and Quality, the Food and Nutrition Service, and the Small Business Administration.
○ Academic institutions including Brown University, Harvard University, University of California—Irvine, University of Maryland, and University of North Carolina at Chapel Hill.
○ Other research organiza-tions including the Institute for Research on Innovation and Science, NORC at the University of Chicago, and the RAND Corporation.
• The members of the Local Employment Dynamics Partnership and other LEHD partners (see Appendix 5), who provide data critical to a number of our public-use data products, including J2J, OnTheMap, PSEO, and the QWI.
U.S. Census Bureau Center for Economic Studies Research Report: 2019 31
Appendix 2. PUBLICATIONS AND WORKING PAPERS BY CENTER FOR ECONOMIC STUDIES STAFF: 2019
PUBLICATIONS
Abowd, John M., Kevin L. McKinney, and Ian M. Schmutte, “Modeling Endogenous Mobility in Earnings Determination,” Journal of Business and Economic Statistics, 2019, 37:405–418.
Abraham, Katharine G., John Haltiwanger, Kristin Sandusky, and James R. Spletzer, “The Consequences of Long Term Unemployment: Evidence from Linked Survey and Administrative Data,” ILR Review, 2019, 72:266–299.
Abraham, Katharine, John Haltiwanger, Kristin Sandusky, and James Spletzer, “Measuring the Gig Economy: Current Knowledge and Open Issues,” In Measuring and Accounting for Innovation in the 21st Century, edited by Carol Corrado, Javier Miranda, Jonathan Haskel, and Daniel Sichel, University of Chicago Press, forthcoming.
Abraham, Katharine G., John Haltiwanger, Kristin Sandusky, and James Spletzer, “The Rise of the Gig Economy: Fact or Fiction?” AEA Papers and Proceedings, 2019, 109:357–361.
Akee, Randall, Maggie R. Jones, and Sonya R. Porter, “Race Matters: Income Shares, Income Inequality, and Income Mobility for All U.S. Races,” Demography, 2019, 56:999–1021.
Akee, Randall, Maggie R. Jones, Sonya R. Porter, and Emilia Simeonova, “Hispanic and Asian Earnings Inequality and the Role of Labor Market Entrants and Immigrants,” AEA Papers and Proceedings, forthcoming.
Altekruse, Sean F., Candace M. Cosgrove, William C. Altekruse, Richard A. Jenkins, and Carlos Blanco, “Socioeconomic Risk Factors for Fatal Opioid Overdoses in the United States: Findings from the Mortality Disparities in American Communities Study (MDAC),” PLoS One, 2020, 15(1):e0227966.
Azoulay, Pierre, Benjamin Jones, J. Daniel Kim, Javier Miranda, “Age and High-Growth Entrepreneurship,” American Economic Review: Insights, 2020, 2:65–82.
Behrendt, Carolyn E., Candace M. Cosgrove, Norman J. Johnson, and Sean F. Altekruse, “Are Associations between Psychosocial Stressors and Incident Lung Cancer Attributable to Smoking?” PLoS One, 2019, 14(6):e0218439.
Birke, David, Garret Christensen, Rebecca Littman, Edward Miguel, Elizabeth Levy Paluck, Nicholas Swanson, and Zenan Wang, “Research Transparency is on the Rise in Economics,” AEA Papers and Proceedings, forthcoming.
Bloom, Nicholas, Erik Brynjolfsson, Lucia Foster, Ron Jarmin, Megha Patnaik, Itay Saporta-Eksten, and John Van Reenen, “What Drives Differences in Management Practices?” American Economic Review, 2019, 109:1648–1683.
Bronchetti, Erin T., Garret Christensen, and Hilary W. Hoynes, “Local Food Prices, SNAP Purchasing Power, and Child Health,” Journal of Health Economics, 2019, 68:102231.
Brown, J. David, John S. Earle, Mee Jung Kim, and Kyung Min Lee, “Large Start-ups, Job Creation, and Founder Characteristics,” Industrial and Corporate Change, 2019, 28:1637–1672.
Brown, J. David, John S. Earle, Mee Jung Kim, and Kyung Min Lee, “Immigrant Entrepreneurs and Innovation in the U.S. High-Tech Sector,” In The Roles of Immigrants and Foreign Students in Science, Innovation, and Entrepreneurship, edited by Ina Ganguli, Shulamit Kahn, and Megan MacGarvie, University of Chicago Press, 2020.
Brown, J. David, Misty L. Heggeness, Suzanne M. Dorinski, Lawrence Warren, and Moises Yi, “Predicting the Effect of Adding a Citizenship Question to the 2020 Census,” Demography, 2019, 56:1173–1194.
32 Center for Economic Studies Research Report: 2019 U.S. Census Bureau
Chetty, Raj, Nathaniel Hendren, Maggie R. Jones, and Sonya R. Porter, “Race and Economic Opportunity in the United States: An Intergenerational Perspective,” Quarterly Journal of Economics, forthcoming.
Christensen, Garret, Allan Dafoe, Edward Miguel, Don A. Moore, and Andrew K. Rose, “A Study of the Impact of Data Sharing on Article Citations using Journal Policies as a Natural Experiment,” PLoS One, 2019, 14(12):e0225883.
Christensen, Garret, Jeremy Freese, and Edward Miguel, Transparent and Reproducible Social Science Research: How to Do Open Science, University of California Press, 2019.
Christensen, Garret, and Edward Miguel, “Transparency and Reproducibility: Conceptualizing the Problem,” In The Production of Knowledge: Enhancing Progress in Social Science, edited by Colin Elman, John Gerring, and James Mahoney, Cambridge University Press, 2020.
Christensen, Garret, and Edward Miguel, “Transparency and Reproducibility: Potential Solutions,” In The Production of Knowledge: Enhancing Progress in Social Science, edited by Colin Elman, John Gerring, and James Mahoney, Cambridge University Press, 2020.
Christensen, Garret, and Edward Miguel, “Improving Research Transparency in the Social Sciences: Registration, Pre-registration, and Multiple Testing Adjustments,” In Research Integrity in the Behavioral Sciences, edited by Lee Jussim, Sean T. Stevens, and Jon A. Krosnick, Oxford University Press, forthcoming.
Cougle, Jesse R., Katherine A. McDermott, Jahn K. Hakes, and Keanan J. Joyner, “Personality Disorders and Social Support in Cannabis Dependence: A Comparison with Alcohol Dependence,” Journal of Affected Disorders, 2020, 265:26–31.
Dilworth, Richardson, and Todd Gardner, “White Flight,” In The Wiley-Blackwell Encyclopedia of Urban and Regional Studies, edited by Anthony Orum, Wiley-Blackwell, 2019.
Dinlersoz, Emin, Nathan Goldschlag, Amanda Myers, and Nikolas Zolas, “The Anatomy of Trademarking by Firms in the United States,” In Measuring and Accounting for Innovation in the 21st Century, edited by Carol Corrado, Javier Miranda, Jonathan Haskel, and Daniel Sichel, University of Chicago Press, forthcoming.
Dinlersoz, Emin M., Henry R. Hyatt, Hubert P. Janicki, “Who Works for Whom? Worker Sorting in a Model of Entrepreneurship with Heterogenous Labor Markets,” Review of Economic Dynamics, 2019, 34:244–266.
Dreisigmeyer, David, “A Quasi-Isometric Embedding Algorithm,” Pattern Recognition and Image Analysis, 2019, 29:230–233.
Dreisigmeyer, David W., “Whitney’s Theorem, Triangular Sets, and Probabilistic Descent on Manifolds,” Journal of Optimization Theory and Applications, 2019, 182:935–946.
Fairlie, Robert W., Javier Miranda and Nikolas Zolas, “Measuring Job Creation, Growth, and Survival among the Universe of Start-ups in the United States Using a Combined Start-up Panel Dataset,” ILR Review, 2019, 72:1262–1277.
Fernandez Leticia, and Norman J. Johnson, “Demographics and the Epidemiological Risk Factors for Dementia in Hispanic/Latino Populations,” In Caring for Latinxs with Dementia in a Globalized World: Behavioral and Psychosocial Treatments, edited by Hector Y. Adames and Yvette N. Tazeau, Springer, 2020.
Foote, Andrew, and Michel Grosz, “The Effect of Local Labor Market Downturns on Postsecondary Enrollment and Program Choice,” Education Finance and Policy, forthcoming.
U.S. Census Bureau Center for Economic Studies Research Report: 2019 33
Foote, Andrew, Michel Grosz, and Stephanie Rennane, “The Effect of Lower Transaction Costs on Social Security Disability Insurance Application Rates and Participation,” Journal of Policy Analysis and Management, 2019, 38:99–123.
Foote, Andrew, Michel Grosz, and Ann Stevens, “Locate Your Nearest Exit: Mass Layoffs and Local Labor Market Response,” ILR Review, 2019, 72:101–126.
Foster, Lucia, Cheryl Grim, John Haltiwanger, and Zoltan Wolf, “Innovation, Productivity Dispersion, and Productivity Growth,” In Measuring and Accounting for Innovation in the 21st Century, edited by Carol Corrado, Javier Miranda, Jonathan Haskel, and Daniel Sichel, University of Chicago Press, forthcoming.
Foster, Lucia, Cheryl Grim, and Nikolas Zolas, “A Portrait of U.S. Firms that Invest in R&D,” Economics of Innovation and New Technology, 2020, 29:89–111.
Foster, Lucia, Julia Manzella, Erika McEntarfer, and Danielle H. Sandler, “Employment and Earnings for Federal Government Economists: Empirical Evidence by Gender and Race,” AEA Papers and Proceedings, forthcoming.
Fraser, Gary E., Candace M. Cosgrove, Andrew D. Mashchak, Michael J. Orlich, and Sean F. Altekruse, “Lower Rates of Cancer and All-Cause Mortality in an Adventist Cohort Compared with a US Census Population,” Cancer, 2020, 126:1102–1111.
Goldschlag, Nathan, Ron Jarmin, Julia Lane, and Nikolas Zolas, “The Link between University R&D, Human Capital and Business Startups,” In Measuring and Accounting for Innovation in the 21st Century, edited by Carol Corrado, Javier Miranda, Jonathan Haskel, and Daniel Sichel, University of Chicago Press, forthcoming.
Goldschlag, Nathan, Julia Lane, Bruce A. Weinberg, and Nikolas Zolas, “Proximity and Economic Activity: An Analysis of Vendor-University Transactions,” Journal of Regional Science, 2019, 59:163–182.
Goldschlag, Nathan, Travis J. Lybbert and Nikolas J. Zolas, “Tracking the Technological Composition of Industries with Algorithmic Patent Concordances,” Economics of Innovation and New Technology, forthcoming.
Goldschlag, Nathan, and Javier Miranda, “Business Dynamics Statistics of High Tech Industries,” Journal of Economics & Management Strategy, 2020, 29:3–30.
Hosgood III, H. Dean, Candace Cosgrove, Madelyn Klugman, Thoman Rohan, Sean Altekruse, “Lung Cancer Mortality among Smokers and Never-Smokers in the United States,” Epidemiology, forthcoming.
Hungerman, Daniel M., Kevin Rinz, and Jay Frymark, “Beyond the Classroom: The Implications of School Vouchers for Church Finances,” Review of Economics and Statistics, 2019, 101:588–601.
Hyatt, Henry, “Co-working Couples and the Similar Jobs of Dual-Earner Households,” Monthly Labor Review, November 2019.
Hyatt, Henry, and Tucker McElroy, “Labor Reallocation, Employment, and Earnings: A Vector Autoregression Approach,” Labour, 2019, 33:463–487.
Ikudo, Akina, Julia I. Lane, Joseph Staudt, and Bruce A. Weinberg, “Occupational Classifications: A Machine Learning Approach,” Journal of Economic and Social Measurement, 2019, 44:57–87.
Jee, Eunjung, Joya Misra, and Marta Murray-Close, “Motherhood Penalties in the U.S., 1986-2014,” Journal of Marriage and Family, 2019, 81:434–449.
Kamal, Fariha, Mary E. Lovely, and Devashish Mitra, “Trade Liberalisation and Labour Shares in China,” The World Economy, 2019, 42:3588–3618.
34 Center for Economic Studies Research Report: 2019 U.S. Census Bureau
Kamal, Fariha, and Asha Sundaram, “Do Institutions Determine Economic Geography? Evidence from the Concentration of Foreign Suppliers,” Journal of Urban Economics, 2019, 110:89–101.
Luque, Adela, and Maggie R. Jones, “Differences in Self-Employment Duration by Year of Entry & Pre-Entry Wage-Sector Attachment,” Journal of Labor Research, 2019, 40:24–57.
Miranda, Javier, and Nikolas Zolas, “Measuring the Impact of Household Innovation Using Non Employer Administrative Data,” In Measuring and Accounting for Innovation in the 21st Century, edited by Carol Corrado, Javier Miranda, Jonathan Haskel, and Daniel Sichel, University of Chicago Press, forthcoming.
Monti, Holly, Martha Stinson, and Lori Zehr, “How Long Do Early Career Decisions Follow Women? The Impact of Employer History on the Gender Wage Gap,” Journal of Labor Research, forthcoming.
Noon, James M., Leticia E. Fernandez, and Sonya R. Porter, “Response Error and the Medicaid Undercount in the Current Population Survey,” Health Services Research, 2019, 54:34–43.
Sanzenbacher, Geoffrey T., Anthony Webb, Candace M. Cosgrove, and Natalia Orlova, “Rising Inequality in Life Expectancy by Socioeconomic Status,” North American Actuarial Journal, forthcoming.
Scherpf, Erik, and Benjamin Cerf, “Local Labor Demand and Program Participation Dynamics: Evidence from New York SNAP Administrative Records,” Journal of Policy Analysis and Management, 2019, 38:394–425.
Schulkind, Lisa, and Danielle H. Sandler, “The Timing of Teenage Births: Estimating the Effect on High School Graduation and Later Life Outcomes,” Demography, 2019, 56:345–365.
Schuster, Steven Sprick, Matthew Jaremski, Elisabeth Ruth Perlman, “An Empirical History of the United States Postal Savings System,” Social Science History, forthcoming.
Staudt, Joseph, “Mandating Accesss: Assessing the NIH’s Public Access Policy,” Economic Policy, forthcoming.
Staudt, Joseph, Yifang Wei, Lisa Singh, Shawn D. Klimek, J. Bradford Jensen, and Andrew L. Baer, “Automating Response Evaluation for Franchising Questions on the 2017 Economic Census,” In Big Data for 21st Century Economic Statistics, edited by Katharine G. Abraham, Ron S. Jarmin, Brian Moyer, and Matthew D. Shapiro, University of Chicago Press, forthcoming.
Swanson, Nicholas, Garret Christensen, Rebecca Littman, David Birke, Edward Miguel, Elizabeth Levy Paluck, and Zenan Wang, “Research Transparency is on the Rise in Economics,” AEA Papers and Proceedings, forthcoming.
WORKING PAPERS
Abowd, John M., Joelle Abramowitz, Margaret C. Levenstein, Kristin McCue, Dhiren Patki, Trivellore Raghunathan, Ann M. Rodgers, Matthew D. Shapiro, and Nada Wasi, “Optimal Probabilistic Record Linkage: Best Practice for Linking Employers in Survey and Administrative Data,” Center for Economic Studies Working Paper 19-08, 2019.
Akcigit, Ufuk, Emin Dinlersoz, Jeremy Greenwood, and Veronika Penciakova, “Synergizing Ventures,” NBER Working Paper No. 26196, 2019.
Akee, Randall, and Maggie R. Jones, “Immigrants’ Earnings Growth and Return Migration from the U.S.: Examining their Determinants using Linked Survey and Administrative Data,” Center for Economic Studies Working Paper 19-10; NBER Working Paper No. 25639, 2019.
Akee, Randall, and Maggie R. Jones, “Foreign vs. U.S. Graduate Degrees: The Impact on Earnings Assimilation and Return Migration for the Foreign Born,” Center for Economic Studies Working Paper 19-17, 2019.
Basker, Emek, Randy A. Becker, Lucia Foster, T. Kirk White, and Alice Zawacki, “Addressing Data Gaps: Four New Lines of Inquiry in the 2017 Economic Census,” Center for Economic Studies Working Paper 19-28, 2019.
U.S. Census Bureau Center for Economic Studies Research Report: 2019 35
Brown, J. David, John S. Earle, Mee Jung Kim, and Kyung Min Lee, “Immigrant Entrepreneurs and Innovation in the U.S. High-Tech Sector,” Center for Economic Studies Working Paper 19-06; NBER Working Paper No. 25565, 2019.
Brown, J. David, Misty L. Heggeness, Suzanne M. Dorinski, Lawrence Warren, and Moises Yi, “Predicting the Effect of Adding a Citizenship Question to the 2020 Census,” Center for Economic Studies Working Paper 19-18, 2019.
Choi, Joonkyu, Nathan Goldschlag, John Haltiwanger, and J. Daniel Kim, “Founding Teams and Startup Performance,” Center for Economic Studies Working Paper 19-32, 2019.
Foote, Andrew, Ashwin Machanavajjhala, and Kevin McKinney, “Releasing Earnings Distributions using Differential Privacy: Disclosure Avoidance System for Post Secondary Employment Outcomes (PSEO),” Center for Economic Studies Working Paper 19-13, 2019.
Handley, Kyle, Fariha Kamal, and Ryan Monarch, “Rising Import Tariffs, Falling Export Growth: When Modern Supply Chains Meet Old-Style Protectionism,” NBER Working Paper No. 26611, 2019.
Jones, Maggie R., and James P. Ziliak, “The Antipoverty Impact of the EITC: New Estimates from Survey and Administrative Tax Records,” Center for Economic Studies Working Paper 19-14, 2019.
Kamal, Fariha, and Asha Sundaram, “Do Institutions Determine Economic Geography? Evidence from the Concentration of Foreign Suppliers,” Center for Economic Studies Working Paper 19-05, 2019.
Krizan, C.J., “Statistics on the Small Business Administration’s Scale-Up America Program,” Center for Economic Studies Working Paper 19-11, 2019.
Kurmann, André, and Erika McEntarfer, “Downward Nominal Wage Rigidity in the United States: New Evidence from Worker-Firm Linked Data,” Center for Economic Studies Working Paper 19-07, 2019.
Luque, Adela, Renuka Bhaskar, James Noon, Kevin Rinz, and Victoria Udalova, “Nonemployer Statistics by Demographics (NES-D): Using Administrative and Census Records Data in Business Statistics,” Center for Economic Studies Working Paper 19-01, 2019.
Luque, Adela, Michaela Dillon, Julia Manzella, James Noon, Kevin Rinz, and Victoria Udalova, “Nonemployer Statistics by Demographics (NES-D): Exploring Longitudinal Consistency and Sub-national Estimates,” Center for Economic Studies Working Paper 19-34, 2019.
Luque, Adela, and Maggie R. Jones, “Gender Differences in Self-employment Duration: the Case of Opportunity and Necessity Entrepreneurs,” Center for Economic Studies Working Paper 19-24, 2019.
Manzella, Julia, Evan Totty, and Gary Benedetto, “A Task-based Approach to Constructing Occupational Categories with Implications for Empirical Research in Labor Economics,” Center for Economic Studies Working Paper 19-27, 2019.
Marinoni, Astrid, and John Voorheis, “Who Gains from Creative Destruction? Evidence from High-Quality Entrepreneurship in the United States,” Center for Economic Studies Working Paper 19-29, 2019.
Miller, Sarah, Sean Altekruse, Norman Johnson, and Laura R. Wherry, “Medicaid and Mortality: New Evidence from Linked Survey and Administrative Data,” NBER Working Paper No. 26081, 2019.
36 Center for Economic Studies Research Report: 2019 U.S. Census Bureau
Murray-Close, Marta, and Misty L. Heggeness, “Manning Up and Womaning Down: How Husbands and Wives Report Earnings When She Earns More,” Federal Reserve Bank of Minneapolis, Institute Working Paper 28, 2019.
Rinz, Kevin, “Did Timing Matter? Life Cycle Differences in Effects of Exposure to the Great Recession,” Center for Economic Studies Working Paper 19-25, 2019.
Sandler, Danielle, and Nichole Szembrot, “Maternal Labor Dynamics: Participation, Earnings, and Employer Changes,” Center for Economic Studies Working Paper 19-33, 2019.
Schuster, Steven Sprick, Matthew Jaremski, and Elisabeth Ruth Perlman, “An Empirical History of the United States Postal Savings System,” NBER Working Paper No. 25812, 2019.
Shattuck, Rachel, “High Labor Force Attachment, but Few Social Ties? Life-Course Predictors of Women’s Receipt of Childcare Subsidies,” Center for Economic Studies Working Paper 19-26, 2019.
Staudt, Joseph, Yifang Wei, Lisa Singh, Shawn Klimek, J. Bradford Jensen, and Andrew L. Baer, “Automating Response Evaluation for Franchising Questions on the 2017 Economic Census,” Center for Economic Studies Working Paper 19-20; NBER Working Paper No. 25818, 2019.
Zawacki, Alice M., Jessica P. Vistnes, and Thomas C. Buchmueller, “Why Are Employer-sponsored Health Insurance Premiums Higher in the Public Sector than in the Private Sector?” Center for Economic Studies Working Paper 19-03, 2019.
U.S. Census Bureau Center for Economic Studies Research Report: 2019 37
Appendix 3. ABSTRACTS OF CENTER FOR ECONOMIC STUDIES WORKING PAPERS BY CENSUS BUREAU STAFF: 2019
Center for Economic Studies Working Paper 19-01
NONEMPLOYER STATISTICS BY DEMOGRAPHICS (NES-D): USING ADMINISTRATIVE AND CENSUS RECORDS DATA IN BUSINESS STATISTICS
Adela Luque Renuka Bhaskar
James Noon Kevin Rinz
Victoria Udalova
January 2019
The quinquennial Survey of Business Owners, or SBO, provided the only comprehensive source of information in the United States on employer and nonemployer businesses by the sex, race, ethnic-ity, and veteran status of the business owners. The annual Nonemployer Statistics series (NES) pro-vides establishment counts and receipts for non-employers but contains no demographic informa-tion on the business owners. With the transition of the employer component of the SBO to the Annual Business Survey, the Nonemployer Statistics by Demographics series, or NES-D, represents the continuation of demographics estimates for non-employer businesses. NES-D will leverage exist-ing administrative and census records to assign demographic characteristics to the universe of approximately 24 million nonemployer businesses (as of 2015). Demographic characteristics include key demographics measured by the SBO (sex, race, Hispanic origin, and veteran status) as well as other demographics (age, place of birth, and citizenship status) collected but not imputed by the SBO if missing. A spectrum of administrative and census data sources will provide the nonem-ployer universe and demographics information. Specifically, the nonemployer universe originates in the Business Register; the Census Numident will provide sex, age, place of birth, and citizenship status; race and Hispanic origin information will be obtained from multiple years of the decennial cen-sus and the American Community Survey; and the
Department of Veteran Affairs will provide admin-istrative records data on veteran status.
The use of blended data in this manner will make possible the production of NES-D, an annual series that will become the only source of detailed and comprehensive statistics on the scope, nature, and activities of U.S. businesses with no paid employment by the demographic characteristics of the business owner. Using the 2015 vintage of nonemployers, initial results indicate that demo-graphic information is available for the overwhelm-ing majority of the universe of nonemployers. For instance, information on sex, age, place of birth, and citizenship status is available for over 95 percent of the 24 million nonemployers, while race and Hispanic origin are available for about 90 percent of them. These results exclude owners of C-corporations, which represent only 2 percent of nonemployer firms. Among other things, future work will entail imputation of missing demograph-ics information (including that of C-corporations), testing the longitudinal consistency of the esti-mates, and expanding the set of characteristics beyond the demographics mentioned above. Without added respondent burden and at lower imputation rates and costs, NES-D will meet the needs of stakeholders, as well as the economy as a whole, by providing reliable estimates at a higher frequency (annual vs. every 5 years) and with a more timely dissemination schedule than the SBO.
38 Center for Economic Studies Research Report: 2019 U.S. Census Bureau
Center for Economic Studies Working Paper 19-03
WHY ARE EMPLOYER-SPONSORED HEALTH INSURANCE PREMIUMS HIGHER IN THE PUBLIC SECTOR THAN IN THE PRIVATE SECTOR?
Alice M. Zawacki Jessica P. Vistnes
Thomas C. Buchmueller
February 2019
In this article, we examine the factors explaining differences in public and private sector health insurance premiums for enrollees with single coverage. We use data from the 2000 and 2014 Medical Expenditure Panel Survey-Insurance Component, along with decomposition methods, to explore the relative explanatory importance of plan features and benefit generosity, such as deductibles and other forms of cost sharing, basic employee characteristics (e.g., age, gender, and education), and unionization. While there was little
difference in public and private sector premiums in 2000, by 2014, public premiums had exceeded private premiums by 14 to 19 percent. We find that differences in plan characteristics played a substantial role in explaining premium differences in 2014, but they were not the only or even the most important factor. Differences in worker age, gender, marital status, and educational attainment were also important factors, as was workforce unionization.
Center for Economic Studies Working Paper 19-05
DO INSTITUTIONS DETERMINE ECONOMIC GEOGRAPHY? EVIDENCE FROM THE CONCENTRATION OF FOREIGN SUPPLIERS
Fariha Kamal Asha Sundaram
February 2019
Do institutions shape the geographic concentra-tion of industrial activity? We explore this ques-tion in an international trade setting by examining the relationship between country-level institutions and patterns of spatial concentration of global sourcing. A priori, weak institutions could be associated with either dispersed or concentrated sourcing. We exploit location and transaction data on imports by U.S. firms and adapt the Ellison and Glaeser (1997) index to construct a
product-country-specific measure of supplier concentration for U.S. importers. Results show that U.S. importers source in a more spatially concentrated manner from countries with weaker contract enforcement. We find support for the idea that, where formal contract enforcement is weak, local supplier networks compensate by sharing information to facilitate matching and transactions.
U.S. Census Bureau Center for Economic Studies Research Report: 2019 39
Center for Economic Studies Working Paper 19-06
IMMIGRANT ENTREPRENEURS AND INNOVATION IN THE U.S. HIGH-TECH SECTOR
J. David Brown John S. Earle
Mee Jung Kim Kyung Min Lee
February 2019
We estimate differences in innovation behavior between foreign- versus U.S.-born entrepreneurs in high-tech industries. Our data come from the Annual Survey of Entrepreneurs, a random sam-ple of firms with detailed information on owner characteristics and innovation activities. We find uniformly higher rates of innovation in immigrant-owned firms for 15 of 16 different innovation measures; the only exception is for copyright/trademark. The immigrant advantage holds for older firms as well as for recent start-ups and for
every level of the entrepreneur’s education. The size of the estimated immigrant-native differences in product and process innovation activities rises with detailed controls for demographic and human capital characteristics but falls for research, devel-opment, and patenting. Controlling for finance, motivations, and industry reduces all coefficients, but for most measures and specifications, immi-grants are estimated to have a sizable advantage in innovation.
Center for Economic Studies Working Paper 19-07
DOWNWARD NOMINAL WAGE RIGIDITY IN THE UNITED STATES: NEW EVIDENCE FROM WORKER-FIRM LINKED DATA
André Kurmann Erika McEntarfer
February 2019
This paper examines the extent and conse-quences of Downward Nominal Wage Rigidity (DNWR) using administrative worker-firm linked data from the Longitudinal Employer Household Dynamics (LEHD) program for a large representa-tive U.S. state. Prior to the Great Recession, only 7–8 percent of job stayers are paid the same nom-inal hourly wage rate as 1 year earlier—substan-tially less than previously found in survey-based data—and about 20 percent of job stayers experi-ence a wage cut. During the Great Recession, the incidence of wage cuts increases to 30 percent, followed by a large rise in the proportion of wage freezes to 16 percent as the economy recovers. Total earnings of job stayers exhibit even fewer zero changes and a larger incidence of reductions
than hourly wage rates due to systematic varia-tions in hours worked. The results are consistent with concurrent findings in the literature that reductions in base pay are exceedingly rare but that firms use different forms of nonbase pay and variations in hours worked to flexibilize labor cost. We then exploit the worker-firm link of the LEHD and find that during the Great Recession, firms with indicators of DNWR reduced employment by about 1.2 percent more per year. This negative effect is driven by significantly lower hiring rates and persists into the recovery. Our results suggest that despite the relatively large incidence of wage cuts in the aggregate, DNWR has sizable alloca-tive consequences.
40 Center for Economic Studies Research Report: 2019 U.S. Census Bureau
Center for Economic Studies Working Paper 19-08
OPTIMAL PROBABILISTIC RECORD LINKAGE: BEST PRACTICE FOR LINKING EMPLOYERS IN SURVEY AND ADMINISTRATIVE DATA
John M. Abowd Joelle Abramowitz
Margaret C. Levenstein Kristin McCue Dhiren Patki
Trivellore Raghunathan Ann M. Rodgers
Matthew D. Shapiro Nada Wasi
March 2019
This paper illustrates an application of record linkage between a household-level survey and an establishment-level frame in the absence of unique identifiers. Linkage between frames in this setting is challenging because the distribution of employ-ment across firms is highly asymmetric. To address these difficulties, this paper uses a supervised, machine-learning model to probabilistically link survey respondents in the Health and Retirement
Study (HRS) with employers and establishments in the Census Bureau’s Business Register to cre-ate a new data source, which we call the CenHRS. Multiple imputation is used to propagate uncer-tainty from the linkage step into subsequent analy-ses of the linked data. The linked data reveal new evidence that survey respondents’ misreporting and selective nonresponse about employer charac-teristics are systematically correlated with wages.
Center for Economic Studies Working Paper 19-09
WHY THE ECONOMICS PROFESSION MUST ACTIVELY PARTICIPATE IN THE PRIVACY PROTECTION DEBATE
John M. Abowd Ian M. Schmutte
William N. Sexton Lars Vilhuber
March 2019
When Google or the U.S. Census Bureau publish detailed statistics on browsing habits or neigh-borhood characteristics, some privacy is lost for everybody while supplying public information. To date, economists have not focused on the privacy loss inherent in data publication. In their stead, these issues have been advanced almost exclu-sively by computer scientists who are primarily
interested in technical problems associated with protecting privacy. Economists should join the discussion, first, to determine where to balance privacy protection against data quality; a social choice problem. Furthermore, economists must ensure new privacy models preserve the validity of public data for economic research.
U.S. Census Bureau Center for Economic Studies Research Report: 2019 41
Center for Economic Studies Working Paper 19-10
IMMIGRANTS’ EARNINGS GROWTH AND RETURN MIGRATION FROM THE UNITED STATES: EXAMINING THEIR DETERMINANTS USING LINKED SURVEY AND ADMINISTRATIVE DATA
Randall Akee Maggie R. Jones
March 2019
Using a novel panel data set of recent immi-grants to the United States (2005–2007) from individual-level linked U.S. Census Bureau survey data and Internal Revenue Service administrative records, we identify the determinants of return migration and earnings growth for this immigrant arrival cohort. We show that by 10 years after arrival, almost 40 percent have return migrated. Our analysis examines these flows by educa-tional attainment, country of birth, and English language ability separately for each gender. We show, for the first time, that return migrants experience downward earnings mobility over 2 to 3 years prior to their return migration. This find-ing suggests that economic shocks are closely
related to emigration decisions; time-variant unobserved characteristics may be more impor-tant in determining out- migration than previously known. We also show that wage assimilation with native-born populations occurs fairly quickly; after 10 years there is strong convergence in earnings by several characteristics. Finally, we confirm that the use of stock-based panel data lead to estimates of slower earnings growth than is found using repeated cross-section data. However, we also show, using selection-correc-tion methods in our panel data, that stock-based panel data may understate the rate of earnings growth for the initial immigrant arrival cohort when emigration is not accounted for.
Center for Economic Studies Working Paper 19-11
STATISTICS ON THE SMALL BUSINESS ADMINISTRATION’S SCALE-UP AMERICA PROGRAM
C.J. Krizan
April 2019
This paper attempts to quantify the difference in performance, of “treated” (program participant) and “nontreated” (nonparticipant) firms in the Small Business Administration’s (SBA) Scale-Up initiative. I combine data from the SBA with admin-istrative data housed at the U.S. Census Bureau using a combination of numeric and name and address matching techniques. My results show that after controlling for available observable char-acteristics, a positive correlation exists between participation in the Scale-Up initiative and firm
growth. However, publicly available survey results have shown that entrepreneurs have a variety of goals in-mind when they start their businesses. Two prominent, and potentially contradictory, ones are work-life balance and greater income. That means that not all firms may want to grow and I am unable to completely control for owner motiva-tions. Finally, I do not find a statistically significant relationship between participation in Scale-Up and firm survival once other business characteristics are accounted for.
42 Center for Economic Studies Research Report: 2019 U.S. Census Bureau
Center for Economic Studies Working Paper 19-13
RELEASING EARNINGS DISTRIBUTIONS USING DIFFERENTIAL PRIVACY: DISCLOSURE AVOIDANCE SYSTEM FOR POST-SECONDARY EMPLOYMENT OUTCOMES
(PSEO)
Andrew Foote Ashwin Machanavajjhala
Kevin McKinney
April 2019
The U.S. Census Bureau recently released data on earnings percentiles of graduates from post- secondary institutions. This paper describes and evaluates the disclosure avoidance system devel-oped for these statistics. We propose a differen-tially private algorithm for releasing these data based on standard differentially private building blocks, by constructing a histogram of earnings
and the application of the Laplace mechanism to recover a differentially private cumulative density function of earnings. We demonstrate that our algorithm can release earnings distributions with low error, and our algorithm out-performs prior work based on the concept of smooth sensitivity from Nissim, Raskhodnikova, and Smith (2007).
Center for Economic Studies Working Paper 19-14
THE ANTIPOVERTY IMPACT OF THE EITC: NEW ESTIMATES FROM SURVEY AND ADMINISTRATIVE TAX RECORDS
Maggie R. Jones James P. Ziliak
April 2019
Evaluations of the Earned Income Tax Credit (EITC), including its antipoverty effectiveness, are based on simulated EITC benefits using either the U.S. Census Bureau’s tax module or from exter-nal tax simulators such as the National Bureau of Economic Research’s TAXSIM or Jon Bakija’s model. Each simulator utilizes model-based assumptions on who is and who is not eligible for the EITC, and conditional on eligibility, assumes that participation is 100 percent. However, recent evidence suggests that take-up of the EITC is con-siderably less than 100 percent, and thus claims regarding the impact of the program on measures of poverty may be overstated. We use data from the Current Population Survey Annual Social and Economic Supplement (CPS ASEC) linked to Internal Revenue Service tax data on the EITC to compare the distribution of EITC benefits from three tax simulation modules to administrative
tax records. We find that significantly more actual EITC payments flow to childless tax units than pre-dicted by the tax simulators, and to those whose family income places them well above official pov-erty thresholds. However, actual EITC payments appear to be target efficient at the individual tax unit level, whether correctly paid or not. We then compare the antipoverty impact of the EITC across the survey and administrative tax measures of EITC benefits. We find that in the full CPS ASEC, the tax simulators overestimate the antipoverty effects of the EITC by about 1.8 million persons in a typical year. Restricting to a harmonized sample of filers, we find that the antipoverty estimates derived from the TAXSIM and Bakija models align more closely to actual EITC payments compared to the CPS, suggesting a discrepancy in assign-ment of tax filers between the tax simulators.
U.S. Census Bureau Center for Economic Studies Research Report: 2019 43
Center for Economic Studies Working Paper 19-17
FOREIGN VS. U.S. GRADUATE DEGREES: THE IMPACT ON EARNINGS ASSIMILATION AND RETURN MIGRATION FOR THE FOREIGN BORN
Randall Akee Maggie R. Jones
June 2019
Using a novel panel data set of recent immigrants to the United States, we identify return migration rates and earnings trajectories of two immigrant groups: those with foreign graduate degrees and those with a U.S. graduate degree. We focus on immigrants (of both genders) to the United States who arrive in the same entry cohort and from the
same country of birth over the period 2005–2015. In Census-Internal Revenue Service administrative data, we found that downward earnings trajecto-ries are predictive of return migration for immi-grants with degrees acquired abroad. Meanwhile, immigrants with U.S.-acquired graduate degrees experience mainly upward earnings mobility.
Center for Economic Studies Working Paper 19-18
PREDICTING THE EFFECT OF ADDING A CITIZENSHIP QUESTION TO THE 2020 CENSUS
J. David Brown Misty L. Heggeness Suzanne M. Dorinski
Lawrence Warren Moises Yi
June 2019
The addition of a citizenship question to the 2020 Census could affect the self-response rate, a key driver of the cost and quality of a census. We find that citizenship question response patterns in the American Community Survey (ACS) suggest that it is a sensitive question when asked about administra-tive record noncitizens but not when asked about administrative record citizens. ACS respondents who were administrative record noncitizens in 2017 frequently choose to skip the question or answer that the person is a citizen. We predict the effect on self-response to the entire survey by comparing mail response rates in the 2010 ACS, which included a citizenship question, with those of the 2010 Census, which did not have a citizenship question, among households in both surveys. We compare the actual
ACS-census difference in response rates for house-holds that may contain noncitizens (more sensitive to the question) with the difference for households containing only U.S. citizens. We estimate that the addition of a citizenship question will have an 8.0 percentage point larger effect on self-response rates in households that may have noncitizens relative to those with only U.S. citizens. Assuming that the citi-zenship question does not affect unit self-response in all- citizen households and applying the 8.0 percentage-point drop to the 28.1 percent of hous-ing units potentially having at least one noncitizen would predict an overall 2.2 percentage-point drop in self-response in the 2020 Census, increasing costs and reducing the quality of the population count.
44 Center for Economic Studies Research Report: 2019 U.S. Census Bureau
Center for Economic Studies Working Paper 19-20
AUTOMATING RESPONSE EVALUATION FOR FRANCHISING QUESTIONS ON THE 2017 ECONOMIC CENSUS
Joseph Staudt Yifang Wei Lisa Singh
Shawn Klimek J. Bradford Jensen
Andrew L. Baer
July 2019
Between the 2007 and 2012 Economic Censuses (EC), the count of franchise-affiliated establish-ments declined by 9.8 percent. One reason for this decline was a reduction in resources that the U.S. Census Bureau was able to dedicate to the manual evaluation of survey responses in the franchise section of the EC. Extensive manual evaluation in 2007 resulted in many establish-ments, whose survey forms indicated they were not franchise-affiliated, being recoded as franchise-affiliated. No such evaluation could be undertaken
in 2012. In this paper, we examine the potential of using external data harvested from the Web in combination with machine learning methods to automate the process of evaluating responses to the franchise section of the 2017 EC. Our method allows us to quickly and accurately identify and recode establishments have been mistakenly classi-fied as not being franchise-affiliated, increasing the unweighted number of franchise-affiliated estab-lishments in the 2017 EC by 22 percent–42 percent.
Center for Economic Studies Working Paper 19-22
REENGINEERING KEY NATIONAL ECONOMIC INDICATORS
Gabriel Ehrlich John Haltiwanger
Ron Jarmin David Johnson
Matthew D. Shapiro
July 2019
Traditional methods of collecting data from busi-nesses and households face increasing challenges. These include declining response rates to surveys, increasing costs to traditional modes of data col-lection, and the difficulty of keeping pace with rapid changes in the economy. The digitization of virtually all market transactions offers the potential for reengineering key national economic indica-tors. The challenge for the statistical system is how to operate in this data-rich environment. This paper focuses on the opportunities for collecting item-level data at the source and constructing key indicators using measurement methods consistent with such a data infrastructure. Ubiquitous digi-tization of transactions allows price and quantity
be collected or aggregated simultaneously at the source. This new architecture for economic sta-tistics creates challenges arising from the rapid change in items sold. The paper explores some recently proposed techniques for estimating price and quantity indices in large-scale, item-level data. Although those methods display tremendous promise, substantially more research is necessary before they will be ready to serve as the basis for the official economic statistics. Finally, the paper addresses implications for building national statis-tics from transactions for data collection and for the capabilities and organization of the statistical agencies in the twenty-first century.
U.S. Census Bureau Center for Economic Studies Research Report: 2019 45
Center for Economic Studies Working Paper 19-24
GENDER DIFFERENCES IN SELF-EMPLOYMENT DURATION: THE CASE OF OPPORTUNITY AND NECESSITY ENTREPRENEURS
Adela Luque Maggie R. Jones
September 2019
A strand of the self-employment literature sug-gests that those “pushed” into self-employment out of necessity may perform differently from those “pulled” into self-employment to pursue a business opportunity. While findings on self-employment outcomes by self-employed type are not unani-mous, there is mounting evidence that performance outcomes differ between these two self-employed types. Another strand of the literature has found important gender differences in self-employment entry rates, motivations for entry, and outcomes. Using a unique set of data that links the American Community Survey to administrative data from Form 1040 and W-2 records, we bring together these two strands of the literature. We explore whether there are gender differences in self-employ-ment duration of self-employed types. In particular, we examine the likelihood of self-employment exit towards unemployment versus
the wage sector for five consecutive entry cohorts, including two cohorts who entered self-employment during the Great Recession. Severely limited labor-market opportunities may have driven many in the recession cohorts to enter self-employment, while those entering self-employment during the boom may have been pursuing opportunities under favorable market conditions. To more explicitly test the concept of “necessity” versus “opportunity” self-employment, we also examine the wage labor attachment (or weeks worked in the wage sector) in the year prior to becoming self-employed. We find that, within the cohorts we examine, there are gen-der differences in the rate at which men and women depart self-employment for either wage work or nonparticipation, but that the patterns are depen-dent on pre-self-employment wage-sector attach-ment and cohort effects.
Center for Economic Studies Working Paper 19-25
DID TIMING MATTER? LIFE CYCLE DIFFERENCES IN EFFECTS OF EXPOSURE TO THE GREAT RECESSION
Kevin Rinz
September 2019
Exposure to a recession can have persistent, nega-tive consequences, but does the severity of those consequences depend on when in the life cycle a person is exposed? I estimate the effects of exposure to the Great Recession on employment and earnings outcomes for groups defined by year of birth over the 10 years following the beginning of the recession. With the exception of the oldest workers, all groups experience reductions in earn-ings and employment due to local unemployment rate shocks during the recession. Younger workers
experience the largest earnings losses in percent terms (up to 13 percent), in part because recession exposure makes them persistently less likely to work for high-paying employers even as their over-all employment recovers more quickly than older workers’. Younger workers also experience reduc-tions in earnings and employment due to changes in local labor market structure associated with the recession. These effects are substantially smaller in magnitude but more persistent than the effects of unemployment rate increases.
46 Center for Economic Studies Research Report: 2019 U.S. Census Bureau
Center for Economic Studies Working Paper 19-26
HIGH LABOR FORCE ATTACHMENT, BUT FEW SOCIAL TIES? LIFE-COURSE PREDICTORS OF WOMEN’S RECEIPT OF CHILDCARE SUBSIDIES
Rachel Shattuck
September 2019
The U.S. federal Child Care and Development Fund (CCDF) childcare subsidy represents the largest source of means-tested assistance for U.S. families with low incomes. The CCDF subsidy aims to help mothers with low incomes gain employment and education, with implications for women’s labor force participation, and the well-being of their children. Because recipients of the CCDF subsidy are either already employed, or seek the subsidy with the goal of gaining employment or school-ing, this group may represent the public assistance recipients who are best able to succeed in the low-wage labor market. However, existing research on the CCDF observes recipients only after they begin receiving the subsidy, thus giving an incom-plete picture of whether recipients may select
into subsidy receipt, and how subsidy recipiency is situated in women’s broader work and family trajectories. My study links administrative records from the CCDF to the American Community Survey (ACS) to construct a longitudinal data set from 38 states that observes CCDF recipients in the 1–2 years before they first received the subsidy. I compare women who subsequently received the CCDF subsidy to other women with low incomes in the ACS who did not go on to receive the sub-sidy, with a total of roughly 641,000 individuals. I find that CCDF recipients are generally positively selected on employment history and educational attainment, but appear to have lower levels of social support than nonrecipients.
Center for Economic Studies Working Paper 19-27
A TASK-BASED APPROACH TO CONSTRUCTING OCCUPATIONAL CATEGORIES WITH IMPLICATIONS FOR EMPIRICAL RESEARCH IN LABOR ECONOMICS
Julia Manzella Evan Totty
Gary Benedetto
September 2019
Most applied research in labor economics that examines returns to worker skills or differences in earnings across subgroups of workers typically accounts for the role of occupations by control-ling for occupational categories. Researchers often aggregate detailed occupations into categories based on the Standard Occupation Classification (SOC) coding scheme, which is based largely on narratives or qualitative measures of workers’ tasks. Alternatively, we propose two quantitative task-based approaches to constructing occupa-tional categories by using factor analysis with O*NET job descriptors that provide a rich set of continuous measures of job tasks across all occu-pations. We find that our task-based approach outperforms the SOC-based approach in terms of lower occupation distance measures. We show that our task-based approach provides an intuitive,
nuanced interpretation for grouping occupations and permits quantitative assessments of similari-ties in task compositions across occupations. We also replicate a recent analysis and find that our task-based occupational categories explain more of the gender wage gap than the SOC-based approaches explain. Our study enhances the Federal Statistical System’s understanding of the SOC codes, investigates ways to use third-party data to construct useful research variables that can potentially be added to U.S. Census Bureau data products to improve their quality and versatil-ity, and sheds light on how the use of alternative occupational categories in economics research may lead to different empirical results and deeper understanding in the analysis of labor market outcomes.
U.S. Census Bureau Center for Economic Studies Research Report: 2019 47
Center for Economic Studies Working Paper 19-28
ADDRESSING DATA GAPS: FOUR NEW LINES OF INQUIRY IN THE 2017 ECONOMIC CENSUS
Emek Basker Randy A. Becker
Lucia Foster T. Kirk White Alice Zawacki
September 2019
We describe four new lines of inquiry added to the 2017 Economic Census regarding (1) retail health clinics, (2) management practices in health care services, (3) self-service in retail and service industries, and (4) water use in manufacturing and mining industries. These were proposed by econo-mists from the U.S. Census Bureau’s Center for Economic Studies in order to fill data gaps in
current Census Bureau products concerning the U.S. economy. The new content addresses, such issues as the rise in importance of health care and its complexity, the adoption of automation tech-nologies, and the importance of measuring water, a critical input to many manufacturing and mining industries.
Center for Economic Studies Working Paper 19-29
WHO GAINS FROM CREATIVE DESTRUCTION? EVIDENCE FROM HIGH-QUALITY ENTREPRENEURSHIP IN THE UNITED STATES
Astrid Marinoni John Voorheis
October 2019
The question of who gains from high-quality entrepreneurship is crucial to understanding whether investments in incubating potentially innovative start-up firms will produce socially beneficial outcomes. We attempt to bring new evidence to this question by combining new aggregate measures of local area income inequal-ity and income mobility with measures of entre-preneurship from Guzman and Stern (2017). Our new aggregate measures are generated by link-ing American Community Survey data with the universe of Internal Revenue Service 1040 tax
returns. In both fixed effects and IV models using a Bartik-style instrument, we find that entrepreneur-ship increases income inequality. Further, we find that this increase in income inequality arises due to the fact that almost all of the individual gains associated with increased entrepreneurship accrue to the top 10 percent of the income distribution. While we find mixed evidence for small positive effects of entrepreneurship lower on the income distribution, we find little, if any, evidence that entrepreneurship increases income mobility.
48 Center for Economic Studies Research Report: 2019 U.S. Census Bureau
Center for Economic Studies Working Paper 19-32
FOUNDING TEAMS AND STARTUP PERFORMANCE
Joonkyu Choi Nathan Goldschlag John Haltiwanger
J. Daniel Kim
November 2019
We explore the role of founding teams in account-ing for the postentry dynamics of startups. While the entrepreneurship literature has largely focused on business founders, we broaden this view by considering founding teams, which include both the founders and the initial employees in the first year of operations. We investigate the idea that the success of a startup may derive from the orga-nizational capital that is created at firm formation and is inalienable from the founding team itself. To test this hypothesis, we exploit premature deaths to identify the causal impact of losing a founding team member on startup performance. We find
that the exogenous separation of a founding team member due to premature death has a persis-tently large, negative, and statistically significant impact on postentry size, survival, and productiv-ity of startups. While we find that the loss of a key founding team member (e.g. founders) has an especially large adverse effect, the loss of a non-key founding team member still has a significant adverse effect, lending support to our inclusive definition of founding teams. Furthermore, we find that the effects are particularly strong for small founding teams but are not driven by activity in small business-intensive or high-tech industries.
Center for Economic Studies Working Paper 19-33
MATERNAL LABOR DYNAMICS: PARTICIPATION, EARNINGS, AND EMPLOYER CHANGES
Danielle Sandler Nichole Szembrot
December 2019
This paper describes the labor dynamics of U.S. women after they have had their first and subsequent children. We build on the child pen-alty literature by showing the heterogeneity of the size and pattern of labor force participation and earnings losses by demographic characteristics of mothers and the characteristics of their employ-ers. The analysis uses longitudinal administrative earnings data from the Longitudinal Employer-Household Dynamics database combined with the Survey of Income and Program Participation survey data to identify women, their fertility tim-ing, and employment. We find that women experi-ence a large and persistent decrease in earnings
and labor force participation after having their first child. The penalty grows over time, driven by the birth of subsequent children. Non-White mothers, unmarried mothers, and mothers with more educa-tion are more likely to return to work following the birth of their first child. Conditional on returning to the labor force, women who change employ-ers earn more after the birth of their first child than women who return to their prebirth employ-ers. The probability of returning to the prebirth employer and industry is heterogeneous over both the demographics of mothers and the characteris-tics of their employers.
U.S. Census Bureau Center for Economic Studies Research Report: 2019 49
Center for Economic Studies Working Paper 19-34
NONEMPLOYER STATISTICS BY DEMOGRAPHICS (NES-D): EXPLORING LONGITUDINAL CONSISTENCY AND SUBNATIONAL ESTIMATES
Adela Luque Michaela Dillon Julia Manzella James Noon Kevin Rinz
Victoria Udalova
December 2019
Until recently, the quinquennial Survey of Business Owners (SBO) was the only source of information for U.S. employer and nonemployer businesses by owner demographic characteristics such as race, ethnicity, sex, and veteran status. Now, however, the Nonemployer Statistics by Demographics series (NES-D) will replace the SBO’s nonem-ployer component with reliable and more frequent (annual) business demographic estimates with no additional respondent burden, and at lower imputation rates and costs. NES-D is not a survey; rather, it exploits existing administrative and cen-sus records to assign demographic characteristics to the universe of approximately 25 million (as of 2016) nonemployer businesses.
Although only in the second year of its research phase, NES-D is rapidly moving towards produc-tion, with a planned prototype or experimental version release of 2017 nonemployer data in 2020, followed by annual releases of the series. After the first year of research, we released a working paper (Luque et al., 2019) that assessed the viability of estimating nonemployer demographics exclusively with administrative records (AR) and census data. That paper used 1 year of data (2015) to produce preliminary tabulations of business counts at the national level. This year we expand that research in multiple ways by: (1) examining the longitudinal consistency of administrative and census records coverage, and of our AR-based demographics estimates, (2) evaluating further coverage from additional data sources, (3) exploring estimates
at the subnational level, (4) exploring estimates by industrial sector, (5) examining demographics estimates of business receipts as well as of counts, and (6) implementing imputation of missing demographic values.
Our current results are consistent with the main findings in Luque et al. (2019), and show that high coverage and demographic assignment rates are not the exception, but the norm. Specifically, we find that AR coverage rates are high and stable over time for each of the 3 years we examine, 2014–2016. We are able to identify owners for approximately 99 percent of nonemployer busi-nesses (excluding C-corporations), 92 to 93 percent of identified nonemployer owners have no missing demographics, and only about 1 percent are missing three or more demographic character-istics in each of the 3 years. We also find that our demographics estimates are stable over time, with expected small annual changes that are consistent with underlying population trends in the United States. Due to data limitations, these results do not include C-corporations, which represent only 2 percent of nonemployer businesses and 4 percent of receipts.
Without added respondent burden and at lower imputation rates and costs, NES-D will provide high-quality business demographics estimates at a higher frequency (annual vs. every 5 years) than the SBO.

This page is intentionally blank.
U.S. Census Bureau Center for Economic Studies Research Report: 2019 51
Appendix 4. CENTER FOR ECONOMIC STUDIES WORKING PAPERS: 2019CES Working Papers are available at <www.census.gov/programs-surveys/ces/research /ces-discussion-paper-series.html>.
19-01 “Nonemployer Statistics by Demographics (NES-D): Using Administrative and Census Records Data in Business Statistics,” by Adela Luque, Renuka Bhaskar, James Noon, Kevin Rinz, and Victoria Udalova, January 2019.
19-02 “Predictive Analytics and Organizational Architecture: Plant-Level Evidence from Census Data,” by Eva Labro, Mark Lang, and Jim Omartian, January 2019.
19-03 “Why Are Employer-Sponsored Health Insurance Premiums Higher in the Public Sector than in the Private Sector?” by Alice M. Zawacki, Jessica P. Vistnes, and Thomas C. Buchmueller, February 2019.
19-04 “The Effect of Child Support on Selection into Marriage and Fertility,” by Daniel I. Tannenbaum, February 2019.
19-05 “Do Institutions Determine Economic Geography? Evidence from the Concentration of Foreign Suppliers,” by Fariha Kamal and Asha Sundaram, February 2019.
19-06 “Immigrant Entrepreneurs and Innovation in the U.S. High-Tech Sector,” by J. David Brown, John S. Earle, Mee Jung Kim, and Kyung Min Lee, February 2019.
19-07 “Downward Nominal Wage Rigidity in the United States: New Evidence from Worker-Firm Linked Data,” by André Kurmann and Erika McEntarfer, February 2019.
19-08 “Optimal Probabilistic Record Linkage: Best Practice for Linking Employers in Survey and Administrative Data,” by John M. Abowd, Joelle Abramowitz, Margaret C. Levenstein, Kristin McCue, Dhiren Patki, Trivellore Raghunathan, Ann M. Rodgers, Matthew D. Shapiro, and Nada Wasi, March 2019.
19-09 “Why the Economics Profession Must Actively Participate in the Privacy Protection Debate,” by John M. Abowd, Ian M. Schmutte, William N. Sexton, and Lars Vilhuber, March 2019.
19-10 “Immigrants’ Earnings Growth and Return Migration from the US: Examining their Determinants using Linked Survey and Administrative Data,” by Randall Akee and Maggie R. Jones, March 2019.
19-11 “Statistics on the Small Business Administration’s Scale-Up America Program,” by C.J. Krizan, March 2019.
19-12 “Fraudulent Financial Reporting and the Consequences for Employees,” by Jung Ho Choi and Brandon Gipper, March 2019.
19-13 “Releasing Earnings Distributions using Differential Privacy: Disclosure Avoidance System for Post Secondary Employment Outcomes (PSEO),” by Andrew Foote, Ashwin Machanavajjhala, and Kevin McKinney, April 2019.
19-14 “The Antipoverty Impact of the EITC: New Estimates from Survey and Administrative Tax Records,” by Maggie R. Jones and James P. Ziliak, April 2019.
52 Center for Economic Studies Research Report: 2019 U.S. Census Bureau
19-15 “Managing Trade: Evidence From China and the U.S.,” by Nicholas Bloom, Kalina Manova, John Van Reenen, Stephen Teng Sun, and Zhihong Yu, May 2019.
19-16 “Property Rights, Place-Based Policies, and Economic Development,” by Laurel Wheeler, June 2019.
19-17 “Foreign vs. U.S. Graduate Degrees: The Impact on Earnings Assimilation and Return Migration for the Foreign Born,” by Randall Akee and Maggie R. Jones, June 2019.
19-18 “Predicting the Effect of Adding a Citizenship Question to the 2020 Census,” by J. David Brown, Misty L. Heggeness, Suzanne M. Dorinski, Lawrence Warren, and Moises Yi, June 2019.
19-19 “The Two-Income Trap: Are Two-Earner Households More Financially Vulnerable?” by Jonathan Fisher and Nathaniel Johnson, June 2019.
19-20 “Automating Response Evaluation for Franchising Questions on the 2017 Economic Census,” by Joseph Staudt, Yifang Wei, Lisa Singh, Shawn Klimek, J. Bradford Jensen, and Andrew L. Baer, July 2019.
19-21 “Demographic Origins of the Startup Deficit,” by Fatih Karahan, Benjamin Pugsley, and Aysegül Sahin, July 2019.
19-22 “Re-engineering Key National Economic Indicators,” by Gabriel Ehrlich, John Haltiwanger, Ron Jarmin, David Johnson, and Matthew D. Shapiro, July 2019.
19-23 “Pay, Employment, and Dynamics of Young Firms,” by Tania Babina, Wenting Ma, Christian Moser, Paige Ouimet, and Rebecca Zarutskie, July 2019.
19-24 “Gender Differences in Self-employment Duration: the Case of Opportunity and Necessity Entrepreneurs,” by Adela Luque and Maggie R. Jones, September 2019.
19-25 “Did Timing Matter? Life Cycle Differences in Effects of Exposure to the Great Recession,” by Kevin Rinz, September 2019.
19-26 “High Labor Force Attachment, but Few Social Ties? Life-Course Predictors of Women’s Receipt of Childcare Subsidies,” by Rachel Shattuck, September 2019.
19-27 “A Task-based Approach to Constructing Occupational Categories with Implications for Empirical Research in Labor Economics,” by Julia Manzella, Evan Totty, and Gary Benedetto, September 2019.
19-28 “Addressing Data Gaps: Four New Lines of Inquiry in the 2017 Economic Census,” by Emek Basker, Randy A. Becker, Lucia Foster, T. Kirk White, and Alice Zawacki, September 2019.
19-29 “Who Gains from Creative Destruction? Evidence from High-Quality Entrepreneurship in the United States,” by Astrid Marinoni and John Voorheis, October 2019.
19-30 “Human Capital, Parent Size and the Destination Industry of Spinouts,” by Mariko Sakakibara and Natarajan Balasubramanian, September 2019.
19-31 “What Do Establishments Do When Wages Increase? Evidence from Minimum Wages in the United States,” by Yuci Chen, November 2019.
U.S. Census Bureau Center for Economic Studies Research Report: 2019 53
19-32 “Founding Teams and Startup Performance,” by Joonkyu Choi, Nathan Goldschlag, John Haltiwanger, and J. Daniel Kim, November 2019.
19-33 “Maternal Labor Dynamics: Participation, Earnings, and Employer Changes,” by Danielle Sandler and Nichole Szembrot, December 2019.
19-34 “Nonemployer Statistics by Demographics (NES-D): Exploring Longitudinal Consistency and Sub-national Estimates,” by Adela Luque, Michaela Dillon, Julia Manzella, James Noon, Kevin Rinz, and Victoria Udalova, December 2019.

This page is intentionally blank.
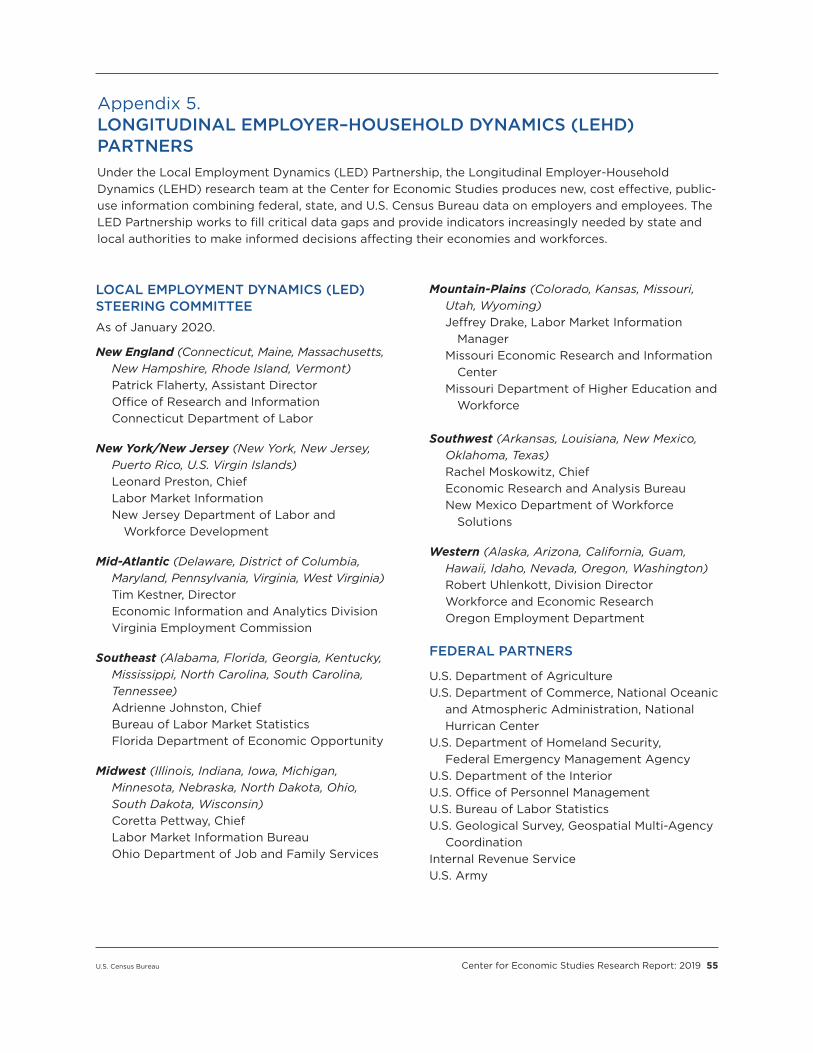
U.S. Census Bureau Center for Economic Studies Research Report: 2019 55
Appendix 5. LONGITUDINAL EMPLOYER–HOUSEHOLD DYNAMICS (LEHD) PARTNERSUnder the Local Employment Dynamics (LED) Partnership, the Longitudinal Employer-Household Dynamics (LEHD) research team at the Center for Economic Studies produces new, cost effective, public-use information combining federal, state, and U.S. Census Bureau data on employers and employees. The LED Partnership works to fill critical data gaps and provide indicators increasingly needed by state and local authorities to make informed decisions affecting their economies and workforces.
LOCAL EMPLOYMENT DYNAMICS (LED)STEERING COMMITTEEAs of January 2020.
New England (Connecticut, Maine, Massachusetts, New Hampshire, Rhode Island, Vermont) Patrick Flaherty, Assistant Director Office of Research and Information Connecticut Department of Labor
New York/New Jersey (New York, New Jersey, Puerto Rico, U.S. Virgin Islands) Leonard Preston, Chief Labor Market Information New Jersey Department of Labor and Workforce Development
Mid-Atlantic (Delaware, District of Columbia, Maryland, Pennsylvania, Virginia, West Virginia) Tim Kestner, Director Economic Information and Analytics Division Virginia Employment Commission
Southeast (Alabama, Florida, Georgia, Kentucky, Mississippi, North Carolina, South Carolina, Tennessee) Adrienne Johnston, Chief
Bureau of Labor Market Statistics Florida Department of Economic Opportunity
Midwest (Illinois, Indiana, Iowa, Michigan, Minnesota, Nebraska, North Dakota, Ohio, South Dakota, Wisconsin) Coretta Pettway, Chief
Labor Market Information Bureau Ohio Department of Job and Family Services
Mountain-Plains (Colorado, Kansas, Missouri, Utah, Wyoming) Jeffrey Drake, Labor Market Information Manager
Missouri Economic Research and Information Center
Missouri Department of Higher Education and Workforce
Southwest (Arkansas, Louisiana, New Mexico, Oklahoma, Texas) Rachel Moskowitz, Chief Economic Research and Analysis Bureau New Mexico Department of Workforce Solutions
Western (Alaska, Arizona, California, Guam, Hawaii, Idaho, Nevada, Oregon, Washington) Robert Uhlenkott, Division Director Workforce and Economic Research Oregon Employment Department
FEDERAL PARTNERS
U.S. Department of AgricultureU.S. Department of Commerce, National Oceanic
and Atmospheric Administration, National Hurrican Center
U.S. Department of Homeland Security, Federal Emergency Management Agency
U.S. Department of the InteriorU.S. Office of Personnel ManagementU.S. Bureau of Labor StatisticsU.S. Geological Survey, Geospatial Multi-Agency
CoordinationInternal Revenue Service U.S. Army

56 Center for Economic Studies Research Report: 2019 U.S. Census Bureau
STATE EDUCATION PARTNERS
University of Texas SystemColorado Department of Higher EducationInstitute for Research on Innovation and Science,
in partnership with: University of Michigan University of Wisconsin—Madison
STATE PARTNERS
As of January 2020.
Alabama Jim Henry, Director Labor Market Information Division Alabama Department of Labor
Alaska Dan Robinson, Director Research and Analysis Section Alaska Department of Labor and Workforce Development
Arizona Doug Walls, Labor Market Information Director Arizona Office of Economic Opportunity
Arkansas Robert S. Marek, Chief Labor Market Information Division Arkansas Department of Workforce Services
California Amy Faulkner, Chief Labor Market Information Division California Employment Development Department
Colorado Michelle Morelli, Director Office of Labor Market Information Colorado Department of Labor and Employment
Connecticut Andrew Condon, Director Office of Research Connecticut Department of Labor
Delaware Thomas Dougherty,Acting Chief Office of Occupational and Labor Market Information Delaware Department of Labor
District of Columbia Saikou Diallo, Chief Economist Office of Labor Market Policy and Information District of Columbia Department of Employment Services
Florida Adrienne Johnston, Chief Bureau of Workforce Statistics and Economic Research Florida Department of Economic Opportunity
Georgia Mark Watson, Director Workforce Statistics and Economic Research Georgia Department of Labor
Guam Gary Hiles, Chief Economist Government of Guam Department of Labor
Hawaii Phyllis Dayao, Chief Research and Statistics Office Hawaii Department of Labor and Industrial Relations
Idaho Salvador Vazquez, Labor Market Information Director Research and Analysis Bureau Idaho Department of Labor
Illinois George Putnam, Labor Market Information Manager Economic Information and Analysis Division Illinois Department of Employment Security
Indiana Charlie Baer, Acting Director Research and Analysis Indiana Department of Workforce Development
Iowa Jeremy Hamp, Director Labor Market Information Division Iowa Department of Workforce Development
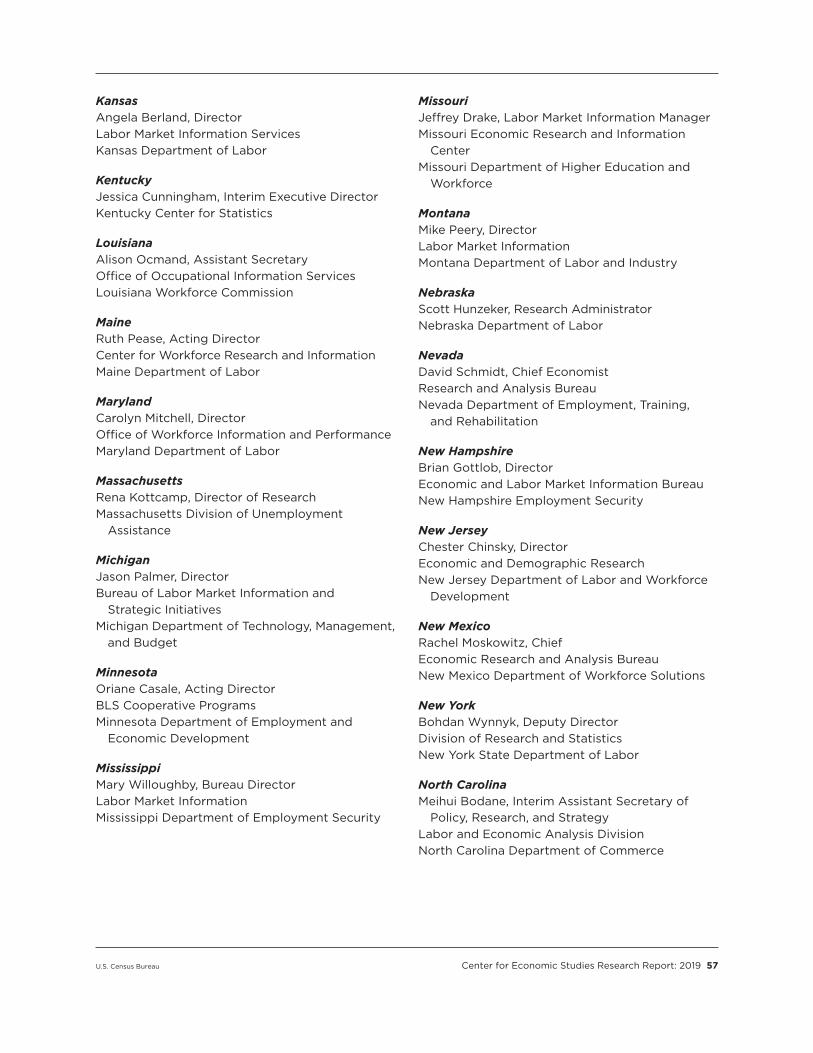
U.S. Census Bureau Center for Economic Studies Research Report: 2019 57
Kansas Angela Berland, Director Labor Market Information Services Kansas Department of Labor
Kentucky Jessica Cunningham, Interim Executive Director Kentucky Center for Statistics
Louisiana Alison Ocmand, Assistant Secretary Office of Occupational Information Services Louisiana Workforce Commission
Maine Ruth Pease, Acting Director Center for Workforce Research and Information Maine Department of Labor
Maryland Carolyn Mitchell, Director Office of Workforce Information and Performance Maryland Department of Labor
Massachusetts Rena Kottcamp, Director of Research Massachusetts Division of Unemployment Assistance
Michigan Jason Palmer, Director Bureau of Labor Market Information and Strategic Initiatives Michigan Department of Technology, Management, and Budget
Minnesota Oriane Casale, Acting Director BLS Cooperative Programs Minnesota Department of Employment and Economic Development
Mississippi Mary Willoughby, Bureau Director Labor Market Information Mississippi Department of Employment Security
Missouri Jeffrey Drake, Labor Market Information Manager Missouri Economic Research and Information Center Missouri Department of Higher Education and Workforce
Montana Mike Peery, Director Labor Market Information Montana Department of Labor and Industry
Nebraska Scott Hunzeker, Research Administrator Nebraska Department of Labor
Nevada David Schmidt, Chief Economist Research and Analysis Bureau Nevada Department of Employment, Training, and Rehabilitation
New Hampshire Brian Gottlob, Director Economic and Labor Market Information Bureau New Hampshire Employment Security
New Jersey Chester Chinsky, Director Economic and Demographic Research New Jersey Department of Labor and Workforce Development
New Mexico Rachel Moskowitz, Chief Economic Research and Analysis Bureau New Mexico Department of Workforce Solutions
New York Bohdan Wynnyk, Deputy Director Division of Research and Statistics New York State Department of Labor
North Carolina Meihui Bodane, Interim Assistant Secretary of Policy, Research, and Strategy Labor and Economic Analysis Division North Carolina Department of Commerce

58 Center for Economic Studies Research Report: 2019 U.S. Census Bureau
North Dakota Marcia Havens, Manager Labor Market Information Center Job Service North Dakota
Ohio Coretta Pettway, Chief Labor Market Information Bureau Ohio Department of Job and Family Services
Oklahoma Lynn Gray, Director Economic Research and Analysis Oklahoma Employment Security Commission
Oregon Robert Uhlenkott, Division Director Workforce and Economic Research Oregon Employment Department
Pennsylvania Ed Legge, Director Center for Workforce Information and Analysis Pennsylvania Department of Labor and Industry
Puerto Rico Elda Pares, Director Bureau of Labor Statistics Department of Labor
Rhode Island Donna Murray, Assistant Director Labor Market Information Rhode Island Department of Labor and Training
South Carolina Brian Nottingham, Director Business Intelligence Department South Carolina Department of Employment and Workforce
South Dakota Melodee Lane, Administrator Labor Market Information Center South Dakota Department of Labor and Regulation
Tennessee Lisa Howard, Assistant Commissioner Workforce Insights and Reporting Engine Division Tennessee Department of Labor and Workforce Development
Texas Mariana Vega, Director Labor Market Information Texas Workforce Commission
Utah Collin Petersen, Director Research and Analysis Utah Department of Workforce Services
Vermont Mathew Barewicz, Director Economic and Labor Market Information Section Vermont Department of Labor
Virgin Islands Gary Halyard, Director Bureau of Labor Statistics U.S. Virgin Islands Department of Labor
Virginia Tim Kestner, Director Economic Information and Analytics Division Virginia Employment Commission
Washington Steven Ross, Director Labor Market and Economic Analysis Washington Employment Security Department
West Virginia Joseph Jarvis, Director Research, Information and Analysis Division Workforce West Virginia
Wisconsin Dennis Winters, Director Bureau of Workforce Information and Technical Support Wisconsin Department of Workforce Development
Wyoming Tony Glover, Manager Research and Planning Wyoming Department of Workforce Services
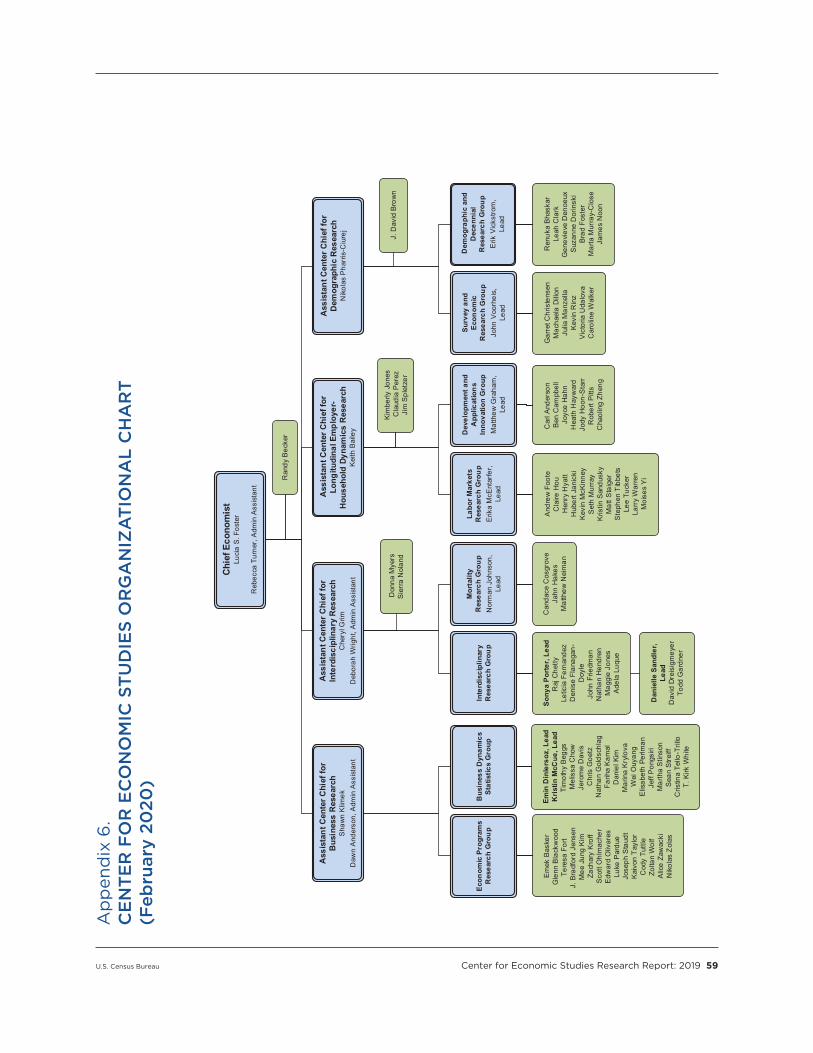
U.S. Census Bureau Center for Economic Studies Research Report: 2019 59
Ap
pen
dix
6.
CE
NT
ER
FO
R E
CO
NO
MIC
ST
UD
IES
OR
GA
NIZ
AT
ION
AL
CH
AR
T
(Feb
ruar
y 20
20)
Chie
f Eco
nom
ist
Luci
a S.
Fos
ter
Reb
ecca
Tur
ner,
Adm
in A
ssis
tant
Ass
ista
nt C
ente
r Chi
ef fo
r B
usin
ess
Res
earc
hS
haw
n K
limek
Daw
n A
nder
son,
Adm
in A
ssis
tant
Ass
ista
nt C
ente
r Chi
ef fo
r In
terd
isci
plin
ary
Res
earc
hC
hery
l Grim
Deb
orah
Wrig
ht, A
dmin
Ass
ista
nt
Labo
r Mar
kets
R
esea
rch
Gro
upE
rika
McE
ntar
fer,
Lead
Ec
onom
ic P
rogr
ams
Res
earc
h G
roup
And
rew
Foo
teC
laire
Hou
Hen
ry H
yatt
Hub
ert J
anic
kiK
evin
McK
inne
yS
eth
Mur
ray
Kris
tin S
andu
sky
Mat
t Sta
iger
Ste
phen
Tib
bets
Lee
Tuck
erLa
rry
War
ren
Moi
ses
Yi
Ass
ista
nt C
ente
r Chi
ef fo
rLo
ngitu
dina
l Em
ploy
er-
Hou
seho
ld D
ynam
ics
Res
earc
hK
eith
Bai
ley Dev
elop
men
t and
A
pplic
atio
ns
Inno
vatio
n G
roup
Mat
thew
Gra
ham
, Le
ad
Car
l And
erso
n B
en C
ampb
ell
Joyc
e H
ahn
Hea
th H
ayw
ard
Jody
Hoo
n-S
tarr
Rob
ert P
itts
Cha
olin
g Zh
eng
Kim
berly
Jon
es C
laud
ia P
erez
Jim
Spl
etze
r
Em
ek B
aske
r G
lenn
Bla
ckw
ood
Tere
sa F
ort
J. B
radf
ord
Jens
enM
ee J
ung
Kim
Zach
ary
Kro
ffS
cott
Ohl
mac
her
Edw
ard
Oliv
ares
Luke
Par
due
Jose
ph S
taud
tK
aivo
n T
aylo
rC
ody
Tuttl
eZo
ltan
Wol
fA
lice
Zaw
acki
N
ikol
as Z
olas
Ass
ista
nt C
ente
r Chi
ef fo
r D
emog
raph
ic R
esea
rch
Nik
olas
Pha
rris
-Ciu
rej
Surv
ey a
nd
Econ
omic
R
esea
rch
Gro
upJo
hn V
oorh
eis,
Lead
Dem
ogra
phic
and
D
ecen
nial
R
esea
rch
Gro
upE
rik V
icks
trom
,Le
ad
B
usin
ess
Dyn
amic
s St
atis
tics
Gro
up
In
terd
isci
plin
ary
Res
earc
h G
roup
Don
na M
yers
Sie
rra
Nol
and
M
orta
lity
Res
earc
h G
roup
Nor
man
Joh
nson
, Le
ad
R
andy
Bec
ker
Emin
Din
lers
oz, L
ead
Kris
tin M
cCue
, Lea
dTi
mot
hy B
eggs
Mel
issa
Cho
wJe
rom
e D
avis
Chr
is G
oetz
Nat
han
Gol
dsch
lag
Farih
a K
amal
Dan
iel K
imM
arin
a K
rylo
vaW
ei O
uyan
gE
lisab
eth
Perlm
anJe
ff P
ongs
iriM
arth
a S
tinso
nS
ean
Stre
iffC
ristin
a Te
llo-T
rillo
T. K
irk W
hite
Gar
ret C
hris
tens
enM
acha
ela
Dill
onJu
lia M
anze
llaK
evin
Rin
zV
icto
ria U
dalo
vaC
arol
ine
Wal
ker
Ren
uka
Bha
skar
Leah
Cla
rkG
enev
ieve
Den
oeux
Suz
anne
Dor
insk
iB
rad
Fost
erM
arta
Mur
ray-
Clo
seJa
mes
Noo
n
Sony
a Po
rter,
Lead
Raj
Che
ttyLe
ticia
Fer
nand
ezD
enis
e Fl
anag
an-
Doy
leJo
hn F
riedm
anN
atha
n H
endr
enM
aggi
e Jo
nes
Ade
la L
uque
Can
dace
Cos
grov
eJa
hn H
akes
Mat
thew
Nei
man
Dan
ielle
San
dler
, Le
adD
avid
Dre
isig
mey
erTo
dd G
ardn
er
J.
Dav
id B
row
n