Embed Size (px)
Citation preview
Center for Congressional and Center for Congressional and Presidential Studies Presidential Studies
www.american.edu/ccpswww.american.edu/ccps
From Campaigning to Governing: Political Power
and the 2012 Campaign
James A. ThurberJames A. ThurberDirector and Professor Director and Professor
Center for Congressional Center for Congressional and Presidential Studiesand Presidential Studies
American UniversityAmerican University
[email protected]@american.edu
202-885-6247202-885-6247
www.american.edu/spa/ccpswww.american.edu/spa/ccps
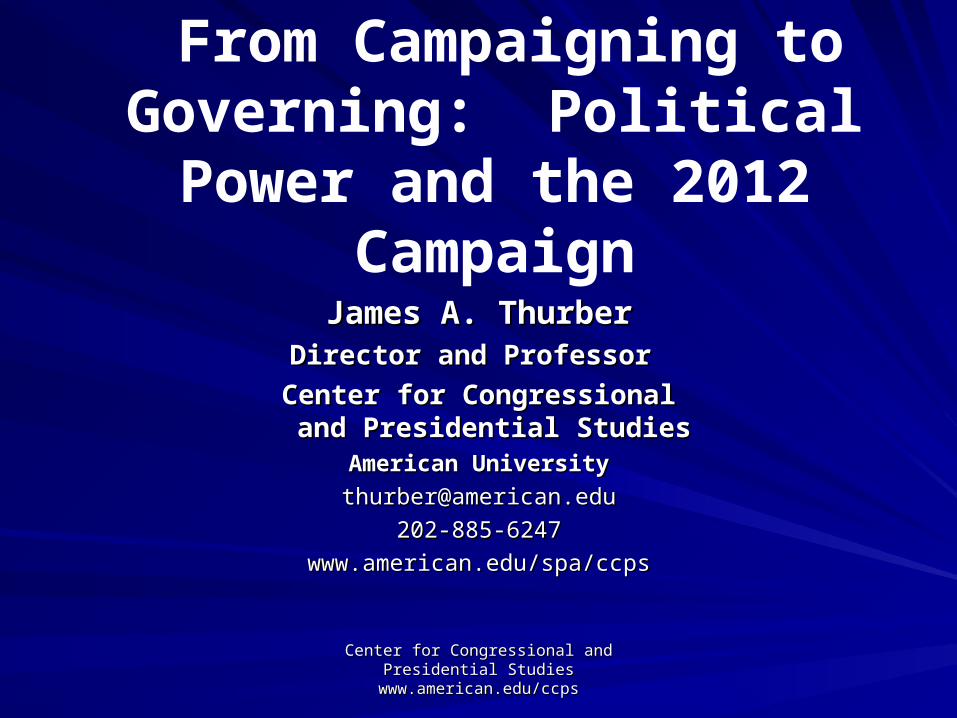
From Promises to From Promises to PerformancePerformance
Center for Congressional and Center for Congressional and Presidential Studies Presidential Studies
www.american.edu/ccpswww.american.edu/ccps
47.9% to 47.4%
Center for Congressional and Center for Congressional and Presidential Studies Presidential Studies
www.american.edu/ccpswww.american.edu/ccps
Center for Congressional and Center for Congressional and Presidential Studies Presidential Studies
www.american.edu/ccpswww.american.edu/ccps
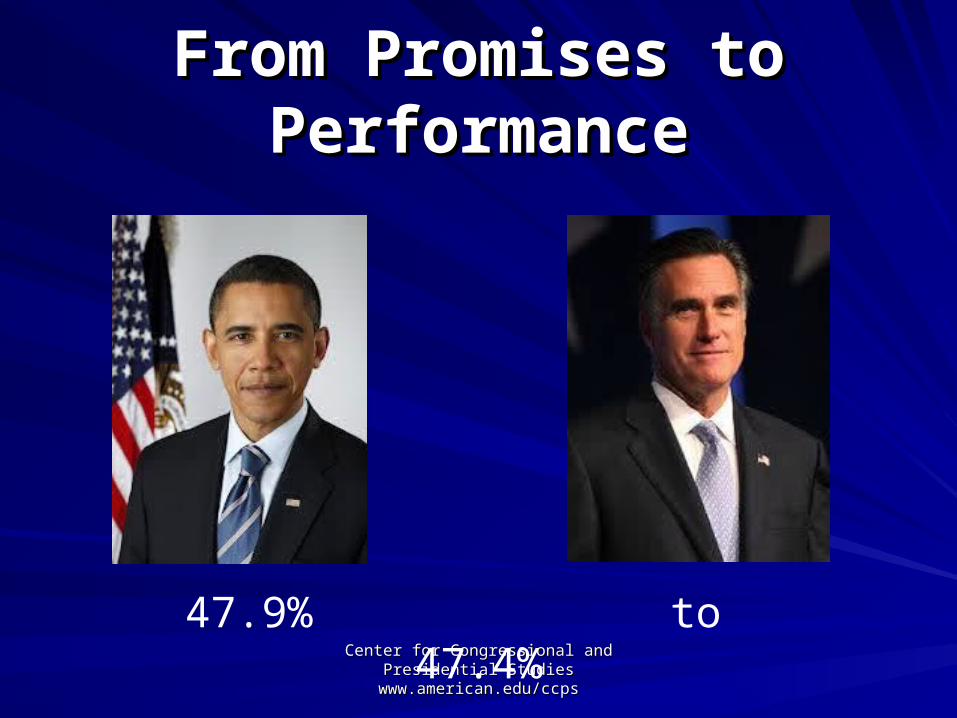
2012 Voters and Campaign 2012 Voters and Campaign StrategyStrategy
The VotersThe Voters– 38% 38%
Independent,34% D. Independent,34% D. 27% R.27% R.
– 39% H/S Turnout 39% H/S Turnout (18.8% primaries)(18.8% primaries)
– Tea Party Groups, Tea Party Groups, Independents, Independents, Retirees. LatinosRetirees. Latinos
– 55% Presidential 55% Presidential Turnout: 62% 2008 Turnout: 62% 2008 (early voting)(early voting)
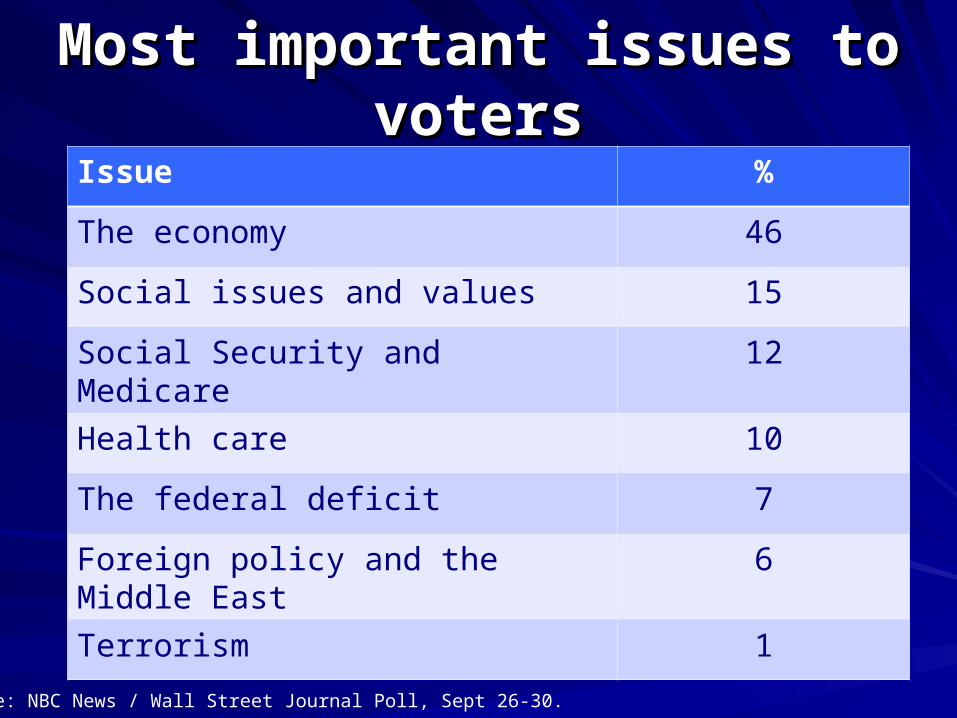
Most important issues to Most important issues to votersvoters
Source: NBC News / Wall Street Journal Poll, Sept 26-30.
Issue %
The economy 46
Social issues and values 15
Social Security and Medicare 12
Health care 10
The federal deficit 7
Foreign policy and the Middle East 6
Terrorism 1
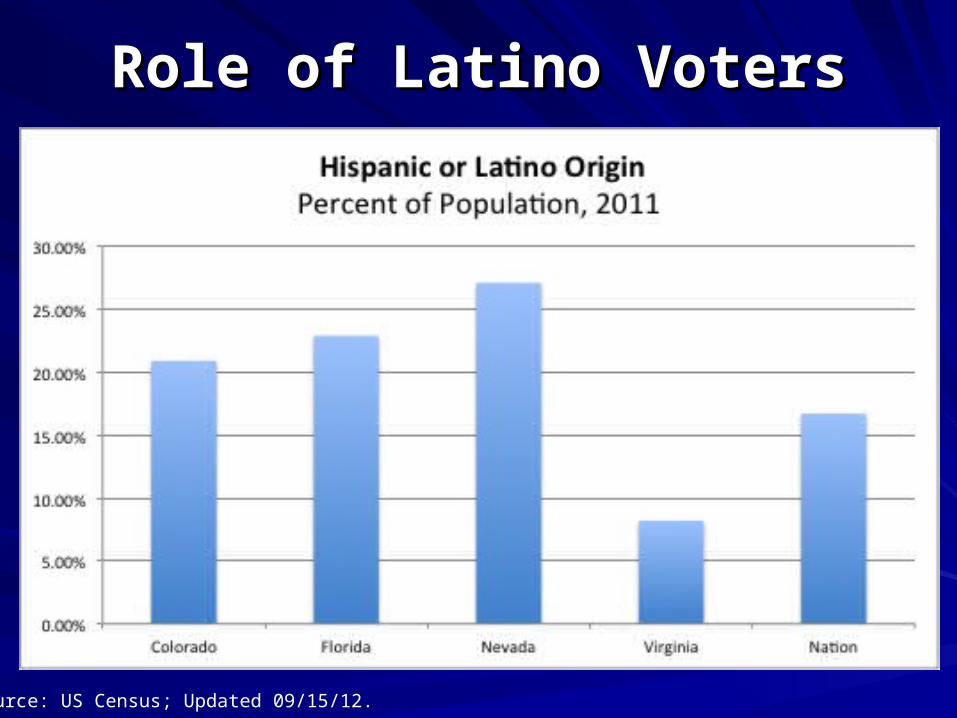
Role of Latino VotersRole of Latino Voters
Source: US Census; Updated 09/15/12.
Center for Congressional and Center for Congressional and Presidential Studies Presidential Studies
www.american.edu/ccpswww.american.edu/ccps
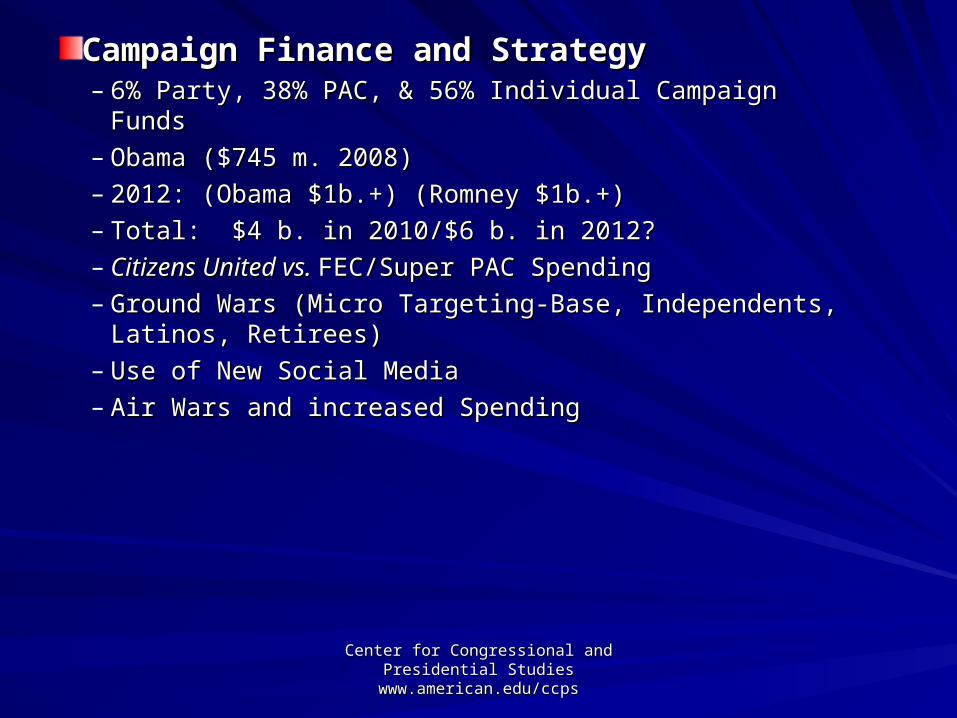
Campaign Finance and StrategyCampaign Finance and Strategy– 6% Party, 38% PAC, & 56% Individual Campaign Funds 6% Party, 38% PAC, & 56% Individual Campaign Funds – Obama ($745 m. 2008)Obama ($745 m. 2008)– 2012: (Obama $1b.+) (Romney $1b.+)2012: (Obama $1b.+) (Romney $1b.+)– Total: $4 b. in 2010/$6 b. in 2012?Total: $4 b. in 2010/$6 b. in 2012?– Citizens United vs. Citizens United vs. FEC/Super PAC SpendingFEC/Super PAC Spending– Ground Wars (Micro Targeting-Base, Independents, Ground Wars (Micro Targeting-Base, Independents,
Latinos, Retirees)Latinos, Retirees)– Use of New Social MediaUse of New Social Media– Air Wars and increased SpendingAir Wars and increased Spending
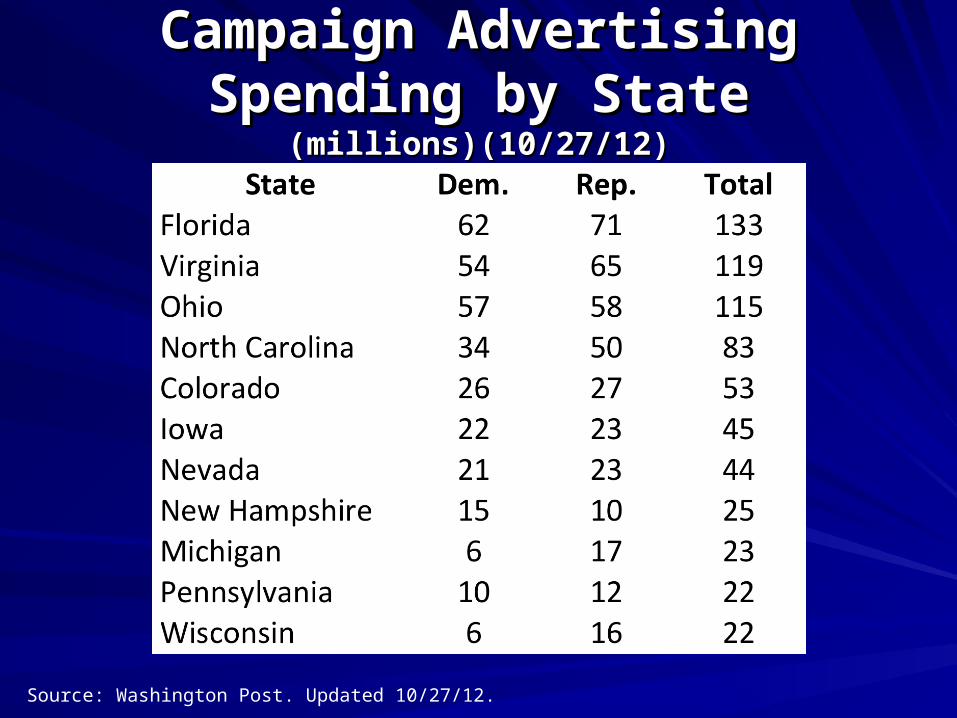
Campaign Advertising Spending Campaign Advertising Spending by Stateby State
(millions)(10/27/12)(millions)(10/27/12)
Source: Washington Post. Updated 10/27/12.
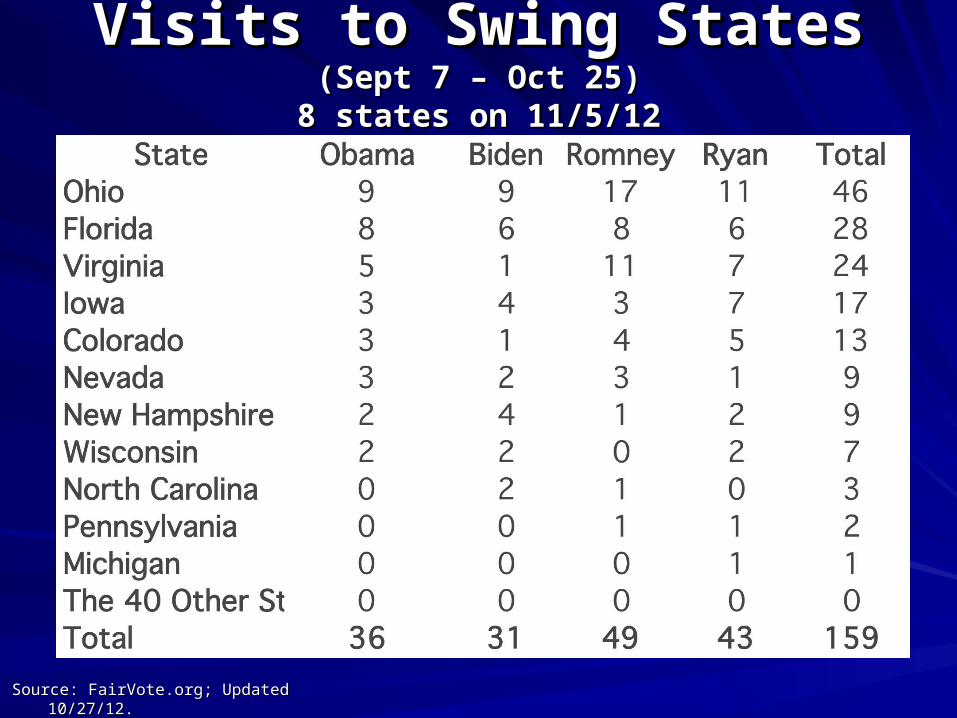
Visits to Swing StatesVisits to Swing States(Sept 7 – Oct 25)(Sept 7 – Oct 25)
8 states on 11/5/128 states on 11/5/12
Source: FairVote.org; Updated 10/27/12.Source: FairVote.org; Updated 10/27/12.
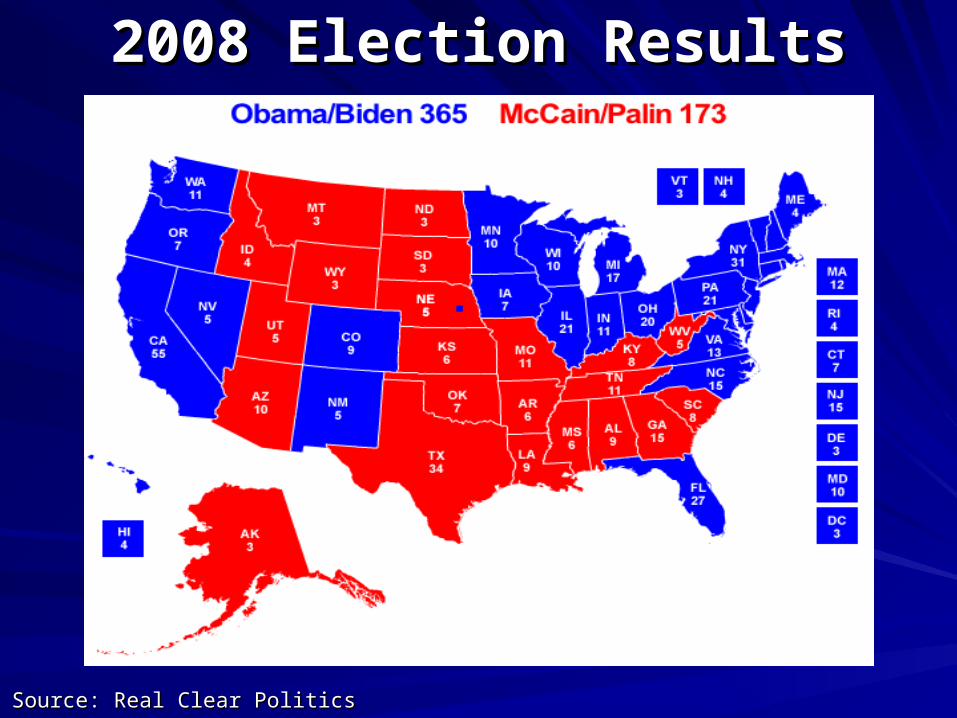
2008 Election Results2008 Election Results
Source: Real Clear PoliticsSource: Real Clear Politics
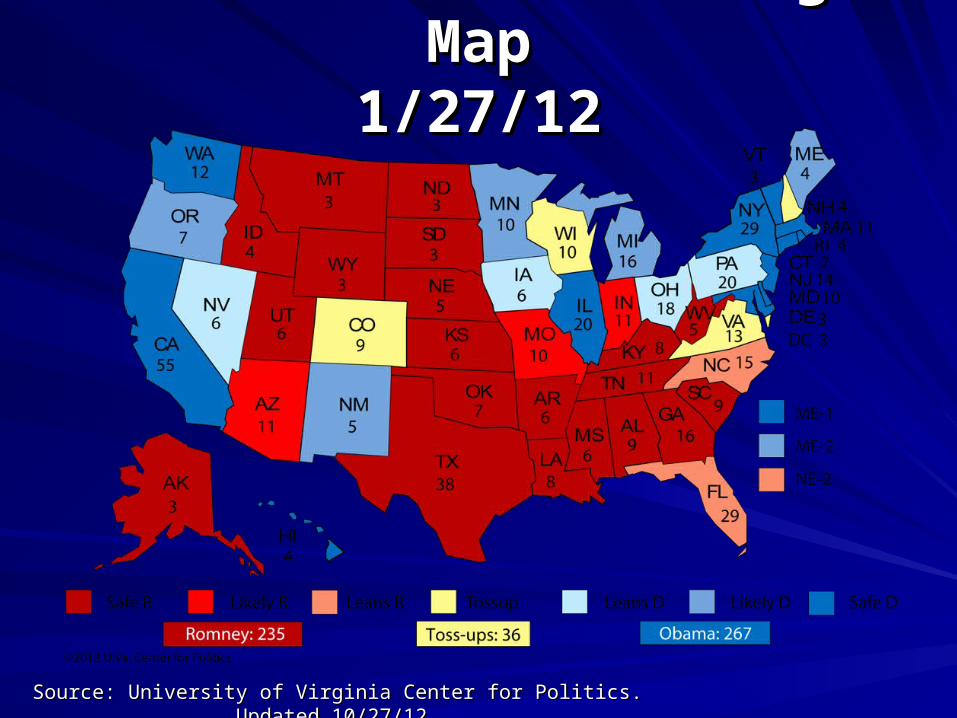
2012 Electoral College Map2012 Electoral College Map1/27/121/27/12
Source: University of Virginia Center for Politics. Updated 10/27/12.Source: University of Virginia Center for Politics. Updated 10/27/12.
Center for Congressional and Center for Congressional and Presidential Studies Presidential Studies
www.american.edu/ccpswww.american.edu/ccps
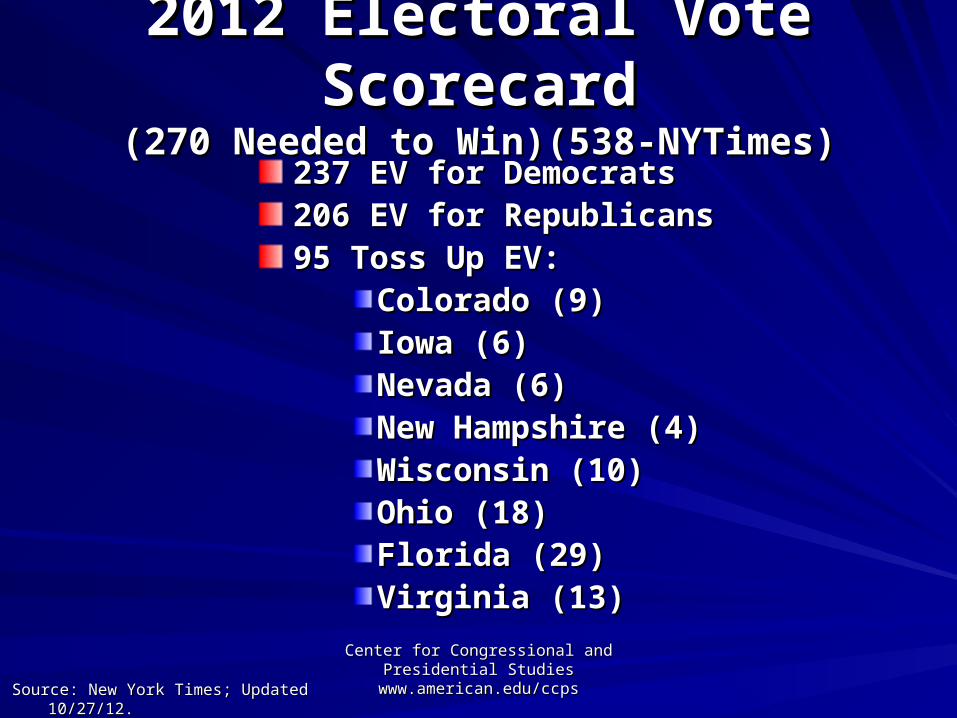
237 EV for Democrats237 EV for Democrats206 EV for Republicans206 EV for Republicans95 Toss Up EV:95 Toss Up EV:
Colorado (9)Colorado (9)Iowa (6)Iowa (6)Nevada (6)Nevada (6)New Hampshire (4)New Hampshire (4)Wisconsin (10)Wisconsin (10)Ohio (18)Ohio (18)Florida (29)Florida (29)Virginia (13)Virginia (13)
2012 Electoral Vote Scorecard2012 Electoral Vote Scorecard(270 Needed to Win)(538-NYTimes)(270 Needed to Win)(538-NYTimes)
Source: New York Times; Updated 10/27/12.Source: New York Times; Updated 10/27/12.
Center for Congressional and Center for Congressional and Presidential Studies Presidential Studies
www.american.edu/ccpswww.american.edu/ccps
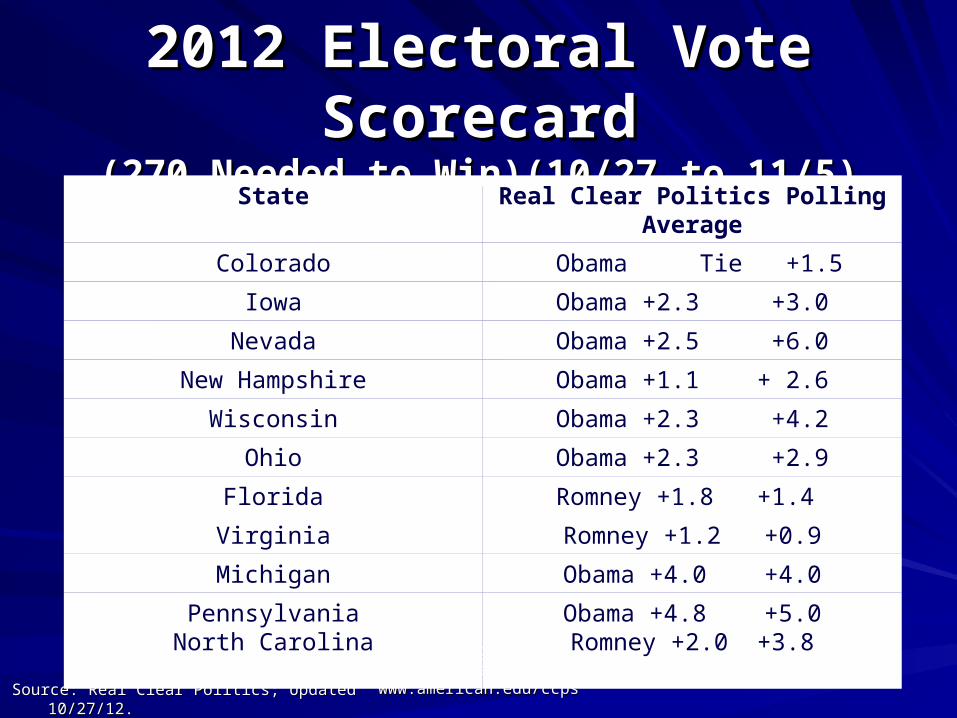
2012 Electoral Vote Scorecard2012 Electoral Vote Scorecard(270 Needed to Win)(10/27 to 11/5)(270 Needed to Win)(10/27 to 11/5)
Source: Real Clear Politics; Updated 10/27/12.Source: Real Clear Politics; Updated 10/27/12.
State Real Clear Politics Polling Average
Colorado Obama Tie +1.5
Iowa Obama +2.3 +3.0
Nevada Obama +2.5 +6.0
New Hampshire Obama +1.1 + 2.6
Wisconsin Obama +2.3 +4.2
Ohio Obama +2.3 +2.9
Florida Romney +1.8 +1.4
Virginia Romney +1.2 +0.9
Michigan Obama +4.0 +4.0
PennsylvaniaNorth Carolina
Obama +4.8 +5.0Romney +2.0 +3.8
Center for Congressional and Center for Congressional and Presidential Studies Presidential Studies
www.american.edu/ccpswww.american.edu/ccps
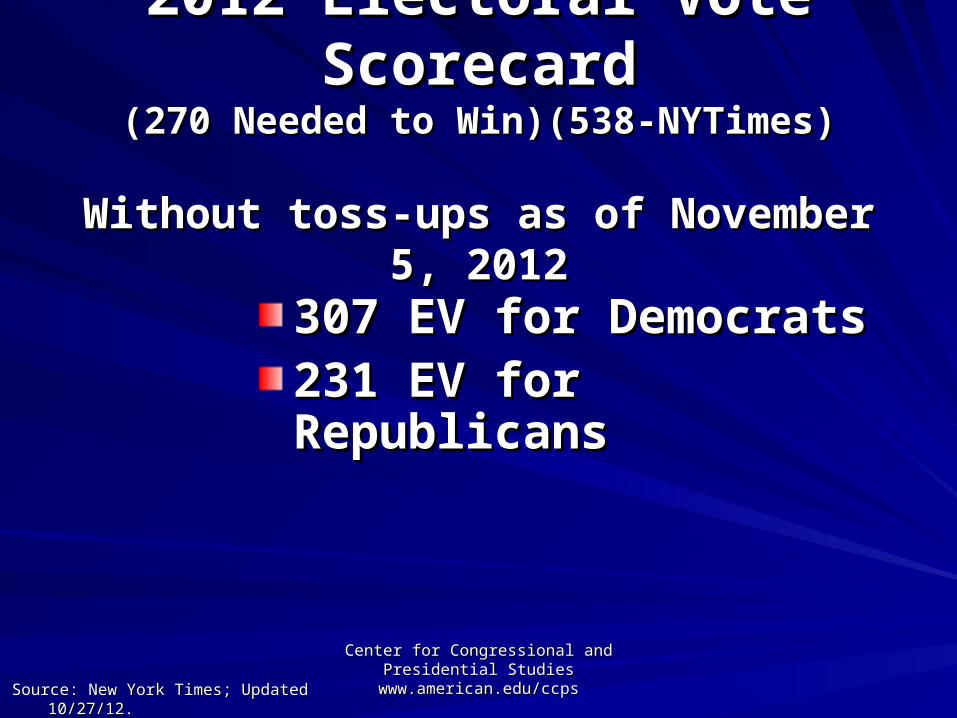
307 EV for Democrats307 EV for Democrats231 EV for Republicans231 EV for Republicans
2012 Electoral Vote Scorecard2012 Electoral Vote Scorecard(270 Needed to Win)(538-NYTimes)(270 Needed to Win)(538-NYTimes)
Without toss-ups as of November 5, 2012Without toss-ups as of November 5, 2012
Source: New York Times; Updated 10/27/12.Source: New York Times; Updated 10/27/12.
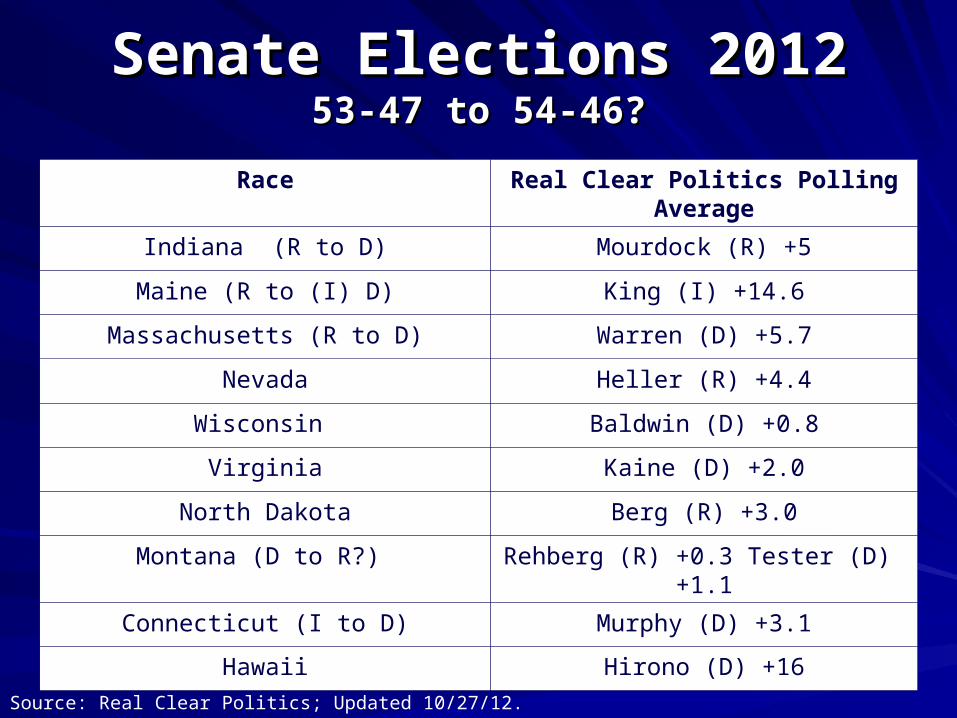
Senate Elections 2012Senate Elections 201253-47 to 54-46?53-47 to 54-46?
Race Real Clear Politics Polling Average
Indiana (R to D) Mourdock (R) +5
Maine (R to (I) D) King (I) +14.6
Massachusetts (R to D) Warren (D) +5.7
Nevada Heller (R) +4.4
Wisconsin Baldwin (D) +0.8
Virginia Kaine (D) +2.0
North Dakota Berg (R) +3.0
Montana (D to R?) Rehberg (R) +0.3 Tester (D) +1.1
Connecticut (I to D) Murphy (D) +3.1
Hawaii Hirono (D) +16
Source: Real Clear Politics; Updated 10/27/12.
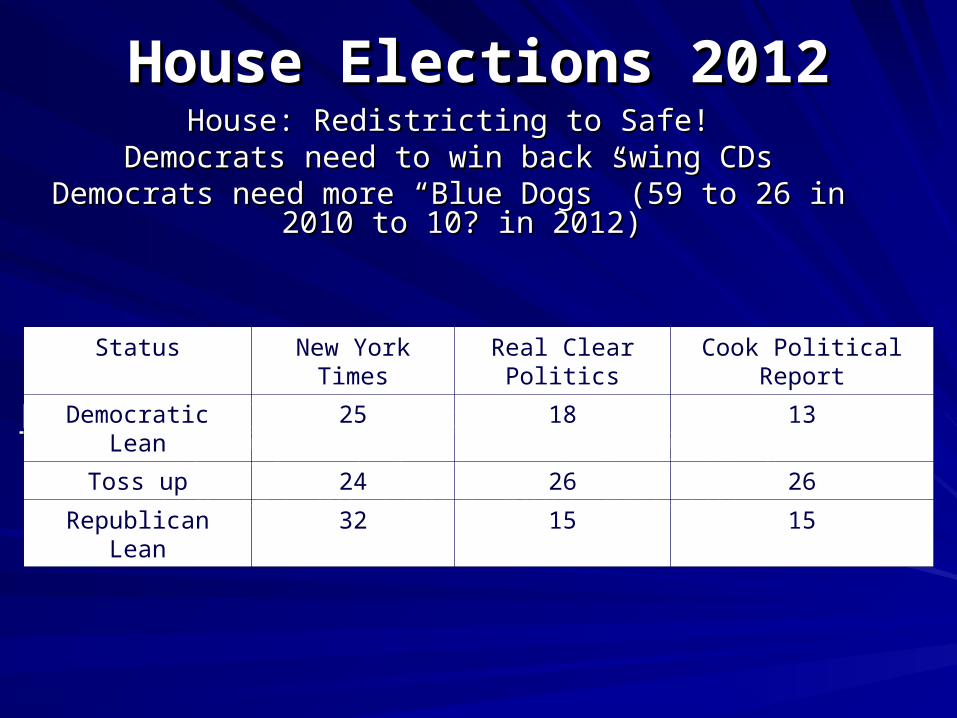
House Elections 2012House Elections 2012House: Redistricting to Safe!House: Redistricting to Safe!
Democrats need to win back swing CDsDemocrats need to win back swing CDsDemocrats need more Democrats need more ““Blue DogsBlue Dogs”” (59 to 26 in 2010 to 10? in (59 to 26 in 2010 to 10? in
2012)2012)
Last Four Elections Competitive Seats: 29, 65, 69, 85, Last Four Elections Competitive Seats: 29, 65, 69, 85, (33 to 81 in 2012?)(33 to 81 in 2012?)
178 (D) 33 (Toss Ups) 224 (R)178 (D) 33 (Toss Ups) 224 (R)
Status New York Times Real Clear Politics Cook Political Report
Democratic Lean 25 18 13
Toss up 24 26 26
Republican Lean 32 15 15
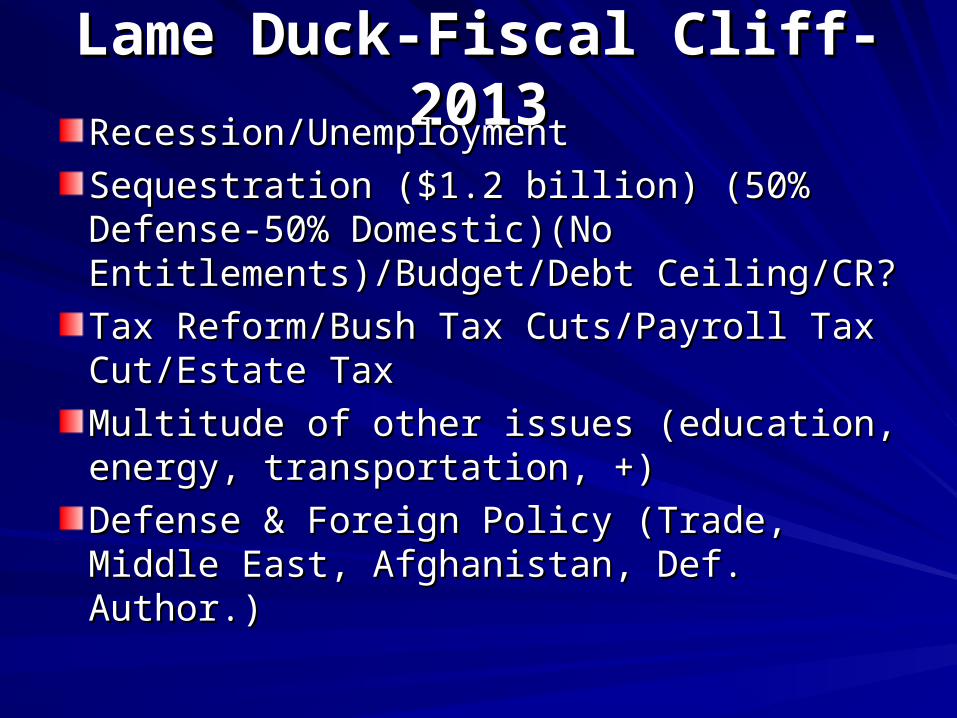
Lame Duck-Fiscal Cliff-2013Lame Duck-Fiscal Cliff-2013Recession/UnemploymentRecession/Unemployment
Sequestration ($1.2 billion) (50% Defense-Sequestration ($1.2 billion) (50% Defense-50% Domestic)(No 50% Domestic)(No Entitlements)/Budget/Debt Ceiling/CR?Entitlements)/Budget/Debt Ceiling/CR?
Tax Reform/Bush Tax Cuts/Payroll Tax Tax Reform/Bush Tax Cuts/Payroll Tax Cut/Estate TaxCut/Estate Tax
Multitude of other issues (education, Multitude of other issues (education, energy, transportation, +)energy, transportation, +)
Defense & Foreign Policy (Trade, Middle Defense & Foreign Policy (Trade, Middle East, Afghanistan, Def. Author.)East, Afghanistan, Def. Author.)
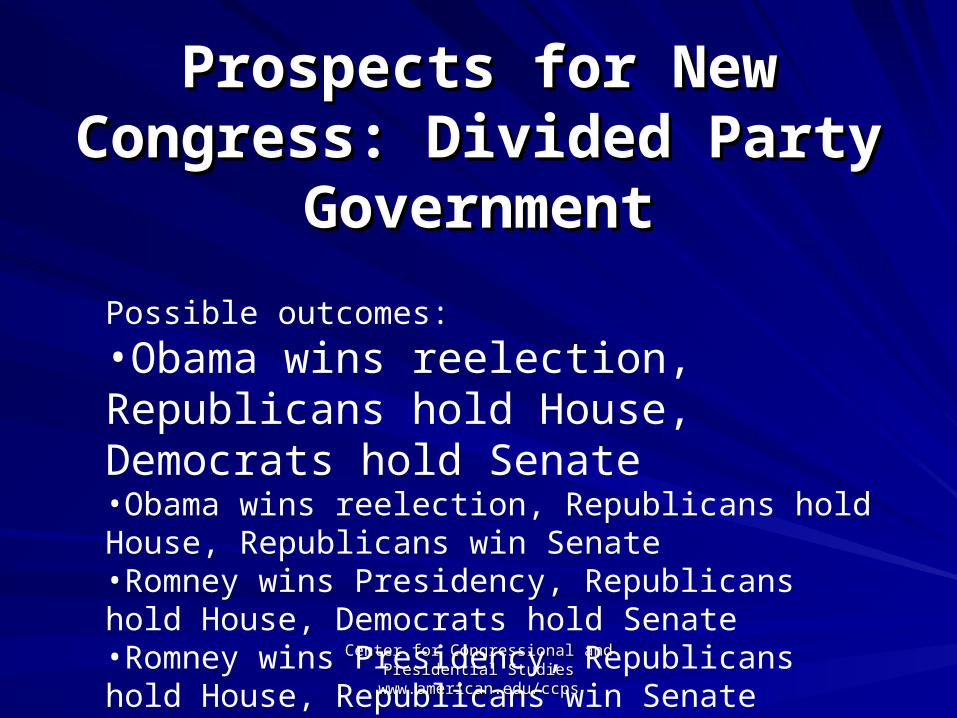
Prospects for New Congress: Prospects for New Congress: Divided Party GovernmentDivided Party Government
Center for Congressional and Center for Congressional and Presidential Studies Presidential Studies
www.american.edu/ccpswww.american.edu/ccps
Possible outcomes:
•Obama wins reelection, Republicans hold House, Democrats hold Senate•Obama wins reelection, Republicans hold House, Republicans win Senate•Romney wins Presidency, Republicans hold House, Democrats hold Senate•Romney wins Presidency, Republicans hold House, Republicans win Senate
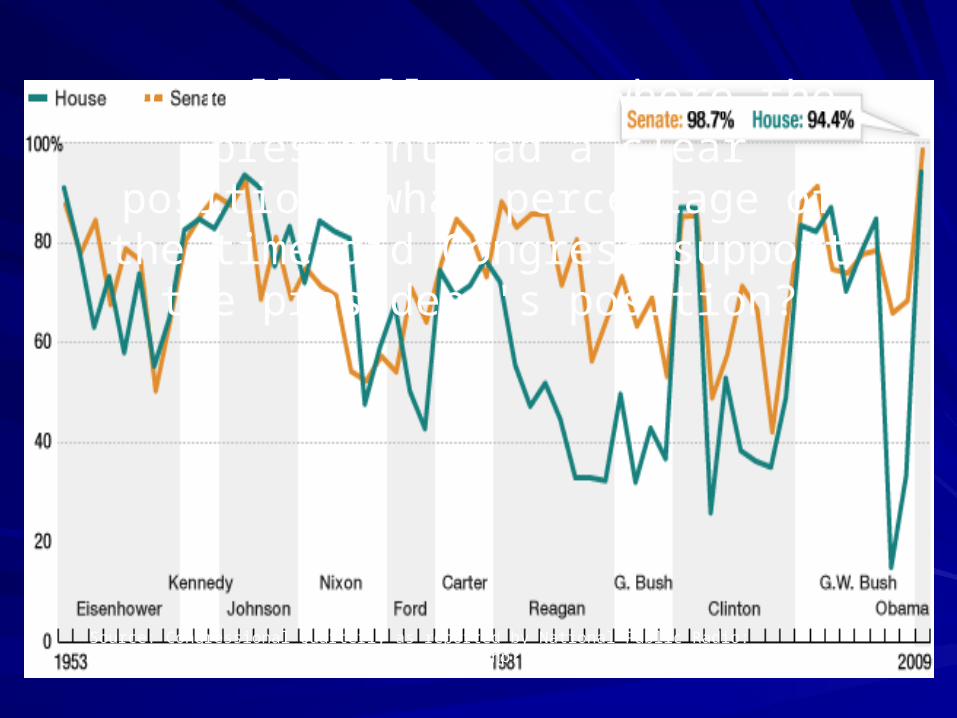
On roll-call votes where the president had a clear position, what percentage of the time
did Congress support the president's position?
Source: Congressional Quarterly as reported by National Public Radio: http://www.npr.org/templates/story/story.php?storyId=122436116&ps=cprs
Center for Congressional and Center for Congressional and Presidential Studies Presidential Studies
www.american.edu/ccpswww.american.edu/ccps
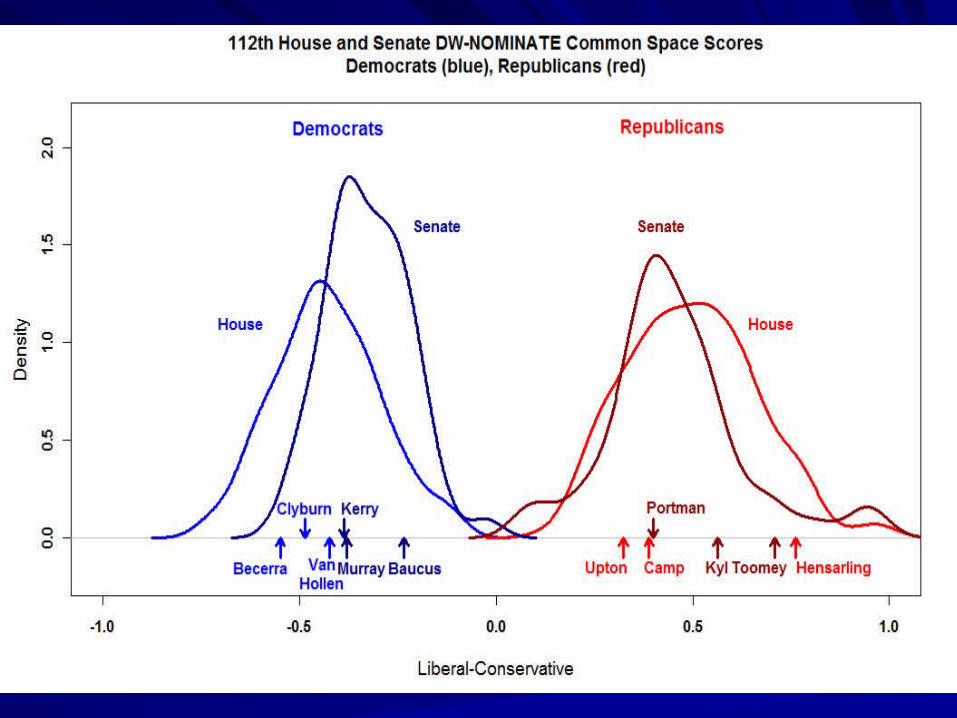
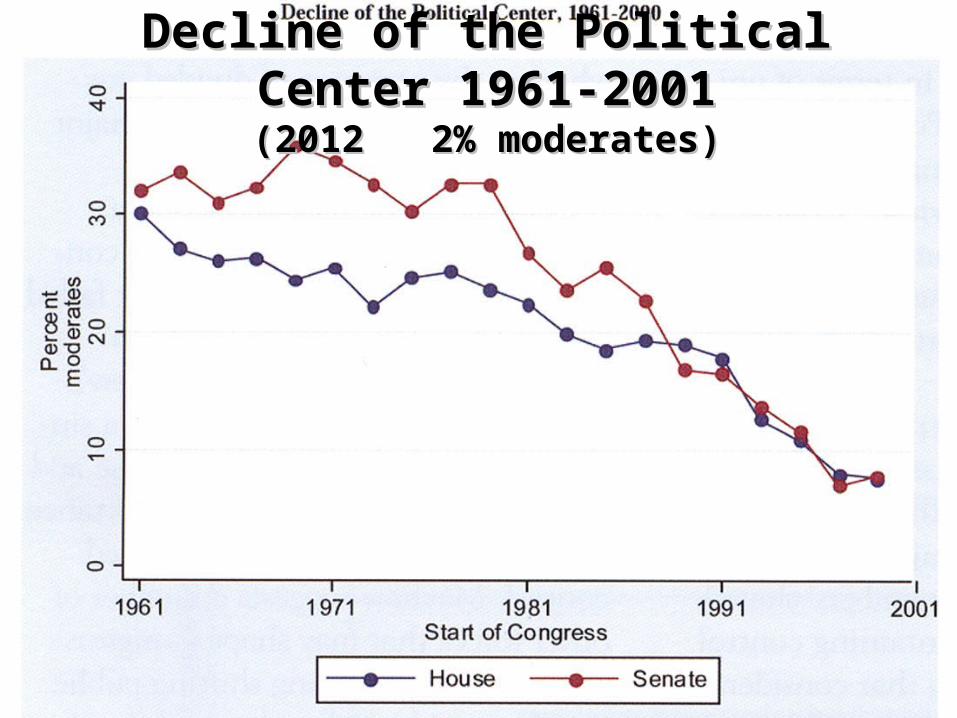
Decline of the Political Center 1961-2001Decline of the Political Center 1961-2001(2012 2% moderates)(2012 2% moderates)
Center for Congressional and Center for Congressional and Presidential Studies Presidential Studies
www.american.edu/ccpswww.american.edu/ccps
Center for Congressional and Center for Congressional and Presidential Studies Presidential Studies
www.american.edu/ccpswww.american.edu/ccps
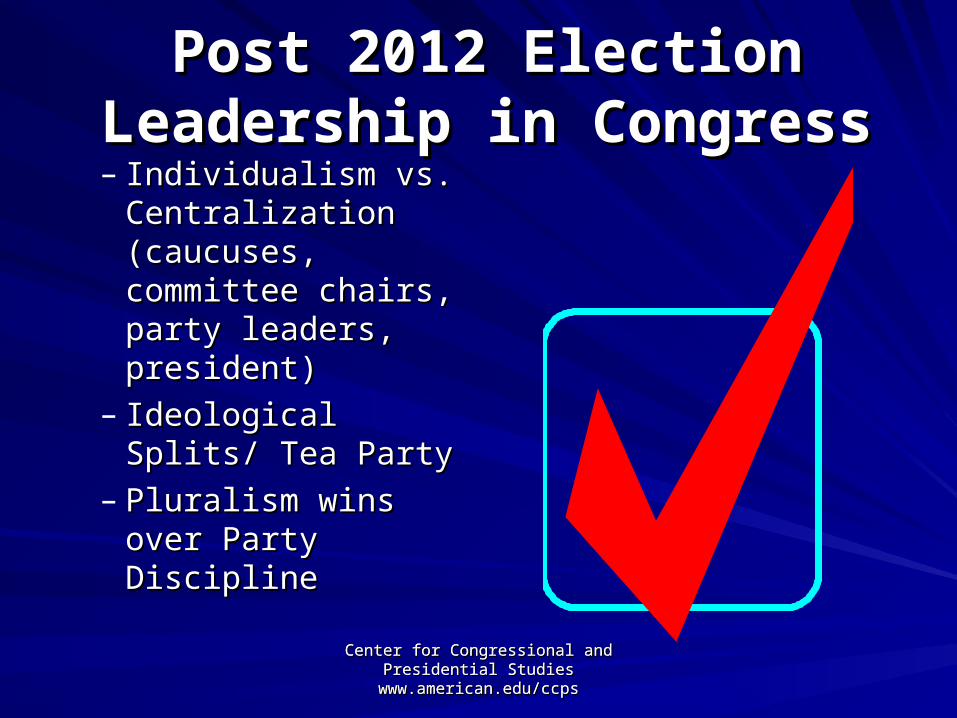
Post 2012 Election Post 2012 Election Leadership in CongressLeadership in Congress
– Individualism vs. Individualism vs. Centralization Centralization (caucuses, (caucuses, committee chairs, committee chairs, party leaders, party leaders, president)president)
– Ideological Splits/ Ideological Splits/ Tea PartyTea Party
– Pluralism wins over Pluralism wins over Party DisciplineParty Discipline
Center for Congressional and Center for Congressional and Presidential Studies Presidential Studies
www.american.edu/ccpswww.american.edu/ccps
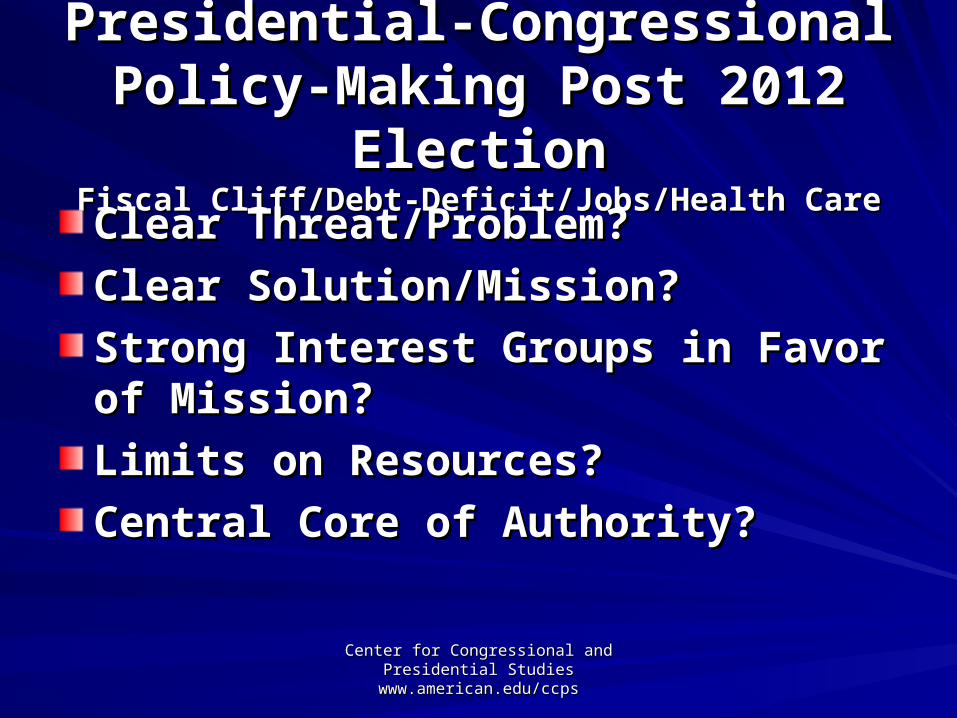
Presidential-Congressional Presidential-Congressional Policy-Making Post 2012 ElectionPolicy-Making Post 2012 Election
Fiscal Cliff/Debt-Deficit/Jobs/Health CareFiscal Cliff/Debt-Deficit/Jobs/Health Care
Clear Threat/Problem?Clear Threat/Problem?
Clear Solution/Mission?Clear Solution/Mission?
Strong Interest Groups in Favor of Strong Interest Groups in Favor of Mission?Mission?
Limits on Resources?Limits on Resources?
Central Core of Authority?Central Core of Authority?
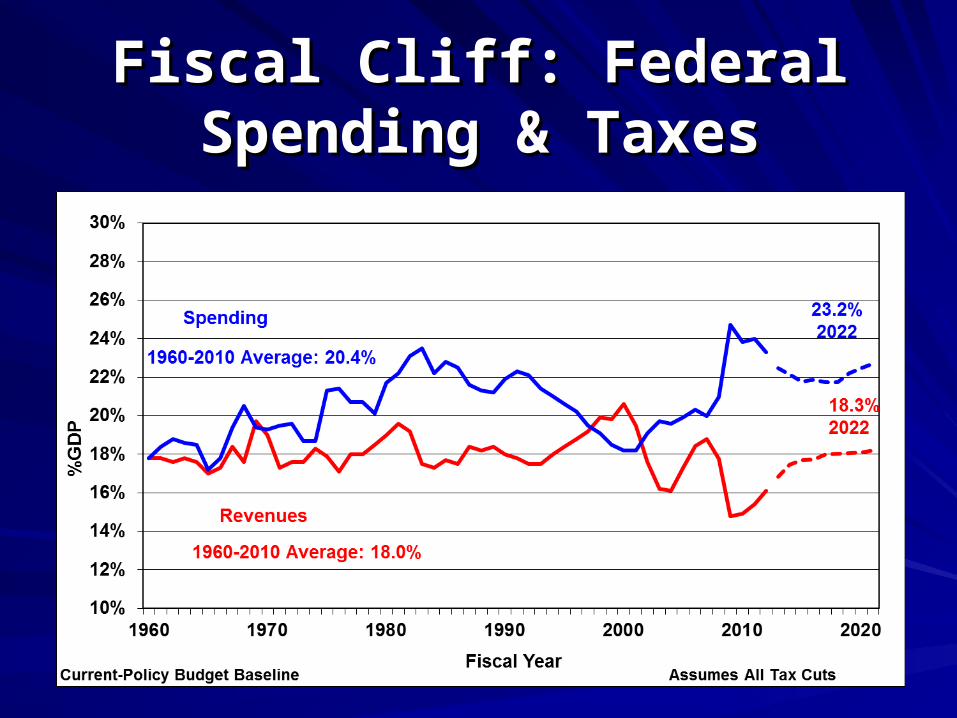
Fiscal Cliff: Federal Spending Fiscal Cliff: Federal Spending & Taxes& Taxes
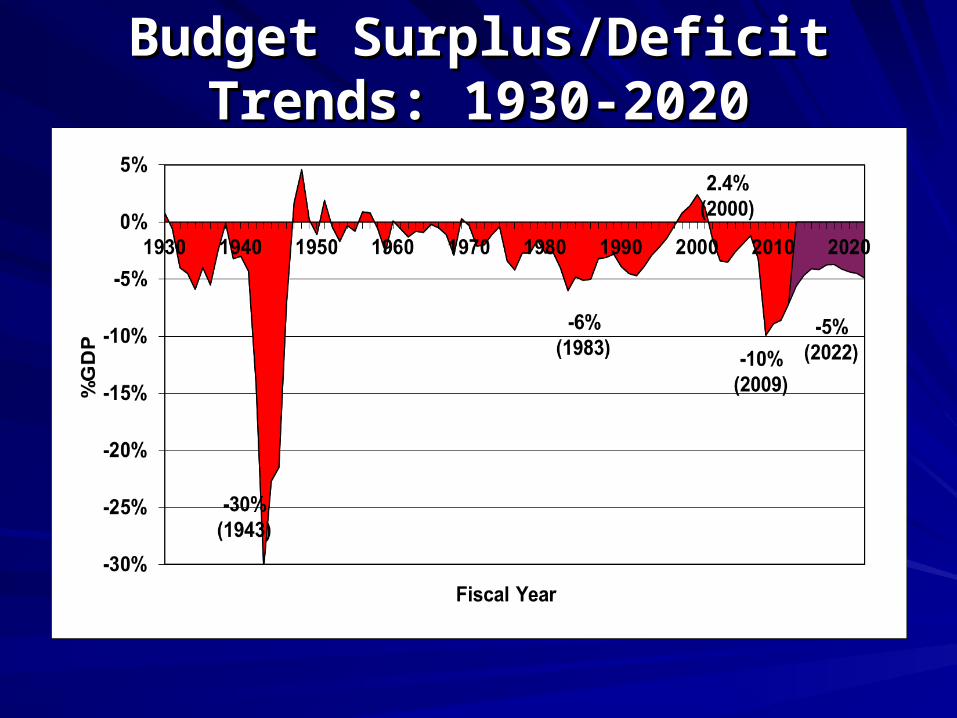
Budget Surplus/Deficit Trends: Budget Surplus/Deficit Trends: 1930-20201930-2020
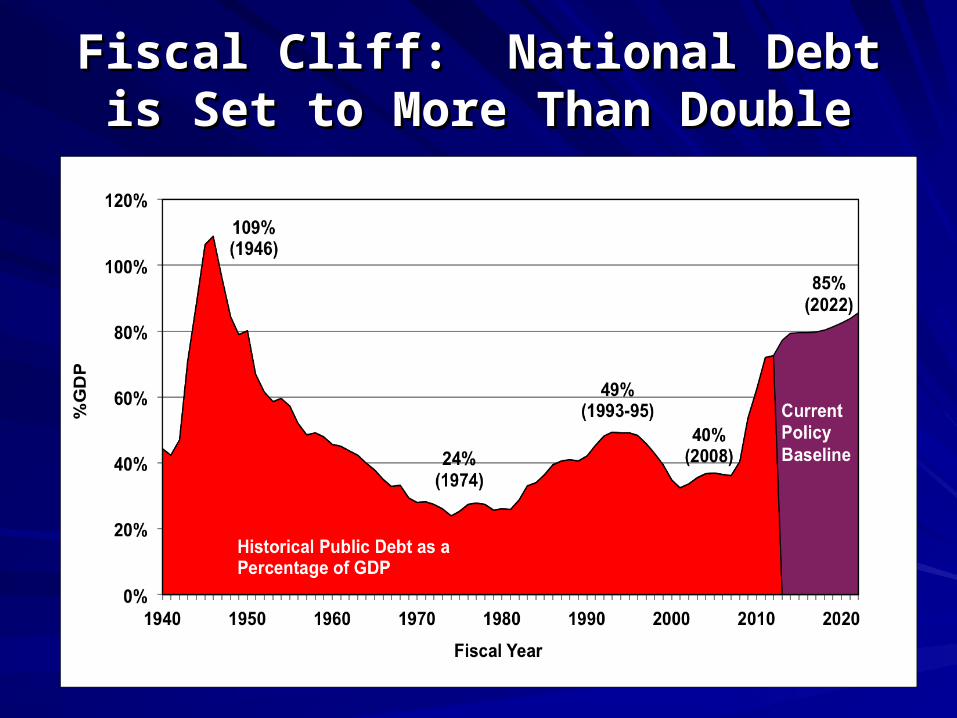
Fiscal Cliff: National Debt is Set to Fiscal Cliff: National Debt is Set to More Than DoubleMore Than Double
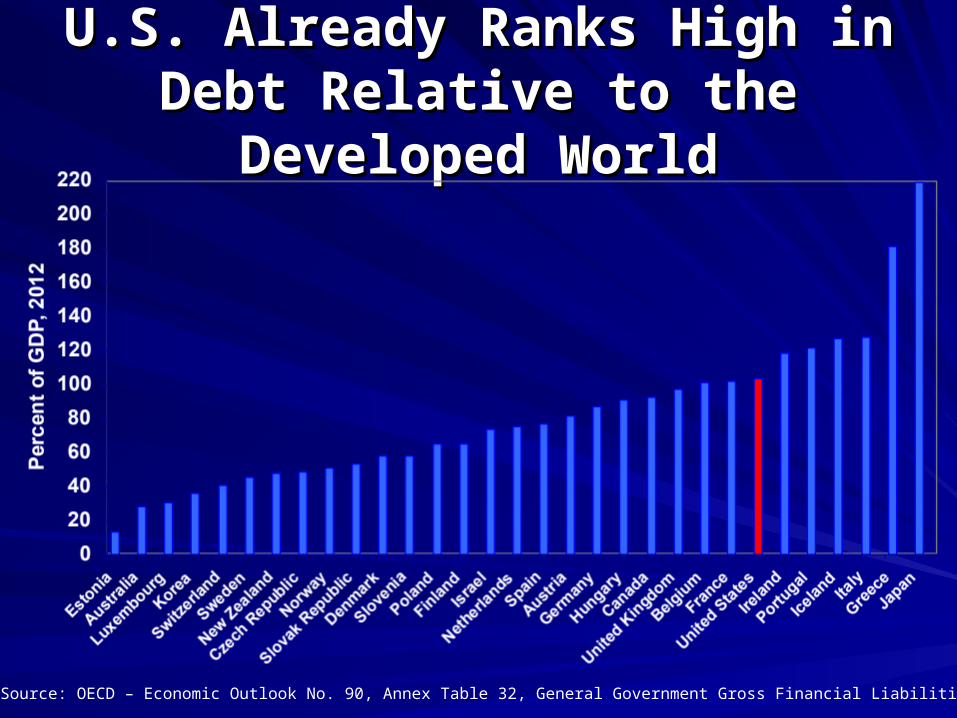
U.S. Already Ranks High in Debt U.S. Already Ranks High in Debt Relative to the Developed WorldRelative to the Developed World
Source: OECD – Economic Outlook No. 90, Annex Table 32, General Government Gross Financial Liabilities
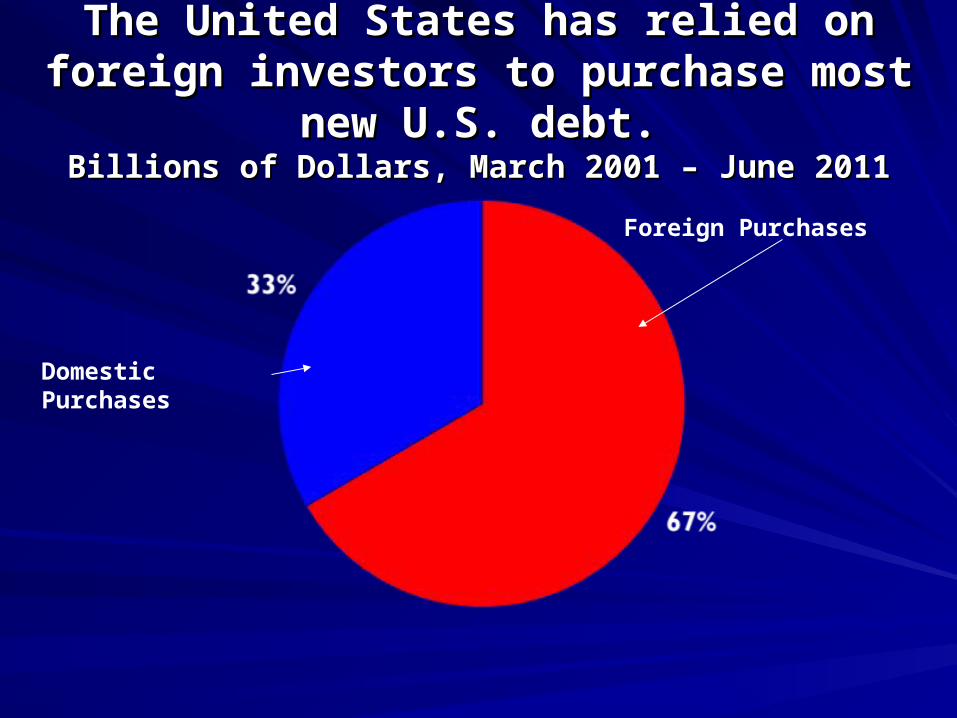
The United States has relied on The United States has relied on foreign investors to purchase most foreign investors to purchase most
new U.S. debt.new U.S. debt.Billions of Dollars, March 2001 – June 2011Billions of Dollars, March 2001 – June 2011
Foreign Purchases
Domestic Purchases

““A man drink like that and A man drink like that and he donhe don’’t eat, he is going to t eat, he is going to
die!die!””BUT When?BUT When?
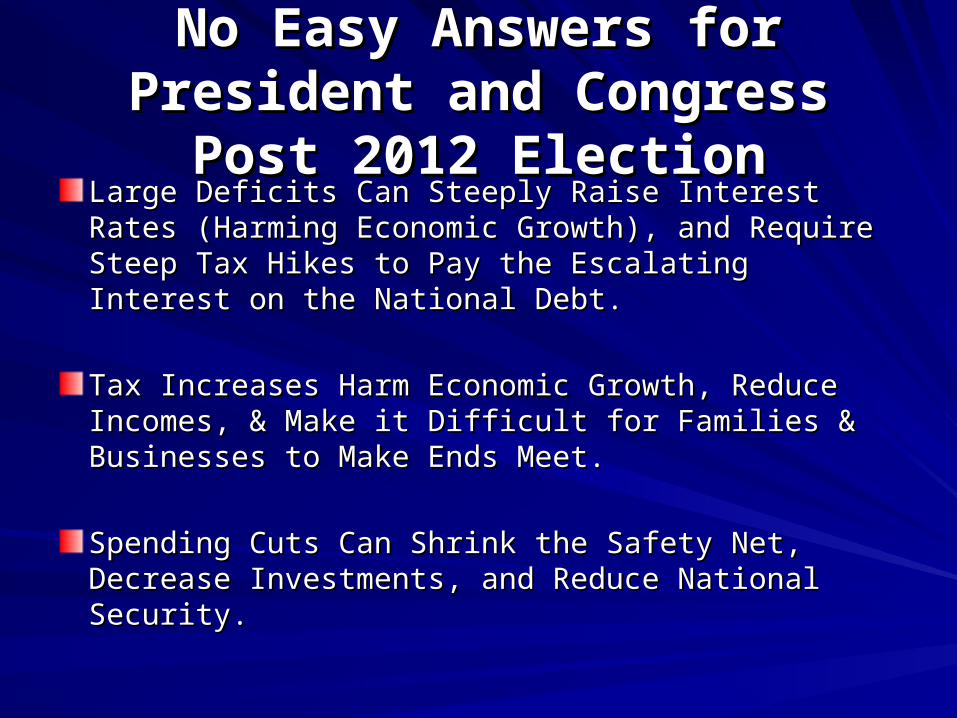
No Easy Answers for President No Easy Answers for President and Congress Post 2012 Electionand Congress Post 2012 Election
Large Deficits Can Steeply Raise Interest Rates Large Deficits Can Steeply Raise Interest Rates (Harming Economic Growth), and Require Steep Tax (Harming Economic Growth), and Require Steep Tax Hikes to Pay the Escalating Interest on the National Hikes to Pay the Escalating Interest on the National Debt.Debt.
Tax Increases Harm Economic Growth, Reduce Tax Increases Harm Economic Growth, Reduce Incomes, & Make it Difficult for Families & Businesses Incomes, & Make it Difficult for Families & Businesses to Make Ends Meet.to Make Ends Meet.
Spending Cuts Can Shrink the Safety Net, Decrease Spending Cuts Can Shrink the Safety Net, Decrease Investments, and Reduce National Security.Investments, and Reduce National Security.
Center for Congressional and Center for Congressional and Presidential Studies Presidential Studies
www.american.edu/ccpswww.american.edu/ccps
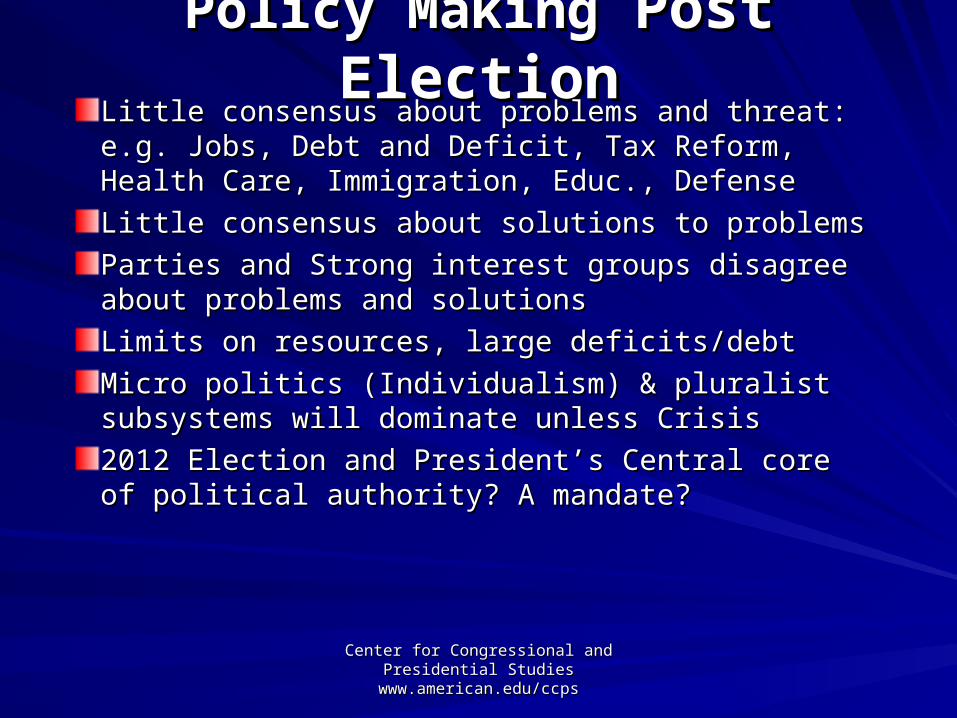
Policy MakingPolicy Making Post Election Post ElectionLittle consensus about problems and threat: e.g. Little consensus about problems and threat: e.g. Jobs, Debt and Deficit, Tax Reform, Health Care, Jobs, Debt and Deficit, Tax Reform, Health Care, Immigration, Educ., DefenseImmigration, Educ., Defense
Little consensus about solutions to problemsLittle consensus about solutions to problems
Parties and Strong interest groups disagree about Parties and Strong interest groups disagree about problems and solutionsproblems and solutions
Limits on resources, large deficits/debtLimits on resources, large deficits/debt
Micro politics (Individualism) & pluralist subsystems Micro politics (Individualism) & pluralist subsystems will dominate unless Crisiswill dominate unless Crisis
2012 Election and President’s Central core of political 2012 Election and President’s Central core of political authority? A mandate?authority? A mandate?
Questions?Questions?
Comments?Comments?
Center for Congressional and Center for Congressional and Presidential Studies Presidential Studies
www.american.edu/ccpswww.american.edu/ccps
SourcesSourcesGeneral Election Resources:General Election Resources:
Real Clear Politics: http://www.realclearpolitics.com/Real Clear Politics: http://www.realclearpolitics.com/Cook Political Report: http://cookpolitical.com/Cook Political Report: http://cookpolitical.com/New York Times Political Blog (538): http://fivethirtyeight.blogs.nytimes.com/New York Times Political Blog (538): http://fivethirtyeight.blogs.nytimes.com/
Other Sources:Other Sources:Tracking of campaign events by FairVote.org. Available: Tracking of campaign events by FairVote.org. Available:
http://www.fairvote.org/presidential-tracker#.UIqwG2l25Jhhttp://www.fairvote.org/presidential-tracker#.UIqwG2l25Jh
Sources (cont.)Sources (cont.)State and national unemployment data from the Bureau of Labor Statistics. State and national unemployment data from the Bureau of Labor Statistics. Available: http://www.bls.gov/home.htmAvailable: http://www.bls.gov/home.htmState and national tracking poll data from Real Clear Politics and National State and national tracking poll data from Real Clear Politics and National Polls. Available: http://www.realclearpolitics.com/ and Polls. Available: http://www.realclearpolitics.com/ and http://www.nationalpolls.com/http://www.nationalpolls.com/2008 Presidential election results from the Federal Elections Commission. 2008 Presidential election results from the Federal Elections Commission. Available: http://www.fec.gov/pubrec/fe2008/federalelections2008.pdfAvailable: http://www.fec.gov/pubrec/fe2008/federalelections2008.pdfLatino turnout data from the William C. Velasquez Institute. Available: Latino turnout data from the William C. Velasquez Institute. Available: http://www.wcvi.org/index.htmlhttp://www.wcvi.org/index.htmlMap of swing states from Map of swing states from CNN. Available: CNN. Available: http://www.cnn.com/ELECTION/2012/electoral-map.htmlhttp://www.cnn.com/ELECTION/2012/electoral-map.htmlElectoral college projections from the Cook Political Report. Available: Electoral college projections from the Cook Political Report. Available: http://cookpolitical.com/charts/president/ev_scorecardhttp://cookpolitical.com/charts/president/ev_scorecard