Embed Size (px)
Citation preview

Center for
By-Products
Utilization
CHARACTERIZATION OF MARBLE POWDER
FOR ITS USE IN MORTAR AND CONCRETE
By Valeria Corinaldesi, Giacomo Moriconi, and Tarun R.
Naik
Report No. CBU-2007-07
REP-628
February 2008
Submitted for Consideration for Publication in the ACI Materials Journal
Department of Civil Engineering and Mechanics
College of Engineering and Applied Science
THE UNIVERSITY OF WISCONSIN – MILWAUKEE

1
CHARACTERIZATION OF MARBLE POWDER FOR ITS USE IN 1
MORTAR AND CONCRETE 2
3
Valeria Corinaldesi, Giacomo Moriconi, and Tarun R. Naik 4
5
Affiliation: 6
Valeria Corinaldesi and Giacomo Moriconi: Department of Materials and Environment 7
Engineering and Physics, Marche Polytechnical University, Ancona, ITALY 60131. 8
Tarun R. Naik: UWM Center for By-Products Utilization, Department of Civil Engineering 9
and Mechanics, College of Engineering Applied Science, University of Wisconsin-10
Milwaukee, Milwaukee, WI 53211. 11
12
Biography: Valeria Corinaldesi is a Civil Engineer and has a Ph.D. in Materials 13
Engineering; she holds a permanent position as researcher at the Department of Materials and 14
Environment Engineering and Physics of the Technical University of Marche, Ancona, Italy. 15
Giacomo Moriconi is Professor of Materials Science and Technology at the Technical 16
University of Marche, Ancona, Italy and is the Head of the Department of Materials and 17
Environment Engineering and Physics. He is the author and co-author of numerous papers in 18
the field of cement and concrete technology, building materials performance, and durability. 19
Tarun R. Naik is the Academic Program Director of the UWM Center for By-Products 20
Utilization and Research Professor at the University of Wisconsin-Milwaukee, Department of 21
Civil Engineering and Mechanics. He is a member of ACI Board Task Group on Sustainable 22
Development, ACI Committees 123 (Research and Current Developments) and 232 (Fly Ash 23
and Natural Pozzolans in Concrete), and Chairman of ACI Committee 555 (Recycled 24

2
Materials in Concrete). His work from sponsored and other research has resulted i 1 n over 1
280 technical papers and reports. 2
3
SYNOPSIS 4
A powder obtained as a by-product of marble sawing and shaping was characterized from a 5
chemical and physical point of view in order to use it as mineral addition for mortars and 6
concretes, especially for self-compacting concrete. This marble powder showed a very high 7
Blaine fineness value of about 1500 m2/kg, with 90% of particles finer than 50 μm (0.0020 8
in.) and 50% under 7 μm (0.00028 in.). For rheological studies, several cement pastes were 9
prepared using marble powder, with and without the addition of an acrylic-based 10
superplasticizer. Water to cementitious materials ratio was also varied. In order to evaluate 11
the effects of the marble powder on mechanical behavior, many different mortar mixtures 12
were tested, all prepared with sand to cement ratio of 3:1 at about the same workability. 13
Mixtures were evaluated based upon cement or sand substitution by the marble powder. 14
Results obtained show that 10% substitution of sand by the marble powder provided 15
maximum compressive strength at about the same workability. 16
17
Keywords: marble, mortar, paste, rheology, recycling, self-consolidating concrete, 18
thixotropy, viscosity, yield stress. 19
20
21
22
23
24
25

3
INTRODUCTION 1
A marble powder, obtained as a by-product of marble sawing and shaping, was characterized 2
from a physical and chemical point of view for evaluating the possibility of using it in mortar 3
and concrete production. 4
5
Mineral additions in general influence the performance of fresh concrete and mortar. 6
Therefore, a rheological study was carried out on various cement pastes prepared with marble 7
powder in combination with cement, and eventually, also, with a superplasticizing admixture. 8
In particular, the goal was to investigate the influence of marble powder on rheological 9
properties of cement pastes for predicting the effect of its addition on self-compacting 10
concrete mixtures1-6
. 11
12
RESEARCH SIGNIFICANCE 13
In this study very fine marble powder was used. It was obtained as a by-product of marble 14
sawing and shaping. It was characterized from a physical and chemical point of view for 15
evaluating the possibility of using it in mortar and concrete production. The test results 16
indicate that due to high fineness of the marble powder, it was very effective in assuring very 17
good cohesiveness of mortar and concrete. This research should lead to proper use of such 18
materials for sustainable use of otherwise discarded materials. 19
20
21
22
23
24
25

4
MATERIALS 1
Portland cement 2
A commercial portland-limestone blended cement type CEM II/A-L 42.5R, according to the 3
European Standards EN-197/1, was used. The Blaine fineness of cement was 410 m2/kg and 4
its relative density (specific gravity) was 3.05. 5
Aggregate 6
Natural sand (5 mm (0.20 in.)) maximum size, with 0.9% passing the 75 μm (0.003 in.) 7
(No. 200) sieve was used. Its relative density (at SSD condition) was 2.62, and its SSD 8
condition water absorption of 3.0%. 9
Chemical admixture 10
In some cases, a water-reducing admixture was added to the mixtures. It was constituted of a 11
carboxylic acrylic ester polymer in the form of 30% aqueous solution. 12
Mineral addition 13
A marble powder was used, which was obtained as a by-product of marble sawing and 14
shaping. Its relative density was 2.55 and the value of Blaine fineness was 1500 m2/kg. It can 15
be observed that the marble powder had a high specific surface area; this could mean that its 16
addition should confer more cohesiveness to mortars and concretes4-5
. 17
18
For better physical characterization of the marble powder, its grain size distribution was 19
performed using laser diffraction. From the graph shown in Fig. 1, it can be observed that 20
50% of particles had a diameter of 7 μm (0.00028 in.) (d50 = 7 μm (0.00028 in.)) and 90% of 21
particles had a diameter lower than 50 μm (0.0020 in.) (d90 = 50 μm (0.0020 in.)). 22
23
24
25

5
The marble powder is produced as “slurry”, a mud made of powder and water. Therefore, for 1
its use in concrete it is important to know how much water is contained in the slurry, by 2
drying it and registering the weight loss related to water evaporation. A known weight of 3
slurry was put in an oven to dry at a temperature of 110 ± 5°C (230 ± 9°F). At fixed intervals 4
(1 hour, 4 hours, 24 hours, 48 hours, and 72 hours) the weight loss was registered with the 5
aim to reach a constant weight. The results obtained are reported in Fig. 2. It is evident from 6
the graph that the sample loses water quickly and reaches the constant weight after about 24 7
hours. 8
9
In order to characterize the marble powder from a chemical point of view, thermal analysis 10
and X-ray diffraction were carried out. Thermal analysis carried out show that the examined 11
material contains about 66% of calcium carbonate, CaCO3. As a matter of fact, as it can be 12
observed in Fig. 3, a sharp weight loss (corresponding to the flex of the DTA curve) occurs 13
from about 730°C (1350°F) to 900°C (1650°F) while strong heat absorption was detected. 14
This was due to the decomposition reaction of calcite, which is endothermic. X-ray 15
diffraction analysis, Fig. 4, show the presence of quartz, which could be estimated at about 16
3%, and ankerite (ferroan dolomite) at about 2%. The remaining part of the marble powder 17
consist of amorphous silica or silicates, coming from natural stones other than marble, whose 18
low crystallinity (making them mostly undetectable by X-ray diffraction) may be due to 19
mechanical processing (sawing and shaping). 20
21
RHEOLOGICAL BEHAVIOR OF CEMENT PASTES 22
The study of the rheological behavior of cement pastes is an essential step for the evaluation 23
of fresh concrete behavior and for the optimization of self-compacting concretes7. For this 24
purpose, eight cement pastes were prepared by varying the water to cement ratio (0.4 - 0.5), 25
6
the amount of marble powder addition (10% and 20% by weight of cement), the basis for 1
adding marble powder (as either cement or sand replacement), and by eventually adding a 2
superplasticizing admixture (at a dosage of 0.5% by weight of very fine materials, i.e., 3
cement plus marble powder). The proportions of these paste mixtures are shown in Table 1. 4
5
The rheological behavior of these cement pastes was determined at 15 minutes after 6
ingredients mixing, and then every 20 minutes up to 1 hour. 7
8
The apparatus was a rotating rheometer based on coaxial rotary cylinders with a slowly 9
increasing shear rate (D), ranging from 1 to 100 s-1. Bui et al.7 found that the rate of 1 to 10
100 s-1 was the most suitable for rheological model of concretes, while higher rotation rates 11
were considered too fast and rates limited to 50 s-1 did not produce consistent results. 12
13
The walls of the concentric cylinders were not smooth but roughened in order to reduce (if 14
not completely eliminate) the “slip” phenomenon; i.e., the development of a water-rich layer 15
close to the inner surface of the rotating cylinder, which produces a lubricating effect, making 16
flow easier, and not representative of the bulk material8. 17
18
The rheological behavior was described by means of the Bingham flow model (Fig. 5): 19
Dy (1) 20
where is the shear stress [Pa, or psi], y is the yield stress [Pa, or psi], is the plastic 21
viscosity [Pa∙s, or psi∙s], and D is the shear rate [s-1]. 22
The slope of the down-curve (decreasing shear rate) was used to calculate the plastic 23
viscosity, while the intercept at zero shear rate was used to calculate the yield stress (see 24
Fig. 6). 25

7
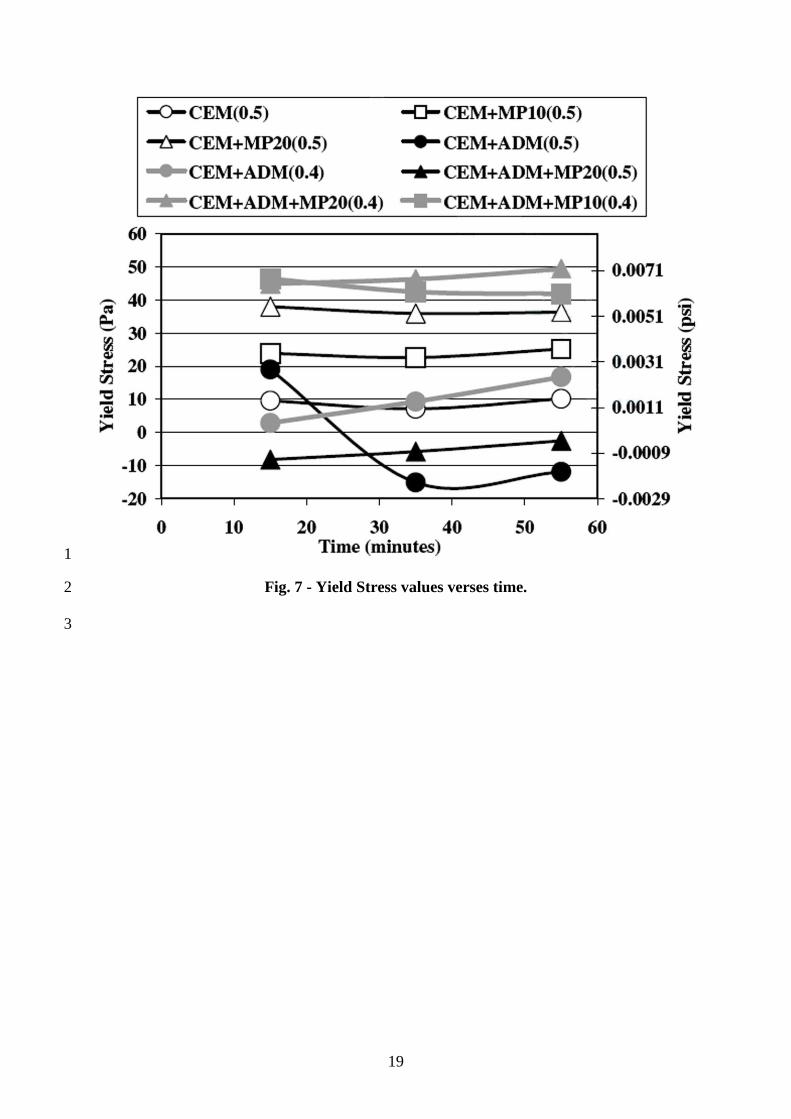
In Fig. 7, the measured yield stress values are plotted as a function of time. It is evident that 1
the pastes prepared with marble powder, superplasticizing admixture, and water/cement of 2
0.4 showed the highest values of the yield stress, more than 40 Pa (0.0058 psi). Quite high 3
values also were obtained for the cement pastes prepared with marble powder and 4
water/cement of 0.5 but in absence of superplasticizer. On the other hand, when the water to 5
cement ratio was 0.5 and the superplasticizing admixture was added, even at the low dosage 6
(0.5% by weight of cement), the yield stress was very low, less than zero, thus implying low 7
cohesiveness of the related mortars and concretes, particularly for self-compacting concretes. 8
9
In Fig. 8 the measured plastic viscosity values are plotted as a function of time. Also in this 10
case, the same hierarchy of yield stress values was maintained among the various cement 11
pastes. 12
13
For maximum segregation resistance, the yield stress of the paste should be high1-3, 7
and the 14
difference in density between the aggregate and the paste should be low. If the density of the 15
aggregate particle is greater than the density of the cement paste, segregation will occur to 16
some extent. However, if the plastic viscosity of the matrix were high enough the velocity of 17
the falling aggregate particle would be so slow that segregation would be avoided7. On the 18
basis of the results reported in Fig. 7 and Fig. 8, it can be seen that in the presence of a 19
superplasticizing admixture (e.g., for preparing self-compacting concrete), the addition of 20
marble powder is very effective in improving segregation resistance provided that 21
water/cement is lower than 0.5. Otherwise, a viscosity-modifying agent should be added to 22
the mixture for adjusting its rheological behavior10-11
. 23
24
8
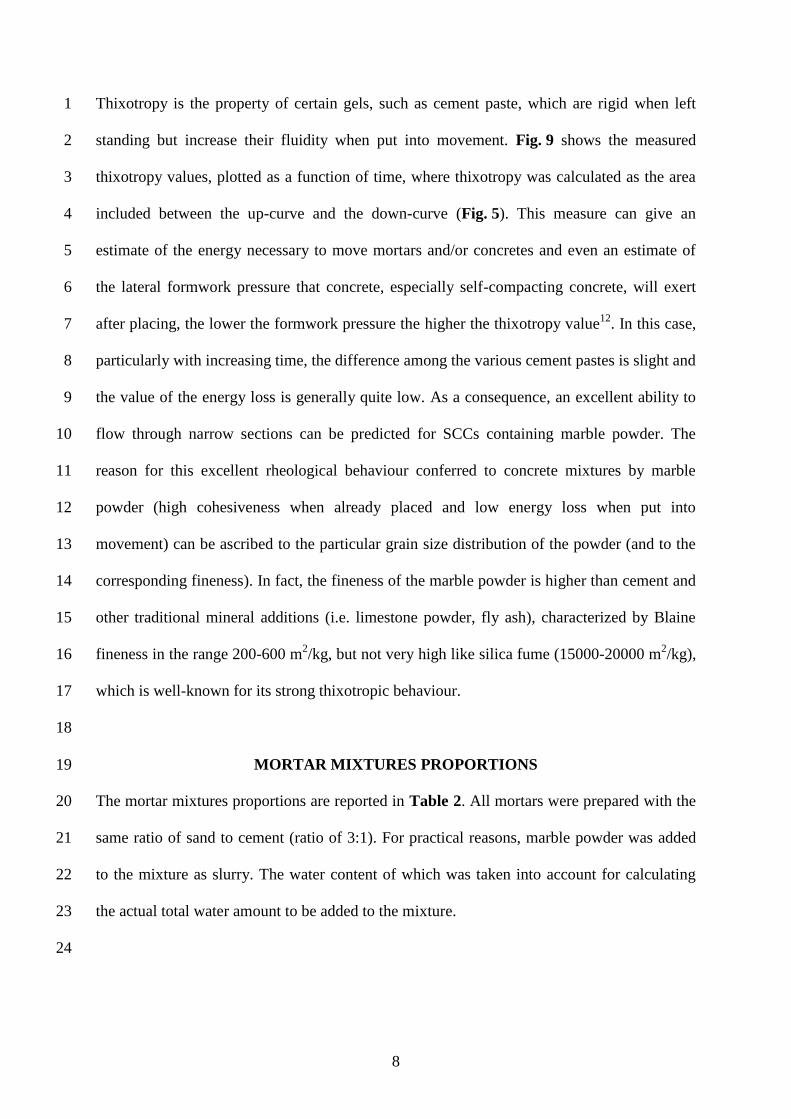
Thixotropy is the property of certain gels, such as cement paste, which are rigid when left 1
standing but increase their fluidity when put into movement. Fig. 9 shows the measured 2
thixotropy values, plotted as a function of time, where thixotropy was calculated as the area 3
included between the up-curve and the down-curve (Fig. 5). This measure can give an 4
estimate of the energy necessary to move mortars and/or concretes and even an estimate of 5
the lateral formwork pressure that concrete, especially self-compacting concrete, will exert 6
after placing, the lower the formwork pressure the higher the thixotropy value12
. In this case, 7
particularly with increasing time, the difference among the various cement pastes is slight and 8
the value of the energy loss is generally quite low. As a consequence, an excellent ability to 9
flow through narrow sections can be predicted for SCCs containing marble powder. The 10
reason for this excellent rheological behaviour conferred to concrete mixtures by marble 11
powder (high cohesiveness when already placed and low energy loss when put into 12
movement) can be ascribed to the particular grain size distribution of the powder (and to the 13
corresponding fineness). In fact, the fineness of the marble powder is higher than cement and 14
other traditional mineral additions (i.e. limestone powder, fly ash), characterized by Blaine 15
fineness in the range 200-600 m2/kg, but not very high like silica fume (15000-20000 m
2/kg), 16
which is well-known for its strong thixotropic behaviour. 17
18
MORTAR MIXTURES PROPORTIONS 19
The mortar mixtures proportions are reported in Table 2. All mortars were prepared with the 20
same ratio of sand to cement (ratio of 3:1). For practical reasons, marble powder was added 21
to the mixture as slurry. The water content of which was taken into account for calculating 22
the actual total water amount to be added to the mixture. 23
24

9
Consistency of fresh mortars was evaluated through the use of a shaking table by measuring 1
the mortar flow. The test was carried out according to the procedure reported in the Italian 2
Norm UNI 7044-72. In this study the flow measure was the same for each mortar and its 3
value was equal to 13. On the other hand, the water content and, consequently, the water to 4
cement ratio are different for the various mortars, keeping constant the fresh mortar fluidity. 5
6
Marble powder was used as a 10% replacement of either cement or 2 sand, with or without an 7
acrylic based superplasticizing admixture, which was added at a dosage of 0.5% by weight of 8
cement. 9
10
PREPARATION AND CURING OF SPECIMENS 11
Prismatic specimens, 40 × 40 × 160 mm (1.575 × 1.575 × 6.300 in.) in size, were 12
manufactured for mechanical tests. These specimens were cast in stainless steel molds and 13
wet cured at 20°C (68°F) until the time of test. 14
15
COMPRESSION TESTS: RESULTS AND DISCUSSION 16
Mechanical behavior of mortars prepared without chemical admixture was studied by 17
compression tests at curing times of 3, 7, 28, and 56 days. Results obtained are reported in 18
Fig. 10. It can be noticed that 10% replacement of either cement or sand with marble powder 19
caused about 10 to 20% compressive strength decrease in late age. However, marble powder 20
used as the replacement of sand performed better (10% decrease) than the case for the marble 21
powder used as the replacement of cement (20% decrease). As a matter of fact, marble 22
powder showed a filler effect (particularly important at early ages) and did not play any 23
noticeable role in the hydration process. A mixture made of water, marble powder, and 24
10
hydrated lime (Ca(OH)2), and cured in sealed air-free environment, was not able to harden 1
after 28 days of observation. 2
3
Compression tests of mortars prepared with superplasticizing admixture were carried out at 4
curing times of 3, 7, and 28 days. The results obtained are reported in Fig. 11. In this case 5
10% replacement of either cement or sand with marble powder caused a small loss (about 6
10%) of strength. In fact, the use of marble powder in combination with superplasticizing 7
admixture allowed for compensating the high water demand of marble powder itself. 8
Consequently, the water to cement ratio could be maintained in order not to compromise the 9
mortar mechanical strength. Again, marble powder used as the replacement of sand 10
performed equal to or better than the case of the marble powder used as the replacement of 11
cement. Figure 11 shows that for early ages compressive strength of reference mortars is 12
lower with respect to other mortars. In fact, the filler effect was enhanced when marble 13
powder was used together with a superplasticizing admixture. Such a synergic effect is quite 14
similar to that found by Bache13
for water-reducing admixtures and silica fume. 15
16
CONCLUSIONS 17
Due to its quite high fineness, marble powder proved to be very effective in assuring very 18
good cohesiveness of mortar and concrete, even in the presence of a superplasticizing 19
admixture, provided that water to cement ratio was adequately low. This was not 20
accompanied by an evident tendency to energy loss during concrete placing, as usual for 21
other ultra-fine mineral additions (such as silica fume) that are able to confer high 22
cohesiveness to the concrete mixture. 23
24

11
In terms of mechanical performance, 10% substitution of sand by the marble powder in the 1
presence of a superplasticizing admixture provided maximum compressive strength at the 2
same workability level, comparable to that of the reference mixture after 28 days of curing. 3
Moreover, an even more positive effect of marble powder is evident at early ages, due to its 4
filler ability. 5
6
Next step of this continuing experimental work is preparation of concretes, fluid and self-7
compacting, by using the marble powder. 8
9
REFERENCES 10
1. Emborg, M., “Rheology Tests for Self-Compacting Concrete – How Useful Are They for 11
the Design of Concrete Mix for Full Scale Production”, Self-Compacting Concrete, RILEM 12
PRO 07, Å. Skarendahl & Ö. Petersson, eds., Stockholm, Sweden, 1999, pp. 95-105. 13
14
2. Saak, A.W., Jennings, H. M. and Shah, S. P. “Characterization of the Rheological 15
Properties of Cement Paste for Use in Self-Compacting Concrete”, Self-Compacting 16
Concrete, RILEM PRO 07, Å. Skarendahl & Ö. Petersson, eds., Stockholm, Sweden, 1999, 17
pp. 83-93. 18
19
3. Saak, A.W., Jennings, H.M. and Shah, S.P., “New Methodology for Designing Self- 20
Compacting Concrete”, ACI Materials Journal, Vol. 98, No. 6, 2001, pp. 429-439. 21
22
4. Corinaldesi, V. and Moriconi, G., “The Influence of Mineral Additions on the Rheology of 23
Self-Compacting Concrete”, Superplasticizers and Other Chemical Admixtures in Concrete, 24

12
SP-217, V. M. Malhotra, ed., American Concrete Institute, Farmington Hills, Mich., 2003, pp. 1
227-240. 2
3
5. Corinaldesi, V. and Moriconi, G., “The Role of Recycled Aggregates in Self-Compacting 4
Concrete”, Fly Ash, Silica Fume, Slag and Natural Pozzolans in Concrete, SP- 221, V. M. 5
Malhotra, ed., American Concrete Institute, Farmington Hills, Mich., 2004, pp. 941-956. 6
7
6. Naik, T. R., Kraus, R. N., Chun, Y. M., Canpolat, F., and Ramme, B. W., “Use of 8
Limestone Quarry By-Products for Developing Economical Self-Compacting Concrete,” 9
published at the CANMET/ACI International Symposium on Sustainable Developments of 10
Cement and Concrete, Toronto, Canada, October 2005. 11
12
7. Bui, V.K., Akkaya, Y. and Shah, S.P., “Rheological Model for Self-Consolidating 13
Concrete”, ACI Materials Journal, Vol. 99, No. 6, 2002, pp. 549-559. 14
15
8. Saak, A.W., Jennings, H.M. and Shah, S.P., “The influence of Wall Slip on Yield Stress 16
and Viscoelastic Measurements of Cement Paste”, Cement and Concrete Research, 31, 2001, 17
pp. 205-212. 18
19
9. Assaad, J., Khayat, K.H. and Mesbah, H., “Variation of Formwork Pressure with 20
Thixotropy of Self-Consolidating Concrete”, ACI Materials Journal, Vol. 100, No. 1, 2003, 21
pp. 29-37. 22
23
10. Khayat, K.H., Guizani, Z., “Use of Viscosity-Modifying Admixture to Enhance Stability 24
of Fluid Concrete”, ACI Materials Journal, Vol. 94, No. 4, 1997, pp. 332-340. 25

13
1
11. Khayat, K.H., “Use of Viscosity-Modifying Admixture to Reduce Top-Bar Effect of 2
Anchored Bars Cast with Fluid Concrete”, ACI Materials Journal, Vol. 95, No. 2, 1998, pp. 3
158-167. 4
5
12. Bui, V.K. and Montgomery, D., “Mixture Proportioning Method for Self-compacting 6
High Performance Concrete with Minimum Paste Volume”, Self-Compacting Concrete, 7
RILEM PRO 07, Å. Skarendahl & Ö. Petersson, eds., Stockholm, Sweden, 1999, pp. 373-8
384. 9
10
13. Bache, H.H., “Densified Cement/Ultra-fine Particle-Based Materials”, Superplasticizers 11
in Concrete, SP-68, V. M. Malhotra, ed., American Concrete Institute, Farmington Hills, 12
Mich., 1981, pp. 3-35. 13
14
APPENDIX 15
The following symbols are used in the paper: 16
d50 = particle diameter for which the cumulative volume is 50% [ m, or in.] 17
d90 = particle diameter for which the cumulative volume is 90% [ m, or in.] 18
= shear stress [Pa, or psi] 19
y = yield stress [Pa, or psi]
20
= plastic viscosity [Pa∙s, or psi∙s] 21
D = shear rate [s-1] 22
23
24
25
14
TABLES AND FIGURES 1
List of Tables: 2
Table 1 – Paste mixture proportions. 3
Table 2 – Mortar mixture proportions. 4
5
List of Figures: 6
Fig. 1 – Grain size distribution of the marble powder by laser diffraction. 7
Fig. 2 – Weight loss of the marble powder slurry verses time. 8
Fig. 3 – Results of the thermogravimetric (TG) and differential thermal analysis (DTA) of the 9
marble powder. 10
Fig. 4 – X-ray diffraction of the marble powder. 11
Fig. 5 – Typical shear stress ( ) verses shear rate (D) of Newtonian or Bingham fluid (A); 12
thixotropy measured by the hysteresis area (B). 13
Fig. 6 – Indication of rheological parameters identified from a real curve. 14
Fig. 7 - Yield Stress values verses time. 15
Fig. 8 - Plastic viscosity values verses time. 16
Fig. 9 - Thixotropy values verses time. 17
Fig. 10 - Compressive strengths vs. curing time for cement mortars without superplasticizer. 18
Fig. 11 - Compressive strengths vs. curing time for cement mortars with superplasticizer. 19
20
21
22
23
24
25

15
Table 1–Paste mixture proportions 1
CEMENT PASTE W/C Cement,
g (lb)
Water,
g (lb)
Marble
Powder,
MP, g
(lb)
Admixture,
ADM, g
(lb)
CEM (0.5) 0.5 100
(0.220)
50
(0.110) - -
CEM+MP10 (0.5) 0.5 90
(0.198)
50
(0.110)
10
(0.022) -
CEM+MP20 (0.5) 0.5 80
(0.176)
50
(0.110)
20
(0.044) -
CEM+ADM (0.5) 0.5 100
(0.220)
50
(0.110) -
0.5
(0.001)
CEM+ADM (0.4) 0.4 100
(0.220)
40
(0.088) -
0.5
(0.001)
CEM+ADM+MP20
(0.5) 0.5 80
50
(0.110)
20
(0.044)
0.5
(0.001)
CEM+ADM+MP20
(0.4) 0.4
80
(0.176)
40
(0.088)
20
(0.044)
0.5
(0.001)
CEM+ADM+MP10
(0.4) 0.4
90
(0.198)
40
(0.088)
10
(0.022)
0.5
(0.001)
2
Table 2–Mortar mixture proportions 3
Mixture REF 10%
CEM
10%
SAND REF+A
10%
CEM+A
10%
SAND+A
W/C 0.61 0.68 0.59 0.48 0.49 0.53
Water, kg/m3 (lb/yd
3) 275 (464)
276
(465)
266
(448)
220
(371)
200
(337) 240 (405)
Cement, kg/m3 (lb/yd
3) 450 (758)
405
(683)
450
(758)
450
(758)
405
(683) 450 (758)
Sand, kg/m3 (lb/yd
3)
1350
(2275)
1350
(2275)
1215
(2048)
1350
(2275)
1350
(2275)
1215
(2048)
Marble Powder, kg/m3
(lb/yd3)
0 45 (76) 135
(228) 0 45 (76) 135 (228)
Chemical Admixture,
kg/m3 (lb/yd
3)
0 0 0 2.25
(3.79)
2.02
(3.40)
2.25
(3.79)
4
5
6

16
1
Fig. 1 – Grain size distribution of the marble powder by laser diffraction. 2
3
4
Fig. 2 – Weight loss of the marble powder slurry verses time. 5
6

17
1
Fig. 3 – Results of the thermogravimetric (TG) and differential thermal analysis (DTA) 2
of the marble powder. 3
4
5
Fig. 4 – X-ray diffraction of the marble powder. 6
7

18
1
Fig. 5 – Typical shear stress ( ) verses shear rate (D) of Newtonian or Bingham fluid (A); 2
thixotropy measured by the hysteresis area (B). 3
4
5
Fig. 6 – Indication of rheological parameters identified from a real curve. 6
19
1
Fig. 7 - Yield Stress values verses time. 2
3

20
1
Fig. 8 - Plastic viscosity values verses time. 2
3

21
1
Fig. 9 - Thixotropy values verses time. 2
3
4

22
1
Fig. 10 - Compressive strengths vs. curing time for cement mortars without 2
superplasticizer. 3
4
5

23
1
Fig. 11 - Compressive strengths vs. curing time for cement mortars with 2
superplasticizer. 3
4