Embed Size (px)
Citation preview
Census of India 2011
State of Literacy AmongAdolescents and Youth Population
Office of the Registrar General & Census Commissioner, IndiaVigyan Bhawan, New Delhi
17-07-2014
Introduction
• The rising and young generation, mainly comprising of
adolescents and youth, occupies a special place in the social
environment.
• Population in the age group 10-19 & 15-24 years are treated as
Adolescents & Youth respectively & constitute about 30% of the
total population in India
• Knowledge and well-being of this important section play major role
in deciding the nation’s future.
Definition
• Literates are defined as persons of 7 years and above who can
both read and write with understanding in any language
• Not necessary to have any formal education to be literate
• Also not necessary to pass any minimum educational standard
• Blind people who can read in Braille are treated as literate
• Literacy rates for adolescent and youth population are the
percentage of literates to total population in the age group 10-19
and 15-24 respectively.
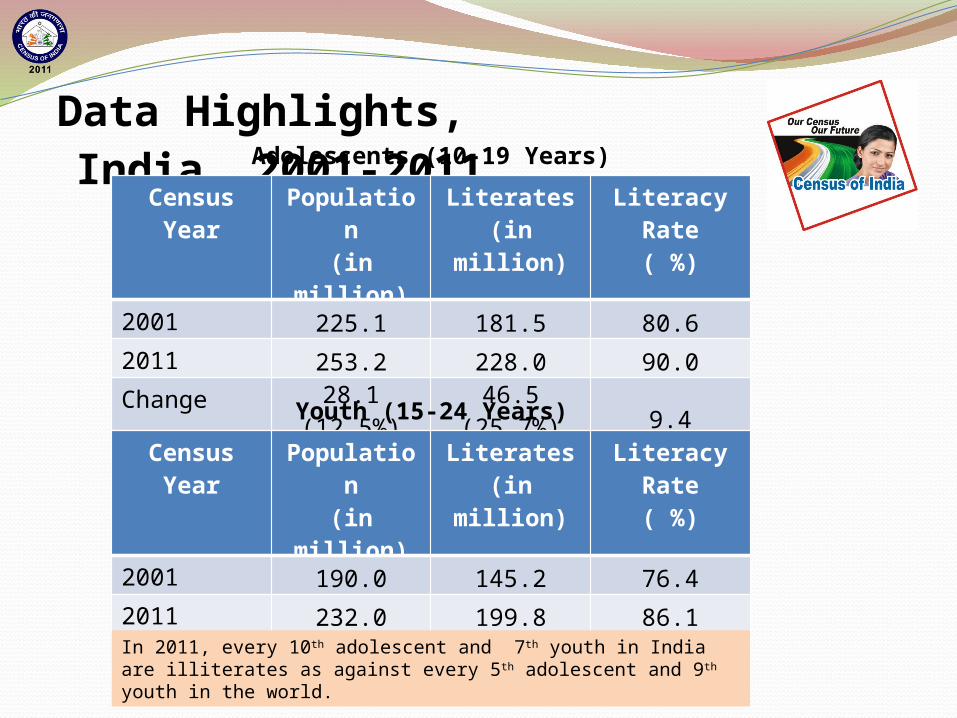
Data Highlights, India, 2001-2011
Census Year Population(in million)
Literates(in million)
Literacy Rate( %)
2001 225.1 181.5 80.62011 253.2 228.0 90.0Change 28.1 (12.5%) 46.5 (25.7%) 9.4
Census Year Population(in million)
Literates(in million)
Literacy Rate( %)
2001 190.0 145.2 76.42011 232.0 199.8 86.1Change 42.0 (22.1%) 54.6 (37.6%) 9.7
Adolescents (10-19 Years)
Youth (15-24 Years)
In 2011, every 10th adolescent and 7th youth in India are illiterates as against every 5th adolescent and 9th youth in the world.
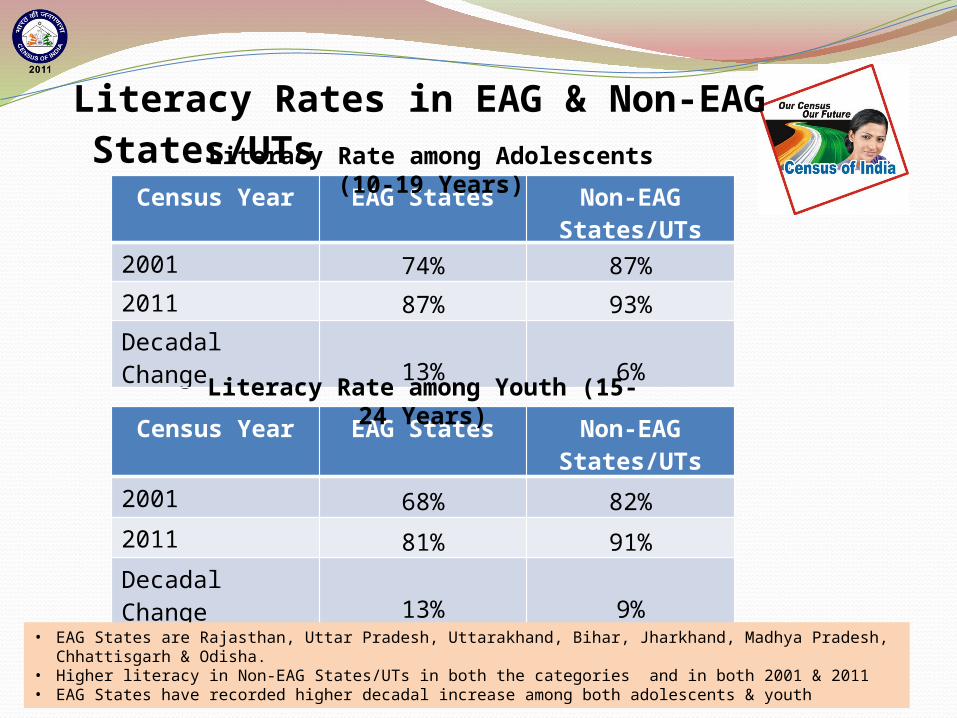
Literacy Rates in EAG & Non-EAG States/UTs
Census Year EAG States Non-EAG States/UTs
2001 74% 87%2011 87% 93%Decadal Change 13% 6%
Census Year EAG States Non-EAG States/UTs
2001 68% 82%2011 81% 91%Decadal Change 13% 9%
Literacy Rate among Adolescents (10-19 Years)
Literacy Rate among Youth (15-24 Years)
• EAG States are Rajasthan, Uttar Pradesh, Uttarakhand, Bihar, Jharkhand, Madhya Pradesh, Chhattisgarh & Odisha.• Higher literacy in Non-EAG States/UTs in both the categories and in both 2001 & 2011• EAG States have recorded higher decadal increase among both adolescents & youth
1961 1971 1981 1991 2001 20110.0
10.0
20.0
30.0
40.0
50.0
60.0
70.0
80.0
90.0
100.0
27.0 23.3 22.3 18.6 10.43.5
40.650.3
56.0
67.4
80.6
90.0
53.4
61.366.5
76.285.5 91.7
26.4
38.044.2 57.6
75.1
88.2
Gender Gap PersonsMales Females
Literacy Rate by Sex, India, 1961-2011Adolescents(10-19 years age group)
1961 1971 1981 1991 2001 20110.0
10.0
20.0
30.0
40.0
50.0
60.0
70.0
80.0
90.0
100.0
30.028.8 26.0
24.2 16.58.2
36.0
48.253.8
61.9
76.4
86.1
50.9
62.166.3
73.5
84.2 90.0
20.9
33.340.3
49.3
67.7
81.8
Gender Gap PersonsMales Females
Literacy Rate by Sex, India, 1961-2011Youth (15-24 years age group)
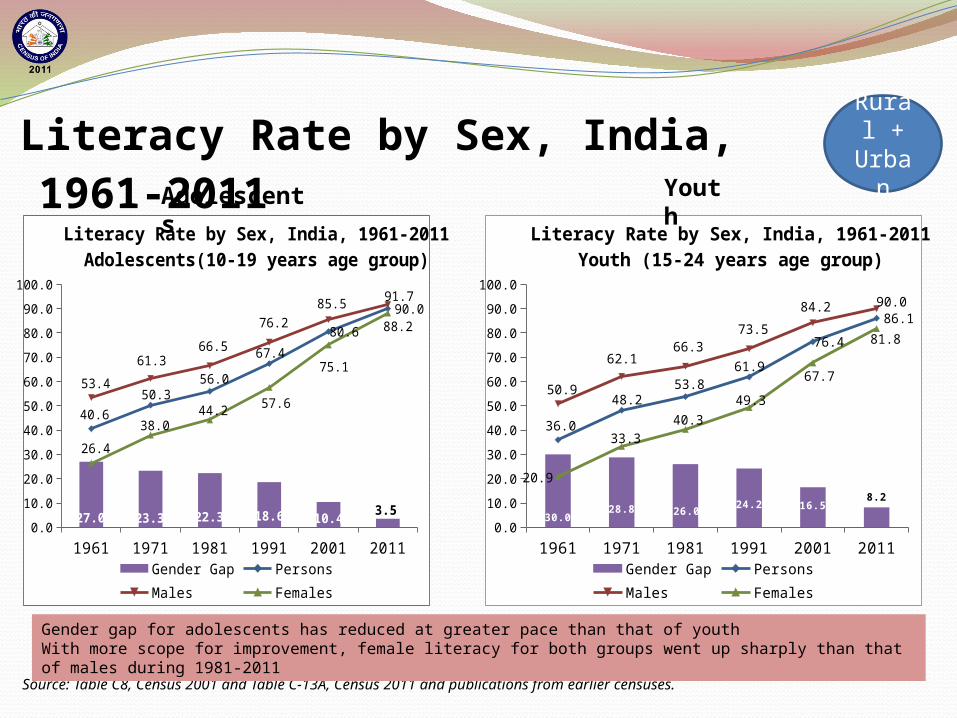
Adolescents Youth
Literacy Rate by Sex, India, 1961-2011 Rural +
Urban
Source: Table C8, Census 2001 and Table C-13A, Census 2011 and publications from earlier censuses.
Gender gap for adolescents has reduced at greater pace than that of youthWith more scope for improvement, female literacy for both groups went up sharply than that of males during 1981-2011
Adolescents Youth
1961 1971 1981 1991 2001 20110.0
10.0
20.0
30.0
40.0
50.0
60.0
70.0
80.0
90.0
100.0
28.7 26.3 26.2 22.8 13.2 4.6
33.9
43.349.1
61.6
77.3
88.9
47.5
55.761.5
72.3
83.591.1
18.8
29.4
35.3
49.5
70.3
86.5
Gender Gap Persons Males Females
Literacy Rate by Sex, India, 1961-2011Adolescents(10-19 years age group)
1961 1971 1981 1991 2001 20110.0
10.0
20.0
30.0
40.0
50.0
60.0
70.0
80.0
90.0
100.0
29.831.1 29.5
28.7 20.9 10.8
28.6
40.245.6
54.7
71.5
83.7
43.7
55.560.0
68.6
81.5 88.8
13.9
24.4
30.5
39.9
60.6
78.0
Gender Gap Persons Males Females
Literacy Rate by Sex, India, 1961-2011Youth (15-24 years age group)
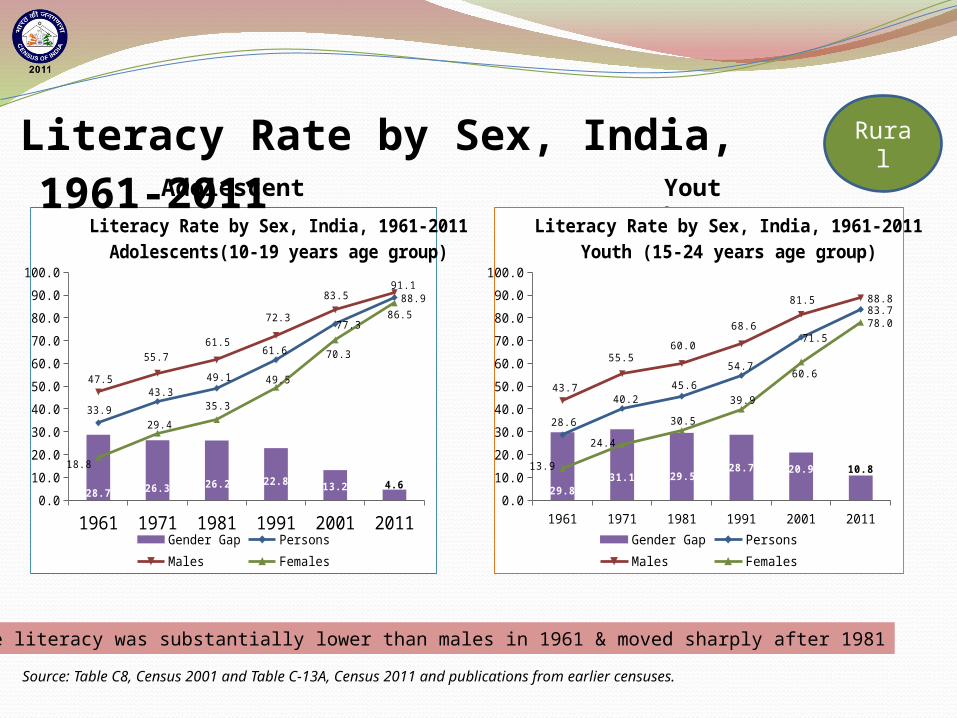
Literacy Rate by Sex, India, 1961-2011 Rural
Source: Table C8, Census 2001 and Table C-13A, Census 2011 and publications from earlier censuses.
Female literacy was substantially lower than males in 1961 & moved sharply after 1981
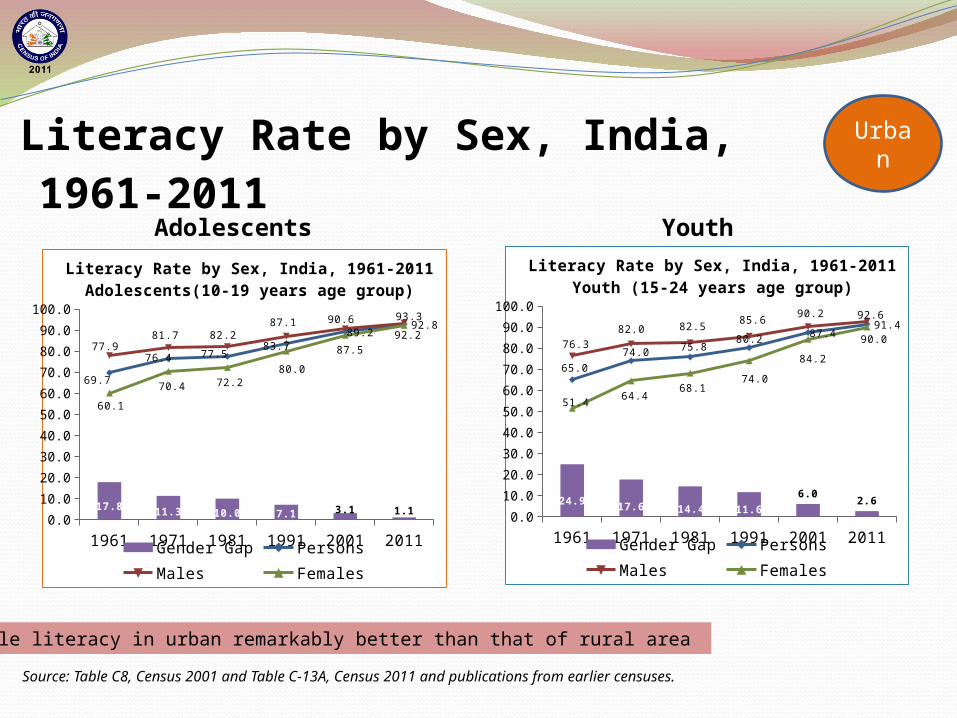
Adolescents Youth
Literacy Rate by Sex, India, 1961-2011 Urban
1961 1971 1981 1991 2001 20110.0
10.0
20.0
30.0
40.0
50.0
60.0
70.0
80.0
90.0
100.0
17.8 11.3 10.0 7.1 3.1 1.1
69.7
76.4 77.583.7
89.292.8
77.981.7 82.2
87.1 90.6 93.3
60.1
70.4 72.280.0
87.592.2
Gender Gap PersonsMales Females
Literacy Rate by Sex, India, 1961-2011Adolescents(10-19 years age group)
1961 1971 1981 1991 2001 20110.0
10.0
20.0
30.0
40.0
50.0
60.0
70.0
80.0
90.0
100.0
24.9 17.6 14.4 11.66.0
2.6
65.074.0 75.8
80.2 87.491.4
76.382.0 82.5
85.690.2 92.6
51.4 64.468.1
74.0
84.2
90.0
Gender Gap PersonsMales Females
Literacy Rate by Sex, India, 1961-2011Youth (15-24 years age group)
Source: Table C8, Census 2001 and Table C-13A, Census 2011 and publications from earlier censuses.
Female literacy in urban remarkably better than that of rural area
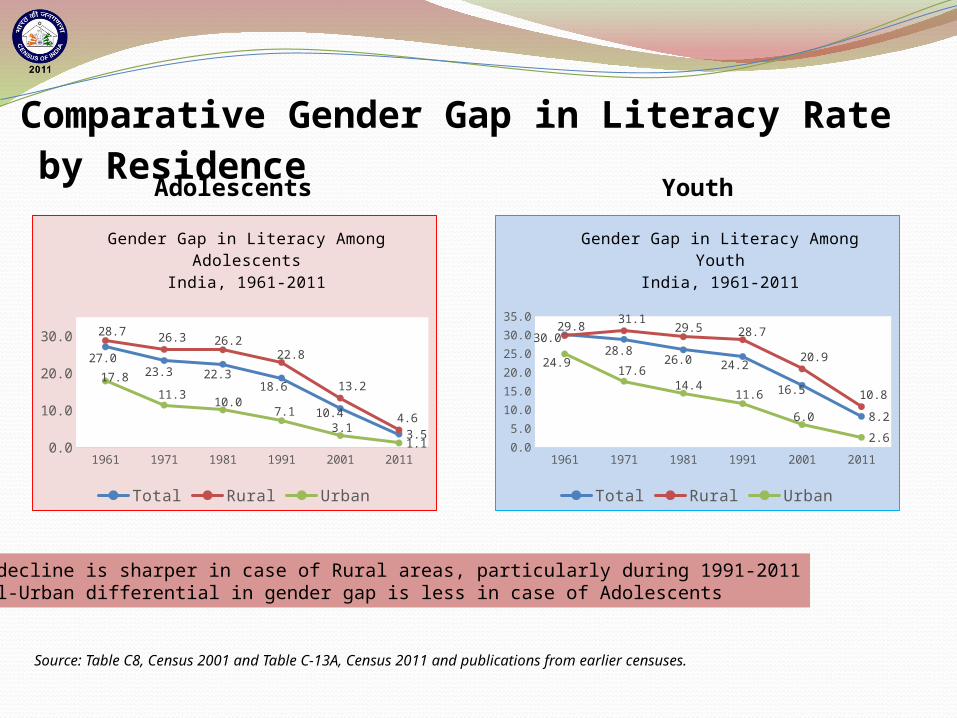
Comparative Gender Gap in Literacy Rate by Residence
Source: Table C8, Census 2001 and Table C-13A, Census 2011 and publications from earlier censuses.
1961 1971 1981 1991 2001 20110.0
5.0
10.0
15.0
20.0
25.0
30.0
35.0
27.0
23.3 22.318.6
10.4
3.5
28.726.3 26.2
22.8
13.2
4.6
17.8
11.310.0
7.1
3.1
1.1
Gender Gap in Literacy Among AdolescentsIndia, 1961-2011
Total Rural Urban
1961 1971 1981 1991 2001 20110.0
5.0
10.0
15.0
20.0
25.0
30.0
35.0
30.028.8
26.024.2
16.5
8.2
29.831.1
29.5 28.7
20.9
10.8
24.917.6
14.411.6
6.0
2.6
Gender Gap in Literacy Among YouthIndia, 1961-2011
Total Rural Urban
Adolescents Youth
• The decline is sharper in case of Rural areas, particularly during 1991-2011• Rural-Urban differential in gender gap is less in case of Adolescents
Source: Table C8, Census 2001 and Table C-13A, Census 2011
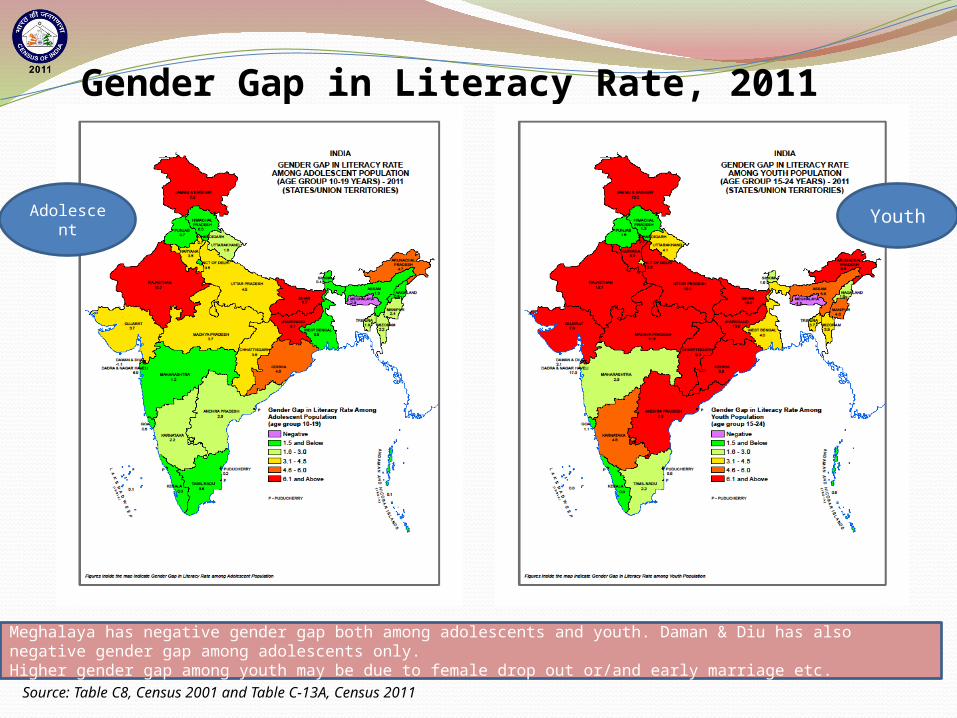
Gender Gap in Literacy Rate, 2011 (States and UTs)
Adolescent Youth
Meghalaya has negative gender gap both among adolescents and youth. Daman & Diu has also negative gender gap among adolescents only.Higher gender gap among youth may be due to female drop out or/and early marriage etc.
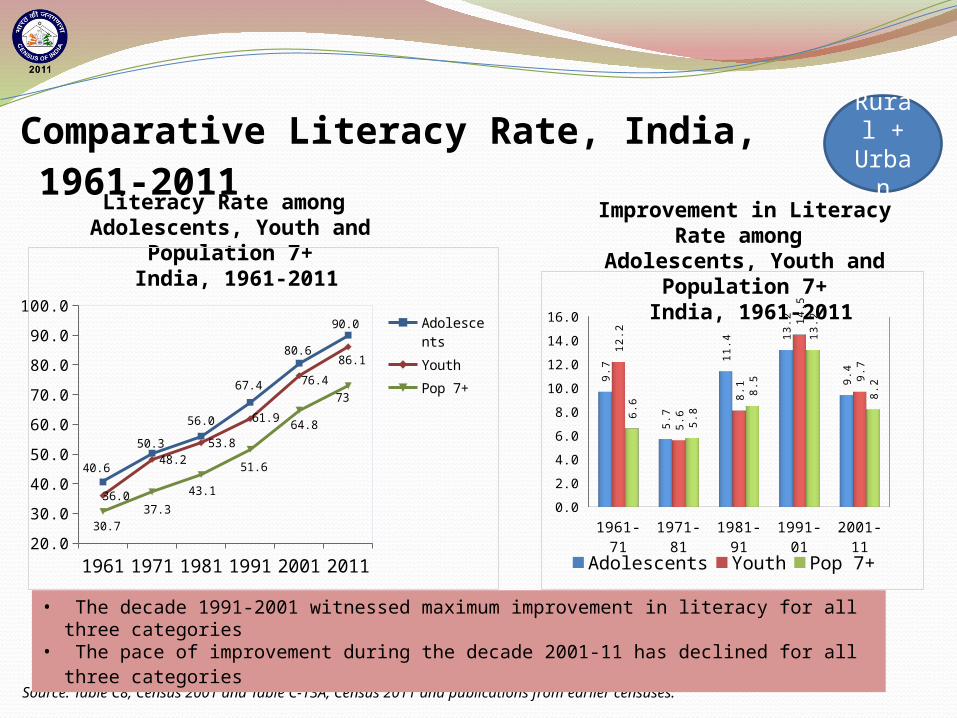
Literacy Rate among Adolescents, Youth and Population 7+
India, 1961-2011
Improvement in Literacy Rate among Adolescents, Youth and Population 7+
India, 1961-2011
Comparative Literacy Rate, India, 1961-2011
1961 1971 1981 1991 2001 201120.0
30.0
40.0
50.0
60.0
70.0
80.0
90.0
100.0
40.6
50.3
56.0
67.4
80.6
90.0
36.0
48.253.8
61.9
76.4
86.1
30.737.3
43.1
51.6
64.8
73
Adolescents
Youth
Pop 7+
1961-71 1971-81 1981-91 1991-01 2001-110.0
2.0
4.0
6.0
8.0
10.0
12.0
14.0
16.0
9.7
5.7
11.4
13.2
9.4
12.2
5.6
8.1
14.5
9.7
6.6
5.8
8.5
13.2
8.2
Adolescents Youth Pop 7+
Source: Table C8, Census 2001 and Table C-13A, Census 2011 and publications from earlier censuses.
Rural +
Urban
• The decade 1991-2001 witnessed maximum improvement in literacy for all three categories• The pace of improvement during the decade 2001-11 has declined for all three categories
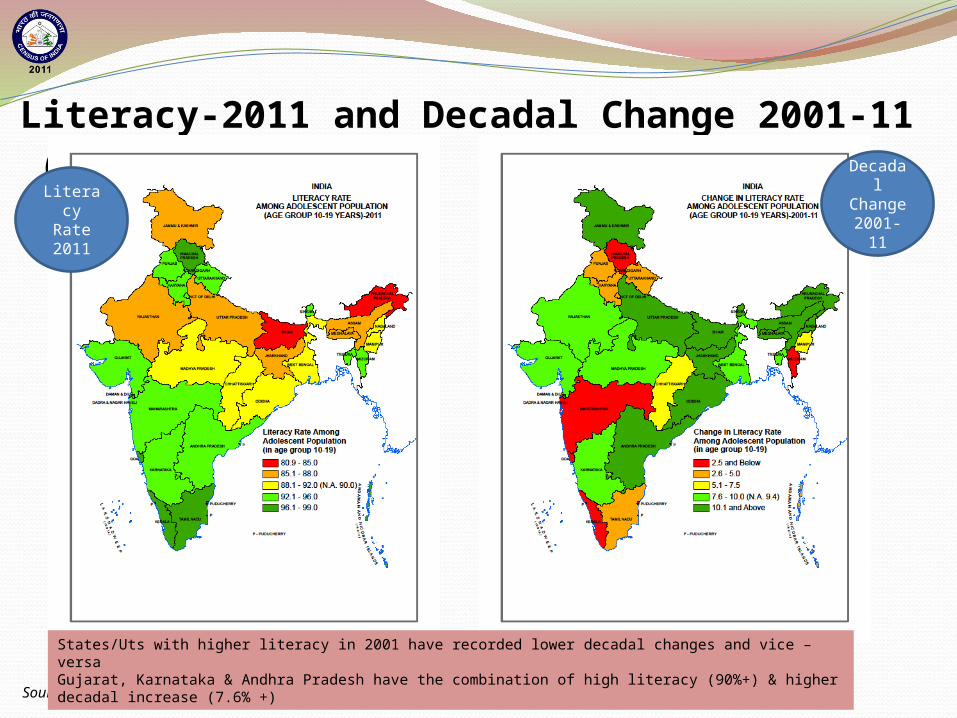
Literacy-2011 and Decadal Change 2001-11 (Adolescents)
Source: Table C8, Census 2001 and Table C-13A, Census 2011
Decadal Change 2001-11
Literacy Rate 2011
States/Uts with higher literacy in 2001 have recorded lower decadal changes and vice –versaGujarat, Karnataka & Andhra Pradesh have the combination of high literacy (90%+) & higher decadal increase (7.6% +)
Source: Table C8, Census 2001 and Table C-13A, Census 2011
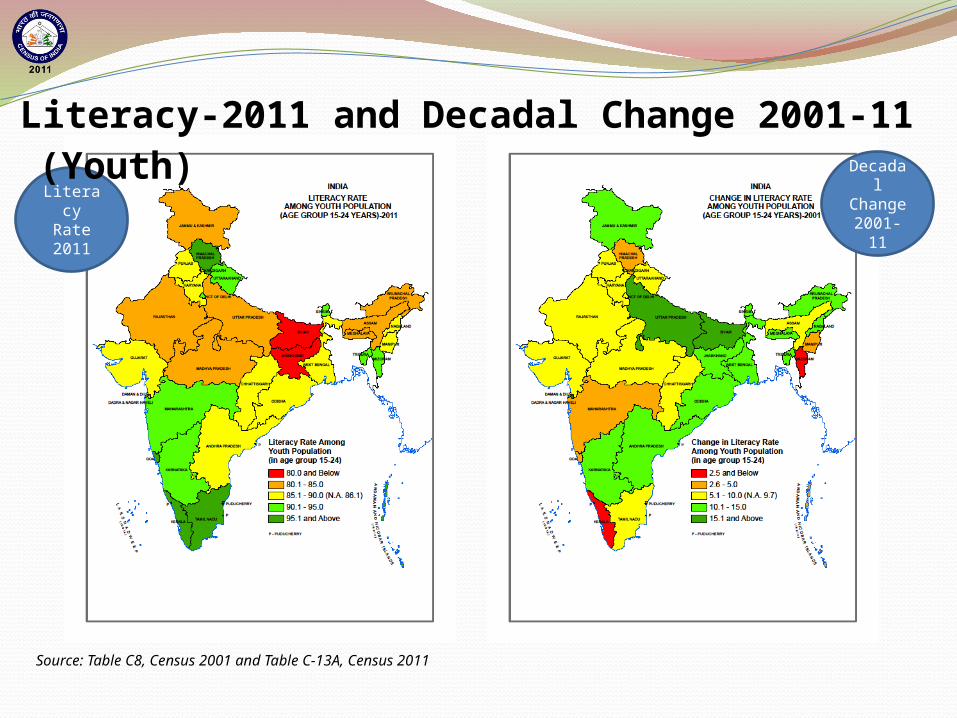
Decadal Change 2001-11
Literacy Rate 2011
Literacy-2011 and Decadal Change 2001-11 (Youth)
Source: Table C8, Census 2001 and Table C-13A, Census 2011
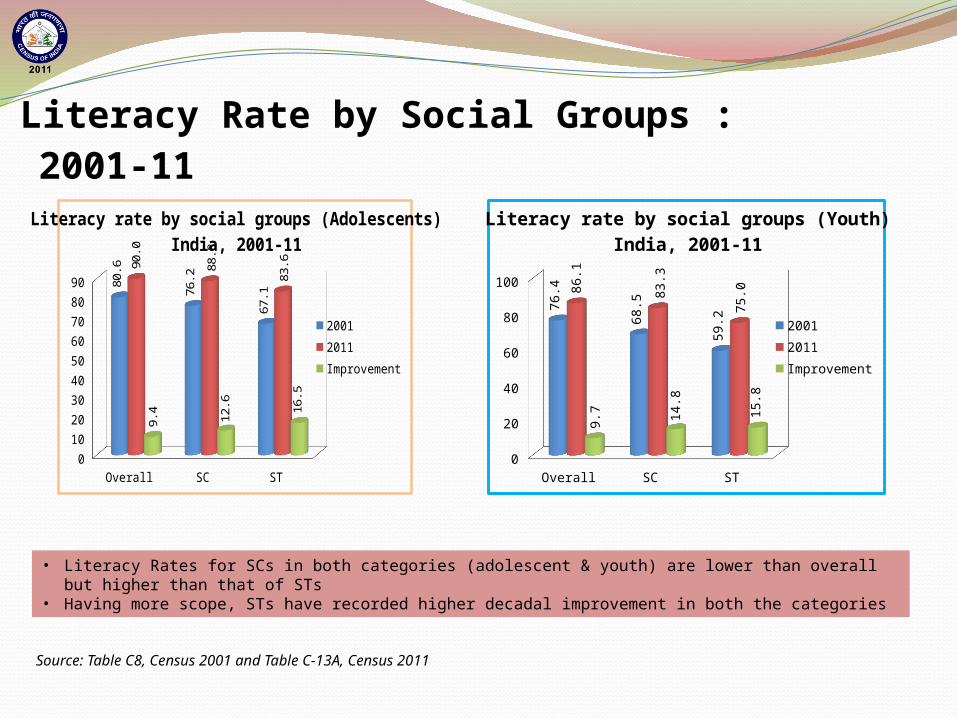
Literacy Rate by Social Groups : 2001-11
Overall SC ST0
102030405060708090 80
.6
76.2
67.1
90.0
88.8
83.6
9.4 12
.6 16.5
20012011Improvement
Literacy rate by social groups (Adolescents)India, 2001-11
Overall SC ST0
102030405060708090
100
76.4
68.5
59.2
86.1
83.3
75.0
9.7 14
.8
15.8
20012011Improvement
Literacy rate by social groups (Youth)India, 2001-11
• Literacy Rates for SCs in both categories (adolescent & youth) are lower than overall but higher than that of STs • Having more scope, STs have recorded higher decadal improvement in both the categories
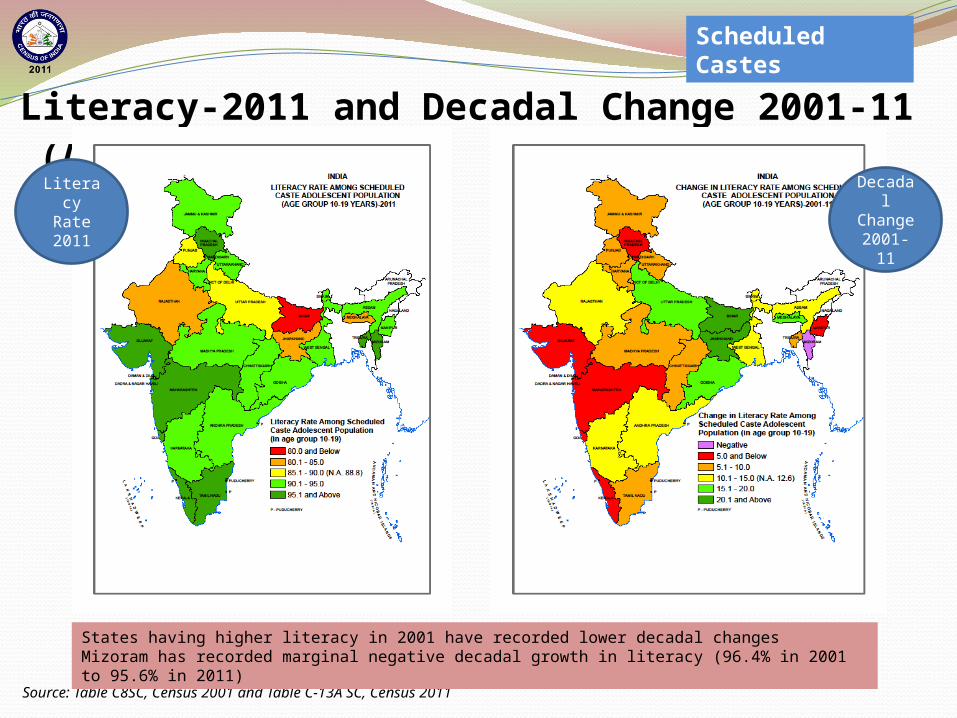
Literacy-2011 and Decadal Change 2001-11 (Adolescents)
Source: Table C8SC, Census 2001 and Table C-13A SC, Census 2011
Scheduled Castes
Literacy Rate 2011
Decadal Change 2001-11
States having higher literacy in 2001 have recorded lower decadal changesMizoram has recorded marginal negative decadal growth in literacy (96.4% in 2001 to 95.6% in 2011)
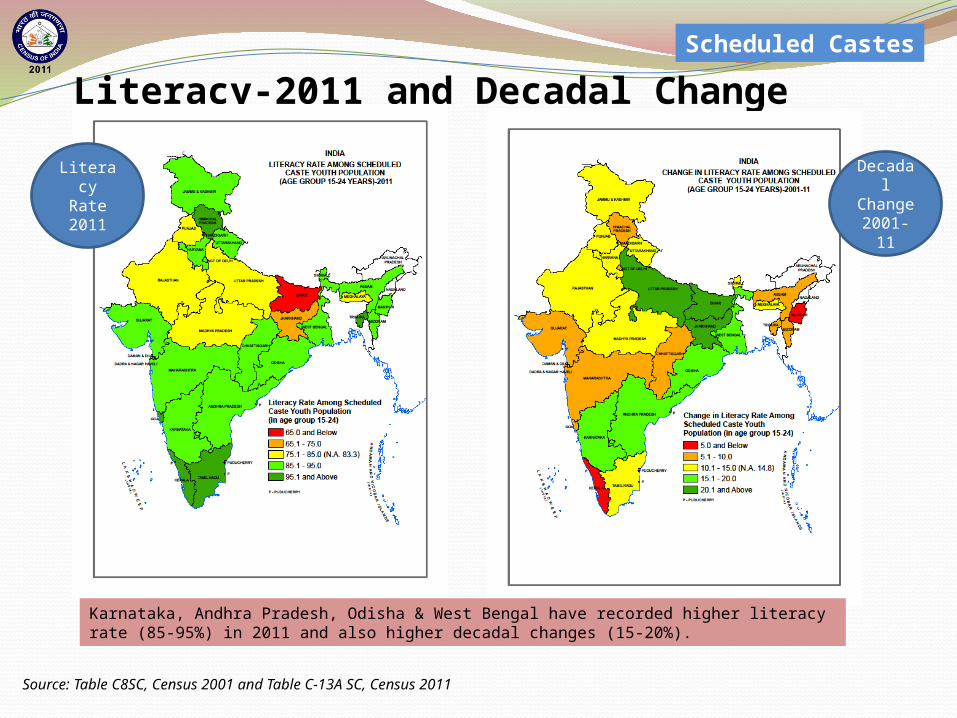
Literacy-2011 and Decadal Change 2001-11 (Youth)Scheduled Castes
Source: Table C8SC, Census 2001 and Table C-13A SC, Census 2011
Literacy Rate 2011
Decadal Change 2001-11
Karnataka, Andhra Pradesh, Odisha & West Bengal have recorded higher literacy rate (85-95%) in 2011 and also higher decadal changes (15-20%).
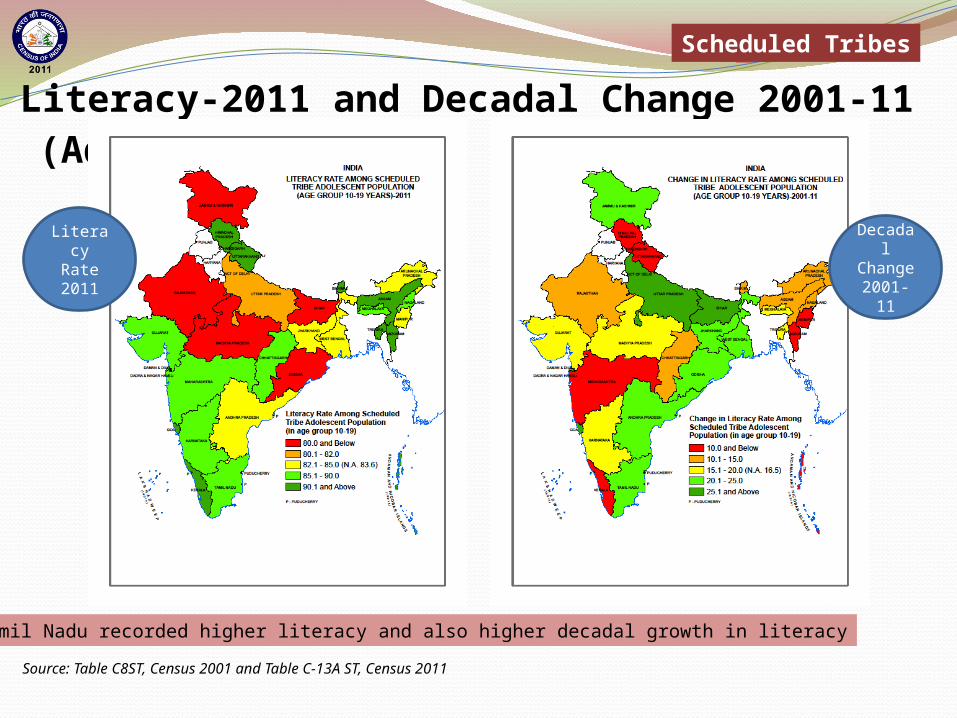
Literacy-2011 and Decadal Change 2001-11 (Adolescents)
Source: Table C8ST, Census 2001 and Table C-13A ST, Census 2011
Scheduled Tribes
Literacy Rate 2011
Decadal Change 2001-11
Tamil Nadu recorded higher literacy and also higher decadal growth in literacy
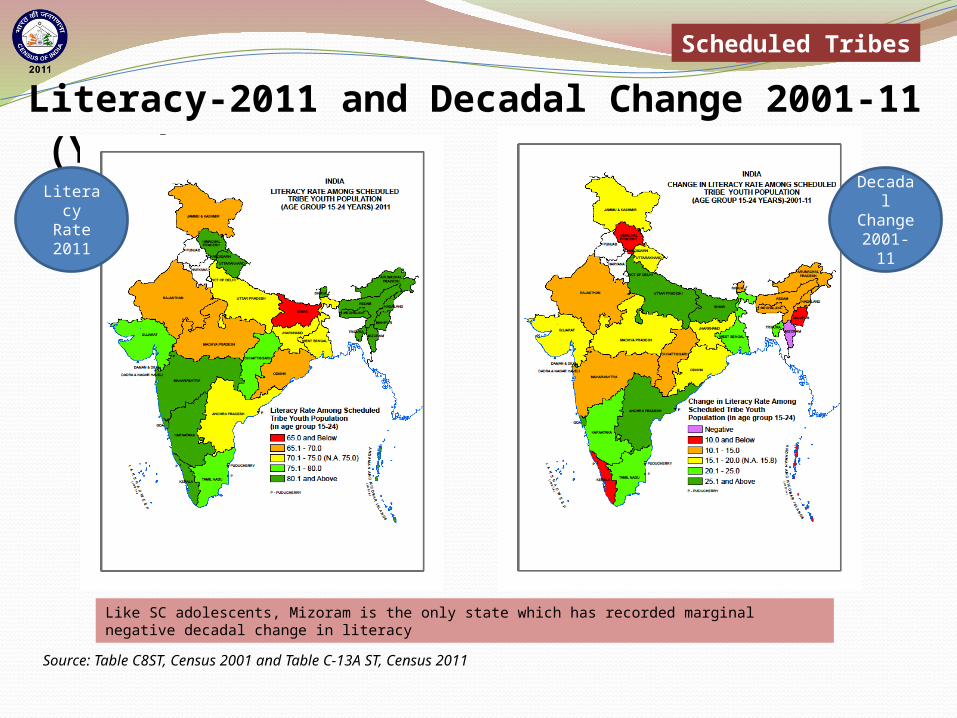
Literacy-2011 and Decadal Change 2001-11 (Youth)
Scheduled Tribes
Source: Table C8ST, Census 2001 and Table C-13A ST, Census 2011
Literacy Rate 2011
Decadal Change 2001-11
Like SC adolescents, Mizoram is the only state which has recorded marginal negative decadal change in literacy
Thank You
Office of the Registrar General & Census Commissioner, India2-A, Man Singh Road, New Delhi – 110011
Website: www.censusindia.gov.in
E-mail: [email protected]