Embed Size (px)
Citation preview

Census of Aquaculture (2013) Volume 3 Special Studies Part 2 AC-12-SS-2 Issued September 2014
United States Department of Agriculture
Tom Vilsack, Secretary National Agricultural Statistics Service
Joseph T. Reilly, Administrator

2012 Census of Agriculture CONTENTS III USDA, National Agricultural Statistics Service
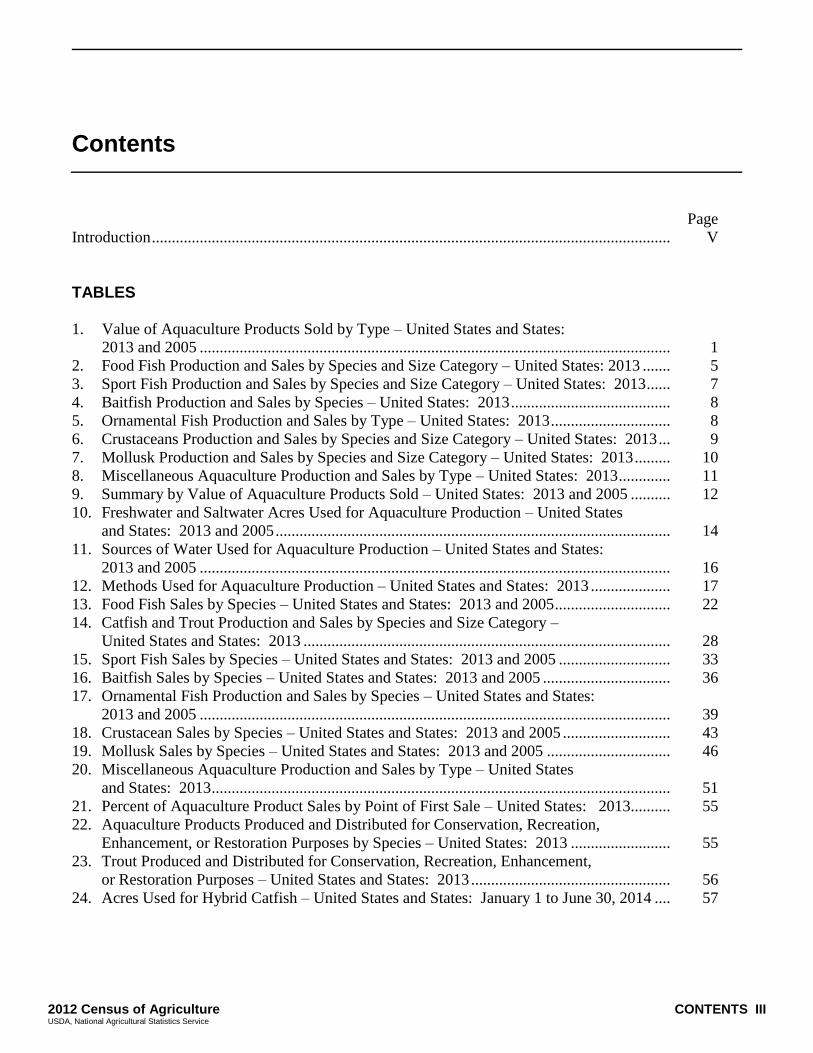
Contents
Page
Introduction .................................................................................................................................. V
TABLES 1. Value of Aquaculture Products Sold by Type – United States and States:
2013 and 2005 ...................................................................................................................... 1
2. Food Fish Production and Sales by Species and Size Category – United States: 2013 ....... 5
3. Sport Fish Production and Sales by Species and Size Category – United States: 2013 ...... 7
4. Baitfish Production and Sales by Species – United States: 2013 ........................................ 8
5. Ornamental Fish Production and Sales by Type – United States: 2013 .............................. 8
6. Crustaceans Production and Sales by Species and Size Category – United States: 2013 ... 9
7. Mollusk Production and Sales by Species and Size Category – United States: 2013 ......... 10
8. Miscellaneous Aquaculture Production and Sales by Type – United States: 2013 ............. 11
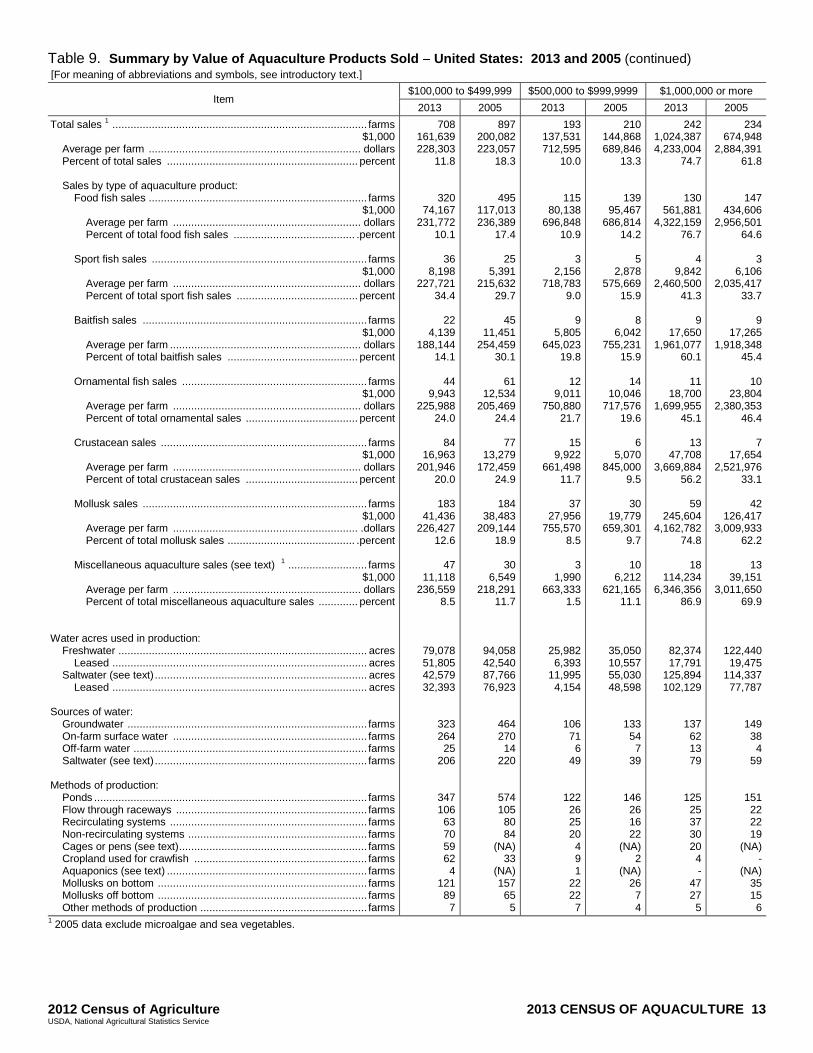
9. Summary by Value of Aquaculture Products Sold – United States: 2013 and 2005 .......... 12
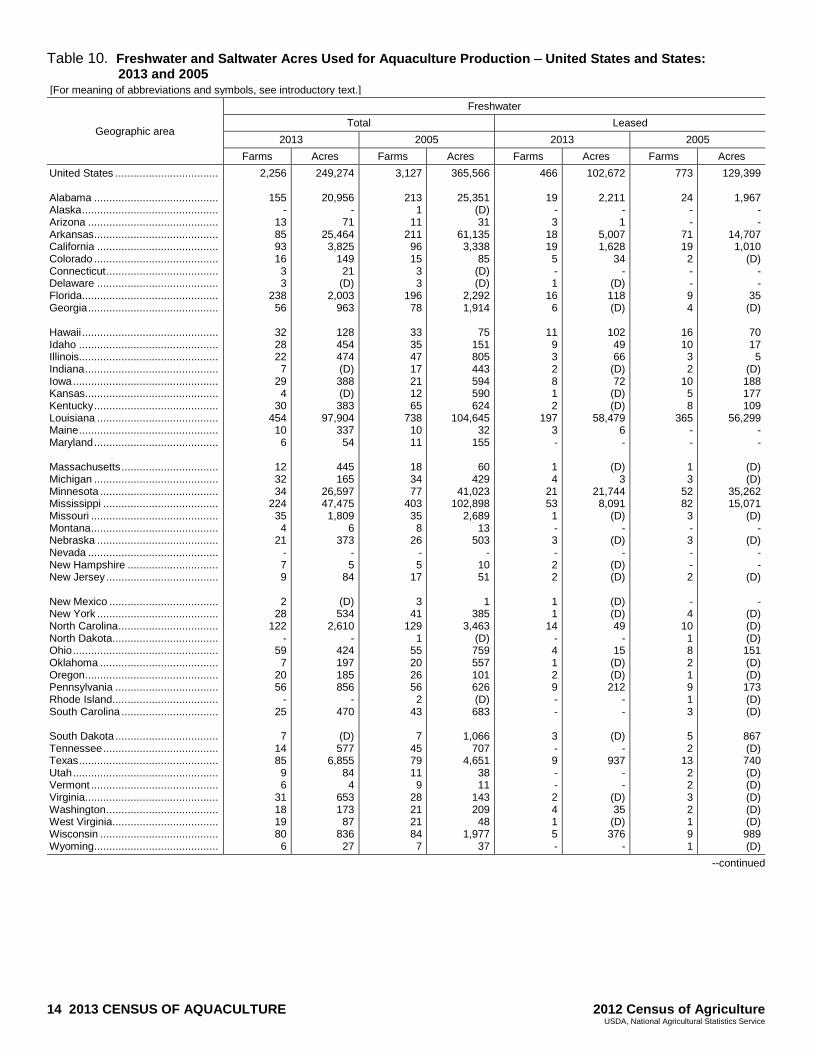
10. Freshwater and Saltwater Acres Used for Aquaculture Production – United States
and States: 2013 and 2005 ................................................................................................... 14
11. Sources of Water Used for Aquaculture Production – United States and States:
2013 and 2005 ...................................................................................................................... 16
12. Methods Used for Aquaculture Production – United States and States: 2013 .................... 17
13. Food Fish Sales by Species – United States and States: 2013 and 2005 ............................. 22
14. Catfish and Trout Production and Sales by Species and Size Category –
United States and States: 2013 ............................................................................................ 28
15. Sport Fish Sales by Species – United States and States: 2013 and 2005 ............................ 33
16. Baitfish Sales by Species – United States and States: 2013 and 2005 ................................ 36
17. Ornamental Fish Production and Sales by Species – United States and States:
2013 and 2005 ...................................................................................................................... 39
18. Crustacean Sales by Species – United States and States: 2013 and 2005 ........................... 43
19. Mollusk Sales by Species – United States and States: 2013 and 2005 ............................... 46
20. Miscellaneous Aquaculture Production and Sales by Type – United States
and States: 2013 ................................................................................................................... 51
21. Percent of Aquaculture Product Sales by Point of First Sale – United States: 2013.......... 55
22. Aquaculture Products Produced and Distributed for Conservation, Recreation,
Enhancement, or Restoration Purposes by Species – United States: 2013 ......................... 55
23. Trout Produced and Distributed for Conservation, Recreation, Enhancement,
or Restoration Purposes – United States and States: 2013 .................................................. 56
24. Acres Used for Hybrid Catfish – United States and States: January 1 to June 30, 2014 .... 57
IV CONTENTS 2012 Census of Agriculture USDA, National Agricultural Statistics Service
APPENDICES
A. Statistical Methodology ....................................................................................................... A-1
B. General Explanation and Census of Aquaculture Report Form .......................................... B-1
Publication Program ................................................................................................. Inside back cover
2012 Census of Agriculture INTRODUCTION V USDA, National Agricultural Statistics Service
Introduction
The 2013 Census of Aquaculture expanded the
aquaculture data collected from the 2012 Census of
Agriculture and provides a current and
comprehensive picture of the aquaculture sector at
the state and national level. The aquaculture census
collects detailed information relating to production
methods, surface water acres and sources,
production, sales, point of first sale outlets, and
aquaculture distributed for restoration, conservation,
enhancement, or recreational purposes.
HISTORY The 2013 Census of Aquaculture is the third national
census conducted by the U.S. Department of
Agriculture (USDA), National Agricultural Statistics
Service (NASS), to collect data about the industry.
The first aquaculture census was conducted in 1998,
in response to the intense need for an accurate
measure of the aquaculture sector. The second
aquaculture census was conducted in 2005. The
census of agriculture has collected limited
aquaculture data since 1974. NASS also publishes
semi-annual catfish production, and annual trout
surveys.
USES OF CENSUS OF AQUACULTURE DATA The census of aquaculture data are used by all those
involved in the aquaculture sector – Federal, State
and local governments, agribusinesses, trade
associations, producers, and many others. Uses of
the data include:
• Legislators use census data to shape policies and
programs, and to evaluate and determine
government funding and resources.
• Aquaculture businesses and suppliers use the
data to determine the locations of facilities that
will serve producers and plan for the production
and marketing of new products.
• Extension and university representatives use the
data to determine research needs and to justify
research funding for programs to develop new
and improved methods of aquaculture production
and profitability.
• Growers use census data to make informed
decisions for their operations.
• Evaluating historical agricultural trends to
formulate farm and rural policies and develop
programs that help agricultural producers.
• Allocating local and national funds for farm
programs, e.g. extension service projects,
agricultural research, soil conservation programs,
and land-grant colleges and universities.
• Identifying the assets needed to support
agricultural production such as land, buildings,
machinery, and other equipment.
• Creating an extensive database of information on
uncommon crops and livestock and the value of
those commodities for assessing the need to
develop policies and programs to support those
commodities.
• Providing geographic data on production so
agribusinesses will locate near major production
areas for efficiencies for both producers and
agribusinesses.
• Measuring the usage of modern technologies
such as conservation practices, organic
production, renewable energy systems, internet
access, and specialized marketing strategies.
VI INTRODUCTION 2012 Census of Agriculture USDA, National Agricultural Statistics Service
• Developing new and improved methods to
increase agricultural production and profitability.
AUTHORITY The census of agriculture is required by law under
the "Census of Agriculture Act of 1997," Public Law
105-113 (Title 7, United States Code, Section
2204g). The law authorizes the Secretary of
Agriculture to conduct surveys deemed necessary to
furnish annual or other data on the subjects covered
by the census. The 2013 Census of Aquaculture was
conducted under the provisions of this section.
FARM DEFINITION Aquaculture is defined as the farming of aquatic
organisms, including: baitfish, crustaceans, food fish,
mollusks, ornamental fish, sport or game fish, and
other aquaculture products. Farming involves some
form of intervention in the rearing process, such as
seeding, stocking, feeding, protection from
predators, etc. Farming also implies individual or
corporate ownership of the stock being cultivated, in
a controlled environment at least part of the time.
Fish, shellfish, and other aquatic products which are
caught or harvested by the public from non-
controlled waters or beds are considered wild caught
and are NOT included as aquaculture farms. In
addition, aquatic plants, except algae and sea
vegetables, are not considered as aquaculture for the
2013 Census of Aquaculture. For the 2013 Census of
Aquaculture, an aquaculture farm is defined as any
place from which $1,000 or more of aquaculture
products were produced and sold or distributed for
conservation, enhancement, or recreation during the
census year.
TABLES AND APPENDICES Tables. Table 1 shows the number of farms and the
market value of aquaculture products sold for the
U.S. and each State. Tables 2, 3, 6 and 7 provide
summaries of aquaculture products sold by species
and size category at the U.S. level. Tables 4, 5, and 8
provide summaries of aquaculture products sold by
species at the U.S. level. Table 9 provides a
summary by value of aquaculture products sold at
the U.S. level. Tables 10 – 21 and Table 24 present
selected data items for operations with sales of
aquaculture products at the U.S. and State level.
Tables 22 and 23 provide information at the U.S. and
State level by species for operations that distributed
aquaculture products for conservation, restoration,
enhancement, or recreational purposes. Table 24
provides data for acres used for hybrid catfish
production at the U.S. and State level. Throughout
the publication average weight and average price
data are published. These values are based on the
number of fish sold, pounds sold, and total sales at
the U.S. and State level. Average weight and average
price data may vary considerably among farms due
to different size, use, or marketing channels.
Appendix A. Provides information about the
statistical methodology, including data collection
and data processing activities, used in conducting
and evaluating the census.
Appendix B. Includes definitions of terms used in
this publication, including items in the publication
tables that carry the note “see text.” It also provides
facsimiles of the report form and instruction sheet
used to collect data.
RESPONDENT CONFIDENTIALITY In keeping with the provisions of Title 7 of the
United States Code, no data are published that would
disclose information about the operations of an
individual farm unless there is specific written
permission. All tabulated data are subjected to an
extensive disclosure review prior to publication. Any
tabulated item that identifies data reported by a
respondent or allows a respondent's data to be
accurately estimated or derived, was suppressed and
coded with a 'D'. However, the number of farms
reporting an item is not considered confidential
information and is provided even though other
information is withheld.
SPECIAL STUDIES AND CUSTOM TABULATIONS
Special studies such as the 2013 Census of
Aquaculture and the 2013 Farm and Ranch Irrigation
Survey are part of the census program and provide
supplemental information to the 2012 Census of
Agriculture in the respective subject area. Results are
published on the internet.
2012 Census of Agriculture INTRODUCTION VII USDA, National Agricultural Statistics Service
Custom-designed tabulations may be developed
when data are not published elsewhere. These
tabulations are developed to individual user
specifications on a cost-reimbursable basis and
shared with the public. Quick Stats, NASS’s online
database that allows data users to build customized
queries, should be investigated before requesting a
custom tabulation.
All special studies and custom tabulations are subject
to a thorough disclosure review prior to release to
prevent the disclosure of any individual respondent
data. Requests for custom tabulations can be
submitted via the internet from the NASS home
page, by mail, or by e-mail to:
Data Lab
National Agricultural Statistics Service
Room 6436A, Stop 2054
1400 Independence Avenue, S.W.
Washington, D.C. 20250-2054
or
ABBREVIATIONS AND SYMBOLS The following abbreviations and symbols are used
throughout the tables:
( - ) Represents zero.
(D) Withheld to avoid disclosing data for
individual farms.
(H) Coefficient of variation is greater than
or equal to 99.95 percent or the standard
error is greater than or equal to 99.95
percent of mean.
(L) Coefficient of variation is less than
0.05 percent or the standard error
is less than 0.05 percent of the mean.
(NA) Not available.
(X) Not applicable.
(Z) Less than half the unit shown.

2012 Census of Agriculture 2013 CENSUS OF AQUACULTURE 1 USDA, National Agricultural Statistics Service
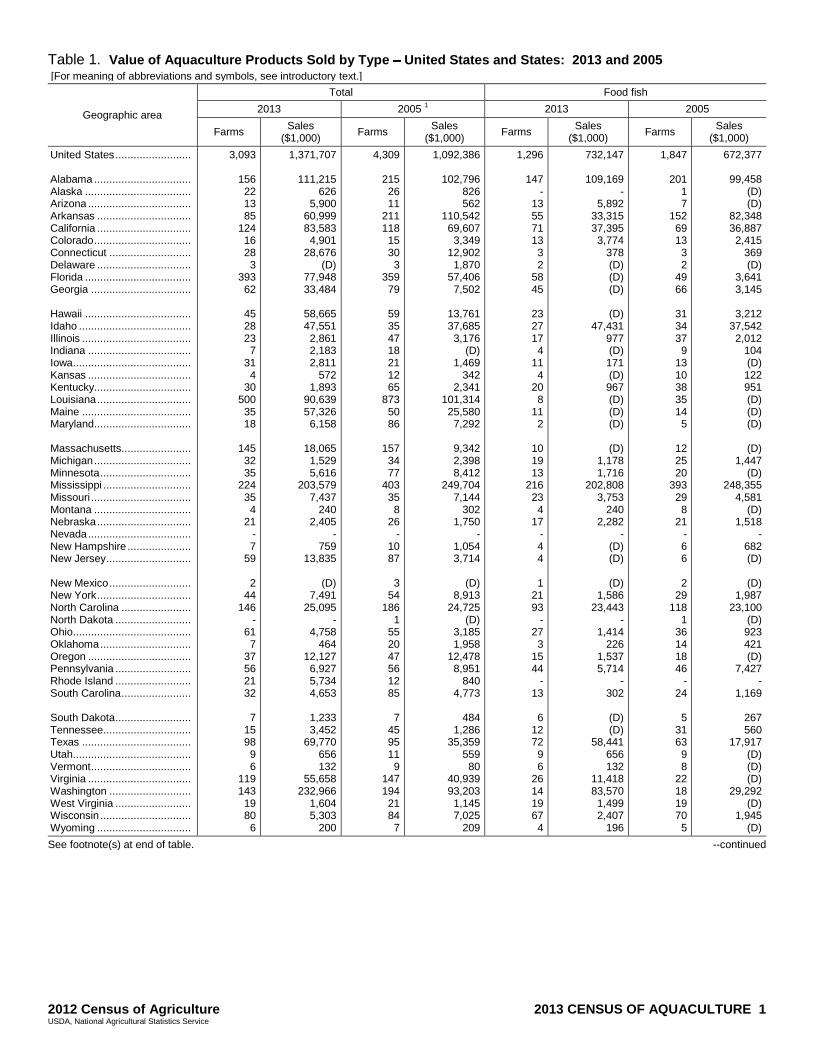
Table 1. Value of Aquaculture Products Sold by Type United States and States: 2013 and 2005 [For meaning of abbreviations and symbols, see introductory text.]
Geographic area
Total Food fish
2013 2005 1 2013 2005
Farms Sales
($1,000) Farms
Sales ($1,000)
Farms Sales
($1,000) Farms
Sales ($1,000)
United States ......................... Alabama ................................ Alaska ................................... Arizona .................................. Arkansas ............................... California ............................... Colorado ................................ Connecticut ........................... Delaware ............................... Florida ................................... Georgia ................................. Hawaii ................................... Idaho ..................................... Illinois .................................... Indiana .................................. Iowa....................................... Kansas .................................. Kentucky................................ Louisiana ............................... Maine .................................... Maryland................................ Massachusetts....................... Michigan ................................ Minnesota .............................. Mississippi ............................. Missouri ................................. Montana ................................ Nebraska ............................... Nevada .................................. New Hampshire ..................... New Jersey ............................ New Mexico ........................... New York ............................... North Carolina ....................... North Dakota ......................... Ohio....................................... Oklahoma .............................. Oregon .................................. Pennsylvania ......................... Rhode Island ......................... South Carolina ....................... South Dakota ......................... Tennessee ............................. Texas .................................... Utah....................................... Vermont ................................. Virginia .................................. Washington ........................... West Virginia ......................... Wisconsin .............................. Wyoming ...............................
3,093
156 22 13 85
124 16 28 3
393 62
45 28 23 7
31 4
30 500 35 18
145 32 35
224 35 4
21 - 7
59
2 44
146 -
61 7
37 56 21 32
7
15 98 9 6
119 143 19 80 6
1,371,707
111,215 626
5,900 60,999 83,583 4,901
28,676 (D)
77,948 33,484
58,665 47,551 2,861 2,183 2,811
572 1,893
90,639 57,326 6,158
18,065 1,529 5,616
203,579 7,437
240 2,405
- 759
13,835
(D) 7,491
25,095 -
4,758 464
12,127 6,927 5,734 4,653
1,233 3,452
69,770 656 132
55,658 232,966
1,604 5,303
200
4,309
215 26 11
211 118 15 30 3
359 79
59 35 47 18 21 12 65
873 50 86
157 34 77
403 35 8
26 -
10 87
3
54 186
1 55 20 47 56 12 85
7
45 95 11 9
147 194 21 84 7
1,092,386
102,796 826 562
110,542 69,607 3,349
12,902 1,870
57,406 7,502
13,761 37,685 3,176
(D) 1,469
342 2,341
101,314 25,580 7,292
9,342 2,398 8,412
249,704 7,144
302 1,750
- 1,054 3,714
(D)
8,913 24,725
(D) 3,185 1,958
12,478 8,951
840 4,773
484
1,286 35,359
559 80
40,939 93,203 1,145 7,025
209
1,296
147 -
13 55 71 13 3 2
58 45
23 27 17 4
11 4
20 8
11 2
10 19 13
216 23 4
17 - 4 4
1 21 93
- 27 3
15 44
- 13
6
12 72 9 6
26 14 19 67 4
732,147
109,169 -
5,892 33,315 37,395 3,774
378 (D) (D) (D)
(D)
47,431 977 (D) 171 (D) 967 (D) (D) (D)
(D)
1,178 1,716
202,808 3,753
240 2,282
- (D) (D)
(D)
1,586 23,443
- 1,414
226 1,537 5,714
- 302
(D) (D)
58,441 656 132
11,418 83,570 1,499 2,407
196
1,847
201 1 7
152 69 13 3 2
49 66
31 34 37 9
13 10 38 35 14 5
12 25 20
393 29 8
21 - 6 6
2 29
118 1
36 14 18 46
- 24
5
31 63 9 8
22 18 19 70 5
672,377
99,458 (D) (D)
82,348 36,887 2,415
369 (D)
3,641 3,145
3,212
37,542 2,012
104 (D) 122 951 (D) (D) (D)
(D)
1,447 (D)
248,355 4,581
(D) 1,518
- 682 (D)
(D)
1,987 23,100
(D) 923 421 (D)
7,427 -
1,169
267 560
17,917 (D) (D) (D)
29,292 (D)
1,945 (D)
See footnote(s) at end of table. --continued
2 2013 CENSUS OF AQUACULTURE 2012 Census of Agriculture USDA, National Agricultural Statistics Service
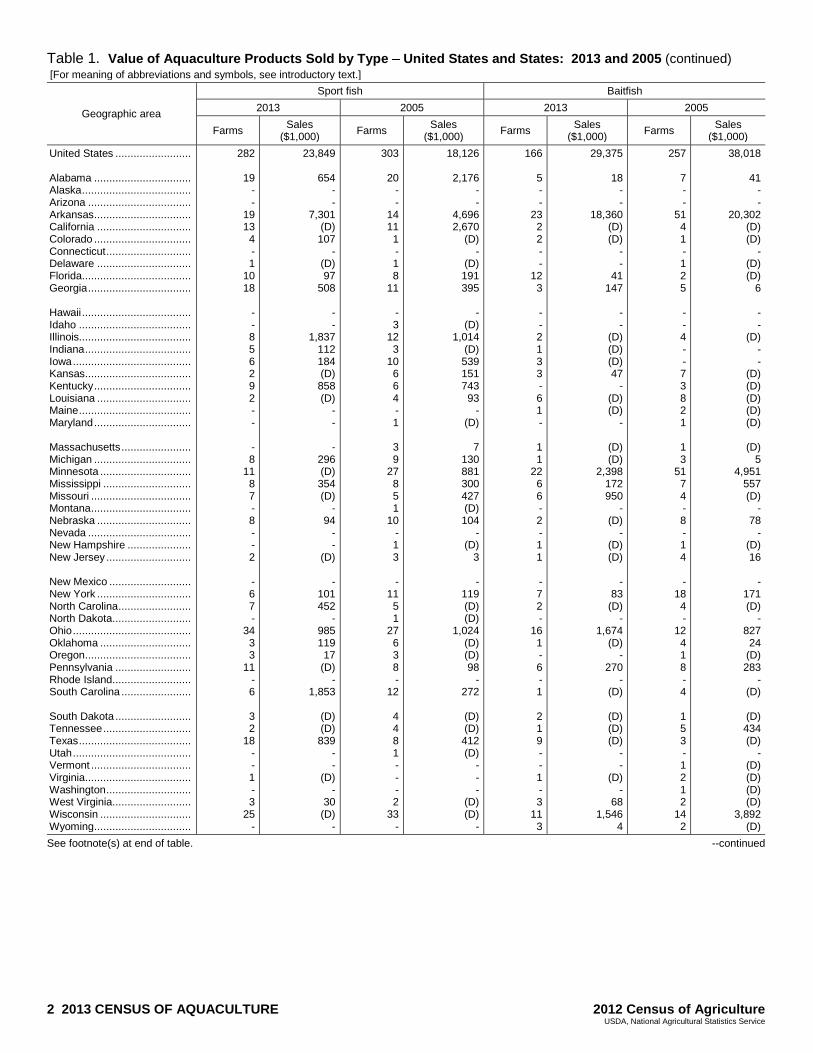
Table 1. Value of Aquaculture Products Sold by Type United States and States: 2013 and 2005 (continued) [For meaning of abbreviations and symbols, see introductory text.]
Geographic area
Sport fish Baitfish
2013 2005 2013 2005
Farms Sales
($1,000) Farms
Sales ($1,000)
Farms Sales
($1,000) Farms
Sales ($1,000)
United States ......................... Alabama ................................ Alaska .................................... Arizona .................................. Arkansas ................................ California ............................... Colorado ................................ Connecticut ............................ Delaware ............................... Florida.................................... Georgia .................................. Hawaii .................................... Idaho ..................................... Illinois..................................... Indiana ................................... Iowa ....................................... Kansas ................................... Kentucky ................................ Louisiana ............................... Maine ..................................... Maryland ................................ Massachusetts ....................... Michigan ................................ Minnesota .............................. Mississippi ............................. Missouri ................................. Montana ................................. Nebraska ............................... Nevada .................................. New Hampshire ..................... New Jersey ............................ New Mexico ........................... New York ............................... North Carolina ........................ North Dakota .......................... Ohio ....................................... Oklahoma .............................. Oregon ................................... Pennsylvania ......................... Rhode Island .......................... South Carolina ....................... South Dakota ......................... Tennessee ............................. Texas ..................................... Utah ....................................... Vermont ................................. Virginia ................................... Washington ............................ West Virginia .......................... Wisconsin .............................. Wyoming ................................
282
19 - -
19 13 4 - 1
10 18
- - 8 5 6 2 9 2 - -
- 8
11 8 7 - 8 - - 2
- 6 7 -
34 3 3
11 - 6
3 2
18 - - 1 - 3
25 -
23,849
654 - -
7,301 (D) 107
- (D) 97
508
- -
1,837 112 184 (D) 858 (D)
- -
- 296 (D) 354 (D)
- 94
- -
(D)
- 101 452
- 985 119 17
(D) -
1,853
(D) (D) 839
- -
(D) -
30 (D)
-
303
20 - -
14 11 1 - 1 8
11
- 3
12 3
10 6 6 4 - 1
3 9
27 8 5 1
10 - 1 3
- 11 5 1
27 6 3 8 -
12
4 4 8 1 - - - 2
33 -
18,126
2,176 - -
4,696 2,670
(D) -
(D) 191 395
-
(D) 1,014
(D) 539 151 743 93
- (D)
7
130 881 300 427 (D) 104
- (D)
3
- 119 (D) (D)
1,024 (D) (D) 98
- 272
(D) (D) 412 (D)
- - -
(D) (D)
-
166
5 - -
23 2 2 - -
12 3
- - 2 1 3 3 - 6 1 -
1 1
22 6 6 - 2 - 1 1
- 7 2 -
16 1 - 6 - 1
2 1 9 - - 1 - 3
11 3
29,375
18 - -
18,360 (D) (D)
- -
41 147
- -
(D) (D) (D) 47
- (D) (D)
-
(D) (D)
2,398 172 950
- (D)
- (D) (D)
-
83 (D)
- 1,674
(D) -
270 -
(D)
(D) (D) (D)
- -
(D) -
68 1,546
4
257
7 - -
51 4 1 - 1 2 5
- - 4 - - 7 3 8 2 1
1 3
51 7 4 - 8 - 1 4
- 18 4 -
12 4 1 8 - 4
1 5 3 - 1 2 1 2
14 2
38,018
41 - -
20,302 (D) (D)
- (D) (D)
6
- -
(D) - -
(D) (D) (D) (D) (D)
(D)
5 4,951
557 (D)
- 78
- (D) 16
-
171 (D)
- 827 24
(D) 283
- (D)
(D) 434 (D)
- (D) (D) (D) (D)
3,892 (D)
See footnote(s) at end of table. --continued
2012 Census of Agriculture 2013 CENSUS OF AQUACULTURE 3 USDA, National Agricultural Statistics Service
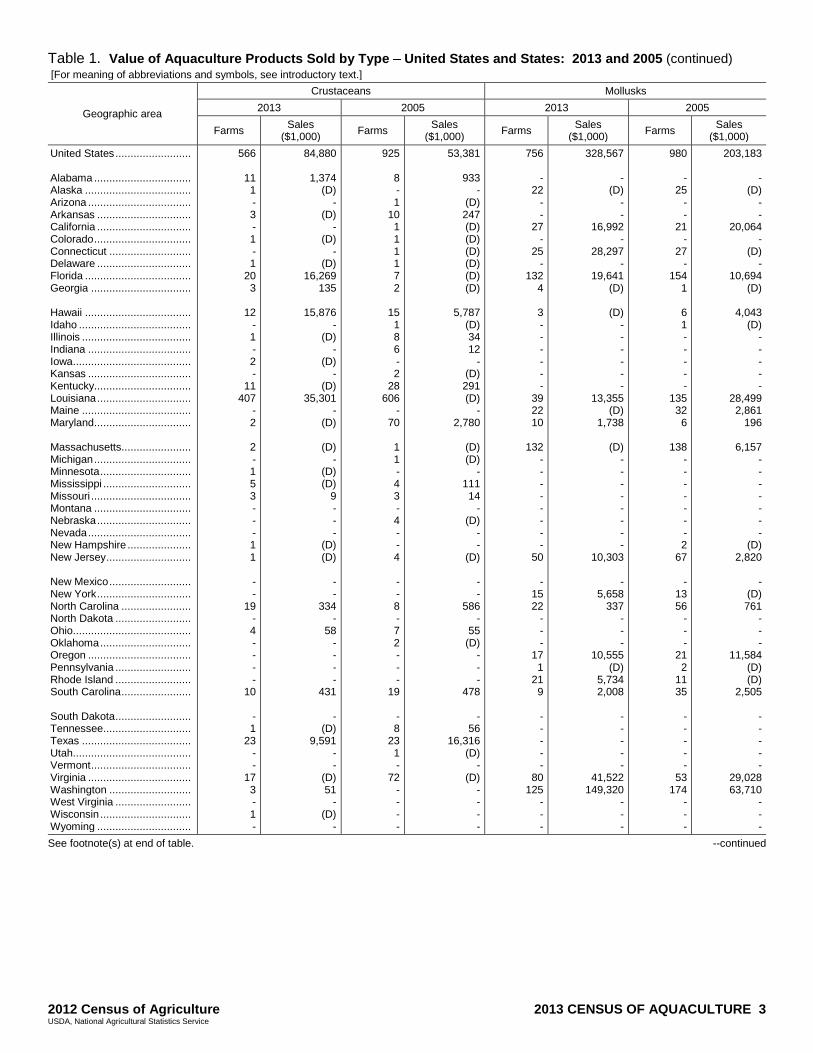
Table 1. Value of Aquaculture Products Sold by Type United States and States: 2013 and 2005 (continued) [For meaning of abbreviations and symbols, see introductory text.]
Geographic area
Crustaceans Mollusks
2013 2005 2013 2005
Farms Sales
($1,000) Farms
Sales ($1,000)
Farms Sales
($1,000) Farms
Sales ($1,000)
United States ......................... Alabama ................................ Alaska ................................... Arizona .................................. Arkansas ............................... California ............................... Colorado ................................ Connecticut ........................... Delaware ............................... Florida ................................... Georgia ................................. Hawaii ................................... Idaho ..................................... Illinois .................................... Indiana .................................. Iowa....................................... Kansas .................................. Kentucky................................ Louisiana ............................... Maine .................................... Maryland................................ Massachusetts....................... Michigan ................................ Minnesota .............................. Mississippi ............................. Missouri ................................. Montana ................................ Nebraska ............................... Nevada .................................. New Hampshire ..................... New Jersey ............................ New Mexico ........................... New York ............................... North Carolina ....................... North Dakota ......................... Ohio....................................... Oklahoma .............................. Oregon .................................. Pennsylvania ......................... Rhode Island ......................... South Carolina ....................... South Dakota ......................... Tennessee ............................. Texas .................................... Utah....................................... Vermont ................................. Virginia .................................. Washington ........................... West Virginia ......................... Wisconsin .............................. Wyoming ...............................
566
11 1 - 3 - 1 - 1
20 3
12 - 1 - 2 -
11 407
- 2
2 - 1 5 3 - - - 1 1
- -
19 - 4 - - - -
10
- 1
23 - -
17 3 - 1 -
84,880
1,374 (D)
- (D)
- (D)
- (D)
16,269 135
15,876
- (D)
- (D)
- (D)
35,301 -
(D)
(D) -
(D) (D)
9 - - -
(D) (D)
- -
334 -
58 - - - -
431
- (D)
9,591 - -
(D) 51
- (D)
-
925
8 - 1
10 1 1 1 1 7 2
15 1 8 6 - 2
28 606
- 70
1 1 - 4 3 - 4 - - 4
- - 8 - 7 2 - - -
19
- 8
23 1 -
72 - - - -
53,381
933 -
(D) 247 (D) (D) (D) (D) (D) (D)
5,787
(D) 34 12
- (D) 291 (D)
- 2,780
(D) (D)
- 111 14
- (D)
- -
(D)
- -
586 -
55 (D)
- - -
478
- 56
16,316 (D)
- (D)
- - - -
756
- 22
- -
27 -
25 -
132 4
3 - - - - - -
39 22 10
132
- - - - - - - -
50
- 15 22
- - -
17 1
21 9
- - - - -
80 125
- - -
328,567
- (D)
- -
16,992 -
28,297 -
19,641 (D)
(D)
- - - - - -
13,355 (D)
1,738
(D) - - - - - - - -
10,303
- 5,658
337 - - -
10,555 (D)
5,734 2,008
- - - - -
41,522 149,320
- - -
980
- 25
- -
21 -
27 -
154 1
6 1 - - - - -
135 32 6
138 - - - - - - - 2
67
- 13 56
- - -
21 2
11 35
- - - - -
53 174
- - -
203,183
- (D)
- -
20,064 -
(D) -
10,694 (D)
4,043
(D) - - - - -
28,499 2,861
196
6,157 - - - - - - -
(D) 2,820
-
(D) 761
- - -
11,584 (D) (D)
2,505
- - - - -
29,028 63,710
- - -
See footnote(s) at end of table. --continued
4 2013 CENSUS OF AQUACULTURE 2012 Census of Agriculture USDA, National Agricultural Statistics Service
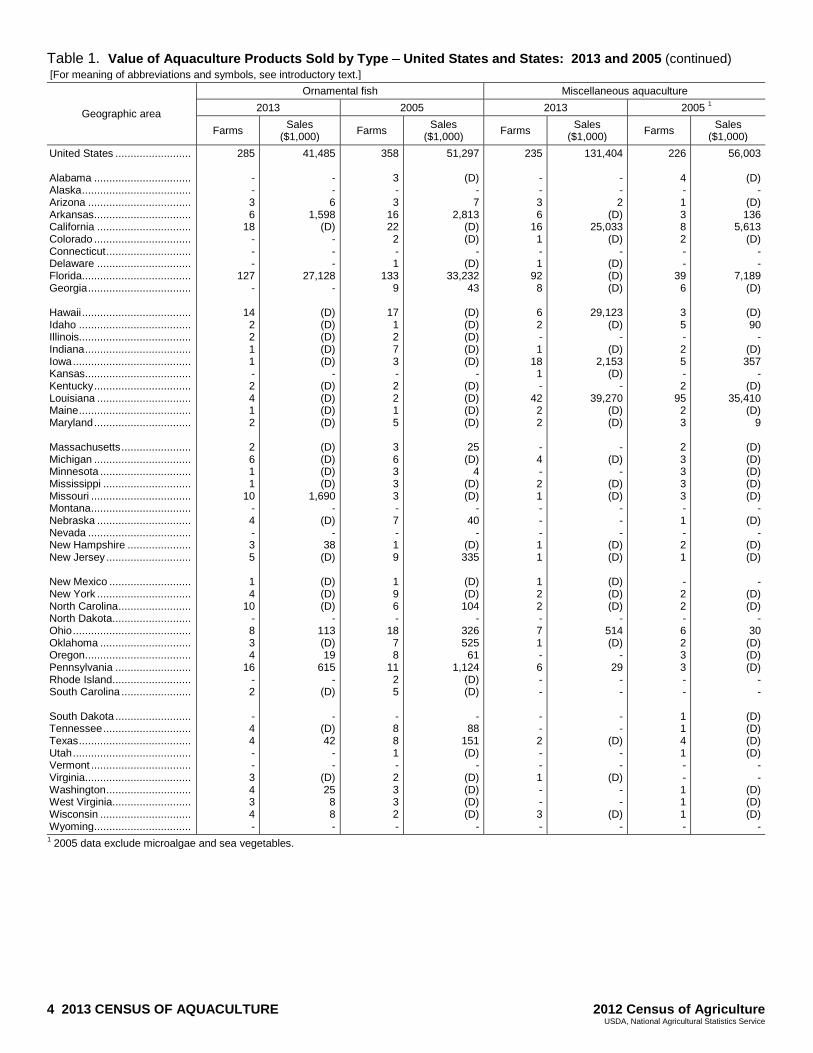
Table 1. Value of Aquaculture Products Sold by Type United States and States: 2013 and 2005 (continued) [For meaning of abbreviations and symbols, see introductory text.]
Geographic area
Ornamental fish Miscellaneous aquaculture
2013 2005 2013 2005 1
Farms Sales
($1,000) Farms
Sales ($1,000)
Farms Sales
($1,000) Farms
Sales ($1,000)
United States ......................... Alabama ................................ Alaska .................................... Arizona .................................. Arkansas ................................ California ............................... Colorado ................................ Connecticut ............................ Delaware ............................... Florida.................................... Georgia .................................. Hawaii .................................... Idaho ..................................... Illinois..................................... Indiana ................................... Iowa ....................................... Kansas ................................... Kentucky ................................ Louisiana ............................... Maine ..................................... Maryland ................................ Massachusetts ....................... Michigan ................................ Minnesota .............................. Mississippi ............................. Missouri ................................. Montana ................................. Nebraska ............................... Nevada .................................. New Hampshire ..................... New Jersey ............................ New Mexico ........................... New York ............................... North Carolina ........................ North Dakota .......................... Ohio ....................................... Oklahoma .............................. Oregon ................................... Pennsylvania ......................... Rhode Island .......................... South Carolina ....................... South Dakota ......................... Tennessee ............................. Texas ..................................... Utah ....................................... Vermont ................................. Virginia ................................... Washington ............................ West Virginia .......................... Wisconsin .............................. Wyoming ................................
285
- - 3 6
18 - - -
127 -
14 2 2 1 1 - 2 4 1 2
2 6 1 1
10 - 4 - 3 5
1 4
10 - 8 3 4
16 - 2
- 4 4 - - 3 4 3 4 -
41,485
- - 6
1,598 (D)
- - -
27,128 -
(D) (D) (D) (D) (D)
- (D) (D) (D) (D)
(D) (D) (D) (D)
1,690 -
(D) -
38 (D)
(D) (D) (D)
- 113 (D) 19
615 -
(D)
- (D) 42
- -
(D) 25 8 8 -
358
3 - 3
16 22 2 - 1
133 9
17 1 2 7 3 - 2 2 1 5
3 6 3 3 3 - 7 - 1 9
1 9 6 -
18 7 8
11 2 5
- 8 8 1 - 2 3 3 2 -
51,297
(D) - 7
2,813 (D) (D)
- (D)
33,232 43
(D) (D) (D) (D) (D)
- (D) (D) (D) (D)
25
(D) 4
(D) (D)
- 40
- (D) 335
(D) (D) 104
- 326 525 61
1,124 (D) (D)
-
88 151 (D)
- (D) (D) (D) (D)
-
235
- - 3 6
16 1 - 1
92 8
6 2 - 1
18 1 -
42 2 2
- 4 - 2 1 - - - 1 1
1 2 2 - 7 1 - 6 - -
- - 2 - - 1 - - 3 -
131,404
- - 2
(D) 25,033
(D) -
(D) (D) (D)
29,123
(D) -
(D) 2,153
(D) -
39,270 (D) (D)
-
(D) -
(D) (D)
- - -
(D) (D)
(D) (D) (D)
- 514 (D)
- 29
- -
- -
(D) - -
(D) - -
(D) -
226
4 - 1 3 8 2 - -
39 6
3 5 - 2 5 - 2
95 2 3
2 3 3 3 3 - 1 - 2 1
- 2 2 - 6 2 3 3 - -
1 1 4 1 - - 1 1 1 -
56,003
(D) -
(D) 136
5,613 (D)
- -
7,189 (D)
(D) 90
- (D) 357
- (D)
35,410 (D)
9
(D) (D) (D) (D) (D)
- (D)
- (D) (D)
-
(D) (D)
- 30
(D) (D) (D)
- -
(D) (D) (D) (D)
- -
(D) (D) (D)
- 1 2005 data exclude microalgae and sea vegetables.
2012 Census of Agriculture 2013 CENSUS OF AQUACULTURE 5 USDA, National Agricultural Statistics Service
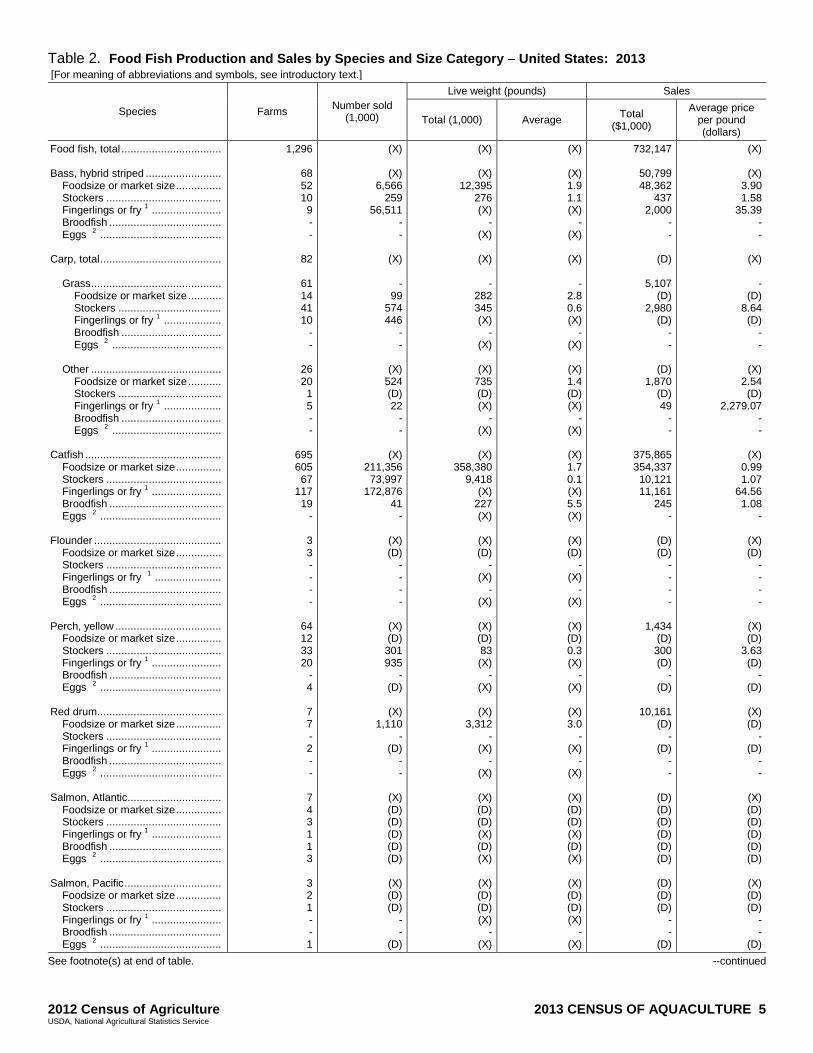
Table 2. Food Fish Production and Sales by Species and Size Category United States: 2013 [For meaning of abbreviations and symbols, see introductory text.]
Species Farms Number sold
(1,000)
Live weight (pounds) Sales
Total (1,000) Average Total
($1,000)
Average price per pound (dollars)
Food fish, total ................................. Bass, hybrid striped ......................... Foodsize or market size ............... Stockers ...................................... Fingerlings or fry 1 ....................... Broodfish ..................................... Eggs 2 ........................................ Carp, total ........................................ Grass ........................................... Foodsize or market size ........... Stockers .................................. Fingerlings or fry 1 ................... Broodfish ................................. Eggs 2 .................................... Other ........................................... Foodsize or market size ........... Stockers .................................. Fingerlings or fry 1 ................... Broodfish ................................. Eggs 2 .................................... Catfish ............................................. Foodsize or market size ............... Stockers ...................................... Fingerlings or fry 1 ....................... Broodfish ..................................... Eggs 2 ........................................ Flounder .......................................... Foodsize or market size ............... Stockers ...................................... Fingerlings or fry 1 ...................... Broodfish ..................................... Eggs 2 ........................................ Perch, yellow ................................... Foodsize or market size ............... Stockers ...................................... Fingerlings or fry 1 ....................... Broodfish ..................................... Eggs 2 ........................................ Red drum......................................... Foodsize or market size ............... Stockers ...................................... Fingerlings or fry 1 ....................... Broodfish ..................................... Eggs 2 ........................................ Salmon, Atlantic ............................... Foodsize or market size ............... Stockers ...................................... Fingerlings or fry 1 ....................... Broodfish ..................................... Eggs 2 ........................................ Salmon, Pacific ................................ Foodsize or market size ............... Stockers ...................................... Fingerlings or fry 1 ....................... Broodfish ..................................... Eggs 2 ........................................
1,296
68 52 10 9 - -
82
61 14 41 10
- -
26 20 1 5 - -
695 605 67
117 19
-
3 3 - - - -
64 12 33 20
- 4
7 7 - 2 - -
7 4 3 1 1 3
3 2 1 - - 1
(X)
(X) 6,566
259 56,511
- -
(X)
- 99
574 446
- -
(X) 524 (D) 22
- -
(X) 211,356 73,997
172,876 41
-
(X) (D)
- - - -
(X) (D) 301 935
- (D)
(X)
1,110 -
(D) - -
(X) (D) (D) (D) (D) (D)
(X) (D) (D)
- -
(D)
(X)
(X) 12,395
276 (X)
- (X)
(X)
-
282 345 (X)
- (X)
(X)
735 (D) (X)
- (X)
(X)
358,380 9,418
(X) 227 (X)
(X) (D)
- (X)
- (X)
(X) (D) 83 (X)
- (X)
(X)
3,312 -
(X) -
(X)
(X) (D) (D) (X) (D) (X)
(X) (D) (D) (X)
- (X)
(X)
(X) 1.9 1.1 (X)
- (X)
(X)
-
2.8 0.6 (X)
- (X)
(X) 1.4 (D) (X)
- (X)
(X) 1.7 0.1 (X) 5.5 (X)
(X) (D)
- (X)
- (X)
(X) (D) 0.3 (X)
- (X)
(X) 3.0
- (X)
- (X)
(X) (D) (D) (X) (D) (X)
(X) (D) (D) (X)
- (X)
732,147
50,799 48,362
437 2,000
- -
(D)
5,107 (D)
2,980 (D)
- -
(D) 1,870
(D) 49
- -
375,865 354,337 10,121 11,161
245 -
(D) (D)
- - - -
1,434 (D) 300 (D)
- (D)
10,161
(D) -
(D) - -
(D) (D) (D) (D) (D) (D)
(D) (D) (D)
- -
(D)
(X)
(X) 3.90 1.58
35.39 - -
(X)
- (D)
8.64 (D)
- -
(X) 2.54 (D)
2,279.07 - -
(X) 0.99 1.07
64.56 1.08
-
(X) (D)
- - - -
(X) (D)
3.63 (D)
- (D)
(X) (D)
- (D)
- -
(X) (D) (D) (D) (D) (D)
(X) (D) (D)
- -
(D)
See footnote(s) at end of table. --continued
6 2013 CENSUS OF AQUACULTURE 2012 Census of Agriculture USDA, National Agricultural Statistics Service
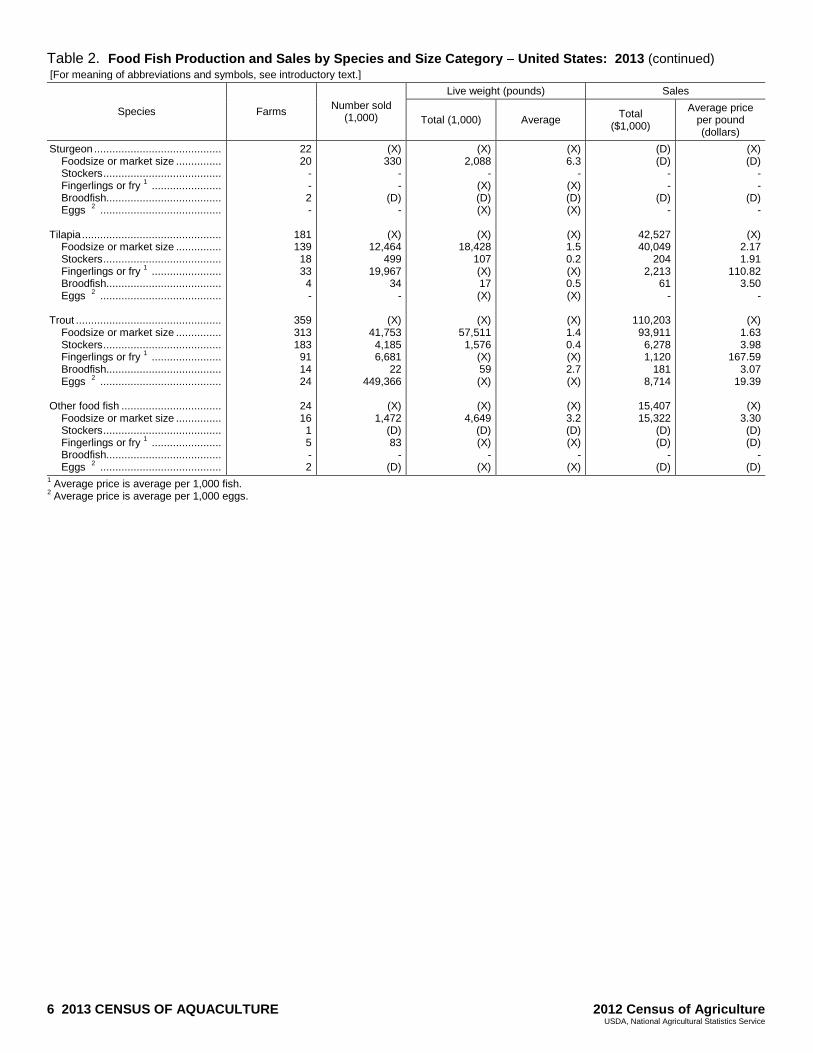
Table 2. Food Fish Production and Sales by Species and Size Category United States: 2013 (continued) [For meaning of abbreviations and symbols, see introductory text.]
Species Farms Number sold
(1,000)
Live weight (pounds) Sales
Total (1,000) Average Total
($1,000)
Average price per pound (dollars)
Sturgeon .......................................... Foodsize or market size ............... Stockers ....................................... Fingerlings or fry 1 ....................... Broodfish...................................... Eggs 2 ........................................ Tilapia .............................................. Foodsize or market size ............... Stockers ....................................... Fingerlings or fry 1 ....................... Broodfish...................................... Eggs 2 ........................................ Trout ................................................ Foodsize or market size ............... Stockers ....................................... Fingerlings or fry 1 ....................... Broodfish...................................... Eggs 2 ........................................ Other food fish ................................. Foodsize or market size ............... Stockers ....................................... Fingerlings or fry 1 ....................... Broodfish...................................... Eggs 2 ........................................
22 20
- - 2 -
181 139 18 33 4 -
359 313 183 91 14 24
24 16 1 5 - 2
(X) 330
- -
(D) -
(X) 12,464
499 19,967
34 -
(X) 41,753 4,185 6,681
22 449,366
(X)
1,472 (D) 83
- (D)
(X) 2,088
- (X) (D) (X)
(X)
18,428 107 (X) 17 (X)
(X)
57,511 1,576
(X) 59 (X)
(X)
4,649 (D) (X)
- (X)
(X) 6.3
- (X) (D) (X)
(X) 1.5 0.2 (X) 0.5 (X)
(X) 1.4 0.4 (X) 2.7 (X)
(X) 3.2 (D) (X)
- (X)
(D) (D)
- -
(D) -
42,527 40,049
204 2,213
61 -
110,203 93,911 6,278 1,120
181 8,714
15,407 15,322
(D) (D)
- (D)
(X) (D)
- -
(D) -
(X) 2.17 1.91
110.82 3.50
-
(X) 1.63 3.98
167.59 3.07
19.39
(X) 3.30 (D) (D)
- (D)
1 Average price is average per 1,000 fish. 2 Average price is average per 1,000 eggs.
2012 Census of Agriculture 2013 CENSUS OF AQUACULTURE 7 USDA, National Agricultural Statistics Service
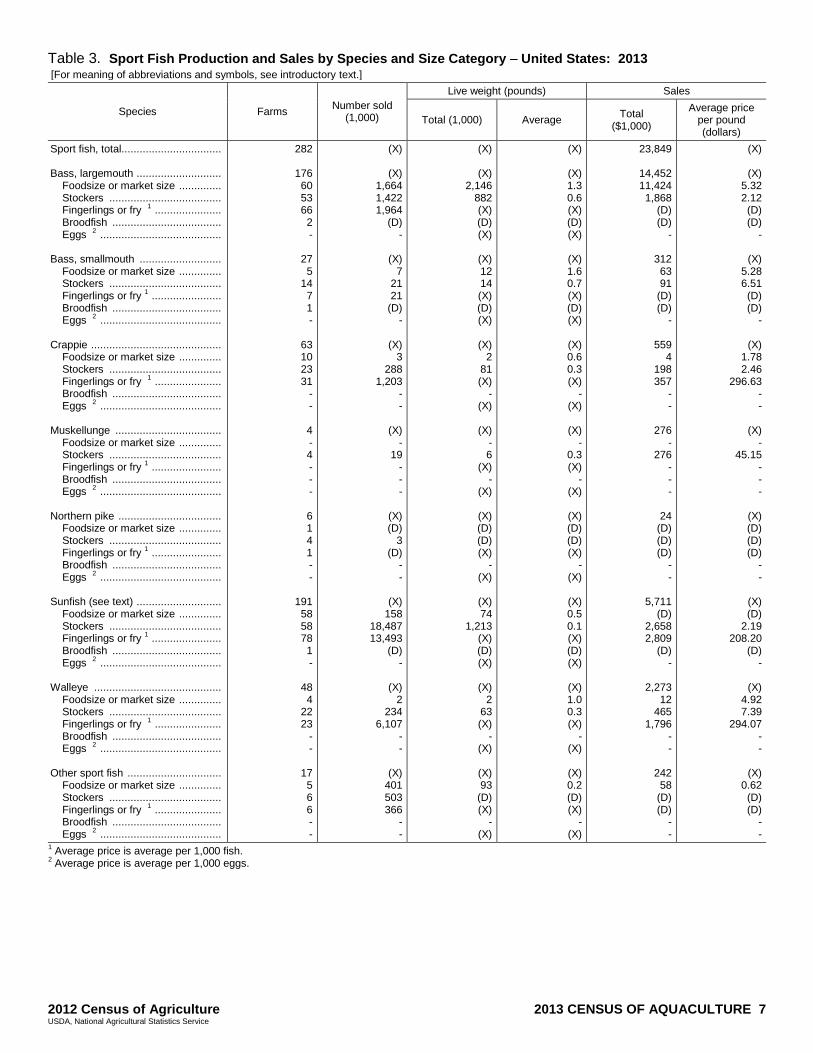
Table 3. Sport Fish Production and Sales by Species and Size Category United States: 2013 [For meaning of abbreviations and symbols, see introductory text.]
Species Farms Number sold
(1,000)
Live weight (pounds) Sales
Total (1,000) Average Total
($1,000)
Average price per pound (dollars)
Sport fish, total................................. Bass, largemouth ............................ Foodsize or market size .............. Stockers ..................................... Fingerlings or fry 1 ...................... Broodfish .................................... Eggs 2 ........................................ Bass, smallmouth ........................... Foodsize or market size .............. Stockers ..................................... Fingerlings or fry 1 ....................... Broodfish .................................... Eggs 2 ........................................ Crappie ........................................... Foodsize or market size .............. Stockers ..................................... Fingerlings or fry 1 ...................... Broodfish .................................... Eggs 2 ........................................ Muskellunge ................................... Foodsize or market size .............. Stockers ..................................... Fingerlings or fry 1 ....................... Broodfish .................................... Eggs 2 ........................................ Northern pike .................................. Foodsize or market size .............. Stockers ..................................... Fingerlings or fry 1 ....................... Broodfish .................................... Eggs 2 ........................................ Sunfish (see text) ............................ Foodsize or market size .............. Stockers ..................................... Fingerlings or fry 1 ....................... Broodfish .................................... Eggs 2 ........................................ Walleye .......................................... Foodsize or market size .............. Stockers ..................................... Fingerlings or fry 1 ...................... Broodfish .................................... Eggs 2 ........................................ Other sport fish ............................... Foodsize or market size .............. Stockers ..................................... Fingerlings or fry 1 ...................... Broodfish .................................... Eggs 2 ........................................
282
176 60 53 66 2 -
27 5
14 7 1 -
63 10 23 31
- -
4 - 4 - - -
6 1 4 1 - -
191 58 58 78 1 -
48 4
22 23
- -
17 5 6 6 - -
(X)
(X) 1,664 1,422 1,964
(D) -
(X) 7
21 21
(D) -
(X) 3
288 1,203
- -
(X) -
19 - - -
(X) (D)
3 (D)
- -
(X) 158
18,487 13,493
(D) -
(X) 2
234 6,107
- -
(X) 401 503 366
- -
(X)
(X) 2,146
882 (X) (D) (X)
(X) 12 14 (X) (D) (X)
(X)
2 81 (X)
- (X)
(X)
- 6
(X) -
(X)
(X) (D) (D) (X)
- (X)
(X) 74
1,213 (X) (D) (X)
(X)
2 63 (X)
- (X)
(X) 93
(D) (X)
- (X)
(X)
(X) 1.3 0.6 (X) (D) (X)
(X) 1.6 0.7 (X) (D) (X)
(X) 0.6 0.3 (X)
- (X)
(X)
- 0.3 (X)
- (X)
(X) (D) (D) (X)
- (X)
(X) 0.5 0.1 (X) (D) (X)
(X) 1.0 0.3 (X)
- (X)
(X) 0.2 (D) (X)
- (X)
23,849
14,452 11,424 1,868
(D) (D)
-
312 63 91
(D) (D)
-
559 4
198 357
- -
276 -
276 - - -
24 (D) (D) (D)
- -
5,711 (D)
2,658 2,809
(D) -
2,273 12
465 1,796
- -
242 58
(D) (D)
- -
(X)
(X) 5.32 2.12 (D) (D)
-
(X) 5.28 6.51 (D) (D)
-
(X) 1.78 2.46
296.63 - -
(X) -
45.15 - - -
(X) (D) (D) (D)
- -
(X) (D)
2.19 208.20
(D) -
(X) 4.92 7.39
294.07 - -
(X) 0.62 (D) (D)
- -
1 Average price is average per 1,000 fish. 2 Average price is average per 1,000 eggs.
8 2013 CENSUS OF AQUACULTURE 2012 Census of Agriculture USDA, National Agricultural Statistics Service
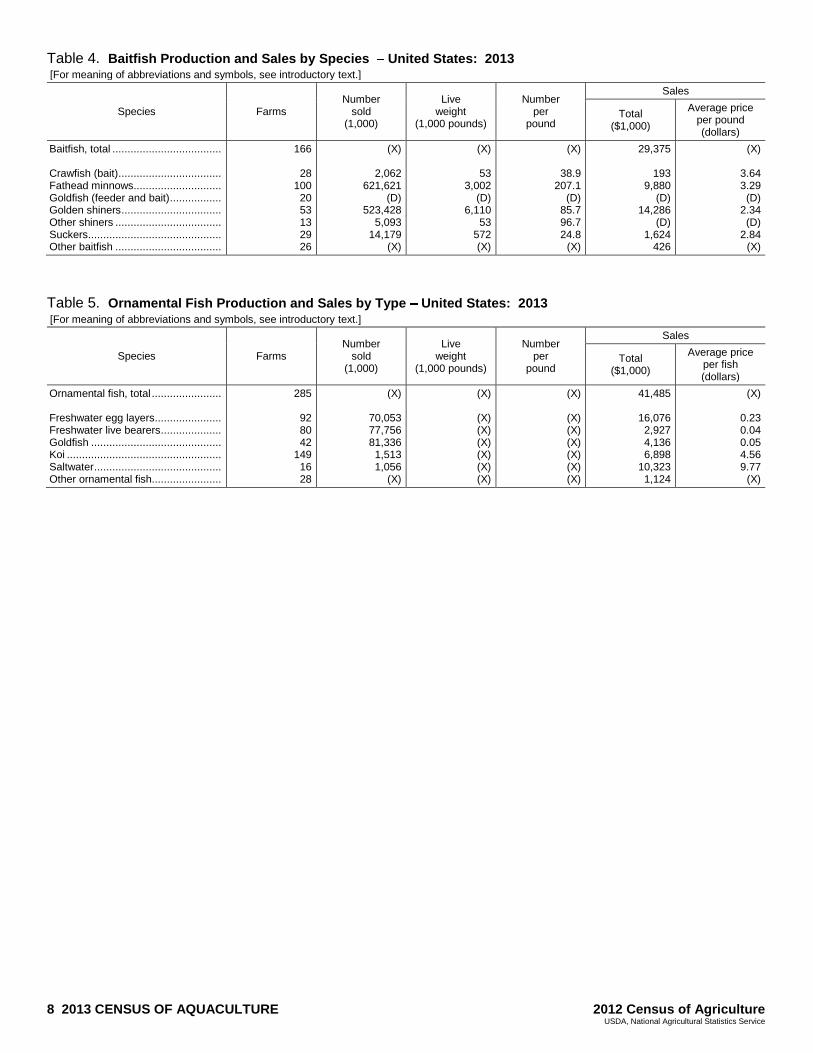
Table 4. Baitfish Production and Sales by Species United States: 2013 [For meaning of abbreviations and symbols, see introductory text.]
Species Farms Number
sold (1,000)
Live weight
(1,000 pounds)
Number per
pound
Sales
Total ($1,000)
Average price per pound (dollars)
Baitfish, total .................................... Crawfish (bait) .................................. Fathead minnows ............................. Goldfish (feeder and bait) ................. Golden shiners ................................. Other shiners ................................... Suckers ............................................ Other baitfish ...................................
166
28 100 20 53 13 29 26
(X)
2,062 621,621
(D) 523,428
5,093 14,179
(X)
(X)
53 3,002
(D) 6,110
53 572 (X)
(X)
38.9 207.1
(D) 85.7 96.7 24.8
(X)
29,375
193 9,880
(D) 14,286
(D) 1,624
426
(X)
3.64 3.29 (D)
2.34 (D)
2.84 (X)
Table 5. Ornamental Fish Production and Sales by Type United States: 2013 [For meaning of abbreviations and symbols, see introductory text.]
Species Farms Number
sold (1,000)
Live weight
(1,000 pounds)
Number per
pound
Sales
Total ($1,000)
Average price per fish (dollars)
Ornamental fish, total ....................... Freshwater egg layers...................... Freshwater live bearers .................... Goldfish ........................................... Koi ................................................... Saltwater .......................................... Other ornamental fish.......................
285
92 80 42
149 16 28
(X)
70,053 77,756 81,336 1,513 1,056
(X)
(X)
(X) (X) (X) (X) (X) (X)
(X)
(X) (X) (X) (X) (X) (X)
41,485
16,076 2,927 4,136 6,898
10,323 1,124
(X)
0.23 0.04 0.05 4.56 9.77
(X)
2012 Census of Agriculture 2013 CENSUS OF AQUACULTURE 9 USDA, National Agricultural Statistics Service
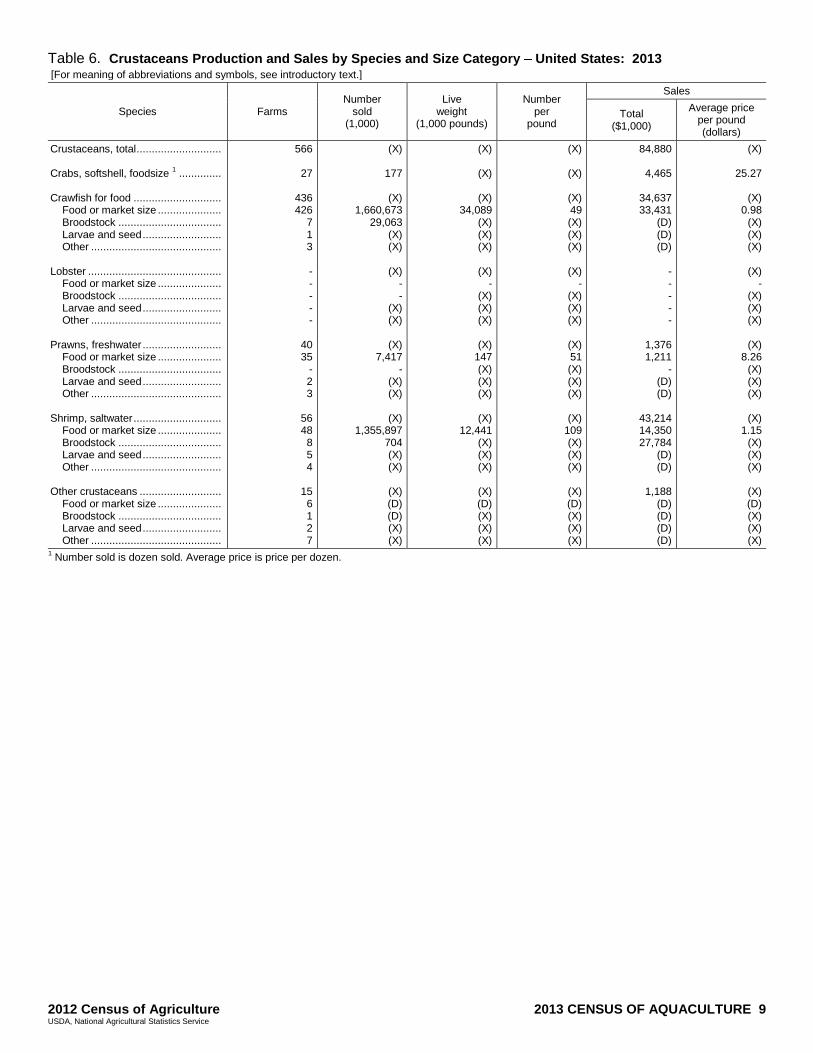
Table 6. Crustaceans Production and Sales by Species and Size Category United States: 2013 [For meaning of abbreviations and symbols, see introductory text.]
Species Farms Number
sold (1,000)
Live weight
(1,000 pounds)
Number per
pound
Sales
Total ($1,000)
Average price per pound (dollars)
Crustaceans, total ............................ Crabs, softshell, foodsize 1 .............. Crawfish for food ............................. Food or market size ..................... Broodstock .................................. Larvae and seed .......................... Other ........................................... Lobster ............................................ Food or market size ..................... Broodstock .................................. Larvae and seed .......................... Other ........................................... Prawns, freshwater .......................... Food or market size ..................... Broodstock .................................. Larvae and seed .......................... Other ........................................... Shrimp, saltwater ............................. Food or market size ..................... Broodstock .................................. Larvae and seed .......................... Other ........................................... Other crustaceans ........................... Food or market size ..................... Broodstock .................................. Larvae and seed .......................... Other ...........................................
566
27
436 426
7 1 3
- - - - -
40 35
- 2 3
56 48 8 5 4
15 6 1 2 7
(X)
177
(X) 1,660,673
29,063 (X) (X)
(X)
- -
(X) (X)
(X)
7,417 -
(X) (X)
(X)
1,355,897 704 (X) (X)
(X) (D) (D) (X) (X)
(X)
(X)
(X) 34,089
(X) (X) (X)
(X)
- (X) (X) (X)
(X)
147 (X) (X) (X)
(X)
12,441 (X) (X) (X)
(X) (D) (X) (X) (X)
(X)
(X)
(X) 49 (X) (X) (X)
(X)
- (X) (X) (X)
(X) 51 (X) (X) (X)
(X)
109 (X) (X) (X)
(X) (D) (X) (X) (X)
84,880
4,465
34,637 33,431
(D) (D) (D)
- - - - -
1,376 1,211
- (D) (D)
43,214 14,350 27,784
(D) (D)
1,188
(D) (D) (D) (D)
(X)
25.27
(X) 0.98
(X) (X) (X)
(X)
- (X) (X) (X)
(X)
8.26 (X) (X) (X)
(X)
1.15 (X) (X) (X)
(X) (D) (X) (X) (X)
1 Number sold is dozen sold. Average price is price per dozen.
10 2013 CENSUS OF AQUACULTURE 2012 Census of Agriculture USDA, National Agricultural Statistics Service
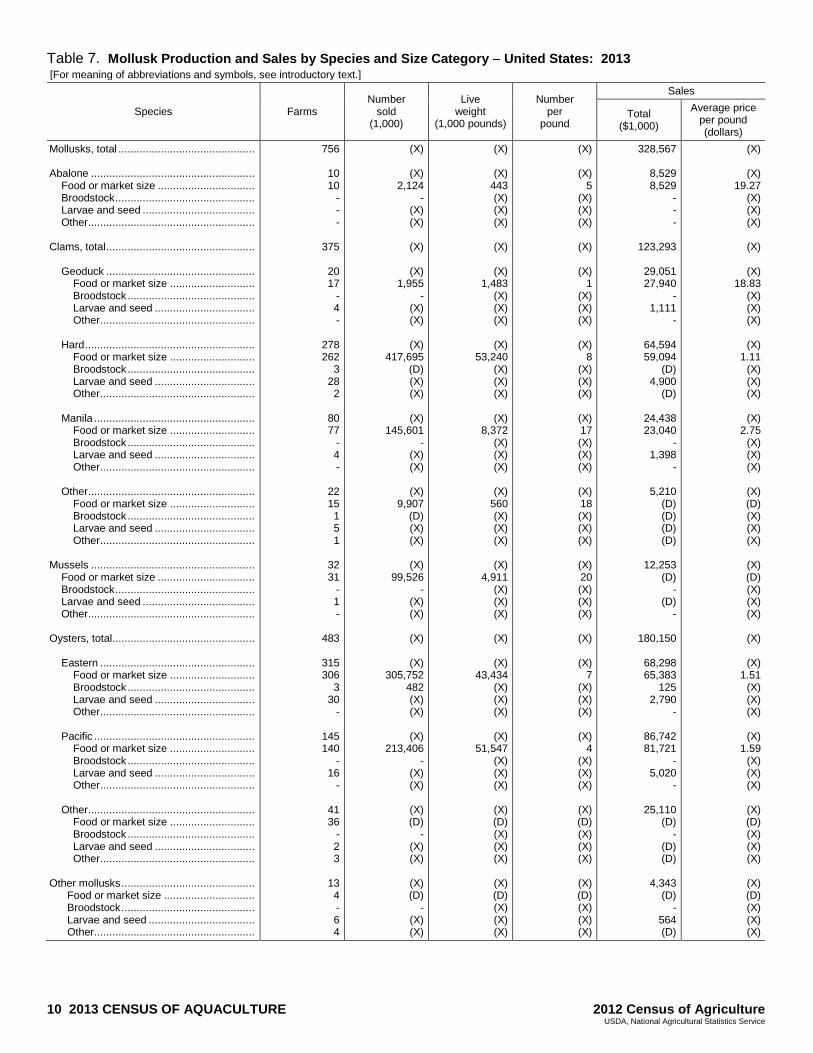
Table 7. Mollusk Production and Sales by Species and Size Category United States: 2013 [For meaning of abbreviations and symbols, see introductory text.]
Species Farms Number
sold (1,000)
Live weight
(1,000 pounds)
Number per
pound
Sales
Total ($1,000)
Average price per pound (dollars)
Mollusks, total ............................................. Abalone ...................................................... Food or market size ................................ Broodstock .............................................. Larvae and seed ..................................... Other ....................................................... Clams, total ................................................. Geoduck ................................................. Food or market size ............................ Broodstock .......................................... Larvae and seed ................................. Other ................................................... Hard ........................................................ Food or market size ............................ Broodstock .......................................... Larvae and seed ................................. Other ................................................... Manila ..................................................... Food or market size ............................ Broodstock .......................................... Larvae and seed ................................. Other ................................................... Other ....................................................... Food or market size ............................ Broodstock .......................................... Larvae and seed ................................. Other ................................................... Mussels ...................................................... Food or market size ................................ Broodstock .............................................. Larvae and seed ..................................... Other ....................................................... Oysters, total ............................................... Eastern ................................................... Food or market size ............................ Broodstock .......................................... Larvae and seed ................................. Other ................................................... Pacific ..................................................... Food or market size ............................ Broodstock .......................................... Larvae and seed ................................. Other ................................................... Other ....................................................... Food or market size ............................ Broodstock .......................................... Larvae and seed ................................. Other ................................................... Other mollusks ............................................ Food or market size .............................. Broodstock ............................................ Larvae and seed ................................... Other .....................................................
756
10 10
- - -
375
20 17
- 4 -
278 262
3 28 2
80 77
- 4 -
22 15 1 5 1
32 31
- 1 -
483
315 306
3 30
-
145 140
- 16
-
41 36
- 2 3
13 4 - 6 4
(X)
(X) 2,124
- (X) (X)
(X)
(X)
1,955 -
(X) (X)
(X)
417,695 (D) (X) (X)
(X)
145,601 -
(X) (X)
(X)
9,907 (D) (X) (X)
(X)
99,526 -
(X) (X)
(X)
(X)
305,752 482 (X) (X)
(X)
213,406 -
(X) (X)
(X) (D)
- (X) (X)
(X) (D)
- (X) (X)
(X)
(X) 443 (X) (X) (X)
(X)
(X)
1,483 (X) (X) (X)
(X)
53,240 (X) (X) (X)
(X)
8,372 (X) (X) (X)
(X)
560 (X) (X) (X)
(X)
4,911 (X) (X) (X)
(X)
(X)
43,434 (X) (X) (X)
(X)
51,547 (X) (X) (X)
(X) (D) (X) (X) (X)
(X) (D) (X) (X) (X)
(X)
(X) 5
(X) (X) (X)
(X)
(X)
1 (X) (X) (X)
(X)
8 (X) (X) (X)
(X) 17 (X) (X) (X)
(X) 18 (X) (X) (X)
(X) 20 (X) (X) (X)
(X)
(X)
7 (X) (X) (X)
(X)
4 (X) (X) (X)
(X) (D) (X) (X) (X)
(X) (D) (X) (X) (X)
328,567
8,529 8,529
- - -
123,293
29,051 27,940
- 1,111
-
64,594 59,094
(D) 4,900
(D)
24,438 23,040
- 1,398
-
5,210 (D) (D) (D) (D)
12,253
(D) -
(D) -
180,150
68,298 65,383
125 2,790
-
86,742 81,721
- 5,020
-
25,110 (D)
- (D) (D)
4,343
(D) -
564 (D)
(X)
(X) 19.27
(X) (X) (X)
(X)
(X)
18.83 (X) (X) (X)
(X)
1.11 (X) (X) (X)
(X)
2.75 (X) (X) (X)
(X) (D) (X) (X) (X)
(X) (D) (X) (X) (X)
(X)
(X)
1.51 (X) (X) (X)
(X)
1.59 (X) (X) (X)
(X) (D) (X) (X) (X)
(X) (D) (X) (X) (X)
2012 Census of Agriculture 2013 CENSUS OF AQUACULTURE 11 USDA, National Agricultural Statistics Service
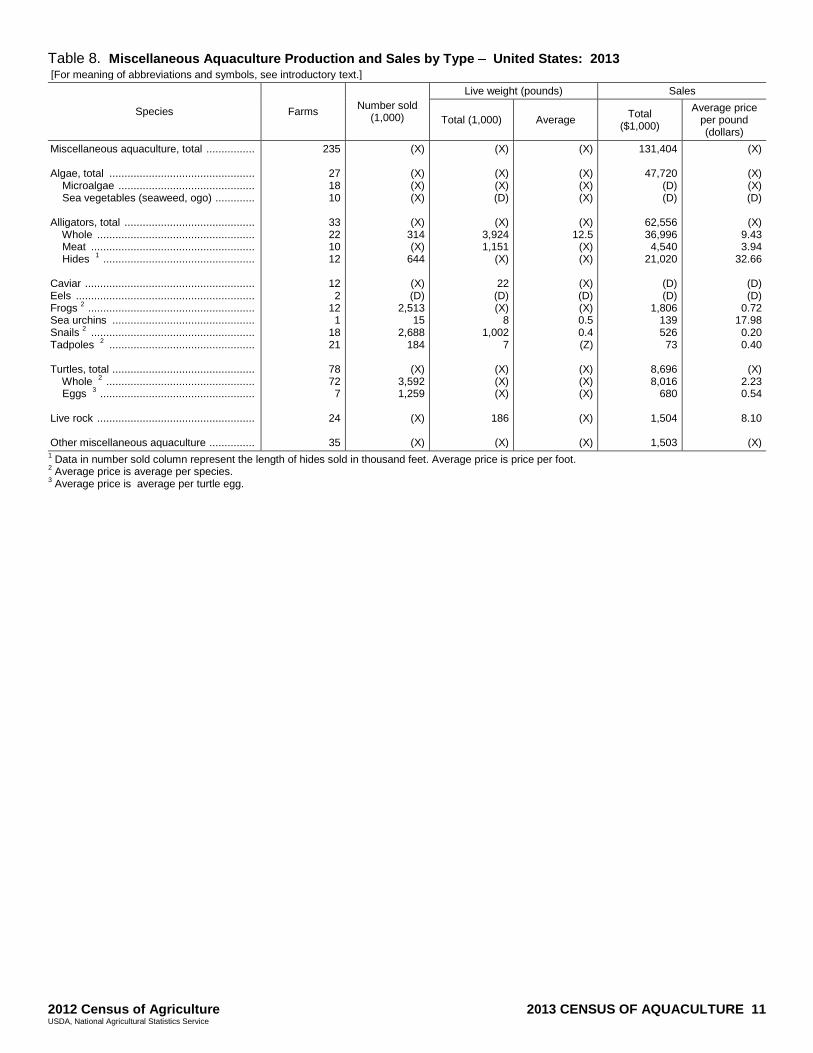
Table 8. Miscellaneous Aquaculture Production and Sales by Type United States: 2013 [For meaning of abbreviations and symbols, see introductory text.]
Species Farms Number sold
(1,000)
Live weight (pounds) Sales
Total (1,000) Average Total
($1,000)
Average price per pound (dollars)
Miscellaneous aquaculture, total ................ Algae, total ................................................ Microalgae ............................................. Sea vegetables (seaweed, ogo) ............. Alligators, total ........................................... Whole .................................................... Meat ...................................................... Hides 1 .................................................. Caviar ........................................................ Eels ........................................................... Frogs 2 ....................................................... Sea urchins ............................................... Snails 2 ...................................................... Tadpoles 2 ................................................ Turtles, total ............................................... Whole 2 ................................................. Eggs 3 ................................................... Live rock .................................................... Other miscellaneous aquaculture ...............
235
27 18 10
33 22 10 12
12 2
12 1
18 21
78 72 7
24
35
(X)
(X) (X) (X)
(X)
314 (X)
644
(X) (D)
2,513 15
2,688 184
(X)
3,592 1,259
(X)
(X)
(X)
(X) (X) (D)
(X)
3,924 1,151
(X)
22 (D) (X)
8 1,002
7
(X) (X) (X)
186
(X)
(X)
(X) (X) (X)
(X)
12.5 (X) (X)
(X) (D) (X) 0.5 0.4 (Z)
(X) (X) (X)
(X)
(X)
131,404
47,720 (D) (D)
62,556 36,996 4,540
21,020
(D) (D)
1,806 139 526 73
8,696 8,016
680
1,504
1,503
(X)
(X) (X) (D)
(X)
9.43 3.94
32.66
(D) (D)
0.72 17.98 0.20 0.40
(X)
2.23 0.54
8.10
(X)
1 Data in number sold column represent the length of hides sold in thousand feet. Average price is price per foot. 2 Average price is average per species. 3 Average price is average per turtle egg.
12 2013 CENSUS OF AQUACULTURE 2012 Census of Agriculture USDA, National Agricultural Statistics Service
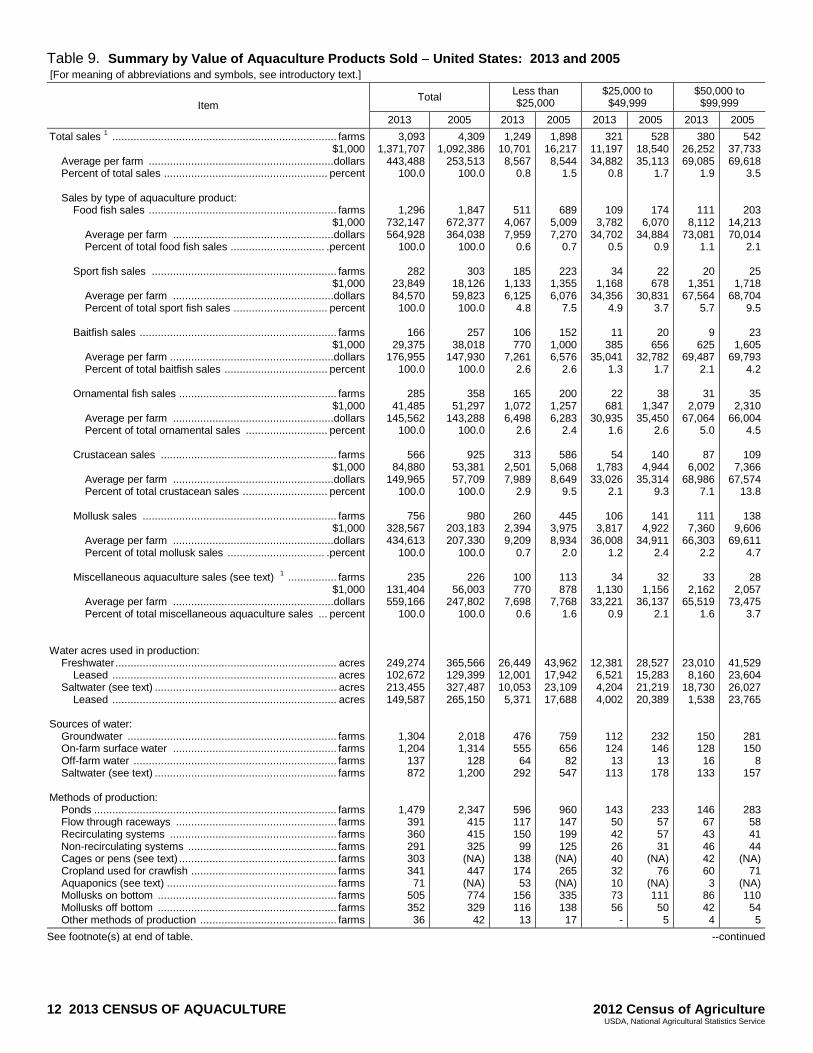
Table 9. Summary by Value of Aquaculture Products Sold United States: 2013 and 2005 [For meaning of abbreviations and symbols, see introductory text.]
Item Total
Less than $25,000
$25,000 to $49,999
$50,000 to $99,999
2013 2005 2013 2005 2013 2005 2013 2005
Total sales 1 .......................................................................... farms $1,000 Average per farm .............................................................dollars Percent of total sales ...................................................... percent Sales by type of aquaculture product: Food fish sales .............................................................. farms $1,000 Average per farm .....................................................dollars Percent of total food fish sales ............................... .percent Sport fish sales ............................................................. farms $1,000 Average per farm .....................................................dollars Percent of total sport fish sales ............................... percent Baitfish sales ................................................................. farms $1,000 Average per farm ......................................................dollars Percent of total baitfish sales .................................. percent Ornamental fish sales .................................................... farms $1,000 Average per farm .....................................................dollars Percent of total ornamental sales ........................... percent Crustacean sales .......................................................... farms $1,000 Average per farm .....................................................dollars Percent of total crustacean sales ............................ percent Mollusk sales ................................................................ farms $1,000 Average per farm .....................................................dollars Percent of total mollusk sales ................................ .percent Miscellaneous aquaculture sales (see text) 1 ................ farms $1,000 Average per farm .....................................................dollars Percent of total miscellaneous aquaculture sales ... percent Water acres used in production: Freshwater ......................................................................... acres Leased .......................................................................... acres Saltwater (see text) ............................................................ acres Leased .......................................................................... acres Sources of water: Groundwater ..................................................................... farms On-farm surface water ...................................................... farms Off-farm water ................................................................... farms Saltwater (see text) ............................................................ farms Methods of production: Ponds ................................................................................ farms Flow through raceways ..................................................... farms Recirculating systems ....................................................... farms Non-recirculating systems ................................................. farms Cages or pens (see text) .................................................... farms Cropland used for crawfish ................................................ farms Aquaponics (see text) ........................................................ farms Mollusks on bottom ........................................................... farms Mollusks off bottom ........................................................... farms Other methods of production ............................................. farms
3,093 1,371,707
443,488 100.0
1,296 732,147 564,928
100.0
282 23,849 84,570 100.0
166
29,375 176,955
100.0
285 41,485
145,562 100.0
566
84,880 149,965
100.0
756 328,567 434,613
100.0
235 131,404 559,166
100.0
249,274 102,672 213,455 149,587
1,304 1,204
137 872
1,479 391 360 291 303 341 71
505 352 36
4,309 1,092,386
253,513 100.0
1,847 672,377 364,038
100.0
303 18,126 59,823 100.0
257
38,018 147,930
100.0
358 51,297
143,288 100.0
925
53,381 57,709 100.0
980
203,183 207,330
100.0
226 56,003
247,802 100.0
365,566 129,399 327,487 265,150
2,018 1,314
128 1,200
2,347 415 415 325
(NA) 447
(NA) 774 329 42
1,249 10,701 8,567
0.8
511 4,067 7,959
0.6
185 1,133 6,125
4.8
106 770
7,261 2.6
165
1,072 6,498
2.6
313 2,501 7,989
2.9
260 2,394 9,209
0.7
100 770
7,698 0.6
26,449 12,001 10,053 5,371
476 555 64
292
596 117 150 99
138 174 53
156 116 13
1,898 16,217 8,544
1.5
689 5,009 7,270
0.7
223 1,355 6,076
7.5
152 1,000 6,576
2.6
200 1,257 6,283
2.4
586 5,068 8,649
9.5
445 3,975 8,934
2.0
113 878
7,768 1.6
43,962 17,942 23,109 17,688
759 656 82
547
960 147 199 125
(NA) 265
(NA) 335 138 17
321 11,197 34,882
0.8
109 3,782
34,702 0.5
34
1,168 34,356
4.9
11 385
35,041 1.3
22
681 30,935
1.6
54 1,783
33,026 2.1
106
3,817 36,008
1.2
34 1,130
33,221 0.9
12,381 6,521 4,204 4,002
112 124 13
113
143 50 42 26 40 32 10 73 56
-
528 18,540 35,113
1.7
174 6,070
34,884 0.9
22
678 30,831
3.7
20 656
32,782 1.7
38
1,347 35,450
2.6
140 4,944
35,314 9.3
141
4,922 34,911
2.4
32 1,156
36,137 2.1
28,527 15,283 21,219 20,389
232 146 13
178
233 57 57 31
(NA) 76
(NA) 111 50 5
380 26,252 69,085
1.9
111 8,112
73,081 1.1
20
1,351 67,564
5.7
9 625
69,487 2.1
31
2,079 67,064
5.0
87 6,002
68,986 7.1
111
7,360 66,303
2.2
33 2,162
65,519 1.6
23,010 8,160
18,730 1,538
150 128 16
133
146 67 43 46 42 60 3
86 42 4
542 37,733 69,618
3.5
203 14,213 70,014
2.1
25 1,718
68,704 9.5
23
1,605 69,793
4.2
35 2,310
66,004 4.5
109
7,366 67,574
13.8
138 9,606
69,611 4.7
28
2,057 73,475
3.7
41,529 23,604 26,027 23,765
281 150
8 157
283 58 41 44
(NA) 71
(NA) 110 54 5
See footnote(s) at end of table. --continued
2012 Census of Agriculture 2013 CENSUS OF AQUACULTURE 13 USDA, National Agricultural Statistics Service
Table 9. Summary by Value of Aquaculture Products Sold United States: 2013 and 2005 (continued) [For meaning of abbreviations and symbols, see introductory text.]
Item $100,000 to $499,999 $500,000 to $999,9999 $1,000,000 or more
2013 2005 2013 2005 2013 2005
Total sales 1 .................................................................................... farms $1,000 Average per farm ...................................................................... dollars Percent of total sales ............................................................... percent Sales by type of aquaculture product: Food fish sales ........................................................................ farms $1,000 Average per farm .............................................................. dollars Percent of total food fish sales ........................................ .percent Sport fish sales ....................................................................... farms $1,000 Average per farm .............................................................. dollars Percent of total sport fish sales ........................................ percent Baitfish sales .......................................................................... farms $1,000 Average per farm ............................................................... dollars Percent of total baitfish sales ........................................... percent Ornamental fish sales ............................................................. farms $1,000 Average per farm .............................................................. dollars Percent of total ornamental sales ..................................... percent Crustacean sales .................................................................... farms $1,000 Average per farm .............................................................. dollars Percent of total crustacean sales ..................................... percent Mollusk sales .......................................................................... farms $1,000 Average per farm ............................................................. .dollars Percent of total mollusk sales .......................................... .percent Miscellaneous aquaculture sales (see text) 1 .......................... farms $1,000 Average per farm .............................................................. dollars Percent of total miscellaneous aquaculture sales ............. percent Water acres used in production: Freshwater .................................................................................. acres Leased .................................................................................... acres Saltwater (see text) ...................................................................... acres Leased .................................................................................... acres Sources of water: Groundwater ............................................................................... farms On-farm surface water ................................................................ farms Off-farm water ............................................................................. farms Saltwater (see text) ...................................................................... farms Methods of production: Ponds .......................................................................................... farms Flow through raceways ............................................................... farms Recirculating systems ................................................................. farms Non-recirculating systems ........................................................... farms Cages or pens (see text) .............................................................. farms Cropland used for crawfish ......................................................... farms Aquaponics (see text) .................................................................. farms Mollusks on bottom ..................................................................... farms Mollusks off bottom ..................................................................... farms Other methods of production ....................................................... farms
708 161,639 228,303
11.8
320 74,167
231,772 10.1
36
8,198 227,721
34.4
22 4,139
188,144 14.1
44
9,943 225,988
24.0
84 16,963
201,946 20.0
183
41,436 226,427
12.6
47 11,118
236,559 8.5
79,078 51,805 42,579 32,393
323 264 25
206
347 106 63 70 59 62 4
121 89 7
897 200,082 223,057
18.3
495 117,013 236,389
17.4
25 5,391
215,632 29.7
45
11,451 254,459
30.1
61 12,534
205,469 24.4
77
13,279 172,459
24.9
184 38,483
209,144 18.9
30
6,549 218,291
11.7
94,058 42,540 87,766 76,923
464 270 14
220
574 105 80 84
(NA) 33
(NA) 157 65 5
193 137,531 712,595
10.0
115 80,138
696,848 10.9
3
2,156 718,783
9.0
9 5,805
645,023 19.8
12
9,011 750,880
21.7
15 9,922
661,498 11.7
37
27,956 755,570
8.5
3 1,990
663,333 1.5
25,982 6,393
11,995 4,154
106 71 6
49
122 26 25 20 4 9 1
22 22 7
210 144,868 689,846
13.3
139 95,467
686,814 14.2
5
2,878 575,669
15.9
8 6,042
755,231 15.9
14
10,046 717,576
19.6
6 5,070
845,000 9.5
30
19,779 659,301
9.7
10 6,212
621,165 11.1
35,050 10,557 55,030 48,598
133 54 7
39
146 26 16 22
(NA) 2
(NA) 26 7 4
242 1,024,387 4,233,004
74.7
130 561,881
4,322,159 76.7
4
9,842 2,460,500
41.3
9 17,650
1,961,077 60.1
11
18,700 1,699,955
45.1
13 47,708
3,669,884 56.2
59
245,604 4,162,782
74.8
18 114,234
6,346,356 86.9
82,374 17,791
125,894 102,129
137 62 13 79
125 25 37 30 20 4 -
47 27 5
234 674,948
2,884,391 61.8
147 434,606
2,956,501 64.6
3
6,106 2,035,417
33.7
9 17,265
1,918,348 45.4
10
23,804 2,380,353
46.4
7 17,654
2,521,976 33.1
42
126,417 3,009,933
62.2
13 39,151
3,011,650 69.9
122,440 19,475
114,337 77,787
149 38 4
59
151 22 22 19
(NA) -
(NA) 35 15 6
1 2005 data exclude microalgae and sea vegetables.
14 2013 CENSUS OF AQUACULTURE 2012 Census of Agriculture USDA, National Agricultural Statistics Service
Table 10. Freshwater and Saltwater Acres Used for Aquaculture Production United States and States: 2013 and 2005
[For meaning of abbreviations and symbols, see introductory text.]
Geographic area
Freshwater
Total Leased
2013 2005 2013 2005
Farms Acres Farms Acres Farms Acres Farms Acres
United States .................................. Alabama ......................................... Alaska ............................................. Arizona ........................................... Arkansas ......................................... California ........................................ Colorado ......................................... Connecticut ..................................... Delaware ........................................ Florida............................................. Georgia ........................................... Hawaii ............................................. Idaho .............................................. Illinois.............................................. Indiana ............................................ Iowa ................................................ Kansas ............................................ Kentucky ......................................... Louisiana ........................................ Maine .............................................. Maryland ......................................... Massachusetts ................................ Michigan ......................................... Minnesota ....................................... Mississippi ...................................... Missouri .......................................... Montana .......................................... Nebraska ........................................ Nevada ........................................... New Hampshire .............................. New Jersey ..................................... New Mexico .................................... New York ........................................ North Carolina ................................. North Dakota ................................... Ohio ................................................ Oklahoma ....................................... Oregon ............................................ Pennsylvania .................................. Rhode Island ................................... South Carolina ................................ South Dakota .................................. Tennessee ...................................... Texas .............................................. Utah ................................................ Vermont .......................................... Virginia ............................................ Washington ..................................... West Virginia ................................... Wisconsin ....................................... Wyoming .........................................
2,256
155 -
13 85 93 16 3 3
238 56
32 28 22 7
29 4
30 454 10 6
12 32 34
224 35 4
21 - 7 9
2 28
122 -
59 7
20 56
- 25
7
14 85 9 6
31 18 19 80 6
249,274
20,956 -
71 25,464 3,825
149 21
(D) 2,003
963
128 454 474 (D) 388 (D) 383
97,904 337 54
445 165
26,597 47,475 1,809
6 373
- 5
84
(D) 534
2,610 -
424 197 185 856
- 470
(D) 577
6,855 84 4
653 173 87
836 27
3,127
213 1
11 211 96 15 3 3
196 78
33 35 47 17 21 12 65
738 10 11
18 34 77
403 35 8
26 - 5
17
3 41
129 1
55 20 26 56 2
43
7 45 79 11 9
28 21 21 84 7
365,566
25,351 (D) 31
61,135 3,338
85 (D) (D)
2,292 1,914
75
151 805 443 594 590 624
104,645 32
155
60 429
41,023 102,898
2,689 13
503 -
10 51
1
385 3,463
(D) 759 557 101 626 (D) 683
1,066
707 4,651
38 11
143 209 48
1,977 37
466
19 - 3
18 19 5 - 1
16 6
11 9 3 2 8 1 2
197 3 -
1 4
21 53 1 - 3 - 2 2
1 1
14 - 4 1 2 9 - -
3 - 9 - - 2 4 1 5 -
102,672
2,211 - 1
5,007 1,628
34 -
(D) 118 (D)
102 49 66
(D) 72
(D) (D)
58,479 6 -
(D) 3
21,744 8,091
(D) -
(D) -
(D) (D)
(D) (D) 49
- 15
(D) (D) 212
- -
(D) -
937 - -
(D) 35
(D) 376
-
773
24 - -
71 19 2 - - 9 4
16 10 3 2
10 5 8
365 - -
1 3
52 82 3 - 3 - - 2
- 4
10 1 8 2 1 9 1 3
5 2
13 2 2 3 2 1 9 1
129,399
1,967 - -
14,707 1,010
(D) - -
35 (D)
70 17 5
(D) 188 177 109
56,299 - -
(D) (D)
35,262 15,071
(D) -
(D) - -
(D)
- (D) (D) (D) 151 (D) (D) 173 (D) (D)
867 (D) 740 (D) (D) (D) (D) (D) 989 (D)
--continued
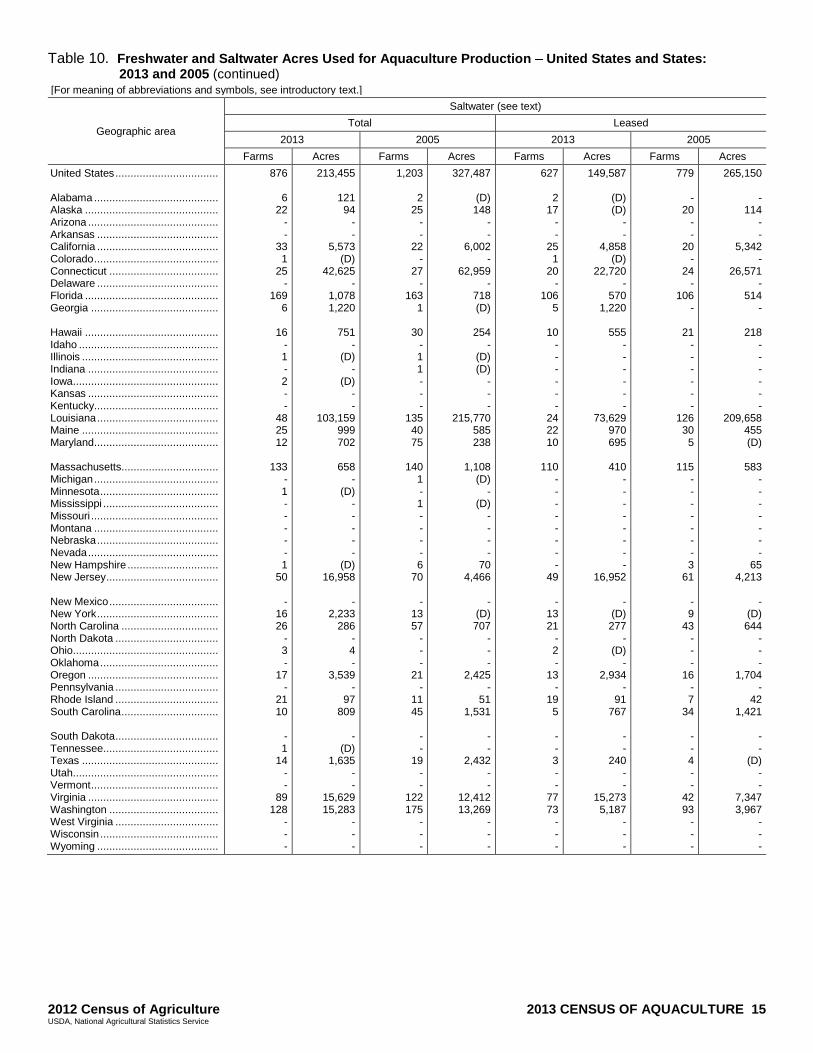
2012 Census of Agriculture 2013 CENSUS OF AQUACULTURE 15 USDA, National Agricultural Statistics Service
Table 10. Freshwater and Saltwater Acres Used for Aquaculture Production United States and States: 2013 and 2005 (continued)
[For meaning of abbreviations and symbols, see introductory text.]
Geographic area
Saltwater (see text)
Total Leased
2013 2005 2013 2005
Farms Acres Farms Acres Farms Acres Farms Acres
United States .................................. Alabama ......................................... Alaska ............................................ Arizona ........................................... Arkansas ........................................ California ........................................ Colorado ......................................... Connecticut .................................... Delaware ........................................ Florida ............................................ Georgia .......................................... Hawaii ............................................ Idaho .............................................. Illinois ............................................. Indiana ........................................... Iowa................................................ Kansas ........................................... Kentucky......................................... Louisiana ........................................ Maine ............................................. Maryland......................................... Massachusetts................................ Michigan ......................................... Minnesota ....................................... Mississippi ...................................... Missouri .......................................... Montana ......................................... Nebraska ........................................ Nevada ........................................... New Hampshire .............................. New Jersey ..................................... New Mexico .................................... New York ........................................ North Carolina ................................ North Dakota .................................. Ohio................................................ Oklahoma ....................................... Oregon ........................................... Pennsylvania .................................. Rhode Island .................................. South Carolina ................................ South Dakota .................................. Tennessee ...................................... Texas ............................................. Utah................................................ Vermont .......................................... Virginia ........................................... Washington .................................... West Virginia .................................. Wisconsin ....................................... Wyoming ........................................
876
6 22
- -
33 1
25 -
169 6
16 - 1 - 2 - -
48 25 12
133
- 1 - - - - - 1
50
- 16 26
- 3 -
17 -
21 10
- 1
14 - -
89 128
- - -
213,455
121 94
- -
5,573 (D)
42,625 -
1,078 1,220
751
- (D)
- (D)
- -
103,159 999 702
658
- (D)
- - - - -
(D) 16,958
-
2,233 286
- 4 -
3,539 -
97 809
-
(D) 1,635
- -
15,629 15,283
- - -
1,203
2 25
- -
22 -
27 -
163 1
30 - 1 1 - - -
135 40 75
140
1 - 1 - - - - 6
70
- 13 57
- - -
21 -
11 45
- -
19 - -
122 175
- - -
327,487
(D) 148
- -
6,002 -
62,959 -
718 (D)
254
- (D) (D)
- - -
215,770 585 238
1,108
(D) -
(D) - - - -
70 4,466
-
(D) 707
- - -
2,425 -
51 1,531
- -
2,432 - -
12,412 13,269
- - -
627
2 17
- -
25 1
20 -
106 5
10 - - - - - -
24 22 10
110
- - - - - - - -
49
- 13 21
- 2 -
13 -
19 5
- - 3 - -
77 73
- - -
149,587
(D) (D)
- -
4,858 (D)
22,720 -
570 1,220
555
- - - - - -
73,629 970 695
410
- - - - - - - -
16,952
- (D) 277
- (D)
- 2,934
- 91
767
- -
240 - -
15,273 5,187
- - -
779
- 20
- -
20 -
24 -
106 -
21 - - - - - -
126 30 5
115 - - - - - - - 3
61
- 9
43 - - -
16 - 7
34
- - 4 - -
42 93
- - -
265,150
- 114
- -
5,342 -
26,571 -
514 -
218 - - - - - -
209,658 455 (D)
583
- - - - - - -
65 4,213
-
(D) 644
- - -
1,704 -
42 1,421
- -
(D) - -
7,347 3,967
- - -
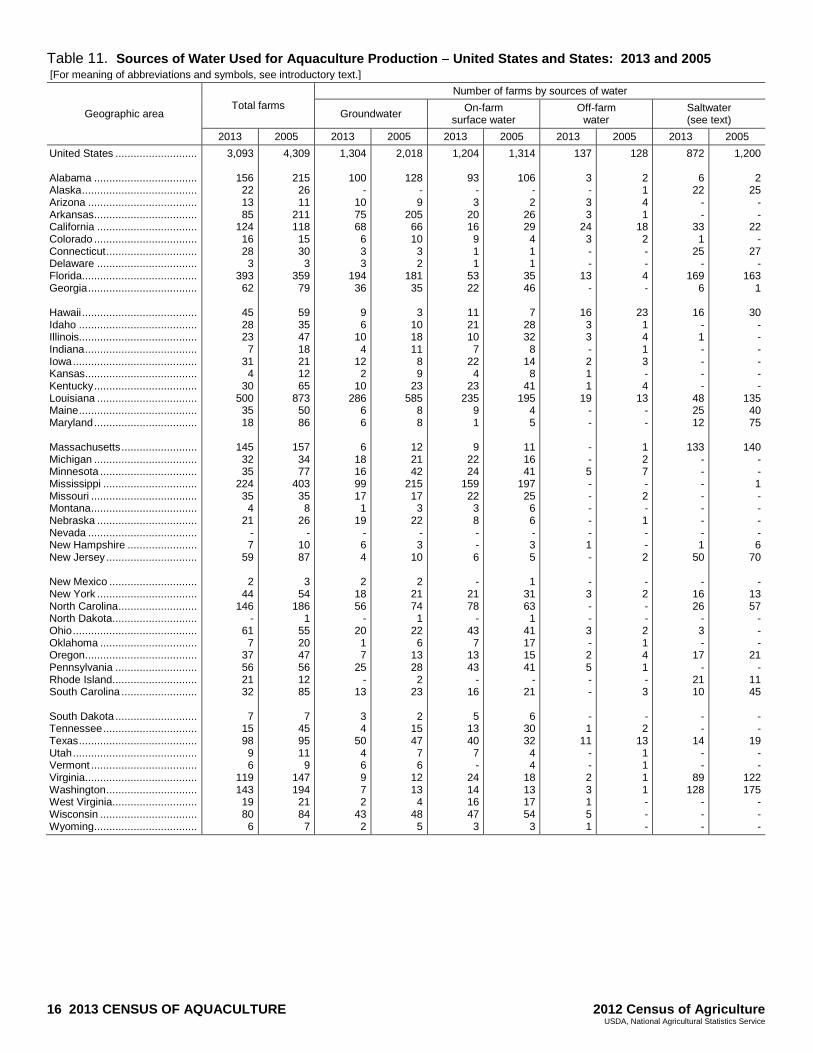
16 2013 CENSUS OF AQUACULTURE 2012 Census of Agriculture USDA, National Agricultural Statistics Service
Table 11. Sources of Water Used for Aquaculture Production United States and States: 2013 and 2005 [For meaning of abbreviations and symbols, see introductory text.]
Geographic area Total farms
Number of farms by sources of water
Groundwater On-farm
surface water Off-farm
water Saltwater (see text)
2013 2005 2013 2005 2013 2005 2013 2005 2013 2005
United States ........................... Alabama .................................. Alaska ...................................... Arizona .................................... Arkansas .................................. California ................................. Colorado .................................. Connecticut .............................. Delaware ................................. Florida...................................... Georgia .................................... Hawaii ...................................... Idaho ....................................... Illinois....................................... Indiana ..................................... Iowa ......................................... Kansas ..................................... Kentucky .................................. Louisiana ................................. Maine ....................................... Maryland .................................. Massachusetts ......................... Michigan .................................. Minnesota ................................ Mississippi ............................... Missouri ................................... Montana ................................... Nebraska ................................. Nevada .................................... New Hampshire ....................... New Jersey .............................. New Mexico ............................. New York ................................. North Carolina .......................... North Dakota ............................ Ohio ......................................... Oklahoma ................................ Oregon ..................................... Pennsylvania ........................... Rhode Island ............................ South Carolina ......................... South Dakota ........................... Tennessee ............................... Texas ....................................... Utah ......................................... Vermont ................................... Virginia ..................................... Washington .............................. West Virginia ............................ Wisconsin ................................ Wyoming ..................................
3,093
156 22 13 85
124 16 28 3
393 62
45 28 23 7
31 4
30 500 35 18
145 32 35
224 35 4
21 - 7
59
2 44
146 -
61 7
37 56 21 32
7
15 98 9 6
119 143 19 80 6
4,309
215 26 11
211 118 15 30 3
359 79
59 35 47 18 21 12 65
873 50 86
157 34 77
403 35 8
26 -
10 87
3
54 186
1 55 20 47 56 12 85
7
45 95 11 9
147 194 21 84 7
1,304
100 -
10 75 68 6 3 3
194 36
9 6
10 4
12 2
10 286
6 6
6 18 16 99 17 1
19 - 6 4
2 18 56
- 20 1 7
25 -
13
3 4
50 4 6 9 7 2
43 2
2,018
128 - 9
205 66 10 3 2
181 35
3
10 18 11 8 9
23 585
8 8
12 21 42
215 17 3
22 - 3
10
2 21 74 1
22 6
13 28 2
23
2 15 47 7 6
12 13 4
48 5
1,204
93 - 3
20 16 9 1 1
53 22
11 21 10 7
22 4
23 235
9 1
9 22 24
159 22 3 8 - - 6
- 21 78
- 43 7
13 43
- 16
5
13 40 7 -
24 14 16 47 3
1,314
106 - 2
26 29 4 1 1
35 46
7
28 32 8
14 8
41 195
4 5
11 16 41
197 25 6 6 - 3 5
1 31 63 1
41 17 15 41
- 21
6
30 32 4 4
18 13 17 54 3
137
3 - 3 3
24 3 - -
13 -
16 3 3 - 2 1 1
19 - -
- - 5 - - - - - 1 -
- 3 - - 3 - 2 5 - -
- 1
11 - - 2 3 1 5 1
128
2 1 4 1
18 2 - - 4 -
23 1 4 1 3 - 4
13 - -
1 2 7 - 2 - 1 - - 2
- 2 - - 2 1 4 1 - 3
- 2
13 1 1 1 1 - - -
872
6 22
- -
33 1
25 -
169 6
16 - 1 - - - -
48 25 12
133
- - - - - - - 1
50
- 16 26
- 3 -
17 -
21 10
- -
14 - -
89 128
- - -
1,200
2 25
- -
22 -
27 -
163 1
30 - - - - - -
135 40 75
140
- - 1 - - - - 6
70
- 13 57
- - -
21 -
11 45
- -
19 - -
122 175
- - -
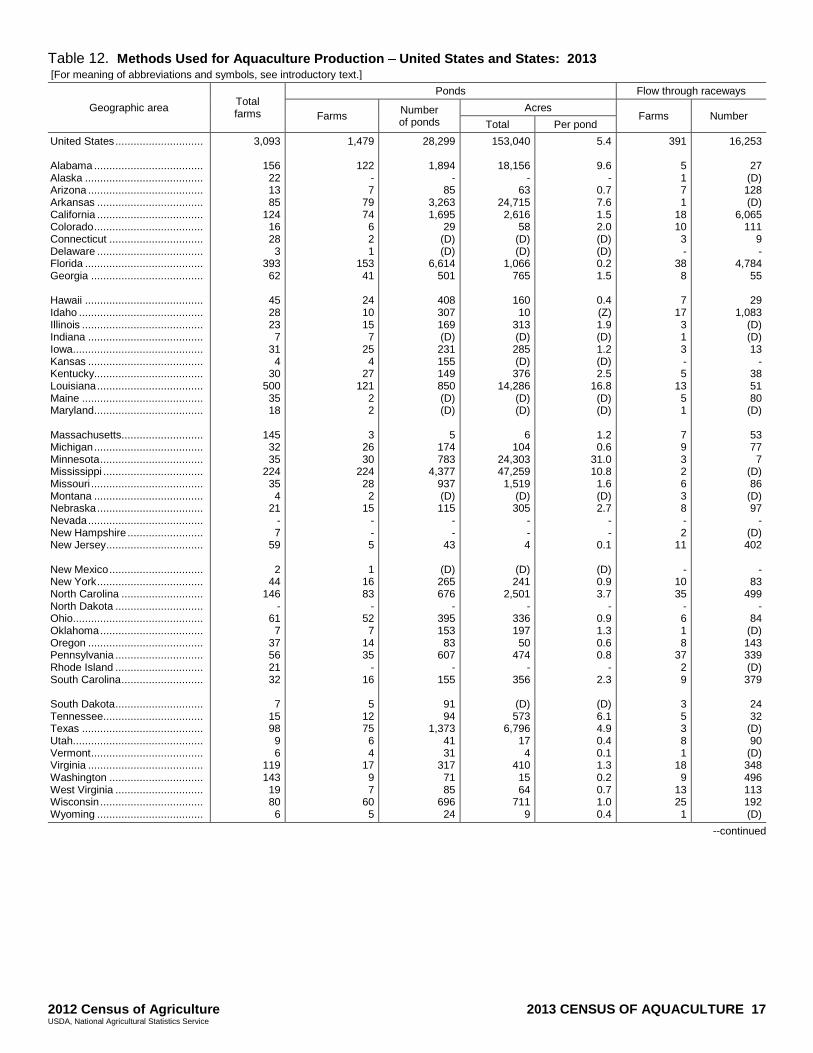
2012 Census of Agriculture 2013 CENSUS OF AQUACULTURE 17 USDA, National Agricultural Statistics Service
Table 12. Methods Used for Aquaculture Production United States and States: 2013 [For meaning of abbreviations and symbols, see introductory text.]
Geographic area Total farms
Ponds Flow through raceways
Farms Number of ponds
Acres Farms Number
Total Per pond
United States ............................. Alabama .................................... Alaska ....................................... Arizona ...................................... Arkansas ................................... California ................................... Colorado .................................... Connecticut ............................... Delaware ................................... Florida ....................................... Georgia ..................................... Hawaii ....................................... Idaho ......................................... Illinois ........................................ Indiana ...................................... Iowa........................................... Kansas ...................................... Kentucky.................................... Louisiana ................................... Maine ........................................ Maryland.................................... Massachusetts........................... Michigan .................................... Minnesota .................................. Mississippi ................................. Missouri ..................................... Montana .................................... Nebraska ................................... Nevada ...................................... New Hampshire ......................... New Jersey ................................ New Mexico ............................... New York ................................... North Carolina ........................... North Dakota ............................. Ohio........................................... Oklahoma .................................. Oregon ...................................... Pennsylvania ............................. Rhode Island ............................. South Carolina ........................... South Dakota ............................. Tennessee ................................. Texas ........................................ Utah........................................... Vermont ..................................... Virginia ...................................... Washington ............................... West Virginia ............................. Wisconsin .................................. Wyoming ...................................
3,093
156 22 13 85
124 16 28 3
393 62
45 28 23 7
31 4
30 500 35 18
145 32 35
224 35 4
21 - 7
59
2 44
146 -
61 7
37 56 21 32
7
15 98 9 6
119 143 19 80 6
1,479
122 - 7
79 74 6 2 1
153 41
24 10 15 7
25 4
27 121
2 2
3 26 30
224 28 2
15 - - 5
1 16 83
- 52 7
14 35
- 16
5
12 75 6 4
17 9 7
60 5
28,299
1,894 -
85 3,263 1,695
29 (D) (D)
6,614 501
408 307 169 (D) 231 155 149 850 (D) (D)
5
174 783
4,377 937 (D) 115
- -
43
(D) 265 676
- 395 153 83
607 -
155
91 94
1,373 41 31
317 71 85
696 24
153,040
18,156 -
63 24,715 2,616
58 (D) (D)
1,066 765
160 10
313 (D) 285 (D) 376
14,286 (D) (D)
6
104 24,303 47,259 1,519
(D) 305
- - 4
(D) 241
2,501 -
336 197 50
474 -
356
(D) 573
6,796 17 4
410 15 64
711 9
5.4
9.6 -
0.7 7.6 1.5 2.0 (D) (D) 0.2 1.5
0.4 (Z) 1.9 (D) 1.2 (D) 2.5
16.8 (D) (D)
1.2 0.6
31.0 10.8 1.6 (D) 2.7
- -
0.1
(D) 0.9 3.7
- 0.9 1.3 0.6 0.8
- 2.3
(D) 6.1 4.9 0.4 0.1 1.3 0.2 0.7 1.0 0.4
391
5 1 7 1
18 10 3 -
38 8
7 17 3 1 3 - 5
13 5 1
7 9 3 2 6 3 8 - 2
11
- 10 35
- 6 1 8
37 2 9
3 5 3 8 1
18 9
13 25 1
16,253
27 (D) 128 (D)
6,065 111
9 -
4,784 55
29
1,083 (D) (D) 13
- 38 51 80
(D)
53 77 7
(D) 86
(D) 97
- (D) 402
-
83 499
- 84
(D) 143 339 (D) 379
24 32
(D) 90
(D) 348 496 113 192 (D)
--continued
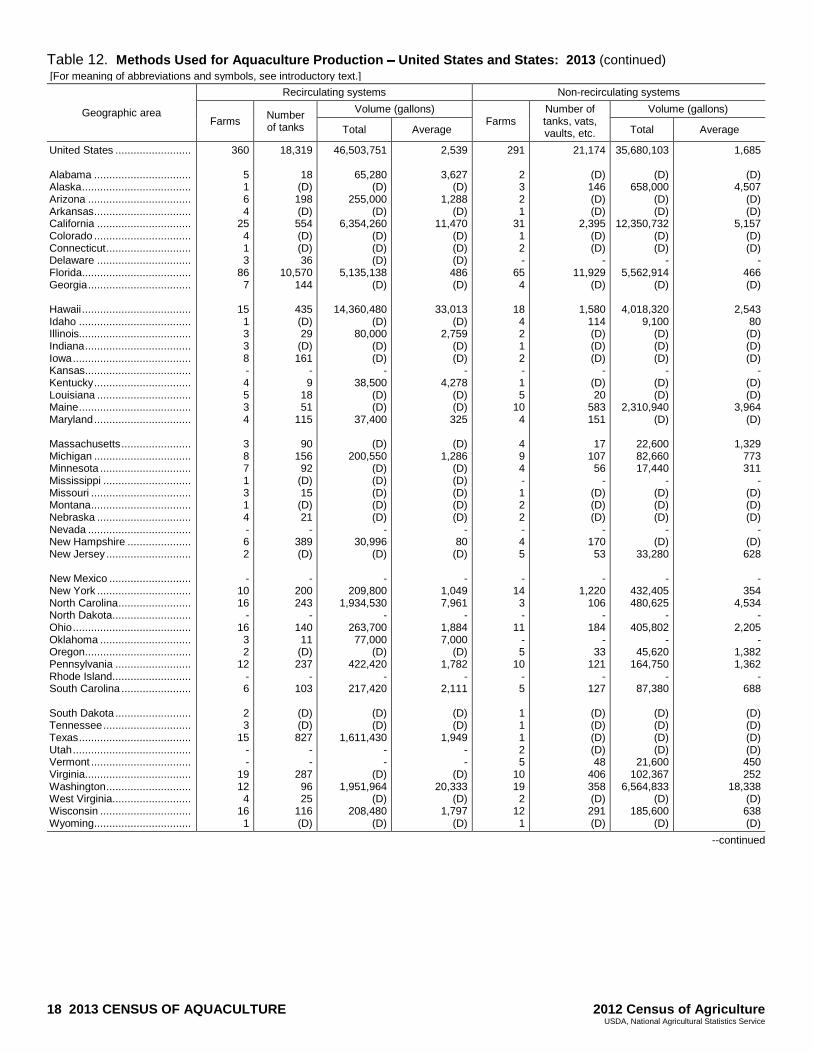
18 2013 CENSUS OF AQUACULTURE 2012 Census of Agriculture USDA, National Agricultural Statistics Service
Table 12. Methods Used for Aquaculture Production United States and States: 2013 (continued) [For meaning of abbreviations and symbols, see introductory text.]
Geographic area
Recirculating systems Non-recirculating systems
Farms Number of tanks
Volume (gallons) Farms
Number of tanks, vats, vaults, etc.
Volume (gallons)
Total Average Total Average
United States ......................... Alabama ................................ Alaska .................................... Arizona .................................. Arkansas ................................ California ............................... Colorado ................................ Connecticut ............................ Delaware ............................... Florida.................................... Georgia .................................. Hawaii .................................... Idaho ..................................... Illinois..................................... Indiana ................................... Iowa ....................................... Kansas ................................... Kentucky ................................ Louisiana ............................... Maine ..................................... Maryland ................................ Massachusetts ....................... Michigan ................................ Minnesota .............................. Mississippi ............................. Missouri ................................. Montana ................................. Nebraska ............................... Nevada .................................. New Hampshire ..................... New Jersey ............................ New Mexico ........................... New York ............................... North Carolina ........................ North Dakota .......................... Ohio ....................................... Oklahoma .............................. Oregon ................................... Pennsylvania ......................... Rhode Island .......................... South Carolina ....................... South Dakota ......................... Tennessee ............................. Texas ..................................... Utah ....................................... Vermont ................................. Virginia ................................... Washington ............................ West Virginia .......................... Wisconsin .............................. Wyoming ................................
360
5 1 6 4
25 4 1 3
86 7
15 1 3 3 8 - 4 5 3 4
3 8 7 1 3 1 4 - 6 2
- 10 16
- 16 3 2
12 - 6
2 3
15 - -
19 12 4
16 1
18,319
18 (D) 198 (D) 554 (D) (D) 36
10,570 144
435 (D) 29
(D) 161
- 9
18 51
115
90 156 92
(D) 15
(D) 21
- 389 (D)
-
200 243
- 140 11
(D) 237
- 103
(D) (D) 827
- -
287 96 25
116 (D)
46,503,751
65,280 (D)
255,000 (D)
6,354,260 (D) (D) (D)
5,135,138 (D)
14,360,480
(D) 80,000
(D) (D)
- 38,500
(D) (D)
37,400
(D) 200,550
(D) (D) (D) (D) (D)
- 30,996
(D)
- 209,800
1,934,530 -
263,700 77,000
(D) 422,420
- 217,420
(D) (D)
1,611,430 - -
(D) 1,951,964
(D) 208,480
(D)
2,539
3,627 (D)
1,288 (D)
11,470 (D) (D) (D) 486 (D)
33,013
(D) 2,759
(D) (D)
- 4,278
(D) (D) 325
(D)
1,286 (D) (D) (D) (D) (D)
- 80
(D)
- 1,049 7,961
- 1,884 7,000
(D) 1,782
- 2,111
(D) (D)
1,949 - -
(D) 20,333
(D) 1,797
(D)
291
2 3 2 1
31 1 2 -
65 4
18 4 2 1 2 - 1 5
10 4
4 9 4 - 1 2 2 - 4 5
- 14 3 -
11 - 5
10 - 5
1 1 1 2 5
10 19 2
12 1
21,174
(D) 146 (D) (D)
2,395 (D) (D)
- 11,929
(D)
1,580 114 (D) (D) (D)
- (D) 20
583 151
17
107 56
- (D) (D) (D)
- 170 53
-
1,220 106
- 184
- 33
121 -
127
(D) (D) (D) (D) 48
406 358 (D) 291 (D)
35,680,103
(D) 658,000
(D) (D)
12,350,732 (D) (D)
- 5,562,914
(D)
4,018,320 9,100
(D) (D) (D)
- (D) (D)
2,310,940 (D)
22,600 82,660 17,440
- (D) (D) (D)
- (D)
33,280
- 432,405 480,625
- 405,802
- 45,620
164,750 -
87,380
(D) (D) (D) (D)
21,600 102,367
6,564,833 (D)
185,600 (D)
1,685
(D) 4,507
(D) (D)
5,157 (D) (D)
- 466 (D)
2,543
80 (D) (D) (D)
- (D) (D)
3,964 (D)
1,329
773 311
- (D) (D) (D)
- (D) 628
-
354 4,534
- 2,205
- 1,382 1,362
- 688
(D) (D) (D) (D) 450 252
18,338 (D) 638 (D)
--continued
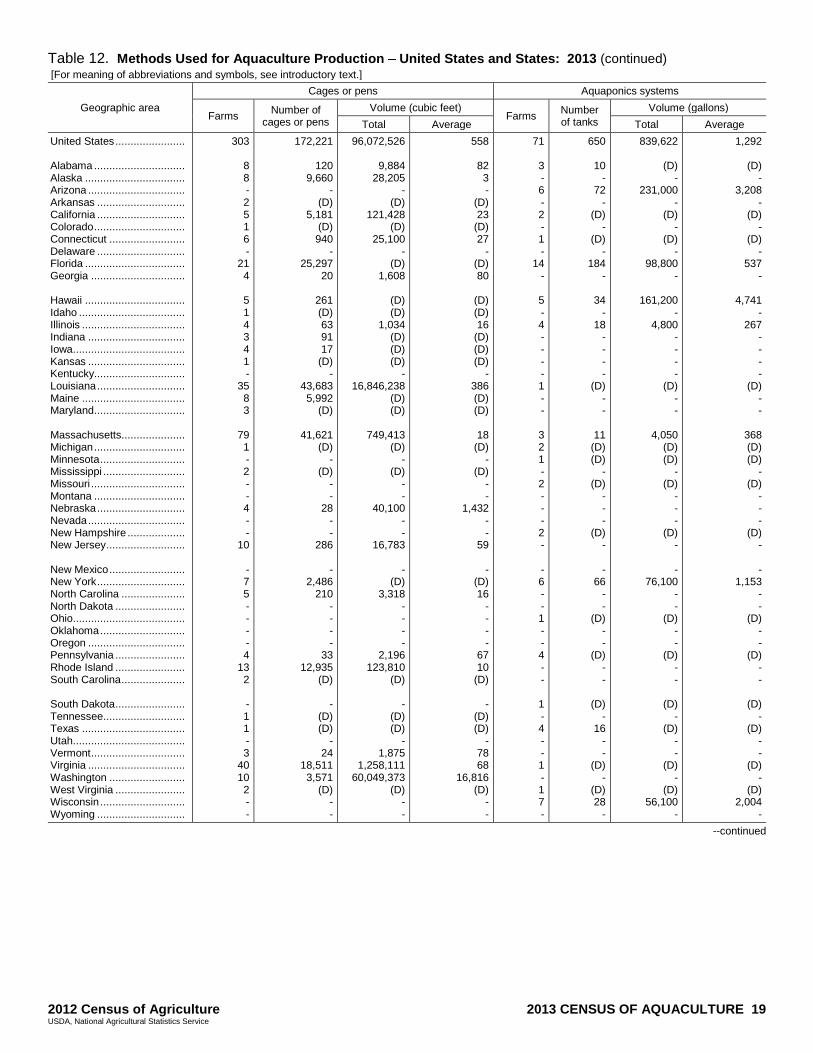
2012 Census of Agriculture 2013 CENSUS OF AQUACULTURE 19 USDA, National Agricultural Statistics Service
Table 12. Methods Used for Aquaculture Production United States and States: 2013 (continued) [For meaning of abbreviations and symbols, see introductory text.]
Geographic area
Cages or pens Aquaponics systems
Farms Number of
cages or pens
Volume (cubic feet) Farms
Number of tanks
Volume (gallons)
Total Average Total Average
United States ....................... Alabama .............................. Alaska ................................. Arizona ................................ Arkansas ............................. California ............................. Colorado .............................. Connecticut ......................... Delaware ............................. Florida ................................. Georgia ............................... Hawaii ................................. Idaho ................................... Illinois .................................. Indiana ................................ Iowa..................................... Kansas ................................ Kentucky.............................. Louisiana ............................. Maine .................................. Maryland.............................. Massachusetts..................... Michigan .............................. Minnesota ............................ Mississippi ........................... Missouri ............................... Montana .............................. Nebraska ............................. Nevada ................................ New Hampshire ................... New Jersey .......................... New Mexico ......................... New York ............................. North Carolina ..................... North Dakota ....................... Ohio..................................... Oklahoma ............................ Oregon ................................ Pennsylvania ....................... Rhode Island ....................... South Carolina ..................... South Dakota ....................... Tennessee ........................... Texas .................................. Utah..................................... Vermont ............................... Virginia ................................ Washington ......................... West Virginia ....................... Wisconsin ............................ Wyoming .............................
303
8 8 - 2 5 1 6 -
21 4
5 1 4 3 4 1 -
35 8 3
79 1 - 2 - - 4 - -
10
- 7 5 - - - - 4
13 2
- 1 1 - 3
40 10 2 - -
172,221
120 9,660
- (D)
5,181 (D) 940
- 25,297
20
261 (D) 63 91 17
(D) -
43,683 5,992
(D)
41,621 (D)
- (D)
- -
28 - -
286
- 2,486
210 - - - -
33 12,935
(D)
- (D) (D)
- 24
18,511 3,571
(D) - -
96,072,526
9,884 28,205
- (D)
121,428 (D)
25,100 -
(D) 1,608
(D) (D)
1,034 (D) (D) (D)
- 16,846,238
(D) (D)
749,413
(D) -
(D) - -
40,100 - -
16,783
- (D)
3,318 - - - -
2,196 123,810
(D)
- (D) (D)
- 1,875
1,258,111 60,049,373
(D) - -
558
82 3 -
(D) 23
(D) 27
- (D) 80
(D) (D) 16
(D) (D) (D)
- 386 (D) (D)
18
(D) -
(D) - -
1,432 - -
59
- (D) 16
- - - -
67 10
(D)
- (D) (D)
- 78 68
16,816 (D)
- -
71
3 - 6 - 2 - 1 -
14 -
5 - 4 - - - - 1 - -
3 2 1 - 2 - - - 2 -
- 6 - - 1 - - 4 - -
1 - 4 - - 1 - 1 7 -
650
10 -
72 -
(D) -
(D) -
184 -
34 -
18 - - - -
(D) - -
11 (D) (D)
- (D)
- - -
(D) -
- 66
- -
(D) - -
(D) - -
(D) -
16 - -
(D) -
(D) 28
-
839,622
(D) -
231,000 -
(D) -
(D) -
98,800 -
161,200 -
4,800 - - - -
(D) - -
4,050 (D) (D)
- (D)
- - -
(D) -
- 76,100
- -
(D) - -
(D) - -
(D) -
(D) - -
(D) -
(D) 56,100
-
1,292
(D) -
3,208 -
(D) -
(D) -
537 -
4,741 -
267 - - - -
(D) - -
368 (D) (D)
- (D)
- - -
(D) -
- 1,153
- -
(D) - -
(D) - -
(D) -
(D) - -
(D) -
(D) 2,004
-
--continued
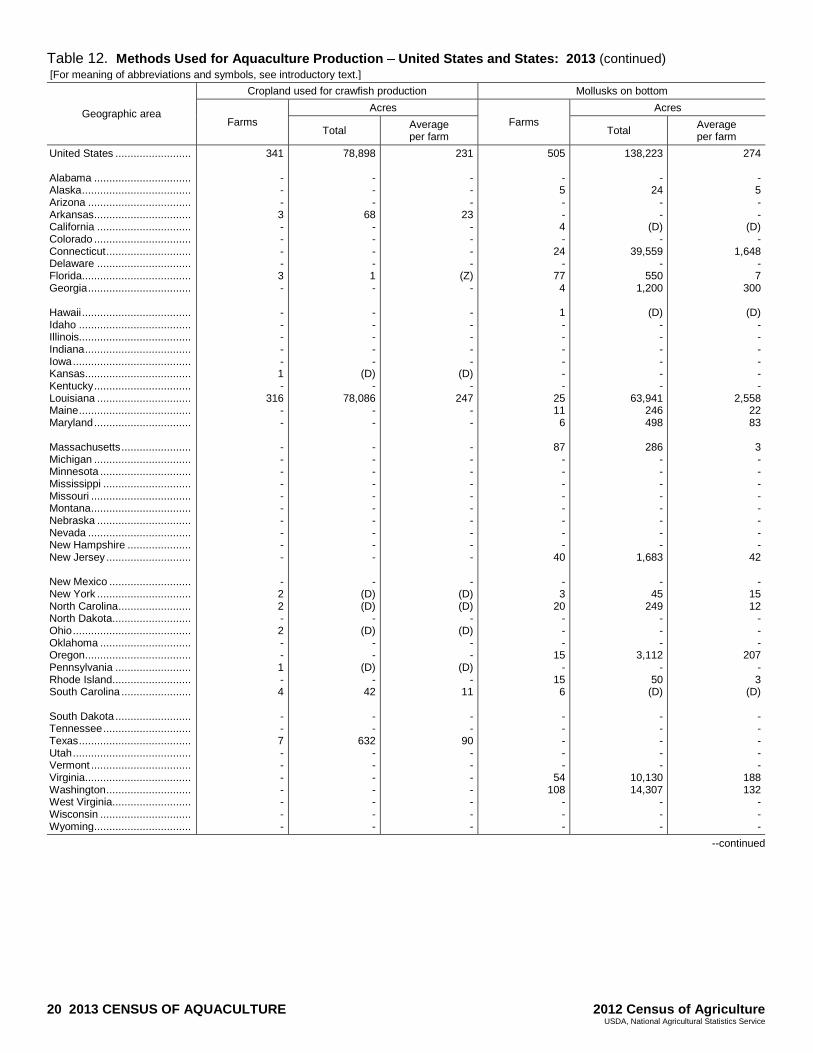
20 2013 CENSUS OF AQUACULTURE 2012 Census of Agriculture USDA, National Agricultural Statistics Service
Table 12. Methods Used for Aquaculture Production United States and States: 2013 (continued) [For meaning of abbreviations and symbols, see introductory text.]
Geographic area
Cropland used for crawfish production Mollusks on bottom
Farms
Acres
Farms
Acres
Total Average per farm
Total Average per farm
United States ......................... Alabama ................................ Alaska .................................... Arizona .................................. Arkansas ................................ California ............................... Colorado ................................ Connecticut ............................ Delaware ............................... Florida.................................... Georgia .................................. Hawaii .................................... Idaho ..................................... Illinois..................................... Indiana ................................... Iowa ....................................... Kansas ................................... Kentucky ................................ Louisiana ............................... Maine ..................................... Maryland ................................ Massachusetts ....................... Michigan ................................ Minnesota .............................. Mississippi ............................. Missouri ................................. Montana ................................. Nebraska ............................... Nevada .................................. New Hampshire ..................... New Jersey ............................ New Mexico ........................... New York ............................... North Carolina ........................ North Dakota .......................... Ohio ....................................... Oklahoma .............................. Oregon ................................... Pennsylvania ......................... Rhode Island .......................... South Carolina ....................... South Dakota ......................... Tennessee ............................. Texas ..................................... Utah ....................................... Vermont ................................. Virginia ................................... Washington ............................ West Virginia .......................... Wisconsin .............................. Wyoming ................................
341
- - - 3 - - - - 3 -
- - - - - 1 -
316 - -
- - - - - - - - - -
- 2 2 - 2 - - 1 - 4
- - 7 - - - - - - -
78,898
- - -
68 - - - - 1 -
- - - - -
(D) -
78,086 - -
- - - - - - - - - -
- (D) (D)
- (D)
- -
(D) -
42
- -
632 - - - - - - -
231
- - -
23 - - - -
(Z) -
- - - - -
(D) -
247 - -
- - - - - - - - - -
- (D) (D)
- (D)
- -
(D) -
11
- -
90 - - - - - - -
505
- 5 - - 4 -
24 -
77 4
1 - - - - - -
25 11 6
87 - - - - - - - -
40
- 3
20 - - -
15 -
15 6
- - - - -
54 108
- - -
138,223
- 24
- -
(D) -
39,559 -
550 1,200
(D)
- - - - - -
63,941 246 498
286
- - - - - - - -
1,683
- 45
249 - - -
3,112 -
50 (D)
- - - - -
10,130 14,307
- - -
274
- 5 - -
(D) -
1,648 - 7
300
(D) - - - - - -
2,558 22 83
3 - - - - - - - -
42
- 15 12
- - -
207 - 3
(D)
- - - - -
188 132
- - -
--continued
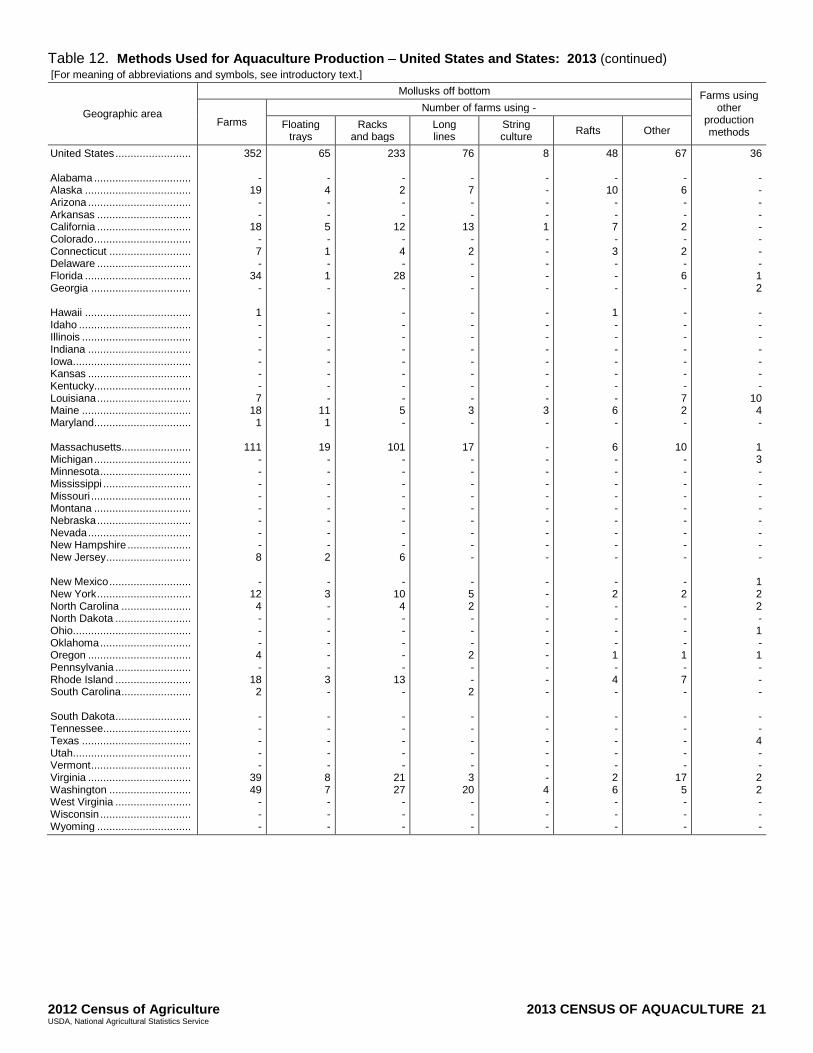
2012 Census of Agriculture 2013 CENSUS OF AQUACULTURE 21 USDA, National Agricultural Statistics Service
Table 12. Methods Used for Aquaculture Production United States and States: 2013 (continued) [For meaning of abbreviations and symbols, see introductory text.]
Geographic area
Mollusks off bottom Farms using other
production methods
Farms
Number of farms using -
Floating trays
Racks and bags
Long lines
String culture
Rafts Other
United States ......................... Alabama ................................ Alaska ................................... Arizona .................................. Arkansas ............................... California ............................... Colorado ................................ Connecticut ........................... Delaware ............................... Florida ................................... Georgia ................................. Hawaii ................................... Idaho ..................................... Illinois .................................... Indiana .................................. Iowa....................................... Kansas .................................. Kentucky................................ Louisiana ............................... Maine .................................... Maryland................................ Massachusetts....................... Michigan ................................ Minnesota .............................. Mississippi ............................. Missouri ................................. Montana ................................ Nebraska ............................... Nevada .................................. New Hampshire ..................... New Jersey ............................ New Mexico ........................... New York ............................... North Carolina ....................... North Dakota ......................... Ohio....................................... Oklahoma .............................. Oregon .................................. Pennsylvania ......................... Rhode Island ......................... South Carolina ....................... South Dakota ......................... Tennessee ............................. Texas .................................... Utah....................................... Vermont ................................. Virginia .................................. Washington ........................... West Virginia ......................... Wisconsin .............................. Wyoming ...............................
352
- 19
- -
18 - 7 -
34 -
1 - - - - - - 7
18 1
111
- - - - - - - - 8
-
12 4 - - - 4 -
18 2
- - - - -
39 49
- - -
65
- 4 - - 5 - 1 - 1 -
- - - - - - - -
11 1
19 - - - - - - - - 2
- 3 - - - - - - 3 -
- - - - - 8 7 - - -
233
- 2 - -
12 - 4 -
28 -
- - - - - - - - 5 -
101 - - - - - - - - 6
- 10 4 - - - - -
13 -
- - - - -
21 27
- - -
76
- 7 - -
13 - 2 - - -
- - - - - - - - 3 -
17 - - - - - - - - -
- 5 2 - - - 2 - - 2
- - - - - 3
20 - - -
8
- - - - 1 - - - - -
- - - - - - - - 3 -
- - - - - - - - - -
- - - - - - - - - -
- - - - - - 4 - - -
48
- 10
- - 7 - 3 - - -
1 - - - - - - - 6 -
6 - - - - - - - - -
- 2 - - - - 1 - 4 -
- - - - - 2 6 - - -
67
- 6 - - 2 - 2 - 6 -
- - - - - - - 7 2 -
10 - - - - - - - - -
- 2 - - - - 1 - 7 -
- - - - -
17 5 - - -
36
- - - - - - - - 1 2
- - - - - - -
10 4 -
1 3 - - - - - - - -
1 2 2 - 1 - 1 - - -
- - 4 - - 2 2 - - -
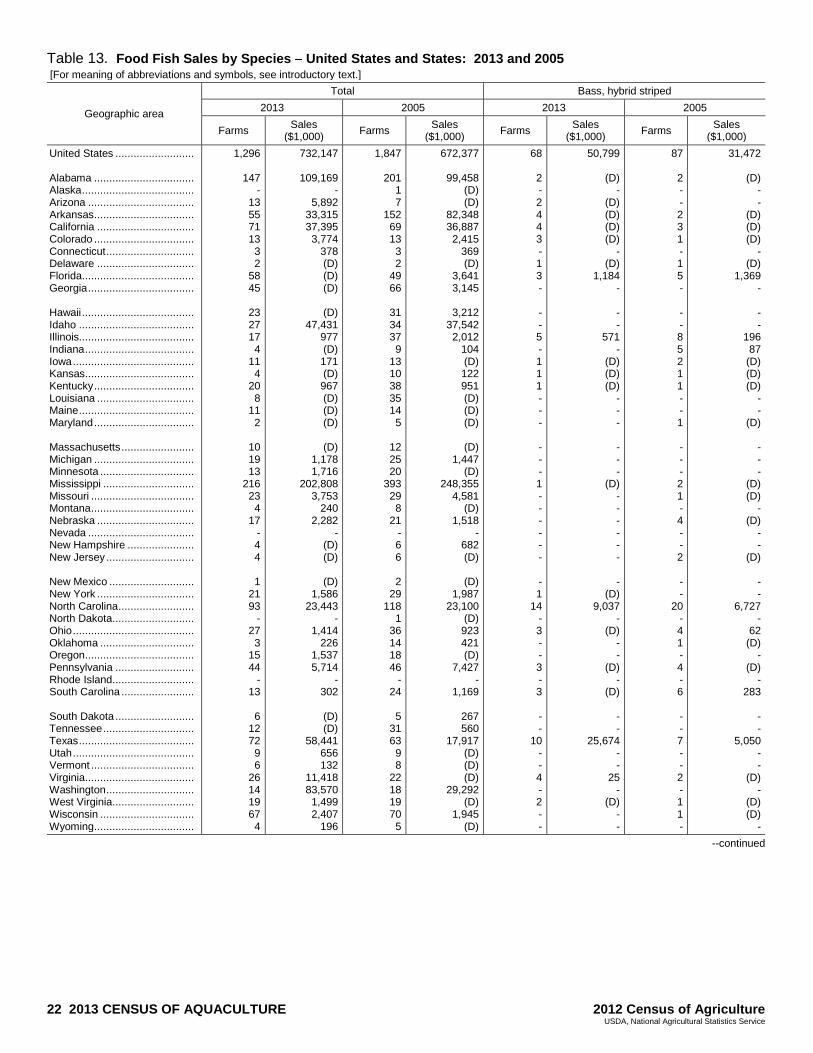
22 2013 CENSUS OF AQUACULTURE 2012 Census of Agriculture USDA, National Agricultural Statistics Service
Table 13. Food Fish Sales by Species United States and States: 2013 and 2005 [For meaning of abbreviations and symbols, see introductory text.]
Geographic area
Total Bass, hybrid striped
2013 2005 2013 2005
Farms Sales
($1,000) Farms
Sales ($1,000)
Farms Sales
($1,000) Farms
Sales ($1,000)
United States .......................... Alabama ................................. Alaska ..................................... Arizona ................................... Arkansas ................................. California ................................ Colorado ................................. Connecticut ............................. Delaware ................................ Florida..................................... Georgia ................................... Hawaii ..................................... Idaho ...................................... Illinois...................................... Indiana .................................... Iowa ........................................ Kansas .................................... Kentucky ................................. Louisiana ................................ Maine ...................................... Maryland ................................. Massachusetts ........................ Michigan ................................. Minnesota ............................... Mississippi .............................. Missouri .................................. Montana .................................. Nebraska ................................ Nevada ................................... New Hampshire ...................... New Jersey ............................. New Mexico ............................ New York ................................ North Carolina ......................... North Dakota ........................... Ohio ........................................ Oklahoma ............................... Oregon .................................... Pennsylvania .......................... Rhode Island ........................... South Carolina ........................ South Dakota .......................... Tennessee .............................. Texas ...................................... Utah ........................................ Vermont .................................. Virginia .................................... Washington ............................. West Virginia ........................... Wisconsin ............................... Wyoming .................................
1,296
147 -
13 55 71 13 3 2
58 45
23 27 17 4
11 4
20 8
11 2
10 19 13
216 23 4
17 - 4 4
1
21 93
- 27 3
15 44
- 13
6
12 72 9 6
26 14 19 67 4
732,147
109,169 -
5,892 33,315 37,395 3,774
378 (D) (D) (D)
(D)
47,431 977 (D) 171 (D) 967 (D) (D) (D)
(D)
1,178 1,716
202,808 3,753
240 2,282
- (D) (D)
(D)
1,586 23,443
- 1,414
226 1,537 5,714
- 302
(D) (D)
58,441 656 132
11,418 83,570 1,499 2,407
196
1,847
201 1 7
152 69 13 3 2
49 66
31 34 37 9
13 10 38 35 14 5
12 25 20
393 29 8
21 - 6 6
2 29
118 1
36 14 18 46
- 24
5
31 63 9 8
22 18 19 70 5
672,377
99,458 (D) (D)
82,348 36,887 2,415
369 (D)
3,641 3,145
3,212
37,542 2,012
104 (D) 122 951 (D) (D) (D)
(D)
1,447 (D)
248,355 4,581
(D) 1,518
- 682 (D)
(D)
1,987 23,100
(D) 923 421 (D)
7,427 -
1,169
267 560
17,917 (D) (D) (D)
29,292 (D)
1,945 (D)
68
2 - 2 4 4 3 - 1 3 -
- - 5 - 1 1 1 - - -
- - - 1 - - - - - -
- 1
14 - 3 - - 3 - 3
- -
10 - - 4 - 2 - -
50,799
(D) -
(D) (D) (D) (D)
- (D)
1,184 -
- -
571 -
(D) (D) (D)
- - -
- - -
(D) - - - - - -
- (D)
9,037 -
(D) - -
(D) -
(D)
- -
25,674 - -
25 -
(D) - -
87
2 - - 2 3 1 - 1 5 -
- - 8 5 2 1 1 - - 1
- - - 2 1 - 4 - - 2
- -
20 - 4 1 - 4 - 6
- - 7 - - 2 - 1 1 -
31,472
(D) - -
(D) (D) (D)
- (D)
1,369 -
- -
196 87
(D) (D) (D)
- -
(D)
- - -
(D) (D)
- (D)
- -
(D)
- -
6,727 -
62 (D)
- (D)
- 283
- -
5,050 - -
(D) -
(D) (D)
-
--continued
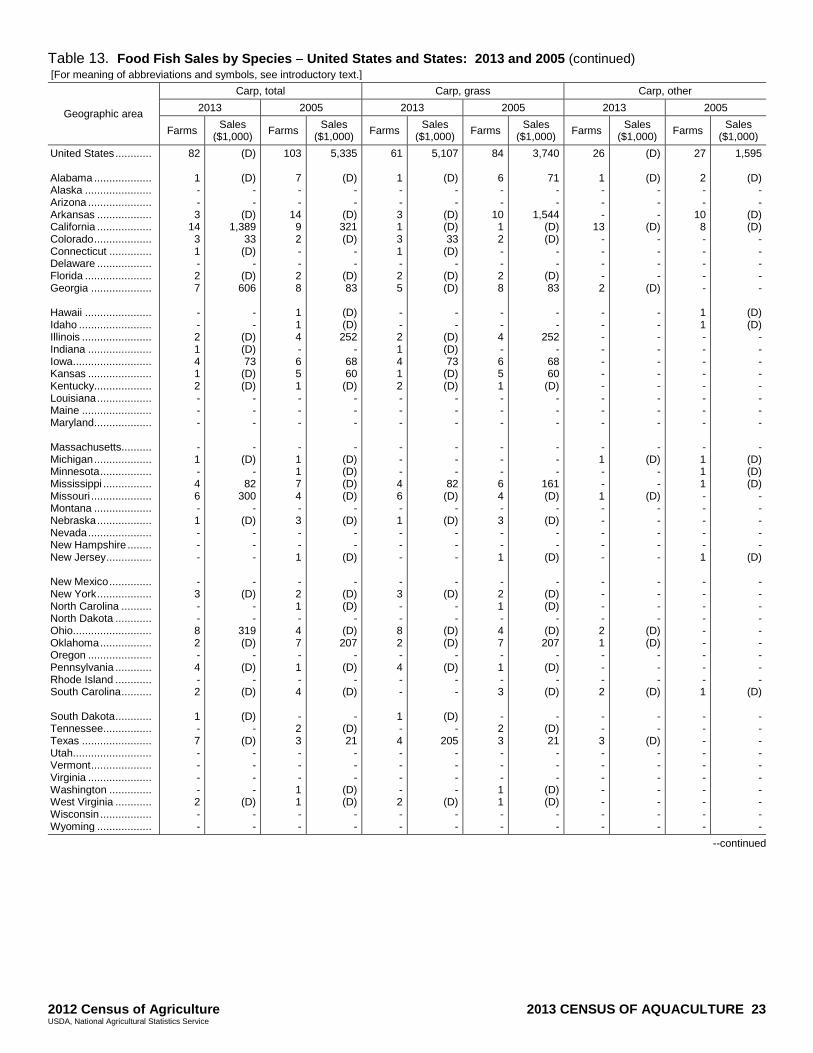
2012 Census of Agriculture 2013 CENSUS OF AQUACULTURE 23 USDA, National Agricultural Statistics Service
Table 13. Food Fish Sales by Species United States and States: 2013 and 2005 (continued) [For meaning of abbreviations and symbols, see introductory text.]
Geographic area
Carp, total Carp, grass Carp, other
2013 2005 2013 2005 2013 2005
Farms Sales
($1,000) Farms
Sales ($1,000)
Farms Sales
($1,000) Farms
Sales ($1,000)
Farms Sales
($1,000) Farms
Sales ($1,000)
United States ............ Alabama ................... Alaska ...................... Arizona ..................... Arkansas .................. California .................. Colorado ................... Connecticut .............. Delaware .................. Florida ...................... Georgia .................... Hawaii ...................... Idaho ........................ Illinois ....................... Indiana ..................... Iowa.......................... Kansas ..................... Kentucky................... Louisiana .................. Maine ....................... Maryland................... Massachusetts.......... Michigan ................... Minnesota ................. Mississippi ................ Missouri .................... Montana ................... Nebraska .................. Nevada ..................... New Hampshire ........ New Jersey ............... New Mexico .............. New York .................. North Carolina .......... North Dakota ............ Ohio.......................... Oklahoma ................. Oregon ..................... Pennsylvania ............ Rhode Island ............ South Carolina .......... South Dakota ............ Tennessee ................ Texas ....................... Utah.......................... Vermont .................... Virginia ..................... Washington .............. West Virginia ............ Wisconsin ................. Wyoming ..................
82
1 - - 3
14 3 1 - 2 7
- - 2 1 4 1 2 - - -
- 1 - 4 6 - 1 - - -
- 3 - - 8 2 - 4 - 2
1 - 7 - - - - 2 - -
(D)
(D) - -
(D) 1,389
33 (D)
- (D) 606
- -
(D) (D) 73
(D) (D)
- - -
- (D)
- 82
300 -
(D) - - -
- (D)
- -
319 (D)
- (D)
- (D)
(D)
- (D)
- - - -
(D) - -
103
7 - -
14 9 2 - - 2 8
1 1 4 - 6 5 1 - - -
- 1 1 7 4 - 3 - - 1
- 2 1 - 4 7 - 1 - 4
- 2 3 - - - 1 1 - -
5,335
(D) - -
(D) 321 (D)
- -
(D) 83
(D) (D) 252
- 68 60
(D) - - -
- (D) (D) (D) (D)
- (D)
- -
(D)
- (D) (D)
- (D) 207
- (D)
- (D)
-
(D) 21
- - -
(D) (D)
- -
61
1 - - 3 1 3 1 - 2 5
- - 2 1 4 1 2 - - -
- - - 4 6 - 1 - - -
- 3 - - 8 2 - 4 - -
1 - 4 - - - - 2 - -
5,107
(D) - -
(D) (D) 33
(D) -
(D) (D)
- -
(D) (D) 73
(D) (D)
- - -
- - -
82 (D)
- (D)
- - -
- (D)
- -
(D) (D)
- (D)
- -
(D) -
205 - - - -
(D) - -
84
6 - -
10 1 2 - - 2 8
- - 4 - 6 5 1 - - -
- - - 6 4 - 3 - - 1
- 2 1 - 4 7 - 1 - 3
- 2 3 - - - 1 1 - -
3,740
71 - -
1,544 (D) (D)
- -
(D) 83
- -
252 -
68 60
(D) - - -
- - -
161 (D)
- (D)
- -
(D)
- (D) (D)
- (D) 207
- (D)
- (D)
-
(D) 21
- - -
(D) (D)
- -
26
1 - - -
13 - - - - 2
- - - - - - - - - -
- 1 - - 1 - - - - -
- - - - 2 1 - - - 2
- - 3 - - - - - - -
(D)
(D) - - -
(D) - - - -
(D)
- - - - - - - - - -
- (D)
- -
(D) - - - - -
- - - -
(D) (D)
- - -
(D)
- -
(D) - - - - - - -
27
2 - -
10 8 - - - - -
1 1 - - - - - - - -
- 1 1 1 - - - - - 1
- - - - - - - - - 1
- - - - - - - - - -
1,595
(D) - -
(D) (D)
- - - - -
(D) (D)
- - - - - - - -
- (D) (D) (D)
- - - - -
(D)
- - - - - - - - -
(D)
- - - - - - - - - -
--continued
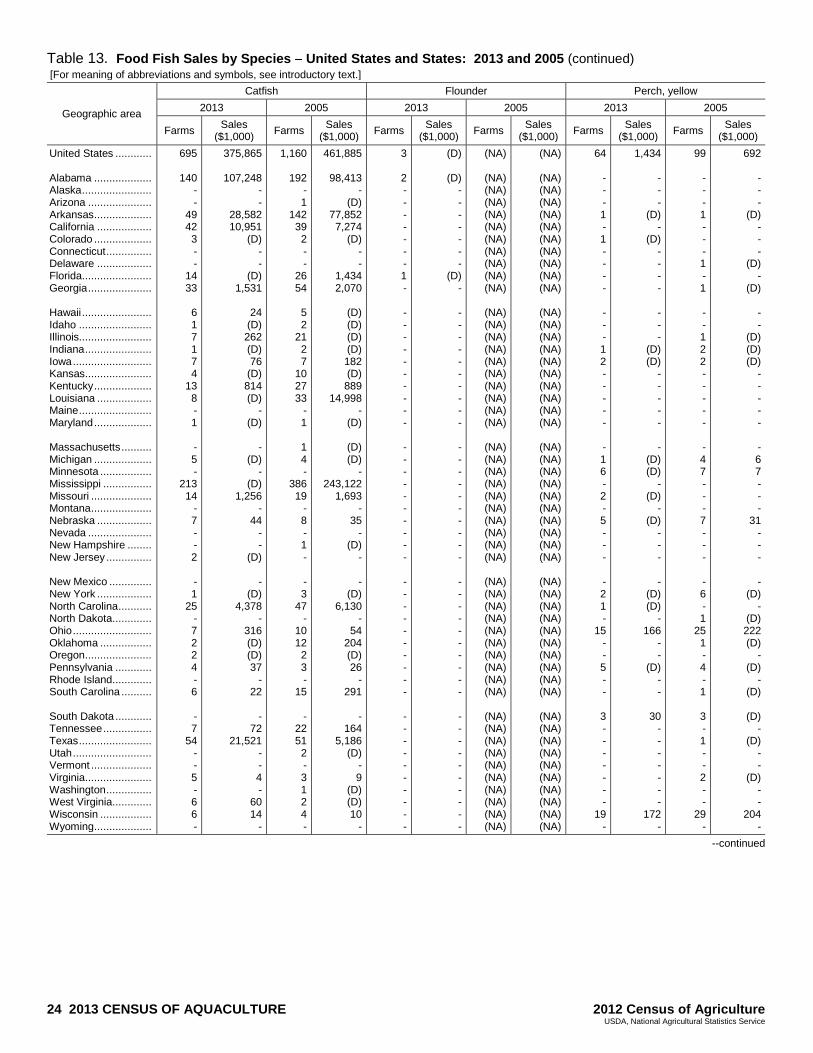
24 2013 CENSUS OF AQUACULTURE 2012 Census of Agriculture USDA, National Agricultural Statistics Service
Table 13. Food Fish Sales by Species United States and States: 2013 and 2005 (continued) [For meaning of abbreviations and symbols, see introductory text.]
Geographic area
Catfish Flounder Perch, yellow
2013 2005 2013 2005 2013 2005
Farms Sales
($1,000) Farms
Sales ($1,000)
Farms Sales
($1,000) Farms
Sales ($1,000)
Farms Sales
($1,000) Farms
Sales ($1,000)
United States ............ Alabama ................... Alaska ....................... Arizona ..................... Arkansas ................... California .................. Colorado ................... Connecticut ............... Delaware .................. Florida....................... Georgia ..................... Hawaii ....................... Idaho ........................ Illinois........................ Indiana ...................... Iowa .......................... Kansas ...................... Kentucky ................... Louisiana .................. Maine ........................ Maryland ................... Massachusetts .......... Michigan ................... Minnesota ................. Mississippi ................ Missouri .................... Montana .................... Nebraska .................. Nevada ..................... New Hampshire ........ New Jersey ............... New Mexico .............. New York .................. North Carolina ........... North Dakota ............. Ohio .......................... Oklahoma ................. Oregon ...................... Pennsylvania ............ Rhode Island ............. South Carolina .......... South Dakota ............ Tennessee ................ Texas ........................ Utah .......................... Vermont .................... Virginia ...................... Washington ............... West Virginia ............. Wisconsin ................. Wyoming ...................
695
140 - -
49 42 3 - -
14 33
6 1 7 1 7 4
13 8 - 1
- 5 -
213 14
- 7 - - 2
- 1
25 - 7 2 2 4 - 6
- 7
54 - - 5 - 6 6 -
375,865
107,248 - -
28,582 10,951
(D) - -
(D) 1,531
24
(D) 262 (D) 76
(D) 814 (D)
- (D)
-
(D) -
(D) 1,256
- 44
- -
(D)
- (D)
4,378 -
316 (D) (D) 37
- 22
-
72 21,521
- - 4 -
60 14
-
1,160
192 - 1
142 39 2 - -
26 54
5 2
21 2 7
10 27 33
- 1
1 4 -
386 19
- 8 - 1 -
- 3
47 -
10 12 2 3 -
15
- 22 51 2 - 3 1 2 4 -
461,885
98,413 -
(D) 77,852 7,274
(D) - -
1,434 2,070
(D) (D) (D) (D) 182 (D) 889
14,998 -
(D)
(D) (D)
- 243,122
1,693 -
35 -
(D) -
- (D)
6,130 -
54 204 (D) 26
- 291
-
164 5,186
(D) - 9
(D) (D) 10
-
3
2 - - - - - - - 1 -
- - - - - - - - - -
- - - - - - - - - -
- - - - - - - - - -
- - - - - - - - - -
(D)
(D) - - - - - - -
(D) -
- - - - - - - - - -
- - - - - - - - - -
- - - - - - - - - -
- - - - - - - - - -
(NA)
(NA) (NA) (NA) (NA) (NA) (NA) (NA) (NA) (NA) (NA)
(NA) (NA) (NA) (NA) (NA) (NA) (NA) (NA) (NA) (NA)
(NA) (NA) (NA) (NA) (NA) (NA) (NA) (NA) (NA) (NA)
(NA) (NA) (NA) (NA) (NA) (NA) (NA) (NA) (NA) (NA)
(NA) (NA) (NA) (NA) (NA) (NA) (NA) (NA) (NA) (NA)
(NA)
(NA) (NA) (NA) (NA) (NA) (NA) (NA) (NA) (NA) (NA)
(NA) (NA) (NA) (NA) (NA) (NA) (NA) (NA) (NA) (NA)
(NA) (NA) (NA) (NA) (NA) (NA) (NA) (NA) (NA) (NA)
(NA) (NA) (NA) (NA) (NA) (NA) (NA) (NA) (NA) (NA)
(NA) (NA) (NA) (NA) (NA) (NA) (NA) (NA) (NA) (NA)
64
- - - 1 - 1 - - - -
- - - 1 2 - - - - -
- 1 6 - 2 - 5 - - -
- 2 1 -
15 - - 5 - -
3 - - - - - - -
19 -
1,434
- - -
(D) -
(D) - - - -
- - -
(D) (D)
- - - - -
- (D) (D)
- (D)
- (D)
- - -
- (D) (D)
- 166
- -
(D) - -
30 - - - - - - -
172 -
99
- - - 1 - - - 1 - 1
- - 1 2 2 - - - - -
- 4 7 - - - 7 - - -
- 6 - 1
25 1 - 4 - 1
3 - 1 - - 2 - -
29 -
692
- - -
(D) - - -
(D) -
(D)
- -
(D) (D) (D)
- - - - -
- 6 7 - - -
31 - - -
- (D)
- (D) 222 (D)
- (D)
- (D)
(D)
- (D)
- -
(D) - -
204 -
--continued
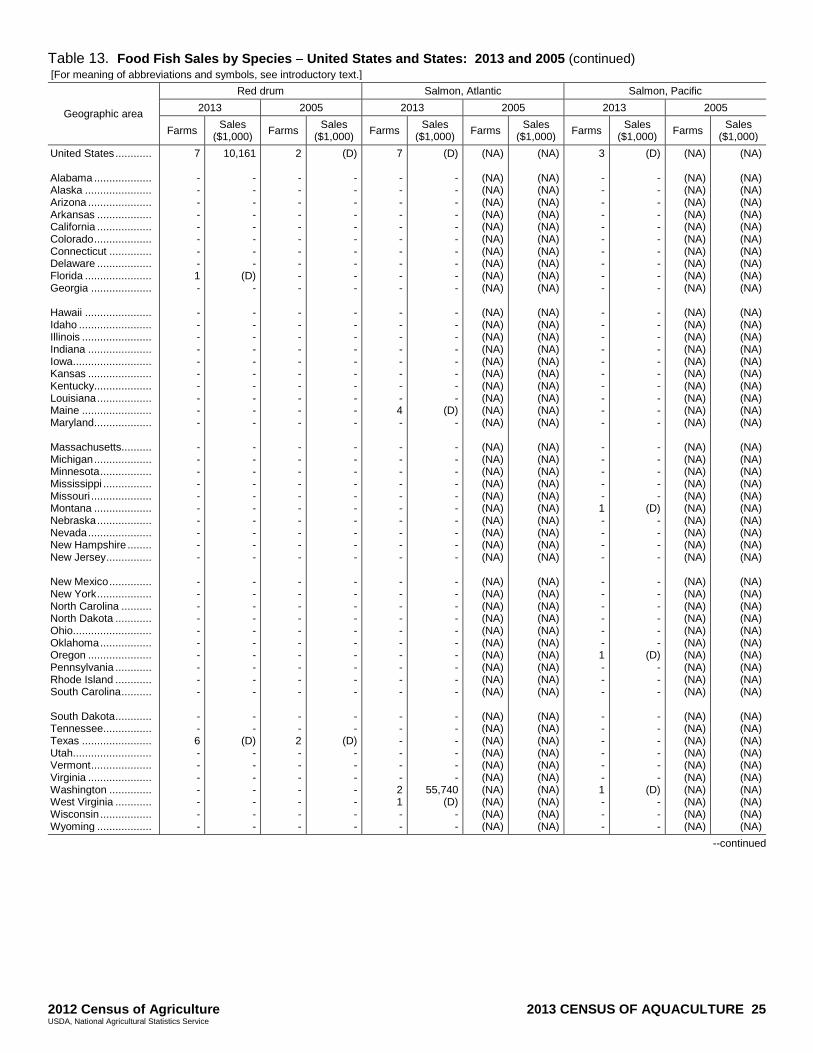
2012 Census of Agriculture 2013 CENSUS OF AQUACULTURE 25 USDA, National Agricultural Statistics Service
Table 13. Food Fish Sales by Species United States and States: 2013 and 2005 (continued) [For meaning of abbreviations and symbols, see introductory text.]
Geographic area
Red drum Salmon, Atlantic Salmon, Pacific
2013 2005 2013 2005 2013 2005
Farms Sales
($1,000) Farms
Sales ($1,000)
Farms Sales
($1,000) Farms
Sales ($1,000)
Farms Sales
($1,000) Farms
Sales ($1,000)
United States ............ Alabama ................... Alaska ...................... Arizona ..................... Arkansas .................. California .................. Colorado ................... Connecticut .............. Delaware .................. Florida ...................... Georgia .................... Hawaii ...................... Idaho ........................ Illinois ....................... Indiana ..................... Iowa.......................... Kansas ..................... Kentucky................... Louisiana .................. Maine ....................... Maryland................... Massachusetts.......... Michigan ................... Minnesota ................. Mississippi ................ Missouri .................... Montana ................... Nebraska .................. Nevada ..................... New Hampshire ........ New Jersey ............... New Mexico .............. New York .................. North Carolina .......... North Dakota ............ Ohio.......................... Oklahoma ................. Oregon ..................... Pennsylvania ............ Rhode Island ............ South Carolina .......... South Dakota ............ Tennessee ................ Texas ....................... Utah.......................... Vermont .................... Virginia ..................... Washington .............. West Virginia ............ Wisconsin ................. Wyoming ..................
7
- - - - - - - - 1 -
- - - - - - - - - -
- - - - - - - - - -
- - - - - - - - - -
- - 6 - - - - - - -
10,161
- - - - - - - -
(D) -
- - - - - - - - - -
- - - - - - - - - -
- - - - - - - - - -
- -
(D) - - - - - - -
2
- - - - - - - - - -
- - - - - - - - - -
- - - - - - - - - -
- - - - - - - - - -
- - 2 - - - - - - -
(D)
- - - - - - - - - -
- - - - - - - - - -
- - - - - - - - - -
- - - - - - - - - -
- -
(D) - - - - - - -
7
- - - - - - - - - -
- - - - - - - - 4 -
- - - - - - - - - -
- - - - - - - - - -
- - - - - - 2 1 - -
(D)
- - - - - - - - - -
- - - - - - - -
(D) -
- - - - - - - - - -
- - - - - - - - - -
- - - - - -
55,740 (D)
- -
(NA)
(NA) (NA) (NA) (NA) (NA) (NA) (NA) (NA) (NA) (NA)
(NA) (NA) (NA) (NA) (NA) (NA) (NA) (NA) (NA) (NA)
(NA) (NA) (NA) (NA) (NA) (NA) (NA) (NA) (NA) (NA)
(NA) (NA) (NA) (NA) (NA) (NA) (NA) (NA) (NA) (NA)
(NA) (NA) (NA) (NA) (NA) (NA) (NA) (NA) (NA) (NA)
(NA)
(NA) (NA) (NA) (NA) (NA) (NA) (NA) (NA) (NA) (NA)
(NA) (NA) (NA) (NA) (NA) (NA) (NA) (NA) (NA) (NA)
(NA) (NA) (NA) (NA) (NA) (NA) (NA) (NA) (NA) (NA)
(NA) (NA) (NA) (NA) (NA) (NA) (NA) (NA) (NA) (NA)
(NA) (NA) (NA) (NA) (NA) (NA) (NA) (NA) (NA) (NA)
3
- - - - - - - - - -
- - - - - - - - - -
- - - - - 1 - - - -
- - - - - - 1 - - -
- - - - - - 1 - - -
(D)
- - - - - - - - - -
- - - - - - - - - -
- - - - -
(D) - - - -
- - - - - -
(D) - - -
- - - - - -
(D) - - -
(NA)
(NA) (NA) (NA) (NA) (NA) (NA) (NA) (NA) (NA) (NA)
(NA) (NA) (NA) (NA) (NA) (NA) (NA) (NA) (NA) (NA)
(NA) (NA) (NA) (NA) (NA) (NA) (NA) (NA) (NA) (NA)
(NA) (NA) (NA) (NA) (NA) (NA) (NA) (NA) (NA) (NA)
(NA) (NA) (NA) (NA) (NA) (NA) (NA) (NA) (NA) (NA)
(NA)
(NA) (NA) (NA) (NA) (NA) (NA) (NA) (NA) (NA) (NA)
(NA) (NA) (NA) (NA) (NA) (NA) (NA) (NA) (NA) (NA)
(NA) (NA) (NA) (NA) (NA) (NA) (NA) (NA) (NA) (NA)
(NA) (NA) (NA) (NA) (NA) (NA) (NA) (NA) (NA) (NA)
(NA) (NA) (NA) (NA) (NA) (NA) (NA) (NA) (NA) (NA)
--continued
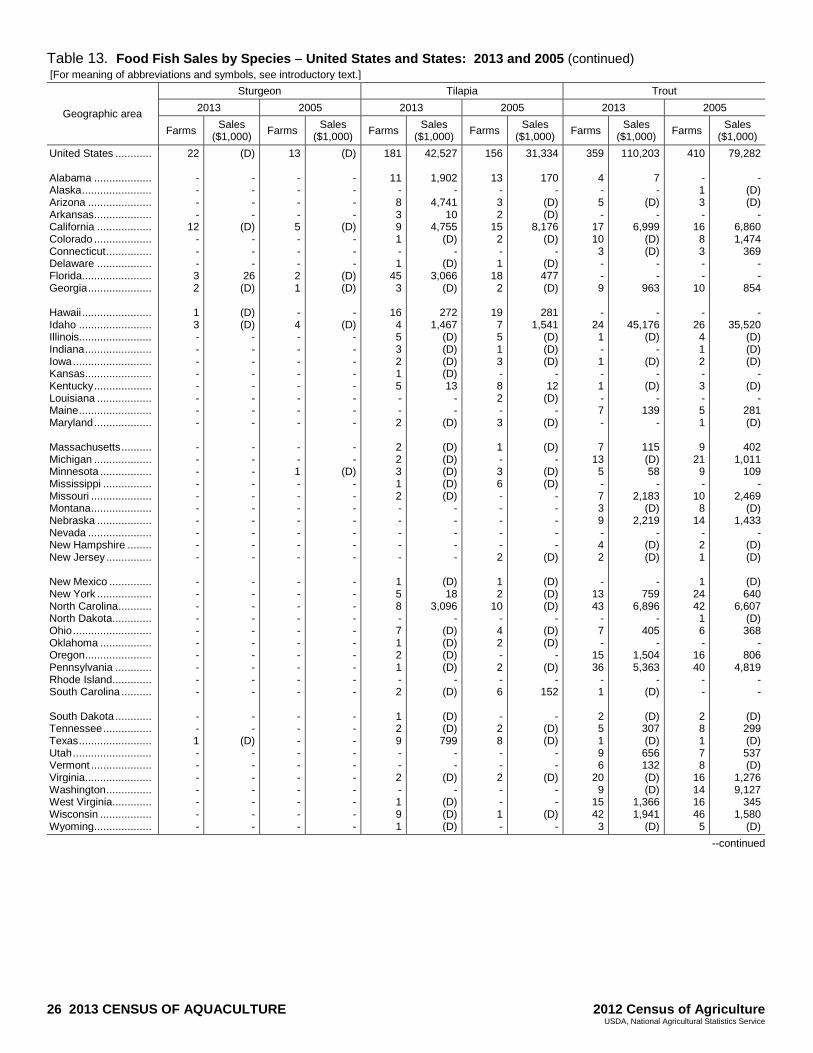
26 2013 CENSUS OF AQUACULTURE 2012 Census of Agriculture USDA, National Agricultural Statistics Service
Table 13. Food Fish Sales by Species United States and States: 2013 and 2005 (continued) [For meaning of abbreviations and symbols, see introductory text.]
Geographic area
Sturgeon Tilapia Trout
2013 2005 2013 2005 2013 2005
Farms Sales
($1,000) Farms
Sales ($1,000)
Farms Sales
($1,000) Farms
Sales ($1,000)
Farms Sales
($1,000) Farms
Sales ($1,000)
United States ............ Alabama ................... Alaska ....................... Arizona ..................... Arkansas ................... California .................. Colorado ................... Connecticut ............... Delaware .................. Florida....................... Georgia ..................... Hawaii ....................... Idaho ........................ Illinois........................ Indiana ...................... Iowa .......................... Kansas ...................... Kentucky ................... Louisiana .................. Maine ........................ Maryland ................... Massachusetts .......... Michigan ................... Minnesota ................. Mississippi ................ Missouri .................... Montana .................... Nebraska .................. Nevada ..................... New Hampshire ........ New Jersey ............... New Mexico .............. New York .................. North Carolina ........... North Dakota ............. Ohio .......................... Oklahoma ................. Oregon ...................... Pennsylvania ............ Rhode Island ............. South Carolina .......... South Dakota ............ Tennessee ................ Texas ........................ Utah .......................... Vermont .................... Virginia ...................... Washington ............... West Virginia ............. Wisconsin ................. Wyoming ...................
22
- - - -
12 - - - 3 2
1 3 - - - - - - - -
- - - - - - - - - -
- - - - - - - - - -
- - 1 - - - - - - -
(D)
- - - -
(D) - - -
26 (D)
(D) (D)
- - - - - - - -
- - - - - - - - - -
- - - - - - - - - -
- -
(D) - - - - - - -
13
- - - - 5 - - - 2 1
- 4 - - - - - - - -
- - 1 - - - - - - -
- - - - - - - - - -
- - - - - - - - - -
(D)
- - - -
(D) - - -
(D) (D)
-
(D) - - - - - - - -
- -
(D) - - - - - - -
- - - - - - - - - -
- - - - - - - - - -
181
11 - 8 3 9 1 - 1
45 3
16 4 5 3 2 1 5 - - 2
2 2 3 1 2 - - - - -
1 5 8 - 7 1 2 1 - 2
1 2 9 - - 2 - 1 9 1
42,527
1,902 -
4,741 10
4,755 (D)
- (D)
3,066 (D)
272
1,467 (D) (D) (D) (D) 13
- -
(D)
(D) (D) (D) (D) (D)
- - - - -
(D) 18
3,096 -
(D) (D) (D) (D)
- (D)
(D) (D) 799
- -
(D) -
(D) (D) (D)
156
13 - 3 2
15 2 - 1
18 2
19 7 5 1 3 - 8 2 - 3
1 - 3 6 - - - - - 2
1 2
10 - 4 2 - 2 - 6
- 2 8 - - 2 - - 1 -
31,334
170 -
(D) (D)
8,176 (D)
- (D) 477 (D)
281
1,541 (D) (D) (D)
- 12
(D) -
(D)
(D) -
(D) (D)
- - - - -
(D)
(D) (D) (D)
- (D) (D)
- (D)
- 152
-
(D) (D)
- -
(D) - -
(D) -
359
4 - 5 -
17 10 3 - - 9
-
24 1 - 1 - 1 - 7 -
7 13 5 - 7 3 9 - 4 2
-
13 43
- 7 -
15 36
- 1
2 5 1 9 6
20 9
15 42 3
110,203
7 -
(D) -
6,999 (D) (D)
- -
963
- 45,176
(D) -
(D) -
(D) -
139 -
115 (D) 58
- 2,183
(D) 2,219
- (D) (D)
-
759 6,896
- 405
- 1,504 5,363
- (D)
(D) 307 (D) 656 132 (D) (D)
1,366 1,941
(D)
410
- 1 3 -
16 8 3 - -
10
- 26 4 1 2 - 3 - 5 1
9 21 9 -
10 8
14 - 2 1
1 24 42 1 6 -
16 40
- -
2 8 1 7 8
16 14 16 46 5
79,282
- (D) (D)
- 6,860 1,474
369 - -
854
- 35,520
(D) (D) (D)
- (D)
- 281 (D)
402
1,011 109
- 2,469
(D) 1,433
- (D) (D)
(D) 640
6,607 (D) 368
- 806
4,819 - -
(D) 299 (D) 537 (D)
1,276 9,127
345 1,580
(D)
--continued
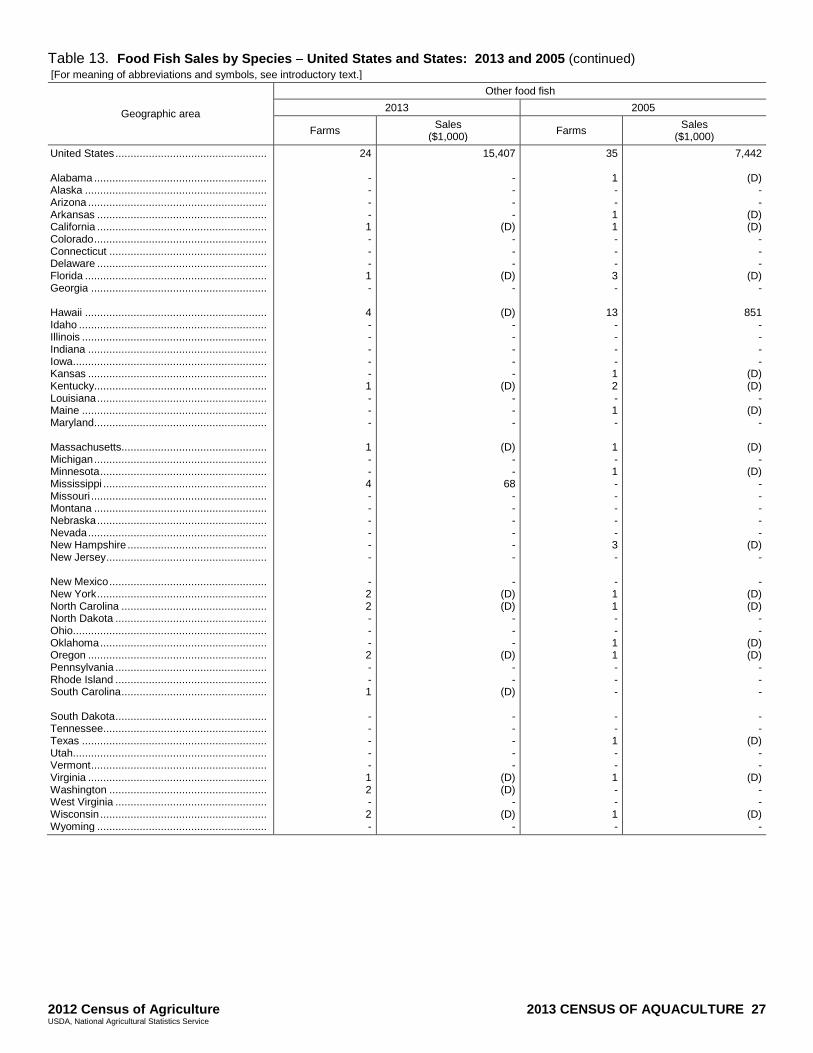
2012 Census of Agriculture 2013 CENSUS OF AQUACULTURE 27 USDA, National Agricultural Statistics Service
Table 13. Food Fish Sales by Species United States and States: 2013 and 2005 (continued) [For meaning of abbreviations and symbols, see introductory text.]
Geographic area
Other food fish
2013 2005
Farms Sales
($1,000) Farms
Sales ($1,000)
United States .................................................. Alabama ......................................................... Alaska ............................................................ Arizona ........................................................... Arkansas ........................................................ California ........................................................ Colorado ......................................................... Connecticut .................................................... Delaware ........................................................ Florida ............................................................ Georgia .......................................................... Hawaii ............................................................ Idaho .............................................................. Illinois ............................................................. Indiana ........................................................... Iowa................................................................ Kansas ........................................................... Kentucky......................................................... Louisiana ........................................................ Maine ............................................................. Maryland......................................................... Massachusetts................................................ Michigan ......................................................... Minnesota ....................................................... Mississippi ...................................................... Missouri .......................................................... Montana ......................................................... Nebraska ........................................................ Nevada ........................................................... New Hampshire .............................................. New Jersey ..................................................... New Mexico .................................................... New York ........................................................ North Carolina ................................................ North Dakota .................................................. Ohio................................................................ Oklahoma ....................................................... Oregon ........................................................... Pennsylvania .................................................. Rhode Island .................................................. South Carolina ................................................ South Dakota .................................................. Tennessee ...................................................... Texas ............................................................. Utah................................................................ Vermont .......................................................... Virginia ........................................................... Washington .................................................... West Virginia .................................................. Wisconsin ....................................................... Wyoming ........................................................
24
- - - - 1 - - - 1 -
4 - - - - - 1 - - -
1 - - 4 - - - - - -
- 2 2 - - - 2 - - 1
- - - - - 1 2 - 2 -
15,407
- - - -
(D) - - -
(D) -
(D) - - - - -
(D) - - -
(D) - -
68 - - - - - -
- (D) (D)
- - -
(D) - -
(D)
- - - - -
(D) (D)
- (D)
-
35
1 - - 1 1 - - - 3 -
13 - - - - 1 2 - 1 -
1 - 1 - - - - - 3 -
- 1 1 - - 1 1 - - -
- - 1 - - 1 - - 1 -
7,442
(D) - -
(D) (D)
- - -
(D) -
851 - - - -
(D) (D)
- (D)
-
(D) -
(D) - - - - -
(D) -
- (D) (D)
- -
(D) (D)
- - -
- -
(D) - -
(D) - -
(D) -
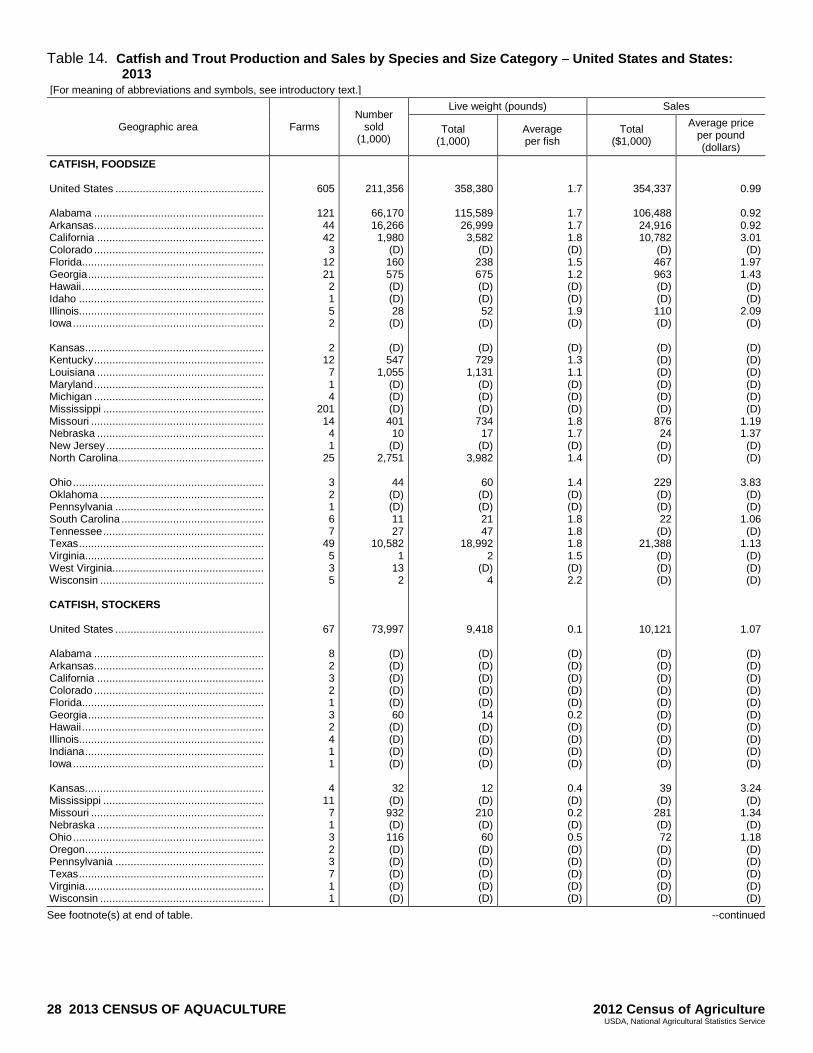
28 2013 CENSUS OF AQUACULTURE 2012 Census of Agriculture USDA, National Agricultural Statistics Service
Table 14. Catfish and Trout Production and Sales by Species and Size Category United States and States: 2013
[For meaning of abbreviations and symbols, see introductory text.]
Geographic area Farms Number
sold (1,000)
Live weight (pounds) Sales
Total (1,000)
Average per fish
Total ($1,000)
Average price per pound (dollars)
CATFISH, FOODSIZE United States ................................................. Alabama ........................................................ Arkansas ........................................................ California ....................................................... Colorado ........................................................ Florida............................................................ Georgia .......................................................... Hawaii ............................................................ Idaho ............................................................. Illinois............................................................. Iowa ............................................................... Kansas ........................................................... Kentucky ........................................................ Louisiana ....................................................... Maryland ........................................................ Michigan ........................................................ Mississippi ..................................................... Missouri ......................................................... Nebraska ....................................................... New Jersey .................................................... North Carolina ................................................ Ohio ............................................................... Oklahoma ...................................................... Pennsylvania ................................................. South Carolina ............................................... Tennessee ..................................................... Texas ............................................................. Virginia ........................................................... West Virginia .................................................. Wisconsin ...................................................... CATFISH, STOCKERS United States ................................................. Alabama ........................................................ Arkansas ........................................................ California ....................................................... Colorado ........................................................ Florida............................................................ Georgia .......................................................... Hawaii ............................................................ Illinois............................................................. Indiana ........................................................... Iowa ............................................................... Kansas ........................................................... Mississippi ..................................................... Missouri ......................................................... Nebraska ....................................................... Ohio ............................................................... Oregon ........................................................... Pennsylvania ................................................. Texas ............................................................. Virginia ........................................................... Wisconsin ......................................................
605
121 44 42 3
12 21 2 1 5 2
2 12 7 1 4
201 14 4 1
25
3 2 1 6 7
49 5 3 5
67
8 2 3 2 1 3 2 4 1 1
4 11 7 1 3 2 3 7 1 1
211,356
66,170 16,266 1,980
(D) 160 575 (D) (D) 28
(D)
(D) 547
1,055 (D) (D) (D) 401 10
(D) 2,751
44
(D) (D) 11 27
10,582 1
13 2
73,997
(D) (D) (D) (D) (D) 60
(D) (D) (D) (D)
32
(D) 932 (D) 116 (D) (D) (D) (D) (D)
358,380
115,589 26,999 3,582
(D) 238 675 (D) (D) 52
(D)
(D) 729
1,131 (D) (D) (D) 734 17
(D) 3,982
60
(D) (D) 21 47
18,992 2
(D) 4
9,418
(D) (D) (D) (D) (D) 14
(D) (D) (D) (D)
12
(D) 210 (D) 60
(D) (D) (D) (D) (D)
1.7
1.7 1.7 1.8 (D) 1.5 1.2 (D) (D) 1.9 (D)
(D) 1.3 1.1 (D) (D) (D) 1.8 1.7 (D) 1.4
1.4 (D) (D) 1.8 1.8 1.8 1.5 (D) 2.2
0.1
(D) (D) (D) (D) (D) 0.2 (D) (D) (D) (D)
0.4 (D) 0.2 (D) 0.5 (D) (D) (D) (D) (D)
354,337
106,488 24,916 10,782
(D) 467 963 (D) (D) 110 (D)
(D) (D) (D) (D) (D) (D) 876 24
(D) (D)
229 (D) (D) 22
(D) 21,388
(D) (D) (D)
10,121
(D) (D) (D) (D) (D) (D) (D) (D) (D) (D)
39
(D) 281 (D) 72
(D) (D) (D) (D) (D)
0.99
0.92 0.92 3.01 (D)
1.97 1.43 (D) (D)
2.09 (D)
(D) (D) (D) (D) (D) (D)
1.19 1.37 (D) (D)
3.83 (D) (D)
1.06 (D)
1.13 (D) (D) (D)
1.07
(D) (D) (D) (D) (D) (D) (D) (D) (D) (D)
3.24 (D)
1.34 (D)
1.18 (D) (D) (D) (D) (D)
See footnote(s) at end of table. --continued
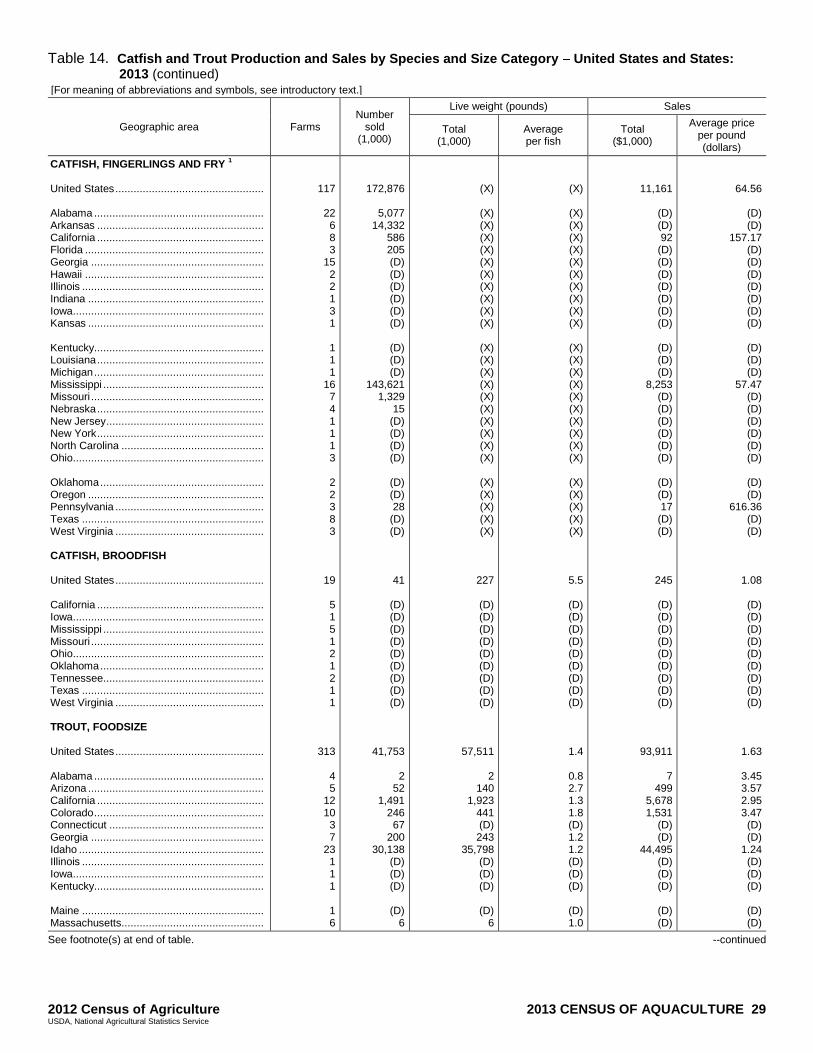
2012 Census of Agriculture 2013 CENSUS OF AQUACULTURE 29 USDA, National Agricultural Statistics Service
Table 14. Catfish and Trout Production and Sales by Species and Size Category United States and States: 2013 (continued)
[For meaning of abbreviations and symbols, see introductory text.]
Geographic area Farms Number
sold (1,000)
Live weight (pounds) Sales
Total (1,000)
Average per fish
Total ($1,000)
Average price per pound (dollars)
CATFISH, FINGERLINGS AND FRY 1
United States ................................................. Alabama ........................................................ Arkansas ....................................................... California ....................................................... Florida ........................................................... Georgia ......................................................... Hawaii ........................................................... Illinois ............................................................ Indiana .......................................................... Iowa............................................................... Kansas .......................................................... Kentucky........................................................ Louisiana ....................................................... Michigan ........................................................ Mississippi ..................................................... Missouri ......................................................... Nebraska ....................................................... New Jersey .................................................... New York ....................................................... North Carolina ............................................... Ohio............................................................... Oklahoma ...................................................... Oregon .......................................................... Pennsylvania ................................................. Texas ............................................................ West Virginia ................................................. CATFISH, BROODFISH United States ................................................. California ....................................................... Iowa............................................................... Mississippi ..................................................... Missouri ......................................................... Ohio............................................................... Oklahoma ...................................................... Tennessee ..................................................... Texas ............................................................ West Virginia ................................................. TROUT, FOODSIZE United States ................................................. Alabama ........................................................ Arizona .......................................................... California ....................................................... Colorado ........................................................ Connecticut ................................................... Georgia ......................................................... Idaho ............................................................. Illinois ............................................................ Iowa............................................................... Kentucky........................................................ Maine ............................................................ Massachusetts...............................................
117
22 6 8 3
15 2 2 1 3 1
1 1 1
16 7 4 1 1 1 3
2 2 3 8 3
19
5 1 5 1 2 1 2 1 1
313
4 5
12 10 3 7
23 1 1 1
1 6
172,876
5,077 14,332
586 205 (D) (D) (D) (D) (D) (D)
(D) (D) (D)
143,621 1,329
15 (D) (D) (D) (D)
(D) (D) 28
(D) (D)
41
(D) (D) (D) (D) (D) (D) (D) (D) (D)
41,753
2 52
1,491 246 67
200 30,138
(D) (D) (D)
(D)
6
(X)
(X) (X) (X) (X) (X) (X) (X) (X) (X) (X)
(X) (X) (X) (X) (X) (X) (X) (X) (X) (X)
(X) (X) (X) (X) (X)
227
(D) (D) (D) (D) (D) (D) (D) (D) (D)
57,511
2 140
1,923 441 (D) 243
35,798 (D) (D) (D)
(D)
6
(X)
(X) (X) (X) (X) (X) (X) (X) (X) (X) (X)
(X) (X) (X) (X) (X) (X) (X) (X) (X) (X)
(X) (X) (X) (X) (X)
5.5
(D) (D) (D) (D) (D) (D) (D) (D) (D)
1.4
0.8 2.7 1.3 1.8 (D) 1.2 1.2 (D) (D) (D)
(D) 1.0
11,161
(D) (D) 92
(D) (D) (D) (D) (D) (D) (D)
(D) (D) (D)
8,253 (D) (D) (D) (D) (D) (D)
(D) (D) 17
(D) (D)
245
(D) (D) (D) (D) (D) (D) (D) (D) (D)
93,911
7 499
5,678 1,531
(D) (D)
44,495 (D) (D) (D)
(D) (D)
64.56
(D) (D)
157.17 (D) (D) (D) (D) (D) (D) (D)
(D) (D) (D)
57.47 (D) (D) (D) (D) (D) (D)
(D) (D)
616.36 (D) (D)
1.08
(D) (D) (D) (D) (D) (D) (D) (D) (D)
1.63
3.45 3.57 2.95 3.47 (D) (D)
1.24 (D) (D) (D)
(D) (D)
See footnote(s) at end of table. --continued
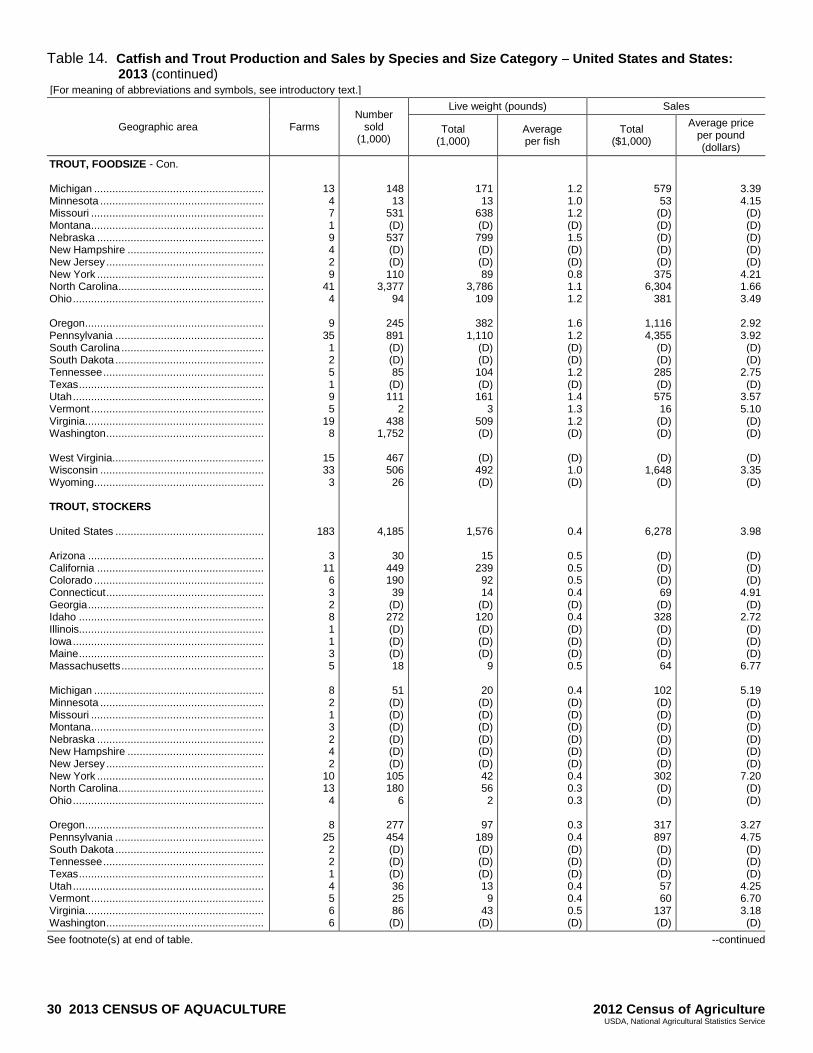
30 2013 CENSUS OF AQUACULTURE 2012 Census of Agriculture USDA, National Agricultural Statistics Service
Table 14. Catfish and Trout Production and Sales by Species and Size Category United States and States: 2013 (continued)
[For meaning of abbreviations and symbols, see introductory text.]
Geographic area Farms Number
sold (1,000)
Live weight (pounds) Sales
Total (1,000)
Average per fish
Total ($1,000)
Average price per pound (dollars)
TROUT, FOODSIZE - Con. Michigan ........................................................ Minnesota ...................................................... Missouri ......................................................... Montana ......................................................... Nebraska ....................................................... New Hampshire ............................................. New Jersey .................................................... New York ....................................................... North Carolina ................................................ Ohio ............................................................... Oregon ........................................................... Pennsylvania ................................................. South Carolina ............................................... South Dakota ................................................. Tennessee ..................................................... Texas ............................................................. Utah ............................................................... Vermont ......................................................... Virginia ........................................................... Washington .................................................... West Virginia .................................................. Wisconsin ...................................................... Wyoming ........................................................ TROUT, STOCKERS United States ................................................. Arizona .......................................................... California ....................................................... Colorado ........................................................ Connecticut .................................................... Georgia .......................................................... Idaho ............................................................. Illinois............................................................. Iowa ............................................................... Maine ............................................................. Massachusetts ............................................... Michigan ........................................................ Minnesota ...................................................... Missouri ......................................................... Montana ......................................................... Nebraska ....................................................... New Hampshire ............................................. New Jersey .................................................... New York ....................................................... North Carolina ................................................ Ohio ............................................................... Oregon ........................................................... Pennsylvania ................................................. South Dakota ................................................. Tennessee ..................................................... Texas ............................................................. Utah ............................................................... Vermont ......................................................... Virginia ........................................................... Washington ....................................................
13 4 7 1 9 4 2 9
41 4
9 35 1 2 5 1 9 5
19 8
15 33 3
183
3 11 6 3 2 8 1 1 3 5
8 2 1 3 2 4 2
10 13 4
8 25 2 2 1 4 5 6 6
148 13
531 (D) 537 (D) (D) 110
3,377 94
245 891 (D) (D) 85
(D) 111
2 438
1,752
467 506 26
4,185
30 449 190 39
(D) 272 (D) (D) (D) 18
51
(D) (D) (D) (D) (D) (D) 105 180
6
277 454 (D) (D) (D) 36 25 86
(D)
171 13
638 (D) 799 (D) (D) 89
3,786 109
382
1,110 (D) (D) 104 (D) 161
3 509 (D)
(D) 492 (D)
1,576
15 239 92 14
(D) 120 (D) (D) (D)
9
20 (D) (D) (D) (D) (D) (D) 42 56 2
97 189 (D) (D) (D) 13 9
43 (D)
1.2 1.0 1.2 (D) 1.5 (D) (D) 0.8 1.1 1.2
1.6 1.2 (D) (D) 1.2 (D) 1.4 1.3 1.2 (D)
(D) 1.0 (D)
0.4
0.5 0.5 0.5 0.4 (D) 0.4 (D) (D) (D) 0.5
0.4 (D) (D) (D) (D) (D) (D) 0.4 0.3 0.3
0.3 0.4 (D) (D) (D) 0.4 0.4 0.5 (D)
579 53
(D) (D) (D) (D) (D) 375
6,304 381
1,116 4,355
(D) (D) 285 (D) 575 16
(D) (D)
(D)
1,648 (D)
6,278
(D) (D) (D) 69
(D) 328 (D) (D) (D) 64
102 (D) (D) (D) (D) (D) (D) 302 (D) (D)
317 897 (D) (D) (D) 57 60
137 (D)
3.39 4.15 (D) (D) (D) (D) (D)
4.21 1.66 3.49
2.92 3.92 (D) (D)
2.75 (D)
3.57 5.10 (D) (D)
(D)
3.35 (D)
3.98
(D) (D) (D)
4.91 (D)
2.72 (D) (D) (D)
6.77
5.19 (D) (D) (D) (D) (D) (D)
7.20 (D) (D)
3.27 4.75 (D) (D) (D)
4.25 6.70 3.18 (D)
See footnote(s) at end of table. --continued
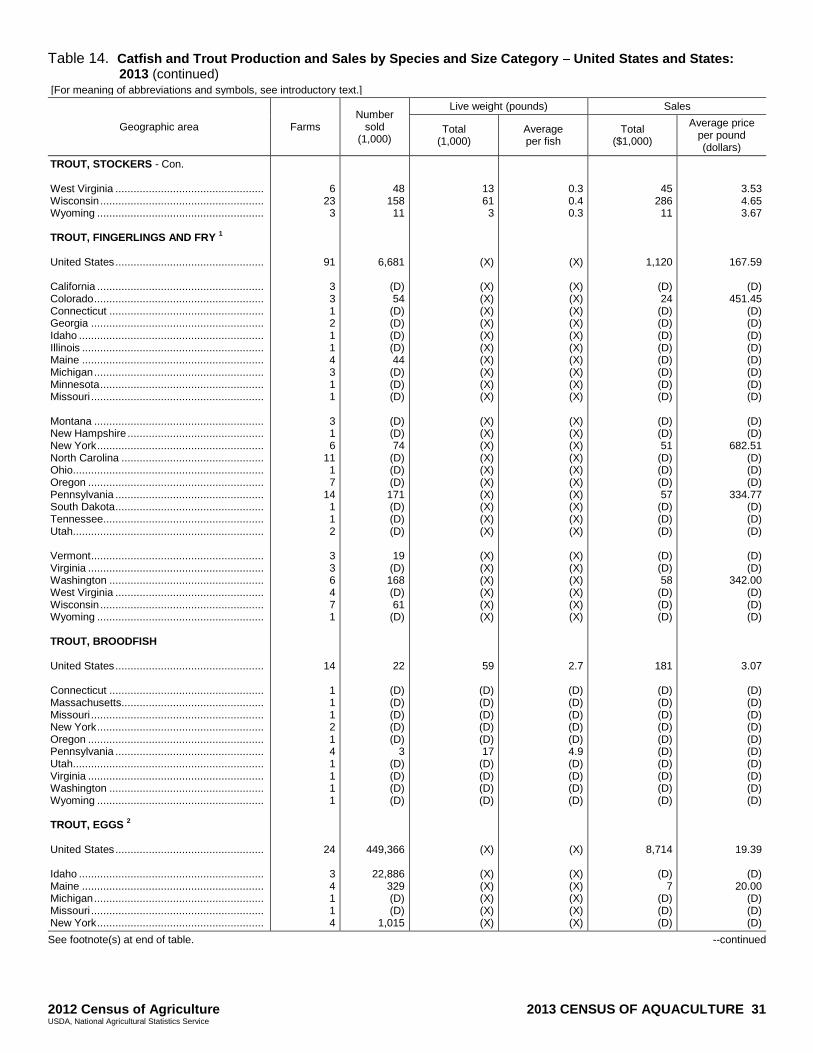
2012 Census of Agriculture 2013 CENSUS OF AQUACULTURE 31 USDA, National Agricultural Statistics Service
Table 14. Catfish and Trout Production and Sales by Species and Size Category United States and States: 2013 (continued)
[For meaning of abbreviations and symbols, see introductory text.]
Geographic area Farms Number
sold (1,000)
Live weight (pounds) Sales
Total (1,000)
Average per fish
Total ($1,000)
Average price per pound (dollars)
TROUT, STOCKERS - Con. West Virginia ................................................. Wisconsin ...................................................... Wyoming ....................................................... TROUT, FINGERLINGS AND FRY
1 United States ................................................. California ....................................................... Colorado ........................................................ Connecticut ................................................... Georgia ......................................................... Idaho ............................................................. Illinois ............................................................ Maine ............................................................ Michigan ........................................................ Minnesota ...................................................... Missouri ......................................................... Montana ........................................................ New Hampshire ............................................. New York ....................................................... North Carolina ............................................... Ohio............................................................... Oregon .......................................................... Pennsylvania ................................................. South Dakota ................................................. Tennessee ..................................................... Utah............................................................... Vermont ......................................................... Virginia .......................................................... Washington ................................................... West Virginia ................................................. Wisconsin ...................................................... Wyoming ....................................................... TROUT, BROODFISH United States ................................................. Connecticut ................................................... Massachusetts............................................... Missouri ......................................................... New York ....................................................... Oregon .......................................................... Pennsylvania ................................................. Utah............................................................... Virginia .......................................................... Washington ................................................... Wyoming ....................................................... TROUT, EGGS
2 United States ................................................. Idaho ............................................................. Maine ............................................................ Michigan ........................................................ Missouri ......................................................... New York .......................................................
6 23 3
91
3 3 1 2 1 1 4 3 1 1
3 1 6
11 1 7
14 1 1 2
3 3 6 4 7 1
14
1 1 1 2 1 4 1 1 1 1
24
3 4 1 1 4
48 158 11
6,681
(D) 54
(D) (D) (D) (D) 44
(D) (D) (D)
(D) (D) 74
(D) (D) (D) 171 (D) (D) (D)
19
(D) 168 (D) 61
(D)
22
(D) (D) (D) (D) (D)
3 (D) (D) (D) (D)
449,366
22,886 329 (D) (D)
1,015
13 61 3
(X)
(X) (X) (X) (X) (X) (X) (X) (X) (X) (X)
(X) (X) (X) (X) (X) (X) (X) (X) (X) (X)
(X) (X) (X) (X) (X) (X)
59
(D) (D) (D) (D) (D) 17
(D) (D) (D) (D)
(X)
(X) (X) (X) (X) (X)
0.3 0.4 0.3
(X)
(X) (X) (X) (X) (X) (X) (X) (X) (X) (X)
(X) (X) (X) (X) (X) (X) (X) (X) (X) (X)
(X) (X) (X) (X) (X) (X)
2.7
(D) (D) (D) (D) (D) 4.9 (D) (D) (D) (D)
(X)
(X) (X) (X) (X) (X)
45 286 11
1,120
(D) 24
(D) (D) (D) (D) (D) (D) (D) (D)
(D) (D) 51
(D) (D) (D) 57
(D) (D) (D)
(D) (D) 58
(D) (D) (D)
181
(D) (D) (D) (D) (D) (D) (D) (D) (D) (D)
8,714
(D) 7
(D) (D) (D)
3.53 4.65 3.67
167.59
(D) 451.45
(D) (D) (D) (D) (D) (D) (D) (D)
(D) (D)
682.51 (D) (D) (D)
334.77 (D) (D) (D)
(D) (D)
342.00 (D) (D) (D)
3.07
(D) (D) (D) (D) (D) (D) (D) (D) (D) (D)
19.39
(D) 20.00
(D) (D) (D)
See footnote(s) at end of table. --continued
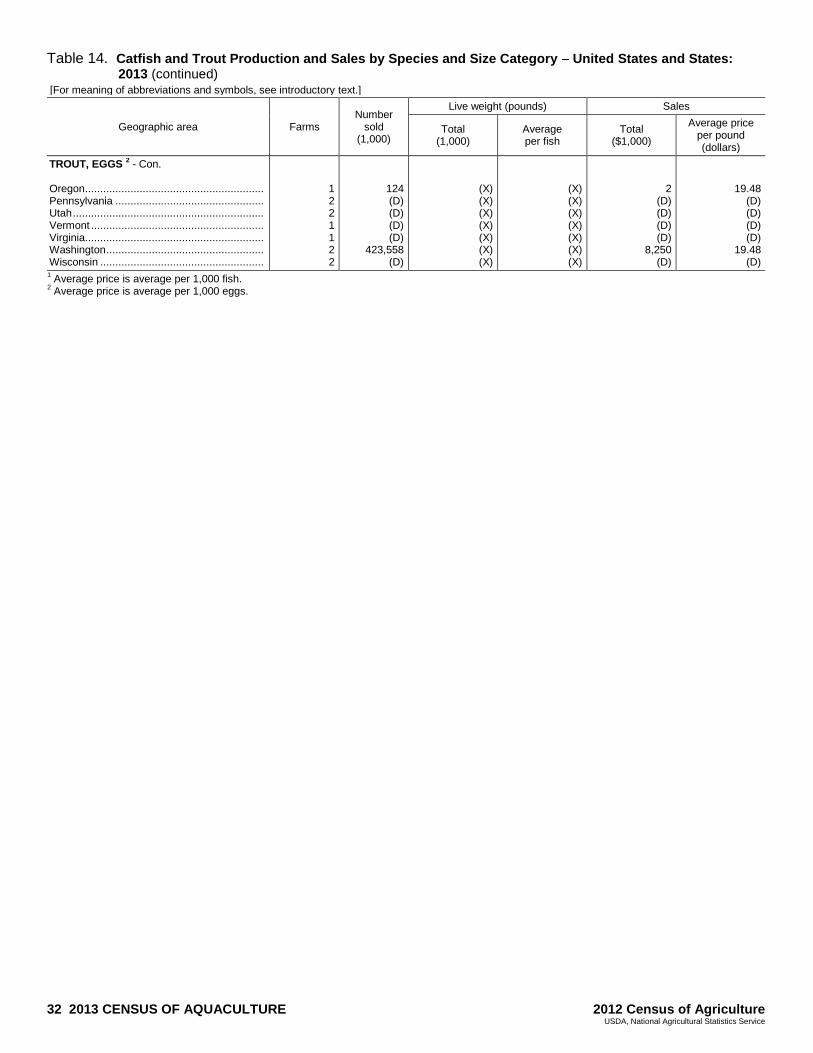
32 2013 CENSUS OF AQUACULTURE 2012 Census of Agriculture USDA, National Agricultural Statistics Service
Table 14. Catfish and Trout Production and Sales by Species and Size Category United States and States: 2013 (continued)
[For meaning of abbreviations and symbols, see introductory text.]
Geographic area Farms Number
sold (1,000)
Live weight (pounds) Sales
Total (1,000)
Average per fish
Total ($1,000)
Average price per pound (dollars)
TROUT, EGGS 2 - Con.
Oregon ........................................................... Pennsylvania ................................................. Utah ............................................................... Vermont ......................................................... Virginia ........................................................... Washington .................................................... Wisconsin ......................................................
1 2 2 1 1 2 2
124 (D) (D) (D) (D)
423,558 (D)
(X) (X) (X) (X) (X) (X) (X)
(X) (X) (X) (X) (X) (X) (X)
2 (D) (D) (D) (D)
8,250 (D)
19.48 (D) (D) (D) (D)
19.48 (D)
1 Average price is average per 1,000 fish. 2 Average price is average per 1,000 eggs.
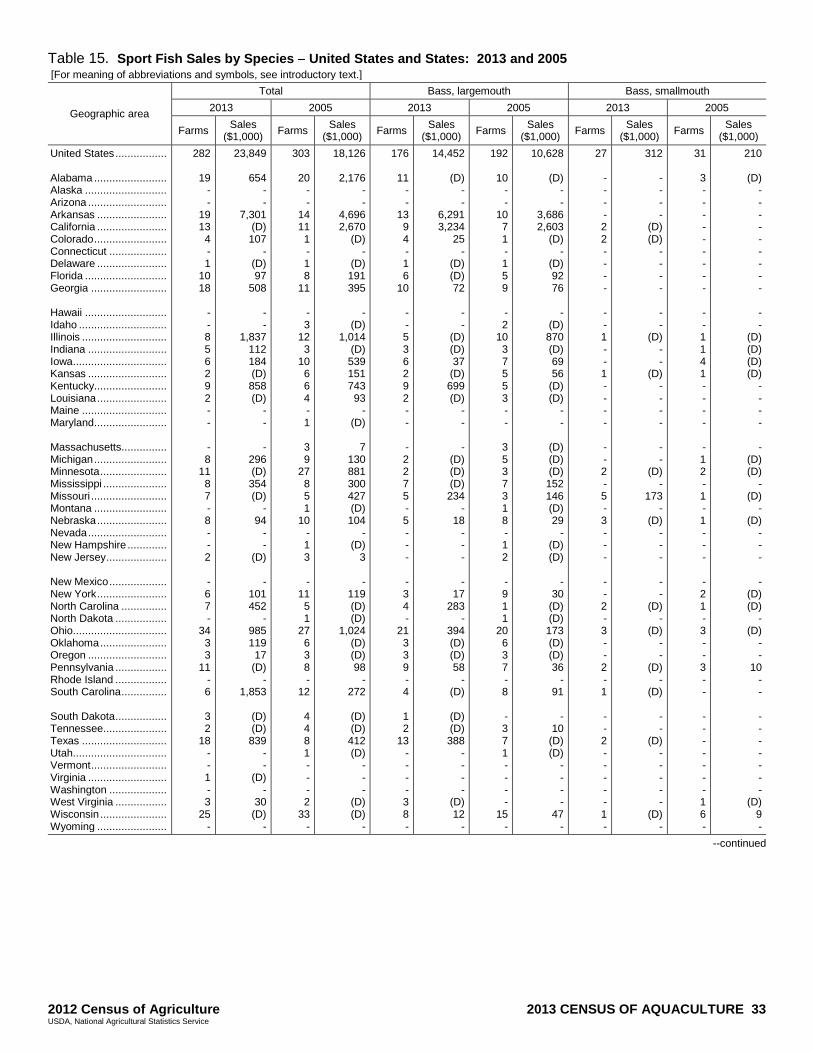
2012 Census of Agriculture 2013 CENSUS OF AQUACULTURE 33 USDA, National Agricultural Statistics Service
Table 15. Sport Fish Sales by Species United States and States: 2013 and 2005 [For meaning of abbreviations and symbols, see introductory text.]
Geographic area
Total Bass, largemouth Bass, smallmouth
2013 2005 2013 2005 2013 2005
Farms Sales
($1,000) Farms
Sales ($1,000)
Farms Sales
($1,000) Farms
Sales ($1,000)
Farms Sales
($1,000) Farms
Sales ($1,000)
United States ................. Alabama ........................ Alaska ........................... Arizona .......................... Arkansas ....................... California ....................... Colorado ........................ Connecticut ................... Delaware ....................... Florida ........................... Georgia ......................... Hawaii ........................... Idaho ............................. Illinois ............................ Indiana .......................... Iowa............................... Kansas .......................... Kentucky........................ Louisiana ....................... Maine ............................ Maryland........................ Massachusetts............... Michigan ........................ Minnesota ...................... Mississippi ..................... Missouri ......................... Montana ........................ Nebraska ....................... Nevada .......................... New Hampshire ............. New Jersey .................... New Mexico ................... New York ....................... North Carolina ............... North Dakota ................. Ohio............................... Oklahoma ...................... Oregon .......................... Pennsylvania ................. Rhode Island ................. South Carolina ............... South Dakota ................. Tennessee ..................... Texas ............................ Utah............................... Vermont ......................... Virginia .......................... Washington ................... West Virginia ................. Wisconsin ...................... Wyoming .......................
282
19 - -
19 13 4 - 1
10 18
- - 8 5 6 2 9 2 - -
- 8
11 8 7 - 8 - - 2
- 6 7 -
34 3 3
11 - 6
3 2
18 - - 1 - 3
25 -
23,849
654 - -
7,301 (D) 107
- (D) 97
508
- -
1,837 112 184 (D) 858 (D)
- -
- 296 (D) 354 (D)
- 94
- -
(D)
- 101 452
- 985 119 17
(D) -
1,853
(D) (D) 839
- -
(D) -
30 (D)
-
303
20 - -
14 11 1 - 1 8
11
- 3
12 3
10 6 6 4 - 1
3 9
27 8 5 1
10 - 1 3
- 11 5 1
27 6 3 8 -
12
4 4 8 1 - - - 2
33 -
18,126
2,176 - -
4,696 2,670
(D) -
(D) 191 395
-
(D) 1,014
(D) 539 151 743 93
- (D)
7
130 881 300 427 (D) 104
- (D)
3
- 119 (D) (D)
1,024 (D) (D) 98
- 272
(D) (D) 412 (D)
- - -
(D) (D)
-
176
11 - -
13 9 4 - 1 6
10
- - 5 3 6 2 9 2 - -
- 2 2 7 5 - 5 - - -
- 3 4 -
21 3 3 9 - 4
1 2
13 - - - - 3 8 -
14,452
(D) - -
6,291 3,234
25 -
(D) (D) 72
- -
(D) (D) 37
(D) 699 (D)
- -
- (D) (D) (D) 234
- 18
- - -
- 17
283 -
394 (D) (D) 58
- (D)
(D) (D) 388
- - - -
(D) 12
-
192
10 - -
10 7 1 - 1 5 9
- 2
10 3 7 5 5 3 - -
3 5 3 7 3 1 8 - 1 2
- 9 1 1
20 6 3 7 - 8
- 3 7 1 - - - -
15 -
10,628
(D) - -
3,686 2,603
(D) -
(D) 92 76
-
(D) 870 (D) 69 56
(D) (D)
- -
(D) (D) (D) 152 146 (D) 29
- (D) (D)
-
30 (D) (D) 173 (D) (D) 36
- 91
-
10 (D) (D)
- - - -
47 -
27
- - - - 2 2 - - - -
- - 1 - - 1 - - - -
- - 2 - 5 - 3 - - -
- - 2 - 3 - - 2 - 1
- - 2 - - - - - 1 -
312
- - - -
(D) (D)
- - - -
- -
(D) - -
(D) - - - -
- -
(D) -
173 -
(D) - - -
- -
(D) -
(D) - -
(D) -
(D)
- -
(D) - - - - -
(D) -
31
3 - - - - - - - - -
- - 1 1 4 1 - - - -
- 1 2 - 1 - 1 - - -
- 2 1 - 3 - - 3 - -
- - - - - - - 1 6 -
210
(D) - - - - - - - - -
- -
(D) (D) (D) (D)
- - - -
- (D) (D)
- (D)
- (D)
- - -
- (D) (D)
- (D)
- -
10 - -
- - - - - - -
(D) 9 -
--continued
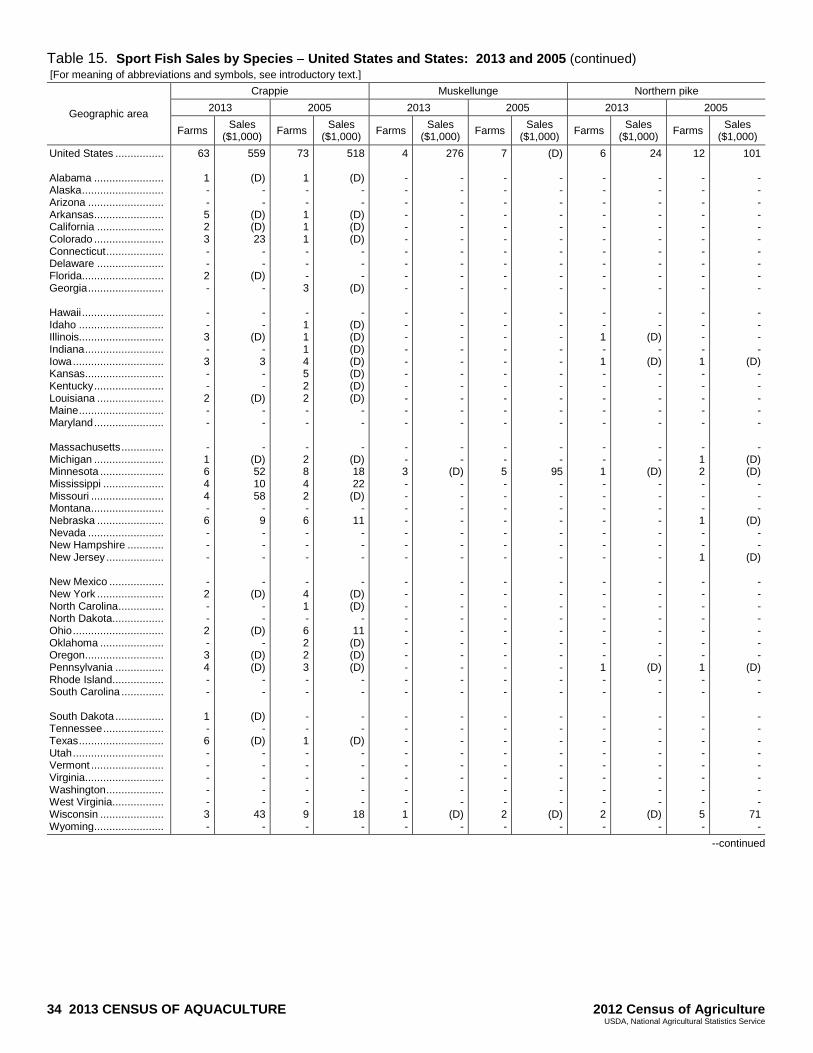
34 2013 CENSUS OF AQUACULTURE 2012 Census of Agriculture USDA, National Agricultural Statistics Service
Table 15. Sport Fish Sales by Species United States and States: 2013 and 2005 (continued) [For meaning of abbreviations and symbols, see introductory text.]
Geographic area
Crappie Muskellunge Northern pike
2013 2005 2013 2005 2013 2005
Farms Sales
($1,000) Farms
Sales ($1,000)
Farms Sales
($1,000) Farms
Sales ($1,000)
Farms Sales
($1,000) Farms
Sales ($1,000)
United States ................ Alabama ....................... Alaska ........................... Arizona ......................... Arkansas ....................... California ...................... Colorado ....................... Connecticut ................... Delaware ...................... Florida........................... Georgia ......................... Hawaii ........................... Idaho ............................ Illinois............................ Indiana .......................... Iowa .............................. Kansas .......................... Kentucky ....................... Louisiana ...................... Maine ............................ Maryland ....................... Massachusetts .............. Michigan ....................... Minnesota ..................... Mississippi .................... Missouri ........................ Montana ........................ Nebraska ...................... Nevada ......................... New Hampshire ............ New Jersey ................... New Mexico .................. New York ...................... North Carolina ............... North Dakota ................. Ohio .............................. Oklahoma ..................... Oregon .......................... Pennsylvania ................ Rhode Island ................. South Carolina .............. South Dakota ................ Tennessee .................... Texas ............................ Utah .............................. Vermont ........................ Virginia .......................... Washington ................... West Virginia ................. Wisconsin ..................... Wyoming .......................
63
1 - - 5 2 3 - - 2 -
- - 3 - 3 - - 2 - -
- 1 6 4 4 - 6 - - -
- 2 - - 2 - 3 4 - -
1 - 6 - - - - - 3 -
559
(D) - -
(D) (D) 23
- -
(D) -
- -
(D) - 3 - -
(D) - -
- (D) 52 10 58
- 9 - - -
- (D)
- -
(D) -
(D) (D)
- -
(D) -
(D) - - - - -
43 -
73
1 - - 1 1 1 - - - 3
- 1 1 1 4 5 2 2 - -
- 2 8 4 2 - 6 - - -
- 4 1 - 6 2 2 3 - -
- - 1 - - - - - 9 -
518
(D) - -
(D) (D) (D)
- - -
(D)
- (D) (D) (D) (D) (D) (D) (D)
- -
- (D) 18 22
(D) -
11 - - -
- (D) (D)
- 11
(D) (D) (D)
- -
- -
(D) - - - - -
18 -
4
- - - - - - - - - -
- - - - - - - - - -
- - 3 - - - - - - -
- - - - - - - - - -
- - - - - - - - 1 -
276
- - - - - - - - - -
- - - - - - - - - -
- -
(D) - - - - - - -
- - - - - - - - - -
- - - - - - - -
(D) -
7
- - - - - - - - - -
- - - - - - - - - -
- - 5 - - - - - - -
- - - - - - - - - -
- - - - - - - - 2 -
(D)
- - - - - - - - - -
- - - - - - - - - -
- -
95 - - - - - - -
- - - - - - - - - -
- - - - - - - -
(D) -
6
- - - - - - - - - -
- - 1 - 1 - - - - -
- - 1 - - - - - - -
- - - - - - - 1 - -
- - - - - - - - 2 -
24
- - - - - - - - - -
- -
(D) -
(D) - - - - -
- -
(D) - - - - - - -
- - - - - - -
(D) - -
- - - - - - - -
(D) -
12
- - - - - - - - - -
- - - - 1 - - - - -
- 1 2 - - - 1 - - 1
- - - - - - - 1 - -
- - - - - - - - 5 -
101
- - - - - - - - - -
- - - -
(D) - - - - -
- (D) (D)
- - -
(D) - -
(D)
- - - - - - -
(D) - -
- - - - - - - -
71 -
--continued
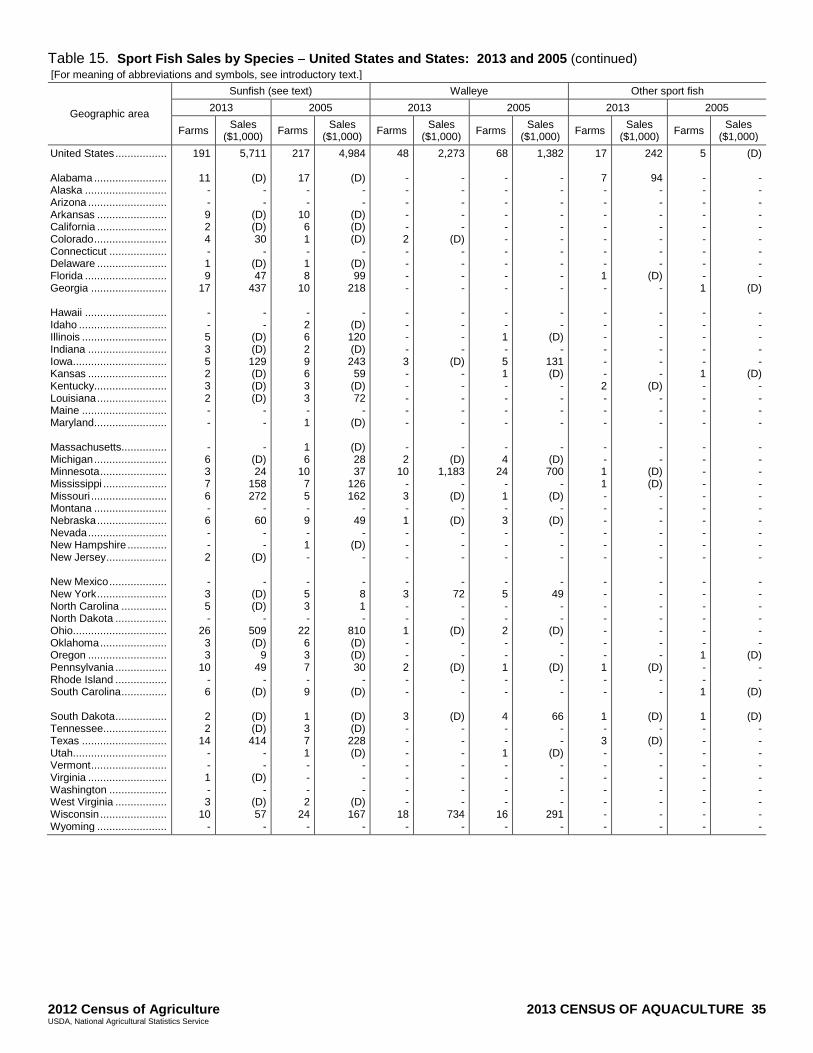
2012 Census of Agriculture 2013 CENSUS OF AQUACULTURE 35 USDA, National Agricultural Statistics Service
Table 15. Sport Fish Sales by Species United States and States: 2013 and 2005 (continued) [For meaning of abbreviations and symbols, see introductory text.]
Geographic area
Sunfish (see text) Walleye Other sport fish
2013 2005 2013 2005 2013 2005
Farms Sales
($1,000) Farms
Sales ($1,000)
Farms Sales
($1,000) Farms
Sales ($1,000)
Farms Sales
($1,000) Farms
Sales ($1,000)
United States ................. Alabama ........................ Alaska ........................... Arizona .......................... Arkansas ....................... California ....................... Colorado ........................ Connecticut ................... Delaware ....................... Florida ........................... Georgia ......................... Hawaii ........................... Idaho ............................. Illinois ............................ Indiana .......................... Iowa............................... Kansas .......................... Kentucky........................ Louisiana ....................... Maine ............................ Maryland........................ Massachusetts............... Michigan ........................ Minnesota ...................... Mississippi ..................... Missouri ......................... Montana ........................ Nebraska ....................... Nevada .......................... New Hampshire ............. New Jersey .................... New Mexico ................... New York ....................... North Carolina ............... North Dakota ................. Ohio............................... Oklahoma ...................... Oregon .......................... Pennsylvania ................. Rhode Island ................. South Carolina ............... South Dakota ................. Tennessee ..................... Texas ............................ Utah............................... Vermont ......................... Virginia .......................... Washington ................... West Virginia ................. Wisconsin ...................... Wyoming .......................
191
11 - - 9 2 4 - 1 9
17
- - 5 3 5 2 3 2 - -
- 6 3 7 6 - 6 - - 2
- 3 5 -
26 3 3
10 - 6
2 2
14 - - 1 - 3
10 -
5,711
(D) - -
(D) (D) 30
- (D) 47
437
- -
(D) (D) 129 (D) (D) (D)
- -
- (D) 24
158 272
- 60
- -
(D)
- (D) (D)
- 509 (D)
9 49
- (D)
(D) (D) 414
- -
(D) -
(D) 57
-
217
17 - -
10 6 1 - 1 8
10
- 2 6 2 9 6 3 3 - 1
1 6
10 7 5 - 9 - 1 -
- 5 3 -
22 6 3 7 - 9
1 3 7 1 - - - 2
24 -
4,984
(D) - -
(D) (D) (D)
- (D) 99
218
- (D) 120 (D) 243 59
(D) 72
- (D)
(D) 28 37
126 162
- 49
- (D)
-
- 8 1 -
810 (D) (D) 30
- (D)
(D) (D) 228 (D)
- - -
(D) 167
-
48
- - - - - 2 - - - -
- - - - 3 - - - - -
- 2
10 - 3 - 1 - - -
- 3 - - 1 - - 2 - -
3 - - - - - - -
18 -
2,273
- - - - -
(D) - - - -
- - - -
(D) - - - - -
- (D)
1,183 -
(D) -
(D) - - -
- 72
- -
(D) - -
(D) - -
(D) - - - - - - -
734 -
68
- - - - - - - - - -
- - 1 - 5 1 - - - -
- 4
24 - 1 - 3 - - -
- 5 - - 2 - - 1 - -
4 - - 1 - - - -
16 -
1,382
- - - - - - - - - -
- -
(D) -
131 (D)
- - - -
- (D) 700
- (D)
- (D)
- - -
- 49
- -
(D) - -
(D) - -
66 - -
(D) - - - -
291 -
17
7 - - - - - - - 1 -
- - - - - - 2 - - -
- - 1 1 - - - - - -
- - - - - - - 1 - -
1 - 3 - - - - - - -
242
94 - - - - - - -
(D) -
- - - - - -
(D) - - -
- -
(D) (D)
- - - - - -
- - - - - - -
(D) - -
(D) -
(D) - - - - - - -
5
- - - - - - - - - 1
- - - - - 1 - - - -
- - - - - - - - - -
- - - - - - 1 - - 1
1 - - - - - - - - -
(D)
- - - - - - - - -
(D)
- - - - -
(D) - - - -
- - - - - - - - - -
- - - - - -
(D) - -
(D)
(D) - - - - - - - - -
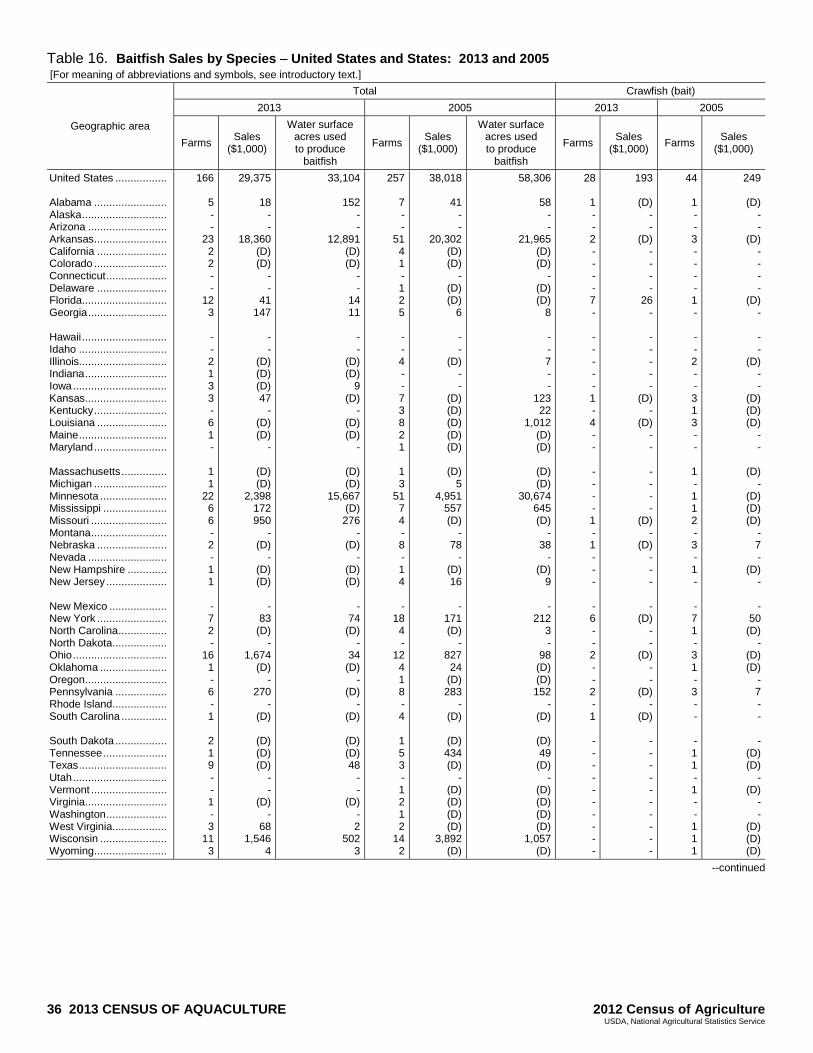
36 2013 CENSUS OF AQUACULTURE 2012 Census of Agriculture USDA, National Agricultural Statistics Service
Table 16. Baitfish Sales by Species United States and States: 2013 and 2005 [For meaning of abbreviations and symbols, see introductory text.]
Geographic area
Total Crawfish (bait)
2013 2005 2013 2005
Farms Sales
($1,000)
Water surface acres used to produce
baitfish
Farms Sales
($1,000)
Water surface acres used to produce
baitfish
Farms Sales
($1,000) Farms
Sales ($1,000)
United States ................. Alabama ........................ Alaska ............................ Arizona .......................... Arkansas ........................ California ....................... Colorado ........................ Connecticut .................... Delaware ....................... Florida............................ Georgia .......................... Hawaii ............................ Idaho ............................. Illinois............................. Indiana ........................... Iowa ............................... Kansas ........................... Kentucky ........................ Louisiana ....................... Maine ............................. Maryland ........................ Massachusetts ............... Michigan ........................ Minnesota ...................... Mississippi ..................... Missouri ......................... Montana ......................... Nebraska ....................... Nevada .......................... New Hampshire ............. New Jersey .................... New Mexico ................... New York ....................... North Carolina ................ North Dakota .................. Ohio ............................... Oklahoma ...................... Oregon ........................... Pennsylvania ................. Rhode Island .................. South Carolina ............... South Dakota ................. Tennessee ..................... Texas ............................. Utah ............................... Vermont ......................... Virginia ........................... Washington .................... West Virginia .................. Wisconsin ...................... Wyoming ........................
166
5 - -
23 2 2 - -
12 3
- - 2 1 3 3 - 6 1 -
1 1
22 6 6 - 2 - 1 1
- 7 2 -
16 1 - 6 - 1
2 1 9 - - 1 - 3
11 3
29,375
18 - -
18,360 (D) (D)
- -
41 147
- -
(D) (D) (D) 47
- (D) (D)
-
(D) (D)
2,398 172 950
- (D)
- (D) (D)
-
83 (D)
- 1,674
(D) -
270 -
(D)
(D) (D) (D)
- -
(D) -
68 1,546
4
33,104
152 - -
12,891 (D) (D)
- -
14 11
- -
(D) (D)
9 (D)
- (D) (D)
-
(D) (D)
15,667 (D) 276
- (D)
- (D) (D)
-
74 (D)
- 34
(D) -
(D) -
(D)
(D) (D) 48
- -
(D) - 2
502 3
257
7 - -
51 4 1 - 1 2 5
- - 4 - - 7 3 8 2 1
1 3
51 7 4 - 8 - 1 4
- 18 4 -
12 4 1 8 - 4
1 5 3 - 1 2 1 2
14 2
38,018
41 - -
20,302 (D) (D)
- (D) (D)
6
- -
(D) - -
(D) (D) (D) (D) (D)
(D)
5 4,951
557 (D)
- 78
- (D) 16
-
171 (D)
- 827 24
(D) 283
- (D)
(D) 434 (D)
- (D) (D) (D) (D)
3,892 (D)
58,306
58 - -
21,965 (D) (D)
- (D) (D)
8
- - 7 - -
123 22
1,012 (D) (D)
(D) (D)
30,674 645 (D)
- 38
- (D)
9
- 212
3 -
98 (D) (D) 152
- (D)
(D) 49
(D) -
(D) (D) (D) (D)
1,057 (D)
28
1 - - 2 - - - - 7 -
- - - - - 1 - 4 - -
- - - - 1 - 1 - - -
- 6 - - 2 - - 2 - 1
- - - - - - - - - -
193
(D) - -
(D) - - - -
26 -
- - - - -
(D) -
(D) - -
- - - -
(D) -
(D) - - -
- (D)
- -
(D) - -
(D) -
(D)
- - - - - - - - - -
44
1 - - 3 - - - - 1 -
- - 2 - - 3 1 3 - -
1 - 1 1 2 - 3 - 1 -
- 7 1 - 3 1 - 3 - -
- 1 1 - 1 - - 1 1 1
249
(D) - -
(D) - - - -
(D) -
- -
(D) - -
(D) (D) (D)
- -
(D) -
(D) (D) (D)
- 7 -
(D) -
- 50
(D) -
(D) (D)
- 7 - -
- (D) (D)
- (D)
- -
(D) (D) (D)
--continued
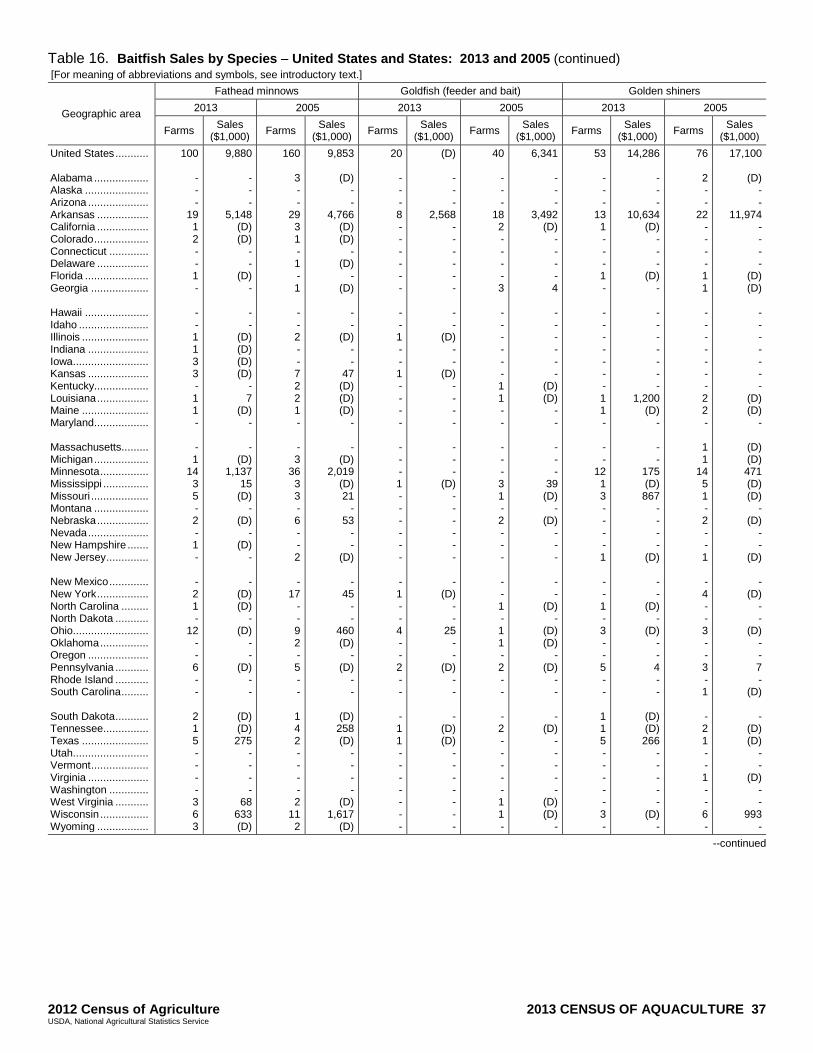
2012 Census of Agriculture 2013 CENSUS OF AQUACULTURE 37 USDA, National Agricultural Statistics Service
Table 16. Baitfish Sales by Species United States and States: 2013 and 2005 (continued) [For meaning of abbreviations and symbols, see introductory text.]
Geographic area
Fathead minnows Goldfish (feeder and bait) Golden shiners
2013 2005 2013 2005 2013 2005
Farms Sales
($1,000) Farms
Sales ($1,000)
Farms Sales
($1,000) Farms
Sales ($1,000)
Farms Sales
($1,000) Farms
Sales ($1,000)
United States ........... Alabama .................. Alaska ..................... Arizona .................... Arkansas ................. California ................. Colorado .................. Connecticut ............. Delaware ................. Florida ..................... Georgia ................... Hawaii ..................... Idaho ....................... Illinois ...................... Indiana .................... Iowa......................... Kansas .................... Kentucky.................. Louisiana ................. Maine ...................... Maryland.................. Massachusetts......... Michigan .................. Minnesota ................ Mississippi ............... Missouri ................... Montana .................. Nebraska ................. Nevada .................... New Hampshire ....... New Jersey .............. New Mexico ............. New York ................. North Carolina ......... North Dakota ........... Ohio......................... Oklahoma ................ Oregon .................... Pennsylvania ........... Rhode Island ........... South Carolina ......... South Dakota ........... Tennessee ............... Texas ...................... Utah......................... Vermont ................... Virginia .................... Washington ............. West Virginia ........... Wisconsin ................ Wyoming .................
100
- - -
19 1 2 - - 1 -
- - 1 1 3 3 - 1 1 -
- 1
14 3 5 - 2 - 1 -
- 2 1 -
12 - - 6 - -
2 1 5 - - - - 3 6 3
9,880
- - -
5,148 (D) (D)
- -
(D) -
- -
(D) (D) (D) (D)
- 7
(D) -
- (D)
1,137 15
(D) -
(D) -
(D) -
- (D) (D)
- (D)
- -
(D) - -
(D) (D) 275
- - - -
68 633 (D)
160
3 - -
29 3 1 - 1 - 1
- - 2 - - 7 2 2 1 -
- 3
36 3 3 - 6 - - 2
- 17
- - 9 2 - 5 - -
1 4 2 - - - - 2
11 2
9,853
(D) - -
4,766 (D) (D)
- (D)
- (D)
- -
(D) - -
47 (D) (D) (D)
-
- (D)
2,019 (D) 21
- 53
- -
(D)
- 45
- -
460 (D)
- (D)
- -
(D) 258 (D)
- - - -
(D) 1,617
(D)
20
- - - 8 - - - - - -
- - 1 - - 1 - - - -
- - - 1 - - - - - -
- 1 - - 4 - - 2 - -
- 1 1 - - - - - - -
(D)
- - -
2,568 - - - - - -
- -
(D) - -
(D) - - - -
- - -
(D) - - - - - -
- (D)
- -
25 - -
(D) - -
- (D) (D)
- - - - - - -
40
- - -
18 2 - - - - 3
- - - - - - 1 1 - -
- - - 3 1 - 2 - - -
- - 1 - 1 1 - 2 - -
- 2 - - - - - 1 1 -
6,341
- - -
3,492 (D)
- - - - 4
- - - - - -
(D) (D)
- -
- - -
39 (D)
- (D)
- - -
- -
(D) -
(D) (D)
- (D)
- -
- (D)
- - - - -
(D) (D)
-
53
- - -
13 1 - - - 1 -
- - - - - - - 1 1 -
- -
12 1 3 - - - - 1
- - 1 - 3 - - 5 - -
1 1 5 - - - - - 3 -
14,286
- - -
10,634 (D)
- - -
(D) -
- - - - - - -
1,200 (D)
-
- -
175 (D) 867
- - - -
(D)
- -
(D) -
(D) - - 4 - -
(D) (D) 266
- - - - -
(D) -
76
2 - -
22 - - - - 1 1
- - - - - - - 2 2 -
1 1
14 5 1 - 2 - - 1
- 4 - - 3 - - 3 - 1
- 2 1 - - 1 - - 6 -
17,100
(D) - -
11,974 - - - -
(D) (D)
- - - - - - -
(D) (D)
-
(D) (D) 471 (D) (D)
- (D)
- -
(D)
- (D)
- -
(D) - - 7 -
(D)
- (D) (D)
- -
(D) - -
993 -
--continued
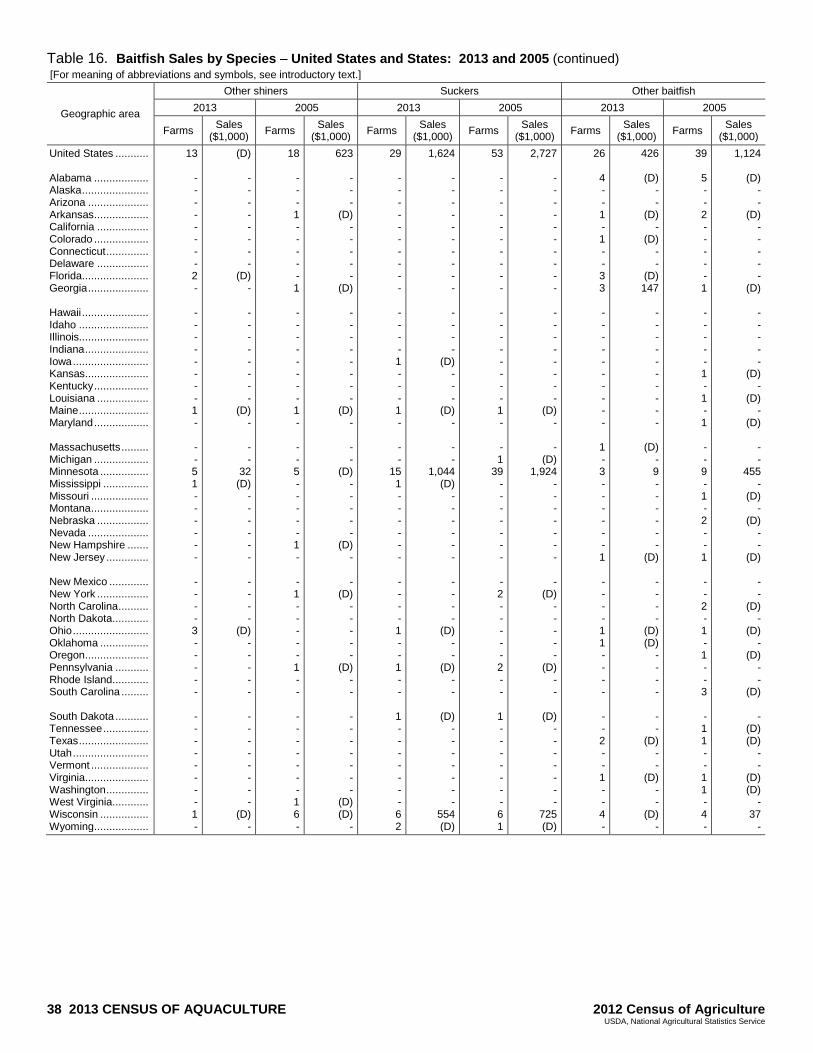
38 2013 CENSUS OF AQUACULTURE 2012 Census of Agriculture USDA, National Agricultural Statistics Service
Table 16. Baitfish Sales by Species United States and States: 2013 and 2005 (continued) [For meaning of abbreviations and symbols, see introductory text.]
Geographic area
Other shiners Suckers Other baitfish
2013 2005 2013 2005 2013 2005
Farms Sales
($1,000) Farms
Sales ($1,000)
Farms Sales
($1,000) Farms
Sales ($1,000)
Farms Sales
($1,000) Farms
Sales ($1,000)
United States ........... Alabama .................. Alaska ...................... Arizona .................... Arkansas .................. California ................. Colorado .................. Connecticut .............. Delaware ................. Florida...................... Georgia .................... Hawaii ...................... Idaho ....................... Illinois....................... Indiana ..................... Iowa ......................... Kansas ..................... Kentucky .................. Louisiana ................. Maine ....................... Maryland .................. Massachusetts ......... Michigan .................. Minnesota ................ Mississippi ............... Missouri ................... Montana ................... Nebraska ................. Nevada .................... New Hampshire ....... New Jersey .............. New Mexico ............. New York ................. North Carolina .......... North Dakota ............ Ohio ......................... Oklahoma ................ Oregon ..................... Pennsylvania ........... Rhode Island ............ South Carolina ......... South Dakota ........... Tennessee ............... Texas ....................... Utah ......................... Vermont ................... Virginia ..................... Washington .............. West Virginia ............ Wisconsin ................ Wyoming ..................
13
- - - - - - - - 2 -
- - - - - - - - 1 -
- - 5 1 - - - - - -
- - - - 3 - - - - -
- - - - - - - - 1 -
(D)
- - - - - - - -
(D) -
- - - - - - - -
(D) -
- -
32 (D)
- - - - - -
- - - -
(D) - - - - -
- - - - - - - -
(D) -
18
- - - 1 - - - - - 1
- - - - - - - - 1 -
- - 5 - - - - - 1 -
- 1 - - - - - 1 - -
- - - - - - - 1 6 -
623
- - -
(D) - - - - -
(D)
- - - - - - - -
(D) -
- -
(D) - - - - -
(D) -
- (D)
- - - - -
(D) - -
- - - - - - -
(D) (D)
-
29
- - - - - - - - - -
- - - - 1 - - - 1 -
- -
15 1 - - - - - -
- - - - 1 - - 1 - -
1 - - - - - - - 6 2
1,624
- - - - - - - - - -
- - - -
(D) - - -
(D) -
- -
1,044 (D)
- - - - - -
- - - -
(D) - -
(D) - -
(D) - - - - - - -
554 (D)
53
- - - - - - - - - -
- - - - - - - - 1 -
- 1
39 - - - - - - -
- 2 - - - - - 2 - -
1 - - - - - - - 6 1
2,727
- - - - - - - - - -
- - - - - - - -
(D) -
- (D)
1,924 - - - - - - -
- (D)
- - - - -
(D) - -
(D) - - - - - - -
725 (D)
26
4 - - 1 - 1 - - 3 3
- - - - - - - - - -
1 - 3 - - - - - - 1
- - - - 1 1 - - - -
- - 2 - - 1 - - 4 -
426
(D) - -
(D) -
(D) - -
(D) 147
- - - - - - - - - -
(D) - 9 - - - - - -
(D)
- - - -
(D) (D)
- - - -
- -
(D) - -
(D) - -
(D) -
39
5 - - 2 - - - - - 1
- - - - - 1 - 1 - 1
- - 9 - 1 - 2 - - 1
- - 2 - 1 - 1 - - 3
- 1 1 - - 1 1 - 4 -
1,124
(D) - -
(D) - - - - -
(D)
- - - - -
(D) -
(D) -
(D)
- -
455 -
(D) -
(D) - -
(D)
- -
(D) -
(D) -
(D) - -
(D)
- (D) (D)
- -
(D) (D)
- 37
-
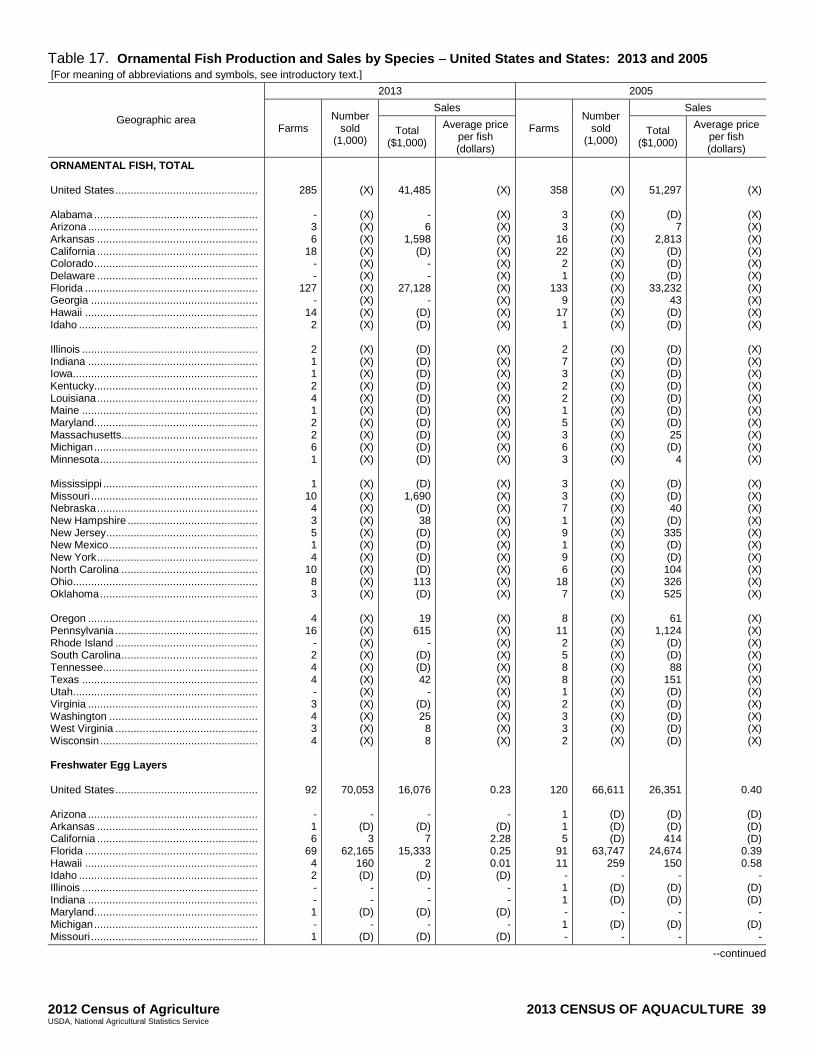
2012 Census of Agriculture 2013 CENSUS OF AQUACULTURE 39 USDA, National Agricultural Statistics Service
Table 17. Ornamental Fish Production and Sales by Species United States and States: 2013 and 2005 [For meaning of abbreviations and symbols, see introductory text.]
Geographic area
2013 2005
Farms Number
sold (1,000)
Sales
Farms Number
sold (1,000)
Sales
Total ($1,000)
Average price per fish (dollars)
Total ($1,000)
Average price per fish (dollars)
ORNAMENTAL FISH, TOTAL United States ............................................... Alabama ...................................................... Arizona ........................................................ Arkansas ..................................................... California ..................................................... Colorado ...................................................... Delaware ..................................................... Florida ......................................................... Georgia ....................................................... Hawaii ......................................................... Idaho ........................................................... Illinois .......................................................... Indiana ........................................................ Iowa............................................................. Kentucky...................................................... Louisiana ..................................................... Maine .......................................................... Maryland...................................................... Massachusetts............................................. Michigan ...................................................... Minnesota .................................................... Mississippi ................................................... Missouri ....................................................... Nebraska ..................................................... New Hampshire ........................................... New Jersey .................................................. New Mexico ................................................. New York ..................................................... North Carolina ............................................. Ohio............................................................. Oklahoma .................................................... Oregon ........................................................ Pennsylvania ............................................... Rhode Island ............................................... South Carolina ............................................. Tennessee ................................................... Texas .......................................................... Utah............................................................. Virginia ........................................................ Washington ................................................. West Virginia ............................................... Wisconsin .................................................... Freshwater Egg Layers United States ............................................... Arizona ........................................................ Arkansas ..................................................... California ..................................................... Florida ......................................................... Hawaii ......................................................... Idaho ........................................................... Illinois .......................................................... Indiana ........................................................ Maryland...................................................... Michigan ...................................................... Missouri .......................................................
285
- 3 6
18 - -
127 -
14 2
2 1 1 2 4 1 2 2 6 1
1 10 4 3 5 1 4
10 8 3
4 16
- 2 4 4 - 3 4 3 4
92
- 1 6
69 4 2 - - 1 - 1
(X)
(X) (X) (X) (X) (X) (X) (X) (X) (X) (X)
(X) (X) (X) (X) (X) (X) (X) (X) (X) (X)
(X) (X) (X) (X) (X) (X) (X) (X) (X) (X)
(X) (X) (X) (X) (X) (X) (X) (X) (X) (X) (X)
70,053
- (D)
3 62,165
160 (D)
- -
(D) -
(D)
41,485
- 6
1,598 (D)
- -
27,128 -
(D) (D)
(D) (D) (D) (D) (D) (D) (D) (D) (D) (D)
(D)
1,690 (D) 38
(D) (D) (D) (D) 113 (D)
19
615 -
(D) (D) 42
- (D) 25 8 8
16,076
- (D)
7 15,333
2 (D)
- -
(D) -
(D)
(X)
(X) (X) (X) (X) (X) (X) (X) (X) (X) (X)
(X) (X) (X) (X) (X) (X) (X) (X) (X) (X)
(X) (X) (X) (X) (X) (X) (X) (X) (X) (X)
(X) (X) (X) (X) (X) (X) (X) (X) (X) (X) (X)
0.23
- (D)
2.28 0.25 0.01 (D)
- -
(D) -
(D)
358
3 3
16 22 2 1
133 9
17 1
2 7 3 2 2 1 5 3 6 3
3 3 7 1 9 1 9 6
18 7
8 11 2 5 8 8 1 2 3 3 2
120
1 1 5
91 11
- 1 1 - 1 -
(X)
(X) (X) (X) (X) (X) (X) (X) (X) (X) (X)
(X) (X) (X) (X) (X) (X) (X) (X) (X) (X)
(X) (X) (X) (X) (X) (X) (X) (X) (X) (X)
(X) (X) (X) (X) (X) (X) (X) (X) (X) (X) (X)
66,611
(D) (D) (D)
63,747 259
- (D) (D)
- (D)
-
51,297
(D) 7
2,813 (D) (D) (D)
33,232 43
(D) (D)
(D) (D) (D) (D) (D) (D) (D) 25
(D) 4
(D) (D) 40
(D) 335 (D) (D) 104 326 525
61
1,124 (D) (D) 88
151 (D) (D) (D) (D) (D)
26,351
(D) (D) 414
24,674 150
- (D) (D)
- (D)
-
(X)
(X) (X) (X) (X) (X) (X) (X) (X) (X) (X)
(X) (X) (X) (X) (X) (X) (X) (X) (X) (X)
(X) (X) (X) (X) (X) (X) (X) (X) (X) (X)
(X) (X) (X) (X) (X) (X) (X) (X) (X) (X) (X)
0.40
(D) (D) (D)
0.39 0.58
- (D) (D)
- (D)
-
--continued
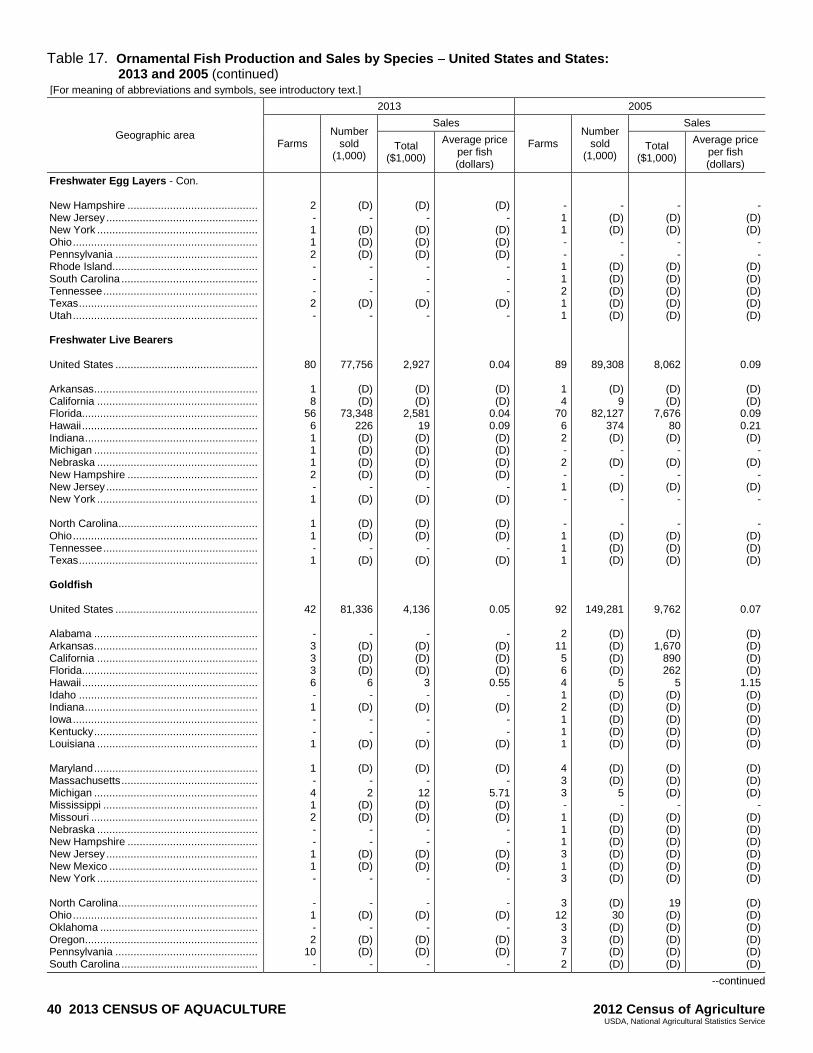
40 2013 CENSUS OF AQUACULTURE 2012 Census of Agriculture USDA, National Agricultural Statistics Service
Table 17. Ornamental Fish Production and Sales by Species United States and States: 2013 and 2005 (continued)
[For meaning of abbreviations and symbols, see introductory text.]
Geographic area
2013 2005
Farms Number
sold (1,000)
Sales
Farms Number
sold (1,000)
Sales
Total ($1,000)
Average price per fish (dollars)
Total ($1,000)
Average price per fish (dollars)
Freshwater Egg Layers - Con. New Hampshire ........................................... New Jersey .................................................. New York ..................................................... Ohio ............................................................. Pennsylvania ............................................... Rhode Island ................................................ South Carolina ............................................. Tennessee ................................................... Texas ........................................................... Utah ............................................................. Freshwater Live Bearers United States ............................................... Arkansas ...................................................... California ..................................................... Florida.......................................................... Hawaii .......................................................... Indiana ......................................................... Michigan ...................................................... Nebraska ..................................................... New Hampshire ........................................... New Jersey .................................................. New York ..................................................... North Carolina .............................................. Ohio ............................................................. Tennessee ................................................... Texas ........................................................... Goldfish United States ............................................... Alabama ...................................................... Arkansas ...................................................... California ..................................................... Florida.......................................................... Hawaii .......................................................... Idaho ........................................................... Indiana ......................................................... Iowa ............................................................. Kentucky ...................................................... Louisiana ..................................................... Maryland ...................................................... Massachusetts ............................................. Michigan ...................................................... Mississippi ................................................... Missouri ....................................................... Nebraska ..................................................... New Hampshire ........................................... New Jersey .................................................. New Mexico ................................................. New York ..................................................... North Carolina .............................................. Ohio ............................................................. Oklahoma .................................................... Oregon ......................................................... Pennsylvania ............................................... South Carolina .............................................
2 - 1 1 2 - - - 2 -
80
1 8
56 6 1 1 1 2 - 1
1 1 - 1
42
- 3 3 3 6 - 1 - - 1
1 - 4 1 2 - - 1 1 -
- 1 - 2
10 -
(D) -
(D) (D) (D)
- - -
(D) -
77,756
(D) (D)
73,348 226 (D) (D) (D) (D)
- (D)
(D) (D)
- (D)
81,336
- (D) (D) (D)
6 -
(D) - -
(D)
(D) - 2
(D) (D)
- -
(D) (D)
-
- (D)
- (D) (D)
-
(D) -
(D) (D) (D)
- - -
(D) -
2,927
(D) (D)
2,581 19
(D) (D) (D) (D)
- (D)
(D) (D)
- (D)
4,136
- (D) (D) (D)
3 -
(D) - -
(D)
(D) -
12 (D) (D)
- -
(D) (D)
-
- (D)
- (D) (D)
-
(D) -
(D) (D) (D)
- - -
(D) -
0.04
(D) (D)
0.04 0.09 (D) (D) (D) (D)
- (D)
(D) (D)
- (D)
0.05
- (D) (D) (D)
0.55 -
(D) - -
(D)
(D) -
5.71 (D) (D)
- -
(D) (D)
-
- (D)
- (D) (D)
-
- 1 1 - - 1 1 2 1 1
89
1 4
70 6 2 - 2 - 1 -
- 1 1 1
92
2 11 5 6 4 1 2 1 1 1
4 3 3 - 1 1 1 3 1 3
3 12 3 3 7 2
- (D) (D)
- -
(D) (D) (D) (D) (D)
89,308
(D) 9
82,127 374 (D)
- (D)
- (D)
-
- (D) (D) (D)
149,281
(D) (D) (D) (D)
5 (D) (D) (D) (D) (D)
(D) (D)
5 -
(D) (D) (D) (D) (D) (D)
(D) 30
(D) (D) (D) (D)
- (D) (D)
- -
(D) (D) (D) (D) (D)
8,062
(D) (D)
7,676 80
(D) -
(D) -
(D) -
- (D) (D) (D)
9,762
(D) 1,670
890 262
5 (D) (D) (D) (D) (D)
(D) (D) (D)
- (D) (D) (D) (D) (D) (D)
19
(D) (D) (D) (D) (D)
- (D) (D)
- -
(D) (D) (D) (D) (D)
0.09
(D) (D)
0.09 0.21 (D)
- (D)
- (D)
-
- (D) (D) (D)
0.07
(D) (D) (D) (D)
1.15 (D) (D) (D) (D) (D)
(D) (D) (D)
- (D) (D) (D) (D) (D) (D)
(D) (D) (D) (D) (D) (D)
--continued
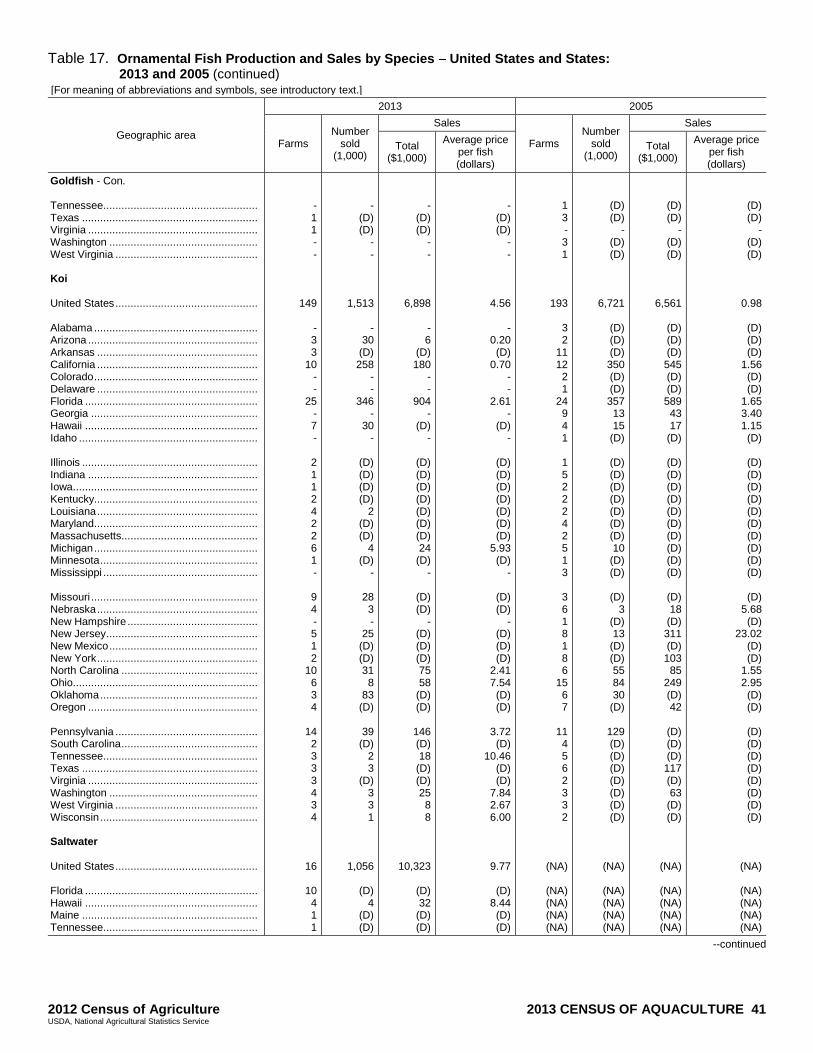
2012 Census of Agriculture 2013 CENSUS OF AQUACULTURE 41 USDA, National Agricultural Statistics Service
Table 17. Ornamental Fish Production and Sales by Species United States and States: 2013 and 2005 (continued)
[For meaning of abbreviations and symbols, see introductory text.]
Geographic area
2013 2005
Farms Number
sold (1,000)
Sales
Farms Number
sold (1,000)
Sales
Total ($1,000)
Average price per fish (dollars)
Total ($1,000)
Average price per fish (dollars)
Goldfish - Con. Tennessee ................................................... Texas .......................................................... Virginia ........................................................ Washington ................................................. West Virginia ............................................... Koi United States ............................................... Alabama ...................................................... Arizona ........................................................ Arkansas ..................................................... California ..................................................... Colorado ...................................................... Delaware ..................................................... Florida ......................................................... Georgia ....................................................... Hawaii ......................................................... Idaho ........................................................... Illinois .......................................................... Indiana ........................................................ Iowa............................................................. Kentucky...................................................... Louisiana ..................................................... Maryland...................................................... Massachusetts............................................. Michigan ...................................................... Minnesota .................................................... Mississippi ................................................... Missouri ....................................................... Nebraska ..................................................... New Hampshire ........................................... New Jersey .................................................. New Mexico ................................................. New York ..................................................... North Carolina ............................................. Ohio............................................................. Oklahoma .................................................... Oregon ........................................................ Pennsylvania ............................................... South Carolina ............................................. Tennessee ................................................... Texas .......................................................... Virginia ........................................................ Washington ................................................. West Virginia ............................................... Wisconsin .................................................... Saltwater United States ............................................... Florida ......................................................... Hawaii ......................................................... Maine .......................................................... Tennessee ...................................................
- 1 1 - -
149
- 3 3
10 - -
25 - 7 -
2 1 1 2 4 2 2 6 1 -
9 4 - 5 1 2
10 6 3 4
14 2 3 3 3 4 3 4
16
10 4 1 1
- (D) (D)
- -
1,513
- 30
(D) 258
- -
346 -
30 -
(D) (D) (D) (D)
2 (D) (D)
4 (D)
-
28 3 -
25 (D) (D) 31 8
83 (D)
39
(D) 2 3
(D) 3 3 1
1,056
(D) 4
(D) (D)
- (D) (D)
- -
6,898
- 6
(D) 180
- -
904 -
(D) -
(D) (D) (D) (D) (D) (D) (D) 24
(D) -
(D) (D)
- (D) (D) (D) 75 58
(D) (D)
146 (D) 18
(D) (D) 25 8 8
10,323
(D) 32
(D) (D)
- (D) (D)
- -
4.56
- 0.20 (D)
0.70 - -
2.61 -
(D) -
(D) (D) (D) (D) (D) (D) (D)
5.93 (D)
-
(D) (D)
- (D) (D) (D)
2.41 7.54 (D) (D)
3.72 (D)
10.46 (D) (D)
7.84 2.67 6.00
9.77
(D) 8.44 (D) (D)
1 3 - 3 1
193
3 2
11 12 2 1
24 9 4 1
1 5 2 2 2 4 2 5 1 3
3 6 1 8 1 8 6
15 6 7
11 4 5 6 2 3 3 2
(NA)
(NA) (NA) (NA) (NA)
(D) (D)
- (D) (D)
6,721
(D) (D) (D) 350 (D) (D) 357 13 15
(D)
(D) (D) (D) (D) (D) (D) (D) 10
(D) (D)
(D)
3 (D) 13
(D) (D) 55 84 30
(D)
129 (D) (D) (D) (D) (D) (D) (D)
(NA)
(NA) (NA) (NA) (NA)
(D) (D)
- (D) (D)
6,561
(D) (D) (D) 545 (D) (D) 589 43 17
(D)
(D) (D) (D) (D) (D) (D) (D) (D) (D) (D)
(D) 18
(D) 311 (D) 103 85
249 (D) 42
(D) (D) (D) 117 (D) 63
(D) (D)
(NA)
(NA) (NA) (NA) (NA)
(D) (D)
- (D) (D)
0.98
(D) (D) (D)
1.56 (D) (D)
1.65 3.40 1.15 (D)
(D) (D) (D) (D) (D) (D) (D) (D) (D) (D)
(D)
5.68 (D)
23.02 (D) (D)
1.55 2.95 (D) (D)
(D) (D) (D) (D) (D) (D) (D) (D)
(NA)
(NA) (NA) (NA) (NA)
--continued
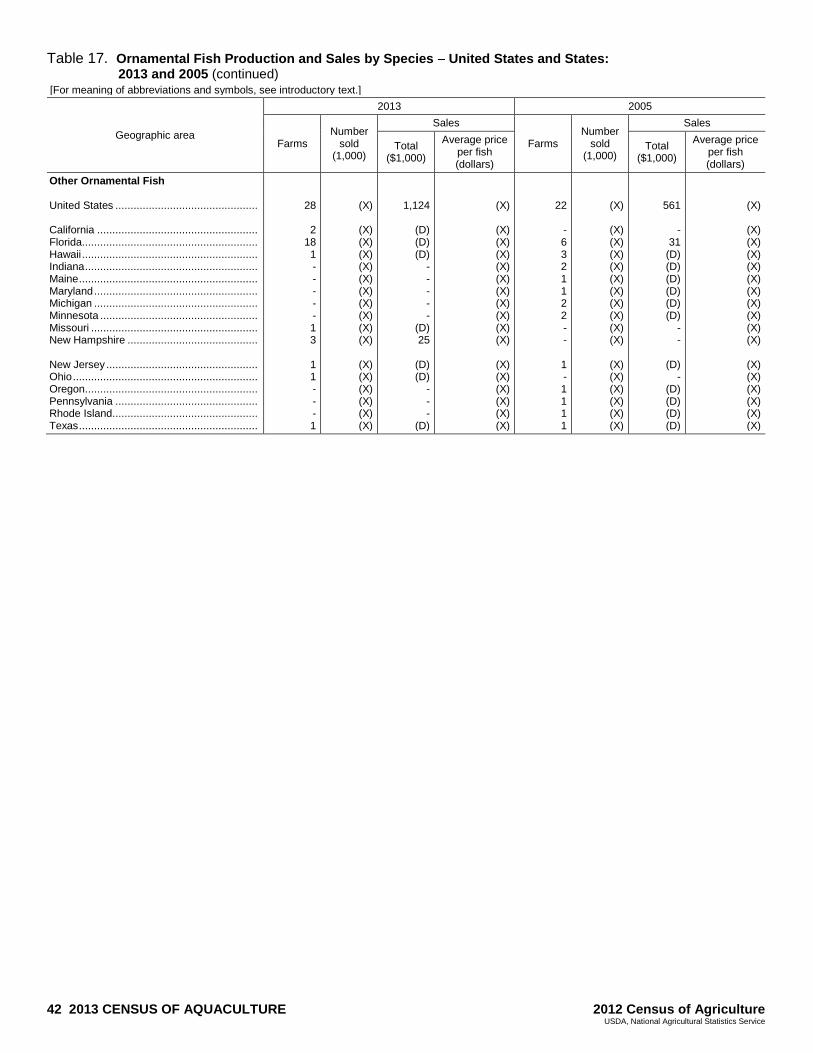
42 2013 CENSUS OF AQUACULTURE 2012 Census of Agriculture USDA, National Agricultural Statistics Service
Table 17. Ornamental Fish Production and Sales by Species United States and States: 2013 and 2005 (continued)
[For meaning of abbreviations and symbols, see introductory text.]
Geographic area
2013 2005
Farms Number
sold (1,000)
Sales
Farms Number
sold (1,000)
Sales
Total ($1,000)
Average price per fish (dollars)
Total ($1,000)
Average price per fish (dollars)
Other Ornamental Fish United States ............................................... California ..................................................... Florida.......................................................... Hawaii .......................................................... Indiana ......................................................... Maine ........................................................... Maryland ...................................................... Michigan ...................................................... Minnesota .................................................... Missouri ....................................................... New Hampshire ........................................... New Jersey .................................................. Ohio ............................................................. Oregon ......................................................... Pennsylvania ............................................... Rhode Island ................................................ Texas ...........................................................
28
2 18 1 - - - - - 1 3
1 1 - - - 1
(X)
(X) (X) (X) (X) (X) (X) (X) (X) (X) (X)
(X) (X) (X) (X) (X) (X)
1,124
(D) (D) (D)
- - - - -
(D) 25
(D) (D)
- - -
(D)
(X)
(X) (X) (X) (X) (X) (X) (X) (X) (X) (X)
(X) (X) (X) (X) (X) (X)
22
- 6 3 2 1 1 2 2 - -
1 - 1 1 1 1
(X)
(X) (X) (X) (X) (X) (X) (X) (X) (X) (X)
(X) (X) (X) (X) (X) (X)
561
- 31
(D) (D) (D) (D) (D) (D)
- -
(D) -
(D) (D) (D) (D)
(X)
(X) (X) (X) (X) (X) (X) (X) (X) (X) (X)
(X) (X) (X) (X) (X) (X)
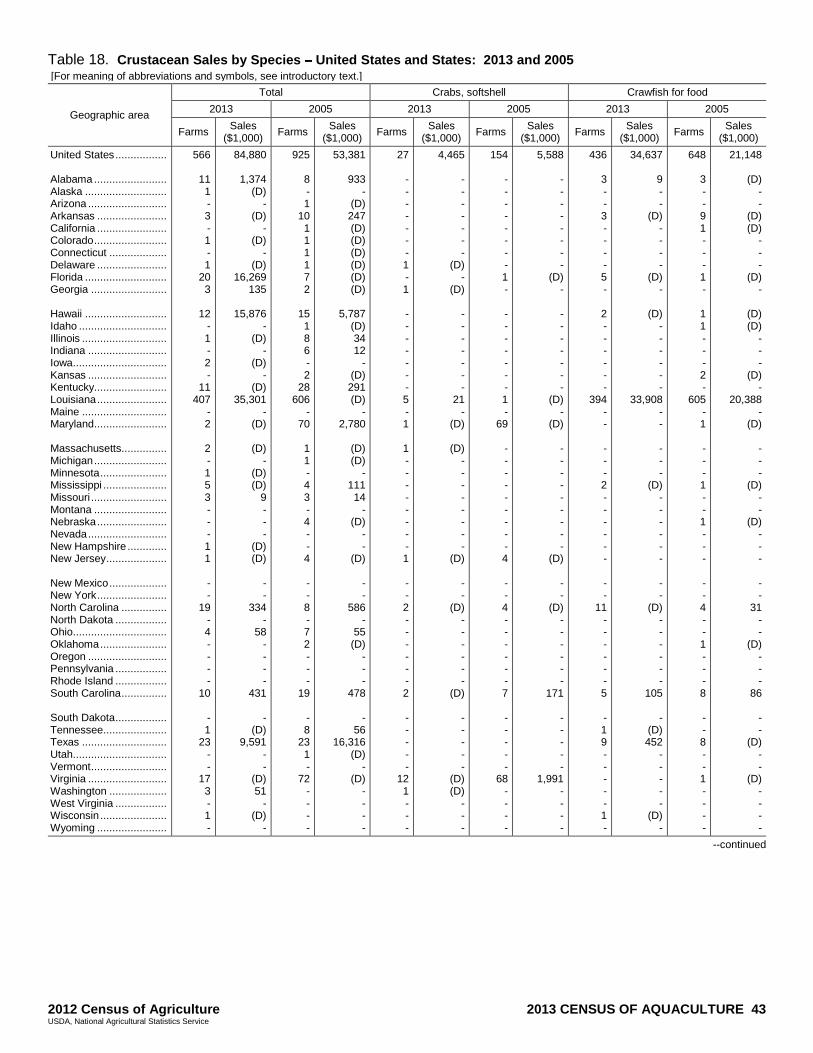
2012 Census of Agriculture 2013 CENSUS OF AQUACULTURE 43 USDA, National Agricultural Statistics Service
Table 18. Crustacean Sales by Species United States and States: 2013 and 2005 [For meaning of abbreviations and symbols, see introductory text.]
Geographic area
Total Crabs, softshell Crawfish for food
2013 2005 2013 2005 2013 2005
Farms Sales
($1,000) Farms
Sales ($1,000)
Farms Sales
($1,000) Farms
Sales ($1,000)
Farms Sales
($1,000) Farms
Sales ($1,000)
United States ................. Alabama ........................ Alaska ........................... Arizona .......................... Arkansas ....................... California ....................... Colorado ........................ Connecticut ................... Delaware ....................... Florida ........................... Georgia ......................... Hawaii ........................... Idaho ............................. Illinois ............................ Indiana .......................... Iowa............................... Kansas .......................... Kentucky........................ Louisiana ....................... Maine ............................ Maryland........................ Massachusetts............... Michigan ........................ Minnesota ...................... Mississippi ..................... Missouri ......................... Montana ........................ Nebraska ....................... Nevada .......................... New Hampshire ............. New Jersey .................... New Mexico ................... New York ....................... North Carolina ............... North Dakota ................. Ohio............................... Oklahoma ...................... Oregon .......................... Pennsylvania ................. Rhode Island ................. South Carolina ............... South Dakota ................. Tennessee ..................... Texas ............................ Utah............................... Vermont ......................... Virginia .......................... Washington ................... West Virginia ................. Wisconsin ...................... Wyoming .......................
566
11 1 - 3 - 1 - 1
20 3
12 - 1 - 2 -
11 407
- 2
2 - 1 5 3 - - - 1 1
- -
19 - 4 - - - -
10
- 1
23 - -
17 3 - 1 -
84,880
1,374 (D)
- (D)
- (D)
- (D)
16,269 135
15,876
- (D)
- (D)
- (D)
35,301 -
(D)
(D) -
(D) (D)
9 - - -
(D) (D)
- -
334 -
58 - - - -
431
- (D)
9,591 - -
(D) 51
- (D)
-
925
8 - 1
10 1 1 1 1 7 2
15 1 8 6 - 2
28 606
- 70
1 1 - 4 3 - 4 - - 4
- - 8 - 7 2 - - -
19
- 8
23 1 -
72 - - - -
53,381
933 -
(D) 247 (D) (D) (D) (D) (D) (D)
5,787
(D) 34 12
- (D) 291 (D)
- 2,780
(D) (D)
- 111 14
- (D)
- -
(D)
- -
586 -
55 (D)
- - -
478
- 56
16,316 (D)
- (D)
- - - -
27
- - - - - - - 1 - 1
- - - - - - - 5 - 1
1 - - - - - - - - 1
- - 2 - - - - - - 2
- - - - -
12 1 - - -
4,465
- - - - - - -
(D) -
(D)
- - - - - - -
21 -
(D)
(D) - - - - - - - -
(D)
- -
(D) - - - - - -
(D)
- - - - -
(D) (D)
- - -
154
- - - - - - - - 1 -
- - - - - - - 1 -
69
- - - - - - - - - 4
- - 4 - - - - - - 7
- - - - -
68 - - - -
5,588
- - - - - - - -
(D) -
- - - - - - -
(D) -
(D)
- - - - - - - - -
(D)
- -
(D) - - - - - -
171
- - - - -
1,991 - - - -
436
3 - - 3 - - - - 5 -
2 - - - - - -
394 - -
- - - 2 - - - - - -
- -
11 - - - - - - 5
- 1 9 - - - - - 1 -
34,637
9 - -
(D) - - - -
(D) -
(D) - - - - - -
33,908 - -
- - -
(D) - - - - - -
- -
(D) - - - - - -
105
- (D) 452
- - - - -
(D) -
648
3 - - 9 1 - - - 1 -
1 1 - - - 2 -
605 - 1
- - - 1 - - 1 - - -
- - 4 - - 1 - - - 8
- - 8 - - 1 - - - -
21,148
(D) - -
(D) (D)
- - -
(D) -
(D) (D)
- - -
(D) -
20,388 -
(D)
- - -
(D) - -
(D) - - -
- -
31 - -
(D) - - -
86
- -
(D) - -
(D) - - - -
--continued
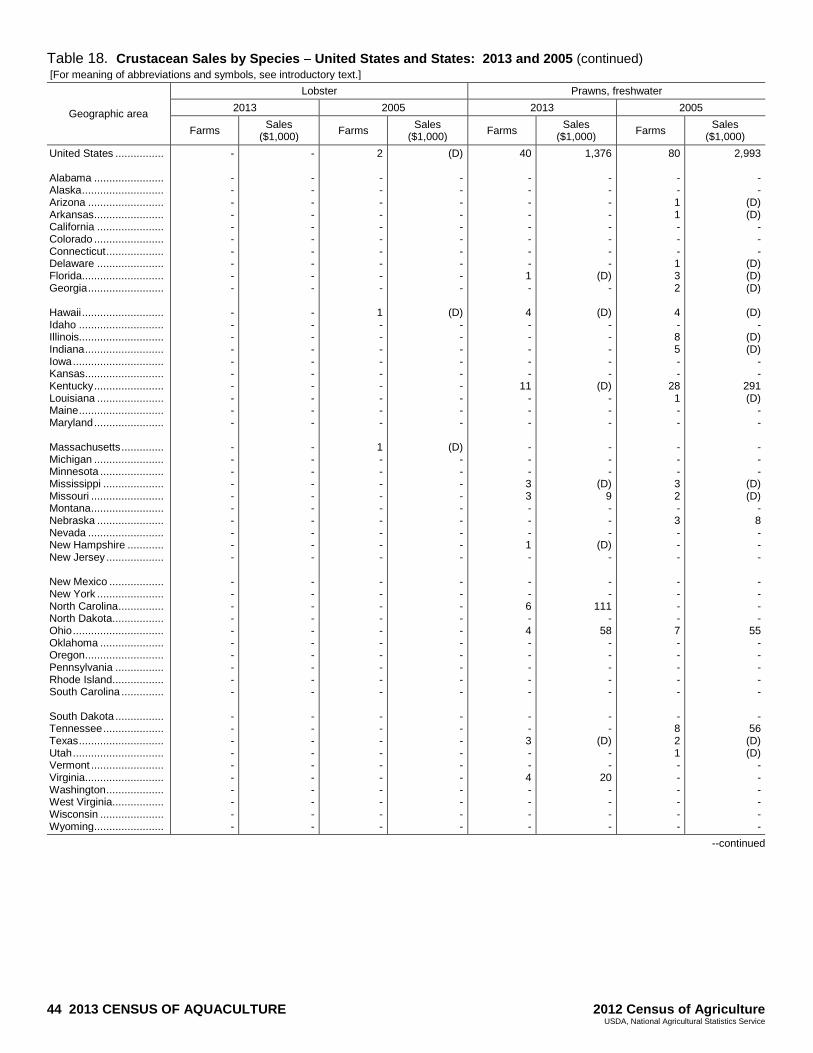
44 2013 CENSUS OF AQUACULTURE 2012 Census of Agriculture USDA, National Agricultural Statistics Service
Table 18. Crustacean Sales by Species United States and States: 2013 and 2005 (continued) [For meaning of abbreviations and symbols, see introductory text.]
Geographic area
Lobster Prawns, freshwater
2013 2005 2013 2005
Farms Sales
($1,000) Farms
Sales ($1,000)
Farms Sales
($1,000) Farms
Sales ($1,000)
United States ................ Alabama ....................... Alaska ........................... Arizona ......................... Arkansas ....................... California ...................... Colorado ....................... Connecticut ................... Delaware ...................... Florida........................... Georgia ......................... Hawaii ........................... Idaho ............................ Illinois............................ Indiana .......................... Iowa .............................. Kansas .......................... Kentucky ....................... Louisiana ...................... Maine ............................ Maryland ....................... Massachusetts .............. Michigan ....................... Minnesota ..................... Mississippi .................... Missouri ........................ Montana ........................ Nebraska ...................... Nevada ......................... New Hampshire ............ New Jersey ................... New Mexico .................. New York ...................... North Carolina ............... North Dakota ................. Ohio .............................. Oklahoma ..................... Oregon .......................... Pennsylvania ................ Rhode Island ................. South Carolina .............. South Dakota ................ Tennessee .................... Texas ............................ Utah .............................. Vermont ........................ Virginia .......................... Washington ................... West Virginia ................. Wisconsin ..................... Wyoming .......................
-
- - - - - - - - - -
- - - - - - - - - -
- - - - - - - - - -
- - - - - - - - - -
- - - - - - - - - -
-
- - - - - - - - - -
- - - - - - - - - -
- - - - - - - - - -
- - - - - - - - - -
- - - - - - - - - -
2
- - - - - - - - - -
1 - - - - - - - - -
1 - - - - - - - - -
- - - - - - - - - -
- - - - - - - - - -
(D)
- - - - - - - - - -
(D) - - - - - - - - -
(D) - - - - - - - - -
- - - - - - - - - -
- - - - - - - - - -
40
- - - - - - - - 1 -
4 - - - - -
11 - - -
- - - 3 3 - - - 1 -
- - 6 - 4 - - - - -
- - 3 - - 4 - - - -
1,376
- - - - - - - -
(D) -
(D) - - - - -
(D) - - -
- - -
(D) 9 - - -
(D) -
- -
111 -
58 - - - - -
- -
(D) - -
20 - - - -
80
- - 1 1 - - - 1 3 2
4 - 8 5 - -
28 1 - -
- - - 3 2 - 3 - - -
- - - - 7 - - - - -
- 8 2 1 - - - - - -
2,993
- -
(D) (D)
- - -
(D) (D) (D)
(D)
- (D) (D)
- -
291 (D)
- -
- - -
(D) (D)
- 8 - - -
- - - -
55 - - - - -
- 56
(D) (D)
- - - - - -
--continued
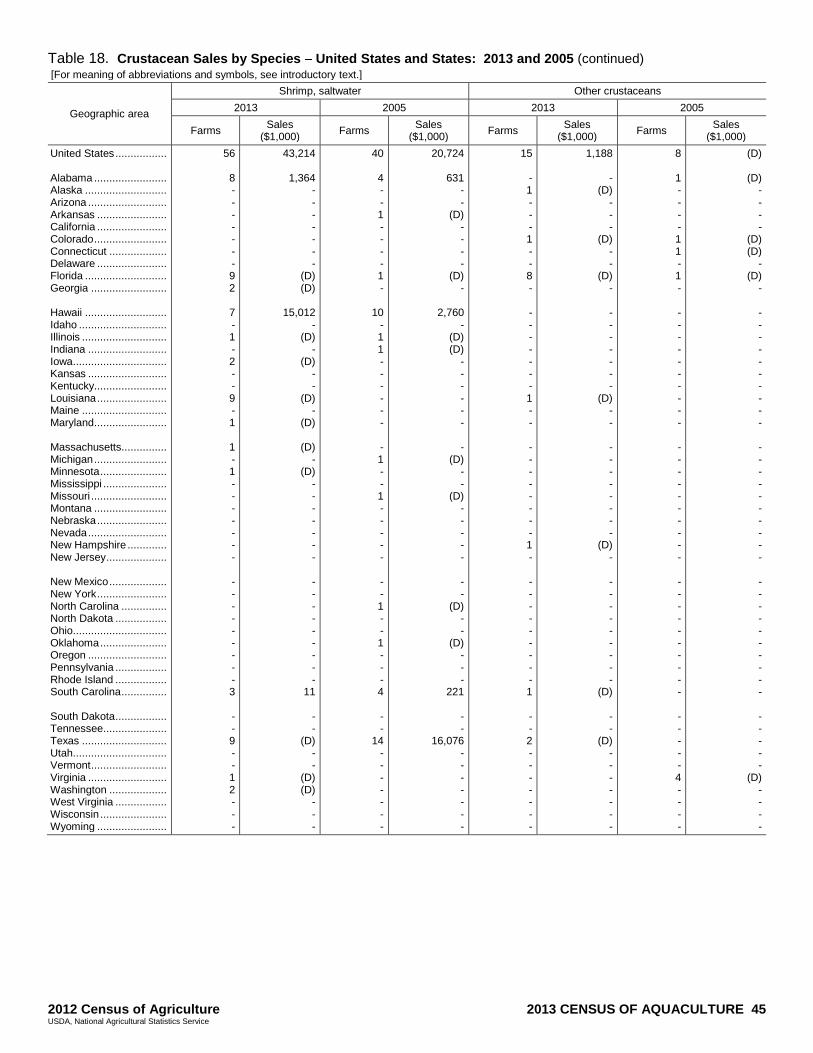
2012 Census of Agriculture 2013 CENSUS OF AQUACULTURE 45 USDA, National Agricultural Statistics Service
Table 18. Crustacean Sales by Species United States and States: 2013 and 2005 (continued) [For meaning of abbreviations and symbols, see introductory text.]
Geographic area
Shrimp, saltwater Other crustaceans
2013 2005 2013 2005
Farms Sales
($1,000) Farms
Sales ($1,000)
Farms Sales
($1,000) Farms
Sales ($1,000)
United States ................. Alabama ........................ Alaska ........................... Arizona .......................... Arkansas ....................... California ....................... Colorado ........................ Connecticut ................... Delaware ....................... Florida ........................... Georgia ......................... Hawaii ........................... Idaho ............................. Illinois ............................ Indiana .......................... Iowa............................... Kansas .......................... Kentucky........................ Louisiana ....................... Maine ............................ Maryland........................ Massachusetts............... Michigan ........................ Minnesota ...................... Mississippi ..................... Missouri ......................... Montana ........................ Nebraska ....................... Nevada .......................... New Hampshire ............. New Jersey .................... New Mexico ................... New York ....................... North Carolina ............... North Dakota ................. Ohio............................... Oklahoma ...................... Oregon .......................... Pennsylvania ................. Rhode Island ................. South Carolina ............... South Dakota ................. Tennessee ..................... Texas ............................ Utah............................... Vermont ......................... Virginia .......................... Washington ................... West Virginia ................. Wisconsin ...................... Wyoming .......................
56
8 - - - - - - - 9 2
7 - 1 - 2 - - 9 - 1
1 - 1 - - - - - - -
- - - - - - - - - 3
- - 9 - - 1 2 - - -
43,214
1,364 - - - - - - -
(D) (D)
15,012
- (D)
- (D)
- -
(D) -
(D)
(D) -
(D) - - - - - - -
- - - - - - - - -
11
- -
(D) - -
(D) (D)
- - -
40
4 - - 1 - - - - 1 -
10 - 1 1 - - - - - -
- 1 - - 1 - - - - -
- - 1 - - 1 - - - 4
- -
14 - - - - - - -
20,724
631 - -
(D) - - - -
(D) -
2,760 -
(D) (D)
- - - - - -
- (D)
- -
(D) - - - - -
- -
(D) - -
(D) - - -
221
- -
16,076 - - - - - - -
15
- 1 - - - 1 - - 8 -
- - - - - - - 1 - -
- - - - - - - - 1 -
- - - - - - - - - 1
- - 2 - - - - - - -
1,188
- (D)
- - -
(D) - -
(D) -
- - - - - - -
(D) - -
- - - - - - - -
(D) -
- - - - - - - - -
(D)
- -
(D) - - - - - - -
8
1 - - - - 1 1 - 1 -
- - - - - - - - - -
- - - - - - - - - -
- - - - - - - - - -
- - - - - 4 - - - -
(D)
(D) - - - -
(D) (D)
- (D)
-
- - - - - - - - - -
- - - - - - - - - -
- - - - - - - - - -
- - - - -
(D) - - - -
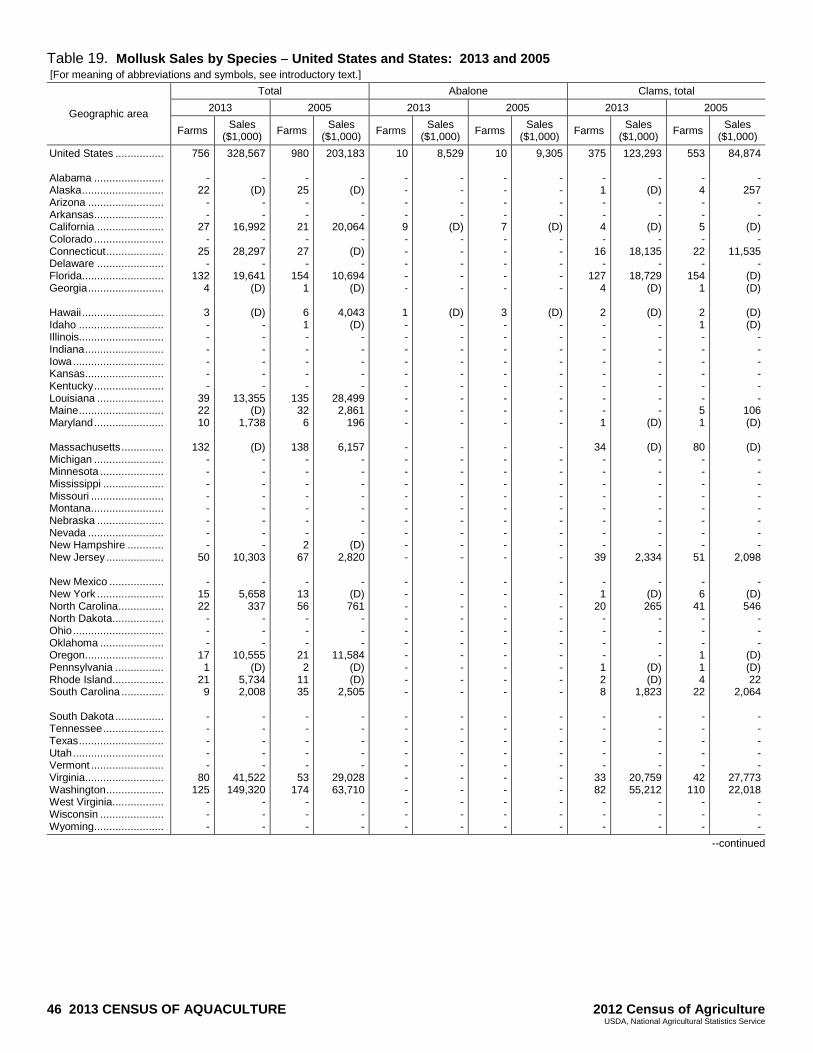
46 2013 CENSUS OF AQUACULTURE 2012 Census of Agriculture USDA, National Agricultural Statistics Service
Table 19. Mollusk Sales by Species United States and States: 2013 and 2005 [For meaning of abbreviations and symbols, see introductory text.]
Geographic area
Total Abalone Clams, total
2013 2005 2013 2005 2013 2005
Farms Sales
($1,000) Farms
Sales ($1,000)
Farms Sales
($1,000) Farms
Sales ($1,000)
Farms Sales
($1,000) Farms
Sales ($1,000)
United States ................ Alabama ....................... Alaska ........................... Arizona ......................... Arkansas ....................... California ...................... Colorado ....................... Connecticut ................... Delaware ...................... Florida........................... Georgia ......................... Hawaii ........................... Idaho ............................ Illinois............................ Indiana .......................... Iowa .............................. Kansas .......................... Kentucky ....................... Louisiana ...................... Maine ............................ Maryland ....................... Massachusetts .............. Michigan ....................... Minnesota ..................... Mississippi .................... Missouri ........................ Montana ........................ Nebraska ...................... Nevada ......................... New Hampshire ............ New Jersey ................... New Mexico .................. New York ...................... North Carolina ............... North Dakota ................. Ohio .............................. Oklahoma ..................... Oregon .......................... Pennsylvania ................ Rhode Island ................. South Carolina .............. South Dakota ................ Tennessee .................... Texas ............................ Utah .............................. Vermont ........................ Virginia .......................... Washington ................... West Virginia ................. Wisconsin ..................... Wyoming .......................
756
- 22
- -
27 -
25 -
132 4
3 - - - - - -
39 22 10
132
- - - - - - - -
50
- 15 22
- - -
17 1
21 9
- - - - -
80 125
- - -
328,567
- (D)
- -
16,992 -
28,297 -
19,641 (D)
(D)
- - - - - -
13,355 (D)
1,738
(D) - - - - - - - -
10,303
- 5,658
337 - - -
10,555 (D)
5,734 2,008
- - - - -
41,522 149,320
- - -
980
- 25
- -
21 -
27 -
154 1
6 1 - - - - -
135 32 6
138 - - - - - - - 2
67
- 13 56
- - -
21 2
11 35
- - - - -
53 174
- - -
203,183
- (D)
- -
20,064 -
(D) -
10,694 (D)
4,043
(D) - - - - -
28,499 2,861
196
6,157 - - - - - - -
(D) 2,820
-
(D) 761
- - -
11,584 (D) (D)
2,505
- - - - -
29,028 63,710
- - -
10
- - - - 9 - - - - -
1 - - - - - - - - -
- - - - - - - - - -
- - - - - - - - - -
- - - - - - - - - -
8,529
- - - -
(D) - - - - -
(D) - - - - - - - - -
- - - - - - - - - -
- - - - - - - - - -
- - - - - - - - - -
10
- - - - 7 - - - - -
3 - - - - - - - - -
- - - - - - - - - -
- - - - - - - - - -
- - - - - - - - - -
9,305
- - - -
(D) - - - - -
(D) - - - - - - - - -
- - - - - - - - - -
- - - - - - - - - -
- - - - - - - - - -
375
- 1 - - 4 -
16 -
127 4
2 - - - - - - - - 1
34
- - - - - - - -
39
- 1
20 - - - - 1 2 8
- - - - -
33 82
- - -
123,293
- (D)
- -
(D) -
18,135 -
18,729 (D)
(D)
- - - - - - - -
(D)
(D) - - - - - - - -
2,334
- (D) 265
- - - -
(D) (D)
1,823
- - - - -
20,759 55,212
- - -
553
- 4 - - 5 -
22 -
154 1
2 1 - - - - - - 5 1
80 - - - - - - - -
51
- 6
41 - - - 1 1 4
22
- - - - -
42 110
- - -
84,874
- 257
- -
(D) -
11,535 -
(D) (D)
(D) (D)
- - - - - -
106 (D)
(D)
- - - - - - - -
2,098
- (D) 546
- - -
(D) (D) 22
2,064
- - - - -
27,773 22,018
- - -
--continued
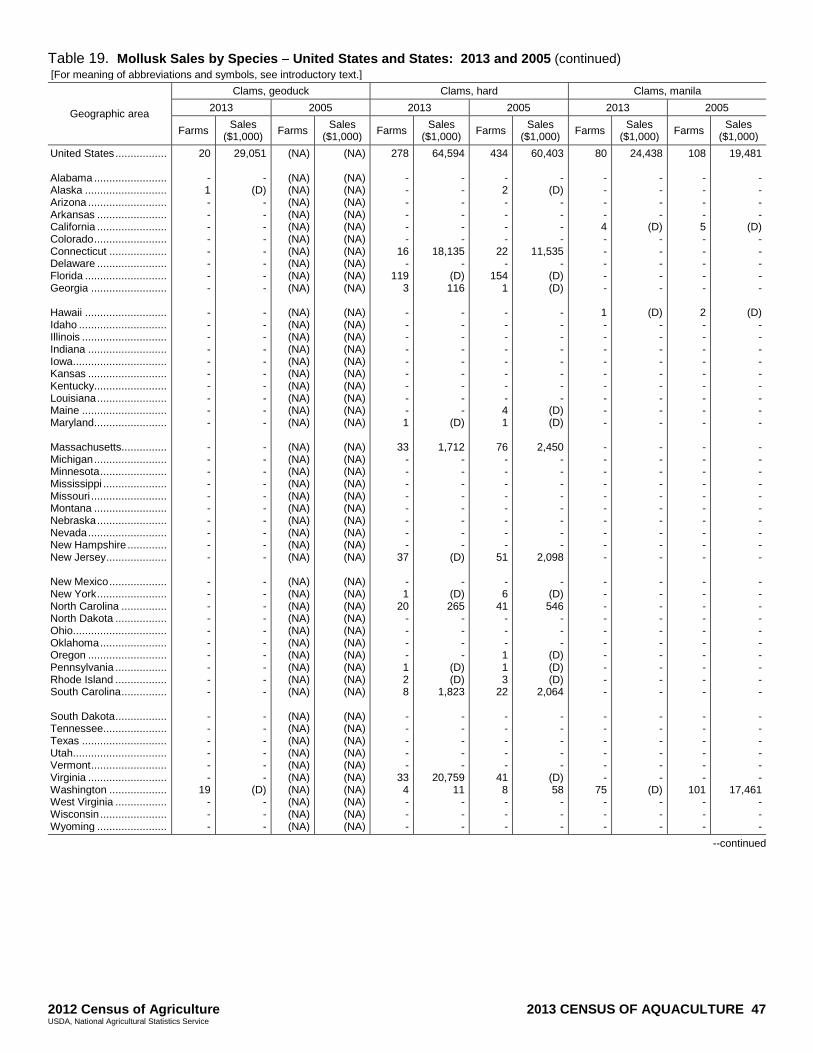
2012 Census of Agriculture 2013 CENSUS OF AQUACULTURE 47 USDA, National Agricultural Statistics Service
Table 19. Mollusk Sales by Species United States and States: 2013 and 2005 (continued) [For meaning of abbreviations and symbols, see introductory text.]
Geographic area
Clams, geoduck Clams, hard Clams, manila
2013 2005 2013 2005 2013 2005
Farms Sales
($1,000) Farms
Sales ($1,000)
Farms Sales
($1,000) Farms
Sales ($1,000)
Farms Sales
($1,000) Farms
Sales ($1,000)
United States ................. Alabama ........................ Alaska ........................... Arizona .......................... Arkansas ....................... California ....................... Colorado ........................ Connecticut ................... Delaware ....................... Florida ........................... Georgia ......................... Hawaii ........................... Idaho ............................. Illinois ............................ Indiana .......................... Iowa............................... Kansas .......................... Kentucky........................ Louisiana ....................... Maine ............................ Maryland........................ Massachusetts............... Michigan ........................ Minnesota ...................... Mississippi ..................... Missouri ......................... Montana ........................ Nebraska ....................... Nevada .......................... New Hampshire ............. New Jersey .................... New Mexico ................... New York ....................... North Carolina ............... North Dakota ................. Ohio............................... Oklahoma ...................... Oregon .......................... Pennsylvania ................. Rhode Island ................. South Carolina ............... South Dakota ................. Tennessee ..................... Texas ............................ Utah............................... Vermont ......................... Virginia .......................... Washington ................... West Virginia ................. Wisconsin ...................... Wyoming .......................
20
- 1 - - - - - - - -
- - - - - - - - - -
- - - - - - - - - -
- - - - - - - - - -
- - - - - -
19 - - -
29,051
- (D)
- - - - - - - -
- - - - - - - - - -
- - - - - - - - - -
- - - - - - - - - -
- - - - - -
(D) - - -
(NA)
(NA) (NA) (NA) (NA) (NA) (NA) (NA) (NA) (NA) (NA)
(NA) (NA) (NA) (NA) (NA) (NA) (NA) (NA) (NA) (NA)
(NA) (NA) (NA) (NA) (NA) (NA) (NA) (NA) (NA) (NA)
(NA) (NA) (NA) (NA) (NA) (NA) (NA) (NA) (NA) (NA)
(NA) (NA) (NA) (NA) (NA) (NA) (NA) (NA) (NA) (NA)
(NA)
(NA) (NA) (NA) (NA) (NA) (NA) (NA) (NA) (NA) (NA)
(NA) (NA) (NA) (NA) (NA) (NA) (NA) (NA) (NA) (NA)
(NA) (NA) (NA) (NA) (NA) (NA) (NA) (NA) (NA) (NA)
(NA) (NA) (NA) (NA) (NA) (NA) (NA) (NA) (NA) (NA)
(NA) (NA) (NA) (NA) (NA) (NA) (NA) (NA) (NA) (NA)
278
- - - - - -
16 -
119 3
- - - - - - - - - 1
33 - - - - - - - -
37
- 1
20 - - - - 1 2 8
- - - - -
33 4 - - -
64,594
- - - - - -
18,135 -
(D) 116
- - - - - - - - -
(D)
1,712 - - - - - - - -
(D)
- (D) 265
- - - -
(D) (D)
1,823
- - - - -
20,759 11
- - -
434
- 2 - - - -
22 -
154 1
- - - - - - - - 4 1
76 - - - - - - - -
51
- 6
41 - - - 1 1 3
22
- - - - -
41 8 - - -
60,403
- (D)
- - - -
11,535 -
(D) (D)
- - - - - - - -
(D) (D)
2,450
- - - - - - - -
2,098
- (D) 546
- - -
(D) (D) (D)
2,064
- - - - -
(D) 58
- - -
80
- - - - 4 - - - - -
1 - - - - - - - - -
- - - - - - - - - -
- - - - - - - - - -
- - - - - -
75 - - -
24,438
- - - -
(D) - - - - -
(D) - - - - - - - - -
- - - - - - - - - -
- - - - - - - - - -
- - - - - -
(D) - - -
108
- - - - 5 - - - - -
2 - - - - - - - - -
- - - - - - - - - -
- - - - - - - - - -
- - - - - -
101 - - -
19,481
- - - -
(D) - - - - -
(D) - - - - - - - - -
- - - - - - - - - -
- - - - - - - - - -
- - - - - -
17,461 - - -
--continued
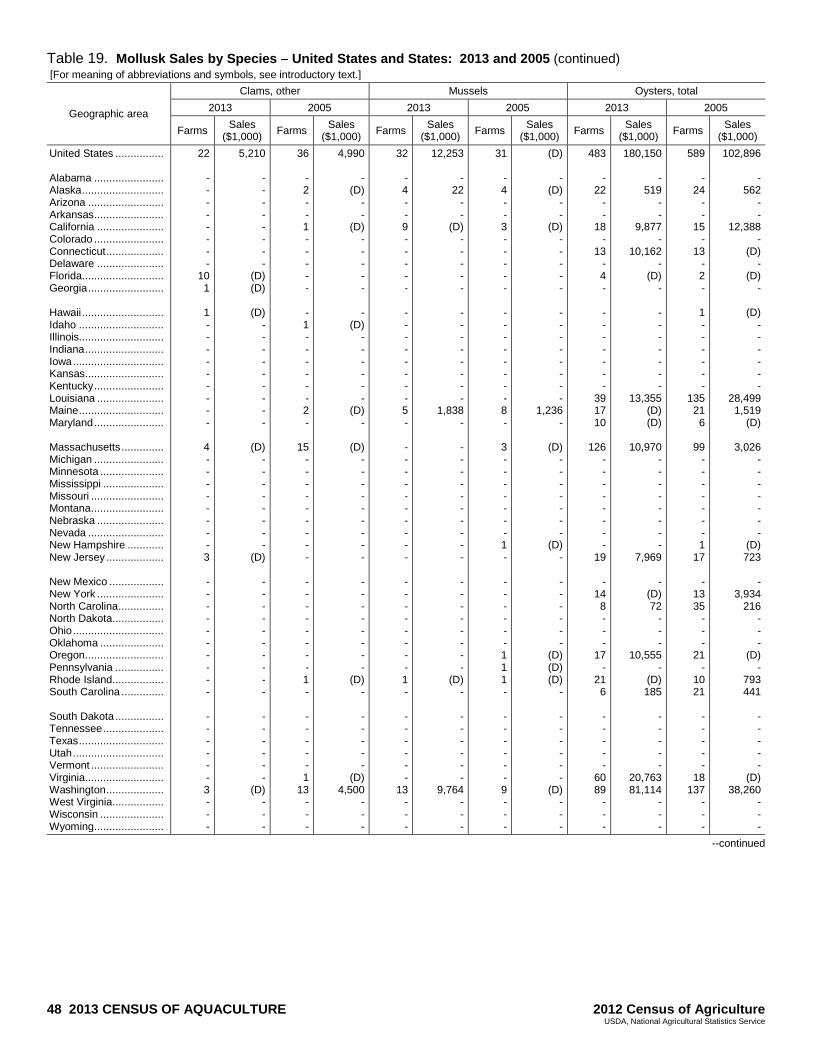
48 2013 CENSUS OF AQUACULTURE 2012 Census of Agriculture USDA, National Agricultural Statistics Service
Table 19. Mollusk Sales by Species United States and States: 2013 and 2005 (continued) [For meaning of abbreviations and symbols, see introductory text.]
Geographic area
Clams, other Mussels Oysters, total
2013 2005 2013 2005 2013 2005
Farms Sales
($1,000) Farms
Sales ($1,000)
Farms Sales
($1,000) Farms
Sales ($1,000)
Farms Sales
($1,000) Farms
Sales ($1,000)
United States ................ Alabama ....................... Alaska ........................... Arizona ......................... Arkansas ....................... California ...................... Colorado ....................... Connecticut ................... Delaware ...................... Florida........................... Georgia ......................... Hawaii ........................... Idaho ............................ Illinois............................ Indiana .......................... Iowa .............................. Kansas .......................... Kentucky ....................... Louisiana ...................... Maine ............................ Maryland ....................... Massachusetts .............. Michigan ....................... Minnesota ..................... Mississippi .................... Missouri ........................ Montana ........................ Nebraska ...................... Nevada ......................... New Hampshire ............ New Jersey ................... New Mexico .................. New York ...................... North Carolina ............... North Dakota ................. Ohio .............................. Oklahoma ..................... Oregon .......................... Pennsylvania ................ Rhode Island ................. South Carolina .............. South Dakota ................ Tennessee .................... Texas ............................ Utah .............................. Vermont ........................ Virginia .......................... Washington ................... West Virginia ................. Wisconsin ..................... Wyoming .......................
22
- - - - - - - -
10 1
1 - - - - - - - - -
4 - - - - - - - - 3
- - - - - - - - - -
- - - - - - 3 - - -
5,210
- - - - - - - -
(D) (D)
(D)
- - - - - - - - -
(D) - - - - - - - -
(D)
- - - - - - - - - -
- - - - - -
(D) - - -
36
- 2 - - 1 - - - - -
- 1 - - - - - - 2 -
15 - - - - - - - - -
- - - - - - - - 1 -
- - - - - 1
13 - - -
4,990
- (D)
- -
(D) - - - - -
- (D)
- - - - - -
(D) -
(D) - - - - - - - - -
- - - - - - - -
(D) -
- - - - -
(D) 4,500
- - -
32
- 4 - - 9 - - - - -
- - - - - - - - 5 -
- - - - - - - - - -
- - - - - - - - 1 -
- - - - - -
13 - - -
12,253
- 22
- -
(D) - - - - -
- - - - - - - -
1,838 -
- - - - - - - - - -
- - - - - - - -
(D) -
- - - - - -
9,764 - - -
31
- 4 - - 3 - - - - -
- - - - - - - - 8 -
3 - - - - - - - 1 -
- - - - - - 1 1 1 -
- - - - - - 9 - - -
(D)
- (D)
- -
(D) - - - - -
- - - - - - - -
1,236 -
(D) - - - - - - -
(D) -
- - - - - -
(D) (D) (D)
-
- - - - - -
(D) - - -
483
- 22
- -
18 -
13 - 4 -
- - - - - - -
39 17 10
126
- - - - - - - -
19
- 14 8 - - -
17 -
21 6
- - - - -
60 89
- - -
180,150
- 519
- -
9,877 -
10,162 -
(D) -
- - - - - - -
13,355 (D) (D)
10,970
- - - - - - - -
7,969
- (D) 72
- - -
10,555 -
(D) 185
- - - - -
20,763 81,114
- - -
589
- 24
- -
15 -
13 - 2 -
1 - - - - - -
135 21 6
99 - - - - - - - 1
17
- 13 35
- - -
21 -
10 21
- - - - -
18 137
- - -
102,896
- 562
- -
12,388 -
(D) -
(D) -
(D) - - - - - -
28,499 1,519
(D)
3,026 - - - - - - -
(D) 723
-
3,934 216
- - -
(D) -
793 441
- - - - -
(D) 38,260
- - -
--continued
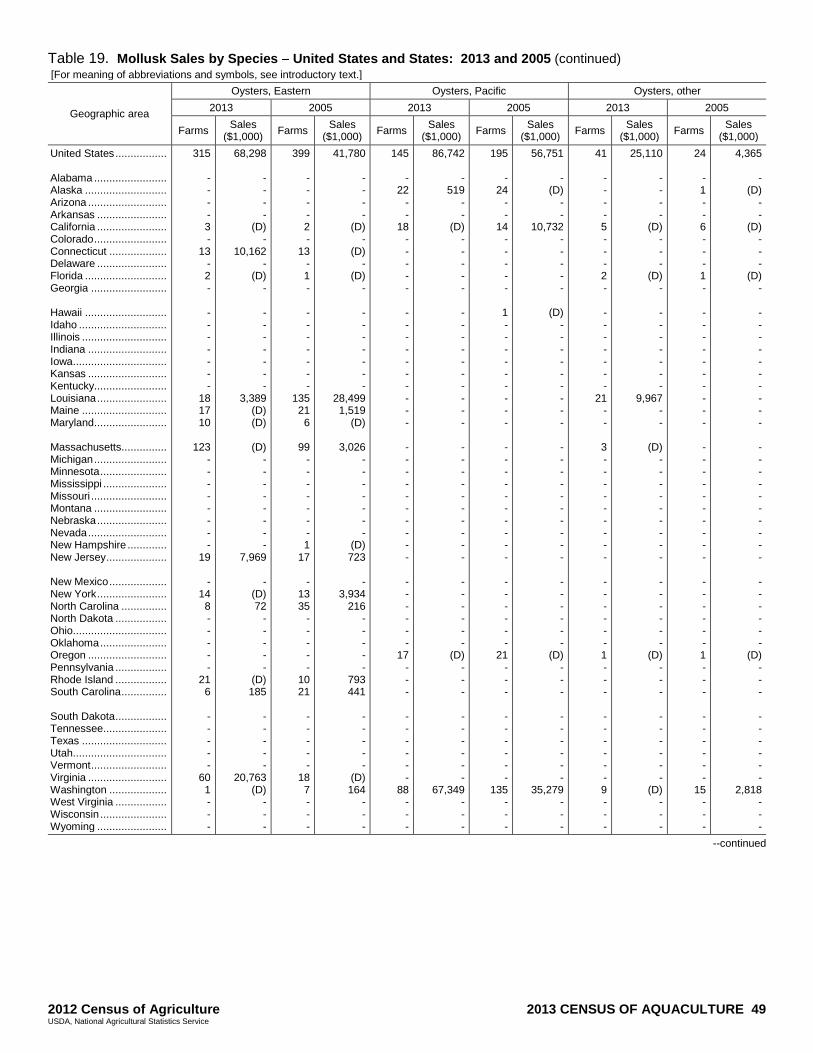
2012 Census of Agriculture 2013 CENSUS OF AQUACULTURE 49 USDA, National Agricultural Statistics Service
Table 19. Mollusk Sales by Species United States and States: 2013 and 2005 (continued) [For meaning of abbreviations and symbols, see introductory text.]
Geographic area
Oysters, Eastern Oysters, Pacific Oysters, other
2013 2005 2013 2005 2013 2005
Farms Sales
($1,000) Farms
Sales ($1,000)
Farms Sales
($1,000) Farms
Sales ($1,000)
Farms Sales
($1,000) Farms
Sales ($1,000)
United States ................. Alabama ........................ Alaska ........................... Arizona .......................... Arkansas ....................... California ....................... Colorado ........................ Connecticut ................... Delaware ....................... Florida ........................... Georgia ......................... Hawaii ........................... Idaho ............................. Illinois ............................ Indiana .......................... Iowa............................... Kansas .......................... Kentucky........................ Louisiana ....................... Maine ............................ Maryland........................ Massachusetts............... Michigan ........................ Minnesota ...................... Mississippi ..................... Missouri ......................... Montana ........................ Nebraska ....................... Nevada .......................... New Hampshire ............. New Jersey .................... New Mexico ................... New York ....................... North Carolina ............... North Dakota ................. Ohio............................... Oklahoma ...................... Oregon .......................... Pennsylvania ................. Rhode Island ................. South Carolina ............... South Dakota ................. Tennessee ..................... Texas ............................ Utah............................... Vermont ......................... Virginia .......................... Washington ................... West Virginia ................. Wisconsin ...................... Wyoming .......................
315
- - - - 3 -
13 - 2 -
- - - - - - -
18 17 10
123
- - - - - - - -
19
- 14 8 - - - - -
21 6
- - - - -
60 1 - - -
68,298
- - - -
(D) -
10,162 -
(D) -
- - - - - - -
3,389 (D) (D)
(D)
- - - - - - - -
7,969
- (D) 72
- - - - -
(D) 185
- - - - -
20,763 (D)
- - -
399
- - - - 2 -
13 - 1 -
- - - - - - -
135 21 6
99 - - - - - - - 1
17
- 13 35
- - - - -
10 21
- - - - -
18 7 - - -
41,780
- - - -
(D) -
(D) -
(D) -
- - - - - - -
28,499 1,519
(D)
3,026 - - - - - - -
(D) 723
-
3,934 216
- - - - -
793 441
- - - - -
(D) 164
- - -
145
- 22
- -
18 - - - - -
- - - - - - - - - -
- - - - - - - - - -
- - - - - -
17 - - -
- - - - - -
88 - - -
86,742
- 519
- -
(D) - - - - -
- - - - - - - - - -
- - - - - - - - - -
- - - - - -
(D) - - -
- - - - - -
67,349 - - -
195
- 24
- -
14 - - - - -
1 - - - - - - - - -
- - - - - - - - - -
- - - - - -
21 - - -
- - - - - -
135 - - -
56,751
- (D)
- -
10,732 - - - - -
(D) - - - - - - - - -
- - - - - - - - - -
- - - - - -
(D) - - -
- - - - - -
35,279 - - -
41
- - - - 5 - - - 2 -
- - - - - - -
21 - -
3 - - - - - - - - -
- - - - - - 1 - - -
- - - - - - 9 - - -
25,110
- - - -
(D) - - -
(D) -
- - - - - - -
9,967 - -
(D) - - - - - - - - -
- - - - - -
(D) - - -
- - - - - -
(D) - - -
24
- 1 - - 6 - - - 1 -
- - - - - - - - - -
- - - - - - - - - -
- - - - - - 1 - - -
- - - - - -
15 - - -
4,365
- (D)
- -
(D) - - -
(D) -
- - - - - - - - - -
- - - - - - - - - -
- - - - - -
(D) - - -
- - - - - -
2,818 - - -
--continued
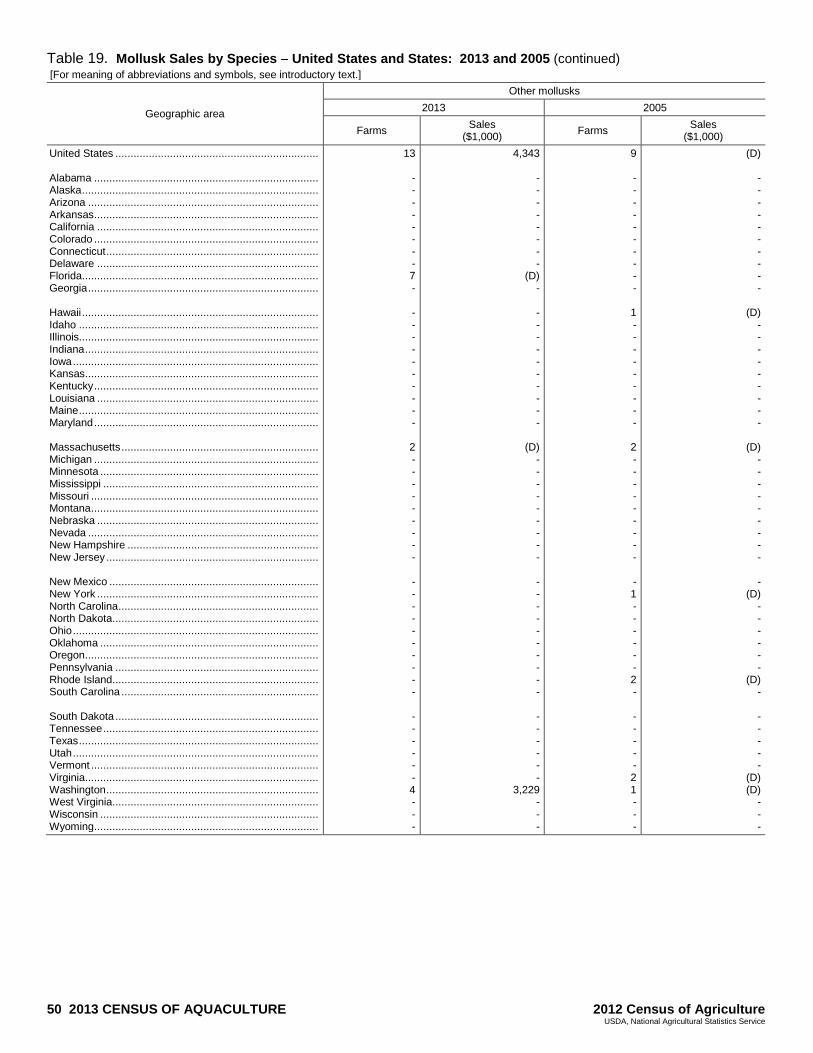
50 2013 CENSUS OF AQUACULTURE 2012 Census of Agriculture USDA, National Agricultural Statistics Service
Table 19. Mollusk Sales by Species United States and States: 2013 and 2005 (continued) [For meaning of abbreviations and symbols, see introductory text.]
Geographic area
Other mollusks
2013 2005
Farms Sales
($1,000) Farms
Sales ($1,000)
United States ................................................................... Alabama .......................................................................... Alaska .............................................................................. Arizona ............................................................................ Arkansas .......................................................................... California ......................................................................... Colorado .......................................................................... Connecticut ...................................................................... Delaware ......................................................................... Florida.............................................................................. Georgia ............................................................................ Hawaii .............................................................................. Idaho ............................................................................... Illinois............................................................................... Indiana ............................................................................. Iowa ................................................................................. Kansas ............................................................................. Kentucky .......................................................................... Louisiana ......................................................................... Maine ............................................................................... Maryland .......................................................................... Massachusetts ................................................................. Michigan .......................................................................... Minnesota ........................................................................ Mississippi ....................................................................... Missouri ........................................................................... Montana ........................................................................... Nebraska ......................................................................... Nevada ............................................................................ New Hampshire ............................................................... New Jersey ...................................................................... New Mexico ..................................................................... New York ......................................................................... North Carolina .................................................................. North Dakota .................................................................... Ohio ................................................................................. Oklahoma ........................................................................ Oregon ............................................................................. Pennsylvania ................................................................... Rhode Island .................................................................... South Carolina ................................................................. South Dakota ................................................................... Tennessee ....................................................................... Texas ............................................................................... Utah ................................................................................. Vermont ........................................................................... Virginia ............................................................................. Washington ...................................................................... West Virginia .................................................................... Wisconsin ........................................................................ Wyoming ..........................................................................
13
- - - - - - - - 7 -
- - - - - - - - - -
2 - - - - - - - - -
- - - - - - - - - -
- - - - - - 4 - - -
4,343
- - - - - - - -
(D) -
- - - - - - - - - -
(D) - - - - - - - - -
- - - - - - - - - -
- - - - - -
3,229 - - -
9
- - - - - - - - - -
1 - - - - - - - - -
2 - - - - - - - - -
- 1 - - - - - - 2 -
- - - - - 2 1 - - -
(D)
- - - - - - - - - -
(D) - - - - - - - - -
(D) - - - - - - - - -
- (D)
- - - - - -
(D) -
- - - - -
(D) (D)
- - -
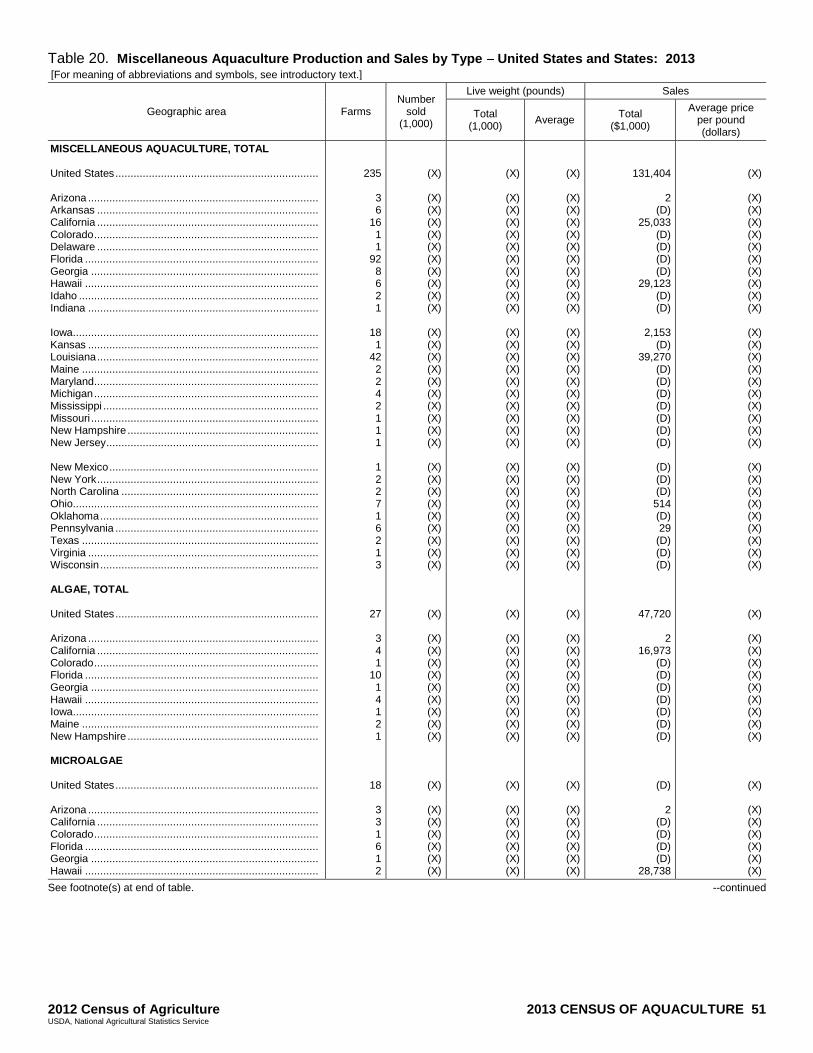
2012 Census of Agriculture 2013 CENSUS OF AQUACULTURE 51 USDA, National Agricultural Statistics Service
Table 20. Miscellaneous Aquaculture Production and Sales by Type United States and States: 2013 [For meaning of abbreviations and symbols, see introductory text.]
Geographic area Farms Number
sold (1,000)
Live weight (pounds) Sales
Total (1,000)
Average Total
($1,000)
Average price per pound (dollars)
MISCELLANEOUS AQUACULTURE, TOTAL United States ................................................................... Arizona ............................................................................ Arkansas ......................................................................... California ......................................................................... Colorado .......................................................................... Delaware ......................................................................... Florida ............................................................................. Georgia ........................................................................... Hawaii ............................................................................. Idaho ............................................................................... Indiana ............................................................................ Iowa................................................................................. Kansas ............................................................................ Louisiana ......................................................................... Maine .............................................................................. Maryland.......................................................................... Michigan .......................................................................... Mississippi ....................................................................... Missouri ........................................................................... New Hampshire ............................................................... New Jersey ...................................................................... New Mexico ..................................................................... New York ......................................................................... North Carolina ................................................................. Ohio................................................................................. Oklahoma ........................................................................ Pennsylvania ................................................................... Texas .............................................................................. Virginia ............................................................................ Wisconsin ........................................................................ ALGAE, TOTAL United States ................................................................... Arizona ............................................................................ California ......................................................................... Colorado .......................................................................... Florida ............................................................................. Georgia ........................................................................... Hawaii ............................................................................. Iowa................................................................................. Maine .............................................................................. New Hampshire ............................................................... MICROALGAE United States ................................................................... Arizona ............................................................................ California ......................................................................... Colorado .......................................................................... Florida ............................................................................. Georgia ........................................................................... Hawaii .............................................................................
235
3 6
16 1 1
92 8 6 2 1
18 1
42 2 2 4 2 1 1 1
1 2 2 7 1 6 2 1 3
27
3 4 1
10 1 4 1 2 1
18
3 3 1 6 1 2
(X)
(X) (X) (X) (X) (X) (X) (X) (X) (X) (X)
(X) (X) (X) (X) (X) (X) (X) (X) (X) (X)
(X) (X) (X) (X) (X) (X) (X) (X) (X)
(X)
(X) (X) (X) (X) (X) (X) (X) (X) (X)
(X)
(X) (X) (X) (X) (X) (X)
(X)
(X) (X) (X) (X) (X) (X) (X) (X) (X) (X)
(X) (X) (X) (X) (X) (X) (X) (X) (X) (X)
(X) (X) (X) (X) (X) (X) (X) (X) (X)
(X)
(X) (X) (X) (X) (X) (X) (X) (X) (X)
(X)
(X) (X) (X) (X) (X) (X)
(X)
(X) (X) (X) (X) (X) (X) (X) (X) (X) (X)
(X) (X) (X) (X) (X) (X) (X) (X) (X) (X)
(X) (X) (X) (X) (X) (X) (X) (X) (X)
(X)
(X) (X) (X) (X) (X) (X) (X) (X) (X)
(X)
(X) (X) (X) (X) (X) (X)
131,404
2 (D)
25,033 (D) (D) (D) (D)
29,123 (D) (D)
2,153
(D) 39,270
(D) (D) (D) (D) (D) (D) (D)
(D) (D) (D) 514 (D) 29
(D) (D) (D)
47,720
2 16,973
(D) (D) (D) (D) (D) (D) (D)
(D)
2 (D) (D) (D) (D)
28,738
(X)
(X) (X) (X) (X) (X) (X) (X) (X) (X) (X)
(X) (X) (X) (X) (X) (X) (X) (X) (X) (X)
(X) (X) (X) (X) (X) (X) (X) (X) (X)
(X)
(X) (X) (X) (X) (X) (X) (X) (X) (X)
(X)
(X) (X) (X) (X) (X) (X)
See footnote(s) at end of table. --continued
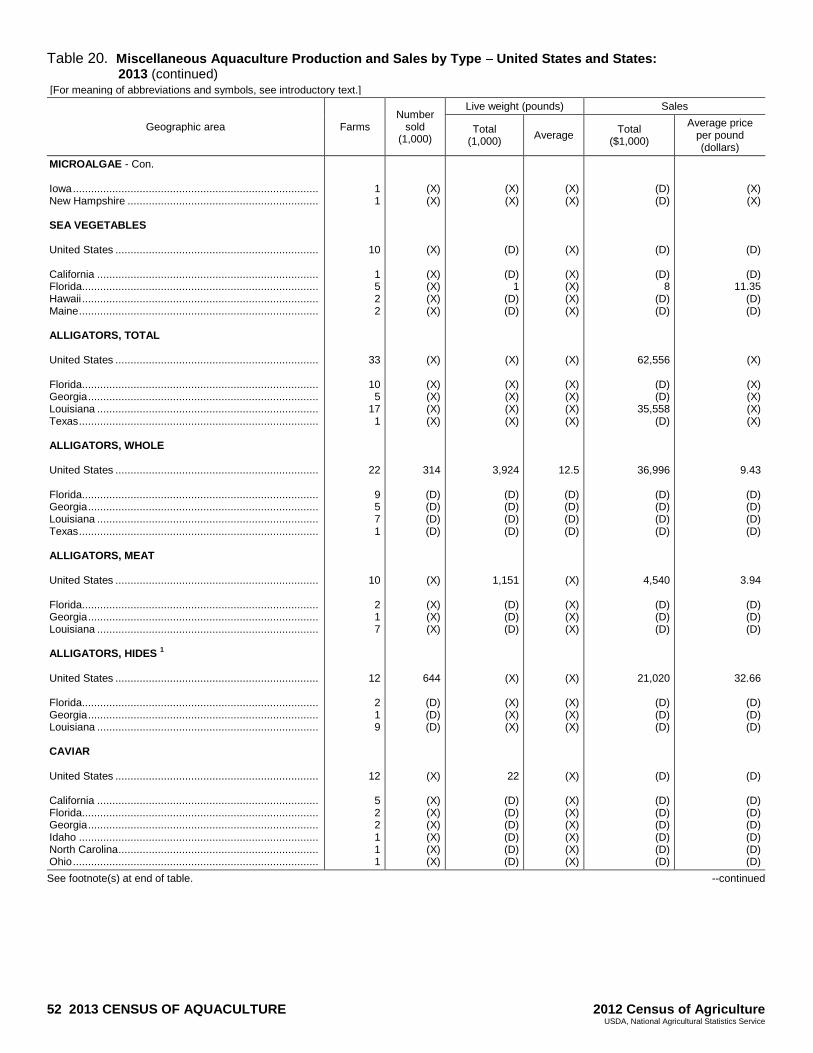
52 2013 CENSUS OF AQUACULTURE 2012 Census of Agriculture USDA, National Agricultural Statistics Service
Table 20. Miscellaneous Aquaculture Production and Sales by Type United States and States: 2013 (continued)
[For meaning of abbreviations and symbols, see introductory text.]
Geographic area Farms Number
sold (1,000)
Live weight (pounds) Sales
Total (1,000)
Average Total
($1,000)
Average price per pound (dollars)
MICROALGAE - Con. Iowa ................................................................................. New Hampshire ............................................................... SEA VEGETABLES United States ................................................................... California ......................................................................... Florida.............................................................................. Hawaii .............................................................................. Maine ............................................................................... ALLIGATORS, TOTAL United States ................................................................... Florida.............................................................................. Georgia ............................................................................ Louisiana ......................................................................... Texas ............................................................................... ALLIGATORS, WHOLE United States ................................................................... Florida.............................................................................. Georgia ............................................................................ Louisiana ......................................................................... Texas ............................................................................... ALLIGATORS, MEAT United States ................................................................... Florida.............................................................................. Georgia ............................................................................ Louisiana ......................................................................... ALLIGATORS, HIDES
1
United States ................................................................... Florida.............................................................................. Georgia ............................................................................ Louisiana ......................................................................... CAVIAR United States ................................................................... California ......................................................................... Florida.............................................................................. Georgia ............................................................................ Idaho ............................................................................... North Carolina .................................................................. Ohio .................................................................................
1 1
10
1 5 2 2
33
10 5
17 1
22
9 5 7 1
10
2 1 7
12
2 1 9
12
5 2 2 1 1 1
(X) (X)
(X)
(X) (X) (X) (X)
(X)
(X) (X) (X) (X)
314
(D) (D) (D) (D)
(X)
(X) (X) (X)
644
(D) (D) (D)
(X)
(X) (X) (X) (X) (X) (X)
(X) (X)
(D)
(D) 1
(D) (D)
(X)
(X) (X) (X) (X)
3,924
(D) (D) (D) (D)
1,151
(D) (D) (D)
(X)
(X) (X) (X)
22
(D) (D) (D) (D) (D) (D)
(X) (X)
(X)
(X) (X) (X) (X)
(X)
(X) (X) (X) (X)
12.5
(D) (D) (D) (D)
(X)
(X) (X) (X)
(X)
(X) (X) (X)
(X)
(X) (X) (X) (X) (X) (X)
(D) (D)
(D)
(D) 8
(D) (D)
62,556
(D) (D)
35,558 (D)
36,996
(D) (D) (D) (D)
4,540
(D) (D) (D)
21,020
(D) (D) (D)
(D)
(D) (D) (D) (D) (D) (D)
(X) (X)
(D)
(D) 11.35
(D) (D)
(X)
(X) (X) (X) (X)
9.43
(D) (D) (D) (D)
3.94
(D) (D) (D)
32.66
(D) (D) (D)
(D)
(D) (D) (D) (D) (D) (D)
See footnote(s) at end of table. --continued
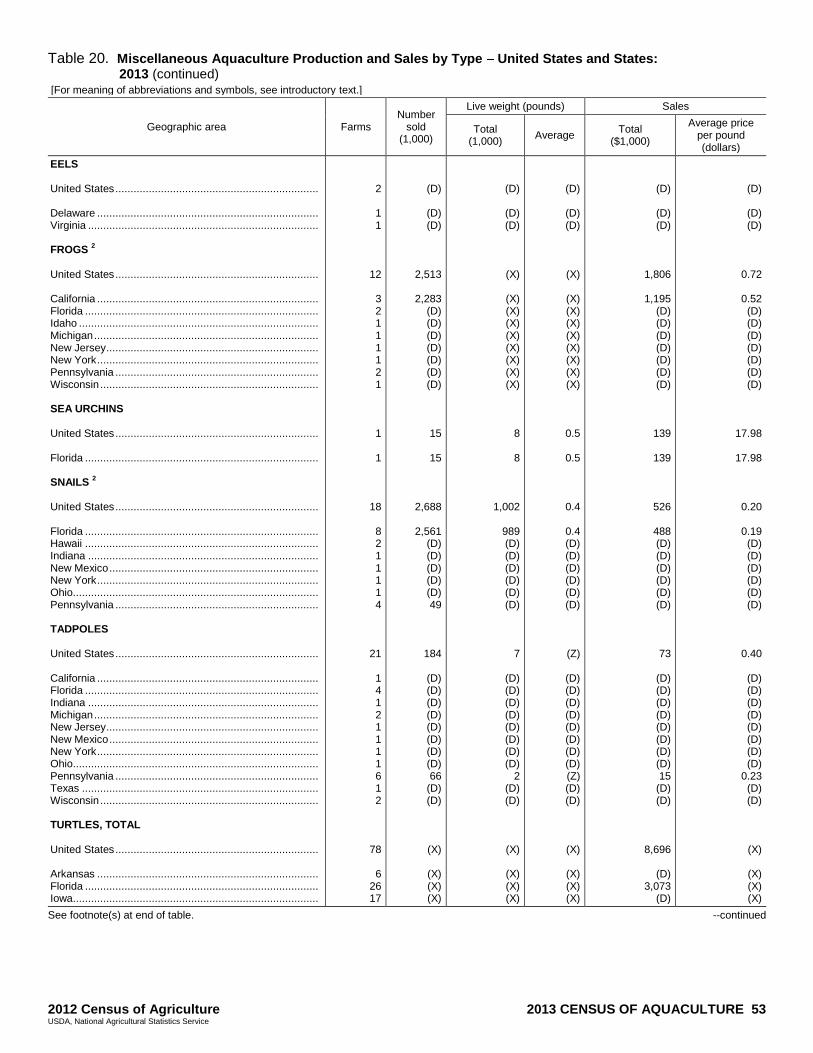
2012 Census of Agriculture 2013 CENSUS OF AQUACULTURE 53 USDA, National Agricultural Statistics Service
Table 20. Miscellaneous Aquaculture Production and Sales by Type United States and States: 2013 (continued)
[For meaning of abbreviations and symbols, see introductory text.]
Geographic area Farms Number
sold (1,000)
Live weight (pounds) Sales
Total (1,000)
Average Total
($1,000)
Average price per pound (dollars)
EELS United States ................................................................... Delaware ......................................................................... Virginia ............................................................................ FROGS
2 United States ................................................................... California ......................................................................... Florida ............................................................................. Idaho ............................................................................... Michigan .......................................................................... New Jersey ...................................................................... New York ......................................................................... Pennsylvania ................................................................... Wisconsin ........................................................................ SEA URCHINS United States ................................................................... Florida ............................................................................. SNAILS
2
United States ................................................................... Florida ............................................................................. Hawaii ............................................................................. Indiana ............................................................................ New Mexico ..................................................................... New York ......................................................................... Ohio................................................................................. Pennsylvania ................................................................... TADPOLES United States ................................................................... California ......................................................................... Florida ............................................................................. Indiana ............................................................................ Michigan .......................................................................... New Jersey ...................................................................... New Mexico ..................................................................... New York ......................................................................... Ohio................................................................................. Pennsylvania ................................................................... Texas .............................................................................. Wisconsin ........................................................................ TURTLES, TOTAL United States ................................................................... Arkansas ......................................................................... Florida ............................................................................. Iowa.................................................................................
2
1 1
12
3 2 1 1 1 1 2 1
1
1
18
8 2 1 1 1 1 4
21
1 4 1 2 1 1 1 1 6 1 2
78
6 26 17
(D)
(D) (D)
2,513
2,283 (D) (D) (D) (D) (D) (D) (D)
15
15
2,688
2,561 (D) (D) (D) (D) (D) 49
184
(D) (D) (D) (D) (D) (D) (D) (D) 66
(D) (D)
(X)
(X) (X) (X)
(D)
(D) (D)
(X)
(X) (X) (X) (X) (X) (X) (X) (X)
8
8
1,002
989 (D) (D) (D) (D) (D) (D)
7
(D) (D) (D) (D) (D) (D) (D) (D)
2 (D) (D)
(X)
(X) (X) (X)
(D)
(D) (D)
(X)
(X) (X) (X) (X) (X) (X) (X) (X)
0.5
0.5
0.4
0.4 (D) (D) (D) (D) (D) (D)
(Z)
(D) (D) (D) (D) (D) (D) (D) (D) (Z) (D) (D)
(X)
(X) (X) (X)
(D)
(D) (D)
1,806
1,195 (D) (D) (D) (D) (D) (D) (D)
139
139
526
488 (D) (D) (D) (D) (D) (D)
73
(D) (D) (D) (D) (D) (D) (D) (D) 15
(D) (D)
8,696
(D) 3,073
(D)
(D)
(D) (D)
0.72
0.52 (D) (D) (D) (D) (D) (D) (D)
17.98
17.98
0.20
0.19 (D) (D) (D) (D) (D) (D)
0.40
(D) (D) (D) (D) (D) (D) (D) (D)
0.23 (D) (D)
(X)
(X) (X) (X)
See footnote(s) at end of table. --continued
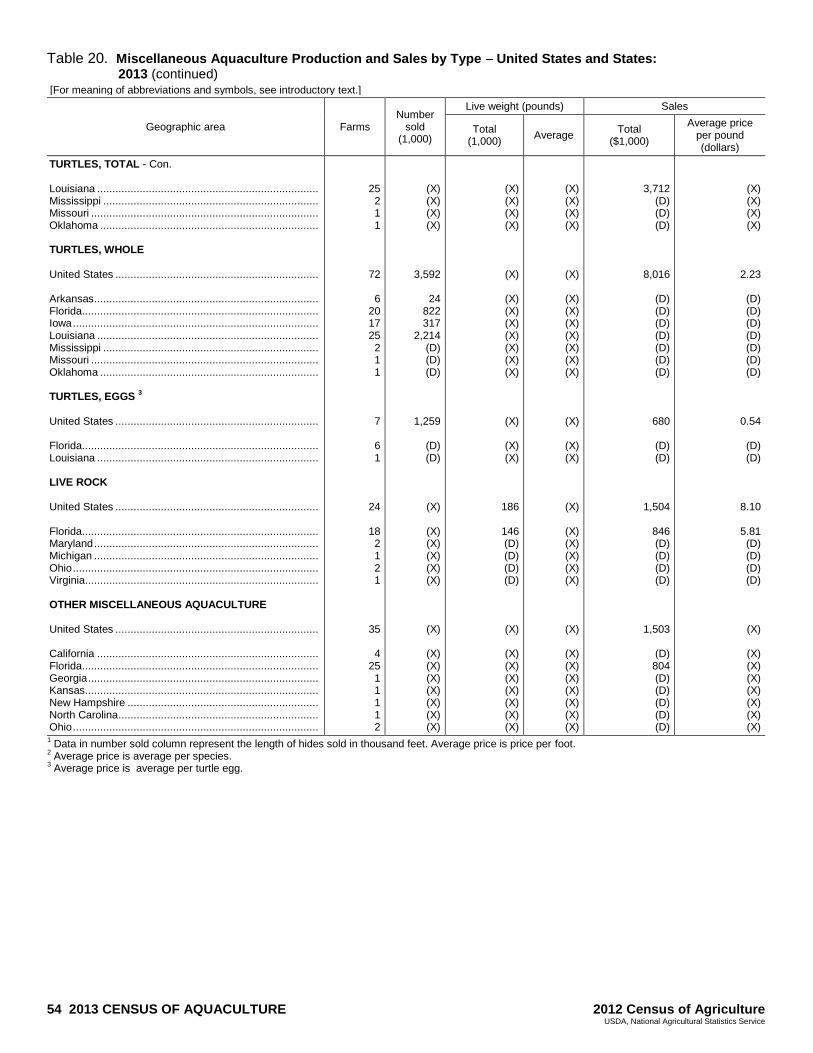
54 2013 CENSUS OF AQUACULTURE 2012 Census of Agriculture USDA, National Agricultural Statistics Service
Table 20. Miscellaneous Aquaculture Production and Sales by Type United States and States: 2013 (continued)
[For meaning of abbreviations and symbols, see introductory text.]
Geographic area Farms Number
sold (1,000)
Live weight (pounds) Sales
Total (1,000)
Average Total
($1,000)
Average price per pound (dollars)
TURTLES, TOTAL - Con. Louisiana ......................................................................... Mississippi ....................................................................... Missouri ........................................................................... Oklahoma ........................................................................ TURTLES, WHOLE United States ................................................................... Arkansas .......................................................................... Florida.............................................................................. Iowa ................................................................................. Louisiana ......................................................................... Mississippi ....................................................................... Missouri ........................................................................... Oklahoma ........................................................................ TURTLES, EGGS
3 United States ................................................................... Florida.............................................................................. Louisiana ......................................................................... LIVE ROCK United States ................................................................... Florida.............................................................................. Maryland .......................................................................... Michigan .......................................................................... Ohio ................................................................................. Virginia ............................................................................. OTHER MISCELLANEOUS AQUACULTURE United States ................................................................... California ......................................................................... Florida.............................................................................. Georgia ............................................................................ Kansas ............................................................................. New Hampshire ............................................................... North Carolina .................................................................. Ohio .................................................................................
25 2 1 1
72
6 20 17 25 2 1 1
7
6 1
24
18 2 1 2 1
35
4 25 1 1 1 1 2
(X) (X) (X) (X)
3,592
24 822 317
2,214 (D) (D) (D)
1,259
(D) (D)
(X)
(X) (X) (X) (X) (X)
(X)
(X) (X) (X) (X) (X) (X) (X)
(X) (X) (X) (X)
(X)
(X) (X) (X) (X) (X) (X) (X)
(X)
(X) (X)
186
146 (D) (D) (D) (D)
(X)
(X) (X) (X) (X) (X) (X) (X)
(X) (X) (X) (X)
(X)
(X) (X) (X) (X) (X) (X) (X)
(X)
(X) (X)
(X)
(X) (X) (X) (X) (X)
(X)
(X) (X) (X) (X) (X) (X) (X)
3,712 (D) (D) (D)
8,016
(D) (D) (D) (D) (D) (D) (D)
680
(D) (D)
1,504
846 (D) (D) (D) (D)
1,503
(D) 804 (D) (D) (D) (D) (D)
(X) (X) (X) (X)
2.23
(D) (D) (D) (D) (D) (D) (D)
0.54
(D) (D)
8.10
5.81 (D) (D) (D) (D)
(X)
(X) (X) (X) (X) (X) (X) (X)
1 Data in number sold column represent the length of hides sold in thousand feet. Average price is price per foot. 2 Average price is average per species. 3 Average price is average per turtle egg.
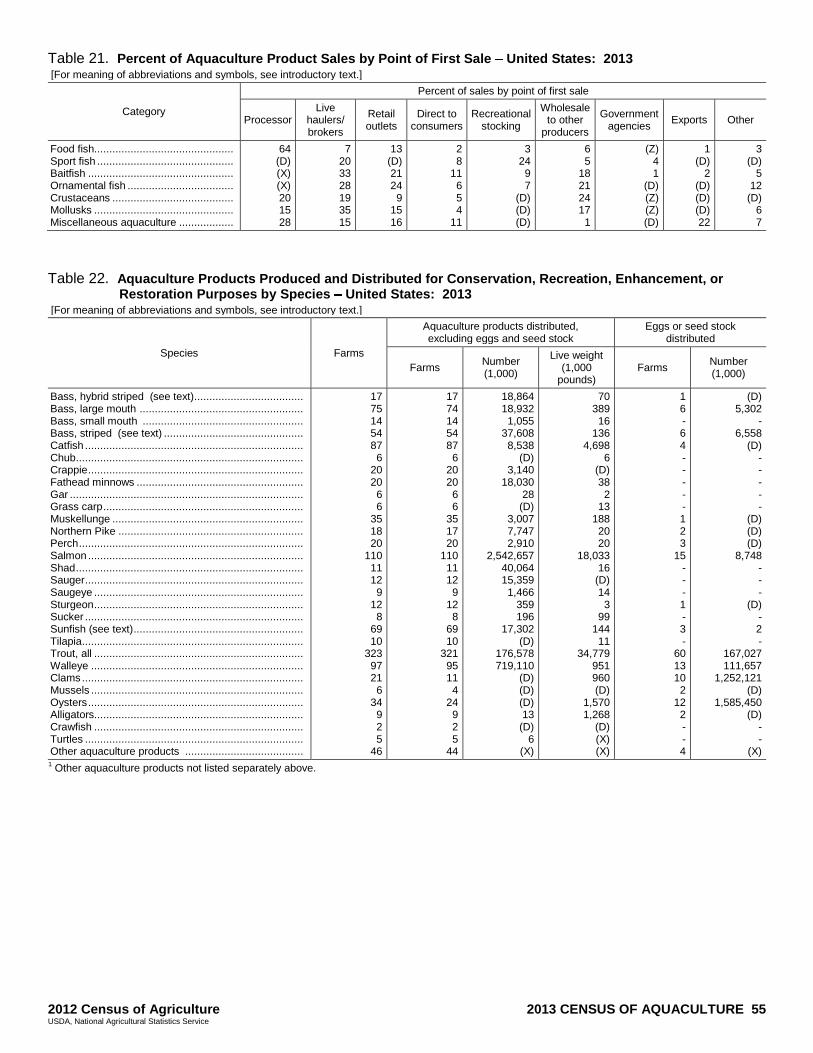
2012 Census of Agriculture 2013 CENSUS OF AQUACULTURE 55 USDA, National Agricultural Statistics Service
Table 21. Percent of Aquaculture Product Sales by Point of First Sale United States: 2013 [For meaning of abbreviations and symbols, see introductory text.]
Category
Percent of sales by point of first sale
Processor Live
haulers/ brokers
Retail outlets
Direct to consumers
Recreational stocking
Wholesale to other
producers
Government agencies
Exports Other
Food fish.............................................. Sport fish ............................................. Baitfish ................................................ Ornamental fish ................................... Crustaceans ........................................ Mollusks .............................................. Miscellaneous aquaculture ..................
64 (D) (X) (X) 20 15 28
7 20 33 28 19 35 15
13 (D) 21 24 9
15 16
2 8
11 6 5 4
11
3 24 9 7
(D) (D) (D)
6 5
18 21 24 17 1
(Z) 4 1
(D) (Z) (Z) (D)
1 (D)
2 (D) (D) (D) 22
3 (D)
5 12
(D) 6 7
Table 22. Aquaculture Products Produced and Distributed for Conservation, Recreation, Enhancement, or
Restoration Purposes by Species United States: 2013 [For meaning of abbreviations and symbols, see introductory text.]
Species Farms
Aquaculture products distributed, excluding eggs and seed stock
Eggs or seed stock distributed
Farms Number (1,000)
Live weight (1,000
pounds) Farms
Number (1,000)
Bass, hybrid striped (see text) .................................... Bass, large mouth ...................................................... Bass, small mouth ..................................................... Bass, striped (see text) .............................................. Catfish ........................................................................ Chub ........................................................................... Crappie ....................................................................... Fathead minnows ....................................................... Gar ............................................................................. Grass carp .................................................................. Muskellunge ............................................................... Northern Pike ............................................................. Perch .......................................................................... Salmon ....................................................................... Shad ........................................................................... Sauger ........................................................................ Saugeye ..................................................................... Sturgeon ..................................................................... Sucker ........................................................................ Sunfish (see text) ........................................................ Tilapia ......................................................................... Trout, all ..................................................................... Walleye ...................................................................... Clams ......................................................................... Mussels ...................................................................... Oysters ....................................................................... Alligators..................................................................... Crawfish ..................................................................... Turtles ........................................................................ Other aquaculture products .......................................
17 75 14 54 87 6
20 20 6 6
35 18 20
110 11 12 9
12 8
69 10
323 97 21 6
34 9 2 5
46
17 74 14 54 87 6
20 20 6 6
35 17 20
110 11 12 9
12 8
69 10
321 95 11 4
24 9 2 5
44
18,864 18,932 1,055
37,608 8,538
(D) 3,140
18,030 28
(D) 3,007 7,747 2,910
2,542,657 40,064 15,359 1,466
359 196
17,302 (D)
176,578 719,110
(D) (D) (D) 13
(D) 6
(X)
70 389 16
136 4,698
6 (D) 38
2 13
188 20 20
18,033 16
(D) 14
3 99
144 11
34,779 951 960 (D)
1,570 1,268
(D) (X) (X)
1 6 - 6 4 - - - - - 1 2 3
15 - - - 1 - 3 -
60 13 10 2
12 2 - - 4
(D) 5,302
- 6,558
(D) - - - - -
(D) (D) (D)
8,748 - - -
(D) - 2 -
167,027 111,657
1,252,121 (D)
1,585,450 (D)
- -
(X) 1 Other aquaculture products not listed separately above.
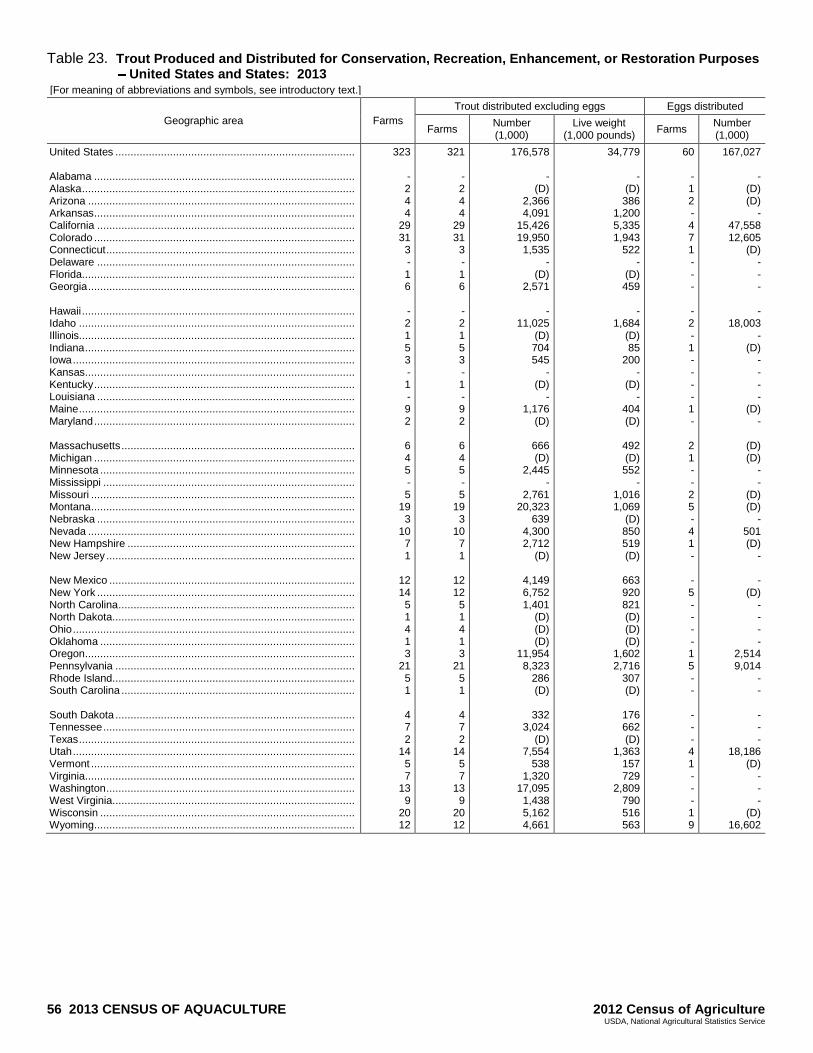
56 2013 CENSUS OF AQUACULTURE 2012 Census of Agriculture USDA, National Agricultural Statistics Service
Table 23. Trout Produced and Distributed for Conservation, Recreation, Enhancement, or Restoration Purposes United States and States: 2013
[For meaning of abbreviations and symbols, see introductory text.]
Geographic area Farms
Trout distributed excluding eggs Eggs distributed
Farms Number (1,000)
Live weight (1,000 pounds)
Farms Number (1,000)
United States ............................................................................... Alabama ...................................................................................... Alaska .......................................................................................... Arizona ........................................................................................ Arkansas ...................................................................................... California ..................................................................................... Colorado ...................................................................................... Connecticut .................................................................................. Delaware ..................................................................................... Florida.......................................................................................... Georgia ........................................................................................ Hawaii .......................................................................................... Idaho ........................................................................................... Illinois........................................................................................... Indiana ......................................................................................... Iowa ............................................................................................. Kansas ......................................................................................... Kentucky ...................................................................................... Louisiana ..................................................................................... Maine ........................................................................................... Maryland ...................................................................................... Massachusetts ............................................................................. Michigan ...................................................................................... Minnesota .................................................................................... Mississippi ................................................................................... Missouri ....................................................................................... Montana ....................................................................................... Nebraska ..................................................................................... Nevada ........................................................................................ New Hampshire ........................................................................... New Jersey .................................................................................. New Mexico ................................................................................. New York ..................................................................................... North Carolina .............................................................................. North Dakota ................................................................................ Ohio ............................................................................................. Oklahoma .................................................................................... Oregon ......................................................................................... Pennsylvania ............................................................................... Rhode Island ................................................................................ South Carolina ............................................................................. South Dakota ............................................................................... Tennessee ................................................................................... Texas ........................................................................................... Utah ............................................................................................. Vermont ....................................................................................... Virginia ......................................................................................... Washington .................................................................................. West Virginia ................................................................................ Wisconsin .................................................................................... Wyoming ......................................................................................
323
- 2 4 4
29 31 3 - 1 6
- 2 1 5 3 - 1 - 9 2
6 4 5 - 5
19 3
10 7 1
12 14 5 1 4 1 3
21 5 1
4 7 2
14 5 7
13 9
20 12
321
- 2 4 4
29 31 3 - 1 6
- 2 1 5 3 - 1 - 9 2
6 4 5 - 5
19 3
10 7 1
12 12 5 1 4 1 3
21 5 1
4 7 2
14 5 7
13 9
20 12
176,578
- (D)
2,366 4,091
15,426 19,950 1,535
- (D)
2,571
- 11,025
(D) 704 545
- (D)
- 1,176
(D)
666 (D)
2,445 -
2,761 20,323
639 4,300 2,712
(D)
4,149 6,752 1,401
(D) (D) (D)
11,954 8,323
286 (D)
332
3,024 (D)
7,554 538
1,320 17,095 1,438 5,162 4,661
34,779
- (D) 386
1,200 5,335 1,943
522 -
(D) 459
-
1,684 (D) 85
200 -
(D) -
404 (D)
492 (D) 552
- 1,016 1,069
(D) 850 519 (D)
663 920 821 (D) (D) (D)
1,602 2,716
307 (D)
176 662 (D)
1,363 157 729
2,809 790 516 563
60
- 1 2 - 4 7 1 - - -
- 2 - 1 - - - - 1 -
2 1 - - 2 5 - 4 1 -
- 5 - - - - 1 5 - -
- - - 4 1 - - - 1 9
167,027
- (D) (D)
- 47,558 12,605
(D) - - -
- 18,003
- (D)
- - - -
(D) -
(D) (D)
- -
(D) (D)
- 501 (D)
-
- (D)
- - - -
2,514 9,014
- -
- - -
18,186 (D)
- - -
(D) 16,602
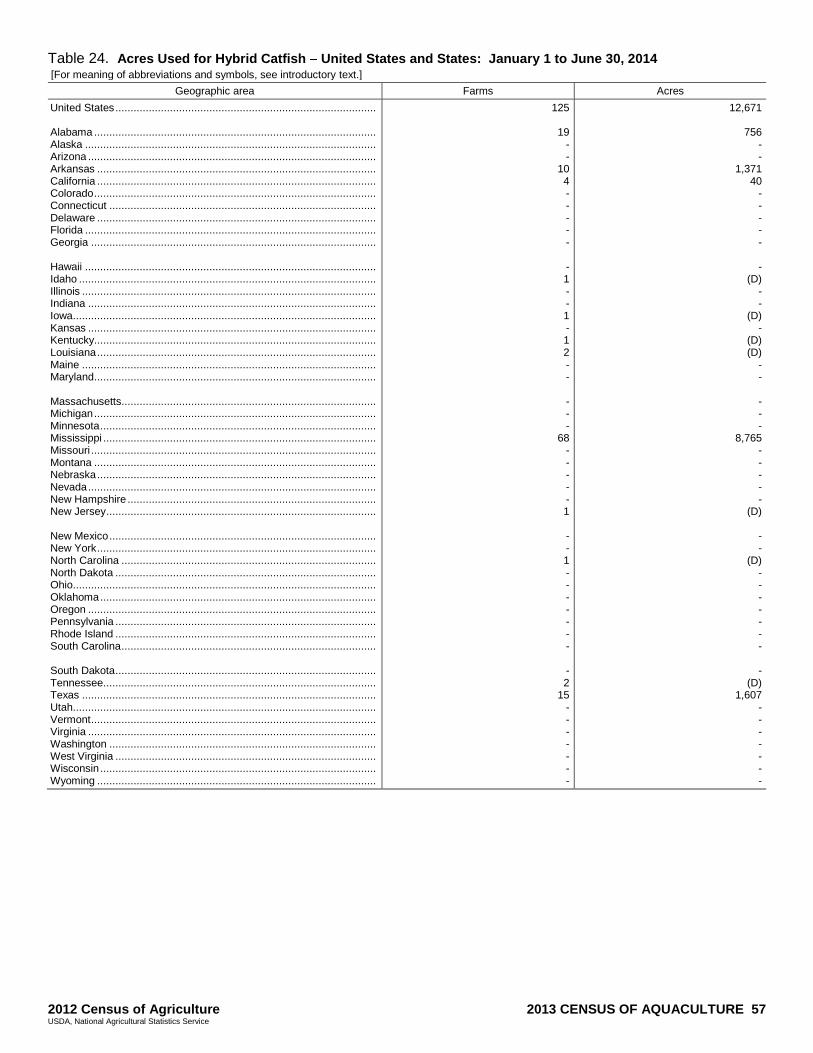
2012 Census of Agriculture 2013 CENSUS OF AQUACULTURE 57 USDA, National Agricultural Statistics Service
Table 24. Acres Used for Hybrid Catfish United States and States: January 1 to June 30, 2014 [For meaning of abbreviations and symbols, see introductory text.]
Geographic area Farms Acres
United States ...................................................................................... Alabama ............................................................................................. Alaska ................................................................................................ Arizona ............................................................................................... Arkansas ............................................................................................ California ............................................................................................ Colorado ............................................................................................. Connecticut ........................................................................................ Delaware ............................................................................................ Florida ................................................................................................ Georgia .............................................................................................. Hawaii ................................................................................................ Idaho .................................................................................................. Illinois ................................................................................................. Indiana ............................................................................................... Iowa.................................................................................................... Kansas ............................................................................................... Kentucky............................................................................................. Louisiana ............................................................................................ Maine ................................................................................................. Maryland............................................................................................. Massachusetts.................................................................................... Michigan ............................................................................................. Minnesota ........................................................................................... Mississippi .......................................................................................... Missouri .............................................................................................. Montana ............................................................................................. Nebraska ............................................................................................ Nevada ............................................................................................... New Hampshire .................................................................................. New Jersey ......................................................................................... New Mexico ........................................................................................ New York ............................................................................................ North Carolina .................................................................................... North Dakota ...................................................................................... Ohio.................................................................................................... Oklahoma ........................................................................................... Oregon ............................................................................................... Pennsylvania ...................................................................................... Rhode Island ...................................................................................... South Carolina .................................................................................... South Dakota ...................................................................................... Tennessee .......................................................................................... Texas ................................................................................................. Utah.................................................................................................... Vermont .............................................................................................. Virginia ............................................................................................... Washington ........................................................................................ West Virginia ...................................................................................... Wisconsin ........................................................................................... Wyoming ............................................................................................
125
19 - -
10 4 - - - - -
- 1 - - 1 - 1 2 - -
- - -
68 - - - - - 1
- - 1 - - - - - - -
- 2
15 - - - - - - -
12,671
756 - -
1,371 40
- - - - -
- (D)
- -
(D) -
(D) (D)
- -
- - -
8,765 - - - - -
(D)
- -
(D) - - - - - - -
- (D)
1,607 - - - - - - -

2012 Census of Agriculture APPENDIX A A - 1 USDA, National Agricultural Statistics Service
Appendix A Statistical Methodology
THE CENSUS POPULATION The target population for the census of aquaculture
was composed of all farms that reported any amount
of aquaculture activity during the 2012 Census of
Agriculture. An effort was made to identify
additional aquaculture operations of significance
from new sources.
DATA COLLECTION Method of Enumeration The 2013 Census of Aquaculture was conducted
primarily by mail. It was supplemented with
Electronic Data reporting (EDR) via the Internet,
telephone calls, and personal enumeration.
Enumeration methods were similar to those used in
the 2005 Census of Aquaculture.
Report Forms One version of the report form was used in all States.
A 16-page 2013 Census of Aquaculture report form
was designed to collect data from operations
producing or distributing aquaculture. It was
designed to collect data that also supported the
agricultural surveys conducted for catfish and trout
production which are part of the National
Agricultural Statistics Service’s (NASS) Estimates
Program. See Appendix B for changes and a copy of
this report form.
Report Form Mailings and Respondent Follow-up The initial mailout took place in December 2013.
Mail packets were mailed to approximately 4,100
farms thought to have produced aquaculture in 2012.
The initial mail packets included a labeled report
form, an instruction sheet, a letter requesting a
prompt response and instructions for completing the
form via Internet (an alternate reporting option), and
a postage-paid return envelope. Mailout packet
preparation, initial mailout, and one follow-up
mailing to nonrespondents were handled by the
Census Bureau’s National Processing Center (NPC)
in Jeffersonville, IN. Telephone follow-ups,
conducted from a NASS Data Collection Center,
began in February 2014 to nonrespondents who were
mailed a report form from NPC.
Data were collected for a select group of operations
by the NASS field offices. To minimize the number
of agency contacts, operations included in this group
were flagged for contact by NASS for other
agricultural surveys. Report forms were labeled at
NPC and sent to field offices in November 2013.
Field office staff collected data by personal
enumeration or by phone from December 2013
through June 2014. For a description of the
adjustment for nonresponse, see Estimation.
REPORT FORM PROCESSING Data Capture All report forms returned to NPC were immediately
checked in using bar codes printed on the mailing
label. This check-in process removed the responding
farms from follow-up mailings. All forms were
reviewed prior to data keying to identify
inconsistencies and ensure that the data could be
keyed. Major inconsistencies, respondent remarks,
blank report forms, and large aquaculture cases were
reviewed by analysts and adjusted prior to data
keying, as needed. All forms with any data were
scanned and an image was created for each page of a
report form.
Data Editing and Analysis Data from each report form were processed through
a computer edit which flagged inconsistent entries.
A - 2 APPENDIX A 2012 Census of Agriculture USDA, National Agricultural Statistics Service
Each flagged entry was reviewed by staff. Reported
data that were obviously incorrect due to
misinterpretation of a question were either corrected
or deleted prior to the computer edit. In some cases,
respondents may have failed to provide all of the
information requested, only indicating the presence
of an item but not the amount. Some data were
estimated by the analyst based on other responses in
the geographic area and by similarly sized farms.
Prior to publication, tabulated totals were reviewed
to identify and resolve remaining inconsistencies and
potential coverage problems. Comparisons were
made to 2012 Census of Agriculture data, 2005
Census of Aquaculture data, and other available
check data. The data were processed through a
disclosure program to prevent data from being
published that could be sourced back to an individual
operation.
ESTIMATION Estimates were produced for the Nation and for each
of the 50 States. All respondents to the 2012 Census
of Agriculture that reported involvement with an
aquaculture enterprise, regardless of its economic
size, were included on the 2013 Census of
Aquaculture mailing list.
The estimation methodology consisted of two
weighting components. The first component was the
fully adjusted weight pulled in from the 2012 Census
of Agriculture. In processing the 2012 Census of
Agriculture data, statistical weights were applied to
each responding record. These weights were
designed to account for 2012 Census of Agriculture
mail list non-respondents, farms that existed but
were not included on the 2012 Census of Agriculture
mail list, and various farm classification errors.
The second weighting component was from a 2013
Census of Aquaculture nonresponse adjustment
factor. In spite of a determined effort to obtain
aquaculture information from every operation on the
2013 Census of Aquaculture mailing list, not all
operations responded. A nonresponse adjustment
factor was used to account for active aquaculture
operations on the list that did not respond to the 2013
Census of Aquaculture.
Together these two weighting components
compensated for aquaculture farm data that were not
obtained from either the 2012 Census of Agriculture
or the 2013 Census of Aquaculture. Each farm on the
2013 Census of Aquaculture mail list was put into a
weight adjustment group. All weight adjustment
groups were formed within a given State. These
groups were based on the economic size of the
farm’s aquaculture enterprise as indicated by the data
obtained from the 2012 Census of Agriculture. The
weights that were carried over from the 2012 Census
of Agriculture were summed across every record
within each aquaculture weight adjustment group.
The resulting weight sum was the best available
estimate of the number of aquaculture farms that
existed for a given State in 2012. The number of
aquaculture farms for the weight adjustment group
was divided equally among all aquaculture census
respondents within the group. The resulting value
became the statistically fully adjusted weight for
each respondent in the weight adjustment group.
The sum of the adjusted weights across all
respondents in the group necessarily equaled the
target value.
The fully-adjusted weights applied to respondents on
the 2013 Census of Aquaculture mail list were
integerized using a random process. This process
rounded each raw weight upwards to the smallest
integer that exceeded the fully adjusted raw weight
using a probability equal to the non-integer portion
of the raw weight, otherwise, the weight would have
been rounded downwards to the largest integer that
was less than the raw weight.
Example: The raw weight for a record is 1.75. It
will be rounded up to 2.0 with a probability of 0.75
and rounded down to 1.0 with a probability of 0.25.
The State total for a particular characteristic being
estimated was obtained by multiplying each record’s
value for the characteristic by the record’s
integerized weight. The weighted values were then
summed up over all the responding records in that
State to obtain the State-level estimate.
RESPONDENT CONFIDENTIALITY In keeping with the provisions of Title 7 of the
United States Code, no data are published that would
disclose information about the operations of an
individual farm, unless there is specific written
2012 Census of Agriculture APPENDIX A A - 3 USDA, National Agricultural Statistics Service
permission. All tabulated data are subjected to an
extensive disclosure review prior to publication. Any
tabulated item that identifies data reported by a
respondent or allows a respondent's data to be
accurately estimated or derived, was suppressed and
coded with a 'D'. However, the number of farms
reporting an item is not considered confidential
information and is provided even though other
information is withheld.
DATA COMPARABILITY Data definitions are comparable between the 2013
and 2005 aquaculture censuses, with the exception
that the 2005 Census of Aquaculture did not include
the algae categories of microalgae and sea
vegetables. For 2013 algae was included in the data
for total sales and miscellaneous sales. Specific data
changes from 2005 are listed in Appendix B. Dollar
figures are expressed in current dollars and have not
been adjusted for inflation or deflation.
The census of aquaculture data are not directly
comparable to the census of agriculture, due to
different priorities and data definitions. A census of
agriculture priority is the value of production of all
agriculture (including aquaculture) at the county
level. A census of aquaculture priority is a more
specific look at U.S. and State-level aquaculture
sales and aquaculture distributed for conservation.
In the 2012 Census of Agriculture all agriculture
production moved off the farm had a value of sales
reported or assigned. Aquaculture which was moved
for distribution, conservation, recreation, etc. was
assigned a value. In the 2013 Census of Aquaculture,
farms with aquaculture which was produced and sold
are included in tables 1 through 21, and 24.
Aquaculture which was not sold, but distributed for
conservation is included in tables 22 and 23 only.
The number of farms for each category is also
affected between the two censuses. For county level
data the census of agriculture attempts to get a
response for each location. The census of
aquaculture allowed one respondent to report for
multiple locations, which reduces farm counts.
Another difference with the census of agriculture is
the minimum level of production. The census of
agriculture has a minimum of $1,000 of production
or potential production of all agriculture items. For
example, a farm with $200 of crayfish and $900 of
rice is included. The census of aquaculture minimum
is $1,000 worth of aquaculture production either sold
or distributed for conservation, which could reduce
the number of farms.
The last difference is that the census of agriculture
food fish category excludes catfish and trout. The
census of aquaculture includes catfish and trout in
the food fish totals.
MEASURES OF CENSUS QUALITY There are two main types of estimation error that
affect all estimates obtained from almost any survey.
These errors make it unlikely that estimates obtained
from the 2013 Census of Aquaculture will exactly
match the true value in the population for a given
farm characteristic.
The first type of error, referred to as non-observation
error, occurs in any estimate generated from a survey
in which nonresponse occurs or data are not
potentially obtainable from every unit in the target
population. Statistical weighting as described in the
Estimation section is used to reduce the effects of
this type of error.
The second type of error is called non-sampling
error. There are many sources of nonsampling error.
Respondent reporting errors, data collection errors,
data keying errors, data editing errors are all
examples of errors of this type. Quality controlled
data processing is used to keep the effect of non-
sampling errors to a minimum.
Census Response Rate The response rate is one indicator of the quality of a
data collection. It is generally assumed that if a
response rate is close to a full participation level of
100 percent, the potential for nonresponse bias is
small. Because the aquaculture mail list contained
both farm and non-farm records, the response rate is
an indicator of replying to the data collection effort,
but does not reflect whether those responding
records qualified for data summarization. The
response rate for the 2013 Census of Aquaculture is
90.2 percent.
A - 4 APPENDIX A 2012 Census of Agriculture USDA, National Agricultural Statistics Service
MEASURES OF PRECISION Census data obtained from the 2013 Census of
Aquaculture are based on the data obtained from a
particular set of respondents. If the entire census of
aquaculture process was repeated over and over, it is
not likely that the same exact mailing list would be
constructed nor the exact same set of responding
farm operators be obtained. The data obtained from
each replication would undoubtedly lead to variation
in the estimates being produced by the census. The
question of how much these estimates might be
expected to differ can be estimated by a statistic
called the standard error, and also a closely related
statistic called the relative standard error (sometimes
referred to as the coefficient of variation).
The relative standard error is used as an indicator of
the precision in the estimates and is reported for
major items in Table A. The relative standard error
expresses the standard error of an estimate as a
percent of the estimated value. The standard error of
a survey estimate is a measure of the variation
among the estimates from all possible samples. It is a
measure of the precision with which an estimate
from a particular sample approximates the average
result of all possible samples.
The relative standard errors given in Table A can be
used to construct confidence intervals for the major
items. Confidence intervals are another way to
express the precision of an estimate by calculating
the upper and lower bounds for a level of
confidence. This confidence interval is designed to
contain the true value being estimated. If all possible
samples were selected, each of the samples was
surveyed under essentially the same conditions, and
an estimate and its standard error were calculated
from each sample, then:
1. Approximately 67 percent of the intervals from
one standard error below the estimate to one
standard error above the estimate would include the
average value of all possible samples.
2. Approximately 95 percent of the intervals from
2.0 standard errors below the estimate to 2.0
standard errors above the estimate would include the
average value of all possible samples.
The computations necessary to construct the
confidence intervals associated with these statements
are illustrated in the following example: Assume that
the estimated number of goldfish produced in a State
is 100,000 and the relative standard error of the
estimate is 10.0 percent (.10). Multiplying 100,000
by 0.10 yields 10,000, the standard error. Therefore,
a 67-percent confidence interval is defined by the
range (90,000 to 110,000) or equivalently 100,000
plus or minus 10,000. If corresponding confidence
intervals were constructed for all possible samples of
the same size and design, approximately 2 out of 3
(67 percent) of these intervals would contain the true
number of goldfish produced in the State. Similarly,
an approximate 95-percent confidence interval is
(80,000 to 120,000) obtained using 100,000 plus or
minus 2.0 x 10,000.
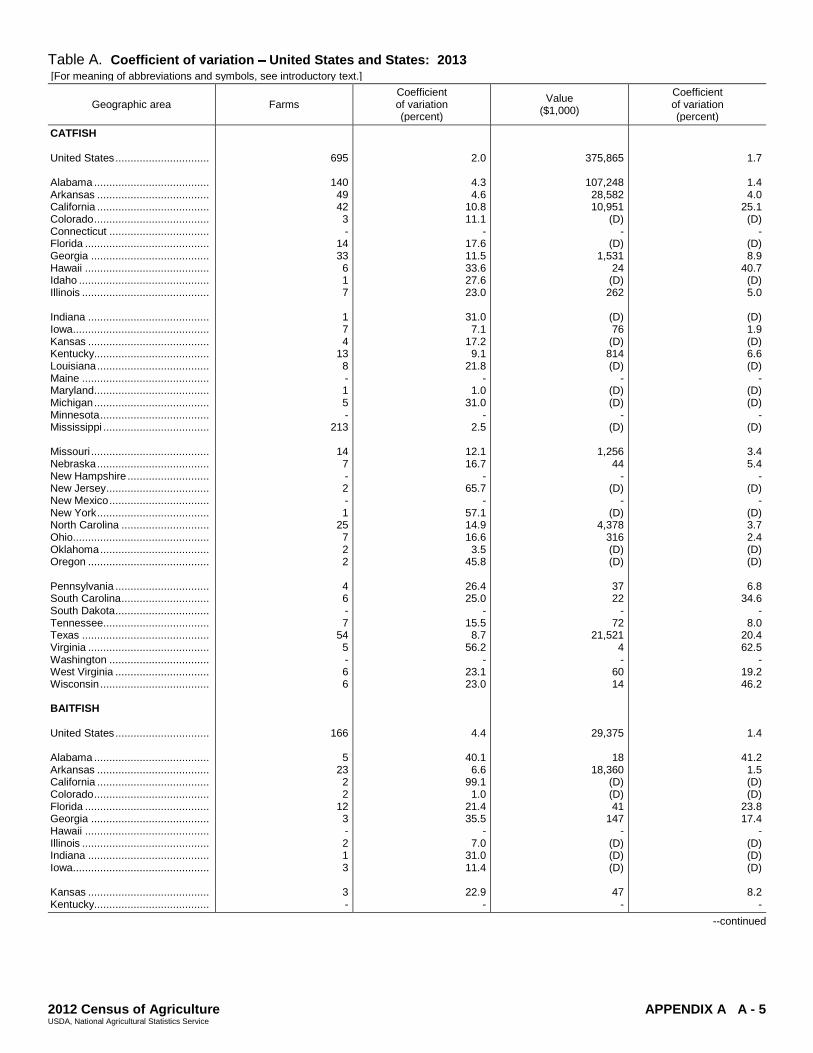
2012 Census of Agriculture APPENDIX A A - 5 USDA, National Agricultural Statistics Service
Table A. Coefficient of variation United States and States: 2013 [For meaning of abbreviations and symbols, see introductory text.]
Geographic area Farms Coefficient of variation (percent)
Value ($1,000)
Coefficient of variation (percent)
CATFISH United States ............................... Alabama ...................................... Arkansas ..................................... California ..................................... Colorado ...................................... Connecticut ................................. Florida ......................................... Georgia ....................................... Hawaii ......................................... Idaho ........................................... Illinois .......................................... Indiana ........................................ Iowa............................................. Kansas ........................................ Kentucky...................................... Louisiana ..................................... Maine .......................................... Maryland...................................... Michigan ...................................... Minnesota .................................... Mississippi ................................... Missouri ....................................... Nebraska ..................................... New Hampshire ........................... New Jersey .................................. New Mexico ................................. New York ..................................... North Carolina ............................. Ohio............................................. Oklahoma .................................... Oregon ........................................ Pennsylvania ............................... South Carolina ............................. South Dakota ............................... Tennessee ................................... Texas .......................................... Virginia ........................................ Washington ................................. West Virginia ............................... Wisconsin .................................... BAITFISH United States ............................... Alabama ...................................... Arkansas ..................................... California ..................................... Colorado ...................................... Florida ......................................... Georgia ....................................... Hawaii ......................................... Illinois .......................................... Indiana ........................................ Iowa............................................. Kansas ........................................ Kentucky......................................
695
140 49 42 3 -
14 33 6 1 7
1 7 4
13 8 - 1 5 -
213
14 7 - 2 - 1
25 7 2 2
4 6 - 7
54 5 - 6 6
166
5 23 2 2
12 3 - 2 1 3
3 -
2.0
4.3 4.6
10.8 11.1
- 17.6 11.5 33.6 27.6 23.0
31.0 7.1
17.2 9.1
21.8 -
1.0 31.0
- 2.5
12.1 16.7
- 65.7
- 57.1 14.9 16.6 3.5
45.8
26.4 25.0
- 15.5 8.7
56.2 -
23.1 23.0
4.4
40.1 6.6
99.1 1.0
21.4 35.5
- 7.0
31.0 11.4
22.9
-
375,865
107,248 28,582 10,951
(D) -
(D) 1,531
24 (D) 262
(D) 76
(D) 814 (D)
- (D) (D)
- (D)
1,256
44 -
(D) -
(D) 4,378
316 (D) (D)
37 22
- 72
21,521 4 -
60 14
29,375
18 18,360
(D) (D) 41
147 -
(D) (D) (D)
47
-
1.7
1.4 4.0
25.1 (D)
- (D) 8.9
40.7 (D) 5.0
(D) 1.9 (D) 6.6 (D)
- (D) (D)
- (D)
3.4 5.4
- (D)
- (D) 3.7 2.4 (D) (D)
6.8
34.6 -
8.0 20.4 62.5
- 19.2 46.2
1.4
41.2 1.5 (D) (D)
23.8 17.4
- (D) (D) (D)
8.2
-
--continued
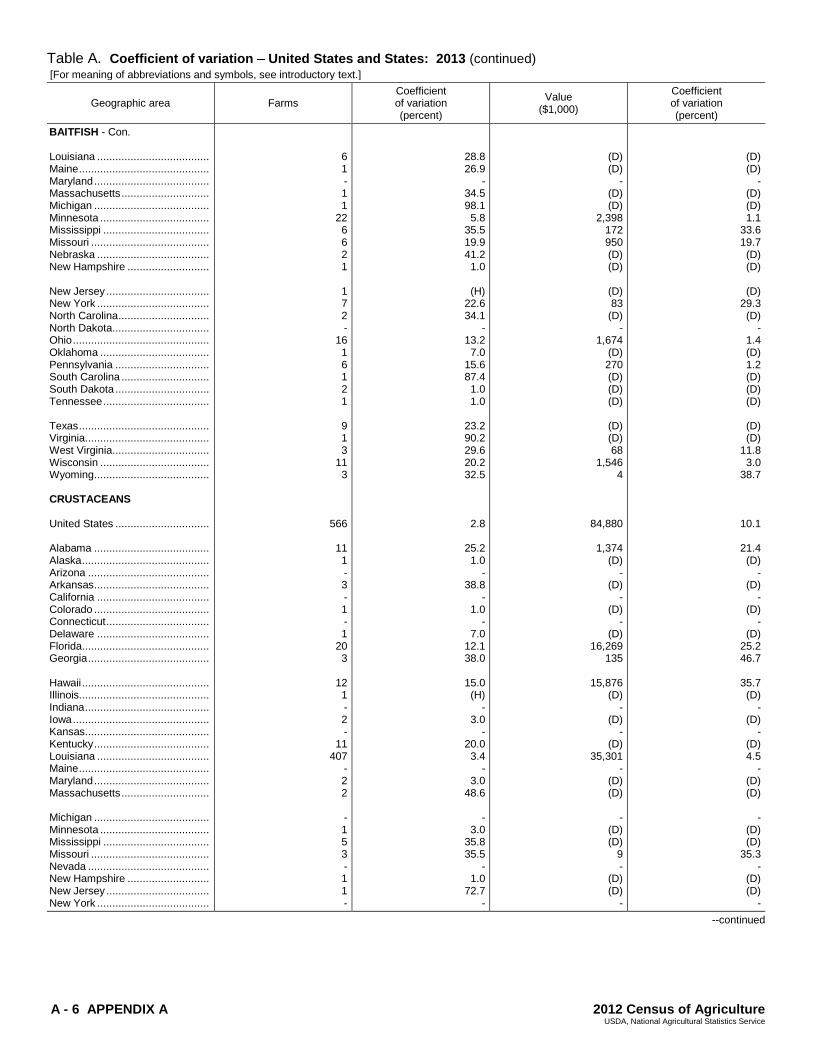
A - 6 APPENDIX A 2012 Census of Agriculture USDA, National Agricultural Statistics Service
Table A. Coefficient of variation United States and States: 2013 (continued) [For meaning of abbreviations and symbols, see introductory text.]
Geographic area Farms Coefficient of variation (percent)
Value ($1,000)
Coefficient of variation (percent)
BAITFISH - Con. Louisiana ..................................... Maine ........................................... Maryland ...................................... Massachusetts ............................. Michigan ...................................... Minnesota .................................... Mississippi ................................... Missouri ....................................... Nebraska ..................................... New Hampshire ........................... New Jersey .................................. New York ..................................... North Carolina .............................. North Dakota ................................ Ohio ............................................. Oklahoma .................................... Pennsylvania ............................... South Carolina ............................. South Dakota ............................... Tennessee ................................... Texas ........................................... Virginia ......................................... West Virginia ................................ Wisconsin .................................... Wyoming ...................................... CRUSTACEANS United States ............................... Alabama ...................................... Alaska .......................................... Arizona ........................................ Arkansas ...................................... California ..................................... Colorado ...................................... Connecticut .................................. Delaware ..................................... Florida.......................................... Georgia ........................................ Hawaii .......................................... Illinois........................................... Indiana ......................................... Iowa ............................................. Kansas ......................................... Kentucky ...................................... Louisiana ..................................... Maine ........................................... Maryland ...................................... Massachusetts ............................. Michigan ...................................... Minnesota .................................... Mississippi ................................... Missouri ....................................... Nevada ........................................ New Hampshire ........................... New Jersey .................................. New York .....................................
6 1 - 1 1
22 6 6 2 1
1 7 2 -
16 1 6 1 2 1
9 1 3
11 3
566
11 1 - 3 - 1 - 1
20 3
12 1 - 2 -
11 407
- 2 2
- 1 5 3 - 1 1 -
28.8 26.9
- 34.5 98.1 5.8
35.5 19.9 41.2 1.0
(H)
22.6 34.1
- 13.2 7.0
15.6 87.4 1.0 1.0
23.2 90.2 29.6 20.2 32.5
2.8
25.2 1.0
- 38.8
- 1.0
- 7.0
12.1 38.0
15.0 (H)
- 3.0
- 20.0 3.4
- 3.0
48.6
- 3.0
35.8 35.5
- 1.0
72.7 -
(D) (D)
- (D) (D)
2,398 172 950 (D) (D)
(D) 83
(D) -
1,674 (D) 270 (D) (D) (D)
(D) (D) 68
1,546 4
84,880
1,374 (D)
- (D)
- (D)
- (D)
16,269 135
15,876
(D) -
(D) -
(D) 35,301
- (D) (D)
-
(D) (D)
9 -
(D) (D)
-
(D) (D)
- (D) (D) 1.1
33.6 19.7 (D) (D)
(D)
29.3 (D)
- 1.4 (D) 1.2 (D) (D) (D)
(D) (D)
11.8 3.0
38.7
10.1
21.4 (D)
- (D)
- (D)
- (D)
25.2 46.7
35.7 (D)
- (D)
- (D) 4.5
- (D) (D)
-
(D) (D)
35.3 -
(D) (D)
-
--continued
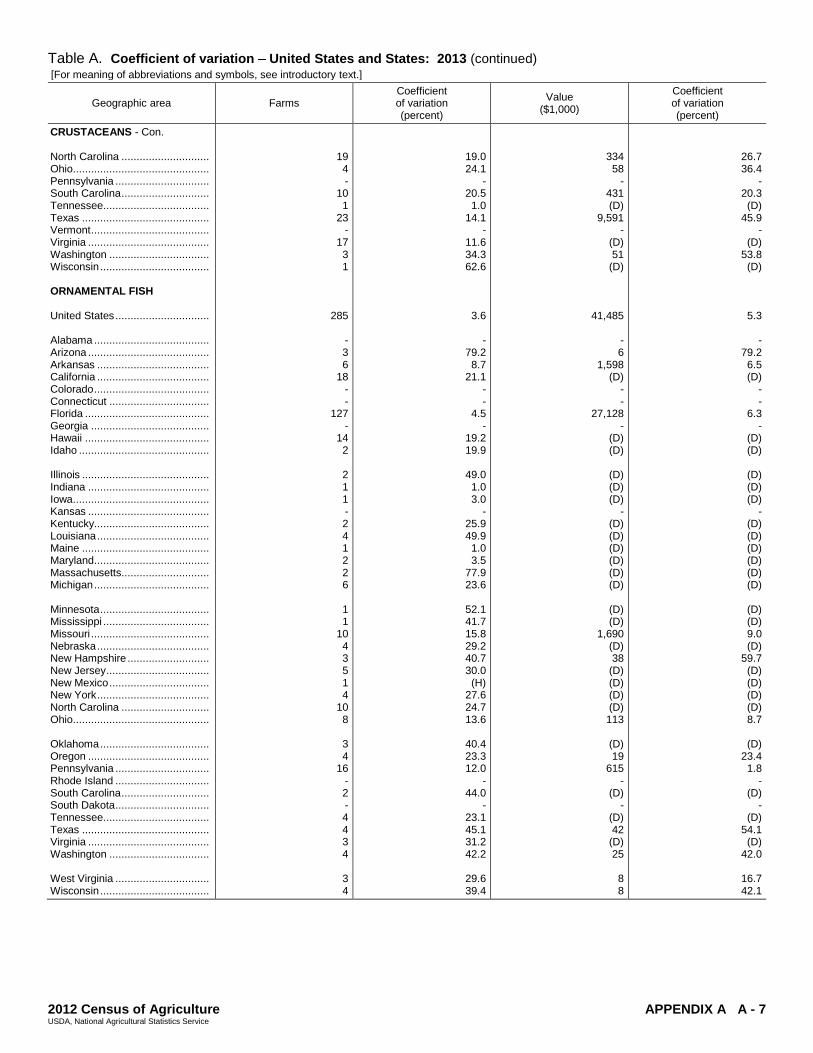
2012 Census of Agriculture APPENDIX A A - 7 USDA, National Agricultural Statistics Service
Table A. Coefficient of variation United States and States: 2013 (continued) [For meaning of abbreviations and symbols, see introductory text.]
Geographic area Farms Coefficient of variation (percent)
Value ($1,000)
Coefficient of variation (percent)
CRUSTACEANS - Con. North Carolina ............................. Ohio............................................. Pennsylvania ............................... South Carolina ............................. Tennessee ................................... Texas .......................................... Vermont ....................................... Virginia ........................................ Washington ................................. Wisconsin .................................... ORNAMENTAL FISH United States ............................... Alabama ...................................... Arizona ........................................ Arkansas ..................................... California ..................................... Colorado ...................................... Connecticut ................................. Florida ......................................... Georgia ....................................... Hawaii ......................................... Idaho ........................................... Illinois .......................................... Indiana ........................................ Iowa............................................. Kansas ........................................ Kentucky...................................... Louisiana ..................................... Maine .......................................... Maryland...................................... Massachusetts............................. Michigan ...................................... Minnesota .................................... Mississippi ................................... Missouri ....................................... Nebraska ..................................... New Hampshire ........................... New Jersey .................................. New Mexico ................................. New York ..................................... North Carolina ............................. Ohio............................................. Oklahoma .................................... Oregon ........................................ Pennsylvania ............................... Rhode Island ............................... South Carolina ............................. South Dakota ............................... Tennessee ................................... Texas .......................................... Virginia ........................................ Washington ................................. West Virginia ............................... Wisconsin ....................................
19 4 -
10 1
23 -
17 3 1
285
- 3 6
18 - -
127 -
14 2
2 1 1 - 2 4 1 2 2 6
1 1
10 4 3 5 1 4
10 8
3 4
16 - 2 - 4 4 3 4
3 4
19.0 24.1
- 20.5 1.0
14.1 -
11.6 34.3 62.6
3.6
- 79.2 8.7
21.1 - -
4.5 -
19.2 19.9
49.0 1.0 3.0
- 25.9 49.9 1.0 3.5
77.9 23.6
52.1 41.7 15.8 29.2 40.7 30.0 (H)
27.6 24.7 13.6
40.4 23.3 12.0
- 44.0
- 23.1 45.1 31.2 42.2
29.6 39.4
334 58
- 431 (D)
9,591 -
(D) 51
(D)
41,485
- 6
1,598 (D)
- -
27,128 -
(D) (D)
(D) (D) (D)
- (D) (D) (D) (D) (D) (D)
(D) (D)
1,690 (D) 38
(D) (D) (D) (D) 113
(D) 19
615 -
(D) -
(D) 42
(D) 25
8 8
26.7 36.4
- 20.3 (D)
45.9 -
(D) 53.8 (D)
5.3
- 79.2 6.5 (D)
- -
6.3 -
(D) (D)
(D) (D) (D)
- (D) (D) (D) (D) (D) (D)
(D) (D) 9.0 (D)
59.7 (D) (D) (D) (D) 8.7
(D)
23.4 1.8
- (D)
- (D)
54.1 (D)
42.0
16.7 42.1

2012 Census of Agriculture APPENDIX B B - 1 USDA, National Agricultural Statistics Service
Appendix B General Explanation and Report Form
DEVELOPMENT OF THE REPORT FORM Planning for the 2013 Census of Aquaculture started
in 2012 with the closeout of data collection for the
2012 Census of Agriculture. Extensive discussions
and meetings took place between NASS staff and
representatives of the aquaculture industry regarding
2013 Census of Aquaculture content. Evaluations
from NASS staff of the 2005 Census of Aquaculture
were reviewed. The decision was made to
incorporate NASS’s Annual Catfish and Annual
Trout surveys into the 2013 Census of Aquaculture
report form.
Report form drafts were developed in headquarters.
NASS staff in regional field offices reviewed the
drafts and solicited input from various data users in
their respective States. Letters were sent to
individuals in government organizations, industry,
and academic positions to solicit their comments on
report form content and design.
Pretesting was conducted with individuals and
industry representatives associated with sections of
the report form where changes were suggested.
Participating field office and headquarters
statisticians evaluated the results of their findings,
identified flaws discovered during the interview
process, and submitted recommendations to the
report form design team in headquarters. All
responses were reviewed and categorized to evaluate
data collection feasibility and priority needs. Results
of the pretest lead to a redesign and the final census
of aquaculture report form.
DATA CHANGES Following are descriptions of the report form
changes and their effect on the publication tables.
Added items include:
• Acres used for hybrid catfish
• Algae, total
• Algae, microalgae
• Algae, sea vegetables
• Aquaponics system tanks
• Clams, geoduck
• Flounder
• Ornamental fish, saltwater
• Bass, hybrid striped distributed
• Chub distributed
• Gar distributed
• Grass carp distributed
• Sauger distributed
• Saugeye distributed
• Sturgeon distributed
• Suckers distributed
• Tilapia distributed
Items listed individually on the 2013 report form that
were reported in conjunction with similar items on
the 2005 report form include:
• Salmon, Atlantic
• Salmon, Pacific
• Ornamental fish, freshwater egg layers
• Ornamental fish, freshwater live bearers
Items combined on the 2013 report form that were
reported individually with similar items on the 2005
report form include:
• Cages and pens (items listed separately in 2005)
Deleted items include:
• Arctic char
• Pacific threadfin
• Average gallons per minute flow in raceways
• Annual payroll
• Average operator hours per farm
• Paid workers (150 days or more)
• Paid workers (less than 150 days)
B - 2 APPENDIX B 2012 Census of Agriculture USDA, National Agricultural Statistics Service
• Unpaid workers
Deleted State-level tables:
• Aquaculture produced and distributed (2013 has
trout only)
• Baitfish production pounds and averages data
• Crustacean production data
• Food fish by size (2013 has only catfish and
trout)
• Mollusk production data
• Percent of sales by point of first sale
• Sportfish production by size
DEFINITIONS AND EXPLANATIONS The following definitions and explanations provide a
detailed description of the terms used in this
publication. Items in the tables which carry the note
"See text" are also explained. For exact wording of
the questions on the 2013 Census of Aquaculture
report form, see the the facsimile of the form at the
end of this appendix.
Algae. These are a very large and diverse group of
simple organisms that can range from the
microscopic (microalgae), to large seaweeds
(macroalgae), such as giant kelp more than 100 feet
in length. Microalgae include both organisms similar
to bacteria called blue green algae, as well as green,
brown, and red algae. Most algae grow through
photosynthesis.
Aquaponics. A system of aquaculture in which the
waste produced by farmed fish or other aquatic
animals supplies nutrients for plants grown
hydroponically (cultivating plants in water), which in
turn purify the water.
Baitfish. These are fish used for bait, such as
crawfish for bait, fathead minnows, golden shiners,
emerald or silver shiners, feeder and bait goldfish,
and suckers. Examples of fish in the Other baitfish
category include chubs, leeches, and other types of
minnows.
Broodstock. These are fish or other stock kept for
reproduction, including males. Female broodfish
produce the fertilized eggs which go to hatcheries.
Cages. Cage culture involves growing a culture
species in floating cages or baskets. Cages are
normally used in larger, open bodies of water, such
as lakes or rivers. The sides of the cages are rigid
and are made of materials like plastic or plastic
covered wire.
Carp, other. Included in this category are bighead,
black, common, and silver carp.
Crustaceans. These are invertebrate animals with a
hard shelled segmented body and jointed legs.
Examples include crawfish, lobsters, prawns, shrimp,
and softshell crabs.
Direct to consumers. Included in this category are
sales made directly to individuals for home
consumption or placement in their ponds for
personal use. Also included are operations that raise
and market fish through their own fee fishing
operation. Sales made to fee fishing operations are
included under “Wholesale to other producers.”
Eggs. These are embryos surrounded by nutrient
material and a protective covering.
Enhancement. A term often used on the West Coast
with salmon. State and tribal hatcheries are releasing
young salmon into known population areas to be
harvested later upon the salmon’s return from the
sea.
Fingerlings. These are young fish, larger than a fry
but not an adult.
Flow through raceways. Environment where fish
are in a confined area, usually long and narrow, in
which water enters one end and exits the other.
Raceways can either be a natural flow system, using
the natural flow of a river or stream, or a closed
system where the water from the raceway flows
through a series of ponds and then is pumped into a
header pond that flows back into the raceway. The
water area for a closed system is the surface acres of
a raceway and all associated ponds. The area for a
natural flow system is the surface acres that the
raceway occupies.
Food fish. Includes fish raised primarily for food.
Examples include hybrid striped bass, carp, catfish,
yellow perch, red drum, salmon, sturgeon, tilapia,
and trout. Examples of fish in the ‘Other’ food fish
2012 Census of Agriculture APPENDIX B B - 3 USDA, National Agricultural Statistics Service
category include barramundi, cobia, cod, and
paddlefish.
In the 2013 Census of Aquaculture, the summary by
value of aquaculture products sold is published for
all food fish, including catfish and trout. In addition,
eggs from food fish are included in the food fish
totals.
Foodsize. Includes grown aquaculture products
ready for market.
Fry. Very young post-larval fish.
Government agencies. Included in this category are
sales made to Federal, State, or local government
hatcheries or other groups involved in purchasing
fish to stock Federal, publicly owned or regulated
waters and recreational areas.
Hybrid catfish. A cross between a female channel
catfish and a male blue catfish.
Hybrid striped bass. A cross between a male white
bass and a female striped bass.
Larvae. Newly hatched, earliest stage of animals
that undergo metamorphosis, differing markedly in
form and appearance from the adult.
Live haulers, brokers, etc. Individuals or
companies that purchase aquaculture products from a
producer for immediate resale. They may or may not
take possession of the product. Live haulers transport
aquaculture products in oxygenated tank trucks to
other outlets, including processing plants, pay lakes,
recreational lakes, and retail outlets.
Miscellaneous aquaculture. In 2013, this category
represents the production of aquaculture products
other than food fish, sport fish, baitfish, ornamental
fish, crustaceans, and mollusks. Examples include
algae (microalgae and sea vegetables such as
seaweed and ogo), alligators, caviar, eels, frogs, sea
urchins, snails, tadpoles, turtles, and live rock.
Examples of Other miscellaneous aquaculture
include gambusia and bioassay fish (fish used for
toxic testing).
Mollusks. These are marine invertebrates (no
backbone). In general, mollusks have three body
regions: a head, a visceral mass, and a “foot.”
Mollusks usually have a shell, although some do not.
Examples include abalone, clams, mussels, and
oysters. Examples of mollusks in the Other mollusk
category include scallops and scallop seed.
Mollusks off bottom. The use of water column
suspension techniques, including enclosures and
lines for the production of normally bottom-dwelling
mollusks. These techniques are designed to minimize
bottom predators and maximize the use of a three-
dimensional space for cultivation.
Mollusks on bottom. The practice of raising
mollusks on the bottom of tidal waters that have had
oyster shell, clam shell, or other material added to
improve the habitat for growth and survival.
Non-recirculating systems. Process of rearing
aquatic organisms and discharging the water after its
intended use.
Off farm water. Water that comes from a Federal
supplier; irrigation district; mutual, private, or
cooperative ditches; commercial company; or
municipal or community water system.
On farm surface water. Surface supply not
controlled by a water supply organization. Examples
include, streams, drainage ditches, lakes, ponds,
springs, and reservoirs.
Operator. A person who operates the farm making
day-to-day decisions for the farm.
Ornamental fish. This category includes fish raised
for water gardens, aquariums, etc. Examples include
koi and guppies. An example of fish in the Other
ornamental fish category include seahorses.
Other aquaculture products. This category
includes all aquaculture products that were not pre-
printed in the table.
Oysters, other. This category includes Kumomoto
and other oysters besides Eastern and Pacific.
Pens. Large enclosures usually placed in rivers or
ocean bays. Pens are usually floated in the water, but
may also be secured to the bottom. Pens are
B - 4 APPENDIX B 2012 Census of Agriculture USDA, National Agricultural Statistics Service
supported in some way, with the sides being flexible.
Point of first sale. The first point at which money is
exchanged for aquaculture products. For example,
delivery of aquaculture products from the farm to the
processing plant is considered to be the point of first
sale.
Ponds. The most common type of water facility for
raising fish. Most ponds are man-made and fish
usually have access to the entire pond.
Processors. Companies that convert live fish to a
product ready to cook such as fish fillets. Usually,
the purchasing plant has no ties to the producer.
However, in some cases, the plant may be a
cooperative that is jointly owned by the producer and
other producers. Also included in this category are
the sales of aquaculture products by vertically
integrated operations through their own processing
and marketing operations.
Recirculating systems. Metal, plastic, or fiberglass
tanks normally above ground and usually under
cover used for the rearing of aquatic organisms
where 90 percent or more of system water is
recycled. Some tanks may consist of frames with
liners.
Recreational stocking. When the point of first sale
is recreational stocking, the purchaser will use the
aquaculture production to stock private lakes or
ponds.
Saltwater. Water from a sea or ocean, including
brackish water. Freshwater converted to saltwater by
adding chemicals was tabulated as saltwater acres
used in production. The source of water was
tabulated as freshwater.
Sea vegetables. A type of algae seaweed that grows
naturally in the ocean.
Seed. Young animals, generally oysters, clams, or
mussels, used for stocking.
Shellfish. An aquatic invertebrate animal with a
shell, particularly an edible mollusk or crustacean.
Sport fish. Fish raised primarily to be released into
lakes and streams to be caught by sport fishermen.
Fish may also be sold to fee fishing operations.
Examples include largemouth and smallmouth bass,
crappie, muskie, northern pike, sunfish, and walleye.
Stockers. Fingerlings that are large enough to be
placed in the final grow-out pond, net, pen, or tank.
Sunfish. This category includes bluegill,
coppernose, bream, redear/shellcrackers, etc.
Surface water acres. A measure of the number of
square acres needed to cover the surface of a pond,
tank, raceway, etc.
Value of sales. The gross value of sales before
marketing and production costs are deducted.
Wholesale to other producers. Included in this
category are sales made to other farmers who buy
live fish to raise for a later sale.
2012 Census of Agriculture APPENDIX B B - 5 USDA, National Agricultural Statistics Service
B - 6 APPENDIX B 2012 Census of Agriculture USDA, National Agricultural Statistics Service
2012 Census of Agriculture APPENDIX B B - 7 USDA, National Agricultural Statistics Service
B - 8 APPENDIX B 2012 Census of Agriculture USDA, National Agricultural Statistics Service
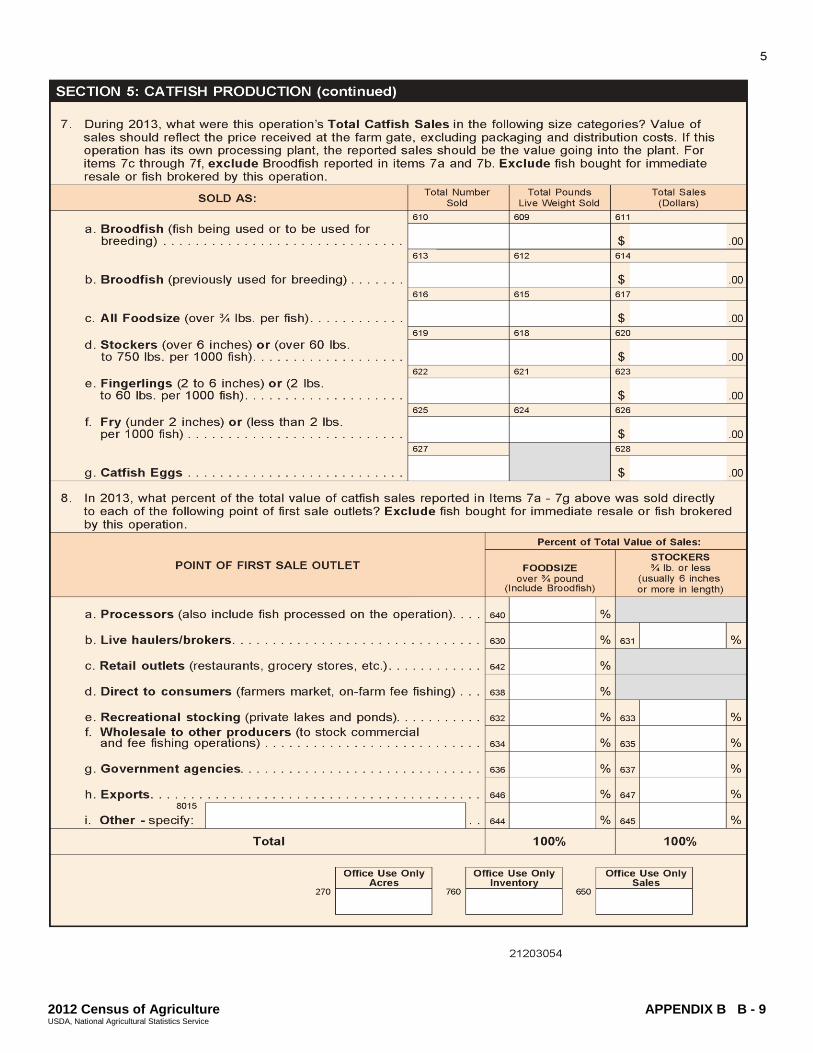
2012 Census of Agriculture APPENDIX B B - 9 USDA, National Agricultural Statistics Service
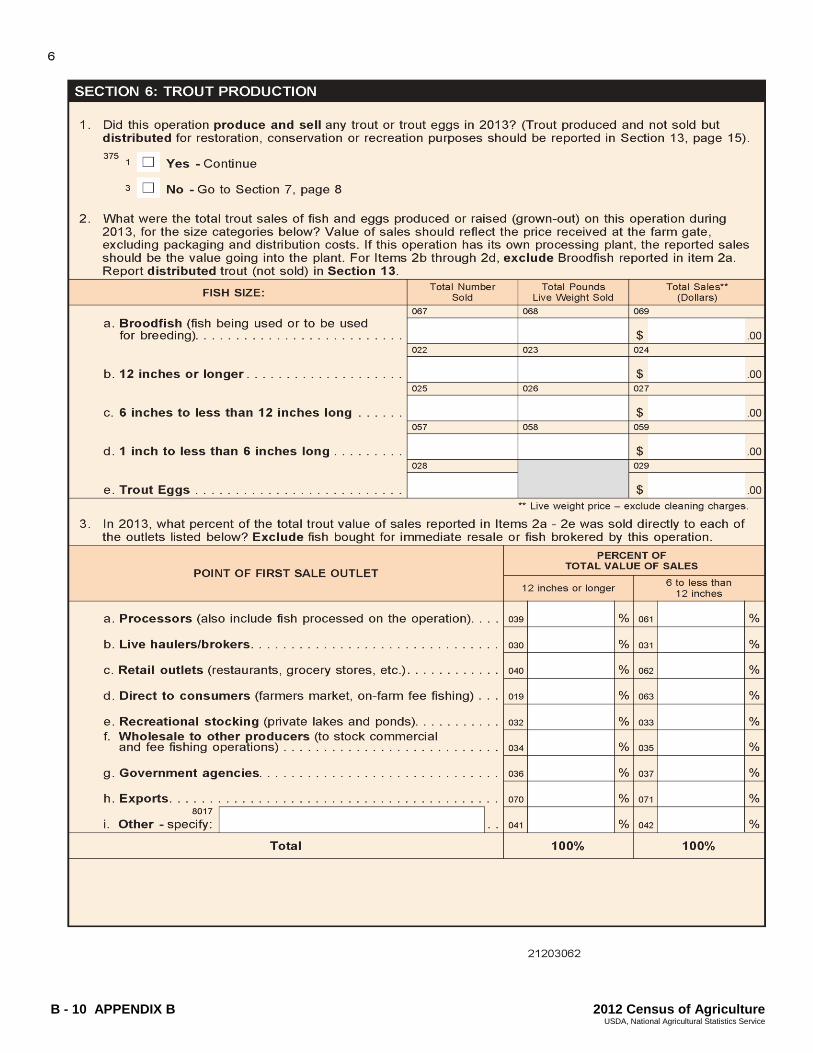
B - 10 APPENDIX B 2012 Census of Agriculture USDA, National Agricultural Statistics Service
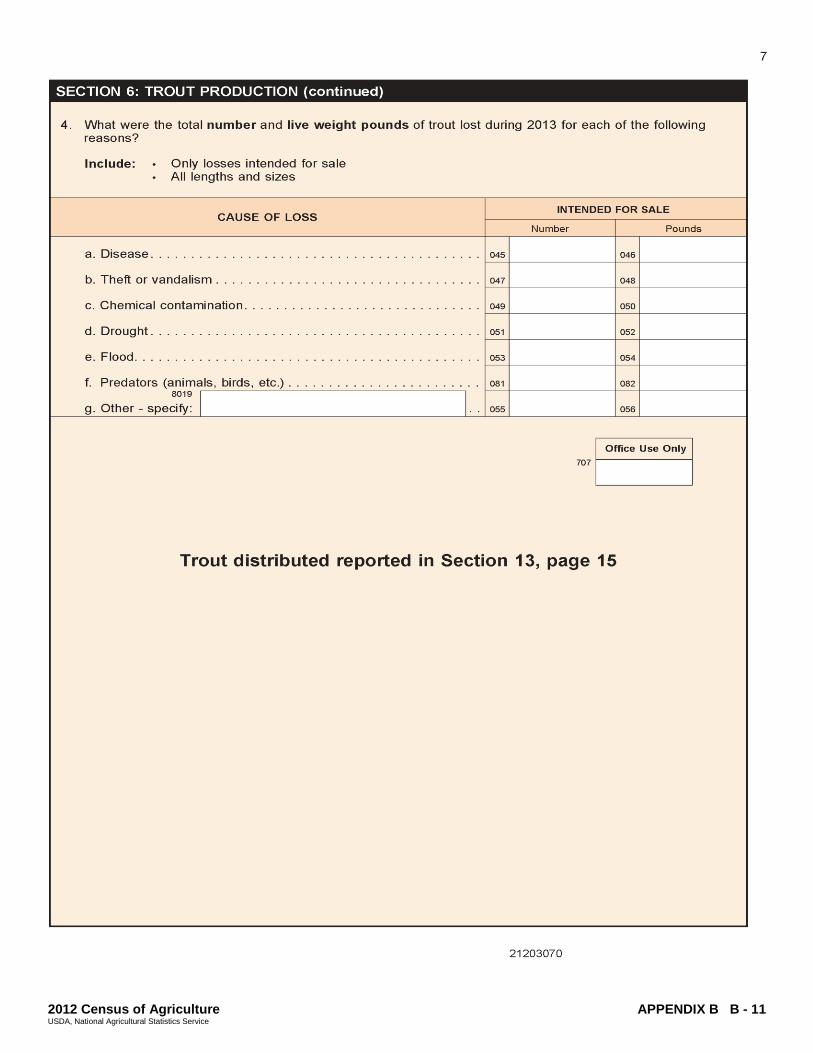
2012 Census of Agriculture APPENDIX B B - 11 USDA, National Agricultural Statistics Service
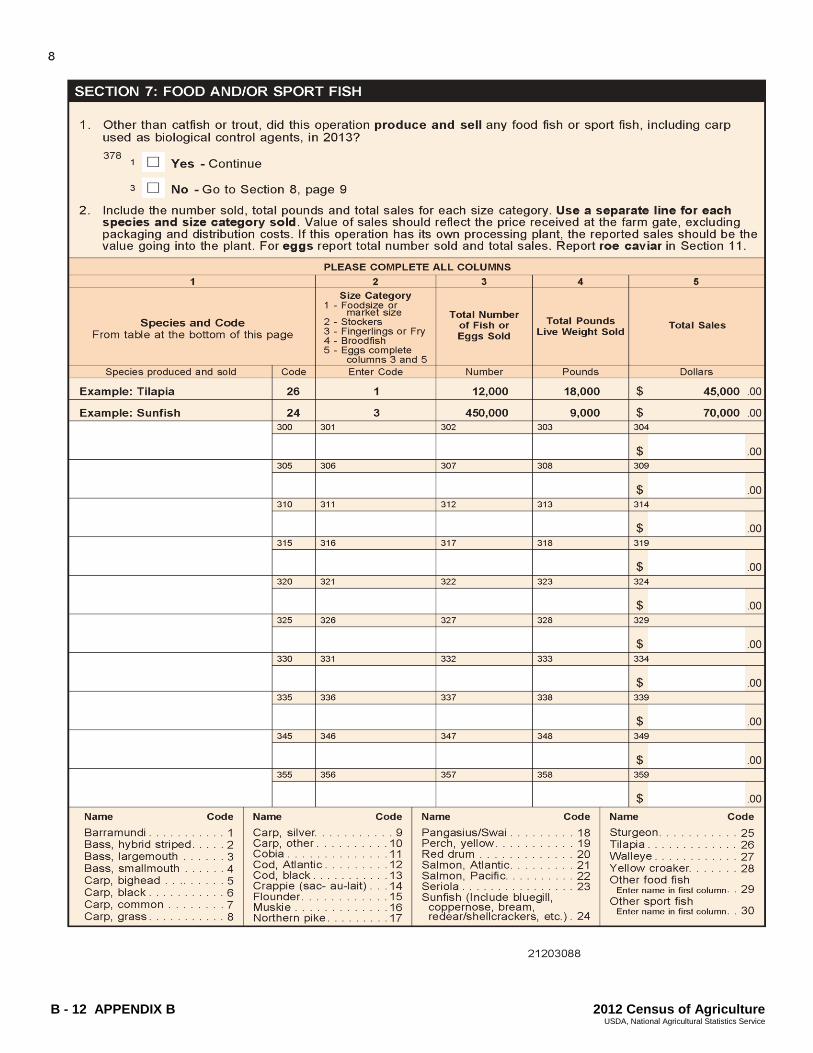
B - 12 APPENDIX B 2012 Census of Agriculture USDA, National Agricultural Statistics Service
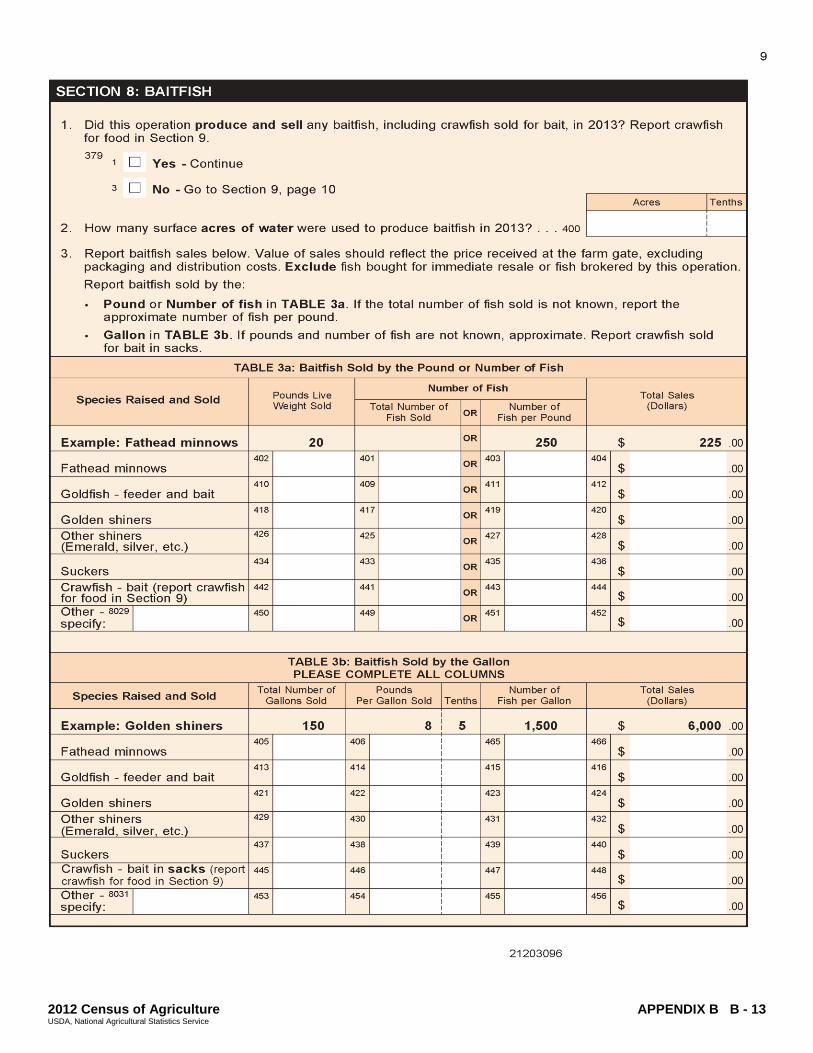
2012 Census of Agriculture APPENDIX B B - 13 USDA, National Agricultural Statistics Service
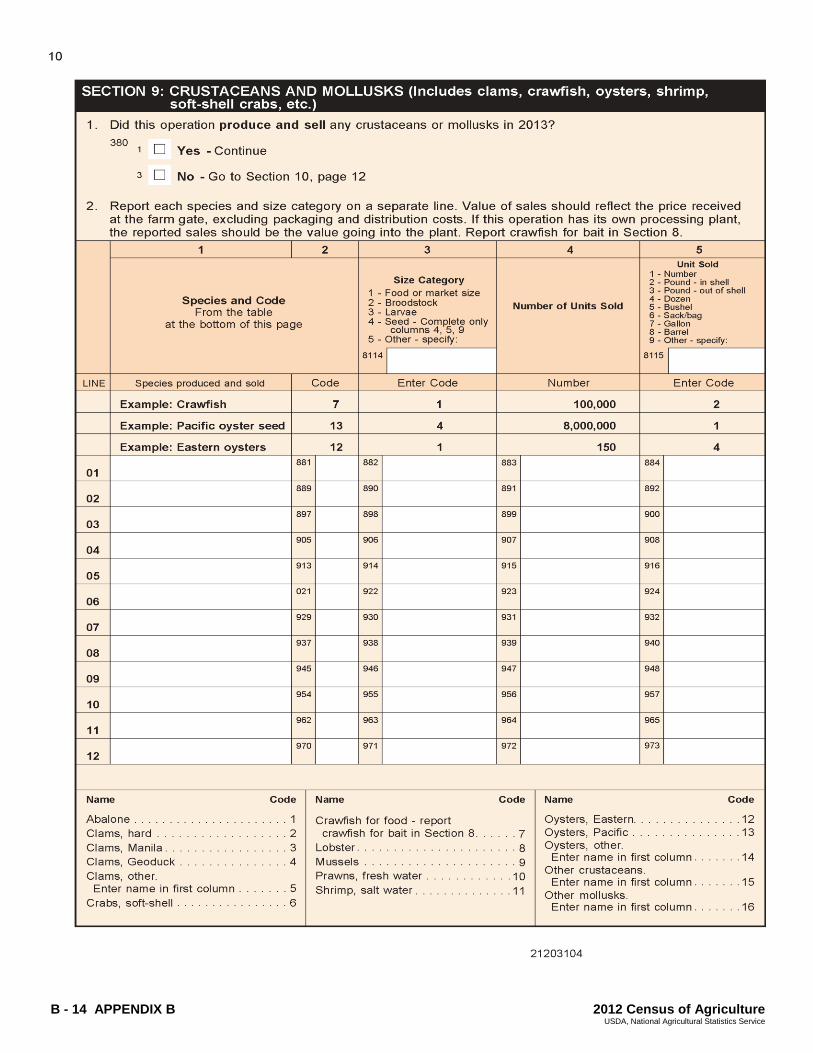
B - 14 APPENDIX B 2012 Census of Agriculture USDA, National Agricultural Statistics Service
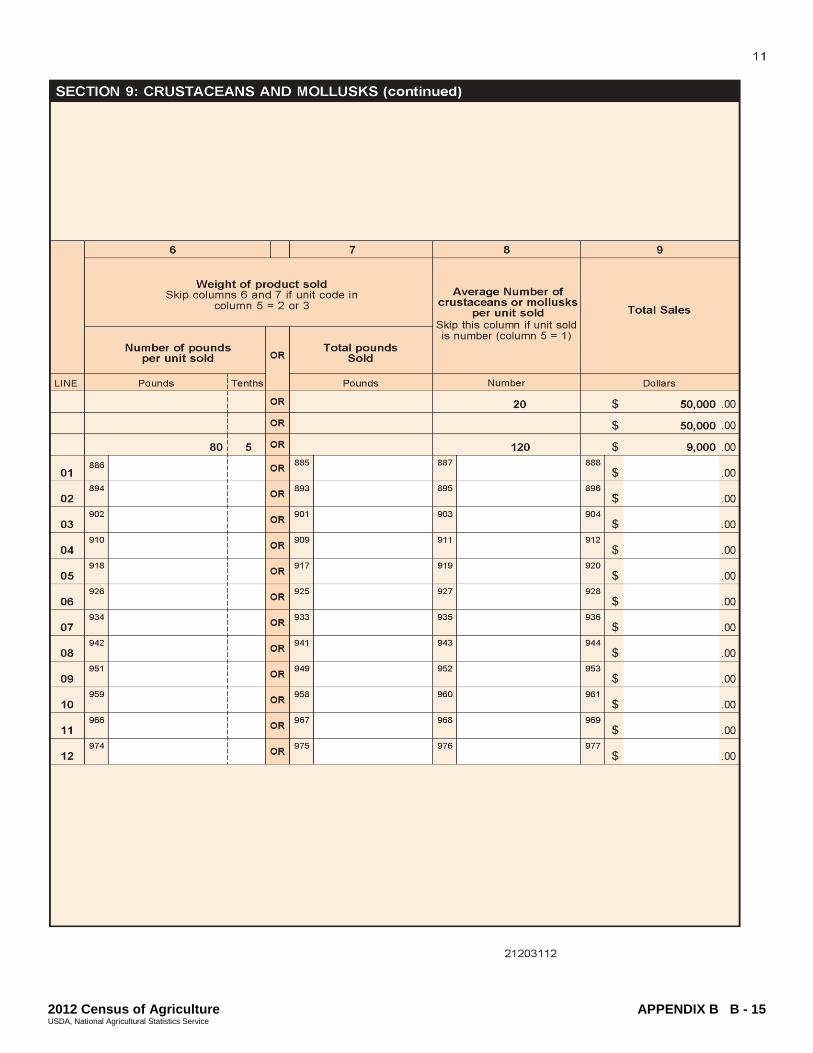
2012 Census of Agriculture APPENDIX B B - 15 USDA, National Agricultural Statistics Service
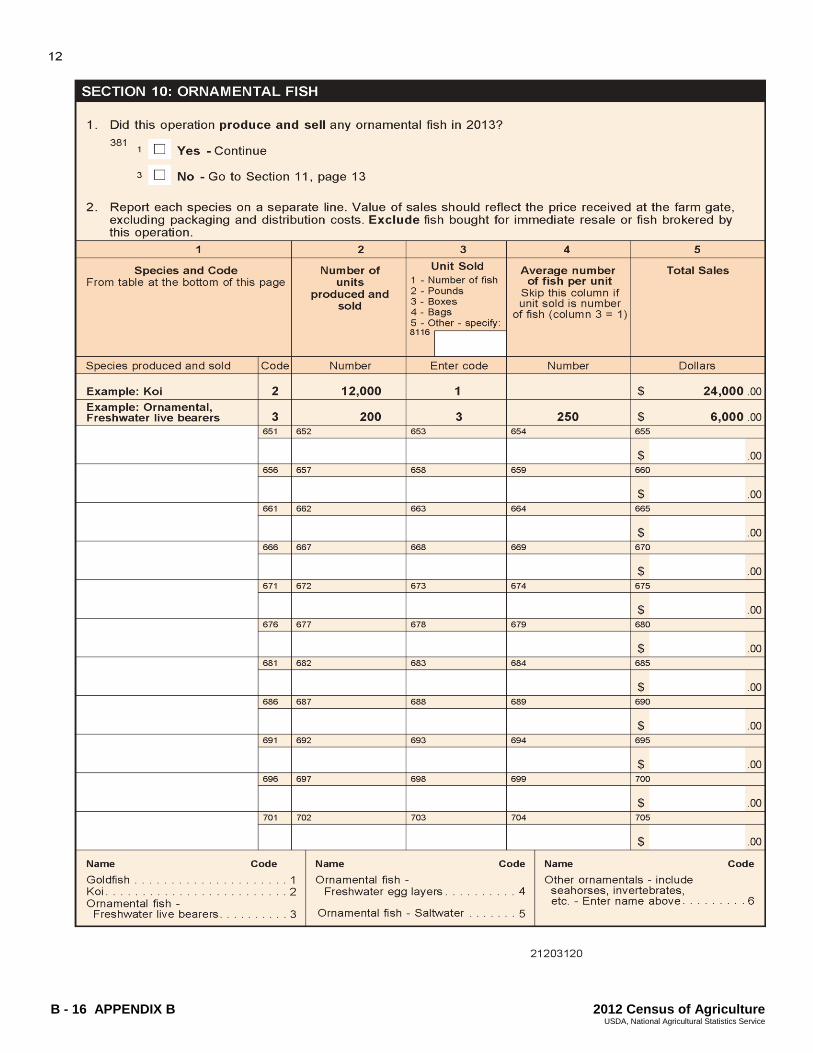
B - 16 APPENDIX B 2012 Census of Agriculture USDA, National Agricultural Statistics Service
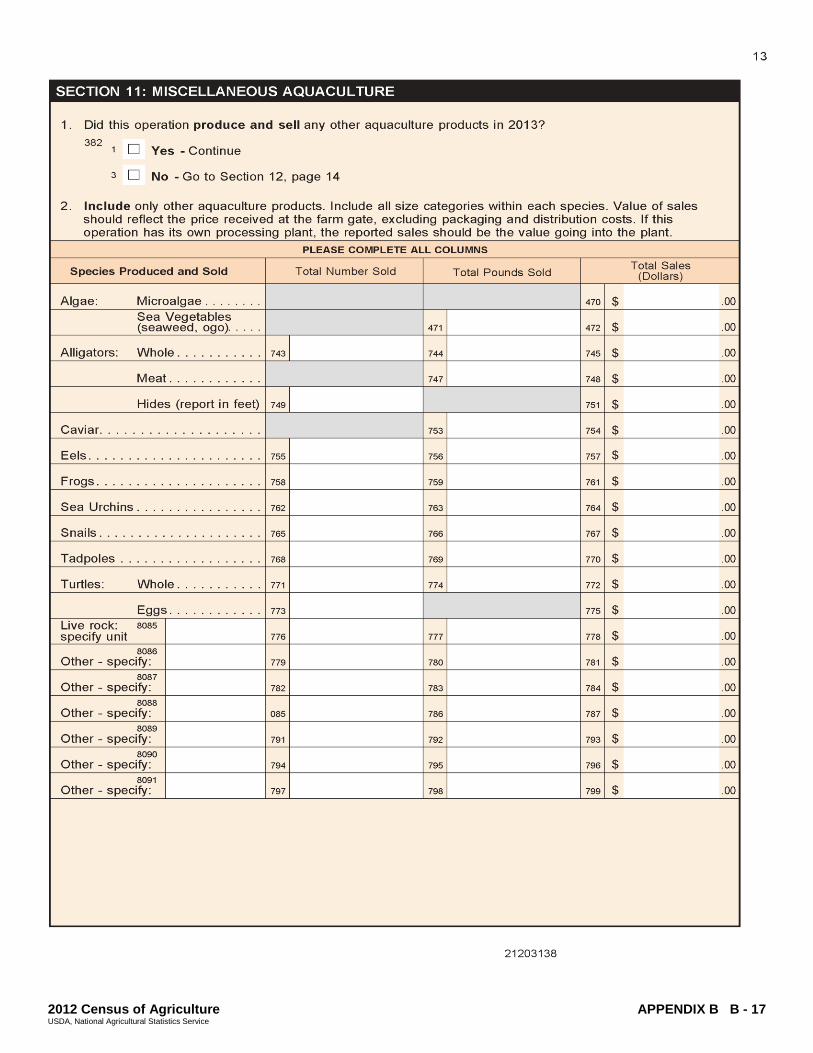
2012 Census of Agriculture APPENDIX B B - 17 USDA, National Agricultural Statistics Service
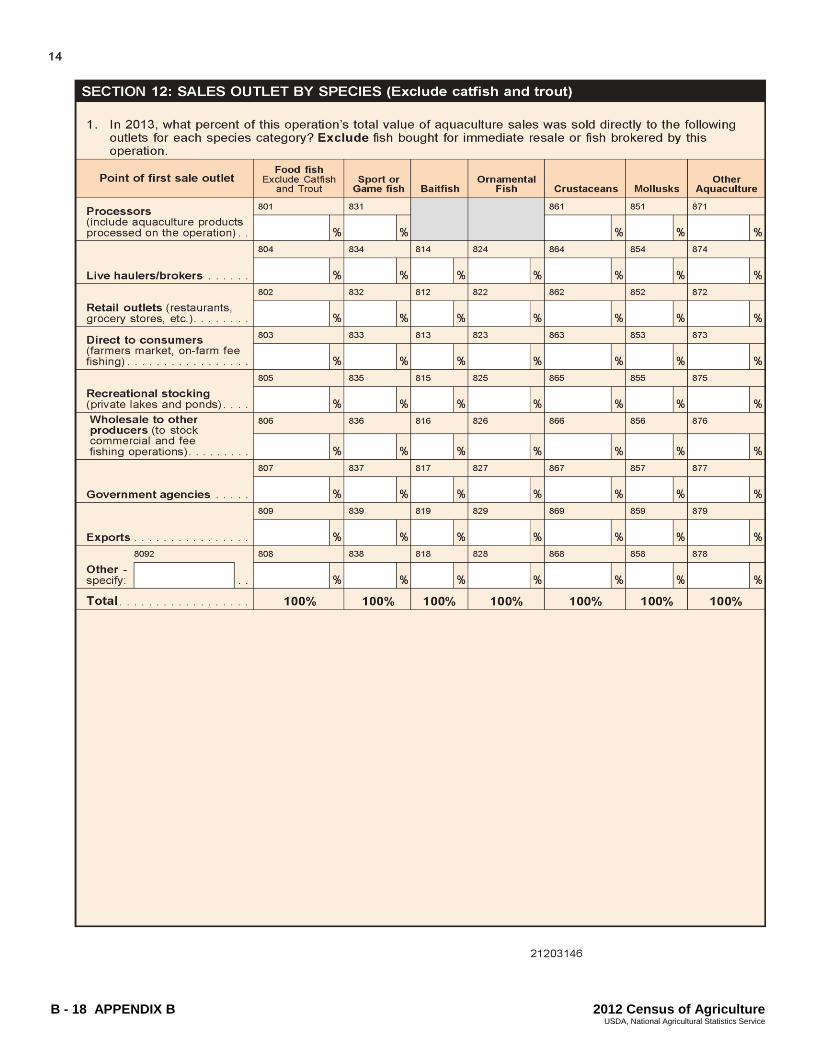
B - 18 APPENDIX B 2012 Census of Agriculture USDA, National Agricultural Statistics Service
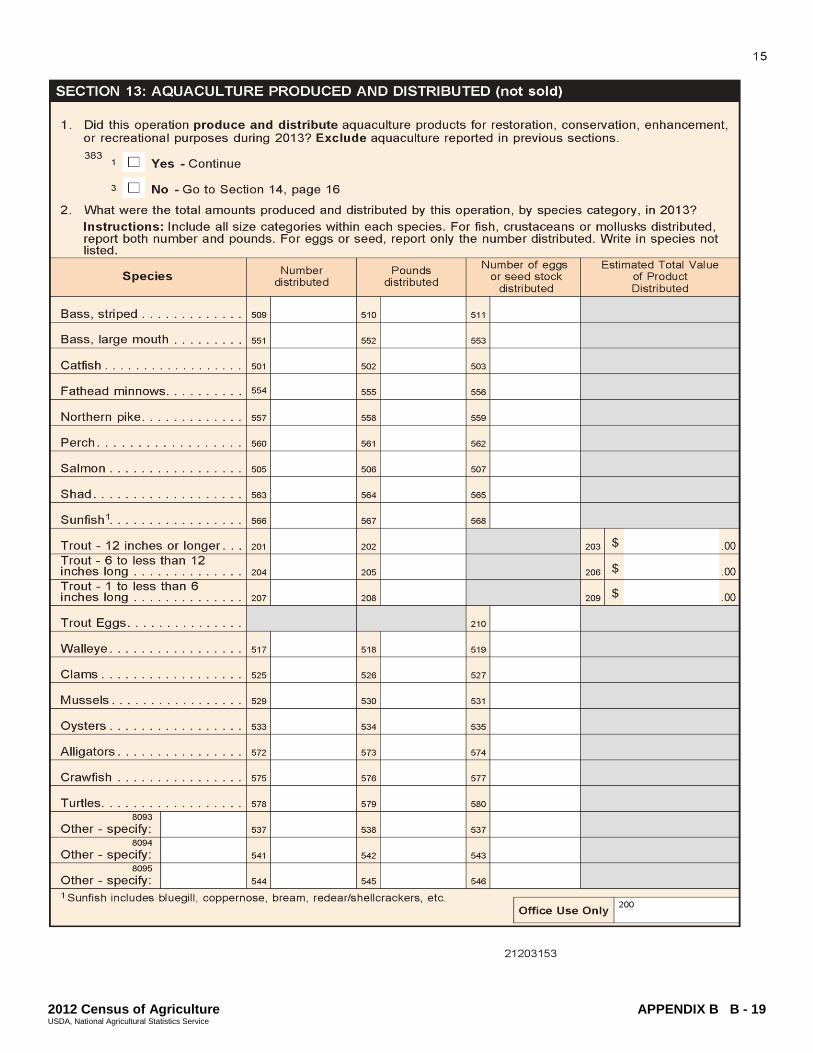
2012 Census of Agriculture APPENDIX B B - 19 USDA, National Agricultural Statistics Service
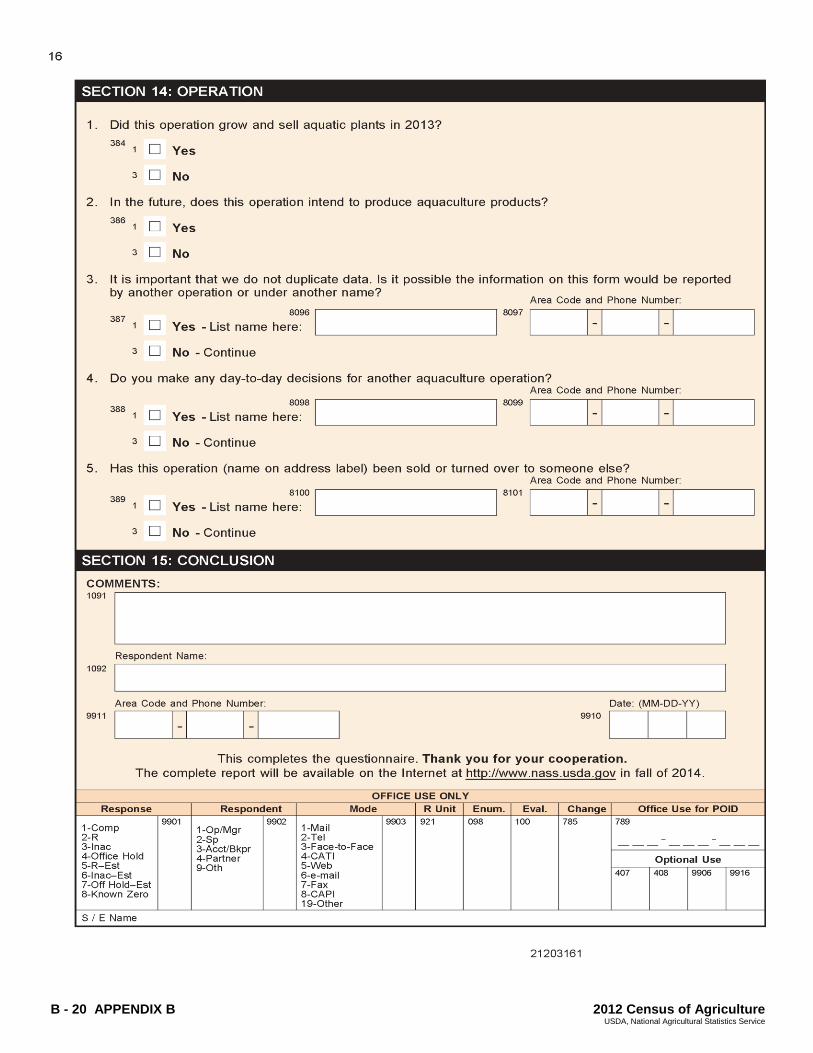
B - 20 APPENDIX B 2012 Census of Agriculture USDA, National Agricultural Statistics Service
2012 Census of Agriculture APPENDIX B B - 21 USDA, National Agricultural Statistics Service
B - 22 APPENDIX B 2012 Census of Agriculture USDA, National Agricultural Statistics Service
2012 Census of Agriculture APPENDIX B B - 23 USDA, National Agricultural Statistics Service
B - 24 APPENDIX B 2012 Census of Agriculture USDA, National Agricultural Statistics Service