Embed Size (px)
Citation preview

Cenovus EnCAID project
Approval #10440L Performance presentation
April 15, 2019

© 2019 Cenovus Energy Inc. April 15, 2019 2
Advisory
This document contains forward-looking information prepared and submitted pursuant to the Alberta Energy Regulator’s requirements and is not intended to be relied upon for the purpose of making investment decisions, including without limitation, to purchase, hold or sell any securities of Cenovus Energy Inc. Additional information regarding Cenovus Energy Inc. is available at cenovus.com.

© 2019 Cenovus Energy Inc. April 15, 2019
3
Cenovus EnCAID* introduction and overview
This presentation was prepared in accordance with AER Directive 054 - Performance presentations, auditing, and surveillance of in
situ oil sands schemes
Subsurface issues related to resource evaluation and recovery
• Directive 054, Section 3.1.1
Surface operations, compliance, and issues not related to resource evaluation and recovery
• Directive 054, Section 3.1.2
* Canadian patent CA2594413 (C)

© 2019 Cenovus Energy Inc. April 15, 2019 4
AER Directive 054 Section 3.1.1
Subsurface issues related to resource evaluation and recovery

© 2019 Cenovus Energy Inc. April 15, 2019 5
Subsurface issues: table of contents
• Background
• Geology/geoscience
• Drilling and completions
• Instrumentation
• Scheme performance
• Future plans

© 2019 Cenovus Energy Inc. April 15, 2019
6
Scheme background Subsurface section 1

© 2019 Cenovus Energy Inc. April 15, 2019
7
Background
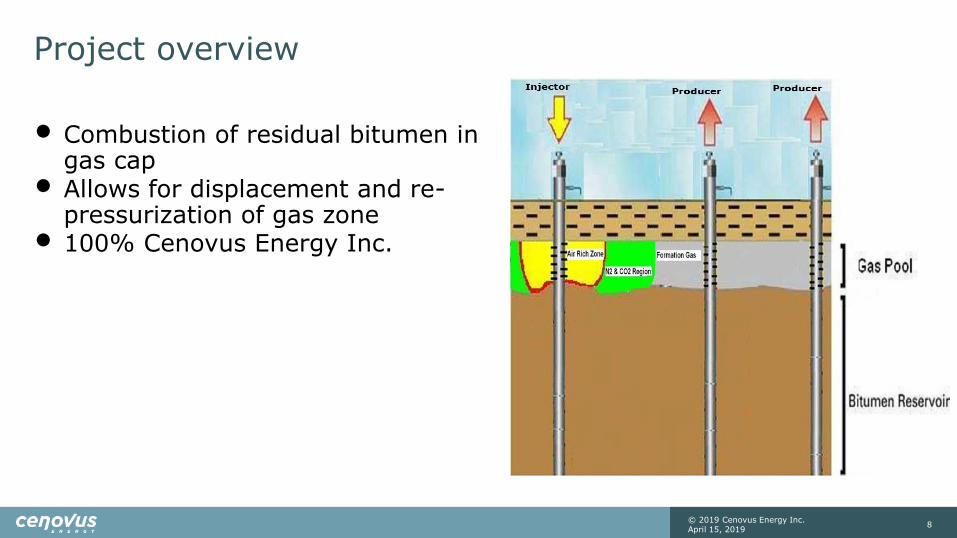
• The EnCAID project is an enhanced recovery scheme which displaces natural gas with combustion gases that are the result of combustion of residual bitumen in gas cap
© 2019 Cenovus Energy Inc. April 15, 2019
8
Project overview
• Combustion of residual bitumen in gas cap
• Allows for displacement and re-pressurization of gas zone
• 100% Cenovus Energy Inc.

© 2019 Cenovus Energy Inc. April 15, 2019
9
Geological/geoscience Subsurface section 2

© 2019 Cenovus Energy Inc. April 15, 2019
10
Summary of Wabiskaw gas properties
Depth 465 TVD
Thickness 5 m
Average porosity ~36%
Average gas saturation ~50%
Average water saturation ~30%
Average bitumen saturation ~20%

11
Wabiskaw stratigraphic cross-section
Regional WBSK WBSK B Valley Fill WBSK D Valley Fill
MCMR
A
A’
A A’
WBSK B VF Depositional Edge Bottom water
© 2019 Cenovus Energy Inc. April 15, 2019

© 2019 Cenovus Energy Inc. April 15, 2019
12
Drilling and completion Subsurface section 3

© 2019 Cenovus Energy Inc. April 15, 2019
13
Well layout

© 2019 Cenovus Energy Inc. April 15, 2019
14
Drilling and completion
• No new wells were drilled
• No recompletions
• No workovers
Requirements under subsection 3.1.1 3c – wellbore schematics are included in the appendix

© 2019 Cenovus Energy Inc. April 15, 2019
15
Instrumentation Subsurface section 5

© 2019 Cenovus Energy Inc. April 15, 2019
16
Instrumentation in wells
Observation Well: 102/05-10-73-6W4 • Equipped with three piezometers
• Equipped with 10 thermocouples
Observation Well: 100/6-10-73-6W4
• Equipped with one piezometer • Equipped with 10 thermocouples
Requirements under subsection 3.1.1 5a – wellbore schematics 5c and 5d are included in the appendix

© 2019 Cenovus Energy Inc. April 15, 2019
17
Observation wells bitumen pressure
Recent data not available due to instrumentation issues

© 2019 Cenovus Energy Inc. April 15, 2019
18
102/05-10-073-06W4 – Temp history

© 2019 Cenovus Energy Inc. April 15, 2019
19
102/05-10-073-06W4/0 Observation well temperature
© 2019 Cenovus Energy Inc. April 15, 2019
20
Scheme performance Subsurface section 7
© 2019 Cenovus Energy Inc. April 15, 2019
21
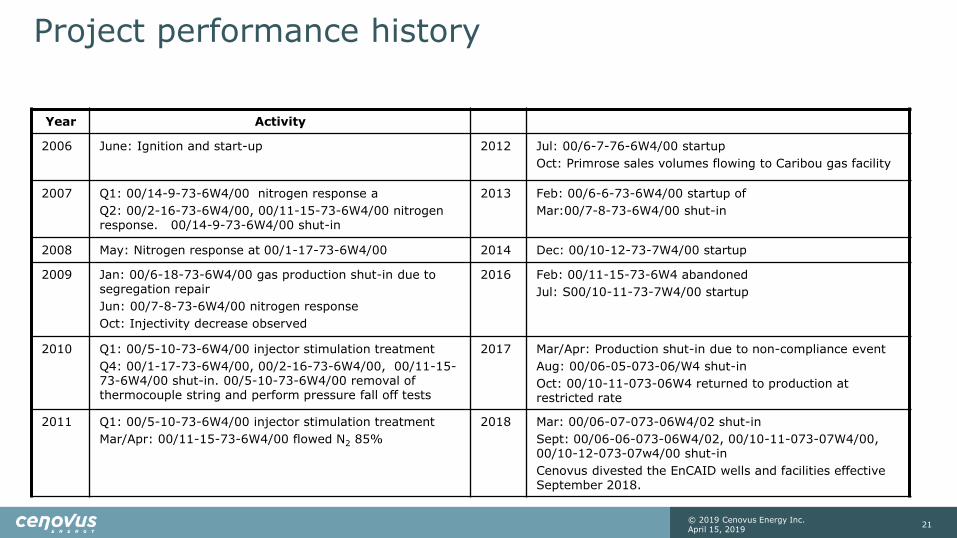
Project performance history
Year Activity
2006 June: Ignition and start-up 2012 Jul: 00/6-7-76-6W4/00 startup
Oct: Primrose sales volumes flowing to Caribou gas facility
2007 Q1: 00/14-9-73-6W4/00 nitrogen response a
Q2: 00/2-16-73-6W4/00, 00/11-15-73-6W4/00 nitrogen response. 00/14-9-73-6W4/00 shut-in
2013 Feb: 00/6-6-73-6W4/00 startup of
Mar:00/7-8-73-6W4/00 shut-in
2008 May: Nitrogen response at 00/1-17-73-6W4/00 2014 Dec: 00/10-12-73-7W4/00 startup
2009 Jan: 00/6-18-73-6W4/00 gas production shut-in due to segregation repair
Jun: 00/7-8-73-6W4/00 nitrogen response
Oct: Injectivity decrease observed
2016 Feb: 00/11-15-73-6W4 abandoned
Jul: S00/10-11-73-7W4/00 startup
2010 Q1: 00/5-10-73-6W4/00 injector stimulation treatment
Q4: 00/1-17-73-6W4/00, 00/2-16-73-6W4/00, 00/11-15-73-6W4/00 shut-in. 00/5-10-73-6W4/00 removal of thermocouple string and perform pressure fall off tests
2017 Mar/Apr: Production shut-in due to non-compliance event
Aug: 00/06-05-073-06/W4 shut-in
Oct: 00/10-11-073-06W4 returned to production at restricted rate
2011 Q1: 00/5-10-73-6W4/00 injector stimulation treatment
Mar/Apr: 00/11-15-73-6W4/00 flowed N2 85%
2018 Mar: 00/06-07-073-06W4/02 shut-in
Sept: 00/06-06-073-06W4/02, 00/10-11-073-07W4/00, 00/10-12-073-07w4/00 shut-in
Cenovus divested the EnCAID wells and facilities effective September 2018.

© 2019 Cenovus Energy Inc. April 15, 2019
22
Production/injection summary
Production operations
Operating for Air injected Bulk gas recovered Formation gas recovered
>12 years ~ 305 e6m3 ~ 217 e6m3 ~ 192 e6m3
Approved producers
UWI Status UWI Status
00/06-05-073-06W4/0 Shut-in ~ 81% N2 00/02-16-073-06W4/0 Shut-in ~ 85% N2
00/06-06-073-06W4/2 Flowing * ~2% N2 00/01-17-073-06W4/0 Shut-in ~ 86% N2
00/06-07-073-06W4/2 Shut-in ~79% N2 00/10-11-073-07W4/0 Flowing * <1% N2
00/07-08-073-06W4/0 Shut-in ~ 87% N2 00/10-12-073-07W4/0 Flowing * <1% N2
00/11-15-073-06W4/0 Abandoned 00/14-09-073-06W4/0 Shut-in ~ 85% N2
* All wells shut-in Sept 2018
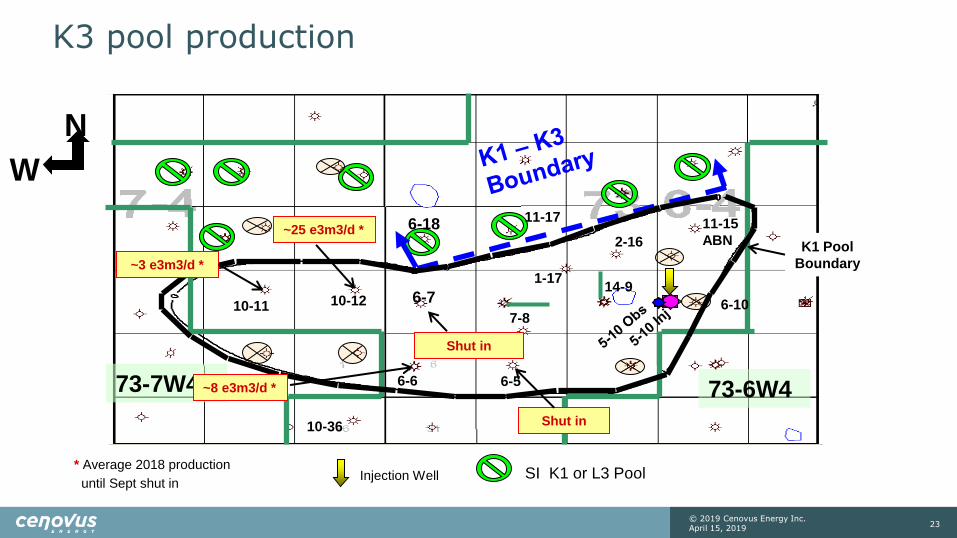
K3 pool production
7-8
14-9
11-15
ABN
73-7W4 73-6W4
2-16
6-5
1-17
N
W
Injection Well
Shut in
10-12
6-6
10-11 6-7
Shut in
SI K1 or L3 Pool
~8 e3m3/d *
~25 e3m3/d *
~3 e3m3/d *
10-36
11-17 6-18
K1 Pool
Boundary
6-10
23 © 2019 Cenovus Energy Inc. April 15, 2019
* Average 2018 production
until Sept shut in

24
History production
© 2019 Cenovus Energy Inc. April 15, 2019

25
Voidage replacement ratio (VRR) - 2018
January to September
Managed air injection to minimize operating costs with intermittent high air injection rates to ensure that the minimum monthly VRR of 0.90 was met
© 2019 Cenovus Energy Inc. April 15, 2019
Cenovus divested the EnCAID wells and facilities effective September 2018.

© 2019 Cenovus Energy Inc. April 15, 2019
26
Voidage replacement ratio
Monthly VRR Cumulative VRR VRR regulatory approved limit (Min monthly)
January 1.30 1.42 0.90
February 1.30 1.42 0.90
March 1.20 1.42 0.90
April 1.00 1.42 0.90
May 1.20 1.41 0.90
June 1.10 1.41 0.90
July 1.00 1.41 0.90
August 1.00 1.41 0.90
September * 1.10 1.41 0.90
October - - -
November - - -
December - - -
* Cenovus divested the EnCAID wells and facilities effective September 2018.

© 2019 Cenovus Energy Inc. April 15, 2019
27
VRR performance
* Note: The Cumulative VRR since 2015 has been updated.
Due to an error in the calculation, the previously reported values were higher than actuals.

© 2019 Cenovus Energy Inc. April 15, 2019
28
VRR history
© 2019 Cenovus Energy Inc. April 15, 2019
29
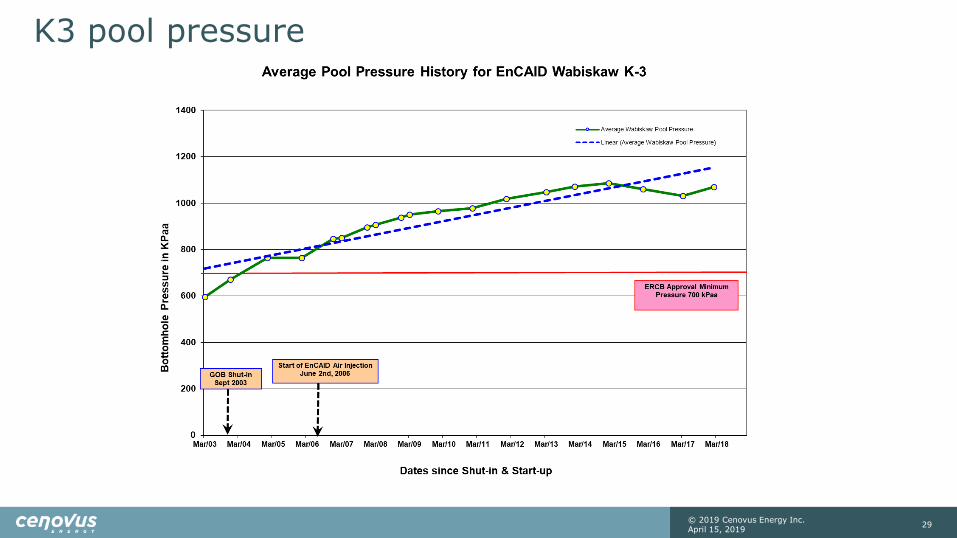
K3 pool pressure

© 2019 Cenovus Energy Inc. April 15, 2019
30
Observation 6-10 well temperature

© 2019 Cenovus Energy Inc. April 15, 2019
31
Composition of injected/produced fluids
• EnCAID does not currently sample air injected
• EnCAID captures gas samples for analysis on the schedule located to the right and monitors compositional changes for each well
• Cenovus samples selective wells on more frequent basis than required under Approval 10440L
Sampling Frequency
00/01-17-073-06W4/0 Annual
00/02-16-073-06W4/0 Annual
00/06-05-073-06W4/0 Semi-annual
00/06-06-073-06W4/2 Semi-annual
00/06-07-073-06W4/2 Semi-annual
00/06-10-073-06W4/2 Annual
00/06-18-073-06W4/0 Annual
00/07-08-073-06W4/0 Annual
00/10-11-073-07W4/0 Semi-annual
00/10-12-073-07W4/0 Semi-annual
00/10-36-072-07W4/2 Annual
00/11-17-073-06W4/0 Annual
00/14-09-073-06W4/0 Annual

Nitrogen response
7-8
14-9
11-15
ABN K1 Pool
Boundary
SI K1 or L3 Pool
73-7W4 73-6W4
2-16
6-5
1-17
N
W 85% N2
86% N2
85% N2
87% N2
81% N2
79% N2
2% N2
<1% N2
<1% N2
Injection Well
6-6
10-11 10-12 6-7
<1% N2
6-18
10-36
11-17
6-10
© 2019 Cenovus Energy Inc. April 15, 2019
32

Wabiskaw K-3 Pool material balance
Original Pressure
– 2050 kPaa
(300 psia)
Pressure Dec 03 = 662 kPaa or 96 psia
OGIP = 1129 e6m3 (39.9 Bcf)
Gas prod = 877 e6m3 (31.0 Bcf 77% RF)
Pre-EnCAID EnCAID
Dec/2017 Cum Prod 1,088 e6m3 (38.7 bcf)
RF 97%
© 2019 Cenovus Energy Inc. April 15, 2019
33

© 2019 Cenovus Energy Inc. April 15, 2019
34
Subsurface key learnings
Presence of more than one oxidation front indicates
• fuel remaining in the region swept by the combustion front
• could be either residual oil left behind first oxidation front, or re-saturation with oil from adjacent rock or, possibly from flammable vapor produced from the oxidation and cracking reactions
Continues to be strong correlations between air-injection rate and temperature changes
• first oxidation zone at the bottom of the gas cap was truncated by a reduction in injection rate
• increase in injection rate performed in early 2013 resulted in ignition and combustion of the top of the bitumen

© 2019 Cenovus Energy Inc. April 15, 2019
35
Future plans Subsurface section 8

© 2019 Cenovus Energy Inc. April 15, 2019
36
Future plans
• Cenovus divested the EnCAID well and facilities effective September 2018 and plans to transfer the scheme approval to the new owner.

© 2019 Cenovus Energy Inc. April 15, 2019 37
AER Directive 054 Section 3.1.2
Surface operations, compliance and issues not related to resource evaluation and recovery
© 2019 Cenovus Energy Inc. April 15, 2019
38
Surface operations: table of contents
• Facility overview/modifications
• Measurement and reporting
• Environmental issues
• Compliance statement
• Future plans

© 2019 Cenovus Energy Inc. April 15, 2019
39
Facilities Overview Surface section 1
© 2019 Cenovus Energy Inc. April 15, 2019
40
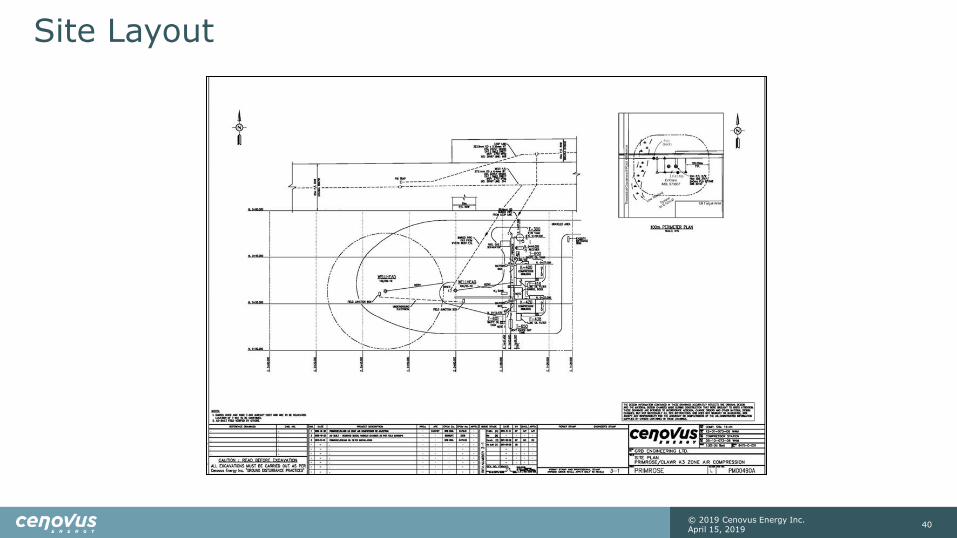
Site Layout

© 2019 Cenovus Energy Inc. April 15, 2019
41
Process flow schematic

© 2019 Cenovus Energy Inc. April 15, 2019
42
Plant performance - 2018
Facility is operating as expected • Steady air injections • Operated to optimize operating costs

© 2019 Cenovus Energy Inc. April 15, 2019
43
Gas usage
Usage is as fuel gas for air compressor operations
• Gas source Primrose plant fuel gas
• Total 2018 usage 824 e3m3 *
* All wells & air injection shut-in Sept 2018

© 2019 Cenovus Energy Inc. April 15, 2019
44
Greenhouse gas emissions
2018 (tonnes CO2e)
January 368.67
February 287.56
March 331.13
April 243.76
May 231.82
June 238.62
July 244.90
August 221.46
September * 70.82
October 0.00
November 0.00
December 0.00
* All wells & air injection shut-in Sept 2018
© 2019 Cenovus Energy Inc. April 15, 2019
45
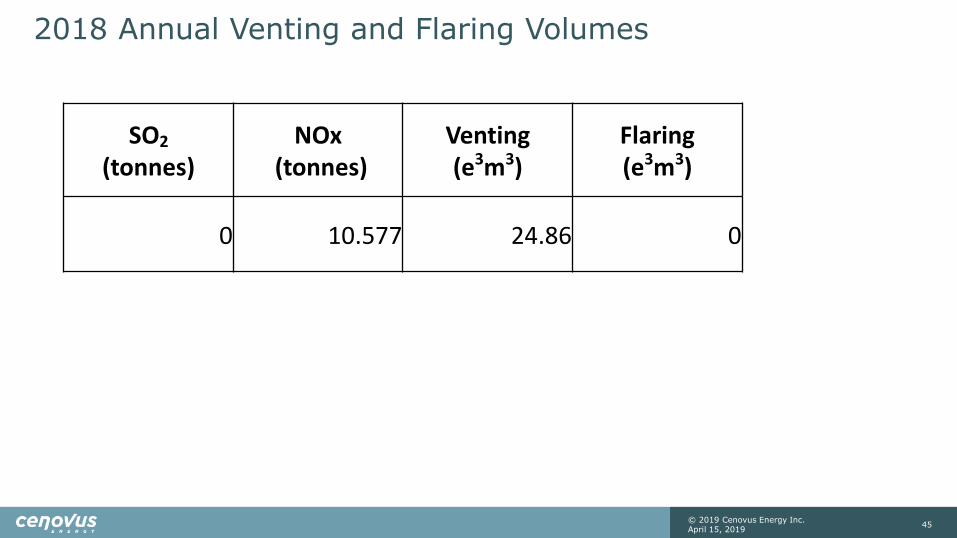
2018 Annual Venting and Flaring Volumes
SO2 (tonnes)
NOx (tonnes)
Venting (e3m3)
Flaring (e3m3)
0 10.577 24.86 0

© 2019 Cenovus Energy Inc. April 15, 2019
46
Surface facility key learnings
• Safe operation of production and injection wells
• Geographical location provides challenges for instrumentation operations utilizing solar panels during the winter season
• Purity of injection gases plays key role in maintaining injectivity
• Marginal economics to operate in today's pricing environment

© 2019 Cenovus Energy Inc. April 15, 2019
47
Measurement and reporting
Surface section 2

© 2019 Cenovus Energy Inc. April 15, 2019
48
Measurement reporting
Field Operations record daily flow volumes for air injection and
compressor usage
Gas Analysis
Gas well meters loaded to PVR via SCADA system
EnCAID Daily Volumes report spreadsheet
Production activities 1) PA updates gas analysis in PAS 2) PA enters air volumes and fuel usage
volume from EnCAID Daily Report in to PAS EnCAID injection facility
3) Well production PVR data uploaded to PAS
4) PAS generates PRA submission 5) PA manually updated the gas fuel
usage and air injection into PRA
PVR

© 2019 Cenovus Energy Inc. April 15, 2019
49
Environmental issues Surface section 7

© 2019 Cenovus Energy Inc. April 15, 2019
50
Environmental compliance
No environmental non-compliance events related to EnCAID occurred in 2018

© 2019 Cenovus Energy Inc. April 15, 2019
51
Compliance statement Surface section 8

© 2019 Cenovus Energy Inc. April 15, 2019
52
Compliance confirmation
There were no non-compliance events related to EnCAID Approval 10440L in 2018

© 2019 Cenovus Energy Inc. April 15, 2019
53
Non-compliance discussion Surface section 9
54
Non-compliance discussion
There were no non-compliance events related to EnCAID Approval 10440L in 2018
© 2019 Cenovus Energy Inc. April 15, 2019
© 2019 Cenovus Energy Inc. April 15, 2019
55
Future plans Surface section 10

© 2019 Cenovus Energy Inc. April 15, 2019
56
Future plans
•Cenovus divested the EnCAID well and facilities effective September 2018 and plans to transfer the scheme approval to the new owner.
© 2019 Cenovus Energy Inc. April 15, 2019
57
Appendix
© 2019 Cenovus Energy Inc. April 15, 2019
58
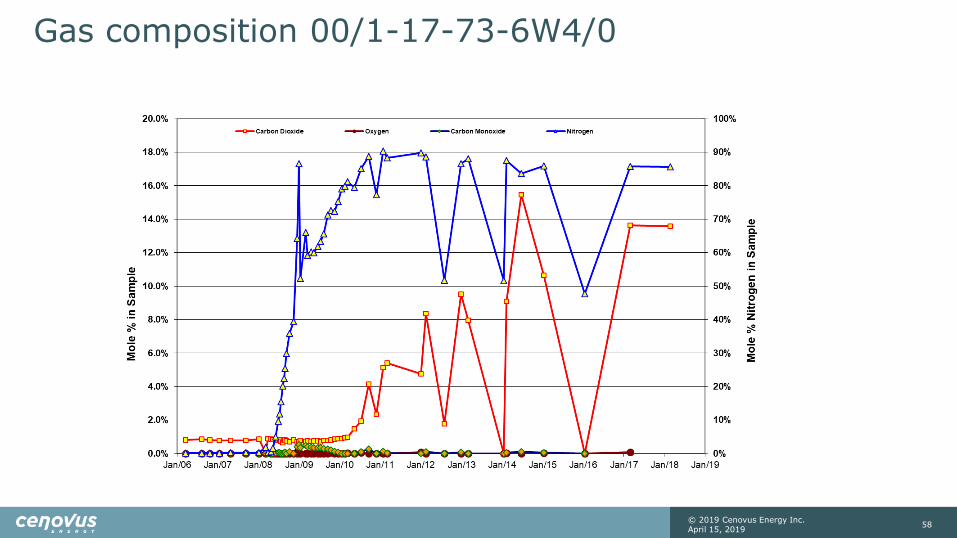
Gas composition 00/1-17-73-6W4/0

© 2019 Cenovus Energy Inc. April 15, 2019
59
Gas composition 00/2-16-73-6W4/0

© 2019 Cenovus Energy Inc. April 15, 2019
60
Gas composition 00/6-5-73-6W4/0

© 2019 Cenovus Energy Inc. April 15, 2019
61
Gas composition 00/6-6-73-6W4/0

© 2019 Cenovus Energy Inc. April 15, 2019
62
Gas composition 00/6-7-73-6W4/0

© 2019 Cenovus Energy Inc. April 15, 2019
63
Gas composition 00/7-8-73-6W4/0

© 2019 Cenovus Energy Inc. April 15, 2019
64
Gas composition 00/10-11-73-7W4/0

© 2019 Cenovus Energy Inc. April 15, 2019
65
Gas composition 00/10-12-73-7W4/0

© 2019 Cenovus Energy Inc. April 15, 2019
66
Gas composition 00/14-9-73-6W4/0
© 2019 Cenovus Energy Inc. April 15, 2019
67
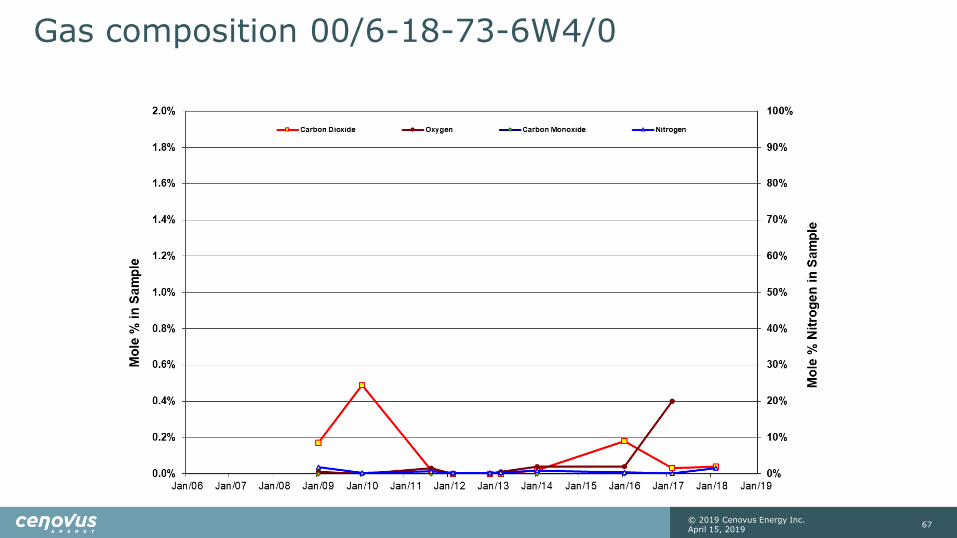
Gas composition 00/6-18-73-6W4/0

© 2019 Cenovus Energy Inc. April 15, 2019
68
Downhole instrumentation layout

© 2019 Cenovus Energy Inc. April 15, 2019
69
100/05-10-073-06W4 wellbore schematic
© 2019 Cenovus Energy Inc. April 15, 2019
70
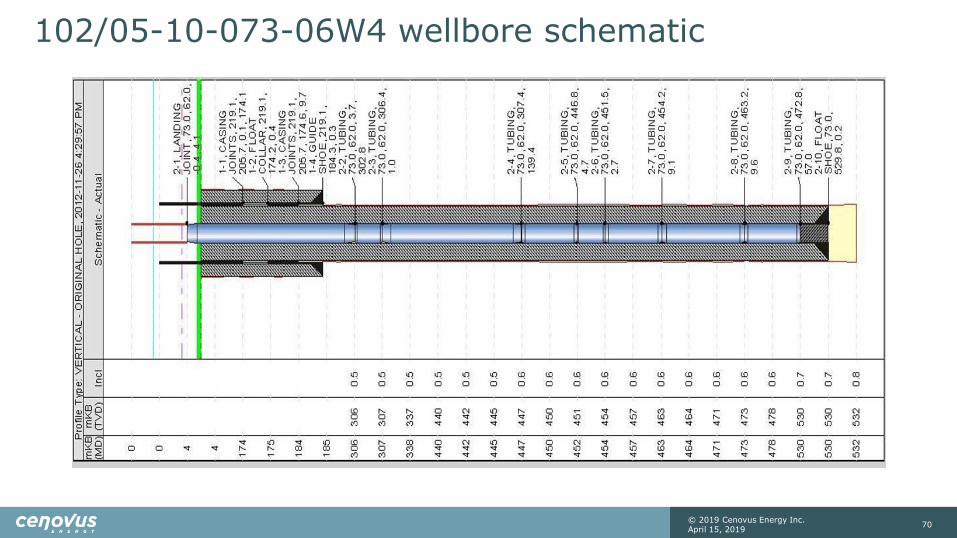
102/05-10-073-06W4 wellbore schematic
© 2019 Cenovus Energy Inc. April 15, 2019
71
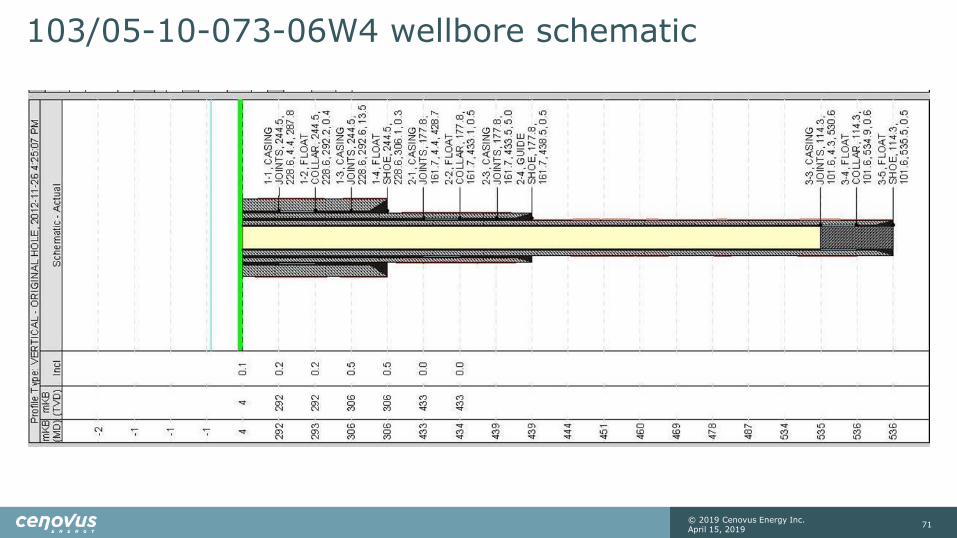
103/05-10-073-06W4 wellbore schematic