Embed Size (px)
Citation preview

Cenovus delivers strong operational performance in 2016
Higher oil sands production, lower costs
Calgary, Alberta (February 16, 2017) – Cenovus Energy Inc. (TSX: CVE) (NYSE: CVE) delivered strong, safe and reliable operating performance in 2016. The company increased its oil sands production compared with 2015 and achieved further cost efficiencies, including decreased operating and general and administrative (G&A) expenses as well as lower oil sands sustaining capital costs. The sustaining capital improvements have contributed to lower future development costs for Cenovus’s oil sands business. “Our operations performed exceptionally well in 2016, and we remained financially resilient through a difficult macro environment that included a 13-year low in benchmark oil prices in the first quarter,” said Brian Ferguson, Cenovus President & Chief Executive Officer. “Our continued focus on costs allowed us to maintain a strong balance sheet and execute our original business plan for the year with lower capital spending than we had planned. This has put us in an excellent position to pursue disciplined growth in 2017 and beyond.” Key 2016 developments
• Added oil sands production capacity of 80,000 barrels per day (bbls/d) gross • Increased oil sands production by 7% compared with 2015 • Reduced oil sands per-barrel non-fuel operating costs by 13% compared with 2015 • Increased proved reserves by 5% compared with 2015 • Funded Cenovus’s capital program and dividend, and generated free funds flow
(previously labelled “free cash flow”)* with West Texas Intermediate (WTI) averaging below US$45/bbl in 2016
• Exited the year with $3.7 billion in cash and $4 billion in undrawn credit facilities
2016 production & financial summary (for the period ended December 31) Production (before royalties)
2016 Q4
2015 Q4 % change 2016
Full year 2015
Full year % change
Oil sands (bbls/d) 164,396 139,413 18 149,693 140,320 7 Conventional oil1 (bbls/d) 55,155 60,143 -8 56,165 66,627 -16
Total oil (bbls/d) 219,551 199,556 10 205,858 206,947 -1
Natural gas (MMcf/d) 379 424 -11 394 441 -11
Financial ($ millions, except per share amounts)
Cash from operating activities 164 322 -49 861 1,474 -42 Adjusted funds flow2
(previously labelled “cash flow”)* 535 275 95 1,423 1,691 -16
Per share diluted 0.64 0.33 1.71 2.07 Operating earnings2 321 -438 -377 -403 Per share diluted 0.39 -0.53 -0.45 -0.49 Net earnings 91 -641 -545 618 Per share diluted 0.11 -0.77 -0.65 0.75 Capital investment 259 428 -39 1,026 1,714 -40
1 Includes natural gas liquids (NGLs). 2 Adjusted funds flow and operating earnings are non-GAAP measures. For more information, refer to the Non-GAAP Measures section of the Advisory at the end of this news release.
_____________________ *For more information on this and certain other changes related to disclosure of non-GAAP measures, refer to the Non-GAAP Measures section of the Advisory at the end of this news release.
Page 1 Q4 2016
Overview
Oil production In 2016, Cenovus achieved first oil at its Christina Lake phase F and Foster Creek phase G expansion projects. The expansions increased the company’s total oil sands production capacity by 26%, or 80,000 bbls/d gross, to 390,000 bbls/d gross. Incremental volumes from the new phases contributed to fourth quarter oil sands production, net to Cenovus, of more than 164,000 bbls/d and full-year production of nearly 150,000 bbls/d net, a 7% increase from full-year 2015. The ramp-up at both expansion phases is progressing well and is expected to be completed in 2017. The Christina Lake phase F expansion included the commissioning of a 100 megawatt natural gas fired cogeneration plant which provides reliable, energy-efficient power to the project. Conventional oil production in 2016 was more than 56,000 bbls/d, a 16% decrease from the previous year, largely due to expected natural declines and the company’s 2015 sale of its royalty interest and mineral fee title lands business. In 2016, Cenovus’s conventional oil and natural gas assets combined generated $374 million in operating margin (previously labelled “operating cash flow”)* net of capital investment to help support growth in the company’s oil sands business. Building on its successes in 2016, Cenovus will continue to pursue disciplined growth in 2017. The company plans to resume investment in its phase G expansion at Christina Lake. Cenovus anticipates the expansion can be completed with go-forward capital investment of between $16,000 and $18,000 per flowing barrel. Module assembly has already resumed for phase G, which has an expected design capacity of 50,000 bbls/d gross, and field construction is expected to ramp up to full activity by mid-year as modules are delivered to the site. First oil from phase G is expected in the second half of 2019. Cenovus has also launched a targeted conventional drilling program on the Palliser Block in southern Alberta, where the company has a large inventory of attractive short-cycle tight oil opportunities. To date, Cenovus has identified approximately 700 drilling locations and plans to spend approximately $160 million in 2017 to drill about 50 horizontal development wells and 60 stratigraphic wells at Palliser. At its Investor Day in June 2017, Cenovus intends to provide an update on its plans for Foster Creek phase H and Narrows Lake phase A, including expectations for capital costs and timing for each project. Foster Creek phase H has an expected design capacity of 30,000 bbls/d and Narrows Lake phase A has an expected design capacity of 45,000 bbls/d. The company continues to advance engineering work on the two deferred expansion projects using the same rigour that was applied to Christina Lake phase G. “We have the financial strength to reinvest in Foster Creek phase H and Narrows Lake phase A, once we’re confident we’ve defined the best possible development plans,” said Ferguson. “With two new expansion phases already ramping up, our planned construction of Christina Lake phase G and potential restarts at Foster Creek and Narrows Lake, we have a clear line of sight to five years of growth that would take our oil sands production capacity to more than half a million barrels per day gross.”
Page 2 Q4 2016
Cost reductions In 2016, Cenovus achieved significant reductions in its per-barrel oil operating costs. Oil sands operating costs were $8.91/bbl in 2016, a 12% decrease from the previous year, while non-fuel oil sands operating costs were $6.65/bbl, a 13% decline compared with 2015 and 30% lower than in 2014. At Cenovus’s conventional oil assets, despite expected production declines, per-unit operating costs continued to improve, falling 10% to $14.18/bbl compared with 2015 and 24% compared with 2014. “I’m extremely pleased with the progress we’ve made to date with our overall cost structure,” said Ferguson. “The cost reductions and operational improvements we’ve achieved over the past two years have enabled us to fund our capital program, pay our dividend and generate free funds flow in 2016 with WTI prices averaging below US$45 per barrel.” In 2016, Cenovus continued to achieve meaningful reductions in the capital required to sustain its base business and maintain ongoing production, particularly at its oil sands operations. The company had 2016 oil sands sustaining capital of approximately $7.00/bbl, a decrease of 33% from 2015 and 50% from 2014. This improvement in sustaining capital costs contributed to 2016 capital spending at the low end of Cenovus’s guidance and reduced future development costs across the company’s oil sands reserves and resources base. Cenovus had G&A costs of $326 million in 2016, down from $335 million in 2015. The 2016 G&A costs included a $61 million non-cash expense related to office building leases in Calgary that exceed Cenovus’s current and near-term requirements. Cenovus also had severance payments of $19 million in 2016 compared with $43 million in 2015. Excluding the lease-related and severance charges, G&A costs would have been $246 million in 2016, 16% lower than the previous year and 35% lower than in 2014. Financial performance Benchmark commodity prices remained volatile in 2016, with WTI falling to nearly US$26/bbl in the first quarter before gradually increasing to almost US$54/bbl by the end of the year. As a result, Cenovus received 12% less for its crude oil in 2016 compared with the previous year. The company also received 21% less for its natural gas than in 2015. This contributed to a 16% decline in adjusted funds flow to $1.4 billion. The Wood River and Borger refineries in the U.S., which are jointly owned with the operator, Phillips 66, had strong operational performance in 2016. Higher crude oil runs and refined product output partially offset a decline in refining and marketing operating margin that was primarily driven by a 32% decline in average market crack spreads compared with 2015. Operating margin from refining and marketing was $346 million in 2016, a decline of 10% from the previous year. Cenovus has an active hedging program to support cash outflows and help maintain financial resilience. As of December 31, 2016, the company had hedges in place on approximately 65,000 bbls/d of crude oil for 2017. About 39% of these barrels are hedged using costless collars, which set an average minimum price of US$44.84/bbl and average maximum price of US$56.47/bbl that the company will receive for its hedged oil. This limits downside risk on the hedged barrels while giving the company some ability to benefit in a rising price environment.
Page 3 Q4 2016
Board succession Michael A. Grandin is retiring as Chair of Cenovus’s Board of Directors at the conclusion of the company’s Annual General Meeting on April 26, 2017. At that time, longstanding Cenovus Board member Patrick D. Daniel will succeed Mr. Grandin as Chair of the Board of Directors. Mr. Grandin was appointed Chair of Cenovus’s Board of Directors when the company launched in 2009 and has also served as the Chair of the Board’s Nominating and Corporate Committee for all of that time. “Michael Grandin’s steadfast guidance of Cenovus since its earliest days has been invaluable to the success of our company. He’s positioned the Board and the company well as we continue our journey, and we wish him an equally rewarding retirement,” said Ferguson. “We’re fortunate that Patrick Daniel, a seasoned Cenovus Board member with a wealth of business experience, is able to seamlessly transition into the role of Chair.” Mr. Daniel has also served on Cenovus’s Board of Directors since the company’s inception and currently sits on its Audit, Human Resources and Compensation, and Nominating and Corporate Governance committees. He was previously President & Chief Executive Officer of Enbridge Inc. More information about Mr. Grandin, Mr. Daniel and Cenovus’s Board of Directors is available on the company’s website at cenovus.com under About us.
2016 and fourth quarter details Oil sands Foster Creek
• Production averaged 70,244 bbls/d net in 2016, 7% more than in 2015, following a targeted well maintenance program in the first half of the year and the start-up of phase G in the third quarter of 2016.
• In the fourth quarter, production averaged 81,588 bbls/d net, a 28% increase from the same period in 2015.
• Operating costs declined 16% to $10.55/bbl in 2016 from the previous year. Non-fuel operating costs were $8.09/bbl, a 17% decrease from 2015.
• The steam to oil ratio (SOR), the amount of steam needed to produce one barrel of oil, was 2.7 in 2016 compared with 2.5 in 2015.
Christina Lake
• Production averaged 79,449 bbls/d net in 2016, an increase of 6%, largely due to the start-up of expansion phase F, which began contributing volumes in the fourth quarter of 2016.
• In the fourth quarter, production averaged 82,808 bbls/d net, a 9% increase from the same period in 2015.
• Cenovus’s new 100 megawatt natural gas fired cogeneration plant began operating in the fourth quarter. Excess power not currently required for operations at Christina Lake is being sold into the Alberta electricity grid.
• Operating costs were $7.48/bbl in 2016, a 7% decline from a year earlier. Non-fuel operating costs were $5.40/bbl, 7% lower than in 2015.
• The SOR was 1.9 in 2016 compared with 1.7 a year earlier.
Page 4 Q4 2016

Conventional oil • Total conventional oil production decreased 16% to 56,165 bbls/d in 2016 compared
with the previous year, primarily due to expected natural reservoir declines. The 2015 sale of the company’s royalty interest and mineral fee title lands business also contributed to the year-over-year decrease. The divested assets produced an average of 2,555 bbls/d in 2015.
• Production was 55,155 bbls/d net in the fourth quarter, a decline of 8% from the same period in 2015.
• Despite expected production declines, operating costs were $14.18/bbl in 2016, 10% lower than in 2015.
Natural gas
• Natural gas production averaged 394 million cubic feet per day (MMcf/d) in 2016, down 11% from a year earlier, primarily due to expected natural declines. The 2015 sale of the company’s royalty interest and mineral fee title lands business also contributed to the year-over-year decrease in natural gas volumes.
• In the fourth quarter, natural gas production declined 11% to 379 MMcf/d compared with the same period in 2015.
• Despite expected production declines, unit operating costs fell 4% to $1.15 per thousand cubic feet (Mcf) in 2016 compared with a year earlier.
Downstream
• The Wood River Refinery in Illinois and Borger Refinery in Texas, which Cenovus jointly owns with the operator, Phillips 66, processed a combined average of 444,000 bbls/d gross of oil (97% utilization) in 2016, compared with 419,000 bbls/d gross in 2015 (91% utilization).
• Cenovus had refining and marketing operating margin of $346 million in 2016, compared with $385 million in 2015. The company’s refining operating margin is calculated on a first-in, first-out (FIFO) inventory accounting basis. Using the last-in, first-out (LIFO) accounting method employed by most U.S. refiners, Cenovus’s operating margin from refining and marketing would have been $108 million lower in 2016. In 2015, operating margin would have been $52 million higher on a LIFO reporting basis.
Financial Corporate and financial information
• Operating margin was $1.8 billion in 2016, a 28% decrease from 2015, largely due to lower commodity prices. The decrease was also due to lower realized risk management gains of $237 million, excluding refining and marketing, compared with gains of $613 million in 2015, as well as an 11% decline in natural gas sales volumes and lower operating margin from refining and marketing.
• Cash from operating activities and adjusted funds flow declined largely due to the decrease in operating margin, partially offset by cash tax recovery and lower workforce costs. In 2016, cash from operating activities declined 42% to $861 million and adjusted funds flow declined 16% to $1.4 billion compared with 2015.
• After investing just over $1 billion in 2016, Cenovus had free funds flow of $397 million, compared with a free funds flow shortfall of $23 million a year earlier.
• Cenovus had a 2016 operating loss of $377 million compared with an operating loss of $403 million in 2015. The smaller loss in 2016 was primarily due to a decline in
Page 5 Q4 2016

depreciation, depletion and amortization (DD&A) related to lower DD&A rates and asset impairments, and a decline in exploration expense.
• Cenovus had a net loss of $545 million in 2016. This compares with net earnings of $618 million in 2015 when the company recorded an after-tax gain of approximately $1.9 billion from the sale of its royalty interest and mineral fee title lands business.
• The company had G&A costs of $326 million in 2016, down from $335 million in 2015. The 2016 G&A costs included a $61 million non-cash expense related to office building leases in Calgary that exceed Cenovus’s current and near-term requirements. Cenovus also had severance payments of $19 million in 2016 compared with $43 million in 2015. Excluding the lease-related and severance charges, G&A costs would have been $246 million in 2016, 16% lower than the previous year and 35% lower than in 2014. The decrease from 2015 was primarily due to lower costs for workforce and information technology.
• The company ended 2016 with cash and cash equivalents of approximately $3.7 billion as well as $4 billion in undrawn capacity under its committed credit facility, and no debt maturities until the fourth quarter of 2019. At the end of 2016, Cenovus’s net debt to capitalization was 18% compared with 16% at the end of 2015. The company’s net debt to adjusted earnings before interest, taxes, depreciation and amortization (EBITDA) was 1.9 times on a trailing 12-month basis compared with 1.2 times at the end of 2015.
• For the first quarter of 2017, the Board of Directors has declared a dividend of $0.05 per share, payable on March 31, 2017 to common shareholders of record as of March 15, 2017. Based on the February 15, 2017 closing share price on the Toronto Stock Exchange of $17.97, this represents an annualized yield of about 1%. Declaration of dividends is at the sole discretion of the Board and will continue to be evaluated on a quarterly basis.
Reserves and resources All of Cenovus’s proved and probable reserves and resources recoverable using established technology are evaluated each year by independent qualified reserves evaluators (IQREs).
• At the end of 2016, Cenovus had total proved reserves of approximately 2.7 billion barrels of oil equivalent (BOE), an increase of 5% compared with 2015. Proved reserves additions of 221 million BOE included approximately 154 million barrels resulting from regulatory approval of an area expansion at Christina Lake, which converted probable reserves into proved reserves, and 61 million barrels from improved reservoir performance across the company’s oil sands business.
• Total proved plus probable reserves were relatively unchanged at 3.8 billion BOE, as reserves additions related to improved reservoir performance at Foster Creek and Christina Lake mostly offset production.
• Based on IQRE evaluation of Cenovus’s bitumen reserves, estimated future capital costs to develop the company’s remaining proved undeveloped bitumen reserves declined to approximately $8.00/bbl in 2016 compared with approximately $9.00/bbl the previous year.
• Cenovus’s 2016 proved reserves finding and development (F&D) costs were $3.49/BOE, excluding changes in future development costs, down 34% from $5.31/BOE in 2015, due to reduced capital spending. Three-year average F&D costs were $7.14/BOE, excluding changes in future development costs. The 2016 recycle ratio was 3.2 times.
• More details about Cenovus’s reserves and contingent resources are available under Financial Information in the Advisory. Further information about the company’s
Page 6 Q4 2016
Conference Call Today 9 a.m. Mountain Time (11 a.m. Eastern Time)
Cenovus will host a conference call today, February 16, 2017, starting at 9 a.m. MT (11 a.m. ET). To participate, please dial 888-231-8191 (toll-free in North America) or 647-427-7450 approximately 10 minutes prior to the conference call. A live audio webcast of the conference call will also be available via cenovus.com. The webcast will be archived for approximately 90 days.
reserves is also available in Cenovus’s Annual Information Form (AIF), while additional details about its resources can be found in the supplemental Statement of Contingent and Prospective Resources. These documents are available on SEDAR at sedar.com, EDGAR at sec.gov and Cenovus’s website at cenovus.com.
Year-end disclosure documents Today, Cenovus Energy Inc. is filing its audited Consolidated Financial Statements for the year ended December 31, 2016 as well as related Management’s Discussion and Analysis with Canadian securities regulatory authorities. Cenovus is also filing today its AIF for the year ended December 31, 2016, which includes disclosure relating to reserves data and other oil and gas information. In addition, the company is filing its Statement of Contingent and Prospective Resources as at December 31, 2016, which includes information relating to bitumen best estimate economic contingent resources and bitumen prospective resources. Cenovus is also filing its Annual Report on Form 40-F for the year ended December 31, 2016 with the U.S. Securities and Exchange Commission. Copies of these documents will be available today on SEDAR at sedar.com, EDGAR at sec.gov (for the Form 40-F), and the company's website at cenovus.com under Investors. They can also be requested by email at [email protected]. Other developments In December 2016, Cenovus announced it had been placed in the Leadership level of the annual CDP Climate Change Report. This global ranking recognizes actions the company has taken to manage climate change impacts within its operations and beyond. The score of A- positions Cenovus in the top quartile of all global companies assessed by CDP and as one of only two Canadian energy companies at the Leadership level. These results were announced on December 8, 2016 as part of CDP’s Canada Report.
ADVISORY FINANCIAL INFORMATION Basis of Presentation Cenovus reports financial results in Canadian dollars and presents production volumes on a net to Cenovus before royalties basis, unless otherwise stated. Cenovus prepares its financial statements in accordance with International Financial Reporting Standards (IFRS). Non-GAAP Measures This news release contains references to adjusted funds flow (previously labelled cash flow), operating earnings (loss), free funds flow (previously labelled free cash flow), net debt to adjusted EBITDA and net debt to capitalization. These are non-GAAP measures, which do not have standardized meanings and may not be comparable to similar measures presented by other issuers. Adjusted funds flow, operating earnings (loss) and free funds flow are
Page 7 Q4 2016

defined and reconciled to IFRS measures in the Financial Results section of the company's Management's Discussion and Analysis for the year ended December 31, 2016 (the “MD&A”). Net debt to adjusted EBITDA and net debt to capitalization are defined and reconciled to IFRS measures in the Liquidity and Capital Resources section of the MD&A. These non-GAAP measures are presented because they are used by management to analyze Cenovus’s liquidity and ability to generate funds to finance its operations. This information should not be considered in isolation or as a substitute for measures prepared in accordance with IFRS. For further information, refer to the MD&A. Cenovus previously identified operating cash flow (now relabelled operating margin) as a non-GAAP measure. However, the company has determined that this measure is more appropriately characterized as an additional subtotal, as it is found in note 1 of the company’s consolidated financial statements for the year ended December 31, 2016 (the “Financial Statements”). Cenovus has not changed the composition of the measure. For more information regarding operating margin, refer to note 1 of the Financial Statements. Oil and gas metrics F&D costs are calculated by dividing the sum of total exploration and development costs incurred in 2016 by the sum of total additions and revisions for proved reserves in the same period. Proved reserves additions and revisions for the period are determined by Cenovus's independent qualified reserves evaluators, effective December 31, 2016, and for purposes of determining F&D costs, exclude changes resulting from acquisitions, dispositions and production. F&D costs provide an indication of the unit cost of finding and developing new reserves. Recycle ratio is an approximate measure used to illustrate the value realized from selling a barrel of oil relative to the cost of adding a barrel of oil to reserves. Recycle ratio is defined as the Operating Netback (in $/BOE for the year) divided by the F&D (in $/BOE). Operating Netback is defined as production revenues, excluding realized gains and losses on commodity hedging, less royalties, production and mineral taxes, transportation and production expenses, calculated on a per BOE basis. Sustaining capital costs per barrel is defined as total oil sands capital investment excluding growth capital divided by total oil sands production capacity. It is used by Management to assess capital efficiency in maintaining oil sands production at capacity. F&D costs, recycle ratio and sustaining costs are oil and gas metrics. Management uses these metrics to evaluate Cenovus's performance over time. These metrics do not have standardized meanings and may not be comparable to similar measures presented by other issuers and may be misleading when making comparisons. F&D costs, recycle ratio and sustaining costs are historical measures and are not indicators of Cenovus’s future performance, which may vary materially. Barrels of Oil Equivalent Natural gas volumes have been converted to barrels of oil equivalent (BOE) on the basis of six Mcf to one barrel. BOE may be misleading, particularly if used in isolation. A conversion ratio of one bbl to six Mcf is based on an energy equivalency conversion method primarily applicable at the burner tip and does not represent value equivalency at the wellhead. Given that the value ratio based on the current price of crude oil compared with natural gas is
Page 8 Q4 2016
significantly different from the energy equivalency conversion ratio of 6:1, utilizing a conversion on a 6:1 basis is not an accurate reflection of value. Forward-Looking Information This news release contains certain forward-looking statements and other information (collectively “forward-looking information”) about Cenovus's current expectations, estimates and projections, made in light of the company's experience and perception of historical trends. Forward-looking information in this document is identified by words such as “anticipate”, “expect”, “estimate”, “plan”, “target”, “position”, “project”, “committed”, “can be”, “pursue”, “capacity”, “potential”, “may”, “on track”, “confidence” or similar expressions and includes suggestions of future outcomes, including statements about: milestones and schedules, including expected timing for oil sands expansion phases and associated expected production capacities; projections for 2017 and future years; forecast operating and financial results; planned capital expenditures; expected future production, including the timing, stability or growth thereof; our ability to preserve our financial resilience and plans and strategies with respect thereto; our expectations regarding growth from our planned oil sands expansions, construction and potential restarts, and future impacts to our oil sands production capacity; achieved and forecast cost reductions, including sustainability and expected impacts thereof; and expected impacts of our hedging program. Readers are cautioned not to place undue reliance on forward-looking information as our actual results may differ materially from those expressed or implied. Developing forward-looking information involves reliance on a number of assumptions and consideration of certain risks and uncertainties, some of which are specific to Cenovus and others that apply to the industry generally. The factors or assumptions on which the forward-looking information is based include: forecast oil and natural gas prices and other assumptions inherent in Cenovus’s current guidance, available at cenovus.com; projected capital investment levels, flexibility of capital spending plans and associated source of funding; future cost reductions; sustainability of cost reductions; expected condensate prices; estimates of quantities of oil, bitumen, natural gas and liquids from properties and other sources not currently classified as proved; future use and development of technology; ability to obtain necessary regulatory and partner approvals; successful and timely implementation of capital projects or stages thereof; the company's ability to generate sufficient cash to meet its current and future obligations; estimated abandonment and reclamation costs, including associated levies and regulations; and other risks and uncertainties described from time to time in the company's filings with securities regulatory authorities. 2017 guidance, as updated on December 8, 2016, assumes: Brent of US$48.75/bbl; WTI of US$47.25/bbl; WCS of US$31.50/bbl; NYMEX of US$3.00/MMBtu; AECO of $2.60/GJ; Chicago 3-2-1 crack spread of US$11.25/bbl; and an exchange rate of $0.74 US$/C$. The risk factors and uncertainties that could cause the company's actual results to differ materially include: volatility of and assumptions regarding oil and natural gas prices; the effectiveness of the company's risk management program, including the impact of derivative financial instruments, the success of hedging strategies and the sufficiency of liquidity position; accuracy of cost estimates; commodity prices, currency and interest rates; product supply and demand; market competition, including from alternative energy sources; risks inherent in Cenovus's marketing operations, including credit risks; exposure to counterparties and partners, including ability and willingness of such parties to satisfy contractual obligations in a timely manner; risks inherent in operation of the company's crude-by-rail terminal, including health, safety and environmental risks; maintaining desirable ratios of debt to adjusted EBITDA and net
Page 9 Q4 2016

debt to adjusted EBITDA as well as debt to capitalization and net debt to capitalization; ability to access various sources of debt and equity capital, generally, and on terms acceptable to Cenovus; ability to finance growth and sustaining capital expenditures; changes in credit ratings applicable to Cenovus or any of its securities; changes to dividend plans or strategy, including the dividend reinvestment plan; accuracy of reserves, resources and future production estimates; ability to replace and expand oil and gas reserves; ability to maintain relationships with partners and to successfully manage and operate the company's integrated business; reliability of assets, including in order to meet production targets; potential disruption or unexpected technical difficulties in developing new products and manufacturing processes; occurrence of unexpected events such as fires, severe weather conditions, explosions, blow-outs, equipment failures, transportation incidents and other accidents or similar events; refining and marketing margins; inflationary pressures on operating costs, including labour, natural gas and other energy sources used in oil sands processes; potential failure of products to achieve acceptance in the market; risks associated with fossil fuel industry reputation; unexpected cost increases or technical difficulties in constructing or modifying manufacturing or refining facilities; unexpected difficulties in producing, transporting or refining of crude oil into petroleum and chemical products; risks associated with technology and its application to Cenovus's business; risks associated with climate change; the timing and costs of well and pipeline construction; ability to secure adequate product transportation, including sufficient pipeline, crude-by-rail, marine or other alternate transportation, including to address any gaps caused by constraints in the pipeline system; availability of, and ability to attract and retain, critical talent; changes in labour relationships; changes in the regulatory framework in any of the locations in which Cenovus operates, including changes to the regulatory approval process and land-use designations, royalty, tax, environmental (including in relation to abandonment, reclamation and remediation costs, levies or liability recovery with respect thereto), greenhouse gas, carbon and other laws or regulations, or changes to the interpretation of such laws and regulations, as adopted or proposed, the impact thereof and the costs associated with compliance; the expected impact and timing of various accounting pronouncements, rule changes and standards on Cenovus's business, financial results and consolidated financial statements; changes in the general economic, market and business conditions; the political and economic conditions in the countries of operation; occurrence of unexpected events such as war, terrorist threats and the instability resulting therefrom; and risks associated with existing and potential future lawsuits and regulatory actions. Readers are cautioned that the foregoing lists are not exhaustive and are made as at the date hereof. For a discussion of Cenovus's material risk factors, see “Risk Factors” in the company's AIF or Form 40-F for the year ended December 31, 2016, available on SEDAR at sedar.com, EDGAR at sec.gov and the company's website at cenovus.com. TM denotes a trademark of Cenovus Energy Inc. Cenovus Energy Inc. Cenovus Energy Inc. is a Canadian integrated oil company. It is committed to applying fresh, progressive thinking to safely and responsibly unlock energy resources the world needs. Operations include oil sands projects in northern Alberta, which use specialized methods to drill and pump the oil to the surface, and established natural gas and oil production in Alberta and Saskatchewan. The company also has 50% ownership in two U.S. refineries. Cenovus shares trade under the symbol CVE, and are listed on the Toronto and New York stock exchanges. For more information, visit cenovus.com.
Page 10 Q4 2016
Find Cenovus on Facebook, Twitter, LinkedIn, YouTube and Instagram. CENOVUS CONTACTS: Investor Relations Kam Sandhar Vice-President, Investor Relations & Corporate Development 403-766-5883 Graham Ingram Manager, Investor Relations 403-766-2849
Media Brett Harris Media Lead 403-766-3420 Sonja Franklin Senior Advisor, News Media 403-766-7264 General media line 403-766-7751
Page 11 Q4 2016
Cenovus Energy Inc. 12 For the period ended December 31, 2016
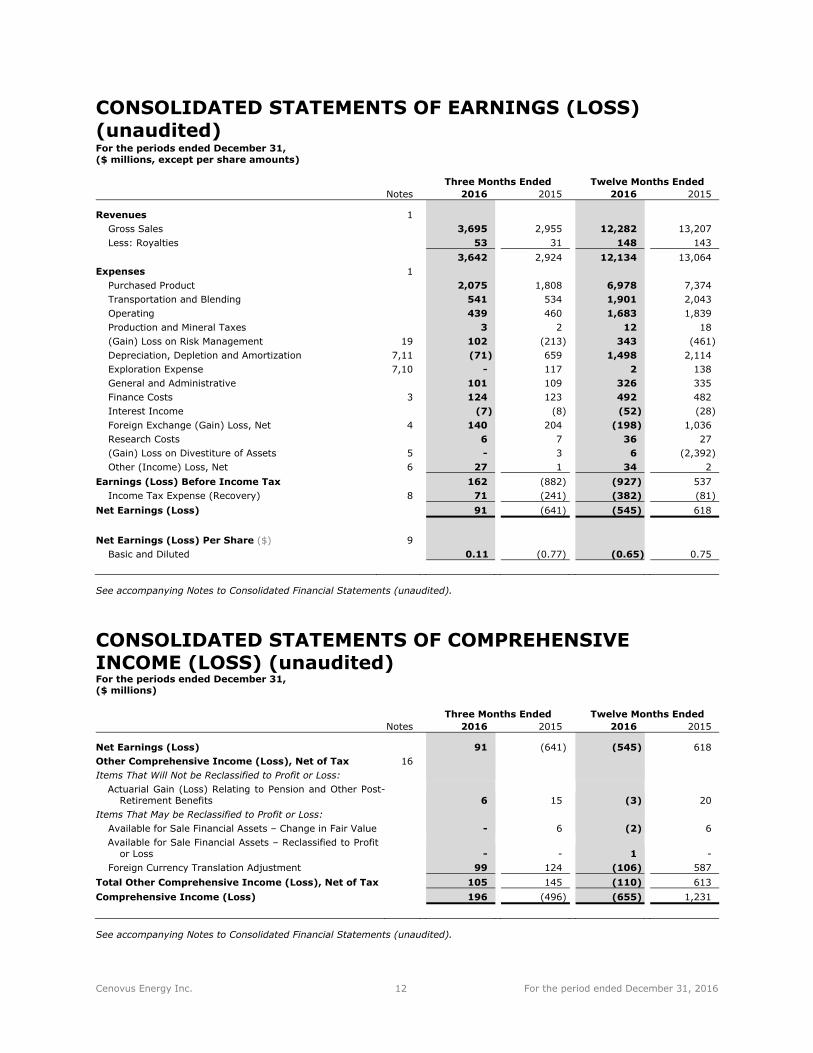
CONSOLIDATED STATEMENTS OF EARNINGS (LOSS) (unaudited)
For the periods ended December 31, ($ millions, except per share amounts)
Three Months Ended Twelve Months Ended Notes 2016 2015 2016 2015
Revenues 1 Gross Sales 3,695 2,955 12,282 13,207 Less: Royalties 53 31 148 143
3,642 2,924 12,134 13,064 Expenses 1
Purchased Product 2,075 1,808 6,978 7,374Transportation and Blending 541 534 1,901 2,043Operating 439 460 1,683 1,839Production and Mineral Taxes 3 2 12 18(Gain) Loss on Risk Management 19 102 (213) 343 (461) Depreciation, Depletion and Amortization 7,11 (71) 659 1,498 2,114Exploration Expense 7,10 - 117 2 138General and Administrative 101 109 326 335Finance Costs 3 124 123 492 482Interest Income (7) (8) (52) (28) Foreign Exchange (Gain) Loss, Net 4 140 204 (198) 1,036Research Costs 6 7 36 27(Gain) Loss on Divestiture of Assets 5 - 3 6 (2,392) Other (Income) Loss, Net 6 27 1 34 2
Earnings (Loss) Before Income Tax 162 (882) (927) 537Income Tax Expense (Recovery) 8 71 (241) (382) (81)
Net Earnings (Loss) 91 (641) (545) 618
Net Earnings (Loss) Per Share ($) 9 Basic and Diluted 0.11 (0.77) (0.65) 0.75
See accompanying Notes to Consolidated Financial Statements (unaudited).
CONSOLIDATED STATEMENTS OF COMPREHENSIVE INCOME (LOSS) (unaudited) For the periods ended December 31, ($ millions)
Three Months Ended Twelve Months Ended Notes 2016 2015 2016 2015
Net Earnings (Loss) 91 (641) (545) 618Other Comprehensive Income (Loss), Net of Tax 16 Items That Will Not be Reclassified to Profit or Loss:
Actuarial Gain (Loss) Relating to Pension and Other Post-Retirement Benefits 6 15 (3) 20
Items That May be Reclassified to Profit or Loss: Available for Sale Financial Assets – Change in Fair Value - 6 (2) 6Available for Sale Financial Assets – Reclassified to Profit
or Loss - - 1 -Foreign Currency Translation Adjustment 99 124 (106) 587
Total Other Comprehensive Income (Loss), Net of Tax 105 145 (110) 613Comprehensive Income (Loss) 196 (496) (655) 1,231
See accompanying Notes to Consolidated Financial Statements (unaudited).
Cenovus Energy Inc. 13 For the period ended December 31, 2016
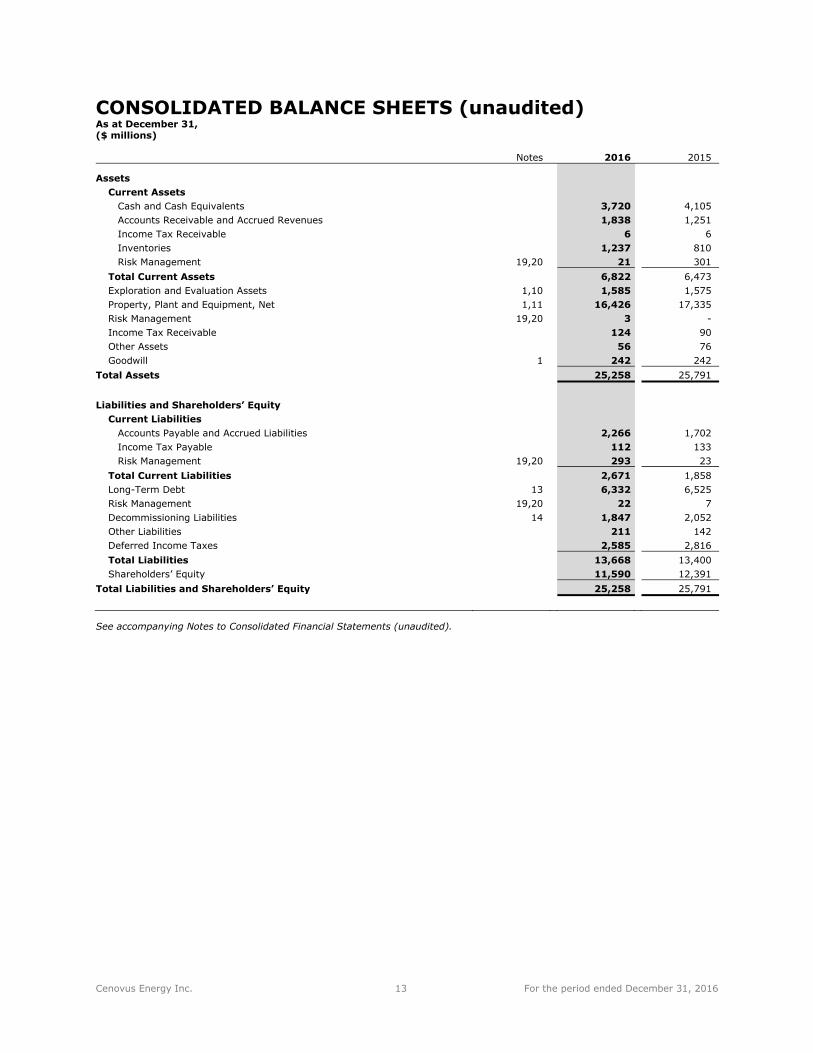
CONSOLIDATED BALANCE SHEETS (unaudited) As at December 31, ($ millions)
Notes 2016 2015
Assets Current Assets
Cash and Cash Equivalents 3,720 4,105 Accounts Receivable and Accrued Revenues 1,838 1,251 Income Tax Receivable 6 6 Inventories 1,237 810 Risk Management 19,20 21 301
Total Current Assets 6,822 6,473 Exploration and Evaluation Assets 1,10 1,585 1,575 Property, Plant and Equipment, Net 1,11 16,426 17,335 Risk Management 19,20 3 - Income Tax Receivable 124 90 Other Assets 56 76 Goodwill 1 242 242
Total Assets 25,258 25,791
Liabilities and Shareholders’ Equity Current Liabilities
Accounts Payable and Accrued Liabilities 2,266 1,702 Income Tax Payable 112 133 Risk Management 19,20 293 23
Total Current Liabilities 2,671 1,858 Long-Term Debt 13 6,332 6,525 Risk Management 19,20 22 7 Decommissioning Liabilities 14 1,847 2,052 Other Liabilities 211 142 Deferred Income Taxes 2,585 2,816 Total Liabilities 13,668 13,400 Shareholders’ Equity 11,590 12,391
Total Liabilities and Shareholders’ Equity 25,258 25,791
See accompanying Notes to Consolidated Financial Statements (unaudited).

Cenovus Energy Inc. 14 For the period ended December 31, 2016
CONSOLIDATED STATEMENTS OF SHAREHOLDERS’ EQUITY (unaudited) ($ millions)
Share Capital
Paid in Surplus
Retained Earnings AOCI (1) Total
(Note 15) (Note 16)
As at December 31, 2014 3,889 4,291 1,599 407 10,186 Net Earnings - - 618 - 618 Other Comprehensive Income - - - 613 613 Total Comprehensive Income - - 618 613 1,231 Common Shares Issued for Cash 1,463 - - - 1,463 Common Shares Issued Pursuant to Dividend
Reinvestment Plan 182 - - - 182 Stock-Based Compensation Expense - 39 - - 39 Dividends on Common Shares - - (710) - (710)
As at December 31, 2015 5,534 4,330 1,507 1,020 12,391 Net Earnings (Loss) - - (545) - (545) Other Comprehensive Income (Loss) - - - (110) (110) Total Comprehensive Income (Loss) - - (545) (110) (655) Stock-Based Compensation Expense - 20 - - 20 Dividends on Common Shares - - (166) - (166)
As at December 31, 2016 5,534 4,350 796 910 11,590
(1) Accumulated Other Comprehensive Income (Loss).
See accompanying Notes to Consolidated Financial Statements (unaudited).

Cenovus Energy Inc. 15 For the period ended December 31, 2016
CONSOLIDATED STATEMENTS OF CASH FLOWS (unaudited) For the periods ended December 31, ($ millions)
Three Months Ended Twelve Months Ended Notes 2016 2015 2016 2015
Operating Activities Net Earnings (Loss) 91 (641) (545) 618Depreciation, Depletion and Amortization 7,11 (71) 659 1,498 2,114Exploration Expense 7,10 - 117 2 138Deferred Income Taxes 8 144 (139) (209) (655) Unrealized (Gain) Loss on Risk Management 19 114 26 554 195Unrealized Foreign Exchange (Gain) Loss 4 152 219 (189) 1,097(Gain) Loss on Divestiture of Assets 5 - 3 6 (2,392) Current Tax on Divestiture of Assets 5 - - - 391Unwinding of Discount on Decommissioning Liabilities 3,14 33 32 130 126Onerous Contract Provisions, Net of Cash Paid 27 - 53 -Other Asset Impairments 6 23 - 30 -Other 22 (1) 93 59Net Change in Other Assets and Liabilities (32) (26) (91) (107) Net Change in Non-Cash Working Capital (339) 73 (471) (110) Cash From Operating Activities 164 322 861 1,474
Investing Activities Capital Expenditures – Exploration and Evaluation Assets 10 (11) (21) (67) (138) Capital Expenditures – Property, Plant and Equipment 11 (248) (406) (967) (1,576) Acquisition 12 - (4) - (84) Proceeds From Divestiture of Assets 5 - (1) 8 3,344Current Tax on Divestiture of Assets 5 - - - (391) Net Change in Investments and Other (1) 3 (1) 3Net Change in Non-Cash Working Capital 16 (40) (52) (270) Cash From (Used in) Investing Activities (244) (469) (1,079) 888
Net Cash Provided (Used) Before Financing Activities (80) (147) (218) 2,362
Financing Activities Net Issuance (Repayment) of Short-Term Borrowings - (6) - (25) Common Shares Issued, Net of Issuance Costs - - - 1,449Dividends Paid on Common Shares 9 (42) (132) (166) (528) Other (1) - (2) (2) Cash From (Used in) Financing Activities (43) (138) (168) 894
Foreign Exchange Gain (Loss) on Cash and Cash Equivalents Held in Foreign Currency (7) (11) 1 (34)
Increase (Decrease) in Cash and Cash Equivalents (130) (296) (385) 3,222Cash and Cash Equivalents, Beginning of Period 3,850 4,401 4,105 883Cash and Cash Equivalents, End of Period 3,720 4,105 3,720 4,105
See accompanying Notes to Consolidated Financial Statements (unaudited).
NOTES TO CONSOLIDATED FINANCIAL STATEMENTS (unaudited) All amounts in $ millions, unless otherwise indicated For the period ended December 31, 2016
Cenovus Energy Inc. 16 For the period ended December 31, 2016
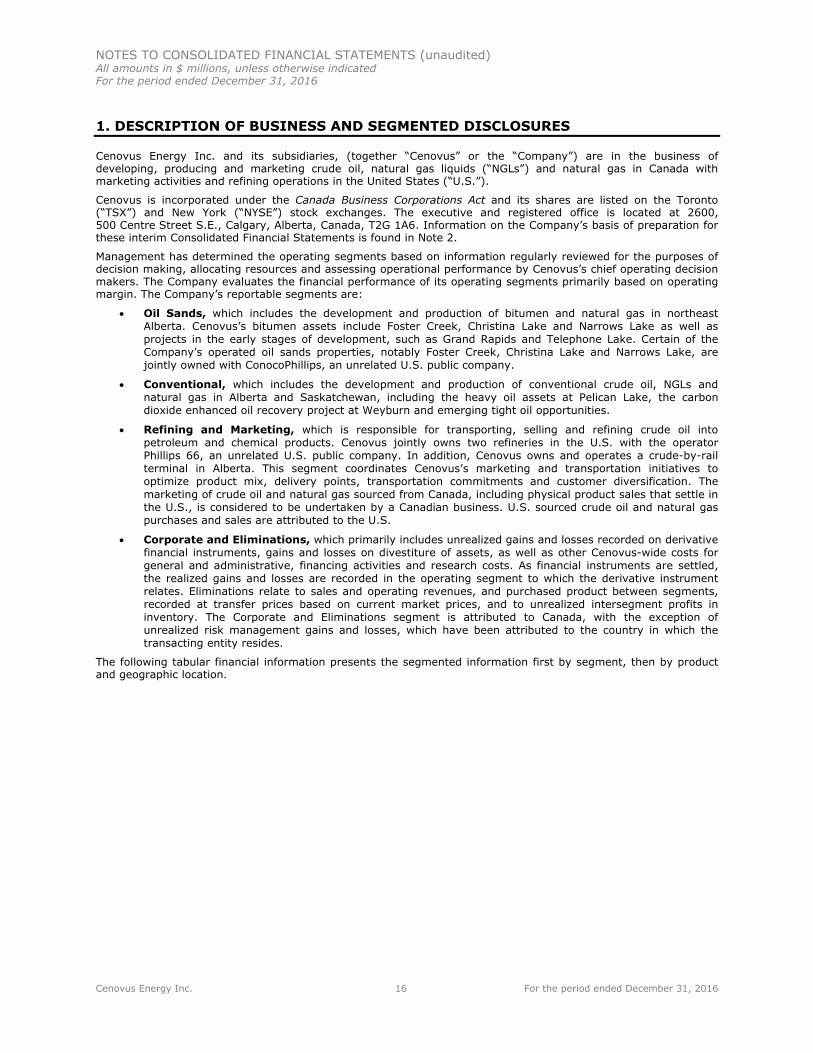
1. DESCRIPTION OF BUSINESS AND SEGMENTED DISCLOSURES
Cenovus Energy Inc. and its subsidiaries, (together “Cenovus” or the “Company”) are in the business of developing, producing and marketing crude oil, natural gas liquids (“NGLs”) and natural gas in Canada with marketing activities and refining operations in the United States (“U.S.”).
Cenovus is incorporated under the Canada Business Corporations Act and its shares are listed on the Toronto (“TSX”) and New York (“NYSE”) stock exchanges. The executive and registered office is located at 2600, 500 Centre Street S.E., Calgary, Alberta, Canada, T2G 1A6. Information on the Company’s basis of preparation for these interim Consolidated Financial Statements is found in Note 2.
Management has determined the operating segments based on information regularly reviewed for the purposes of decision making, allocating resources and assessing operational performance by Cenovus’s chief operating decision makers. The Company evaluates the financial performance of its operating segments primarily based on operating margin. The Company’s reportable segments are:
Oil Sands, which includes the development and production of bitumen and natural gas in northeastAlberta. Cenovus’s bitumen assets include Foster Creek, Christina Lake and Narrows Lake as well asprojects in the early stages of development, such as Grand Rapids and Telephone Lake. Certain of theCompany’s operated oil sands properties, notably Foster Creek, Christina Lake and Narrows Lake, arejointly owned with ConocoPhillips, an unrelated U.S. public company.
Conventional, which includes the development and production of conventional crude oil, NGLs andnatural gas in Alberta and Saskatchewan, including the heavy oil assets at Pelican Lake, the carbondioxide enhanced oil recovery project at Weyburn and emerging tight oil opportunities.
Refining and Marketing, which is responsible for transporting, selling and refining crude oil intopetroleum and chemical products. Cenovus jointly owns two refineries in the U.S. with the operatorPhillips 66, an unrelated U.S. public company. In addition, Cenovus owns and operates a crude-by-railterminal in Alberta. This segment coordinates Cenovus’s marketing and transportation initiatives tooptimize product mix, delivery points, transportation commitments and customer diversification. Themarketing of crude oil and natural gas sourced from Canada, including physical product sales that settle inthe U.S., is considered to be undertaken by a Canadian business. U.S. sourced crude oil and natural gaspurchases and sales are attributed to the U.S.
Corporate and Eliminations, which primarily includes unrealized gains and losses recorded on derivativefinancial instruments, gains and losses on divestiture of assets, as well as other Cenovus-wide costs forgeneral and administrative, financing activities and research costs. As financial instruments are settled,the realized gains and losses are recorded in the operating segment to which the derivative instrumentrelates. Eliminations relate to sales and operating revenues, and purchased product between segments,recorded at transfer prices based on current market prices, and to unrealized intersegment profits ininventory. The Corporate and Eliminations segment is attributed to Canada, with the exception ofunrealized risk management gains and losses, which have been attributed to the country in which thetransacting entity resides.
The following tabular financial information presents the segmented information first by segment, then by product and geographic location.

NOTES TO CONSOLIDATED FINANCIAL STATEMENTS (unaudited) All amounts in $ millions, unless otherwise indicated For the period ended December 31, 2016
Cenovus Energy Inc. 17 For the period ended December 31, 2016
A) Results of Operations – Segment and Operational Information
Oil Sands Conventional Refining and Marketing For the three months ended December 31, 2016 2015 2016 2015 2016 2015
Revenues Gross Sales 957 651 369 351 2,477 2,030 Less: Royalties 2 3 51 28 - -
955 648 318 323 2,477 2,030 Expenses
Purchased Product - - - - 2,181 1,883 Transportation and Blending 493 478 50 58 - -Operating 142 129 113 130 185 203Production and Mineral Taxes - - 3 2 - -(Gain) Loss on Risk Management (14) (152) (1) (71) 3 (16)
Operating Margin (1) 334 193 153 204 108 (40) Depreciation, Depletion and Amortization 170 189 (310) 403 54 51Exploration Expense - 67 - 50 - -
Segment Income (Loss) 164 (63) 463 (249) 54 (91)
(1) Previously labelled Operating Cash Flow.
Corporate and Eliminations Consolidated
For the three months ended December 31, 2016 2015 2016 2015
Revenues Gross Sales (108) (77) 3,695 2,955 Less: Royalties - - 53 31
(108) (77) 3,642 2,924 Expenses
Purchased Product (106) (75) 2,075 1,808 Transportation and Blending (2) (2) 541 534Operating (1) (2) 439 460Production and Mineral Taxes - - 3 2(Gain) Loss on Risk Management 114 26 102 (213) Depreciation, Depletion and Amortization 15 16 (71) 659Exploration Expense - - - 117
Segment Income (Loss) (128) (40) 553 (443) General and Administrative 101 109 101 109Finance Costs 124 123 124 123Interest Income (7) (8) (7) (8) Foreign Exchange (Gain) Loss, Net 140 204 140 204Research Costs 6 7 6 7(Gain) Loss on Divestiture of Assets - 3 - 3Other (Income) Loss, Net 27 1 27 1
391 439 391 439Earnings (Loss) Before Income Tax 162 (882)
Income Tax Expense (Recovery) 71 (241) Net Earnings (Loss) 91 (641)
NOTES TO CONSOLIDATED FINANCIAL STATEMENTS (unaudited) All amounts in $ millions, unless otherwise indicated For the period ended December 31, 2016
Cenovus Energy Inc. 18 For the period ended December 31, 2016
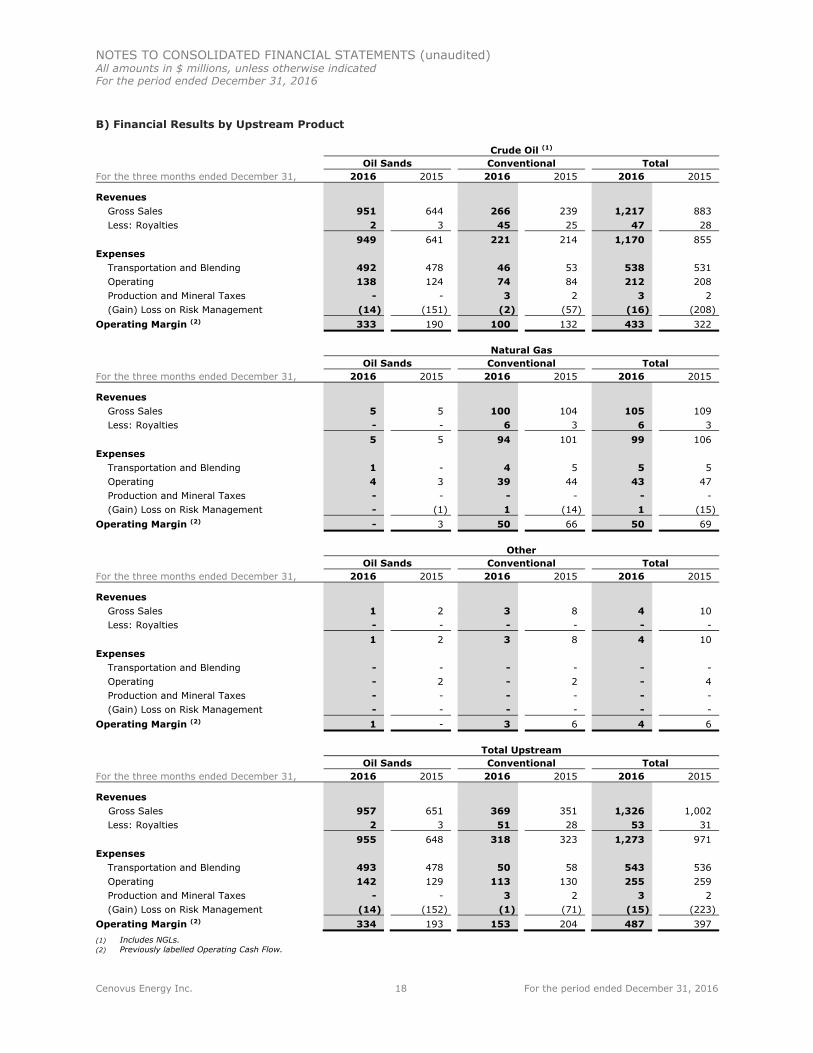
B) Financial Results by Upstream Product
Crude Oil (1) Oil Sands Conventional Total
For the three months ended December 31, 2016 2015 2016 2015 2016 2015
Revenues Gross Sales 951 644 266 239 1,217 883Less: Royalties 2 3 45 25 47 28
949 641 221 214 1,170 855Expenses
Transportation and Blending 492 478 46 53 538 531Operating 138 124 74 84 212 208Production and Mineral Taxes - - 3 2 3 2(Gain) Loss on Risk Management (14) (151) (2) (57) (16) (208)
Operating Margin (2) 333 190 100 132 433 322
Natural Gas Oil Sands Conventional Total
For the three months ended December 31, 2016 2015 2016 2015 2016 2015
Revenues Gross Sales 5 5 100 104 105 109Less: Royalties - - 6 3 6 3
5 5 94 101 99 106Expenses
Transportation and Blending 1 - 4 5 5 5Operating 4 3 39 44 43 47Production and Mineral Taxes - - - - - -(Gain) Loss on Risk Management - (1) 1 (14) 1 (15)
Operating Margin (2) - 3 50 66 50 69
Other Oil Sands Conventional Total
For the three months ended December 31, 2016 2015 2016 2015 2016 2015
Revenues Gross Sales 1 2 3 8 4 10Less: Royalties - - - - - -
1 2 3 8 4 10Expenses
Transportation and Blending - - - - - -Operating - 2 - 2 - 4Production and Mineral Taxes - - - - - -(Gain) Loss on Risk Management - - - - - -
Operating Margin (2) 1 - 3 6 4 6
Total Upstream Oil Sands Conventional Total
For the three months ended December 31, 2016 2015 2016 2015 2016 2015
Revenues Gross Sales 957 651 369 351 1,326 1,002 Less: Royalties 2 3 51 28 53 31
955 648 318 323 1,273 971Expenses
Transportation and Blending 493 478 50 58 543 536Operating 142 129 113 130 255 259Production and Mineral Taxes - - 3 2 3 2(Gain) Loss on Risk Management (14) (152) (1) (71) (15) (223)
Operating Margin (2) 334 193 153 204 487 397(1) Includes NGLs. (2) Previously labelled Operating Cash Flow.
NOTES TO CONSOLIDATED FINANCIAL STATEMENTS (unaudited) All amounts in $ millions, unless otherwise indicated For the period ended December 31, 2016
Cenovus Energy Inc. 19 For the period ended December 31, 2016
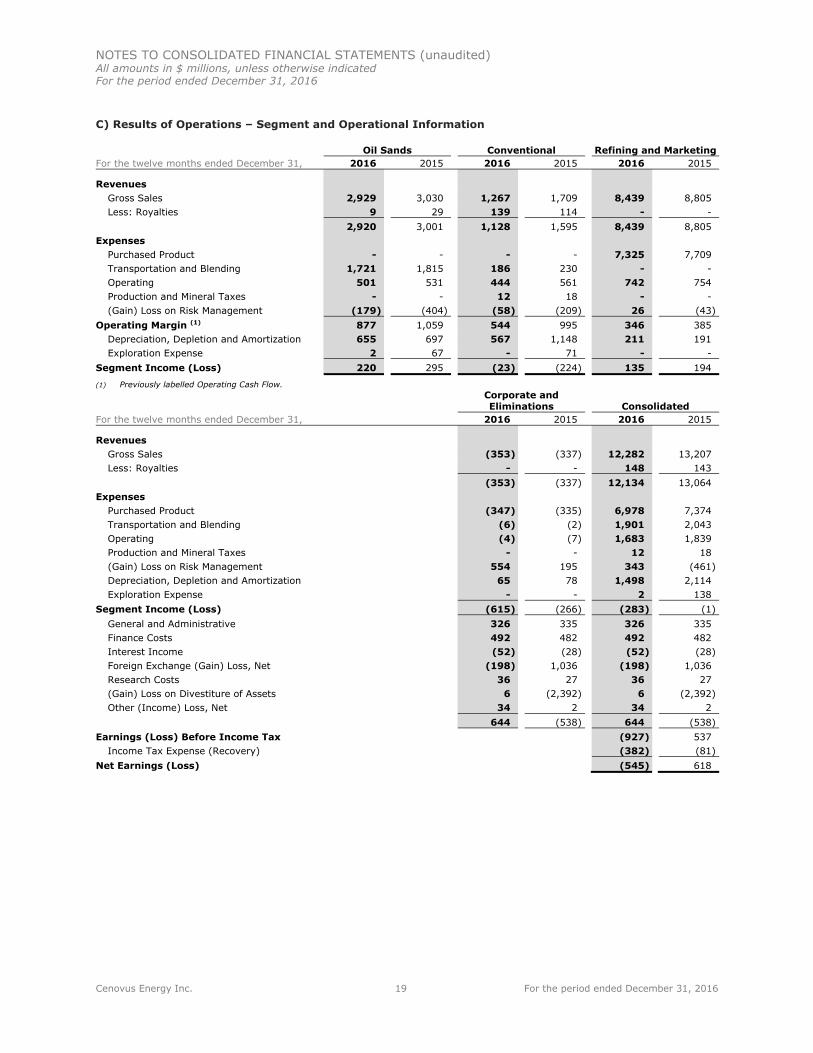
C) Results of Operations – Segment and Operational Information
Oil Sands Conventional Refining and Marketing For the twelve months ended December 31, 2016 2015 2016 2015 2016 2015
Revenues Gross Sales 2,929 3,030 1,267 1,709 8,439 8,805 Less: Royalties 9 29 139 114 - -
2,920 3,001 1,128 1,595 8,439 8,805 Expenses
Purchased Product - - - - 7,325 7,709 Transportation and Blending 1,721 1,815 186 230 - -Operating 501 531 444 561 742 754Production and Mineral Taxes - - 12 18 - -(Gain) Loss on Risk Management (179) (404) (58) (209) 26 (43)
Operating Margin (1) 877 1,059 544 995 346 385Depreciation, Depletion and Amortization 655 697 567 1,148 211 191Exploration Expense 2 67 - 71 - -
Segment Income (Loss) 220 295 (23) (224) 135 194
(1) Previously labelled Operating Cash Flow.
Corporate and Eliminations Consolidated
For the twelve months ended December 31, 2016 2015 2016 2015
Revenues Gross Sales (353) (337) 12,282 13,207 Less: Royalties - - 148 143
(353) (337) 12,134 13,064 Expenses
Purchased Product (347) (335) 6,978 7,374 Transportation and Blending (6) (2) 1,901 2,043 Operating (4) (7) 1,683 1,839 Production and Mineral Taxes - - 12 18(Gain) Loss on Risk Management 554 195 343 (461) Depreciation, Depletion and Amortization 65 78 1,498 2,114 Exploration Expense - - 2 138
Segment Income (Loss) (615) (266) (283) (1) General and Administrative 326 335 326 335Finance Costs 492 482 492 482Interest Income (52) (28) (52) (28) Foreign Exchange (Gain) Loss, Net (198) 1,036 (198) 1,036 Research Costs 36 27 36 27(Gain) Loss on Divestiture of Assets 6 (2,392) 6 (2,392) Other (Income) Loss, Net 34 2 34 2
644 (538) 644 (538) Earnings (Loss) Before Income Tax (927) 537
Income Tax Expense (Recovery) (382) (81) Net Earnings (Loss) (545) 618
NOTES TO CONSOLIDATED FINANCIAL STATEMENTS (unaudited) All amounts in $ millions, unless otherwise indicated For the period ended December 31, 2016
Cenovus Energy Inc. 20 For the period ended December 31, 2016
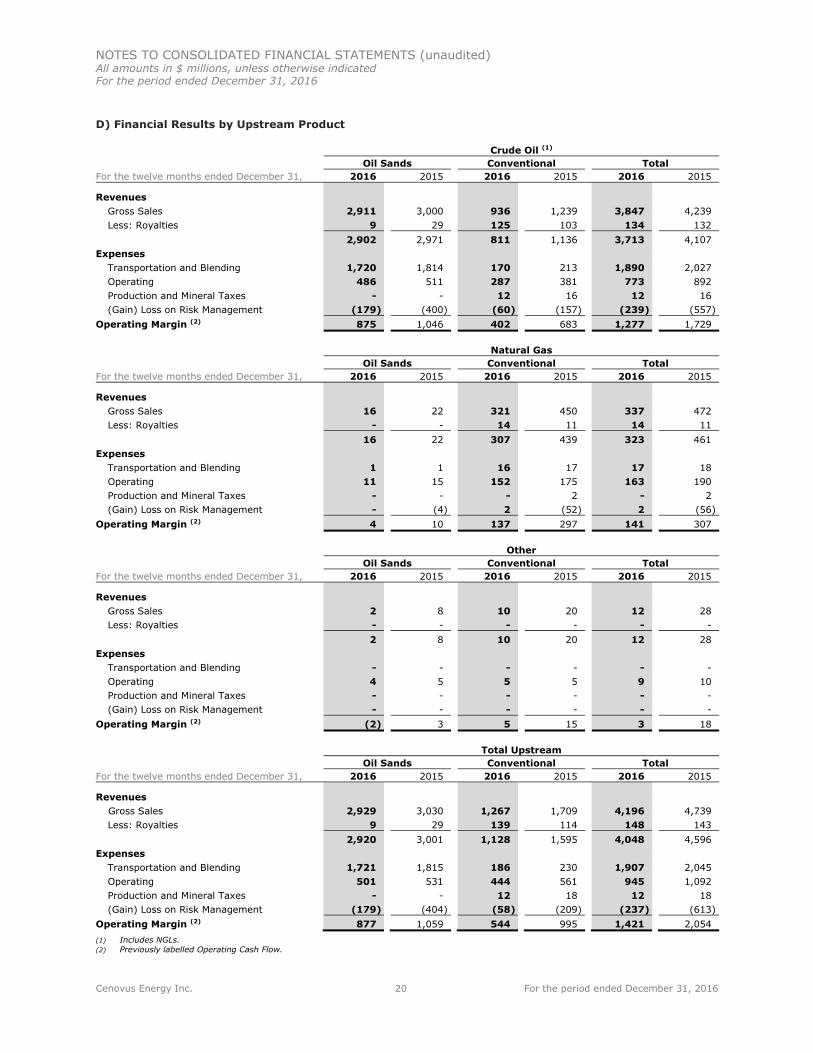
D) Financial Results by Upstream Product
Crude Oil (1) Oil Sands Conventional Total
For the twelve months ended December 31, 2016 2015 2016 2015 2016 2015
Revenues Gross Sales 2,911 3,000 936 1,239 3,847 4,239 Less: Royalties 9 29 125 103 134 132
2,902 2,971 811 1,136 3,713 4,107 Expenses
Transportation and Blending 1,720 1,814 170 213 1,890 2,027 Operating 486 511 287 381 773 892Production and Mineral Taxes - - 12 16 12 16(Gain) Loss on Risk Management (179) (400) (60) (157) (239) (557)
Operating Margin (2) 875 1,046 402 683 1,277 1,729
Natural Gas Oil Sands Conventional Total
For the twelve months ended December 31, 2016 2015 2016 2015 2016 2015
Revenues Gross Sales 16 22 321 450 337 472Less: Royalties - - 14 11 14 11
16 22 307 439 323 461Expenses
Transportation and Blending 1 1 16 17 17 18Operating 11 15 152 175 163 190Production and Mineral Taxes - - - 2 - 2(Gain) Loss on Risk Management - (4) 2 (52) 2 (56)
Operating Margin (2) 4 10 137 297 141 307
Other Oil Sands Conventional Total
For the twelve months ended December 31, 2016 2015 2016 2015 2016 2015
Revenues Gross Sales 2 8 10 20 12 28Less: Royalties - - - - - -
2 8 10 20 12 28Expenses
Transportation and Blending - - - - - -Operating 4 5 5 5 9 10Production and Mineral Taxes - - - - - -(Gain) Loss on Risk Management - - - - - -
Operating Margin (2) (2) 3 5 15 3 18
Total Upstream Oil Sands Conventional Total
For the twelve months ended December 31, 2016 2015 2016 2015 2016 2015
Revenues Gross Sales 2,929 3,030 1,267 1,709 4,196 4,739 Less: Royalties 9 29 139 114 148 143
2,920 3,001 1,128 1,595 4,048 4,596 Expenses
Transportation and Blending 1,721 1,815 186 230 1,907 2,045 Operating 501 531 444 561 945 1,092 Production and Mineral Taxes - - 12 18 12 18(Gain) Loss on Risk Management (179) (404) (58) (209) (237) (613)
Operating Margin (2) 877 1,059 544 995 1,421 2,054 (1) Includes NGLs. (2) Previously labelled Operating Cash Flow.
NOTES TO CONSOLIDATED FINANCIAL STATEMENTS (unaudited) All amounts in $ millions, unless otherwise indicated For the period ended December 31, 2016
Cenovus Energy Inc. 21 For the period ended December 31, 2016
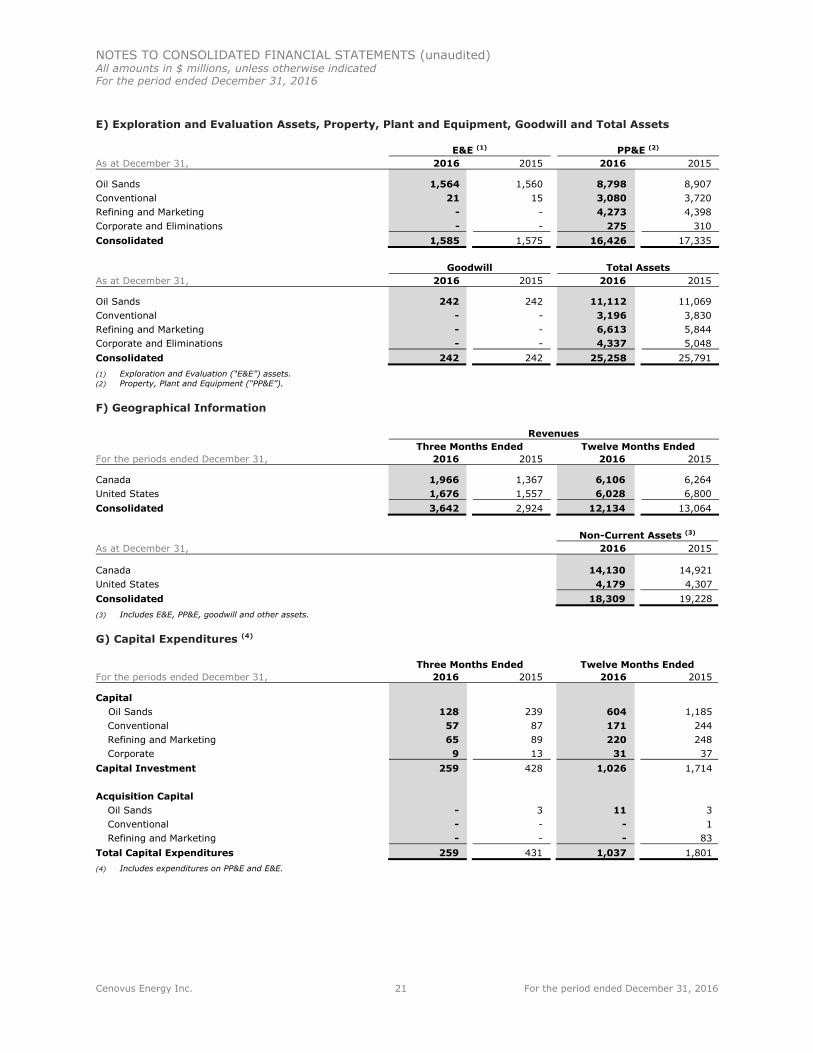
E) Exploration and Evaluation Assets, Property, Plant and Equipment, Goodwill and Total Assets
E&E (1) PP&E (2) As at December 31, 2016 2015 2016 2015
Oil Sands 1,564 1,560 8,798 8,907Conventional 21 15 3,080 3,720 Refining and Marketing - - 4,273 4,398 Corporate and Eliminations - - 275 310 Consolidated 1,585 1,575 16,426 17,335
Goodwill Total Assets As at December 31, 2016 2015 2016 2015
Oil Sands 242 242 11,112 11,069Conventional - - 3,196 3,830 Refining and Marketing - - 6,613 5,844 Corporate and Eliminations - - 4,337 5,048 Consolidated 242 242 25,258 25,791(1) Exploration and Evaluation (“E&E”) assets. (2) Property, Plant and Equipment (“PP&E”).
F) Geographical Information
Revenues Three Months Ended Twelve Months Ended
For the periods ended December 31, 2016 2015 2016 2015
Canada 1,966 1,367 6,106 6,264 United States 1,676 1,557 6,028 6,800 Consolidated 3,642 2,924 12,134 13,064
Non-Current Assets (3) As at December 31, 2016 2015
Canada 14,130 14,921 United States 4,179 4,307 Consolidated 18,309 19,228(3) Includes E&E, PP&E, goodwill and other assets.
G) Capital Expenditures (4)
Three Months Ended Twelve Months Ended For the periods ended December 31, 2016 2015 2016 2015
Capital Oil Sands 128 239 604 1,185 Conventional 57 87 171 244 Refining and Marketing 65 89 220 248 Corporate 9 13 31 37
Capital Investment 259 428 1,026 1,714
Acquisition Capital Oil Sands - 3 11 3 Conventional - - - 1 Refining and Marketing - - - 83
Total Capital Expenditures 259 431 1,037 1,801 (4) Includes expenditures on PP&E and E&E.
NOTES TO CONSOLIDATED FINANCIAL STATEMENTS (unaudited) All amounts in $ millions, unless otherwise indicated For the period ended December 31, 2016
Cenovus Energy Inc. 22 For the period ended December 31, 2016
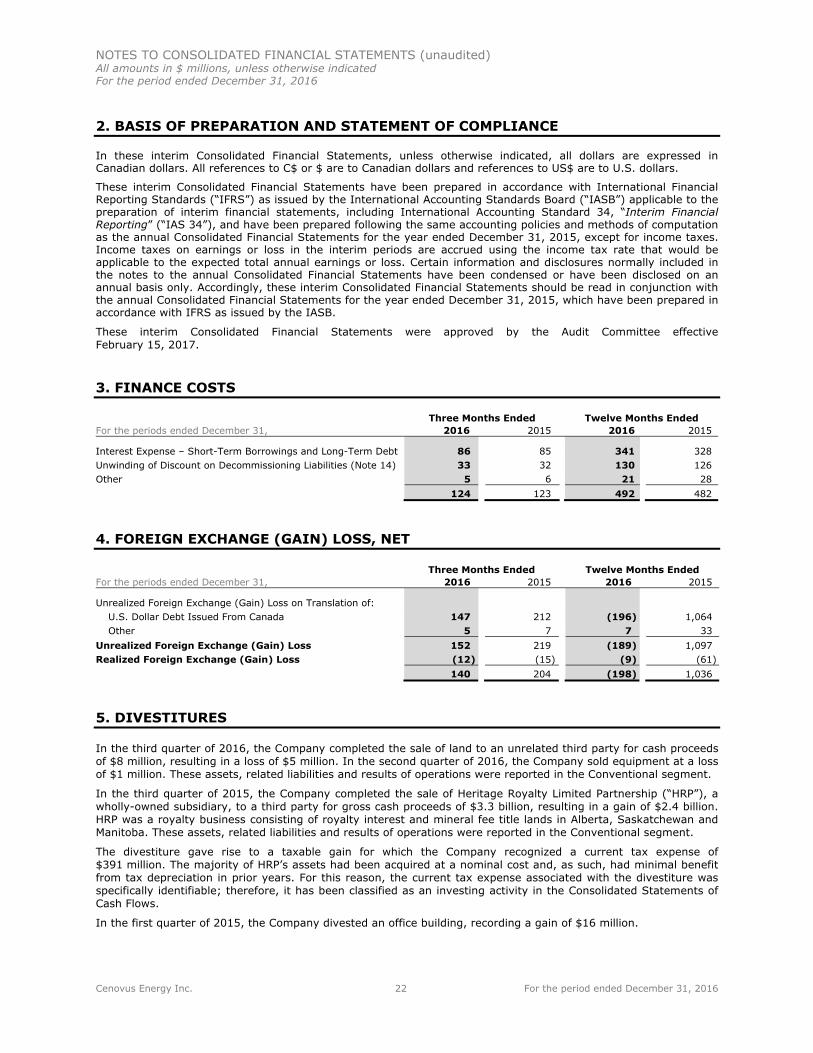
2. BASIS OF PREPARATION AND STATEMENT OF COMPLIANCE
In these interim Consolidated Financial Statements, unless otherwise indicated, all dollars are expressed in Canadian dollars. All references to C$ or $ are to Canadian dollars and references to US$ are to U.S. dollars.
These interim Consolidated Financial Statements have been prepared in accordance with International Financial Reporting Standards (“IFRS”) as issued by the International Accounting Standards Board (“IASB”) applicable to the preparation of interim financial statements, including International Accounting Standard 34, “Interim Financial Reporting” (“IAS 34”), and have been prepared following the same accounting policies and methods of computation as the annual Consolidated Financial Statements for the year ended December 31, 2015, except for income taxes. Income taxes on earnings or loss in the interim periods are accrued using the income tax rate that would be applicable to the expected total annual earnings or loss. Certain information and disclosures normally included in the notes to the annual Consolidated Financial Statements have been condensed or have been disclosed on an annual basis only. Accordingly, these interim Consolidated Financial Statements should be read in conjunction with the annual Consolidated Financial Statements for the year ended December 31, 2015, which have been prepared in accordance with IFRS as issued by the IASB.
These interim Consolidated Financial Statements were approved by the Audit Committee effective February 15, 2017.
3. FINANCE COSTS
Three Months Ended Twelve Months Ended For the periods ended December 31, 2016 2015 2016 2015
Interest Expense – Short-Term Borrowings and Long-Term Debt 86 85 341 328Unwinding of Discount on Decommissioning Liabilities (Note 14) 33 32 130 126 Other 5 6 21 28
124 123 492 482
4. FOREIGN EXCHANGE (GAIN) LOSS, NET
Three Months Ended Twelve Months Ended For the periods ended December 31, 2016 2015 2016 2015
Unrealized Foreign Exchange (Gain) Loss on Translation of: U.S. Dollar Debt Issued From Canada 147 212 (196) 1,064 Other 5 7 7 33
Unrealized Foreign Exchange (Gain) Loss 152 219 (189) 1,097 Realized Foreign Exchange (Gain) Loss (12) (15) (9) (61)
140 204 (198) 1,036
5. DIVESTITURES
In the third quarter of 2016, the Company completed the sale of land to an unrelated third party for cash proceeds of $8 million, resulting in a loss of $5 million. In the second quarter of 2016, the Company sold equipment at a loss of $1 million. These assets, related liabilities and results of operations were reported in the Conventional segment.
In the third quarter of 2015, the Company completed the sale of Heritage Royalty Limited Partnership (“HRP”), a wholly-owned subsidiary, to a third party for gross cash proceeds of $3.3 billion, resulting in a gain of $2.4 billion. HRP was a royalty business consisting of royalty interest and mineral fee title lands in Alberta, Saskatchewan and Manitoba. These assets, related liabilities and results of operations were reported in the Conventional segment.
The divestiture gave rise to a taxable gain for which the Company recognized a current tax expense of $391 million. The majority of HRP’s assets had been acquired at a nominal cost and, as such, had minimal benefit from tax depreciation in prior years. For this reason, the current tax expense associated with the divestiture was specifically identifiable; therefore, it has been classified as an investing activity in the Consolidated Statements of Cash Flows.
In the first quarter of 2015, the Company divested an office building, recording a gain of $16 million.
NOTES TO CONSOLIDATED FINANCIAL STATEMENTS (unaudited) All amounts in $ millions, unless otherwise indicated For the period ended December 31, 2016
Cenovus Energy Inc. 23 For the period ended December 31, 2016
6. OTHER (INCOME) LOSS, NET
As at December 31, 2016, due to the Government of Canada’s decision to reject the Northern Gateway Pipeline project, the Company has written off $23 million of capitalized costs associated with its funding support unit in Northern Gateway Pipeline. In addition, $7 million of expected costs associated with termination have been recorded.
In 2016, $7 million (2015 – $nil) of certain investments in private equity companies were written off.
7. IMPAIRMENT CHARGES AND REVERSALS
A) Cash-Generating Unit (“CGU”) Net Impairments
The review of the Company’s PP&E and E&E assets for indicators of impairment as at December 31, 2016 provided evidence that a portion of the impairment losses previously recorded should be reversed.
2016 Net Upstream Impairments
As at December 31, 2016, the recoverable value of the Northern Alberta CGU was estimated to be $1.1 billion. Earlier in 2016 and 2015, impairment losses of $380 million and $184 million, respectively, were recorded primarily due to a decline in long-term heavy crude oil prices and a slowing of the development plan. In the fourth quarter of 2016, the Company reversed $400 million of impairment losses, net of the depreciation, depletion and amortization (“DD&A”) that would have been recorded had no impairments been recorded. The reversal arose due to the increase in the CGU’s estimated recoverable amount caused by an average reduction in expected future operating costs of five percent and lower future development costs, partially offset by a decline in estimated reserves. The impairment losses and subsequent reversal were recorded as DD&A in the Conventional segment. The Northern Alberta CGU includes the Pelican Lake and Elk Point producing assets and other emerging assets in the exploration and evaluation stage.
As at December 31, 2016, the recoverable amount of the Suffield CGU was estimated to be $548 million. Earlier in 2016, an impairment loss of $65 million was recognized due to lower long-term forward natural gas and heavy crude oil prices. In the fourth quarter of 2016, the Company reversed the full amount of the impairment losses, net of the DD&A that would have been recorded had no impairment been recorded ($62 million). The reversal arose due to a decline in expected future royalties increasing the estimated recoverable amount of the CGU. The impairment loss and the subsequent reversal were recorded as DD&A in the Conventional segment. The Suffield CGU includes production of natural gas and heavy crude oil in Alberta on the Canadian Forces Base.
For the purpose of impairment testing, goodwill is allocated to the CGU to which it relates. There were no goodwill impairments for the twelve months ended December 31, 2016.
Key Assumptions
The recoverable amounts of Cenovus’s upstream CGUs were determined based on fair value less costs of disposal (“FVLCOD”) or an evaluation of comparable asset transactions. The fair values for producing properties were calculated based on discounted after-tax cash flows of proved and probable reserves using forward prices and cost estimates, prepared by Cenovus’s independent qualified reserves evaluators (“IQREs”) (Level 3). Key assumptions in the determination of future cash flows from reserves include crude oil and natural gas prices, costs to develop and the discount rate. All reserves have been evaluated as at December 31, 2016 by the IQREs.
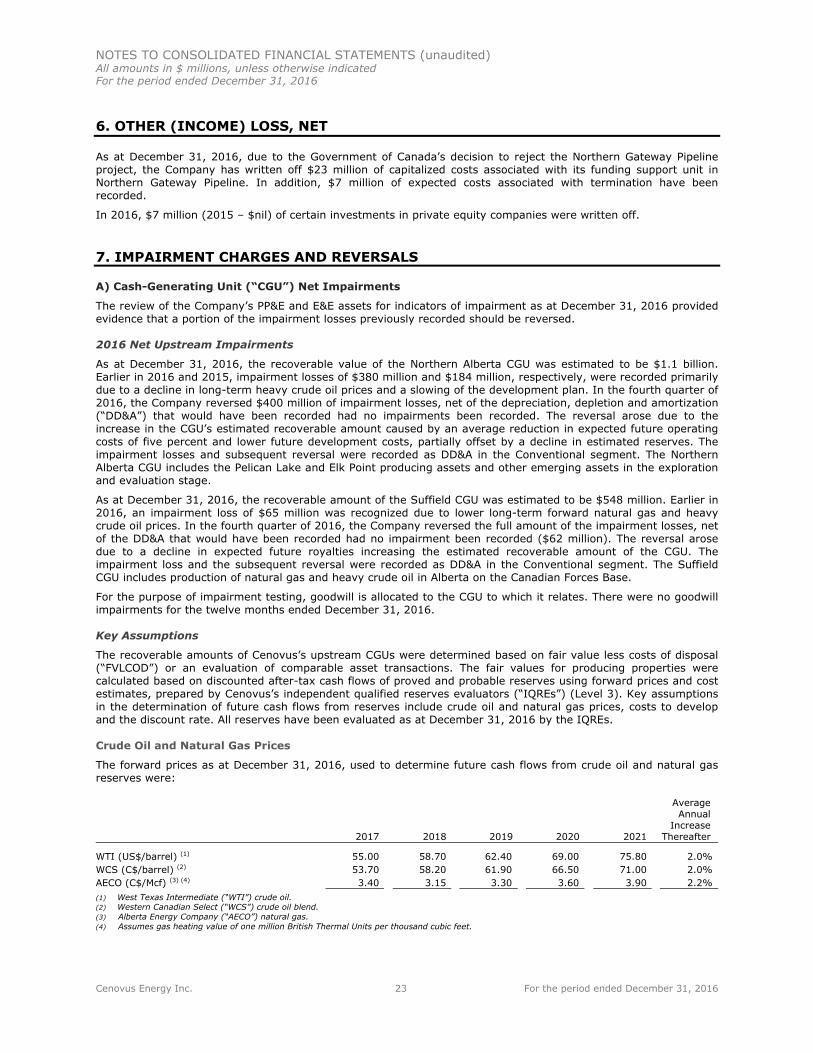
Crude Oil and Natural Gas Prices
The forward prices as at December 31, 2016, used to determine future cash flows from crude oil and natural gas reserves were:
2017 2018 2019 2020 2021
Average Annual Increase Thereafter
WTI (US$/barrel) (1) 55.00 58.70 62.40 69.00 75.80 2.0% WCS (C$/barrel) (2) 53.70 58.20 61.90 66.50 71.00 2.0% AECO (C$/Mcf) (3) (4) 3.40 3.15 3.30 3.60 3.90 2.2% (1) West Texas Intermediate (“WTI”) crude oil. (2) Western Canadian Select (“WCS”) crude oil blend. (3) Alberta Energy Company (“AECO”) natural gas. (4) Assumes gas heating value of one million British Thermal Units per thousand cubic feet.
NOTES TO CONSOLIDATED FINANCIAL STATEMENTS (unaudited) All amounts in $ millions, unless otherwise indicated For the period ended December 31, 2016
Cenovus Energy Inc. 24 For the period ended December 31, 2016
Discount and Inflation Rates
Evaluations of discounted future cash flows are initiated using the discount rate of 10 percent and inflation is estimated at two percent, which is common industry practice and used by Cenovus’s IQREs in preparing the reserves report. Based on the individual characteristics of the CGU, other economic and operating factors are also considered, which may increase or decrease the implied discount rate.
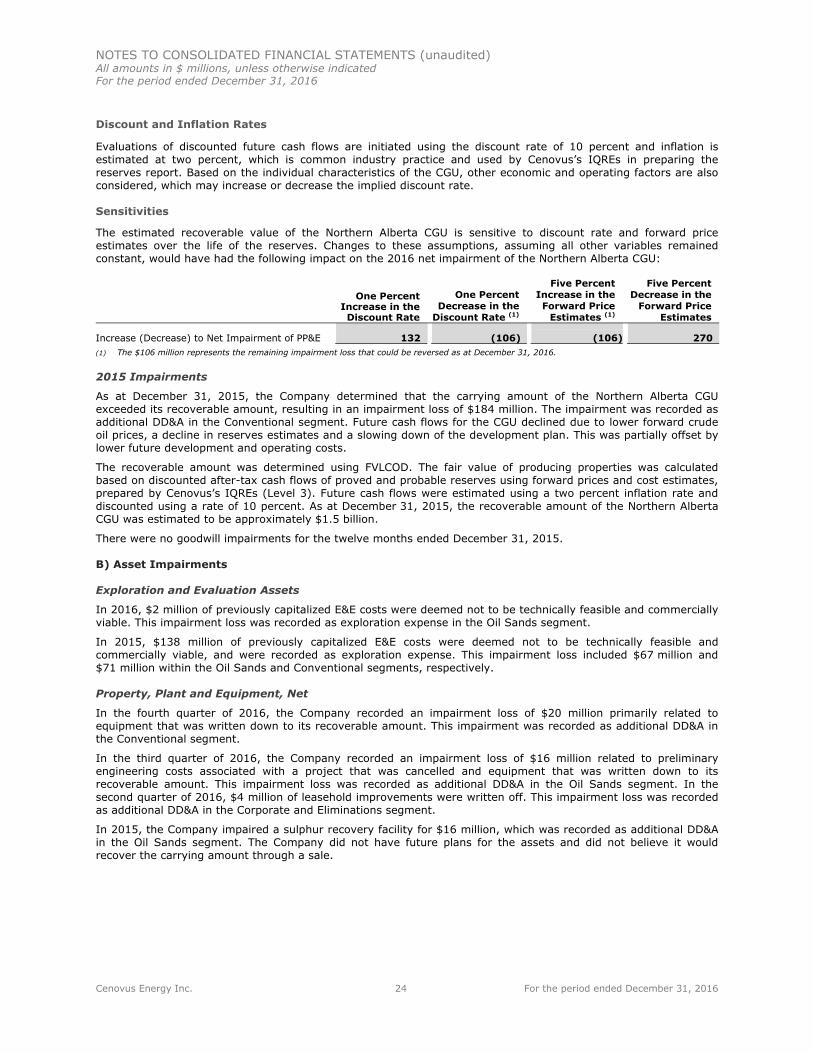
Sensitivities
The estimated recoverable value of the Northern Alberta CGU is sensitive to discount rate and forward price estimates over the life of the reserves. Changes to these assumptions, assuming all other variables remained constant, would have had the following impact on the 2016 net impairment of the Northern Alberta CGU:
One Percent Increase in the Discount Rate
One Percent Decrease in the
Discount Rate (1)
Five Percent Increase in the Forward Price
Estimates (1)
Five Percent Decrease in the
Forward Price Estimates
Increase (Decrease) to Net Impairment of PP&E 132 (106) (106) 270 (1) The $106 million represents the remaining impairment loss that could be reversed as at December 31, 2016.
2015 Impairments
As at December 31, 2015, the Company determined that the carrying amount of the Northern Alberta CGU exceeded its recoverable amount, resulting in an impairment loss of $184 million. The impairment was recorded as additional DD&A in the Conventional segment. Future cash flows for the CGU declined due to lower forward crude oil prices, a decline in reserves estimates and a slowing down of the development plan. This was partially offset by lower future development and operating costs.
The recoverable amount was determined using FVLCOD. The fair value of producing properties was calculated based on discounted after-tax cash flows of proved and probable reserves using forward prices and cost estimates, prepared by Cenovus’s IQREs (Level 3). Future cash flows were estimated using a two percent inflation rate and discounted using a rate of 10 percent. As at December 31, 2015, the recoverable amount of the Northern Alberta CGU was estimated to be approximately $1.5 billion.
There were no goodwill impairments for the twelve months ended December 31, 2015.
B) Asset Impairments
Exploration and Evaluation Assets
In 2016, $2 million of previously capitalized E&E costs were deemed not to be technically feasible and commercially viable. This impairment loss was recorded as exploration expense in the Oil Sands segment.
In 2015, $138 million of previously capitalized E&E costs were deemed not to be technically feasible and commercially viable, and were recorded as exploration expense. This impairment loss included $67 million and $71 million within the Oil Sands and Conventional segments, respectively.
Property, Plant and Equipment, Net
In the fourth quarter of 2016, the Company recorded an impairment loss of $20 million primarily related to equipment that was written down to its recoverable amount. This impairment was recorded as additional DD&A in the Conventional segment.
In the third quarter of 2016, the Company recorded an impairment loss of $16 million related to preliminary engineering costs associated with a project that was cancelled and equipment that was written down to its recoverable amount. This impairment loss was recorded as additional DD&A in the Oil Sands segment. In the second quarter of 2016, $4 million of leasehold improvements were written off. This impairment loss was recorded as additional DD&A in the Corporate and Eliminations segment.
In 2015, the Company impaired a sulphur recovery facility for $16 million, which was recorded as additional DD&A in the Oil Sands segment. The Company did not have future plans for the assets and did not believe it would recover the carrying amount through a sale.
NOTES TO CONSOLIDATED FINANCIAL STATEMENTS (unaudited) All amounts in $ millions, unless otherwise indicated For the period ended December 31, 2016
Cenovus Energy Inc. 25 For the period ended December 31, 2016
8. INCOME TAXES
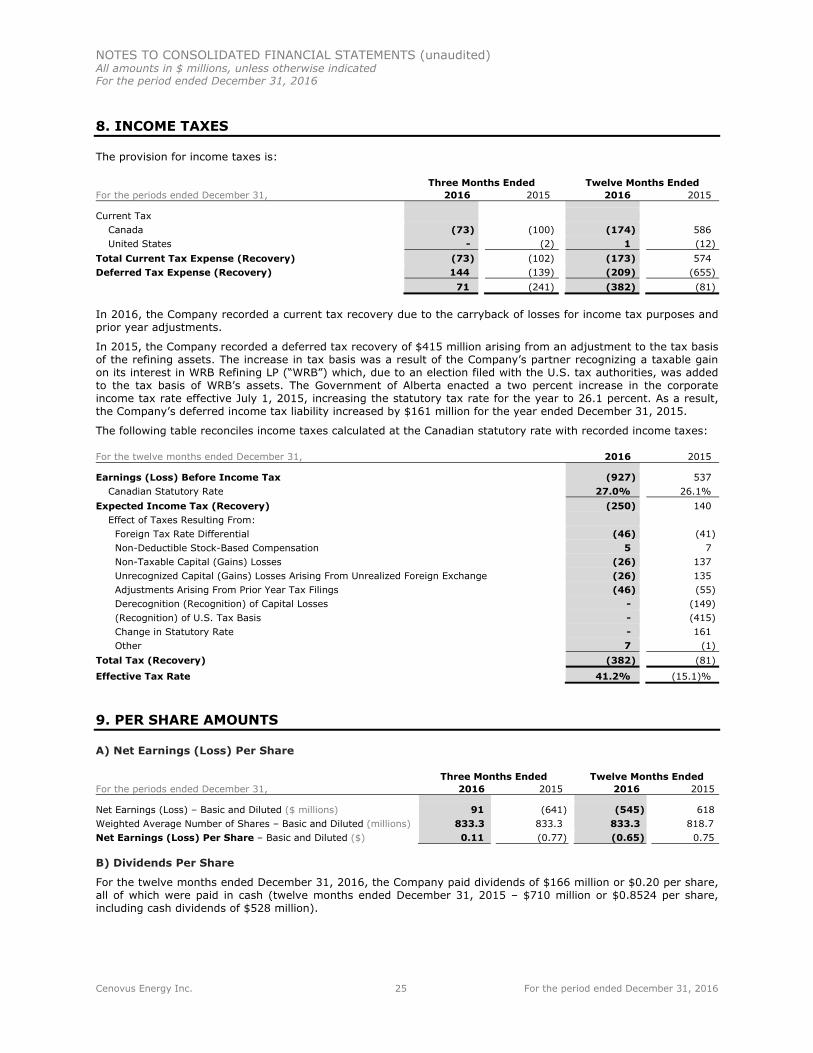
The provision for income taxes is:
Three Months Ended Twelve Months Ended For the periods ended December 31, 2016 2015 2016 2015
Current Tax Canada (73) (100) (174) 586 United States - (2) 1 (12)
Total Current Tax Expense (Recovery) (73) (102) (173) 574 Deferred Tax Expense (Recovery) 144 (139) (209) (655)
71 (241) (382) (81)
In 2016, the Company recorded a current tax recovery due to the carryback of losses for income tax purposes and prior year adjustments.
In 2015, the Company recorded a deferred tax recovery of $415 million arising from an adjustment to the tax basis of the refining assets. The increase in tax basis was a result of the Company’s partner recognizing a taxable gain on its interest in WRB Refining LP (“WRB”) which, due to an election filed with the U.S. tax authorities, was added to the tax basis of WRB’s assets. The Government of Alberta enacted a two percent increase in the corporate income tax rate effective July 1, 2015, increasing the statutory tax rate for the year to 26.1 percent. As a result, the Company’s deferred income tax liability increased by $161 million for the year ended December 31, 2015.
The following table reconciles income taxes calculated at the Canadian statutory rate with recorded income taxes:
For the twelve months ended December 31, 2016 2015
Earnings (Loss) Before Income Tax (927) 537 Canadian Statutory Rate 27.0% 26.1%
Expected Income Tax (Recovery) (250) 140 Effect of Taxes Resulting From:
Foreign Tax Rate Differential (46) (41) Non-Deductible Stock-Based Compensation 5 7 Non-Taxable Capital (Gains) Losses (26) 137 Unrecognized Capital (Gains) Losses Arising From Unrealized Foreign Exchange (26) 135Adjustments Arising From Prior Year Tax Filings (46) (55) Derecognition (Recognition) of Capital Losses - (149) (Recognition) of U.S. Tax Basis - (415) Change in Statutory Rate - 161 Other 7 (1)
Total Tax (Recovery) (382) (81)
Effective Tax Rate 41.2% (15.1)%
9. PER SHARE AMOUNTS
A) Net Earnings (Loss) Per Share
Three Months Ended Twelve Months Ended For the periods ended December 31, 2016 2015 2016 2015
Net Earnings (Loss) – Basic and Diluted ($ millions) 91 (641) (545) 618 Weighted Average Number of Shares – Basic and Diluted (millions) 833.3 833.3 833.3 818.7 Net Earnings (Loss) Per Share – Basic and Diluted ($) 0.11 (0.77) (0.65) 0.75
B) Dividends Per Share
For the twelve months ended December 31, 2016, the Company paid dividends of $166 million or $0.20 per share, all of which were paid in cash (twelve months ended December 31, 2015 – $710 million or $0.8524 per share, including cash dividends of $528 million).
NOTES TO CONSOLIDATED FINANCIAL STATEMENTS (unaudited) All amounts in $ millions, unless otherwise indicated For the period ended December 31, 2016
Cenovus Energy Inc. 26 For the period ended December 31, 2016
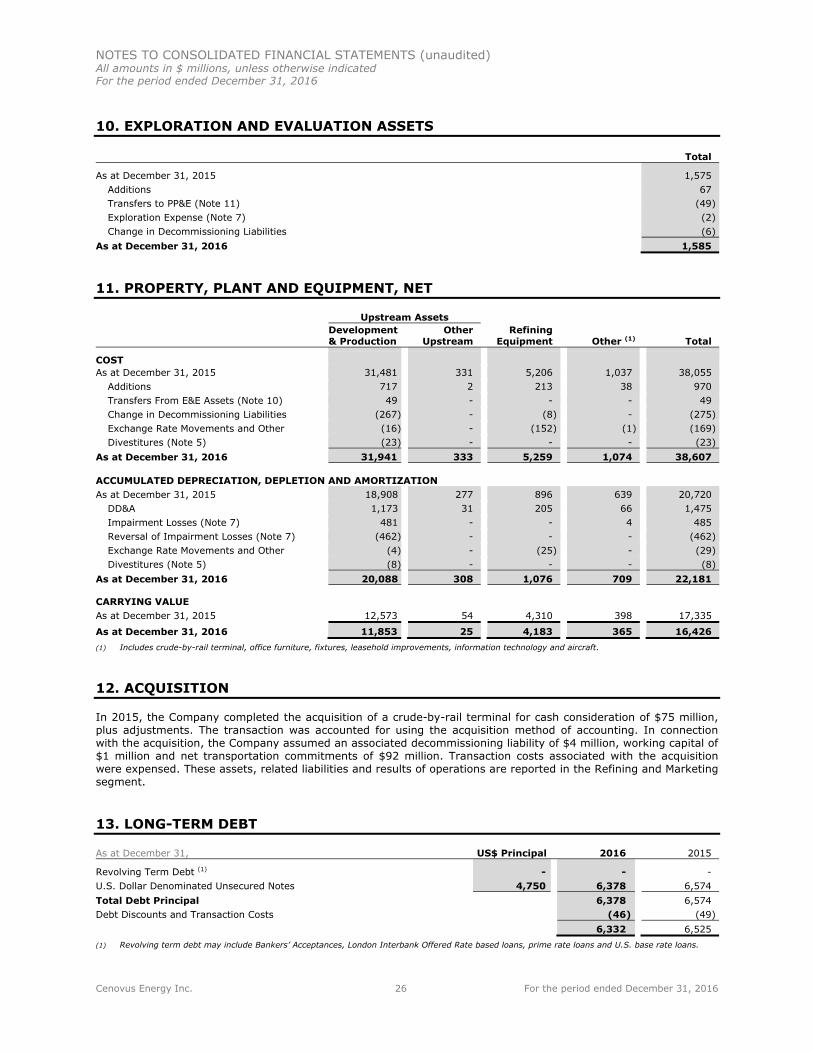
10. EXPLORATION AND EVALUATION ASSETS
Total
As at December 31, 2015 1,575 Additions 67 Transfers to PP&E (Note 11) (49) Exploration Expense (Note 7) (2) Change in Decommissioning Liabilities (6)
As at December 31, 2016 1,585
11. PROPERTY, PLANT AND EQUIPMENT, NET
Upstream Assets Development & Production
Other Upstream
Refining Equipment Other (1) Total
COST As at December 31, 2015 31,481 331 5,206 1,037 38,055
Additions 717 2 213 38 970 Transfers From E&E Assets (Note 10) 49 - - - 49 Change in Decommissioning Liabilities (267) - (8) - (275) Exchange Rate Movements and Other (16) - (152) (1) (169) Divestitures (Note 5) (23) - - - (23)
As at December 31, 2016 31,941 333 5,259 1,074 38,607
ACCUMULATED DEPRECIATION, DEPLETION AND AMORTIZATION As at December 31, 2015 18,908 277 896 639 20,720
DD&A 1,173 31 205 66 1,475 Impairment Losses (Note 7) 481 - - 4 485 Reversal of Impairment Losses (Note 7) (462) - - - (462) Exchange Rate Movements and Other (4) - (25) - (29) Divestitures (Note 5) (8) - - - (8)
As at December 31, 2016 20,088 308 1,076 709 22,181
CARRYING VALUE As at December 31, 2015 12,573 54 4,310 398 17,335
As at December 31, 2016 11,853 25 4,183 365 16,426 (1) Includes crude-by-rail terminal, office furniture, fixtures, leasehold improvements, information technology and aircraft.
12. ACQUISITION
In 2015, the Company completed the acquisition of a crude-by-rail terminal for cash consideration of $75 million, plus adjustments. The transaction was accounted for using the acquisition method of accounting. In connection with the acquisition, the Company assumed an associated decommissioning liability of $4 million, working capital of $1 million and net transportation commitments of $92 million. Transaction costs associated with the acquisition were expensed. These assets, related liabilities and results of operations are reported in the Refining and Marketing segment.
13. LONG-TERM DEBT
As at December 31, US$ Principal 2016 2015
Revolving Term Debt (1) - - - U.S. Dollar Denominated Unsecured Notes 4,750 6,378 6,574 Total Debt Principal 6,378 6,574 Debt Discounts and Transaction Costs (46) (49)
6,332 6,525 (1) Revolving term debt may include Bankers’ Acceptances, London Interbank Offered Rate based loans, prime rate loans and U.S. base rate loans.
NOTES TO CONSOLIDATED FINANCIAL STATEMENTS (unaudited) All amounts in $ millions, unless otherwise indicated For the period ended December 31, 2016
Cenovus Energy Inc. 27 For the period ended December 31, 2016
On February 24, 2016, Cenovus filed a base shelf prospectus. The base shelf prospectus allows the Company to offer, from time to time, up to US$5.0 billion, or the equivalent in other currencies, of debt securities, common shares, preferred shares, subscription receipts, warrants, share purchase contracts and units in Canada, the U.S. and elsewhere where permitted by law. The base shelf prospectus will expire in March 2018. As at December 31, 2016, no issuances have been made under the US$5.0 billion base shelf prospectus.
On April 22, 2016, the Company renegotiated the maturity date of the $1.0 billion tranche of its committed credit facility from November 30, 2017 to April 30, 2019. As at December 31, 2016, Cenovus had $4.0 billion available on its committed credit facility.
As at December 31, 2016, the Company is in compliance with all of the terms of its debt agreements.
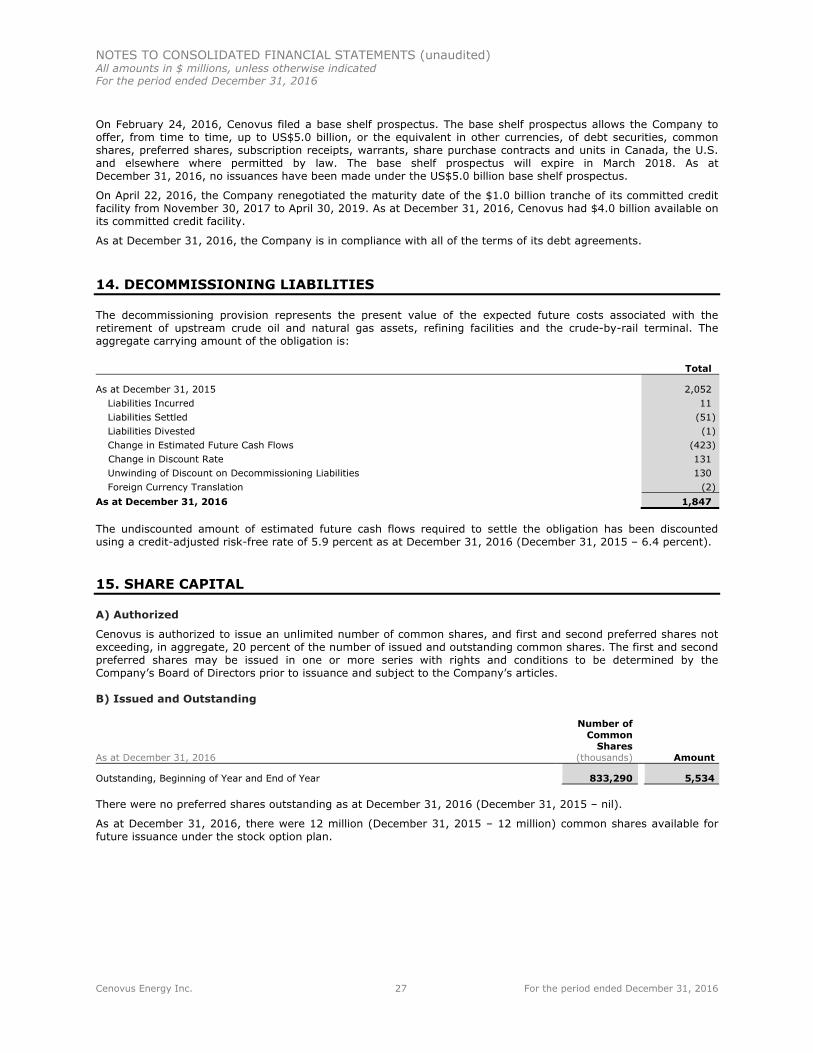
14. DECOMMISSIONING LIABILITIES
The decommissioning provision represents the present value of the expected future costs associated with the retirement of upstream crude oil and natural gas assets, refining facilities and the crude-by-rail terminal. The aggregate carrying amount of the obligation is:
Total
As at December 31, 2015 2,052 Liabilities Incurred 11 Liabilities Settled (51) Liabilities Divested (1) Change in Estimated Future Cash Flows (423) Change in Discount Rate 131 Unwinding of Discount on Decommissioning Liabilities 130 Foreign Currency Translation (2)
As at December 31, 2016 1,847
The undiscounted amount of estimated future cash flows required to settle the obligation has been discounted using a credit-adjusted risk-free rate of 5.9 percent as at December 31, 2016 (December 31, 2015 – 6.4 percent).
15. SHARE CAPITAL
A) Authorized
Cenovus is authorized to issue an unlimited number of common shares, and first and second preferred shares not exceeding, in aggregate, 20 percent of the number of issued and outstanding common shares. The first and second preferred shares may be issued in one or more series with rights and conditions to be determined by the Company’s Board of Directors prior to issuance and subject to the Company’s articles.
B) Issued and Outstanding
As at December 31, 2016
Number of Common
Shares (thousands) Amount
Outstanding, Beginning of Year and End of Year 833,290 5,534
There were no preferred shares outstanding as at December 31, 2016 (December 31, 2015 – nil).
As at December 31, 2016, there were 12 million (December 31, 2015 – 12 million) common shares available for future issuance under the stock option plan.
NOTES TO CONSOLIDATED FINANCIAL STATEMENTS (unaudited) All amounts in $ millions, unless otherwise indicated For the period ended December 31, 2016
Cenovus Energy Inc. 28 For the period ended December 31, 2016
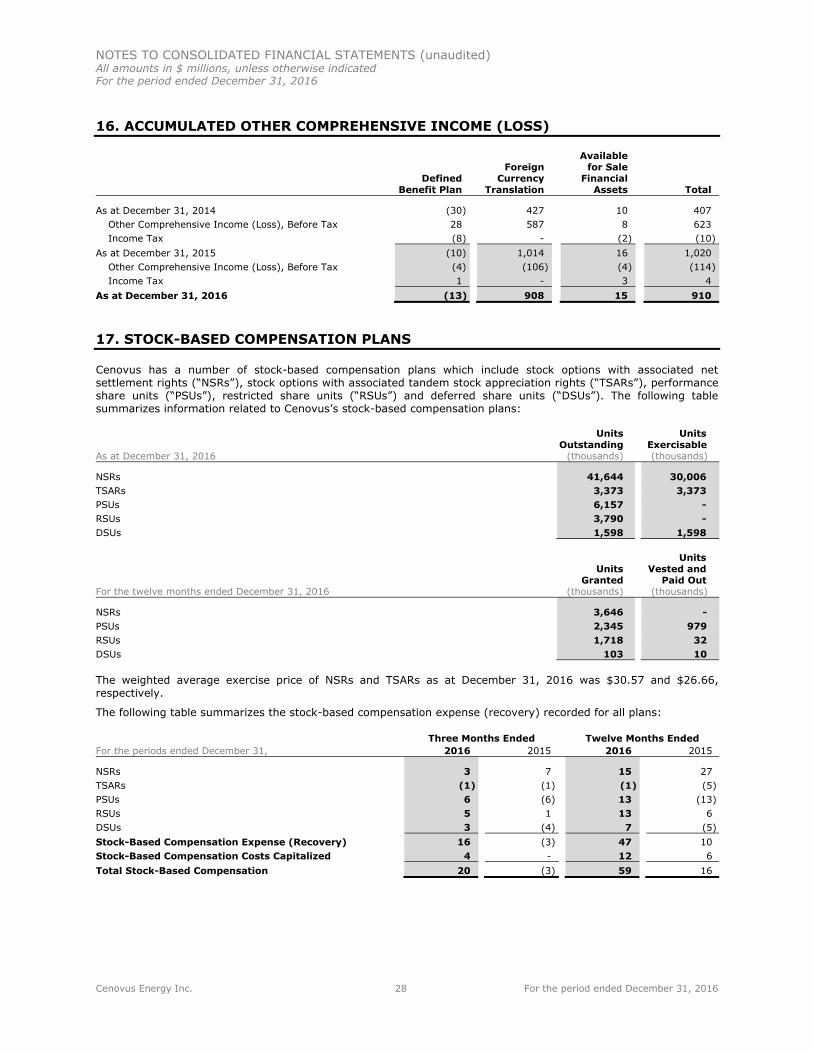
16. ACCUMULATED OTHER COMPREHENSIVE INCOME (LOSS)
Defined Benefit Plan
Foreign Currency
Translation
Available for Sale
Financial Assets Total
As at December 31, 2014 (30) 427 10 407 Other Comprehensive Income (Loss), Before Tax 28 587 8 623 Income Tax (8) - (2) (10)
As at December 31, 2015 (10) 1,014 16 1,020 Other Comprehensive Income (Loss), Before Tax (4) (106) (4) (114) Income Tax 1 - 3 4
As at December 31, 2016 (13) 908 15 910
17. STOCK-BASED COMPENSATION PLANS
Cenovus has a number of stock-based compensation plans which include stock options with associated net settlement rights (“NSRs”), stock options with associated tandem stock appreciation rights (“TSARs”), performance share units (“PSUs”), restricted share units (“RSUs”) and deferred share units (“DSUs”). The following table summarizes information related to Cenovus’s stock-based compensation plans:
As at December 31, 2016
Units Outstanding
(thousands)
Units Exercisable (thousands)
NSRs 41,644 30,006 TSARs 3,373 3,373 PSUs 6,157 - RSUs 3,790 - DSUs 1,598 1,598
For the twelve months ended December 31, 2016
Units Granted
(thousands)
Units Vested and
Paid Out (thousands)
NSRs 3,646 - PSUs 2,345 979 RSUs 1,718 32 DSUs 103 10
The weighted average exercise price of NSRs and TSARs as at December 31, 2016 was $30.57 and $26.66, respectively.
The following table summarizes the stock-based compensation expense (recovery) recorded for all plans:
Three Months Ended Twelve Months Ended For the periods ended December 31, 2016 2015 2016 2015
NSRs 3 7 15 27TSARs (1) (1) (1) (5) PSUs 6 (6) 13 (13) RSUs 5 1 13 6 DSUs 3 (4) 7 (5) Stock-Based Compensation Expense (Recovery) 16 (3) 47 10Stock-Based Compensation Costs Capitalized 4 - 12 6Total Stock-Based Compensation 20 (3) 59 16

NOTES TO CONSOLIDATED FINANCIAL STATEMENTS (unaudited) All amounts in $ millions, unless otherwise indicated For the period ended December 31, 2016
Cenovus Energy Inc. 29 For the period ended December 31, 2016
18. CAPITAL STRUCTURE
Cenovus’s capital structure objectives and targets have remained unchanged from previous periods. Cenovus’s capital structure consists of Shareholders’ Equity plus Debt. Debt is defined as short-term borrowings, and the current and long-term portions of long-term debt. Net debt includes the Company’s short-term borrowings, and the current and long-term portions of long-term debt, net of cash and cash equivalents. Cenovus’s objectives when managing its capital structure are to maintain financial flexibility, preserve access to capital markets, ensure its ability to finance internally generated growth and to fund potential acquisitions while maintaining the ability to meet the Company’s financial obligations as they come due.
Cenovus monitors its capital structure and financing requirements using, among other things, non-GAAP financial metrics consisting of Debt to Capitalization and Debt to Adjusted Earnings Before Interest, Taxes and DD&A (“Adjusted EBITDA”). These metrics are used to steward Cenovus’s overall debt position as measures of Cenovus’s overall financial strength.
Over the long term, Cenovus targets a Debt to Capitalization ratio of between 30 and 40 percent and a Debt to Adjusted EBITDA ratio of between 1.0 and 2.0 times. At different points within the economic cycle, Cenovus expects these ratios may periodically be outside of the target range.
A) Debt to Capitalization and Net Debt to Capitalization
As at December 31, 2016 2015
Debt 6,332 6,525 Shareholders’ Equity 11,590 12,391
17,922 18,916 Debt to Capitalization 35% 34%
Debt 6,332 6,525 Add (Deduct):
Cash and Cash Equivalents (3,720) (4,105) Net Debt 2,612 2,420 Shareholders’ Equity 11,590 12,391
14,202 14,811Net Debt to Capitalization 18% 16%
B) Debt to Adjusted EBITDA and Net Debt to Adjusted EBITDA
As at December 31, 2016 2015
Debt 6,332 6,525 Net Debt 2,612 2,420
Net Earnings (Loss) (545) 618 Add (Deduct):
Finance Costs 492 482 Interest Income (52) (28) Income Tax Expense (Recovery) (382) (81) DD&A 1,498 2,114 E&E Impairment 2 138 Unrealized (Gain) Loss on Risk Management 554 195 Foreign Exchange (Gain) Loss, Net (198) 1,036 (Gain) Loss on Divestitures of Assets 6 (2,392) Other (Income) Loss, Net 34 2
Adjusted EBITDA (1) 1,409 2,084
Debt to Adjusted EBITDA 4.5x 3.1x
Net Debt to Adjusted EBITDA 1.9x 1.2x (1) Calculated on a trailing twelve-month basis.

NOTES TO CONSOLIDATED FINANCIAL STATEMENTS (unaudited) All amounts in $ millions, unless otherwise indicated For the period ended December 31, 2016
Cenovus Energy Inc. 30 For the period ended December 31, 2016
Cenovus will maintain a high level of capital discipline and manage its capital structure to help ensure sufficient liquidity through all stages of the economic cycle. To manage its capital structure, Cenovus may, among other actions, adjust capital and operating spending, adjust dividends paid to shareholders, purchase shares for cancellation pursuant to normal course issuer bids, issue new shares, issue new debt, draw down on its credit facility or repay existing debt.
Effective April 22, 2016, the Company extended the maturity date of the $1.0 billion tranche of the committed credit facility from November 30, 2017 to April 30, 2019. As at December 31, 2016, Cenovus had $4.0 billion available on its committed credit facility. In addition, Cenovus has in place a US$5.0 billion base shelf prospectus, the availability of which is dependent on market conditions.
Under the committed credit facility, the Company is required to maintain a debt to capitalization ratio, as defined in the agreement, not to exceed 65 percent. The Company is well below this limit.
As at December 31, 2016, Cenovus is in compliance with all of the terms of its debt agreements.
19. FINANCIAL INSTRUMENTS
Cenovus’s financial assets and financial liabilities consist of cash and cash equivalents, accounts receivable and accrued revenues, accounts payable and accrued liabilities, risk management assets and liabilities, available for sale financial assets, long-term receivables, short-term borrowings and long-term debt. Risk management assets and liabilities arise from the use of derivative financial instruments.
A) Fair Value of Non-Derivative Financial Instruments
The fair values of cash and cash equivalents, accounts receivable and accrued revenues, accounts payable and accrued liabilities, and short-term borrowings approximate their carrying amount due to the short-term maturity of these instruments.
The fair values of long-term receivables approximate their carrying amount due to the specific non-tradeable nature of these instruments.
Long-term debt is carried at amortized cost. The estimated fair values of long-term borrowings have been determined based on period-end trading prices of long-term borrowings on the secondary market (Level 2). As at December 31, 2016, the carrying value of Cenovus’s long-term debt was $6,332 million and the fair value was $6,539 million (December 31, 2015 carrying value – $6,525 million, fair value – $6,050 million).
Available for sale financial assets comprise private equity investments. These assets are carried at fair value on the Consolidated Balance Sheets in other assets. Fair value is determined based on recent private placement transactions (Level 3) when available. The following table provides a reconciliation of changes in the fair value of available for sale financial assets:
Total
Fair Value, as at December 31, 2015 42 Change in Fair Value (1) (4) Impairment Losses (2) (3)
Fair Value, as at December 31, 2016 35 (1) Changes in fair value on available for sale financial assets are recorded in other comprehensive income. (2) Impairment losses on available for sale financial assets are reclassified from other comprehensive income to profit or loss.
B) Fair Value of Risk Management Assets and Liabilities
The Company’s risk management assets and liabilities consist of crude oil, condensate, power purchase contracts and interest rate swaps. Crude oil, condensate and, if entered, natural gas contracts, are recorded at their estimated fair value based on the difference between the contracted price and the period-end forward price for the same commodity, using quoted market prices or the period-end forward price for the same commodity extrapolated to the end of the term of the contract (Level 2). The fair value of power purchase contracts are calculated internally based on observable and unobservable inputs such as forward power prices in less active markets (Level 3). The unobservable inputs are obtained from third parties whenever possible and reviewed by the Company for reasonableness. The fair value of interest rate swaps are calculated using external valuation models which incorporate observable market data, including interest rate yield curves (Level 2).

NOTES TO CONSOLIDATED FINANCIAL STATEMENTS (unaudited) All amounts in $ millions, unless otherwise indicated For the period ended December 31, 2016
Cenovus Energy Inc. 31 For the period ended December 31, 2016
Summary of Unrealized Risk Management Positions
2016 2015Risk Management Risk Management
As at December 31, Asset Liability Net Asset Liability Net
Commodity Prices Crude Oil 21 307 (286) 301 15 286 Power - - - - 13 (13)
21 307 (286) 301 28 273 Interest Rate 3 8 (5) - 2 (2) Total Fair Value 24 315 (291) 301 30 271
The following table presents the Company’s fair value hierarchy for risk management assets and liabilities carried at fair value:
As at December 31, 2016 2015
Level 2 – Prices Sourced From Observable Data or Market Corroboration (291) 284 Level 3 – Prices Determined From Unobservable Inputs - (13)
(291) 271
Prices sourced from observable data or market corroboration refers to the fair value of contracts valued in part using active quotes and in part using observable, market-corroborated data. Prices determined from unobservable inputs refers to the fair value of contracts valued using data that is both unobservable and significant to the overall fair value measurement.
The following table provides a reconciliation of changes in the fair value of Cenovus’s risk management assets and liabilities from January 1 to December 31:
2016 2015
Fair Value of Contracts, Beginning of Year 271 462 Fair Value of Contracts Realized During the Year (1) (211) (656) Change in Fair Value of Contracts in Place at Beginning of Year and Contracts Entered
Into During the Year (2) (343) 461 Unrealized Foreign Exchange Gain (Loss) on U.S. Dollar Contracts (8) 4
Fair Value of Contracts, End of Year (291) 271 (1) Includes a realized loss of $6 million related to power contracts (2015 – $10 million loss). (2) Includes an increase of $7 million related to power contracts (2015 – $14 million decrease).
C) Earnings Impact of (Gains) Losses From Risk Management Positions
Three Months Ended Twelve Months Ended For the periods ended December 31, 2016 2015 2016 2015
Realized (Gain) Loss (1) (12) (239) (211) (656) Unrealized (Gain) Loss (2) 114 26 554 195 (Gain) Loss on Risk Management 102 (213) 343 (461) (1) Realized gains and losses on risk management are recorded in the operating segment to which the derivative instrument relates. (2) Unrealized gains and losses on risk management are recorded in the Corporate and Eliminations segment.
20. RISK MANAGEMENT
Cenovus is exposed to financial risks, including market risk related to commodity prices, foreign exchange rates, interest rates as well as credit risk and liquidity risk. A description of the nature and extent of risks arising from the Company’s financial assets and liabilities can be found in the notes to the annual Consolidated Financial Statements as at December 31, 2015. Exposure to these risks has not changed significantly since December 31, 2015. To manage exposure to interest rate volatility, the Company entered into interest rate swap contracts related to expected future debt issuances. As at December 31, 2016, Cenovus had a notional amount of US$400 million in interest rate swaps.
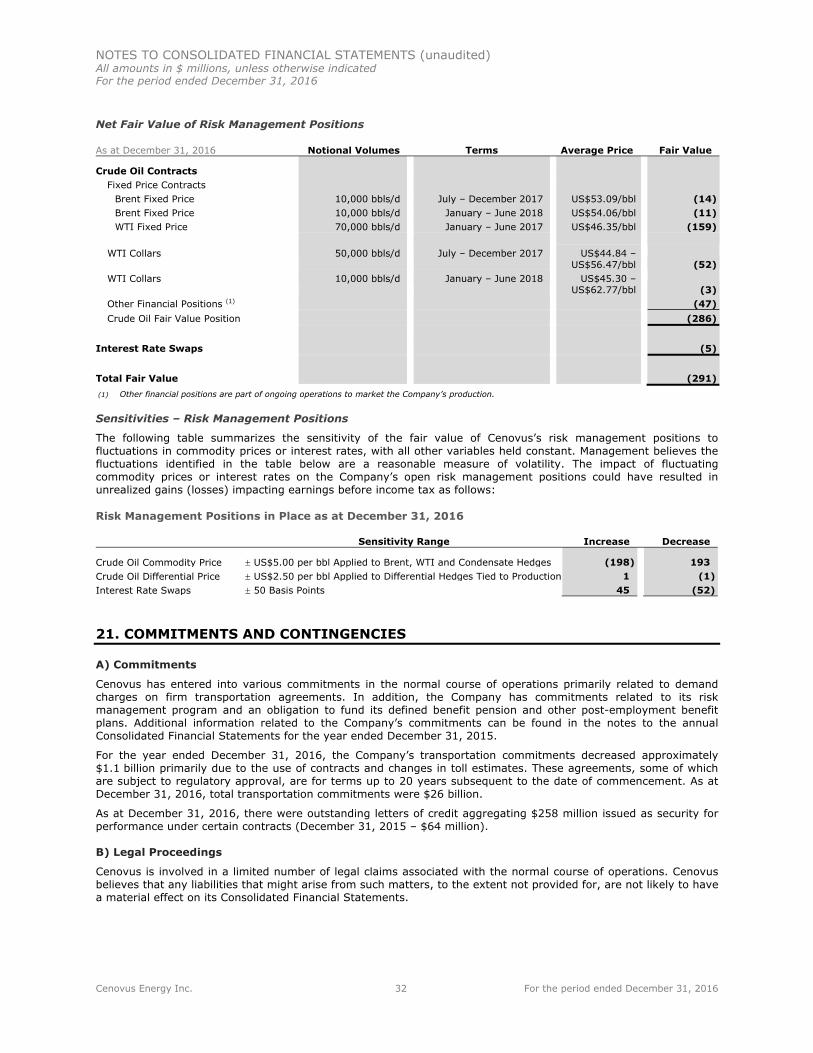
NOTES TO CONSOLIDATED FINANCIAL STATEMENTS (unaudited) All amounts in $ millions, unless otherwise indicated For the period ended December 31, 2016
Cenovus Energy Inc. 32 For the period ended December 31, 2016
Net Fair Value of Risk Management Positions
As at December 31, 2016 Notional Volumes Terms Average Price Fair Value
Crude Oil Contracts Fixed Price Contracts
Brent Fixed Price 10,000 bbls/d July – December 2017 US$53.09/bbl (14) Brent Fixed Price 10,000 bbls/d January – June 2018 US$54.06/bbl (11) WTI Fixed Price 70,000 bbls/d January – June 2017 US$46.35/bbl (159)
WTI Collars 50,000 bbls/d July – December 2017 US$44.84 – US$56.47/bbl (52)
WTI Collars 10,000 bbls/d January – June 2018 US$45.30 – US$62.77/bbl (3)
Other Financial Positions (1) (47) Crude Oil Fair Value Position (286)
Interest Rate Swaps (5)
Total Fair Value (291) (1) Other financial positions are part of ongoing operations to market the Company’s production.
Sensitivities – Risk Management Positions
The following table summarizes the sensitivity of the fair value of Cenovus’s risk management positions to fluctuations in commodity prices or interest rates, with all other variables held constant. Management believes the fluctuations identified in the table below are a reasonable measure of volatility. The impact of fluctuating commodity prices or interest rates on the Company’s open risk management positions could have resulted in unrealized gains (losses) impacting earnings before income tax as follows:
Risk Management Positions in Place as at December 31, 2016
Sensitivity Range Increase Decrease
Crude Oil Commodity Price US$5.00 per bbl Applied to Brent, WTI and Condensate Hedges (198) 193 Crude Oil Differential Price US$2.50 per bbl Applied to Differential Hedges Tied to Production 1 (1) Interest Rate Swaps 50 Basis Points 45 (52)
21. COMMITMENTS AND CONTINGENCIES
A) Commitments
Cenovus has entered into various commitments in the normal course of operations primarily related to demand charges on firm transportation agreements. In addition, the Company has commitments related to its risk management program and an obligation to fund its defined benefit pension and other post-employment benefit plans. Additional information related to the Company’s commitments can be found in the notes to the annual Consolidated Financial Statements for the year ended December 31, 2015.
For the year ended December 31, 2016, the Company’s transportation commitments decreased approximately $1.1 billion primarily due to the use of contracts and changes in toll estimates. These agreements, some of which are subject to regulatory approval, are for terms up to 20 years subsequent to the date of commencement. As at December 31, 2016, total transportation commitments were $26 billion.
As at December 31, 2016, there were outstanding letters of credit aggregating $258 million issued as security for performance under certain contracts (December 31, 2015 – $64 million).
B) Legal Proceedings
Cenovus is involved in a limited number of legal claims associated with the normal course of operations. Cenovus believes that any liabilities that might arise from such matters, to the extent not provided for, are not likely to have a material effect on its Consolidated Financial Statements.

SUPPLEMENTAL INFORMATION (unaudited)
Financial Statistics($ millions, except per share amounts)
RevenuesYear Q4 Q3 Q2 Q1 Year
Gross SalesUpstream 4,196 1,326 1,123 1,003 744 4,739 Refining and Marketing 8,439 2,477 2,245 2,129 1,588 8,805 Corporate and Eliminations (353) (108) (89) (89) (67) (337)
Less: Royalties 148 53 39 36 20 143 Revenues 12,134 3,642 3,240 3,007 2,245 13,064
Operating Margin (1)
Year Q4 Q3 Q2 Q1 YearCrude Oil and Natural Gas Liquids
Foster Creek 399 165 125 98 11 454 Christina Lake 476 168 140 134 34 592 Conventional 402 100 108 106 88 683
Natural Gas 141 50 47 10 34 307 Other Upstream Operations 3 4 (1) - - 18
1,421 487 419 348 167 2,054 Refining and Marketing 346 108 68 193 (23) 385 Operating Margin 1,767 595 487 541 144 2,439
Adjusted Funds Flow (2)
Year Q4 Q3 Q2 Q1 YearCash From Operating Activities 861 164 310 205 182 1,474 Deduct (Add Back):
Net Change in Other Assets and Liabilities (91) (32) (13) (17) (29) (107) Net Change in Non-Cash Working Capital (471) (339) (99) (218) 185 (110)
Adjusted Funds Flow 1,423 535 422 440 26 1,691 Per Share - Basic 1.71 0.64 0.51 0.53 0.03 2.07
- Diluted 1.71 0.64 0.51 0.53 0.03 2.07
EarningsYear Q4 Q3 Q2 Q1 Year
Operating Earnings (Loss) (3) (377) 321 (236) (39) (423) (403) Per Share - Diluted (0.45) 0.39 (0.28) (0.05) (0.51) (0.49)
Net Earnings (Loss) (545) 91 (251) (267) (118) 618 Per Share - Basic (0.65) 0.11 (0.30) (0.32) (0.14) 0.75
- Diluted (0.65) 0.11 (0.30) (0.32) (0.14) 0.75
Income Tax & Exchange RatesYear Q4 Q3 Q2 Q1 Year
Effective Tax Rates Using:Net Earnings (4) 41.2% (15.1)%Operating Earnings, Excluding Divestitures 33.0% 32.4%Canadian Statutory Rate (5) 27.0% 26.1%U.S. Statutory Rate 38.0% 38.0%
Foreign Exchange Rates (US$ per C$1)Average 0.755 0.750 0.766 0.776 0.728 0.782 Period End 0.745 0.745 0.762 0.769 0.771 0.723
(1)
(2)
(3)
(4)
(5)
Financial Metrics (Non-GAAP Measures)Year Q4 Q3 Q2 Q1 Year
Net Debt to Capitalization (1) (2) 18% 18% 17% 17% 16% 16%
Debt to Capitalization (3) (4) 35% 35% 35% 34% 34% 34%
Net Debt to Adjusted EBITDA (1) (5) 1.9x 1.9x 2.0x 1.9x 1.3x 1.2x
Debt to Adjusted EBITDA (3) (5) 4.5x 4.5x 5.3x 4.8x 3.6x 3.1x
Return on Capital Employed (6) (2)% (2)% (6)% 6% 8% 5%
Return on Common Equity (7) (5)% (5)% (10)% 7% 10% 5%(1)
(2)
(3)
(4)
(5)
(6)
(7)
2015
Adjusted Funds Flow (previously labelled Cash Flow) is a non-GAAP measure commonly used in the oil and gas industry to assist in measuring a company’s ability to finance its capital programs and meet its financialobligations. Adjusted Funds Flow is defined as cash from operating activities excluding net change in other assets and liabilities and net change in non-cash working capital, both of which are defined on theConsolidated Statement of Cash Flows. Net change in other assets and liabilities is composed of site restoration costs and pension funding.
Operating Margin (previously labelled Operating Cash Flow) is an additional subtotal found in Note 1 of the Consolidated Financial Statements and is used to provide a consistent measure of the cash generatingperformance of our assets for comparability of our underlying financial performance between periods. Operating Margin is defined as revenues less purchased product, transportation and blending, operating expensesand production and mineral taxes plus realized gains less realized losses on risk management activities. Items within the Corporate and Eliminations segment are excluded from the calculation of Operating Margin.
Operating Earnings (Loss) is a non-GAAP measure that is used to provide a consistent measure of the comparability of our underlying financial performance between periods by removing non-operating items.Operating Earnings (Loss) is defined as Earnings (Loss) Before Income Tax excluding gain (loss) on discontinuance, gain on bargain purchase, unrealized risk management gains (losses) on derivative instruments,unrealized foreign exchange gains (losses) on translation of U.S. dollar denominated notes issued from Canada, foreign exchange gains (losses) on settlement of intercompany transactions, gains (losses) ondivestiture of assets, less income taxes on Operating Earnings (Loss) before tax, excluding the effect of changes in statutory income tax rates and the recognition of an increase in U.S. tax basis.
2015
On June 29, 2015, the Alberta government enacted a two percent increase in the corporate income tax rate. The rate increase was effective July 1, 2015.
Net debt to capitalization is defined as net debt divided by net debt plus shareholders’ equity.
2016
2016
2016
2016
Adjusted EBITDA is defined as earnings before finance costs, interest income, income tax expense, depreciation, depletion and amortization, goodwill impairments, asset impairments and reversals, unrealized gains(losses) on risk management, foreign exchange gains (losses), gains (losses) on divestiture of assets and other income (loss), net, calculated on a trailing twelve-month basis. Return on capital employed is calculated, on a trailing twelve-month basis, as net earnings before after-tax interest divided by average shareholders' equity plus average debt.
2015
Capitalization is a non-GAAP measure defined as debt plus shareholders' equity.
Return on common equity is calculated, on a trailing twelve-month basis, as net earnings divided by average shareholders' equity.
2015
2015
2015
2016
Debt includes the Company's short-term borrowings and the current and long-term portions of long-term debt.
The 2015 effective tax rate reflects an increase to the tax basis of Cenovus's U.S. assets, the two percent increase in the Alberta corporate income tax rate and the benefit from recognition of previously unrecognizedcapital losses.
2016
Net debt includes the Company's short-term borrowings, and the current and long-term portions of long-term debt, net of cash and cash equivalents.
Cenovus Energy Inc. 33Supplemental Information
for the period ended December 31, 2016
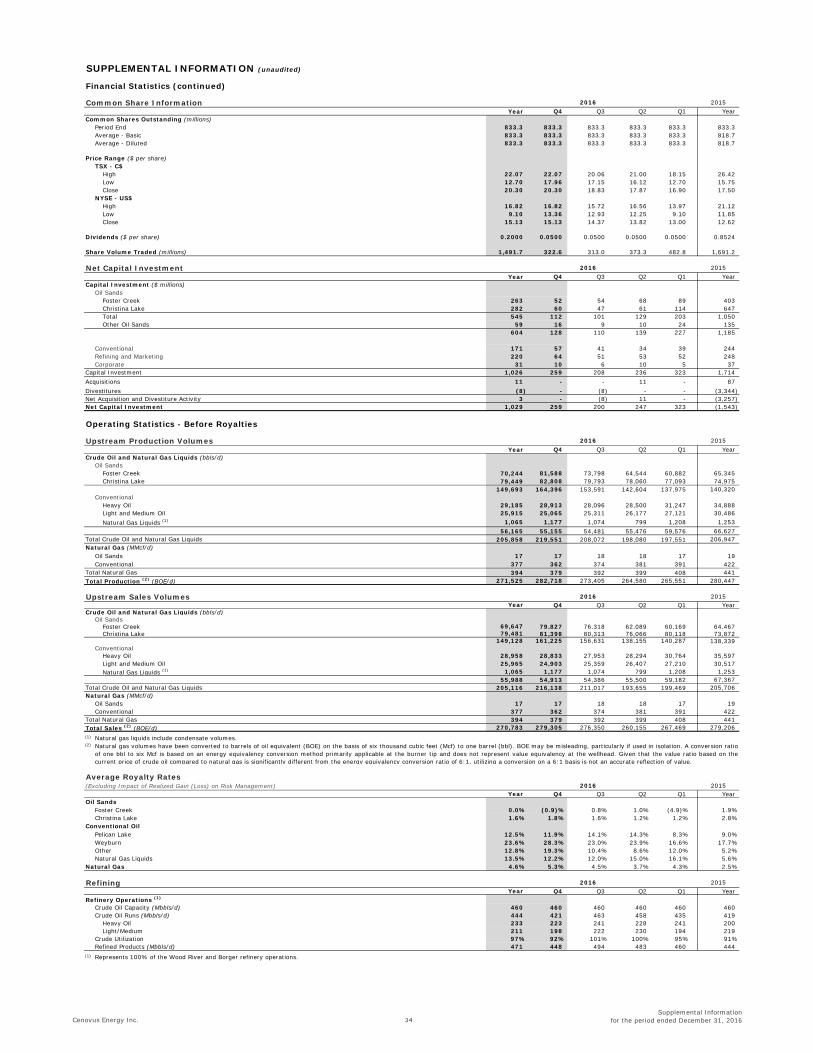
SUPPLEMENTAL INFORMATION (unaudited)
Financial Statistics (continued)
Common Share InformationYear Q4 Q3 Q2 Q1 Year
Common Shares Outstanding (millions) Period End 833.3 833.3 833.3 833.3 833.3 833.3Average - Basic 833.3 833.3 833.3 833.3 833.3 818.7 Average - Diluted 833.3 833.3 833.3 833.3 833.3 818.7
Price Range ($ per share)TSX - C$
High 22.07 22.07 20.06 21.00 18.15 26.42 Low 12.70 17.96 17.15 16.12 12.70 15.75 Close 20.30 20.30 18.83 17.87 16.90 17.50
NYSE - US$High 16.82 16.82 15.72 16.56 13.97 21.12 Low 9.10 13.36 12.93 12.25 9.10 11.85 Close 15.13 15.13 14.37 13.82 13.00 12.62
Dividends ($ per share) 0.2000 0.0500 0.0500 0.0500 0.0500 0.8524
Share Volume Traded (millions) 1,491.7 322.6 313.0 373.3 482.8 1,691.2
Net Capital InvestmentYear Q4 Q3 Q2 Q1 Year
Capital Investment ($ millions)Oil Sands
Foster Creek 263 52 54 68 89 403 Christina Lake 282 60 47 61 114 647 Total 545 112 101 129 203 1,050 Other Oil Sands 59 16 9 10 24 135
604 128 110 139 227 1,185
Conventional 171 57 41 34 39 244 Refining and Marketing 220 64 51 53 52 248 Corporate 31 10 6 10 5 37
Capital Investment 1,026 259 208 236 323 1,714 Acquisitions 11 - - 11 - 87 Divestitures (8) - (8) - - (3,344) Net Acquisition and Divestiture Activity 3 - (8) 11 - (3,257) Net Capital Investment 1,029 259 200 247 323 (1,543)
Operating Statistics - Before Royalties
Upstream Production VolumesYear Q4 Q3 Q2 Q1 Year
Crude Oil and Natural Gas Liquids (bbls/d) Oil Sands
Foster Creek 70,244 81,588 73,798 64,544 60,882 65,345 Christina Lake 79,449 82,808 79,793 78,060 77,093 74,975
149,693 164,396 153,591 142,604 137,975 140,320 Conventional
Heavy Oil 29,185 28,913 28,096 28,500 31,247 34,888 Light and Medium Oil 25,915 25,065 25,311 26,177 27,121 30,486 Natural Gas Liquids (1) 1,065 1,177 1,074 799 1,208 1,253
56,165 55,155 54,481 55,476 59,576 66,627 Total Crude Oil and Natural Gas Liquids 205,858 219,551 208,072 198,080 197,551 206,947 Natural Gas (MMcf/d)
Oil Sands 17 17 18 18 17 19 Conventional 377 362 374 381 391 422
Total Natural Gas 394 379 392 399 408 441 Total Production (2) (BOE/d) 271,525 282,718 273,405 264,580 265,551 280,447
Upstream Sales VolumesYear Q4 Q3 Q2 Q1 Year
Crude Oil and Natural Gas Liquids (bbls/d) Oil Sands
Foster Creek 69,647 79,827 76,318 62,089 60,169 64,467 Christina Lake 79,481 81,398 80,313 76,066 80,118 73,872
149,128 161,225 156,631 138,155 140,287 138,339 Conventional
Heavy Oil 28,958 28,833 27,953 28,294 30,764 35,597 Light and Medium Oil 25,965 24,903 25,359 26,407 27,210 30,517 Natural Gas Liquids (1) 1,065 1,177 1,074 799 1,208 1,253
55,988 54,913 54,386 55,500 59,182 67,367 Total Crude Oil and Natural Gas Liquids 205,116 216,138 211,017 193,655 199,469 205,706 Natural Gas (MMcf/d)
Oil Sands 17 17 18 18 17 19 Conventional 377 362 374 381 391 422
Total Natural Gas 394 379 392 399 408 441 Total Sales (2) (BOE/d) 270,783 279,305 276,350 260,155 267,469 279,206 (1) Natural gas liquids include condensate volumes.(2)
Average Royalty Rates(Excluding Impact of Realized Gain (Loss) on Risk Management)
Year Q4 Q3 Q2 Q1 YearOil Sands
Foster Creek 0.0% (0.9)% 0.8% 1.0% (4.9)% 1.9%Christina Lake 1.6% 1.8% 1.6% 1.2% 1.2% 2.8%
Conventional OilPelican Lake 12.5% 11.9% 14.1% 14.3% 8.3% 9.0%Weyburn 23.6% 28.3% 23.0% 23.9% 16.6% 17.7%Other 12.8% 19.3% 10.4% 8.6% 12.0% 5.2%Natural Gas Liquids 13.5% 12.2% 12.0% 15.0% 16.1% 5.6%
Natural Gas 4.6% 5.3% 4.5% 3.7% 4.3% 2.5%
RefiningYear Q4 Q3 Q2 Q1 Year
Refinery Operations (1)
Crude Oil Capacity (Mbbls/d) 460 460 460 460 460 460 Crude Oil Runs (Mbbls/d) 444 421 463 458 435 419
Heavy Oil 233 223 241 228 241 200 Light/Medium 211 198 222 230 194 219
Crude Utilization 97% 92% 101% 100% 95% 91%Refined Products (Mbbls/d) 471 448 494 483 460 444
(1) Represents 100% of the Wood River and Borger refinery operations.
2015
2015
2015
2015
2016
2015
2016
2016
2016
2016
2016 2015
Natural gas volumes have been converted to barrels of oil equivalent (BOE) on the basis of six thousand cubic feet (Mcf) to one barrel (bbl). BOE may be misleading, particularly if used in isolation. A conversion ratioof one bbl to six Mcf is based on an energy equivalency conversion method primarily applicable at the burner tip and does not represent value equivalency at the wellhead. Given that the value ratio based on thecurrent price of crude oil compared to natural gas is significantly different from the energy equivalency conversion ratio of 6:1, utilizing a conversion on a 6:1 basis is not an accurate reflection of value.
Cenovus Energy Inc. 34Supplemental Information
for the period ended December 31, 2016
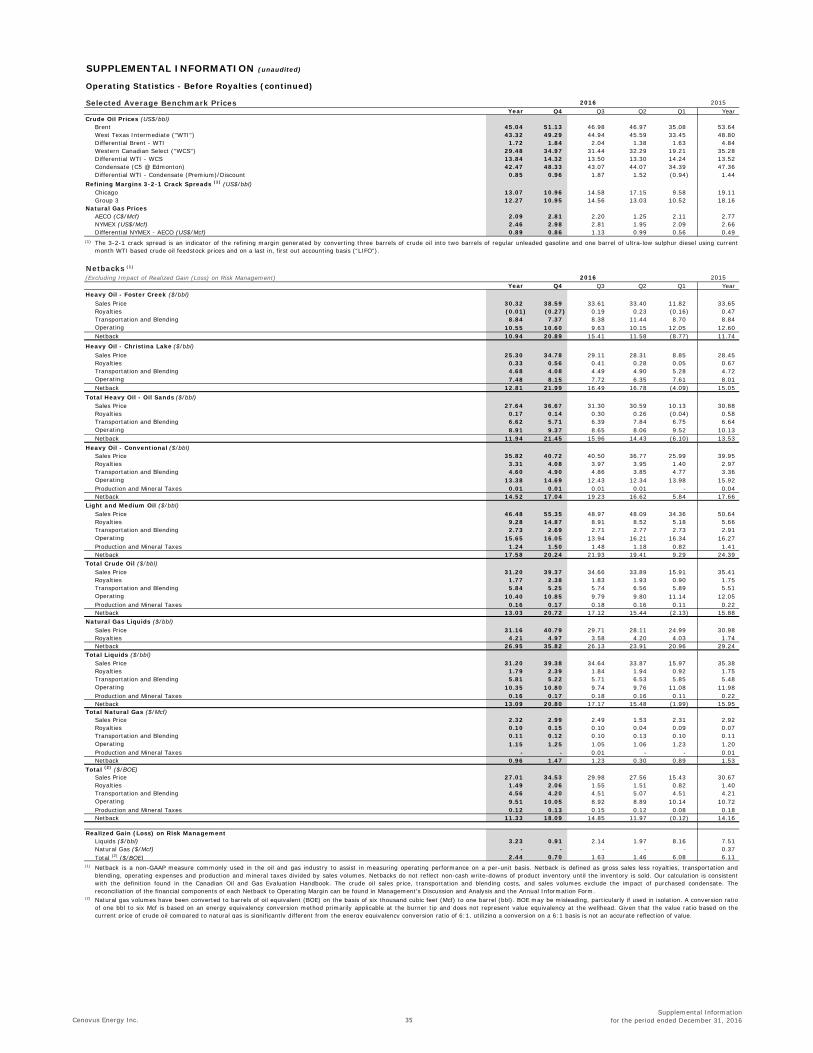
SUPPLEMENTAL INFORMATION (unaudited)
Operating Statistics - Before Royalties (continued)
Selected Average Benchmark PricesYear Q4 Q3 Q2 Q1 Year
Crude Oil Prices (US$/bbl)Brent 45.04 51.13 46.98 46.97 35.08 53.64 West Texas Intermediate ("WTI") 43.32 49.29 44.94 45.59 33.45 48.80 Differential Brent - WTI 1.72 1.84 2.04 1.38 1.63 4.84 Western Canadian Select ("WCS") 29.48 34.97 31.44 32.29 19.21 35.28 Differential WTI - WCS 13.84 14.32 13.50 13.30 14.24 13.52 Condensate (C5 @ Edmonton) 42.47 48.33 43.07 44.07 34.39 47.36 Differential WTI - Condensate (Premium)/Discount 0.85 0.96 1.87 1.52 (0.94) 1.44
Refining Margins 3-2-1 Crack Spreads (1) (US$/bbl)Chicago 13.07 10.96 14.58 17.15 9.58 19.11 Group 3 12.27 10.95 14.56 13.03 10.52 18.16
Natural Gas PricesAECO (C$/Mcf) 2.09 2.81 2.20 1.25 2.11 2.77 NYMEX (US$/Mcf) 2.46 2.98 2.81 1.95 2.09 2.66 Differential NYMEX - AECO (US$/Mcf) 0.89 0.86 1.13 0.99 0.56 0.49
(1)
Netbacks (1)
(Excluding Impact of Realized Gain (Loss) on Risk Management)Year Q4 Q3 Q2 Q1 Year
Heavy Oil - Foster Creek ($/bbl)Sales Price 30.32 38.59 33.61 33.40 11.82 33.65 Royalties (0.01) (0.27) 0.19 0.23 (0.16) 0.47 Transportation and Blending 8.84 7.37 8.38 11.44 8.70 8.84 Operating 10.55 10.60 9.63 10.15 12.05 12.60 Netback 10.94 20.89 15.41 11.58 (8.77) 11.74
Heavy Oil - Christina Lake ($/bbl)Sales Price 25.30 34.78 29.11 28.31 8.85 28.45 Royalties 0.33 0.56 0.41 0.28 0.05 0.67 Transportation and Blending 4.68 4.08 4.49 4.90 5.28 4.72 Operating 7.48 8.15 7.72 6.35 7.61 8.01 Netback 12.81 21.99 16.49 16.78 (4.09) 15.05
Total Heavy Oil - Oil Sands ($/bbl)Sales Price 27.64 36.67 31.30 30.59 10.13 30.88 Royalties 0.17 0.14 0.30 0.26 (0.04) 0.58 Transportation and Blending 6.62 5.71 6.39 7.84 6.75 6.64 Operating 8.91 9.37 8.65 8.06 9.52 10.13 Netback 11.94 21.45 15.96 14.43 (6.10) 13.53
Heavy Oil - Conventional ($/bbl)Sales Price 35.82 40.72 40.50 36.77 25.99 39.95 Royalties 3.31 4.08 3.97 3.95 1.40 2.97 Transportation and Blending 4.60 4.90 4.86 3.85 4.77 3.36 Operating 13.38 14.69 12.43 12.34 13.98 15.92 Production and Mineral Taxes 0.01 0.01 0.01 0.01 - 0.04 Netback 14.52 17.04 19.23 16.62 5.84 17.66
Light and Medium Oil ($/bbl)Sales Price 46.48 55.35 48.97 48.09 34.36 50.64 Royalties 9.28 14.87 8.91 8.52 5.18 5.66 Transportation and Blending 2.73 2.69 2.71 2.77 2.73 2.91 Operating 15.65 16.05 13.94 16.21 16.34 16.27 Production and Mineral Taxes 1.24 1.50 1.48 1.18 0.82 1.41 Netback 17.58 20.24 21.93 19.41 9.29 24.39
Total Crude Oil ($/bbl) Sales Price 31.20 39.37 34.66 33.89 15.91 35.41 Royalties 1.77 2.38 1.83 1.93 0.90 1.75 Transportation and Blending 5.84 5.25 5.74 6.56 5.89 5.51 Operating 10.40 10.85 9.79 9.80 11.14 12.05 Production and Mineral Taxes 0.16 0.17 0.18 0.16 0.11 0.22 Netback 13.03 20.72 17.12 15.44 (2.13) 15.88
Natural Gas Liquids ($/bbl)Sales Price 31.16 40.79 29.71 28.11 24.99 30.98 Royalties 4.21 4.97 3.58 4.20 4.03 1.74 Netback 26.95 35.82 26.13 23.91 20.96 29.24
Total Liquids ($/bbl)Sales Price 31.20 39.38 34.64 33.87 15.97 35.38 Royalties 1.79 2.39 1.84 1.94 0.92 1.75 Transportation and Blending 5.81 5.22 5.71 6.53 5.85 5.48 Operating 10.35 10.80 9.74 9.76 11.08 11.98 Production and Mineral Taxes 0.16 0.17 0.18 0.16 0.11 0.22 Netback 13.09 20.80 17.17 15.48 (1.99) 15.95
Total Natural Gas ($/Mcf) Sales Price 2.32 2.99 2.49 1.53 2.31 2.92 Royalties 0.10 0.15 0.10 0.04 0.09 0.07 Transportation and Blending 0.11 0.12 0.10 0.13 0.10 0.11 Operating 1.15 1.25 1.05 1.06 1.23 1.20 Production and Mineral Taxes - - 0.01 - - 0.01 Netback 0.96 1.47 1.23 0.30 0.89 1.53
Total (2) ($/BOE) Sales Price 27.01 34.53 29.98 27.56 15.43 30.67 Royalties 1.49 2.06 1.55 1.51 0.82 1.40 Transportation and Blending 4.56 4.20 4.51 5.07 4.51 4.21 Operating 9.51 10.05 8.92 8.89 10.14 10.72 Production and Mineral Taxes 0.12 0.13 0.15 0.12 0.08 0.18 Netback 11.33 18.09 14.85 11.97 (0.12) 14.16
Realized Gain (Loss) on Risk ManagementLiquids ($/bbl) 3.23 0.91 2.14 1.97 8.16 7.51 Natural Gas ($/Mcf) - - - - - 0.37 Total (2) ($/BOE) 2.44 0.70 1.63 1.46 6.08 6.11
(1)
(2) Natural gas volumes have been converted to barrels of oil equivalent (BOE) on the basis of six thousand cubic feet (Mcf) to one barrel (bbl). BOE may be misleading, particularly if used in isolation. A conversion ratioof one bbl to six Mcf is based on an energy equivalency conversion method primarily applicable at the burner tip and does not represent value equivalency at the wellhead. Given that the value ratio based on thecurrent price of crude oil compared to natural gas is significantly different from the energy equivalency conversion ratio of 6:1, utilizing a conversion on a 6:1 basis is not an accurate reflection of value.
Netback is a non-GAAP measure commonly used in the oil and gas industry to assist in measuring operating performance on a per-unit basis. Netback is defined as gross sales less royalties, transportation andblending, operating expenses and production and mineral taxes divided by sales volumes. Netbacks do not reflect non-cash write-downs of product inventory until the inventory is sold. Our calculation is consistentwith the definition found in the Canadian Oil and Gas Evaluation Handbook. The crude oil sales price, transportation and blending costs, and sales volumes exclude the impact of purchased condensate. Thereconciliation of the financial components of each Netback to Operating Margin can be found in Management's Discussion and Analysis and the Annual Information Form.
20152016
The 3-2-1 crack spread is an indicator of the refining margin generated by converting three barrels of crude oil into two barrels of regular unleaded gasoline and one barrel of ultra-low sulphur diesel using currentmonth WTI based crude oil feedstock prices and on a last in, first out accounting basis (“LIFO”).
20152016
Cenovus Energy Inc. 35Supplemental Information
for the period ended December 31, 2016