Embed Size (px)
Citation preview
Page | 1
Equity Research
Cement Sector Update
Table of Contents
Cement Industry in 2016 .......................................................................................................................................................... 2
Cement demand to pick up ................................................................................................................................... 2
Growth on Infrastructure Push ............................................................................................................................. 3
Attention to shift towards optimising capacity utilisation level ............................................................................. 3
Robust Domestic Sales, Exports, set to take centre stage ...................................................................................... 4
Renewed calls for concrete road technology by major cement producers ............................................................. 4
Dangote Cement Plc ................................................................................................................................................................. 5
Stronger push for volume sales expected in 2016 ................................................................................................. 5
Margins to remain resilient ................................................................................................................................... 5
FY’16 valuations revised downwards on lower cement prices ............................................................................... 6
FY’15 Review ........................................................................................................................................................ 7
Lafarge Africa Plc ...................................................................................................................................................................... 9
Unification, Rationalisation and Growth ............................................................................................................... 9
A comprehensive roll-out plan for 2016 ................................................................................................................ 9
Consolidated group valuation incites a BUY rating .............................................................................................. 10
FY’15 Review ...................................................................................................................................................... 11
Page | 2
Equity Research
Cement Sector Update
Cement Industry in 2016
Cement demand to pick up
According to Dangote Cement Plc (Nigeria’s biggest cement producer with a market share of
c.62%), Nigeria's cement industry offers robust growth opportunities in the long term with a
forecast 10% annual increase in demand as the economic environment improves. The
government, particularly at the federal level, is likely to be a major driver of cement demand in
2016 as shown by the proposed 2016 budget of N6 trillion which is the country’s most
ambitious since 1999. In our view, the expected CAPEX on infrastructural development (N1.5
trillion) should boost construction activity, if adequately implemented. Cement which
constitutes about 7% to 15% of concrete - (a mixture of cement and other aggregates), is a key
material in construction; thus an increase in construction activities naturally means a rise in
demand for cement as well. A large chunk of the activity recorded in the building and
construction sector in 2015 could be attributable to the private sector (individual home
builders) given that government activities were modest because of elections.
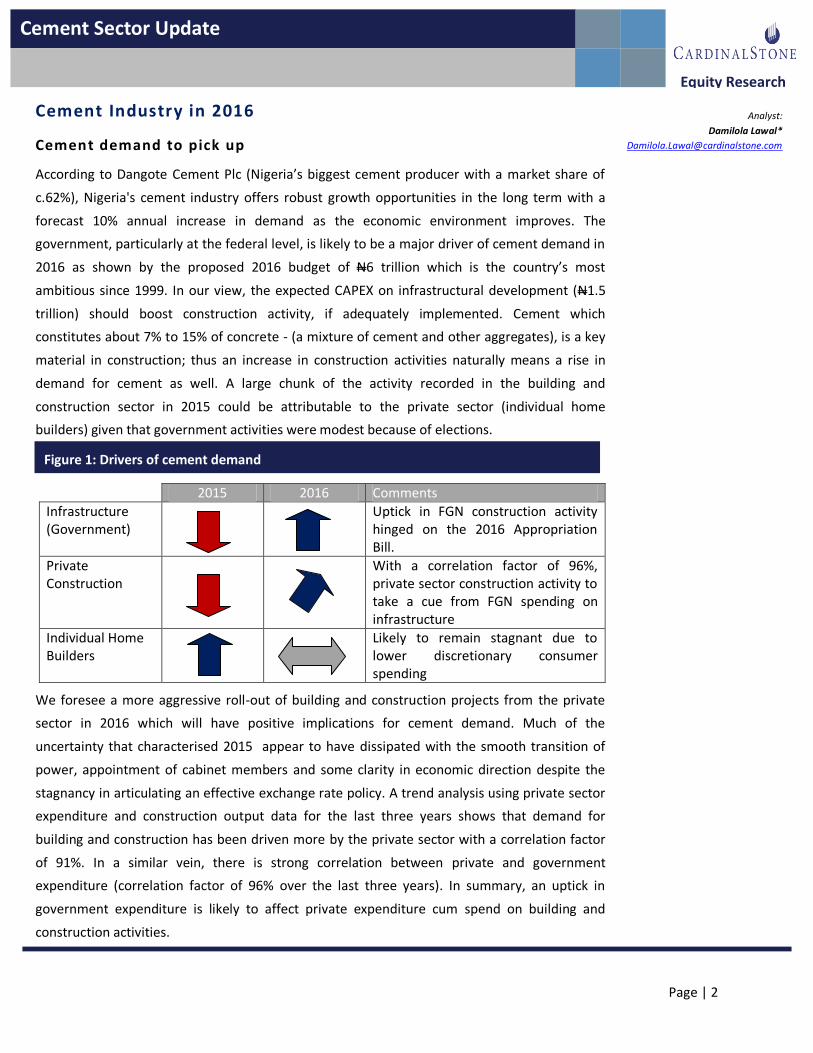
2015 2016 Comments
Infrastructure (Government)
Uptick in FGN construction activity hinged on the 2016 Appropriation Bill.
Private Construction
With a correlation factor of 96%, private sector construction activity to take a cue from FGN spending on infrastructure
Individual Home Builders
Likely to remain stagnant due to lower discretionary consumer spending
We foresee a more aggressive roll-out of building and construction projects from the private
sector in 2016 which will have positive implications for cement demand. Much of the
uncertainty that characterised 2015 appear to have dissipated with the smooth transition of
power, appointment of cabinet members and some clarity in economic direction despite the
stagnancy in articulating an effective exchange rate policy. A trend analysis using private sector
expenditure and construction output data for the last three years shows that demand for
building and construction has been driven more by the private sector with a correlation factor
of 91%. In a similar vein, there is strong correlation between private and government
expenditure (correlation factor of 96% over the last three years). In summary, an uptick in
government expenditure is likely to affect private expenditure cum spend on building and
construction activities.
Analyst:
Damilola Lawal*
Figure 1: Drivers of cement demand
Page | 3
Equity Research
Cement Sector Update
Growth on Infrastructure Push
2015 was a sluggish year for Nigeria’s cement industry amidst slowing economic growth. Lower
commodity prices as well as political uncertainty curtailed government spending on capital
projects. Amidst the economic slowdown and weakening purchasing power, the private sector
also cancelled or delayed commencing many construction projects. Total cement sales rose by
2.5% YoY to 21.5 million tonnes in 2015. President Muhammadu Buhari seems to be living up to
his pledge to boost economic growth by increasing government spending on infrastructure.
Partly underscoring this commitment, the 2016 appropriation bill allocates N1.5 trillion towards
capital projects in 2016; the highest since 2009 (in absolute value) to be apportioned to CAPEX
and 30% of the total budget (Last 5-year average: 21%). Unsurprisingly, the Ministry of Works,
Power and Housing received the highest CAPEX allocation (N423.0 billion). Another N242.5
billion was earmarked for special projects under capital allocation. These include the FGN
Special Intervention Programme (N200.0 billion); Federal Initiative for the North East (N12.0
billion), payment of Local Contractor’s Debt (N25.5 billion) and Refunds to state governments
for federal road projects (N5.0 billion). The bulk of this allocation will directly or indirectly
improve construction activities.
Attention to shift towards optimis ing capacity uti lisation level
The cement industry witnessed huge capacity expansion of 26.7 million tonne post FY10.
Nigeria has emerged as the continent’s indisputable giant, with total capacity of 40.7 million
tonnes annually, around one quarter of Sub Saharan Africa’s cement production capacity. This
enabled Nigeria to eclipse the region’s historical leader, South Africa, which produces 19 million
tonnes annually. Hoping to ride on the construction boom in the country and backed by
government support and higher retail prices compared to neighbouring West African countries
such as Ghana and Benin Republic, cement manufacturers saw the incentive to increase their
installed capacities. This huge expansion distorted the demand-supply dynamics of the
industry. The Nigerian cement industry has commissioned 26.7 million tonnes of new capacities
in the last six (6) years, of which 14.7 million tonnes (55%) were in the last three (3) years. We
expect the pace of capacity addition to slow or even grind to a halt once the already announced
capacities by local manufacturers come on stream. Attention will then focus on improving the
utilisation level which was an average of 54% in 2015, on the back of fresh demand for housing,
urban and infrastructure development.
Page | 4
Equity Research
Cement Sector Update
Robust Domestic Sales , Exports, set to take centre stage
The rapid expansion of production capacity across the country has led to a sharp drop in
cement imports. Nigeria, which as recently as 2010 was importing c.6 million tonnes worth of
cement each year, has seen imports slump to less than 1 million tonnes in 2015. This reflects
the steady tightening of the Nigeria’s import regime, where the federal government phased out
licences to import cement and encouraged investment in local production. With supply
exceeding demand in Nigeria, major cement producers are exploring new markets, particularly
in West and Central Africa given their closer proximity to Nigeria. West Africa is of particular
focus for Dangote Cement given that the group will benefit from duty free trade within the
Economic Community of West African States (ECOWAS). About 0.7 million tonnes were
exported to Ghana this year and plans are afoot to expand this program and even extend their
reach to Togo, Cameroun, Ivory Coast, Liberia, Mali and Niger. The lack of limestone in these
countries limits cement production and defines Dangote Cement’s export strategy to these
regions. Not to be left out, Lafarge Africa at its last management presentation to analysts
announced plans to open a grinding facility in neighbouring Ghana.
Renewed ca lls for concrete road technology by major cement producers
With supply ahead of demand in the cement industry, the major producers may have found
succor in the existing infrastructural gap in the country as a means of achieving optimal
utilisation of the commodity. Hence, there are renewed calls to push for the adoption of
cement and concrete in road construction. In our view, there is no better time to embrace the
option of using cement and concrete for roads in the country. This will align with the federal
government’s “Buy Naija to Grow the Naira” drive given that cement is made using more
locally sourced content (limestone), compared to asphalt whose major raw material
component – Bitumen – is imported due to the inefficient state of local refineries. Whilst initial
construction costs for concrete roads may be higher, they are cheaper in the long term due to
the lower maintenance costs and considerably longer life span (27 years vs. 17 years for asphalt
roads). Lafarge recently constructed a road in Aba using concrete and is receiving significant
interest, support and commitment from the federal government and state governments
looking to expand massively on this approach.
Page | 5
Equity Research
Cement Sector Update
Dangote Cement Plc
Dangote Cement Plc
Stronger push for volume sales expected in 2016
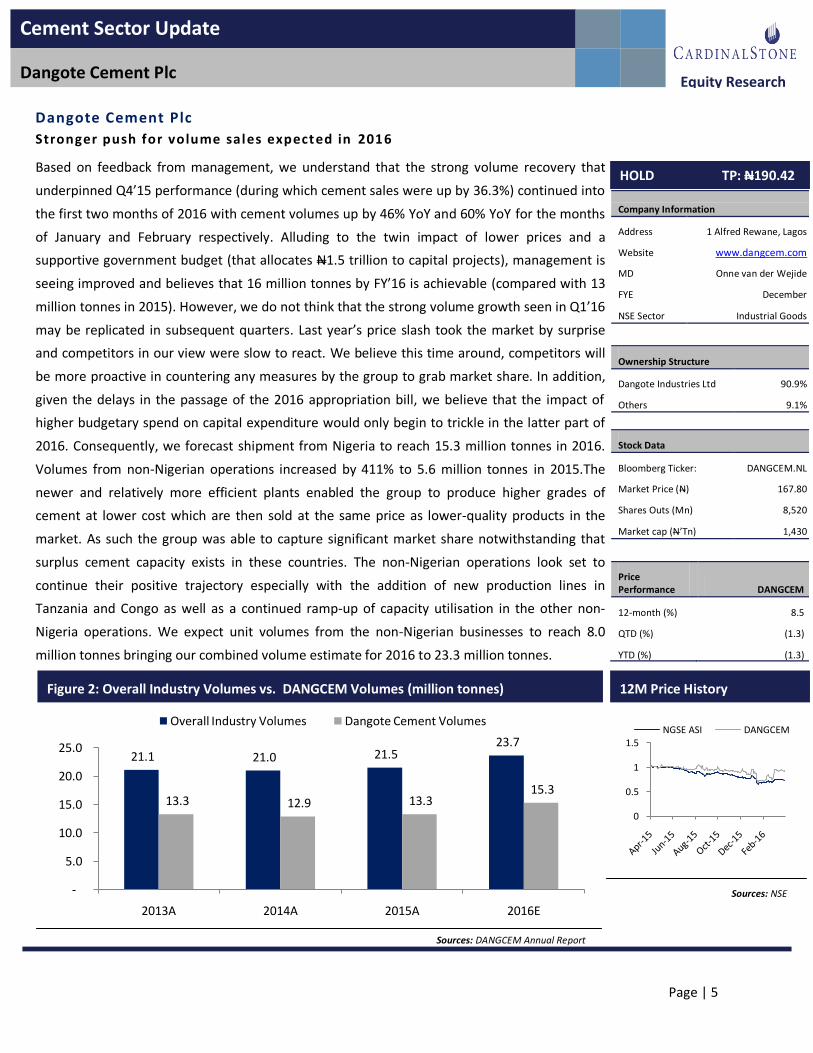
Based on feedback from management, we understand that the strong volume recovery that
underpinned Q4’15 performance (during which cement sales were up by 36.3%) continued into
the first two months of 2016 with cement volumes up by 46% YoY and 60% YoY for the months
of January and February respectively. Alluding to the twin impact of lower prices and a
supportive government budget (that allocates N1.5 trillion to capital projects), management is
seeing improved and believes that 16 million tonnes by FY’16 is achievable (compared with 13
million tonnes in 2015). However, we do not think that the strong volume growth seen in Q1’16
may be replicated in subsequent quarters. Last year’s price slash took the market by surprise
and competitors in our view were slow to react. We believe this time around, competitors will
be more proactive in countering any measures by the group to grab market share. In addition,
given the delays in the passage of the 2016 appropriation bill, we believe that the impact of
higher budgetary spend on capital expenditure would only begin to trickle in the latter part of
2016. Consequently, we forecast shipment from Nigeria to reach 15.3 million tonnes in 2016.
Volumes from non-Nigerian operations increased by 411% to 5.6 million tonnes in 2015.The
newer and relatively more efficient plants enabled the group to produce higher grades of
cement at lower cost which are then sold at the same price as lower-quality products in the
market. As such the group was able to capture significant market share notwithstanding that
surplus cement capacity exists in these countries. The non-Nigerian operations look set to
continue their positive trajectory especially with the addition of new production lines in
Tanzania and Congo as well as a continued ramp-up of capacity utilisation in the other non-
Nigeria operations. We expect unit volumes from the non-Nigerian businesses to reach 8.0
million tonnes bringing our combined volume estimate for 2016 to 23.3 million tonnes.
21.1 21.0 21.5 23.7
13.3 12.9 13.3 15.3
-
5.0
10.0
15.0
20.0
25.0
2013A 2014A 2015A 2016E
Overall Industry Volumes Dangote Cement Volumes
Figure 2: Overall Industry Volumes vs. DANGCEM Volumes (million tonnes)
Sources: DANGCEM Annual Report
Company Information
Address 1 Alfred Rewane, Lagos
Website www.dangcem.com
MD Onne van der Wejide
FYE December
NSE Sector Industrial Goods
Ownership Structure
Dangote Industries Ltd 90.9%
Others 9.1%
Stock Data
Bloomberg Ticker: DANGCEM.NL
Market Price (N) 167.80
Shares Outs (Mn) 8,520
Market cap (N’Tn) 1,430
Price Performance DANGCEM
12-month (%) 8.5
QTD (%) (1.3)
YTD (%) (1.3)
HOLD TP: N190.42
0
0.5
1
1.5NGSE ASI DANGCEM
12M Price History
Sources: NSE
Page | 6
Equity Research
Cement Sector Update
Dangote Cement Plc
Margins to remain resil ient
The Group has completed its coal back-up project which replaces the three times (3X) more
expensive low pour fuel oil (LPFO), suggesting significant savings on energy cost with the
substitution given current concerns about reliable gas supply. Overall, across 2015, Obajana’s
fuel usage was 90.6% gas and 4.6% coal, with just 4.8% use of LPFO during the year, compared
with 24% LPFO in 2014 whilst at Ibese, gas utilisation was 79% (2014: 89%) with the rest
supplied by coal. Given current concerns about gas supply on the back of frequent
vandalisation, gas utilization rate is likely to drop but the coal back-up project and LPFO should
make up for any shortfalls in gas supply. In line with FY’15 performance, we expect OPEX
pressures to persist in 2016 and forecast a 14.9% rise in operating expenses. Specifically, sharp
increases in distribution and administrative expenses should continue, reflecting the ramp up of
logistics and administrative capabilities to support maiden market penetration outside Nigeria.
Overall, we expect gross and operating margins to drop to 58.7% and 41.9% from 59.0% and
42.3% in FY’15 respectively.
FY’16 va luations revised downwards on lower cement prices
Our revised overall volume growth forecast of 24% translates to revenue growth of 13% to
N555.4 billion (2015: N491.7 billion). On other fronts, after adjusting for our expectations for
input and operating expenses as the business ramps up its investments across the group, a
slightly narrower tax rate hinged on its tax exemptions, we revise our FY’16 PAT forecast to
N202.0 billion (2015: N181.3 billion). Our target price is cut to N190.42, HOLD (Previous:
N192.53, BUY), as we have increased our equity risk premium. We find Dangcem slightly
expensive on a relative valuation basis, given our estimated 2016 P/E of 14.6x relative to 10.0x
for Bloomberg EMEA peers.
Page | 7
Equity Research
Cement Sector Update
Dangote Cement Plc
FY’15 Review
Africa gaining momentum - Dangote Cement Plc reported strong volume growth for FY’15, up
by 35% YoY to 19 million tonnes. Cement volumes in Nigeria rose by 3.2% due to a sharp
recovery in the fourth quarter underpinned by the 18% price slash in September. The group
also reported strong performances across the ‘Rest of Africa’. Specifically, volumes from its
West & Central Africa operations and South & East Africa operation were up 592% YoY and
340% YoY to 2.1 million tonnes and 3.5 million tonnes respectively, thanks to the maiden
contributions from Senegal, Cameroon, Ethopia, Zambia and Tanzania which were augmented
by substantially better results in Ghana and South Africa. Group revenues came in at N491.7
billion up by 25.6% (2014: N391.6 billion).
Earnings rise by 13.7% YoY - Cost of sales and operating expenses increased by 41.3% YoY and
32.2% to N202.2 billion and N86.0 billion respectively. The bulk of these increases were
attributable to the commencement of operations outside Nigeria as well as marketing
initiatives aimed at increasing brand awareness and market recognition of the quality of the
group’s 3X cement. The Group posted an operating profit of ₦207.8bn, 11.1% higher than the
₦187.1 billion generated in 2014, with all the regions (Nigerian and Non-Nigerian) achieving
profitability at operating level. With new plants ramping up throughout Africa, the operating
profit margin fell to 42.3% from 47.8% in 2014. Compounding the pressure was the 712.5% rise
in net finance charges which limited PBT growth to 2.0% with related margin at 38.3% (2014:
47.2%). However, a lower effective tax rate of 3.7% (vs. tax rate of 13.6% in the corresponding
period of 2014), raised earnings by 13.7% to N181.3 billion. According to management, lower
taxes reflect pioneer tax status on Ibese Line 3 & 4 and Obajana Line 4.
Page | 8
Equity Research
Cement Sector Update
Dangote Cement Plc
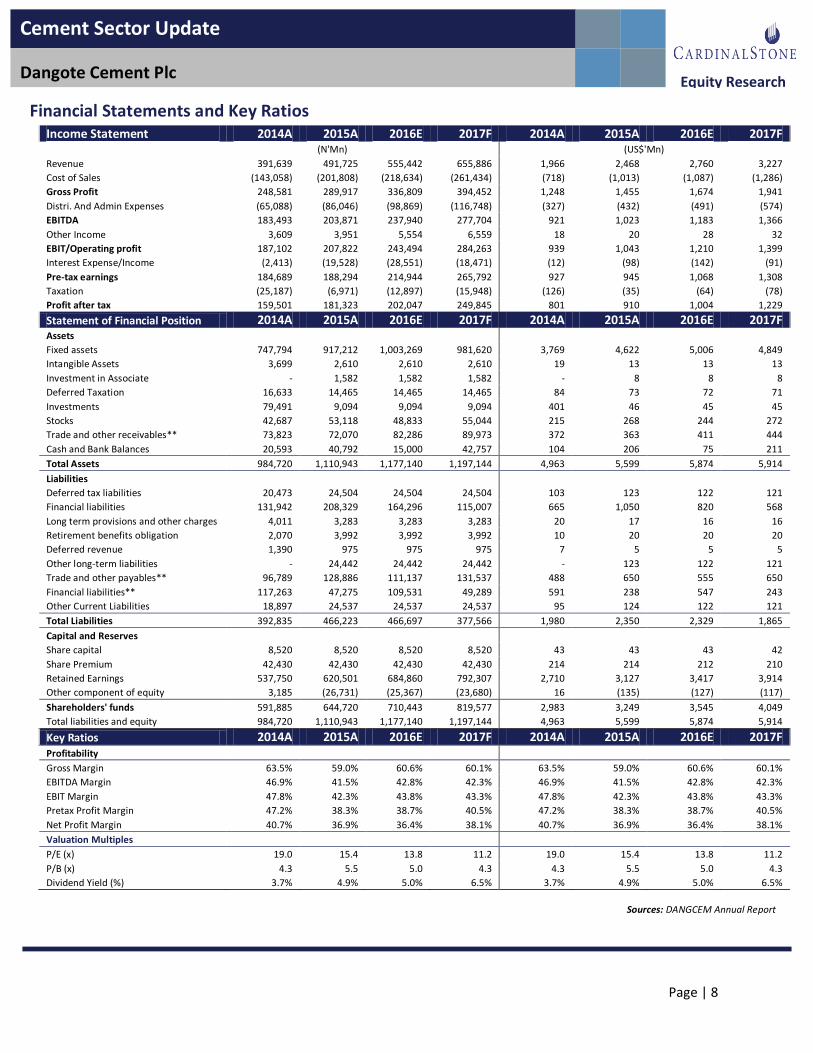
Financial Statements and Key Ratios Income Statement 2014A 2015A 2016E 2017F 2014A 2015A 2016E 2017F
(N'Mn)
(US$'Mn)
Revenue 391,639 491,725 555,442 655,886 1,966 2,468 2,760 3,227
Cost of Sales (143,058) (201,808) (218,634) (261,434) (718) (1,013) (1,087) (1,286)
Gross Profit 248,581 289,917 336,809 394,452 1,248 1,455 1,674 1,941
Distri. And Admin Expenses (65,088) (86,046) (98,869) (116,748) (327) (432) (491) (574)
EBITDA 183,493 203,871 237,940 277,704 921 1,023 1,183 1,366
Other Income 3,609 3,951 5,554 6,559 18 20 28 32
EBIT/Operating profit 187,102 207,822 243,494 284,263 939 1,043 1,210 1,399
Interest Expense/Income (2,413) (19,528) (28,551) (18,471) (12) (98) (142) (91)
Pre-tax earnings 184,689 188,294 214,944 265,792 927 945 1,068 1,308
Taxation (25,187) (6,971) (12,897) (15,948) (126) (35) (64) (78)
Profit after tax 159,501 181,323 202,047 249,845 801 910 1,004 1,229
Statement of Financial Position 2014A 2015A 2016E 2017F 2014A 2015A 2016E 2017F Assets
Fixed assets 747,794 917,212 1,003,269 981,620 3,769 4,622 5,006 4,849
Intangible Assets 3,699 2,610 2,610 2,610 19 13 13 13
Investment in Associate - 1,582 1,582 1,582 - 8 8 8
Deferred Taxation 16,633 14,465 14,465 14,465 84 73 72 71
Investments 79,491 9,094 9,094 9,094 401 46 45 45
Stocks 42,687 53,118 48,833 55,044 215 268 244 272
Trade and other receivables** 73,823 72,070 82,286 89,973 372 363 411 444
Cash and Bank Balances 20,593 40,792 15,000 42,757 104 206 75 211
Total Assets 984,720 1,110,943 1,177,140 1,197,144 4,963 5,599 5,874 5,914
Liabilities Deferred tax liabilities 20,473 24,504 24,504 24,504 103 123 122 121
Financial liabilities 131,942 208,329 164,296 115,007 665 1,050 820 568
Long term provisions and other charges 4,011 3,283 3,283 3,283 20 17 16 16
Retirement benefits obligation 2,070 3,992 3,992 3,992 10 20 20 20
Deferred revenue 1,390 975 975 975 7 5 5 5
Other long-term liabilities - 24,442 24,442 24,442 - 123 122 121
Trade and other payables** 96,789 128,886 111,137 131,537 488 650 555 650
Financial liabilities** 117,263 47,275 109,531 49,289 591 238 547 243
Other Current Liabilities 18,897 24,537 24,537 24,537 95 124 122 121
Total Liabilities 392,835 466,223 466,697 377,566 1,980 2,350 2,329 1,865
Capital and Reserves Share capital 8,520 8,520 8,520 8,520 43 43 43 42
Share Premium 42,430 42,430 42,430 42,430 214 214 212 210
Retained Earnings 537,750 620,501 684,860 792,307 2,710 3,127 3,417 3,914
Other component of equity 3,185 (26,731) (25,367) (23,680) 16 (135) (127) (117)
Shareholders' funds 591,885 644,720 710,443 819,577 2,983 3,249 3,545 4,049
Total liabilities and equity 984,720 1,110,943 1,177,140 1,197,144 4,963 5,599 5,874 5,914
Key Ratios 2014A 2015A 2016E 2017F 2014A 2015A 2016E 2017F Profitability
Gross Margin 63.5% 59.0% 60.6% 60.1% 63.5% 59.0% 60.6% 60.1%
EBITDA Margin 46.9% 41.5% 42.8% 42.3% 46.9% 41.5% 42.8% 42.3%
EBIT Margin 47.8% 42.3% 43.8% 43.3% 47.8% 42.3% 43.8% 43.3%
Pretax Profit Margin 47.2% 38.3% 38.7% 40.5% 47.2% 38.3% 38.7% 40.5%
Net Profit Margin 40.7% 36.9% 36.4% 38.1% 40.7% 36.9% 36.4% 38.1%
Valuation Multiples P/E (x) 19.0 15.4 13.8 11.2 19.0 15.4 13.8 11.2
P/B (x) 4.3 5.5 5.0 4.3 4.3 5.5 5.0 4.3
Dividend Yield (%) 3.7% 4.9% 5.0% 6.5% 3.7% 4.9% 5.0% 6.5%
Sources: DANGCEM Annual Report
Page | 9
Equity Research
Cement Sector Update
Lafarge Africa Plc
Lafarge Africa Plc
Unif ication, Rationalisation and Growth
Lafarge Africa reported full consolidated results for the first time in FY’15, which reflected the
combined result of Lafarge Wapco, Ashaka Cement, United Cement and Atlas in Nigeria and
South Africa. The integration and merger of Lafarge Holcim worldwide triggered in Nigeria the
opportunity to bring Ashaka Cement, United Cement, Atlas and WAPCO all under one roof with
one single management team driving and optimising operations nationwide. Nigerian Cement
Holdings BV (NCH), an affiliate of Lafarge, acquired an additional 30% stake in UNICEM from
Flourmills of Nigeria Plc, making the company a wholly-owned subsidiary of NCH. Lafarge and
Holcim each own a 50% stake in NCH and with the merger of the two companies; NCH is fully
owned by the combined LafargeHolcim Group. Management anticipates that it will extract
between N8 billion to N10 billion per year of annualised synergies – 1) personnel costs to
reduce from rightsizing; 2) supplier rationalisation and contract consolidation; 3) significant
savings on general and admin costs; and 4) optimising route to market. With the consolidation
of Unicem also came obviously the debt that was taken on board to build the second 2.5 million
tonne line. A savings of N2 billion was generated by taking advantage of Lafarge Africa’s higher
credit rating to restructure the loan and in our view we expect the project to self-liquidate the
debt.
A comprehen sive rol l -out plan for 2016
According to management, the group has shifted focus towards how it can be differentiated
and how it can leverage the innovation that is available within the LafargeHolcim international
group. Based on management findings, securing a reliable supply concrete, aggregates and
cement in a timely manner is a major pain for contractors. To combat this, the Group is
introducing a single integrated offer which allows them to provide international-quality
concrete, aggregate and cement on time, to spec, which allows faster client quality, lower
hassle for construction projects, and at the end reduce lead times, thus minimizing the cost of
construction very dramatically. This strategy is already yielding fruit evidenced by the contract
with the Eko Atlantic project. The company also introduced a new product line - sulphate
resistant cement which allows concrete to survive in aggressive salt water environment. The
company is also exploring the option of mass housing and in the last two quarters has signed
agreements and partnerships with micro finance institutions and will build 1,500 homes this
year in partnership with government and developers in Abuja, Lagos and Delta State.
Company Information
Address 27B Gerrard Road, Lagos
Website www.lafarge.com.ng
MD Michel Pucheros
FYE December
NSE Sector Industrial Goods
Ownership Structure
LafargeHolcim 72.7%
Others 27.3%
Stock Data
Bloomberg Ticker: WAPCO.NL
Market Price (N) 77.00
Shares Outs (Mn) 4,404
Market cap (N’Bn) 339
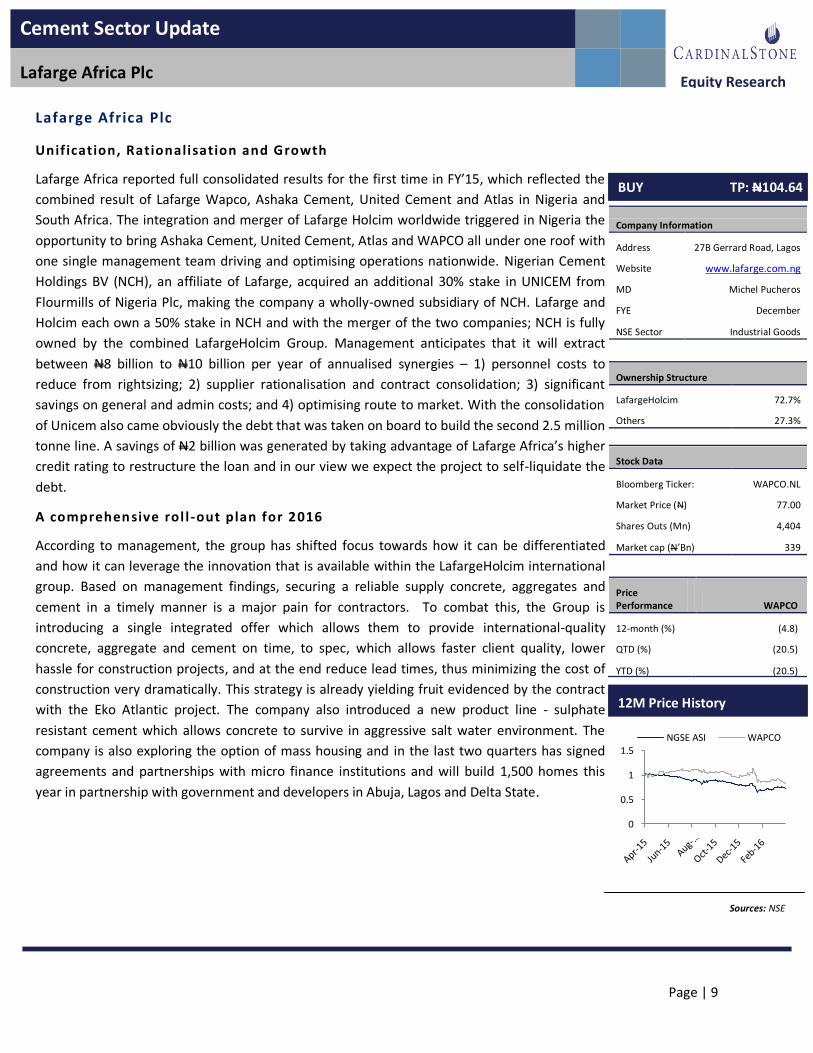
Price Performance WAPCO
12-month (%) (4.8)
QTD (%) (20.5)
YTD (%) (20.5)
BUY TP: N104.64
12M Price History
Sources: NSE
0
0.5
1
1.5NGSE ASI WAPCO
Page | 10
Equity Research
Cement Sector Update
Lafarge Africa Plc
Consolidated group valuation incites a BUY rating
We expect ramp up in production volumes in Nigeria given the return to normalcy in operations
at ASHAKCEM and UNICEM as well as the overall positive outlook for the sector, particularly in
the North East given the federal government’s rebuilding initiative. In our view, this to some
extent should mitigate the impact of lower cement pricing and as such we estimate WAPCO’s
FY’16 revenue at N274.8 billion, a 3% growth over FY’15. Also, whilst we expect finance costs to
remain high amidst the group’s current high leverage, we also expect the company to achieve
significant variable and fixed cost savings on the back of synergies from combined raw material
sourcing and a more tempered staff cost. Overall, we see the group’s FY’16 PAT at N33.0 billion
(FY’15: N26.9 billion) and revise our target price to N104.64 (Previous: N99.05).
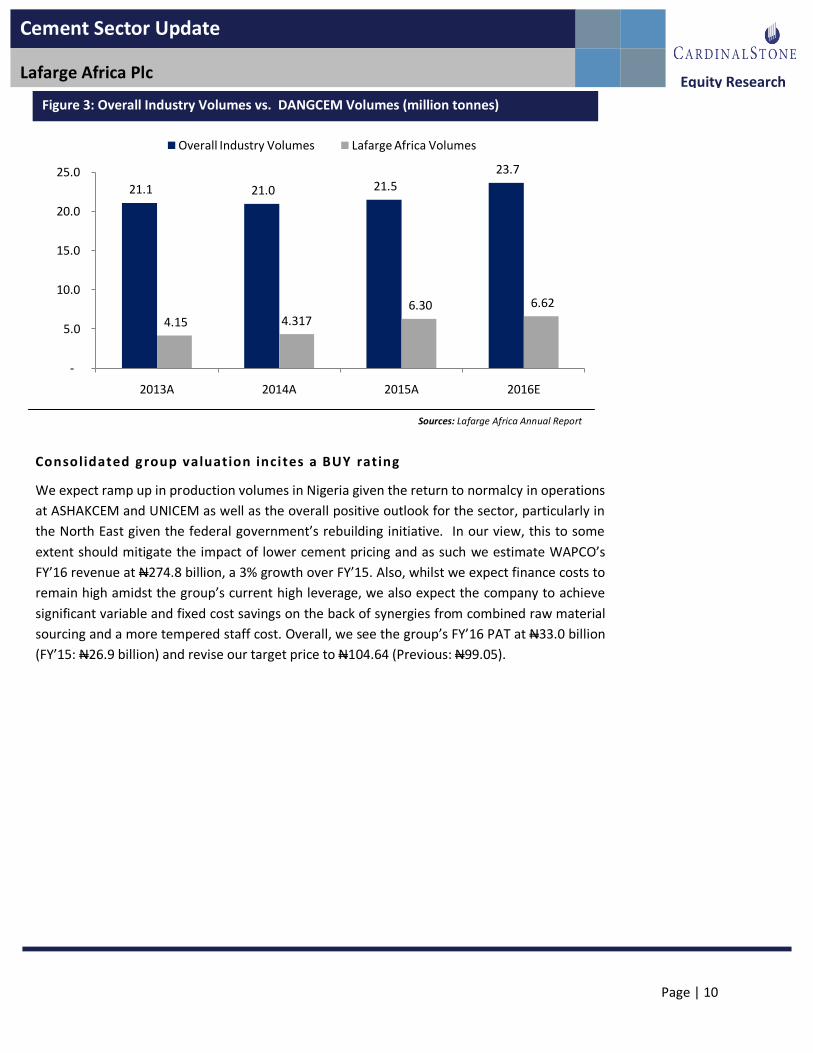
21.1 21.0 21.5
23.7
4.15 4.3176.30 6.62
-
5.0
10.0
15.0
20.0
25.0
2013A 2014A 2015A 2016E
Overall Industry Volumes Lafarge Africa Volumes
Figure 3: Overall Industry Volumes vs. DANGCEM Volumes (million tonnes)
Sources: Lafarge Africa Annual Report
Page | 11
Equity Research
Cement Sector Update
Lafarge Africa Plc
FY’15 Review
Revenue supported by Nigerian operations - Lafarge Africa Plc reported its FY 2015 results,
which consolidates contribution from UNICEM. In the same vein, the company also restated its
FY 2014 financial statements. Consolidated FY’15 revenue increased marginally by 2% YoY to
N267.2 billion given security challenges which disrupted production at ASHAKACEM, technical
challenges and flood at UNICEM, and the loss of market share following the cutback in cement
prices in Nigeria in Q4. Across the group, cement volumes were flat as the decline in the Nigeria
market (-1% YoY) was balanced by the increase in the South African market (+1% YoY). Ready
Mix Nigeria continues to wax stronger with revenue from that unit up by 29% YoY to N7.5
billion.
Margins contract on one-off expenses totalling N14.6 billion - Operating expenses surged
higher mostly relating to one-off restructuring costs associated with the consolidation of the
group’s operations and FX losses in UNICEM. EBITDA margin contracted to 25.4% from 26.7% in
the prior period falling across four of the five operating structures of the group with the
exception of UNICEM. UNICEM’s EBITDA margin rose by 9.5% to 35.4%. UNICEM comes in with
a strong EBITDA margin (buoyed by gas utilization) that hovered around 40% up until Q4’15
when the plant operation was disrupted by technical issues and floods. With the consolidation
of UNICEM also came obviously the debt that was taken to expand its installed capacity by 2.5
million tonnes. Therefore, net finance charges increased by 14% to N9.0 billion, whilst FY’15
PAT dropped by 20% YoY to N27.0 billion.
Page | 12
Equity Research
Cement Sector Update
Lafarge Africa Plc
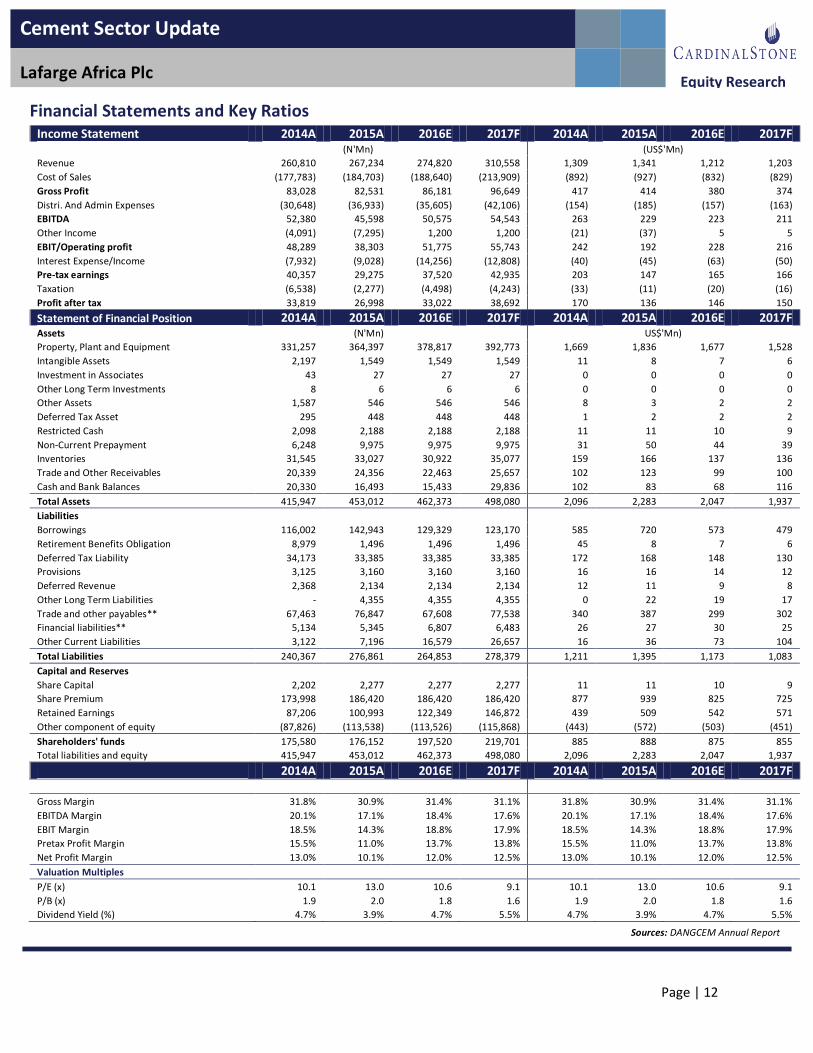
Financial Statements and Key Ratios Income Statement 2014A 2015A 2016E 2017F 2014A 2015A 2016E 2017F
(N'Mn) (US$'Mn)
Revenue 260,810 267,234 274,820 310,558 1,309 1,341 1,212 1,203
Cost of Sales (177,783) (184,703) (188,640) (213,909) (892) (927) (832) (829)
Gross Profit 83,028 82,531 86,181 96,649 417 414 380 374
Distri. And Admin Expenses (30,648) (36,933) (35,605) (42,106) (154) (185) (157) (163)
EBITDA 52,380 45,598 50,575 54,543 263 229 223 211
Other Income (4,091) (7,295) 1,200 1,200 (21) (37) 5 5
EBIT/Operating profit 48,289 38,303 51,775 55,743 242 192 228 216
Interest Expense/Income (7,932) (9,028) (14,256) (12,808) (40) (45) (63) (50)
Pre-tax earnings 40,357 29,275 37,520 42,935 203 147 165 166
Taxation (6,538) (2,277) (4,498) (4,243) (33) (11) (20) (16)
Profit after tax 33,819 26,998 33,022 38,692 170 136 146 150
Statement of Financial Position 2014A 2015A 2016E 2017F 2014A 2015A 2016E 2017F Assets
(N'Mn)
US$'Mn)
Property, Plant and Equipment 331,257 364,397 378,817 392,773 1,669 1,836 1,677 1,528
Intangible Assets 2,197 1,549 1,549 1,549 11 8 7 6
Investment in Associates 43 27 27 27 0 0 0 0
Other Long Term Investments 8 6 6 6 0 0 0 0
Other Assets 1,587 546 546 546 8 3 2 2
Deferred Tax Asset 295 448 448 448 1 2 2 2
Restricted Cash 2,098 2,188 2,188 2,188 11 11 10 9
Non-Current Prepayment 6,248 9,975 9,975 9,975 31 50 44 39
Inventories 31,545 33,027 30,922 35,077 159 166 137 136
Trade and Other Receivables 20,339 24,356 22,463 25,657 102 123 99 100
Cash and Bank Balances 20,330 16,493 15,433 29,836 102 83 68 116
Total Assets 415,947 453,012 462,373 498,080 2,096 2,283 2,047 1,937
Liabilities Borrowings 116,002 142,943 129,329 123,170 585 720 573 479
Retirement Benefits Obligation 8,979 1,496 1,496 1,496 45 8 7 6
Deferred Tax Liability 34,173 33,385 33,385 33,385 172 168 148 130
Provisions 3,125 3,160 3,160 3,160 16 16 14 12
Deferred Revenue 2,368 2,134 2,134 2,134 12 11 9 8
Other Long Term Liabilities - 4,355 4,355 4,355 0 22 19 17
Trade and other payables** 67,463 76,847 67,608 77,538 340 387 299 302
Financial liabilities** 5,134 5,345 6,807 6,483 26 27 30 25
Other Current Liabilities 3,122 7,196 16,579 26,657 16 36 73 104
Total Liabilities 240,367 276,861 264,853 278,379 1,211 1,395 1,173 1,083
Capital and Reserves Share Capital 2,202 2,277 2,277 2,277 11 11 10 9
Share Premium 173,998 186,420 186,420 186,420 877 939 825 725
Retained Earnings 87,206 100,993 122,349 146,872 439 509 542 571
Other component of equity (87,826) (113,538) (113,526) (115,868) (443) (572) (503) (451)
Shareholders' funds 175,580 176,152 197,520 219,701 885 888 875 855
Total liabilities and equity 415,947 453,012 462,373 498,080 2,096 2,283 2,047 1,937
2014A 2015A 2016E 2017F 2014A 2015A 2016E 2017F
Gross Margin 31.8% 30.9% 31.4% 31.1% 31.8% 30.9% 31.4% 31.1%
EBITDA Margin 20.1% 17.1% 18.4% 17.6% 20.1% 17.1% 18.4% 17.6%
EBIT Margin 18.5% 14.3% 18.8% 17.9% 18.5% 14.3% 18.8% 17.9%
Pretax Profit Margin 15.5% 11.0% 13.7% 13.8% 15.5% 11.0% 13.7% 13.8%
Net Profit Margin 13.0% 10.1% 12.0% 12.5% 13.0% 10.1% 12.0% 12.5%
Valuation Multiples P/E (x) 10.1 13.0 10.6 9.1 10.1 13.0 10.6 9.1
P/B (x) 1.9 2.0 1.8 1.6 1.9 2.0 1.8 1.6
Dividend Yield (%) 4.7% 3.9% 4.7% 5.5% 4.7% 3.9% 4.7% 5.5%
Sources: DANGCEM Annual Report
Page | 13
Equity Research
Cement Sector Update
Disclosure
Analyst Certification
The research analyst(s) denoted by an “*” on the cover of this report certifies (or, where multiple research analysts are primarily responsible for
this report, the research analysts denoted by an “*” on the cover or within the document individually certifies, with respect to each security or
issuer that the research analyst(s) cover in this research) that: (1) all of the views expressed in this report accurately articulate the research
analyst(s) independent views/opinions, based on public information regarding the companies, securities, industries or markets discussed in this
report. (2) The research analyst(s) compensation or remuneration is in no way connected (either directly or indirectly) to the specific
recommendations, estimates or opinions expressed in this report.
Analysts’ Compensation: The research analyst(s) responsible for the preparation of this report receive compensation based upon various factors,
including the quality and accuracy of research, client feedback, competitive factors, and overall firm revenues, which include revenues from,
among other business units, Investment Banking and Asset Management.
Investment Ratings
CardinalStone employs a 3-step rating system for equities under coverage: Buy, Hold, and Sell.
Buy ≥ +15.00% expected share price performance
Hold +0.00% to +14.99% expected share price performance
Sell < 0.00% expected share price performance
A BUY rating is given to equities with strong fundamentals, which have the potential to rise by at least +15.00% between the current price and the
analyst’s target price
An HOLD rating is given to equities with good fundamentals, which have upside potential within a range of +0.00% and +14.99%,
A SELL rating is given to equities that are highly overvalued or with weak fundamentals, where potential returns of less than 0.00% is expected,
between the current price and analyst’s target price.
A NEGATIVE WATCH is given to equities whose fundamentals may deteriorate significantly over the next six (6) months, in our view.
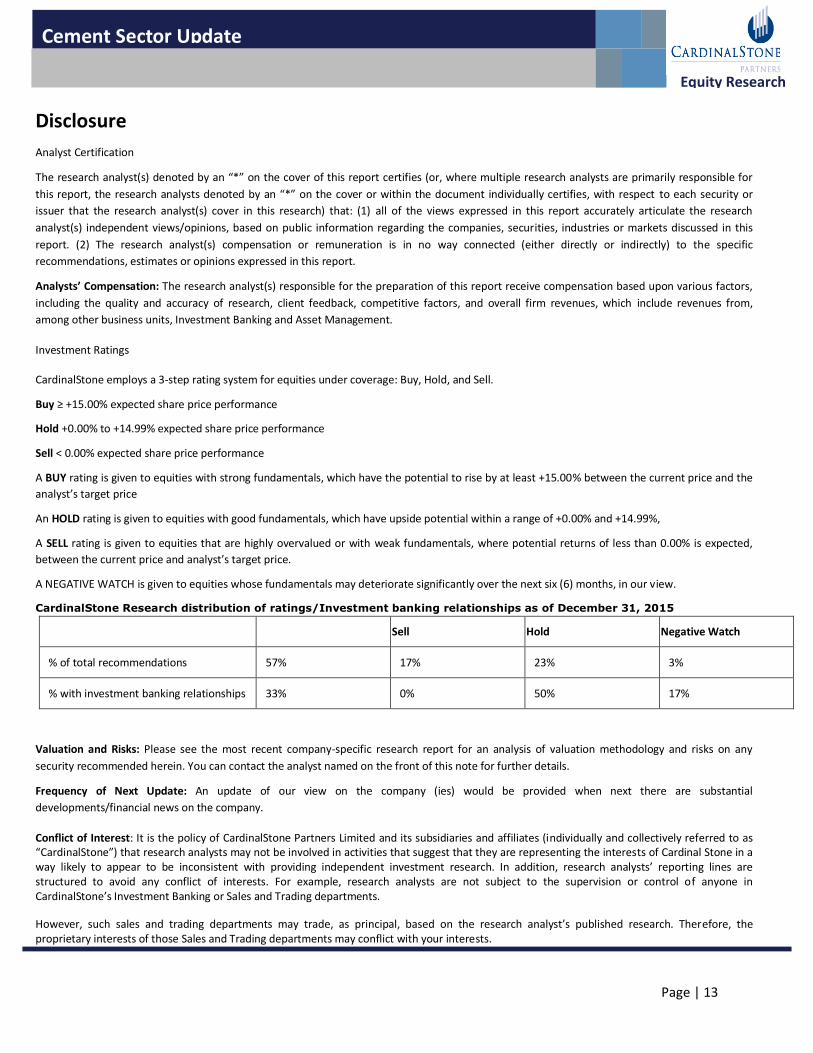
CardinalStone Research distribution of ratings/Investment banking relationships as of December 31, 2015
Rating Buy Sell Hold Negative Watch
% of total recommendations 57% 17% 23% 3%
% with investment banking relationships 33% 0% 50% 17%
Valuation and Risks: Please see the most recent company-specific research report for an analysis of valuation methodology and risks on any
security recommended herein. You can contact the analyst named on the front of this note for further details.
Frequency of Next Update: An update of our view on the company (ies) would be provided when next there are substantial
developments/financial news on the company.
Conflict of Interest: It is the policy of CardinalStone Partners Limited and its subsidiaries and affiliates (individually and collectively referred to as “CardinalStone”) that research analysts may not be involved in activities that suggest that they are representing the interests of Cardinal Stone in a way likely to appear to be inconsistent with providing independent investment research. In addition, research analysts’ reporting lines are structured to avoid any conflict of interests. For example, research analysts are not subject to the supervision or control of anyone in CardinalStone’s Investment Banking or Sales and Trading departments.
However, such sales and trading departments may trade, as principal, based on the research analyst’s published research. Therefore, the proprietary interests of those Sales and Trading departments may conflict with your interests.
Page | 14
Equity Research
Cement Sector Update
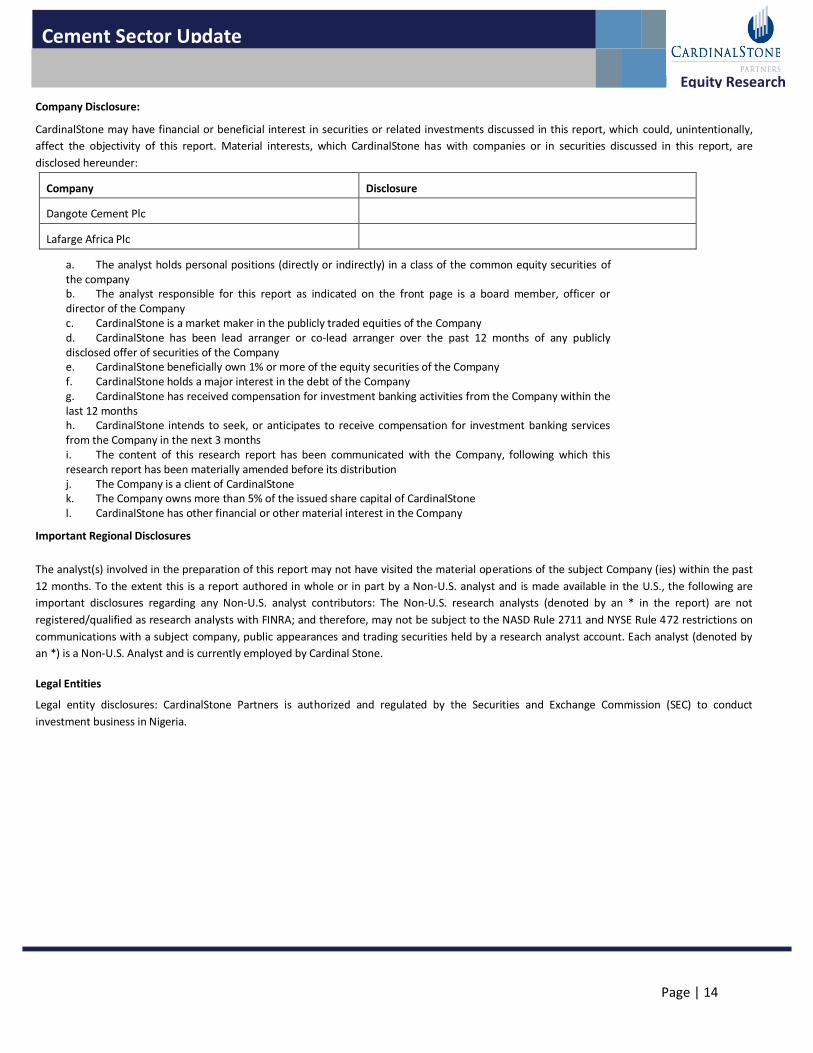
Company Disclosure:
CardinalStone may have financial or beneficial interest in securities or related investments discussed in this report, which could, unintentionally,
affect the objectivity of this report. Material interests, which CardinalStone has with companies or in securities discussed in this report, are
disclosed hereunder:
Company Disclosure
Dangote Cement Plc
Lafarge Africa Plc
a. The analyst holds personal positions (directly or indirectly) in a class of the common equity securities of the company b. The analyst responsible for this report as indicated on the front page is a board member, officer or director of the Company c. CardinalStone is a market maker in the publicly traded equities of the Company d. CardinalStone has been lead arranger or co-lead arranger over the past 12 months of any publicly disclosed offer of securities of the Company e. CardinalStone beneficially own 1% or more of the equity securities of the Company f. CardinalStone holds a major interest in the debt of the Company g. CardinalStone has received compensation for investment banking activities from the Company within the last 12 months h. CardinalStone intends to seek, or anticipates to receive compensation for investment banking services from the Company in the next 3 months i. The content of this research report has been communicated with the Company, following which this research report has been materially amended before its distribution j. The Company is a client of CardinalStone k. The Company owns more than 5% of the issued share capital of CardinalStone l. CardinalStone has other financial or other material interest in the Company
Important Regional Disclosures
The analyst(s) involved in the preparation of this report may not have visited the material operations of the subject Company (ies) within the past
12 months. To the extent this is a report authored in whole or in part by a Non-U.S. analyst and is made available in the U.S., the following are
important disclosures regarding any Non-U.S. analyst contributors: The Non-U.S. research analysts (denoted by an * in the report) are not
registered/qualified as research analysts with FINRA; and therefore, may not be subject to the NASD Rule 2711 and NYSE Rule 472 restrictions on
communications with a subject company, public appearances and trading securities held by a research analyst account. Each analyst (denoted by
an *) is a Non-U.S. Analyst and is currently employed by Cardinal Stone.
Legal Entities
Legal entity disclosures: CardinalStone Partners is authorized and regulated by the Securities and Exchange Commission (SEC) to conduct
investment business in Nigeria.