Embed Size (px)
Citation preview
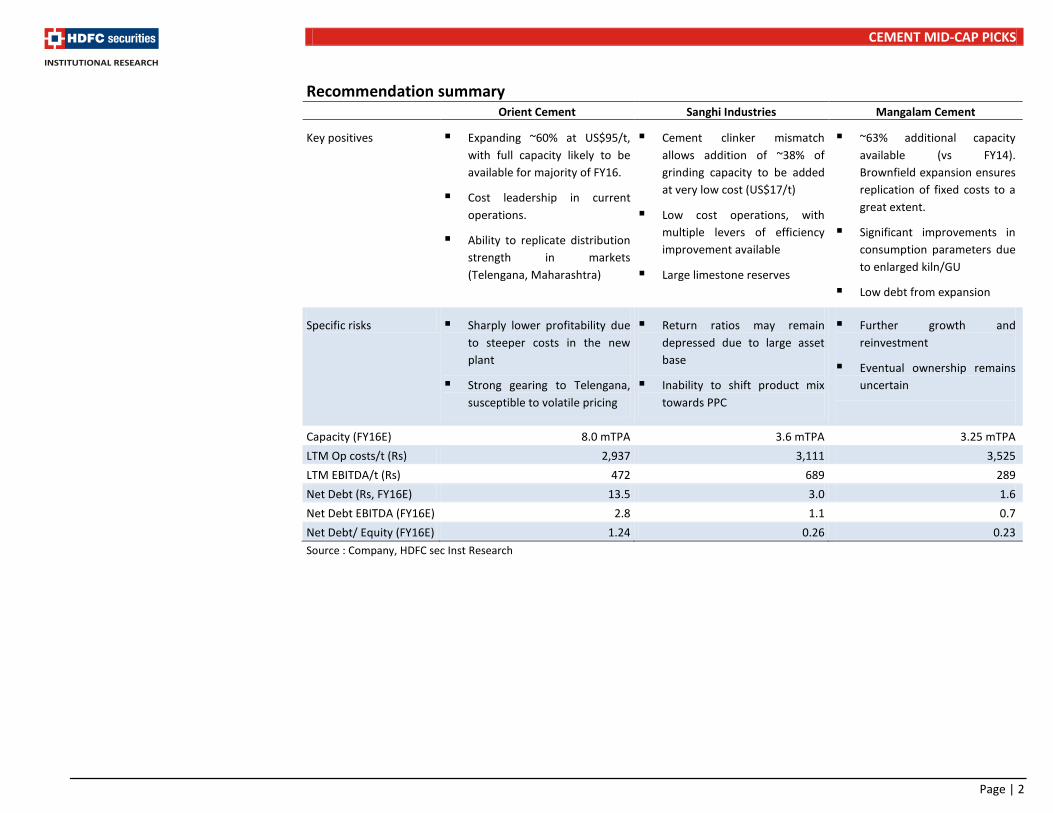
SECTOR UPDATE 9 OCT 2014
Cement Mid-Cap Picks
Sustainable re-rating ahead? Cement stocks have seen their valuations rerate at an unprecedented pace in the past 6 months or so, driven by heightened expectations of demand growth. Large caps are trading at multiple year high valuations, with several mid-caps closing in the gap too. Most importantly, valuation hierarchy has flipped (we believe, sustainably) with a cost leader (Shree Cement) now at the top of the band.
Given an increasing proportion of non-trade sales, higher RMC penetration and bulk (i.e. not bag) cement sales, the premium pricing of brand leaders will erode gradually. Historically, the erosion of pricing premium has coincided with periods of fast demand growth (implying sudden utilization surges). Given the low entry barriers in to the cement industry and relatively slow expansion plans of pan-India companies (Holcim/Lafarge mainly), market share for erstwhile dominant players is shrinking.
Given this scenario, single/two region cost leaders with better logistics will trump multi-region cost-laggards (op-ex and capex). Sharper growth in cement consumption will suit nimbler companies (faster execution and turnaround) better than slower ones, and will also make them better equipped to navigate periods of weak demand. These companies will see their valuations rerate substantially.
In line with above, we looked for the following attributes:
Proven operational cost leaders, who can compete with pan India players on costs?
Companies with large expansions in their catchment area (40-50% growth in capacity) delivered/ready to be delivered in next 12 months to catch the upcycle.
Companies with multiple efficiency triggers in their cost structures, waiting to be exploited.
Valuations still appealing enough for investors.
Orient Cement (CMP:127; TP:177; BUY), Sanghi Industries (CMP:63; TP:83; BUY) and Mangalam Cement (CMP:243; TP: 415; BUY) can sustainably rerate during the coming upturn, given the potential to catch the upcycle with a 40-60% jump in capacity and efficiency levers waiting to be exploited. In three cases, leverage will not be excessive upon capacity addition. (Net Debt/EBITDA < 3.0 and net D/E < 1.2x).
Given that the frontline cement stocks are already factoring in strong earnings growth, these companies also carry with them a margin of safety for investors in case a less bullish demand scenario pans out.
Orient Cement YE Mar FY15E FY16E FY17E Net Sales (Rs mn) 16.8 23.7 28.3 EBITDA (Rs mn) 3.3 5.2 6.8 PAT (Rs mn) 1.8 1.6 2.8 P/E (x) 14.7 16.2 9.3 EV / EBITDA (x) 11.7 7.5 5.5 EV/T (US$) 127 81 76 Volumes (mT) 4.3 5.5 6.1 EBITDA/T (Rs) 756 928 1,088
Sanghi Industries YE Jun FY15E FY16E FY17E Net Sales (Rs mn) 12.4 14.4 15.7 EBITDA (Rs mn) 2.3 2.8 3.5 PAT (Rs mn) 0.6 1.3 2.0 P/E (x) 20.1 9.6 6.5 EV / EBITDA (x) 7.3 5.4 3.6 EV/T (US$) 106 69 70 Volumes (mT) 2.7 3.1 3.2 EBITDA/T (Rs) 847 924 1,083
Mangalam Cement YE Mar FY15E FY16E FY17E Net Sales (Rs mn) 9.1 11.8 13.1 EBITDA (Rs mn) 1.8 2.5 2.9 PAT (Rs mn) 0.8 1.4 1.7 P/E (x) 8.6 4.7 3.9 EV / EBITDA (x) 5.2 3.4 2.2 EV/T (US$) 47 44 32 Volumes (mT) 2.2 2.7 2.9 EBITDA/T (Rs) 762 904 962
Ankur Kulshrestha [email protected] +91-22-6171-7346
HDFC securities Institutional Research is also available on Bloomberg HSLB <GO> & Thomson Reuters
CEMENT MID-CAP PICKS
Recommendation summary Orient Cement Sanghi Industries Mangalam Cement
Key positives Expanding ~60% at US$95/t, with full capacity likely to be available for majority of FY16.
Cost leadership in current operations.
Ability to replicate distribution strength in markets (Telengana, Maharashtra)
Cement clinker mismatch allows addition of ~38% of grinding capacity to be added at very low cost (US$17/t)
Low cost operations, with multiple levers of efficiency improvement available
Large limestone reserves
~63% additional capacity available (vs FY14). Brownfield expansion ensures replication of fixed costs to a great extent.
Significant improvements in consumption parameters due to enlarged kiln/GU
Low debt from expansion
Specific risks Sharply lower profitability due to steeper costs in the new plant
Strong gearing to Telengana, susceptible to volatile pricing
Return ratios may remain depressed due to large asset base
Inability to shift product mix towards PPC
Further growth and reinvestment
Eventual ownership remains uncertain
Capacity (FY16E) 8.0 mTPA 3.6 mTPA 3.25 mTPA LTM Op costs/t (Rs) 2,937 3,111 3,525 LTM EBITDA/t (Rs) 472 689 289 Net Debt (Rs, FY16E) 13.5 3.0 1.6 Net Debt EBITDA (FY16E) 2.8 1.1 0.7 Net Debt/ Equity (FY16E) 1.24 0.26 0.23 Source : Company, HDFC sec Inst Research
Page | 2
CEMENT MID-CAP PICKS
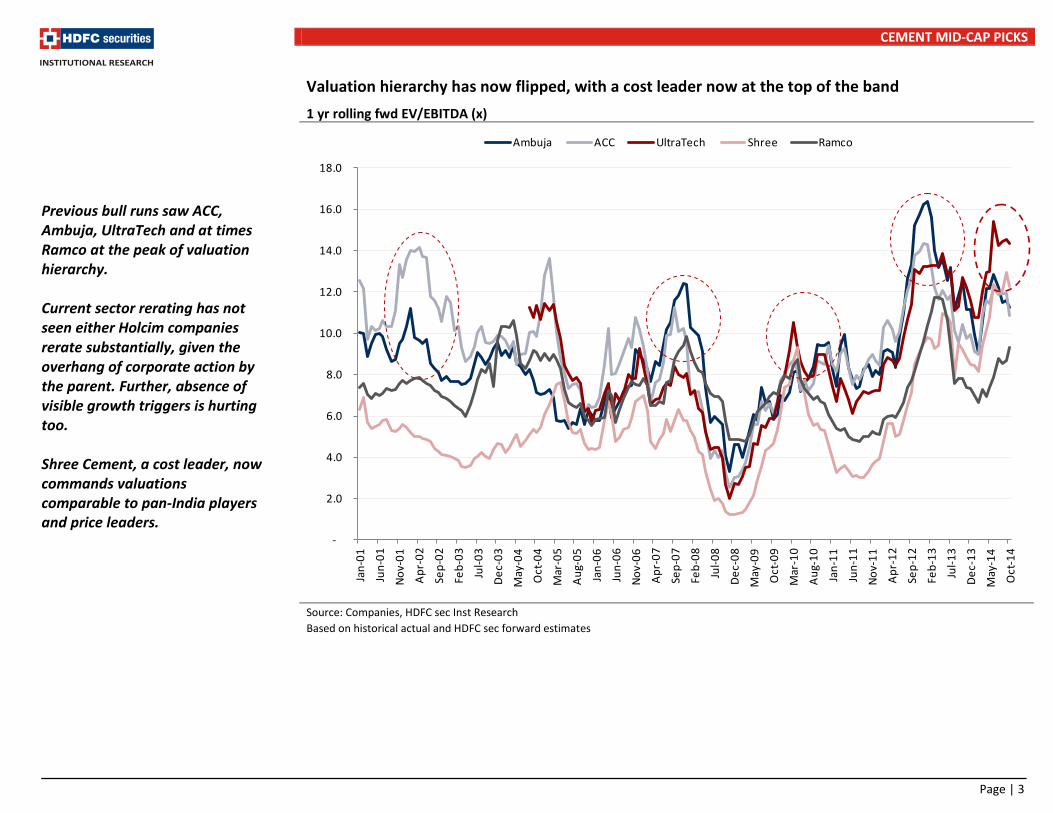
Valuation hierarchy has now flipped, with a cost leader now at the top of the band 1 yr rolling fwd EV/EBITDA (x)
Source: Companies, HDFC sec Inst Research Based on historical actual and HDFC sec forward estimates
Previous bull runs saw ACC, Ambuja, UltraTech and at times Ramco at the peak of valuation hierarchy. Current sector rerating has not seen either Holcim companies rerate substantially, given the overhang of corporate action by the parent. Further, absence of visible growth triggers is hurting too. Shree Cement, a cost leader, now commands valuations comparable to pan-India players and price leaders.
-
2.0
4.0
6.0
8.0
10.0
12.0
14.0
16.0
18.0
Jan-
01
Jun-
01
Nov-
01
Apr-
02
Sep-
02
Feb-
03
Jul-0
3
Dec-
03
May
-04
Oct
-04
Mar
-05
Aug-
05
Jan-
06
Jun-
06
Nov-
06
Apr-
07
Sep-
07
Feb-
08
Jul-0
8
Dec-
08
May
-09
Oct
-09
Mar
-10
Aug-
10
Jan-
11
Jun-
11
Nov-
11
Apr-
12
Sep-
12
Feb-
13
Jul-1
3
Dec-
13
May
-14
Oct
-14
Ambuja ACC UltraTech Shree Ramco
Page | 3
CEMENT MID-CAP PICKS
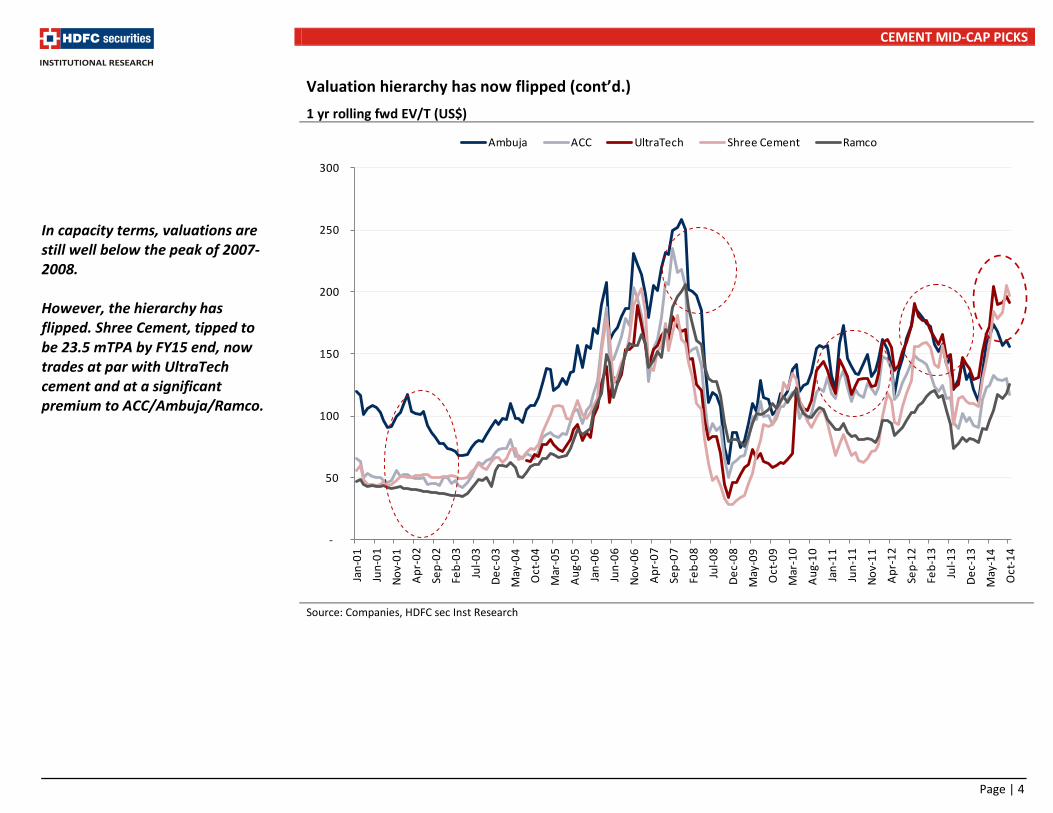
Valuation hierarchy has now flipped (cont’d.) 1 yr rolling fwd EV/T (US$)
Source: Companies, HDFC sec Inst Research
In capacity terms, valuations are still well below the peak of 2007-2008. However, the hierarchy has flipped. Shree Cement, tipped to be 23.5 mTPA by FY15 end, now trades at par with UltraTech cement and at a significant premium to ACC/Ambuja/Ramco.
-
50
100
150
200
250
300
Jan-
01
Jun-
01
Nov-
01
Apr-
02
Sep -
02
Feb-
03
Jul-0
3
Dec-
03
May
-04
Oct
-04
Mar
-05
Aug-
05
Jan-
06
Jun-
06
Nov-
06
Apr-
07
Sep-
07
Feb-
08
Jul-0
8
Dec-
08
May
-09
Oct
-09
Mar
-10
Aug-
10
Jan-
11
Jun-
11
Nov-
11
Apr-
12
Sep-
12
Feb-
13
Jul-1
3
Dec-
13
May
-14
Oct
-14
Ambuja ACC UltraTech Shree Cement Ramco
Page | 4
CEMENT MID-CAP PICKS
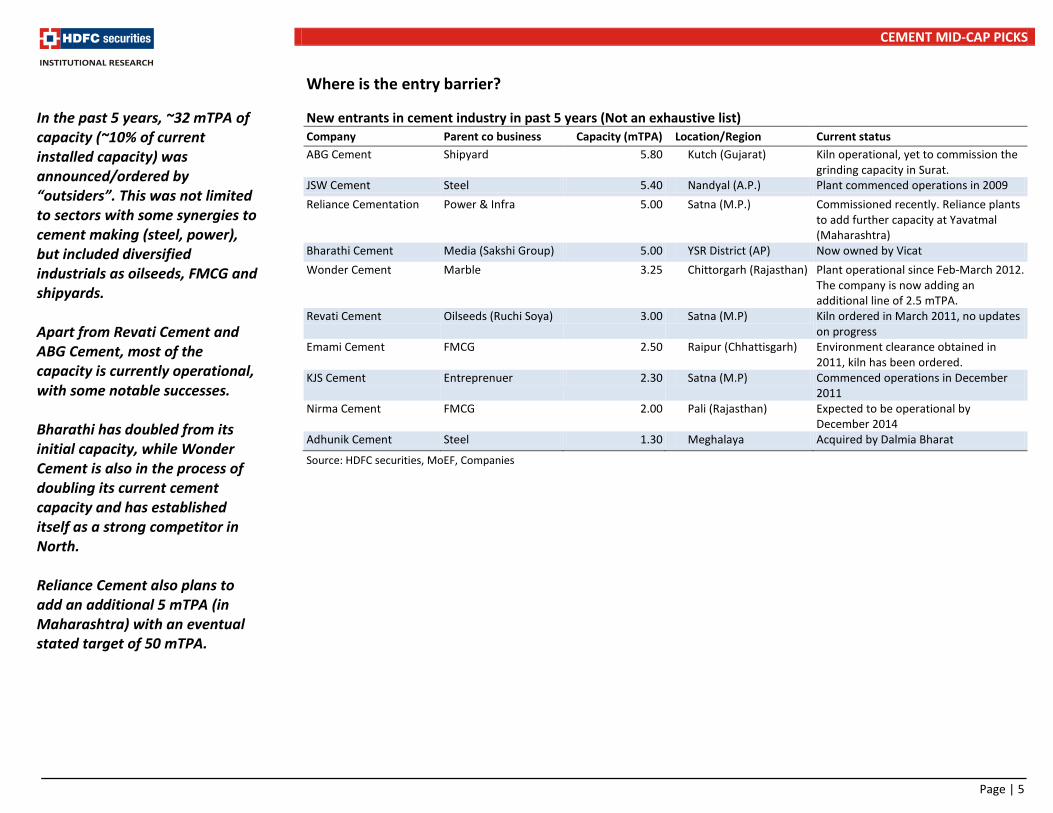
Where is the entry barrier?
New entrants in cement industry in past 5 years (Not an exhaustive list) Company Parent co business Capacity (mTPA) Location/Region Current status ABG Cement Shipyard 5.80 Kutch (Gujarat) Kiln operational, yet to commission the
grinding capacity in Surat. JSW Cement Steel 5.40 Nandyal (A.P.) Plant commenced operations in 2009 Reliance Cementation Power & Infra 5.00 Satna (M.P.) Commissioned recently. Reliance plants
to add further capacity at Yavatmal (Maharashtra)
Bharathi Cement Media (Sakshi Group) 5.00 YSR District (AP) Now owned by Vicat Wonder Cement Marble 3.25 Chittorgarh (Rajasthan) Plant operational since Feb-March 2012.
The company is now adding an additional line of 2.5 mTPA.
Revati Cement Oilseeds (Ruchi Soya) 3.00 Satna (M.P) Kiln ordered in March 2011, no updates on progress
Emami Cement FMCG 2.50 Raipur (Chhattisgarh) Environment clearance obtained in 2011, kiln has been ordered.
KJS Cement Entreprenuer 2.30 Satna (M.P) Commenced operations in December 2011
Nirma Cement FMCG 2.00 Pali (Rajasthan) Expected to be operational by December 2014
Adhunik Cement Steel 1.30 Meghalaya Acquired by Dalmia Bharat
Source: HDFC securities, MoEF, Companies
In the past 5 years, ~32 mTPA of capacity (~10% of current installed capacity) was announced/ordered by “outsiders”. This was not limited to sectors with some synergies to cement making (steel, power), but included diversified industrials as oilseeds, FMCG and shipyards. Apart from Revati Cement and ABG Cement, most of the capacity is currently operational, with some notable successes. Bharathi has doubled from its initial capacity, while Wonder Cement is also in the process of doubling its current cement capacity and has established itself as a strong competitor in North. Reliance Cement also plans to add an additional 5 mTPA (in Maharashtra) with an eventual stated target of 50 mTPA.
Page | 5
CEMENT MID-CAP PICKS
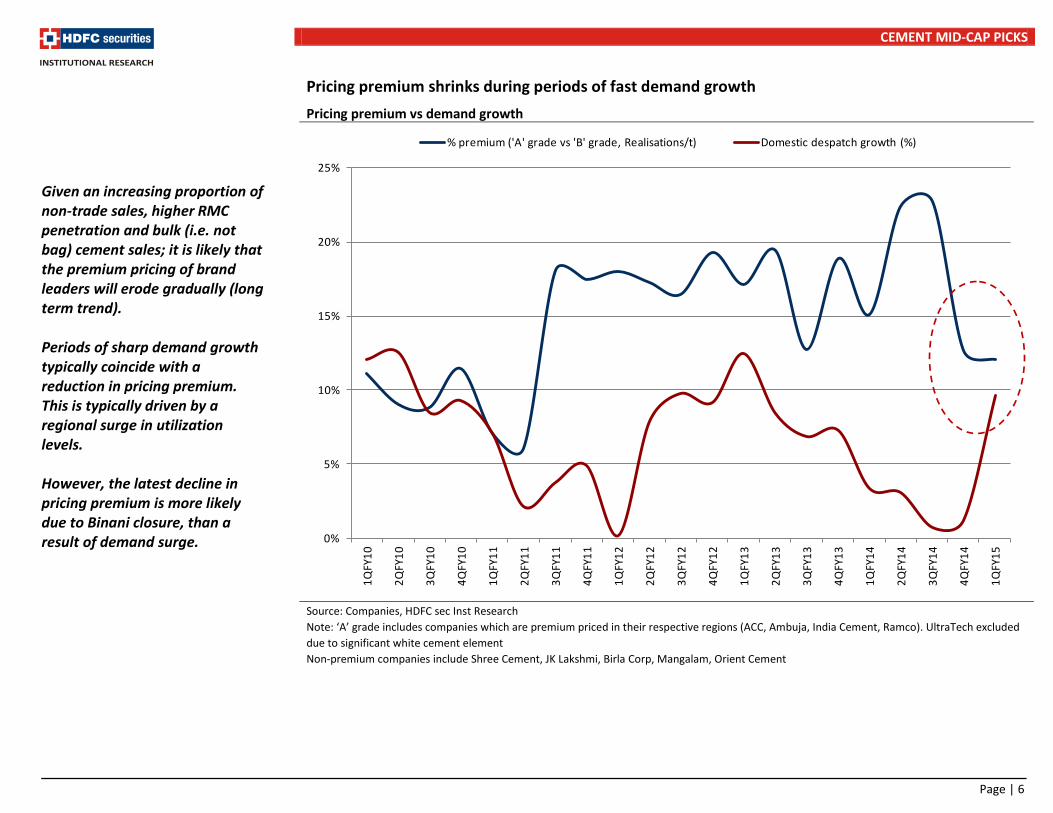
Pricing premium shrinks during periods of fast demand growth Pricing premium vs demand growth
Source: Companies, HDFC sec Inst Research Note: ‘A’ grade includes companies which are premium priced in their respective regions (ACC, Ambuja, India Cement, Ramco). UltraTech excluded due to significant white cement element Non-premium companies include Shree Cement, JK Lakshmi, Birla Corp, Mangalam, Orient Cement
Given an increasing proportion of non-trade sales, higher RMC penetration and bulk (i.e. not bag) cement sales; it is likely that the premium pricing of brand leaders will erode gradually (long term trend). Periods of sharp demand growth typically coincide with a reduction in pricing premium. This is typically driven by a regional surge in utilization levels. However, the latest decline in pricing premium is more likely due to Binani closure, than a result of demand surge.
0%
5%
10%
15%
20%
25%
1QFY
10
2QFY
10
3QFY
10
4QFY
10
1QFY
11
2QFY
11
3QFY
11
4QFY
11
1QFY
12
2QFY
12
3QFY
12
4QFY
12
1QFY
13
2QFY
13
3QFY
13
4QFY
13
1QFY
14
2QFY
14
3QFY
14
4QFY
14
1QFY
15
% premium ('A' grade vs 'B' grade, Realisations/t) Domestic despatch growth (%)
Page | 6
CEMENT MID-CAP PICKS
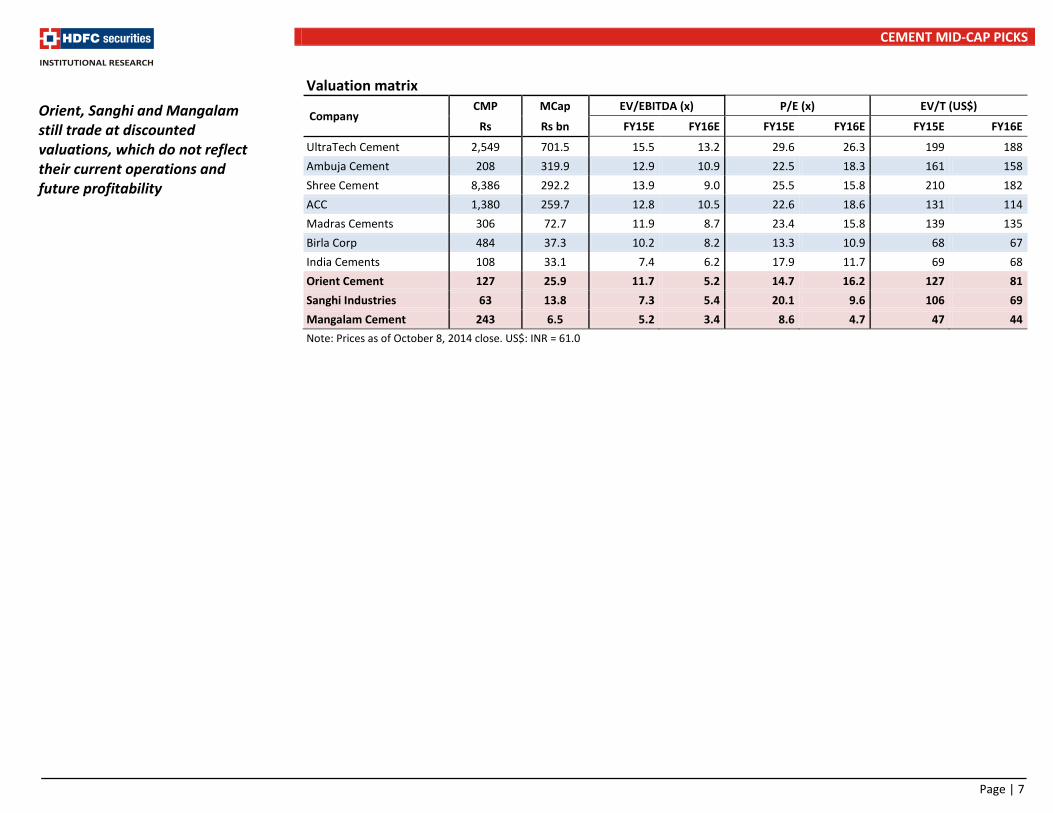
Valuation matrix
Company CMP MCap EV/EBITDA (x) P/E (x) EV/T (US$)
Rs Rs bn FY15E FY16E FY15E FY16E FY15E FY16E
UltraTech Cement 2,549 701.5 15.5 13.2 29.6 26.3 199 188 Ambuja Cement 208 319.9 12.9 10.9 22.5 18.3 161 158 Shree Cement 8,386 292.2 13.9 9.0 25.5 15.8 210 182 ACC 1,380 259.7 12.8 10.5 22.6 18.6 131 114 Madras Cements 306 72.7 11.9 8.7 23.4 15.8 139 135 Birla Corp 484 37.3 10.2 8.2 13.3 10.9 68 67 India Cements 108 33.1 7.4 6.2 17.9 11.7 69 68 Orient Cement 127 25.9 11.7 5.2 14.7 16.2 127 81 Sanghi Industries 63 13.8 7.3 5.4 20.1 9.6 106 69 Mangalam Cement 243 6.5 5.2 3.4 8.6 4.7 47 44 Note: Prices as of October 8, 2014 close. US$: INR = 61.0
Orient, Sanghi and Mangalam still trade at discounted valuations, which do not reflect their current operations and future profitability
Page | 7
CEMENT MID-CAP PICKS
Company Section
Page | 8
INITIATING COVERAGE 9 OCT 2014
Orient Cement BUY
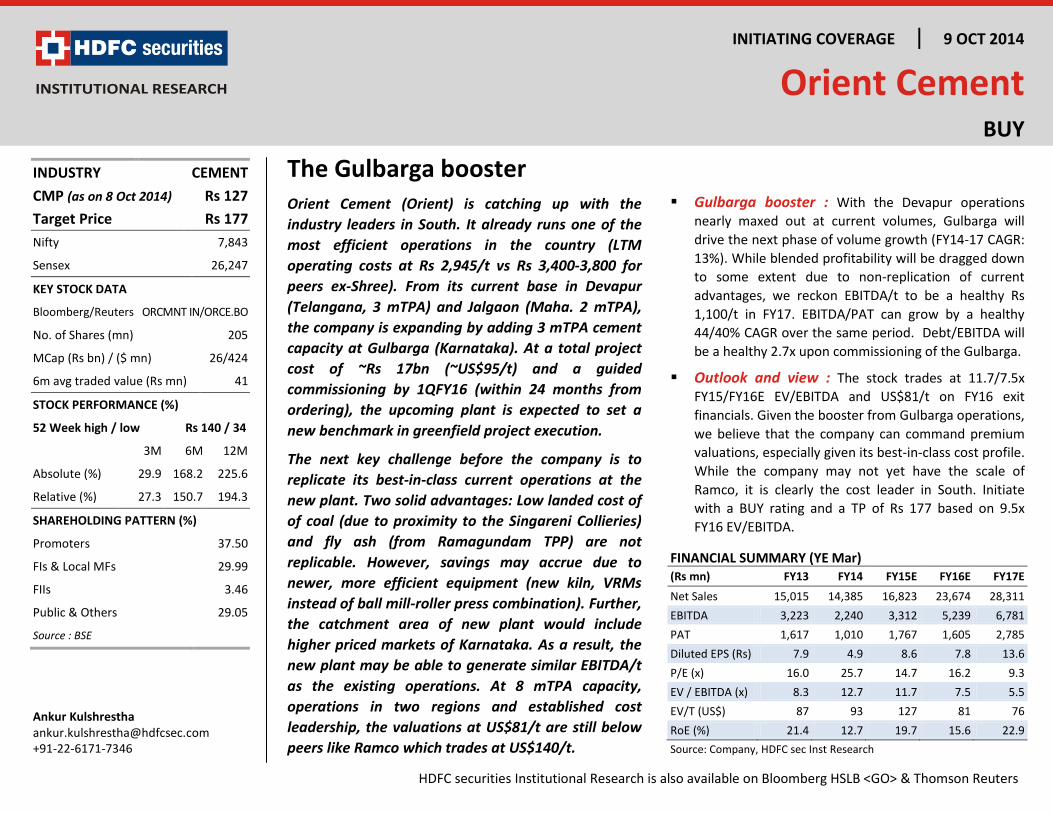
The Gulbarga booster Orient Cement (Orient) is catching up with the industry leaders in South. It already runs one of the most efficient operations in the country (LTM operating costs at Rs 2,945/t vs Rs 3,400-3,800 for peers ex-Shree). From its current base in Devapur (Telangana, 3 mTPA) and Jalgaon (Maha. 2 mTPA), the company is expanding by adding 3 mTPA cement capacity at Gulbarga (Karnataka). At a total project cost of ~Rs 17bn (~US$95/t) and a guided commissioning by 1QFY16 (within 24 months from ordering), the upcoming plant is expected to set a new benchmark in greenfield project execution.
The next key challenge before the company is to replicate its best-in-class current operations at the new plant. Two solid advantages: Low landed cost of of coal (due to proximity to the Singareni Collieries) and fly ash (from Ramagundam TPP) are not replicable. However, savings may accrue due to newer, more efficient equipment (new kiln, VRMs instead of ball mill-roller press combination). Further, the catchment area of new plant would include higher priced markets of Karnataka. As a result, the new plant may be able to generate similar EBITDA/t as the existing operations. At 8 mTPA capacity, operations in two regions and established cost leadership, the valuations at US$81/t are still below peers like Ramco which trades at US$140/t.
Gulbarga booster : With the Devapur operations nearly maxed out at current volumes, Gulbarga will drive the next phase of volume growth (FY14-17 CAGR: 13%). While blended profitability will be dragged down to some extent due to non-replication of current advantages, we reckon EBITDA/t to be a healthy Rs 1,100/t in FY17. EBITDA/PAT can grow by a healthy 44/40% CAGR over the same period. Debt/EBITDA will be a healthy 2.7x upon commissioning of the Gulbarga.
Outlook and view : The stock trades at 11.7/7.5x FY15/FY16E EV/EBITDA and US$81/t on FY16 exit financials. Given the booster from Gulbarga operations, we believe that the company can command premium valuations, especially given its best-in-class cost profile. While the company may not yet have the scale of Ramco, it is clearly the cost leader in South. Initiate with a BUY rating and a TP of Rs 177 based on 9.5x FY16 EV/EBITDA.
FINANCIAL SUMMARY (YE Mar) (Rs mn) FY13 FY14 FY15E FY16E FY17E
Net Sales 15,015 14,385 16,823 23,674 28,311 EBITDA 3,223 2,240 3,312 5,239 6,781 PAT 1,617 1,010 1,767 1,605 2,785 Diluted EPS (Rs) 7.9 4.9 8.6 7.8 13.6 P/E (x) 16.0 25.7 14.7 16.2 9.3 EV / EBITDA (x) 8.3 12.7 11.7 7.5 5.5 EV/T (US$) 87 93 127 81 76 RoE (%) 21.4 12.7 19.7 15.6 22.9 Source: Company, HDFC sec Inst Research
INDUSTRY CEMENT CMP (as on 8 Oct 2014) Rs 127 Target Price Rs 177 Nifty 7,843
Sensex 26,247
KEY STOCK DATA
Bloomberg/Reuters ORCMNT IN/ORCE.BO
No. of Shares (mn) 205
MCap (Rs bn) / ($ mn) 26/424
6m avg traded value (Rs mn) 41
STOCK PERFORMANCE (%)
52 Week high / low Rs 140 / 34
3M 6M 12M
Absolute (%) 29.9 168.2 225.6
Relative (%) 27.3 150.7 194.3
SHAREHOLDING PATTERN (%)
Promoters 37.50
FIs & Local MFs 29.99
FIIs 3.46
Public & Others 29.05
Source : BSE
Ankur Kulshrestha [email protected] +91-22-6171-7346
HDFC securities Institutional Research is also available on Bloomberg HSLB <GO> & Thomson Reuters
ORIENT CEMENT : INITIATING COVERAGE
Key investment arguments
Best-in-class operations
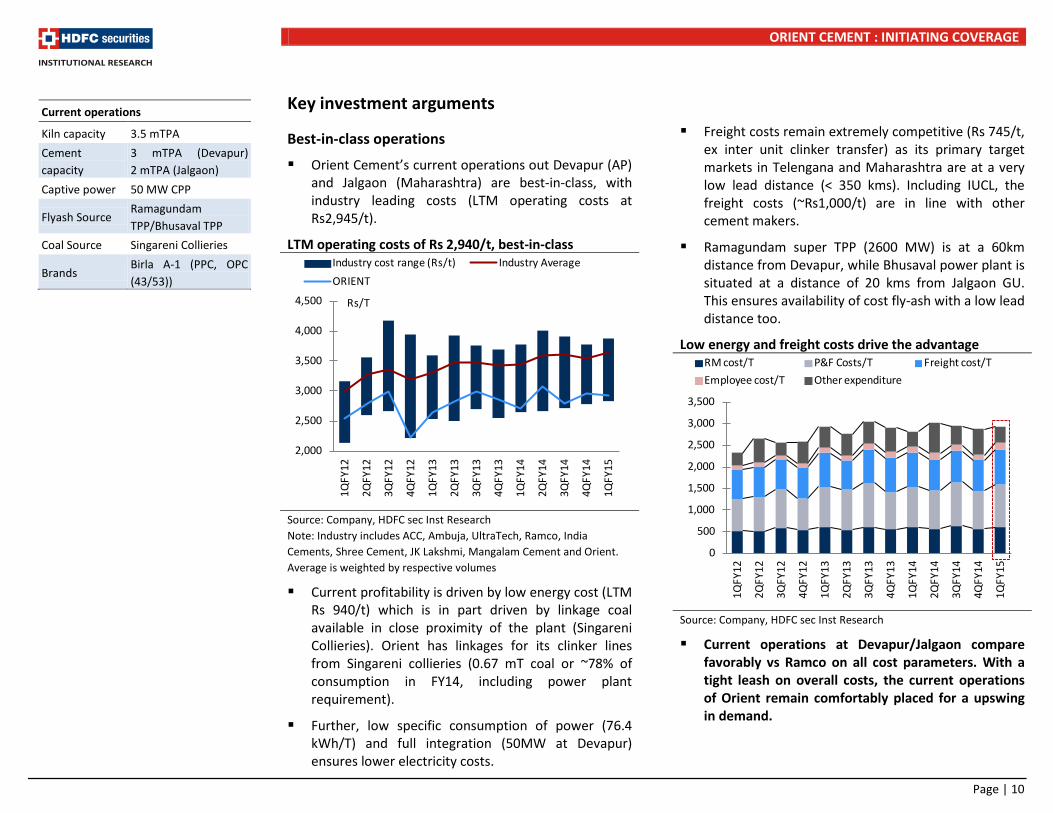
Orient Cement’s current operations out Devapur (AP) and Jalgaon (Maharashtra) are best-in-class, with industry leading costs (LTM operating costs at Rs2,945/t).
LTM operating costs of Rs 2,940/t, best-in-class
Source: Company, HDFC sec Inst Research Note: Industry includes ACC, Ambuja, UltraTech, Ramco, India Cements, Shree Cement, JK Lakshmi, Mangalam Cement and Orient. Average is weighted by respective volumes
Current profitability is driven by low energy cost (LTM Rs 940/t) which is in part driven by linkage coal available in close proximity of the plant (Singareni Collieries). Orient has linkages for its clinker lines from Singareni collieries (0.67 mT coal or ~78% of consumption in FY14, including power plant requirement).
Further, low specific consumption of power (76.4 kWh/T) and full integration (50MW at Devapur) ensures lower electricity costs.
Freight costs remain extremely competitive (Rs 745/t, ex inter unit clinker transfer) as its primary target markets in Telengana and Maharashtra are at a very low lead distance (< 350 kms). Including IUCL, the freight costs (~Rs1,000/t) are in line with other cement makers.
Ramagundam super TPP (2600 MW) is at a 60km distance from Devapur, while Bhusaval power plant is situated at a distance of 20 kms from Jalgaon GU. This ensures availability of cost fly-ash with a low lead distance too.
Low energy and freight costs drive the advantage
Source: Company, HDFC sec Inst Research
Current operations at Devapur/Jalgaon compare favorably vs Ramco on all cost parameters. With a tight leash on overall costs, the current operations of Orient remain comfortably placed for a upswing in demand.
Current operations
Kiln capacity 3.5 mTPA Cement capacity
3 mTPA (Devapur) 2 mTPA (Jalgaon)
Captive power 50 MW CPP
Flyash Source Ramagundam TPP/Bhusaval TPP
Coal Source Singareni Collieries
Brands Birla A-1 (PPC, OPC (43/53))
0
500
1,000
1,500
2,000
2,500
3,000
3,500
1QFY
12
2QFY
12
3QFY
12
4QFY
12
1QFY
13
2QFY
13
3QFY
13
4QFY
13
1QFY
14
2QFY
14
3QFY
14
4QFY
14
1QFY
15
RM cost/T P&F Costs/T Freight cost/TEmployee cost/T Other expenditure
2,000
2,500
3,000
3,500
4,000
4,500
1QFY
12
2QFY
12
3QFY
12
4QFY
12
1QFY
13
2QFY
13
3QFY
13
4QFY
13
1QFY
14
2QFY
14
3QFY
14
4QFY
14
1QFY
15
Industry cost range (Rs/t) Industry AverageORIENT
Rs/T
Page | 10
ORIENT CEMENT : INITIATING COVERAGE
New capacity addition at US$95/t
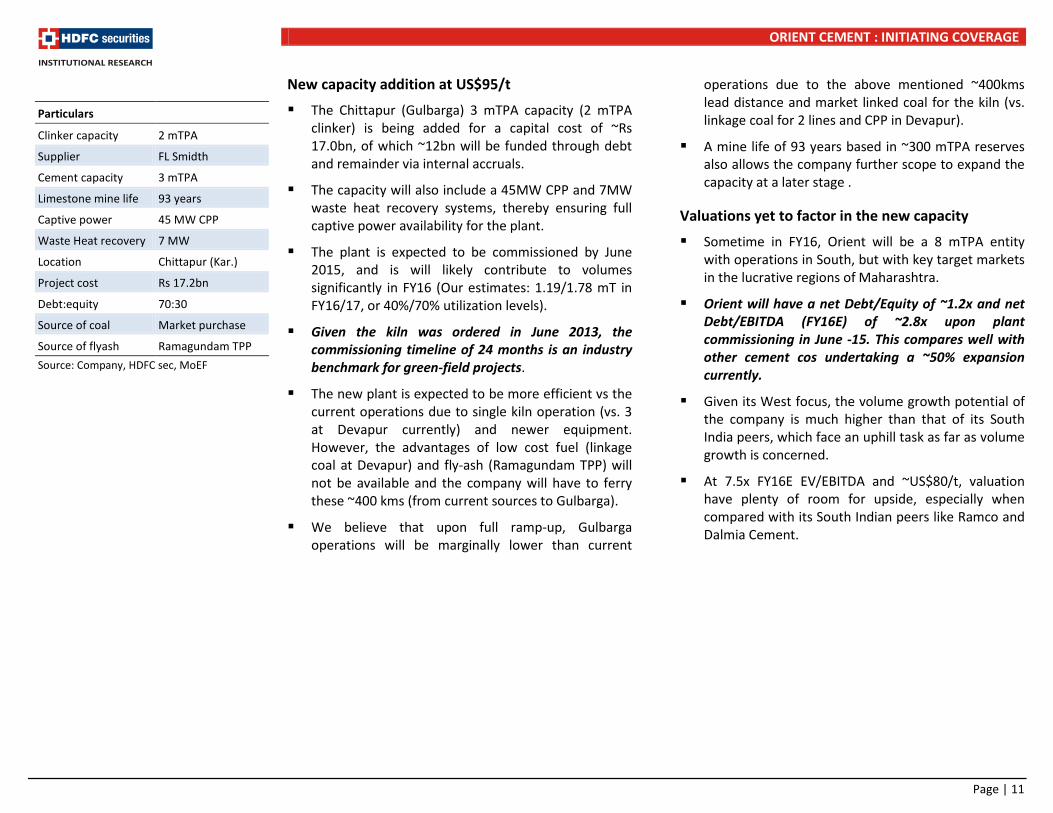
The Chittapur (Gulbarga) 3 mTPA capacity (2 mTPA clinker) is being added for a capital cost of ~Rs 17.0bn, of which ~12bn will be funded through debt and remainder via internal accruals.
The capacity will also include a 45MW CPP and 7MW waste heat recovery systems, thereby ensuring full captive power availability for the plant.
The plant is expected to be commissioned by June 2015, and is will likely contribute to volumes significantly in FY16 (Our estimates: 1.19/1.78 mT in FY16/17, or 40%/70% utilization levels).
Given the kiln was ordered in June 2013, the commissioning timeline of 24 months is an industry benchmark for green-field projects.
The new plant is expected to be more efficient vs the current operations due to single kiln operation (vs. 3 at Devapur currently) and newer equipment. However, the advantages of low cost fuel (linkage coal at Devapur) and fly-ash (Ramagundam TPP) will not be available and the company will have to ferry these ~400 kms (from current sources to Gulbarga).
We believe that upon full ramp-up, Gulbarga operations will be marginally lower than current
operations due to the above mentioned ~400kms lead distance and market linked coal for the kiln (vs. linkage coal for 2 lines and CPP in Devapur).
A mine life of 93 years based in ~300 mTPA reserves also allows the company further scope to expand the capacity at a later stage .
Valuations yet to factor in the new capacity
Sometime in FY16, Orient will be a 8 mTPA entity with operations in South, but with key target markets in the lucrative regions of Maharashtra.
Orient will have a net Debt/Equity of ~1.2x and net Debt/EBITDA (FY16E) of ~2.8x upon plant commissioning in June -15. This compares well with other cement cos undertaking a ~50% expansion currently.
Given its West focus, the volume growth potential of the company is much higher than that of its South India peers, which face an uphill task as far as volume growth is concerned.
At 7.5x FY16E EV/EBITDA and ~US$80/t, valuation have plenty of room for upside, especially when compared with its South Indian peers like Ramco and Dalmia Cement.
Particulars
Clinker capacity 2 mTPA
Supplier FL Smidth
Cement capacity 3 mTPA
Limestone mine life 93 years
Captive power 45 MW CPP
Waste Heat recovery 7 MW
Location Chittapur (Kar.)
Project cost Rs 17.2bn
Debt:equity 70:30
Source of coal Market purchase
Source of flyash Ramagundam TPP Source: Company, HDFC sec, MoEF
Page | 11
ORIENT CEMENT : INITIATING COVERAGE
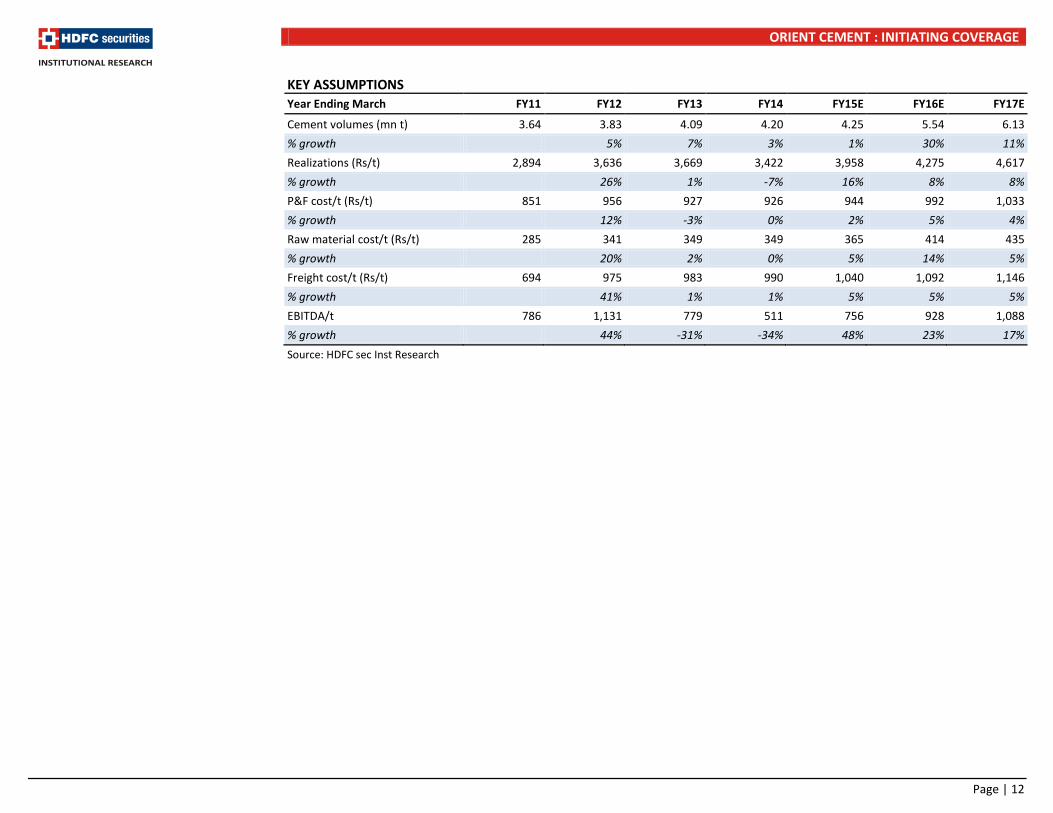
KEY ASSUMPTIONS Year Ending March FY11 FY12 FY13 FY14 FY15E FY16E FY17E
Cement volumes (mn t) 3.64 3.83 4.09 4.20 4.25 5.54 6.13 % growth 5% 7% 3% 1% 30% 11% Realizations (Rs/t) 2,894 3,636 3,669 3,422 3,958 4,275 4,617 % growth 26% 1% -7% 16% 8% 8% P&F cost/t (Rs/t) 851 956 927 926 944 992 1,033 % growth 12% -3% 0% 2% 5% 4% Raw material cost/t (Rs/t) 285 341 349 349 365 414 435 % growth 20% 2% 0% 5% 14% 5% Freight cost/t (Rs/t) 694 975 983 990 1,040 1,092 1,146 % growth 41% 1% 1% 5% 5% 5% EBITDA/t 786 1,131 779 511 756 928 1,088 % growth 44% -31% -34% 48% 23% 17% Source: HDFC sec Inst Research
Page | 12
ORIENT CEMENT : INITIATING COVERAGE
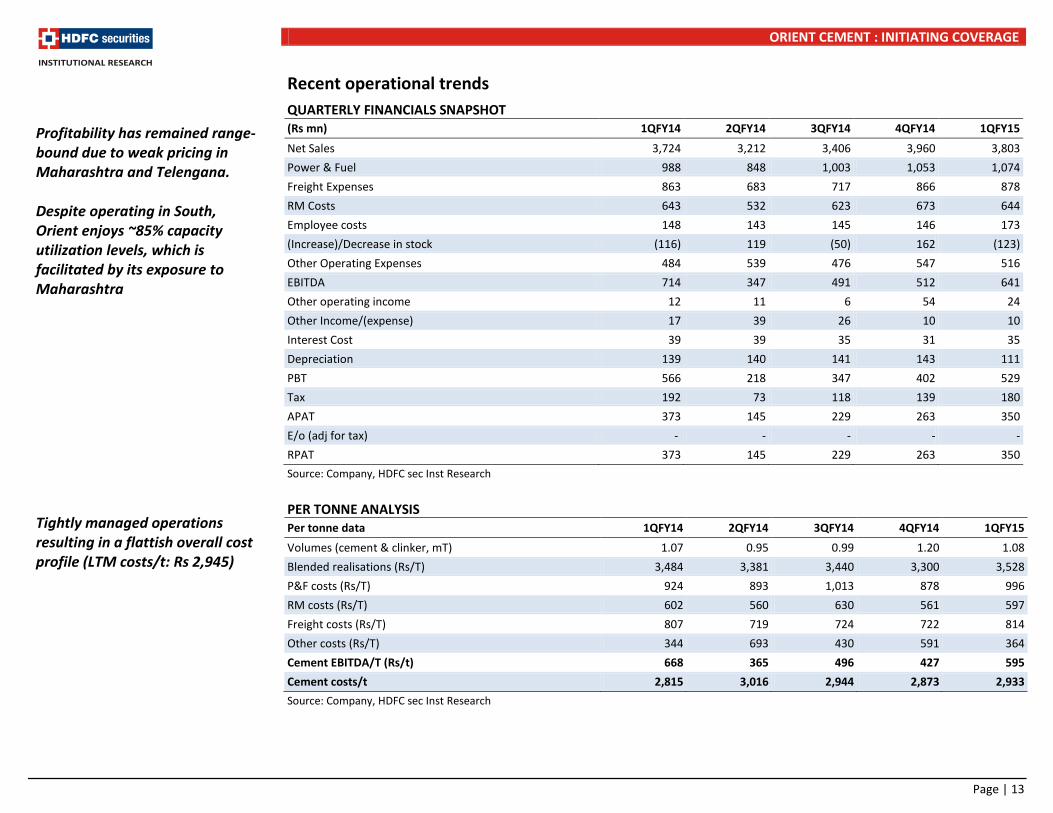
Recent operational trends QUARTERLY FINANCIALS SNAPSHOT (Rs mn) 1QFY14 2QFY14 3QFY14 4QFY14 1QFY15
Net Sales 3,724 3,212 3,406 3,960 3,803 Power & Fuel 988 848 1,003 1,053 1,074 Freight Expenses 863 683 717 866 878 RM Costs 643 532 623 673 644 Employee costs 148 143 145 146 173 (Increase)/Decrease in stock (116) 119 (50) 162 (123) Other Operating Expenses 484 539 476 547 516 EBITDA 714 347 491 512 641 Other operating income 12 11 6 54 24 Other Income/(expense) 17 39 26 10 10 Interest Cost 39 39 35 31 35 Depreciation 139 140 141 143 111 PBT 566 218 347 402 529 Tax 192 73 118 139 180 APAT 373 145 229 263 350 E/o (adj for tax) - - - - - RPAT 373 145 229 263 350 Source: Company, HDFC sec Inst Research PER TONNE ANALYSIS Per tonne data 1QFY14 2QFY14 3QFY14 4QFY14 1QFY15 Volumes (cement & clinker, mT) 1.07 0.95 0.99 1.20 1.08 Blended realisations (Rs/T) 3,484 3,381 3,440 3,300 3,528 P&F costs (Rs/T) 924 893 1,013 878 996 RM costs (Rs/T) 602 560 630 561 597 Freight costs (Rs/T) 807 719 724 722 814 Other costs (Rs/T) 344 693 430 591 364 Cement EBITDA/T (Rs/t) 668 365 496 427 595 Cement costs/t 2,815 3,016 2,944 2,873 2,933 Source: Company, HDFC sec Inst Research
Profitability has remained range-bound due to weak pricing in Maharashtra and Telengana. Despite operating in South, Orient enjoys ~85% capacity utilization levels, which is facilitated by its exposure to Maharashtra Tightly managed operations resulting in a flattish overall cost profile (LTM costs/t: Rs 2,945)
Page | 13
ORIENT CEMENT : INITIATING COVERAGE
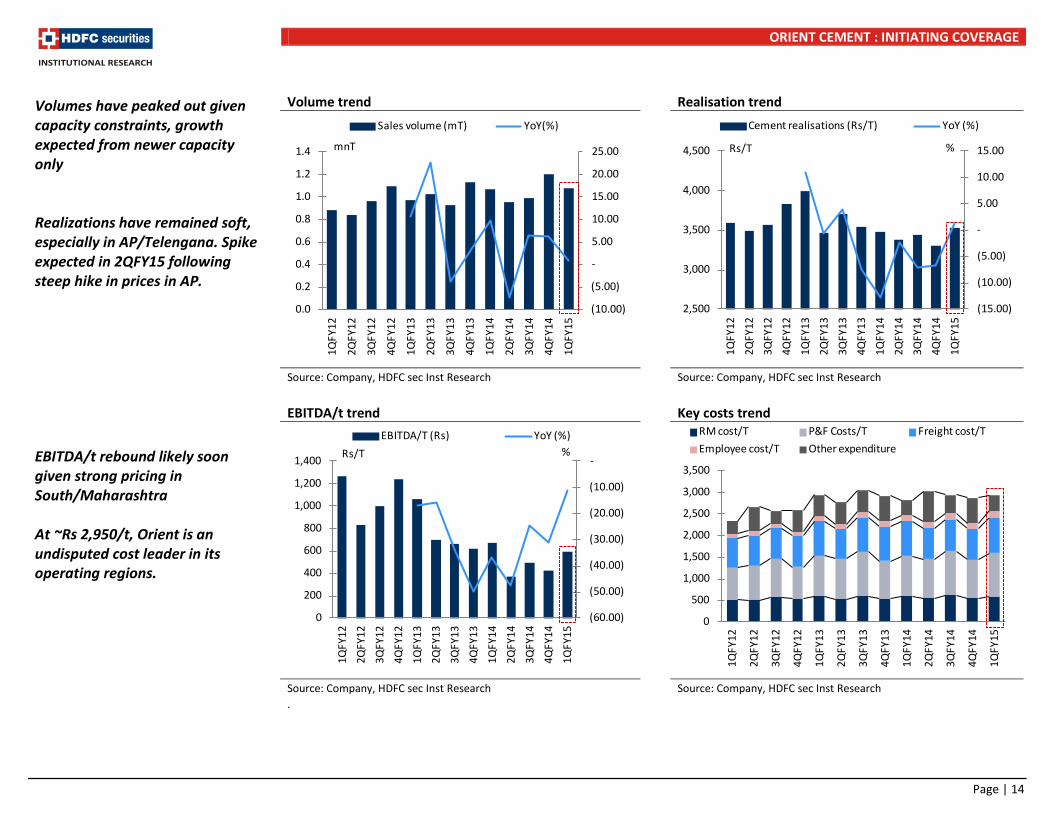
Volume trend Realisation trend
Source: Company, HDFC sec Inst Research Source: Company, HDFC sec Inst Research EBITDA/t trend Key costs trend
Source: Company, HDFC sec Inst Research Source: Company, HDFC sec Inst Research .
Volumes have peaked out given capacity constraints, growth expected from newer capacity only Realizations have remained soft, especially in AP/Telengana. Spike expected in 2QFY15 following steep hike in prices in AP. EBITDA/t rebound likely soon given strong pricing in South/Maharashtra At ~Rs 2,950/t, Orient is an undisputed cost leader in its operating regions.
(10.00)
(5.00)
-
5.00
10.00
15.00
20.00
25.00
0.0
0.2
0.4
0.6
0.8
1.0
1.2
1.4
1QFY
12
2QFY
12
3QFY
12
4QFY
12
1QFY
13
2QFY
13
3QFY
13
4QFY
13
1QFY
14
2QFY
14
3QFY
14
4QFY
14
1QFY
15
Sales volume (mT) YoY(%)
mnT
(15.00)
(10.00)
(5.00)
-
5.00
10.00
15.00
2,500
3,000
3,500
4,000
4,500
1QFY
122Q
FY12
3QFY
124Q
FY12
1QFY
132Q
FY13
3QFY
134Q
FY13
1QFY
142Q
FY14
3QFY
144Q
FY14
1QFY
15
Cement realisations (Rs/T) YoY (%)
Rs/T %
(60.00)
(50.00)
(40.00)
(30.00)
(20.00)
(10.00)
-
0
200
400
600
800
1,000
1,200
1,400
1QFY
122Q
FY12
3QFY
124Q
FY12
1QFY
132Q
FY13
3QFY
134Q
FY13
1QFY
142Q
FY14
3QFY
144Q
FY14
1QFY
15
EBITDA/T (Rs) YoY (%)Rs/T %
0
500
1,000
1,500
2,000
2,500
3,000
3,500
1QFY
12
2QFY
12
3QFY
12
4QFY
12
1QFY
13
2QFY
13
3QFY
13
4QFY
13
1QFY
14
2QFY
14
3QFY
14
4QFY
14
1QFY
15
RM cost/T P&F Costs/T Freight cost/TEmployee cost/T Other expenditure
Page | 14
ORIENT CEMENT : INITIATING COVERAGE
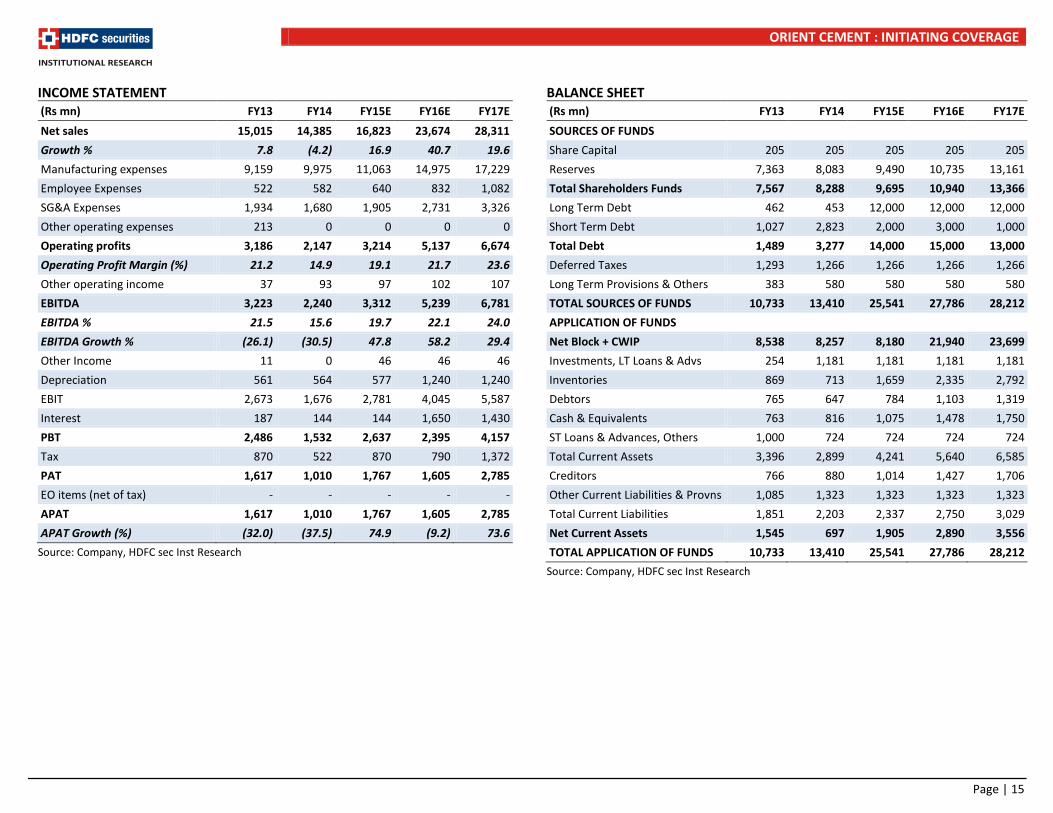
INCOME STATEMENT (Rs mn) FY13 FY14 FY15E FY16E FY17E Net sales 15,015 14,385 16,823 23,674 28,311 Growth % 7.8 (4.2) 16.9 40.7 19.6 Manufacturing expenses 9,159 9,975 11,063 14,975 17,229 Employee Expenses 522 582 640 832 1,082 SG&A Expenses 1,934 1,680 1,905 2,731 3,326 Other operating expenses 213 0 0 0 0 Operating profits 3,186 2,147 3,214 5,137 6,674 Operating Profit Margin (%) 21.2 14.9 19.1 21.7 23.6 Other operating income 37 93 97 102 107 EBITDA 3,223 2,240 3,312 5,239 6,781 EBITDA % 21.5 15.6 19.7 22.1 24.0 EBITDA Growth % (26.1) (30.5) 47.8 58.2 29.4 Other Income 11 0 46 46 46 Depreciation 561 564 577 1,240 1,240 EBIT 2,673 1,676 2,781 4,045 5,587 Interest 187 144 144 1,650 1,430 PBT 2,486 1,532 2,637 2,395 4,157 Tax 870 522 870 790 1,372 PAT 1,617 1,010 1,767 1,605 2,785 EO items (net of tax) - - - - - APAT 1,617 1,010 1,767 1,605 2,785 APAT Growth (%) (32.0) (37.5) 74.9 (9.2) 73.6
Source: Company, HDFC sec Inst Research
BALANCE SHEET (Rs mn) FY13 FY14 FY15E FY16E FY17E SOURCES OF FUNDS Share Capital 205 205 205 205 205 Reserves 7,363 8,083 9,490 10,735 13,161 Total Shareholders Funds 7,567 8,288 9,695 10,940 13,366 Long Term Debt 462 453 12,000 12,000 12,000 Short Term Debt 1,027 2,823 2,000 3,000 1,000 Total Debt 1,489 3,277 14,000 15,000 13,000 Deferred Taxes 1,293 1,266 1,266 1,266 1,266 Long Term Provisions & Others 383 580 580 580 580 TOTAL SOURCES OF FUNDS 10,733 13,410 25,541 27,786 28,212 APPLICATION OF FUNDS Net Block + CWIP 8,538 8,257 8,180 21,940 23,699 Investments, LT Loans & Advs 254 1,181 1,181 1,181 1,181 Inventories 869 713 1,659 2,335 2,792 Debtors 765 647 784 1,103 1,319 Cash & Equivalents 763 816 1,075 1,478 1,750 ST Loans & Advances, Others 1,000 724 724 724 724 Total Current Assets 3,396 2,899 4,241 5,640 6,585 Creditors 766 880 1,014 1,427 1,706 Other Current Liabilities & Provns 1,085 1,323 1,323 1,323 1,323 Total Current Liabilities 1,851 2,203 2,337 2,750 3,029 Net Current Assets 1,545 697 1,905 2,890 3,556 TOTAL APPLICATION OF FUNDS 10,733 13,410 25,541 27,786 28,212
Source: Company, HDFC sec Inst Research
Page | 15
ORIENT CEMENT : INITIATING COVERAGE
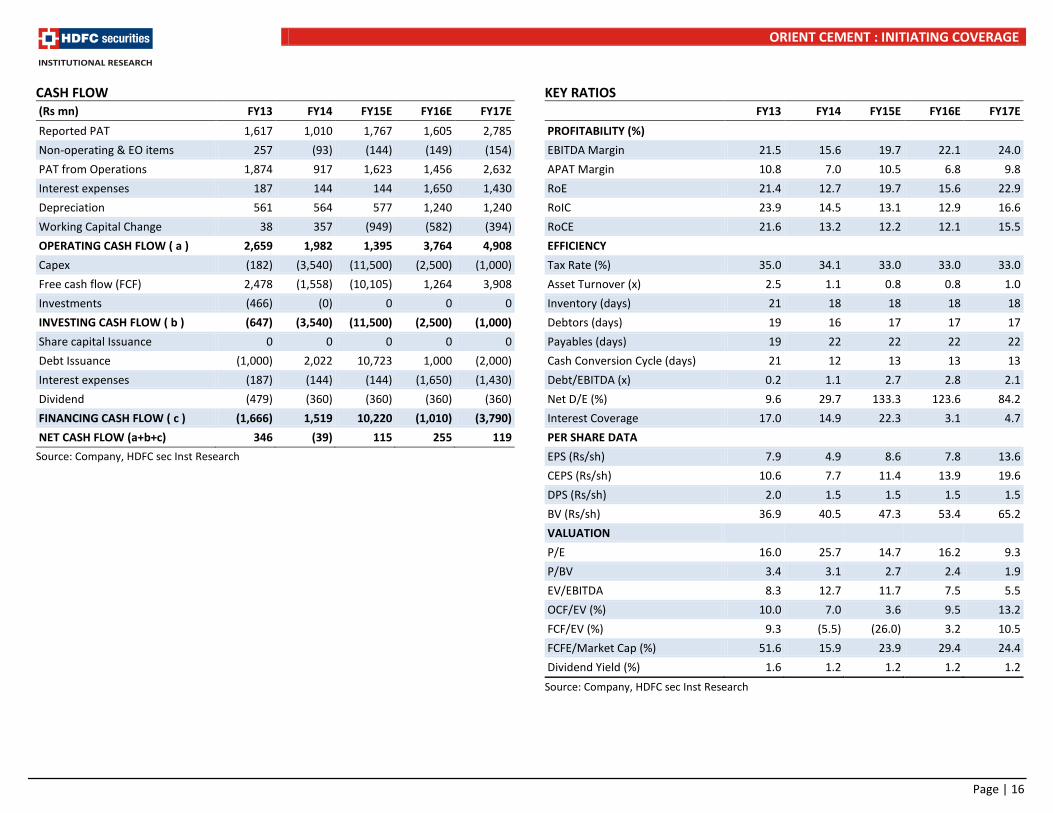
CASH FLOW (Rs mn) FY13 FY14 FY15E FY16E FY17E Reported PAT 1,617 1,010 1,767 1,605 2,785 Non-operating & EO items 257 (93) (144) (149) (154) PAT from Operations 1,874 917 1,623 1,456 2,632 Interest expenses 187 144 144 1,650 1,430 Depreciation 561 564 577 1,240 1,240 Working Capital Change 38 357 (949) (582) (394) OPERATING CASH FLOW ( a ) 2,659 1,982 1,395 3,764 4,908 Capex (182) (3,540) (11,500) (2,500) (1,000) Free cash flow (FCF) 2,478 (1,558) (10,105) 1,264 3,908 Investments (466) (0) 0 0 0 INVESTING CASH FLOW ( b ) (647) (3,540) (11,500) (2,500) (1,000) Share capital Issuance 0 0 0 0 0 Debt Issuance (1,000) 2,022 10,723 1,000 (2,000) Interest expenses (187) (144) (144) (1,650) (1,430) Dividend (479) (360) (360) (360) (360) FINANCING CASH FLOW ( c ) (1,666) 1,519 10,220 (1,010) (3,790) NET CASH FLOW (a+b+c) 346 (39) 115 255 119
Source: Company, HDFC sec Inst Research
KEY RATIOS
FY13 FY14 FY15E FY16E FY17E PROFITABILITY (%) EBITDA Margin 21.5 15.6 19.7 22.1 24.0 APAT Margin 10.8 7.0 10.5 6.8 9.8 RoE 21.4 12.7 19.7 15.6 22.9 RoIC 23.9 14.5 13.1 12.9 16.6 RoCE 21.6 13.2 12.2 12.1 15.5 EFFICIENCY Tax Rate (%) 35.0 34.1 33.0 33.0 33.0 Asset Turnover (x) 2.5 1.1 0.8 0.8 1.0 Inventory (days) 21 18 18 18 18 Debtors (days) 19 16 17 17 17 Payables (days) 19 22 22 22 22 Cash Conversion Cycle (days) 21 12 13 13 13 Debt/EBITDA (x) 0.2 1.1 2.7 2.8 2.1 Net D/E (%) 9.6 29.7 133.3 123.6 84.2 Interest Coverage 17.0 14.9 22.3 3.1 4.7 PER SHARE DATA EPS (Rs/sh) 7.9 4.9 8.6 7.8 13.6 CEPS (Rs/sh) 10.6 7.7 11.4 13.9 19.6 DPS (Rs/sh) 2.0 1.5 1.5 1.5 1.5 BV (Rs/sh) 36.9 40.5 47.3 53.4 65.2 VALUATION P/E 16.0 25.7 14.7 16.2 9.3 P/BV 3.4 3.1 2.7 2.4 1.9 EV/EBITDA 8.3 12.7 11.7 7.5 5.5 OCF/EV (%) 10.0 7.0 3.6 9.5 13.2 FCF/EV (%) 9.3 (5.5) (26.0) 3.2 10.5 FCFE/Market Cap (%) 51.6 15.9 23.9 29.4 24.4 Dividend Yield (%) 1.6 1.2 1.2 1.2 1.2
Source: Company, HDFC sec Inst Research
Page | 16
INITIATING COVERAGE 9 OCT 2014
Sanghi Industries BUY
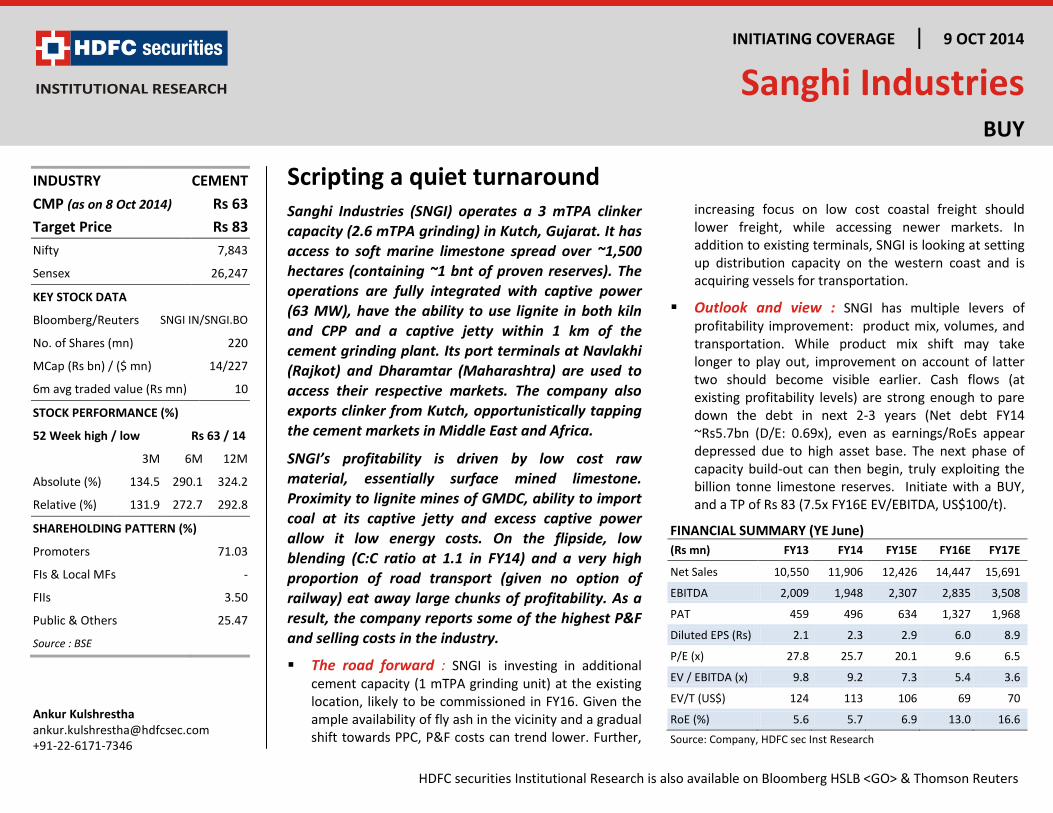
Scripting a quiet turnaround Sanghi Industries (SNGI) operates a 3 mTPA clinker capacity (2.6 mTPA grinding) in Kutch, Gujarat. It has access to soft marine limestone spread over ~1,500 hectares (containing ~1 bnt of proven reserves). The operations are fully integrated with captive power (63 MW), have the ability to use lignite in both kiln and CPP and a captive jetty within 1 km of the cement grinding plant. Its port terminals at Navlakhi (Rajkot) and Dharamtar (Maharashtra) are used to access their respective markets. The company also exports clinker from Kutch, opportunistically tapping the cement markets in Middle East and Africa.
SNGI’s profitability is driven by low cost raw material, essentially surface mined limestone. Proximity to lignite mines of GMDC, ability to import coal at its captive jetty and excess captive power allow it low energy costs. On the flipside, low blending (C:C ratio at 1.1 in FY14) and a very high proportion of road transport (given no option of railway) eat away large chunks of profitability. As a result, the company reports some of the highest P&F and selling costs in the industry.
The road forward : SNGI is investing in additional cement capacity (1 mTPA grinding unit) at the existing location, likely to be commissioned in FY16. Given the ample availability of fly ash in the vicinity and a gradual shift towards PPC, P&F costs can trend lower. Further,
increasing focus on low cost coastal freight should lower freight, while accessing newer markets. In addition to existing terminals, SNGI is looking at setting up distribution capacity on the western coast and is acquiring vessels for transportation.
Outlook and view : SNGI has multiple levers of profitability improvement: product mix, volumes, and transportation. While product mix shift may take longer to play out, improvement on account of latter two should become visible earlier. Cash flows (at existing profitability levels) are strong enough to pare down the debt in next 2-3 years (Net debt FY14 ~Rs5.7bn (D/E: 0.69x), even as earnings/RoEs appear depressed due to high asset base. The next phase of capacity build-out can then begin, truly exploiting the billion tonne limestone reserves. Initiate with a BUY, and a TP of Rs 83 (7.5x FY16E EV/EBITDA, US$100/t).
FINANCIAL SUMMARY (YE June) (Rs mn) FY13 FY14 FY15E FY16E FY17E
Net Sales 10,550 11,906 12,426 14,447 15,691
EBITDA 2,009 1,948 2,307 2,835 3,508
PAT 459 496 634 1,327 1,968
Diluted EPS (Rs) 2.1 2.3 2.9 6.0 8.9
P/E (x) 27.8 25.7 20.1 9.6 6.5
EV / EBITDA (x) 9.8 9.2 7.3 5.4 3.6
EV/T (US$) 124 113 106 69 70
RoE (%) 5.6 5.7 6.9 13.0 16.6 Source: Company, HDFC sec Inst Research
INDUSTRY CEMENT CMP (as on 8 Oct 2014) Rs 63 Target Price Rs 83 Nifty 7,843
Sensex 26,247
KEY STOCK DATA
Bloomberg/Reuters SNGI IN/SNGI.BO
No. of Shares (mn) 220
MCap (Rs bn) / ($ mn) 14/227
6m avg traded value (Rs mn) 10
STOCK PERFORMANCE (%)
52 Week high / low Rs 63 / 14
3M 6M 12M
Absolute (%) 134.5 290.1 324.2
Relative (%) 131.9 272.7 292.8
SHAREHOLDING PATTERN (%)
Promoters 71.03
FIs & Local MFs -
FIIs 3.50
Public & Others 25.47
Source : BSE
Ankur Kulshrestha [email protected] +91-22-6171-7346
HDFC securities Institutional Research is also available on Bloomberg HSLB <GO> & Thomson Reuters
SANGHI INDUSTRIES : INITIATING COVERAGE
Key investment arguments
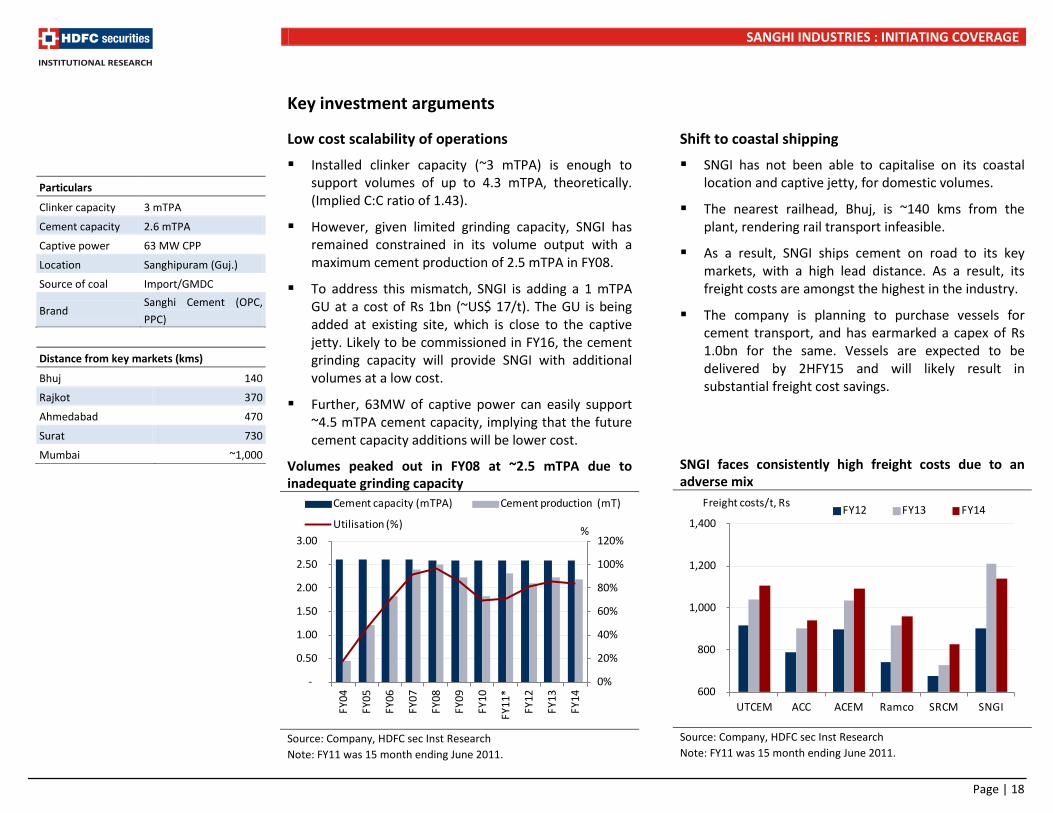
Low cost scalability of operations
Installed clinker capacity (~3 mTPA) is enough to support volumes of up to 4.3 mTPA, theoretically. (Implied C:C ratio of 1.43).
However, given limited grinding capacity, SNGI has remained constrained in its volume output with a maximum cement production of 2.5 mTPA in FY08.
To address this mismatch, SNGI is adding a 1 mTPA GU at a cost of Rs 1bn (~US$ 17/t). The GU is being added at existing site, which is close to the captive jetty. Likely to be commissioned in FY16, the cement grinding capacity will provide SNGI with additional volumes at a low cost.
Further, 63MW of captive power can easily support ~4.5 mTPA cement capacity, implying that the future cement capacity additions will be lower cost.
Volumes peaked out in FY08 at ~2.5 mTPA due to inadequate grinding capacity
Source: Company, HDFC sec Inst Research Note: FY11 was 15 month ending June 2011.
Shift to coastal shipping
SNGI has not been able to capitalise on its coastal location and captive jetty, for domestic volumes.
The nearest railhead, Bhuj, is ~140 kms from the plant, rendering rail transport infeasible.
As a result, SNGI ships cement on road to its key markets, with a high lead distance. As a result, its freight costs are amongst the highest in the industry.
The company is planning to purchase vessels for cement transport, and has earmarked a capex of Rs 1.0bn for the same. Vessels are expected to be delivered by 2HFY15 and will likely result in substantial freight cost savings.
SNGI faces consistently high freight costs due to an adverse mix
Source: Company, HDFC sec Inst Research Note: FY11 was 15 month ending June 2011.
Particulars
Clinker capacity 3 mTPA
Cement capacity 2.6 mTPA
Captive power 63 MW CPP
Location Sanghipuram (Guj.)
Source of coal Import/GMDC
Brand Sanghi Cement (OPC, PPC)
Distance from key markets (kms)
Bhuj 140
Rajkot 370
Ahmedabad 470
Surat 730
Mumbai ~1,000
600
800
1,000
1,200
1,400
UTCEM ACC ACEM Ramco SRCM SNGI
Freight costs/t, Rs FY12 FY13 FY14
0%
20%
40%
60%
80%
100%
120%
-
0.50
1.00
1.50
2.00
2.50
3.00
FY04
FY05
FY06
FY07
FY08
FY09
FY10
FY11
*
FY12
FY13
FY14
Cement capacity (mTPA) Cement production (mT)
Utilisation (%) %
Page | 18
SANGHI INDUSTRIES : INITIATING COVERAGE
Improvement in product mix (More PPC)
SNGI sells primarily OPC, given low grinding/blending capacity and brand positioning. Of late the company has attempted to foray in to PPC manufacturing.
This is likely to bring down the production costs even lower on a per tonne basis, since the landed cost of fly ash is lower than clinker production cost.
With multiple fly ash sources available in the vicinity (Mundra/Tata Power) and increasing grinding capacity, share of PPC in the mix should increase. The eventual product mix will still tilt towards OPC, given the market dynamics of Gujarat, where OPC is preferred over PPC. Further, the product mix shift is usually slow/gradual and needs marketing effort.
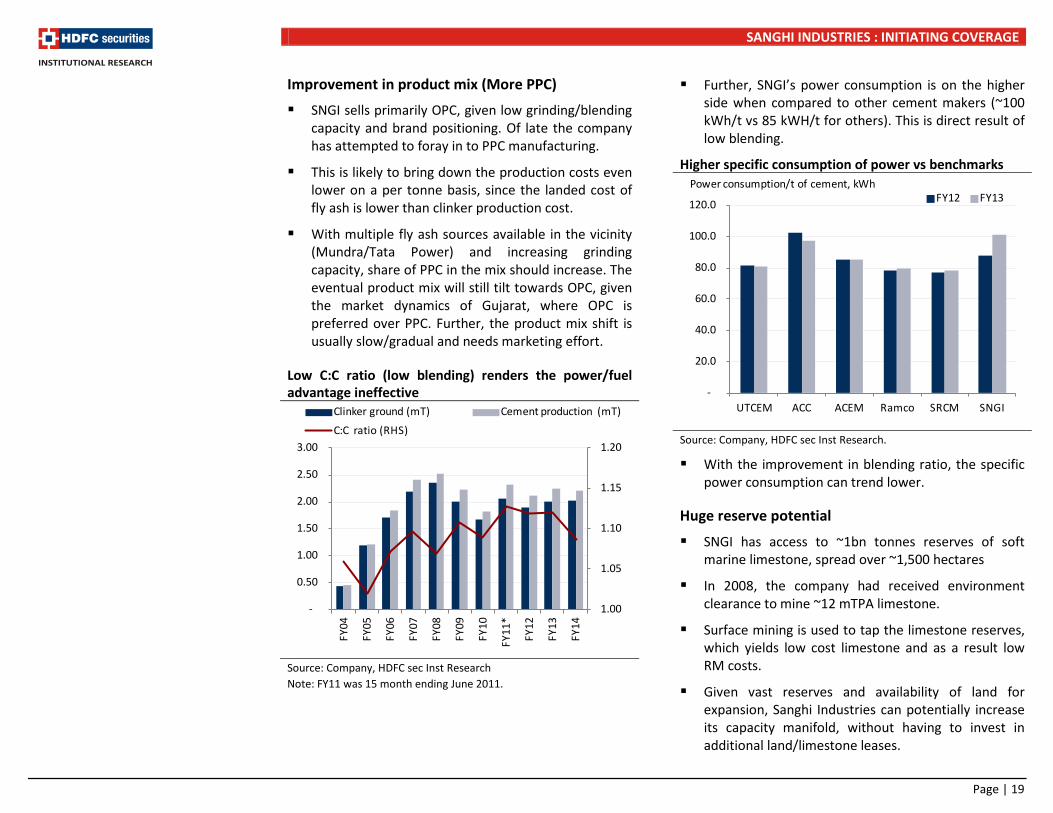
Low C:C ratio (low blending) renders the power/fuel advantage ineffective
Source: Company, HDFC sec Inst Research Note: FY11 was 15 month ending June 2011.
Further, SNGI’s power consumption is on the higher side when compared to other cement makers (~100 kWh/t vs 85 kWH/t for others). This is direct result of low blending.
Higher specific consumption of power vs benchmarks
Source: Company, HDFC sec Inst Research.
With the improvement in blending ratio, the specific power consumption can trend lower.
Huge reserve potential
SNGI has access to ~1bn tonnes reserves of soft marine limestone, spread over ~1,500 hectares
In 2008, the company had received environment clearance to mine ~12 mTPA limestone.
Surface mining is used to tap the limestone reserves, which yields low cost limestone and as a result low RM costs.
Given vast reserves and availability of land for expansion, Sanghi Industries can potentially increase its capacity manifold, without having to invest in additional land/limestone leases.
1.00
1.05
1.10
1.15
1.20
-
0.50
1.00
1.50
2.00
2.50
3.00
FY04
FY05
FY06
FY07
FY08
FY09
FY10
FY11
*
FY12
FY13
FY14
Clinker ground (mT) Cement production (mT)
C:C ratio (RHS)
-
20.0
40.0
60.0
80.0
100.0
120.0
UTCEM ACC ACEM Ramco SRCM SNGI
Power consumption/t of cement, kWhFY12 FY13
Page | 19
SANGHI INDUSTRIES : INITIATING COVERAGE
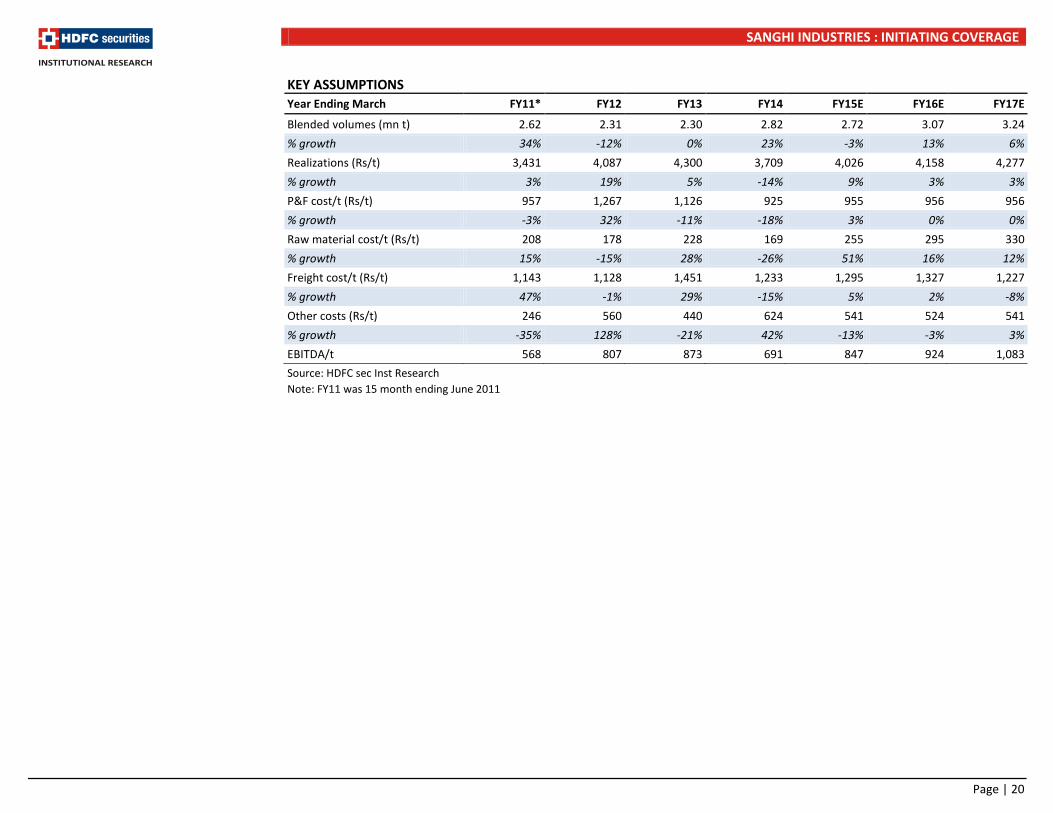
KEY ASSUMPTIONS Year Ending March FY11* FY12 FY13 FY14 FY15E FY16E FY17E
Blended volumes (mn t) 2.62 2.31 2.30 2.82 2.72 3.07 3.24 % growth 34% -12% 0% 23% -3% 13% 6% Realizations (Rs/t) 3,431 4,087 4,300 3,709 4,026 4,158 4,277 % growth 3% 19% 5% -14% 9% 3% 3% P&F cost/t (Rs/t) 957 1,267 1,126 925 955 956 956 % growth -3% 32% -11% -18% 3% 0% 0% Raw material cost/t (Rs/t) 208 178 228 169 255 295 330 % growth 15% -15% 28% -26% 51% 16% 12% Freight cost/t (Rs/t) 1,143 1,128 1,451 1,233 1,295 1,327 1,227 % growth 47% -1% 29% -15% 5% 2% -8% Other costs (Rs/t) 246 560 440 624 541 524 541 % growth -35% 128% -21% 42% -13% -3% 3% EBITDA/t 568 807 873 691 847 924 1,083 Source: HDFC sec Inst Research Note: FY11 was 15 month ending June 2011
Page | 20
SANGHI INDUSTRIES : INITIATING COVERAGE
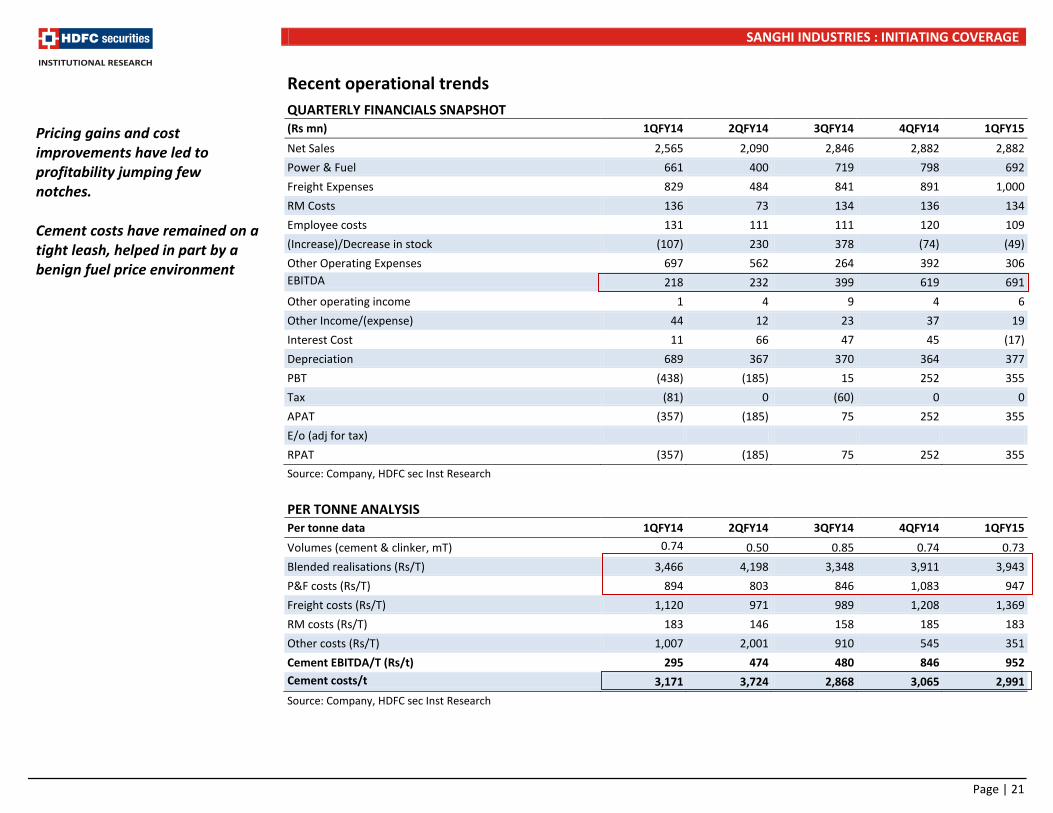
Recent operational trends QUARTERLY FINANCIALS SNAPSHOT (Rs mn) 1QFY14 2QFY14 3QFY14 4QFY14 1QFY15
Net Sales 2,565 2,090 2,846 2,882 2,882 Power & Fuel 661 400 719 798 692 Freight Expenses 829 484 841 891 1,000 RM Costs 136 73 134 136 134 Employee costs 131 111 111 120 109 (Increase)/Decrease in stock (107) 230 378 (74) (49) Other Operating Expenses 697 562 264 392 306 EBITDA 218 232 399 619 691 Other operating income 1 4 9 4 6 Other Income/(expense) 44 12 23 37 19 Interest Cost 11 66 47 45 (17) Depreciation 689 367 370 364 377 PBT (438) (185) 15 252 355 Tax (81) 0 (60) 0 0 APAT (357) (185) 75 252 355 E/o (adj for tax) RPAT (357) (185) 75 252 355 Source: Company, HDFC sec Inst Research PER TONNE ANALYSIS Per tonne data 1QFY14 2QFY14 3QFY14 4QFY14 1QFY15 Volumes (cement & clinker, mT) 0.74 0.50 0.85 0.74 0.73 Blended realisations (Rs/T) 3,466 4,198 3,348 3,911 3,943 P&F costs (Rs/T) 894 803 846 1,083 947 Freight costs (Rs/T) 1,120 971 989 1,208 1,369 RM costs (Rs/T) 183 146 158 185 183 Other costs (Rs/T) 1,007 2,001 910 545 351 Cement EBITDA/T (Rs/t) 295 474 480 846 952 Cement costs/t 3,171 3,724 2,868 3,065 2,991 Source: Company, HDFC sec Inst Research
Pricing gains and cost improvements have led to profitability jumping few notches. Cement costs have remained on a tight leash, helped in part by a benign fuel price environment
Page | 21
SANGHI INDUSTRIES : INITIATING COVERAGE
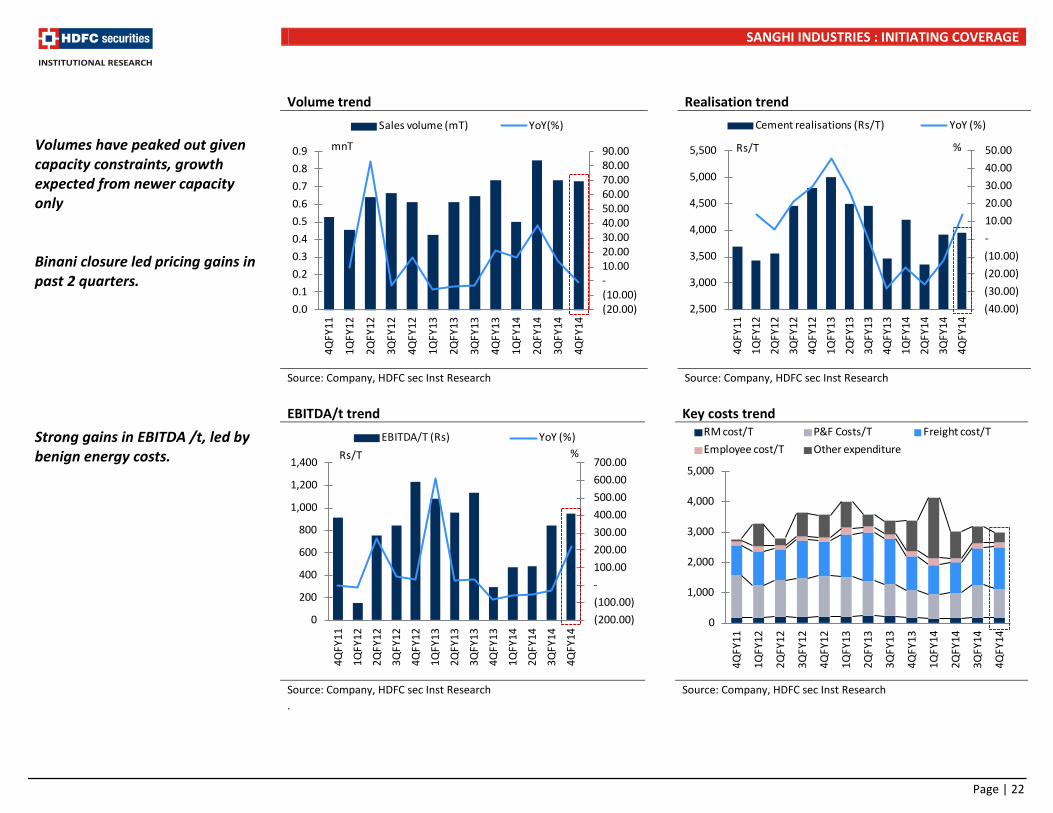
Volume trend Realisation trend
Source: Company, HDFC sec Inst Research Source: Company, HDFC sec Inst Research EBITDA/t trend Key costs trend
Source: Company, HDFC sec Inst Research Source: Company, HDFC sec Inst Research .
Volumes have peaked out given capacity constraints, growth expected from newer capacity only Binani closure led pricing gains in past 2 quarters. Strong gains in EBITDA /t, led by benign energy costs.
(20.00)(10.00)-10.00 20.00 30.00 40.00 50.00 60.00 70.00 80.00 90.00
0.00.10.20.30.40.50.60.70.80.9
4QFY
11
1QFY
12
2QFY
12
3QFY
12
4QFY
12
1QFY
13
2QFY
13
3QFY
13
4QFY
13
1QFY
14
2QFY
14
3QFY
14
4QFY
14
Sales volume (mT) YoY(%)
mnT
(40.00)(30.00)(20.00)(10.00)-10.00 20.00 30.00 40.00 50.00
2,500
3,000
3,500
4,000
4,500
5,000
5,500
4QFY
111Q
FY12
2QFY
123Q
FY12
4QFY
121Q
FY13
2QFY
133Q
FY13
4QFY
131Q
FY14
2QFY
143Q
FY14
4QFY
14
Cement realisations (Rs/T) YoY (%)
Rs/T %
(200.00)(100.00)-100.00 200.00 300.00 400.00 500.00 600.00 700.00
0
200
400
600
800
1,000
1,200
1,400
4QFY
11
1QFY
12
2QFY
12
3QFY
12
4QFY
12
1QFY
13
2QFY
13
3QFY
13
4QFY
13
1QFY
14
2QFY
14
3QFY
14
4QFY
14
EBITDA/T (Rs) YoY (%)Rs/T %
0
1,000
2,000
3,000
4,000
5,000
4QFY
11
1QFY
12
2QFY
12
3QFY
12
4QFY
12
1QFY
13
2QFY
13
3QFY
13
4QFY
13
1QFY
14
2QFY
14
3QFY
14
4QFY
14
RM cost/T P&F Costs/T Freight cost/TEmployee cost/T Other expenditure
Page | 22
SANGHI INDUSTRIES : INITIATING COVERAGE
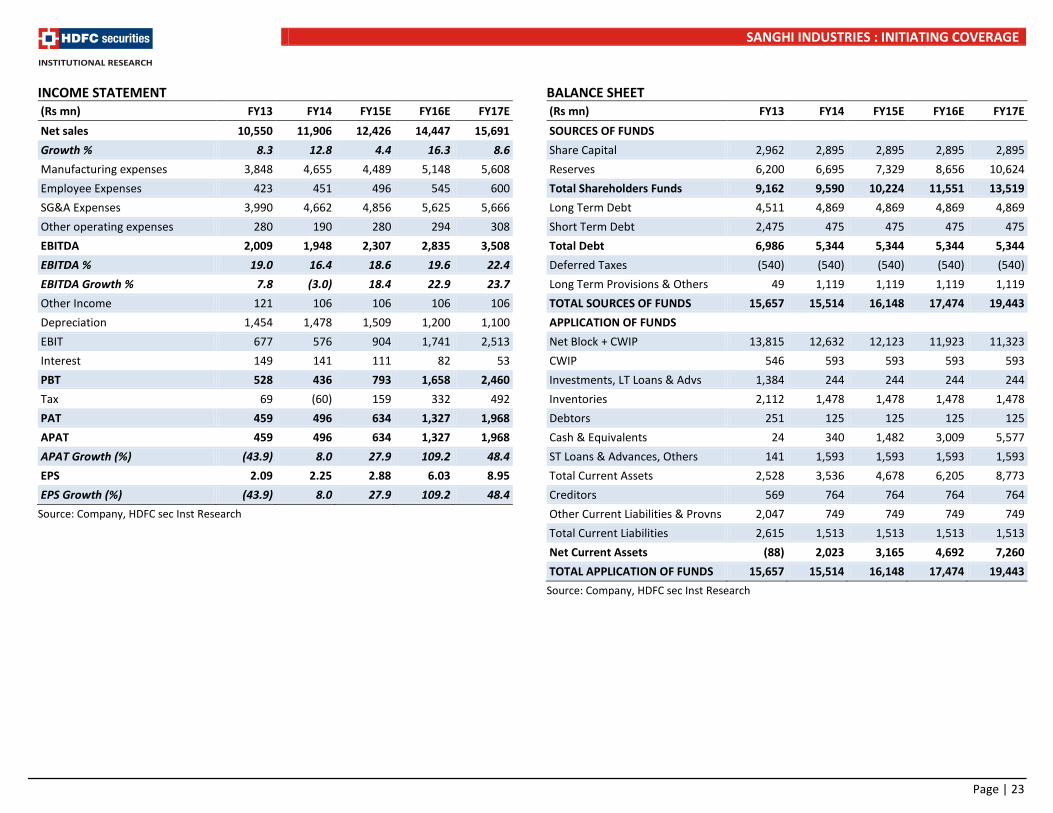
INCOME STATEMENT (Rs mn) FY13 FY14 FY15E FY16E FY17E Net sales 10,550 11,906 12,426 14,447 15,691 Growth % 8.3 12.8 4.4 16.3 8.6 Manufacturing expenses 3,848 4,655 4,489 5,148 5,608 Employee Expenses 423 451 496 545 600 SG&A Expenses 3,990 4,662 4,856 5,625 5,666 Other operating expenses 280 190 280 294 308 EBITDA 2,009 1,948 2,307 2,835 3,508 EBITDA % 19.0 16.4 18.6 19.6 22.4 EBITDA Growth % 7.8 (3.0) 18.4 22.9 23.7 Other Income 121 106 106 106 106 Depreciation 1,454 1,478 1,509 1,200 1,100 EBIT 677 576 904 1,741 2,513 Interest 149 141 111 82 53 PBT 528 436 793 1,658 2,460 Tax 69 (60) 159 332 492 PAT 459 496 634 1,327 1,968 APAT 459 496 634 1,327 1,968 APAT Growth (%) (43.9) 8.0 27.9 109.2 48.4 EPS 2.09 2.25 2.88 6.03 8.95 EPS Growth (%) (43.9) 8.0 27.9 109.2 48.4
Source: Company, HDFC sec Inst Research
BALANCE SHEET (Rs mn) FY13 FY14 FY15E FY16E FY17E SOURCES OF FUNDS Share Capital 2,962 2,895 2,895 2,895 2,895 Reserves 6,200 6,695 7,329 8,656 10,624 Total Shareholders Funds 9,162 9,590 10,224 11,551 13,519 Long Term Debt 4,511 4,869 4,869 4,869 4,869 Short Term Debt 2,475 475 475 475 475 Total Debt 6,986 5,344 5,344 5,344 5,344 Deferred Taxes (540) (540) (540) (540) (540) Long Term Provisions & Others 49 1,119 1,119 1,119 1,119 TOTAL SOURCES OF FUNDS 15,657 15,514 16,148 17,474 19,443 APPLICATION OF FUNDS Net Block + CWIP 13,815 12,632 12,123 11,923 11,323 CWIP 546 593 593 593 593 Investments, LT Loans & Advs 1,384 244 244 244 244 Inventories 2,112 1,478 1,478 1,478 1,478 Debtors 251 125 125 125 125 Cash & Equivalents 24 340 1,482 3,009 5,577 ST Loans & Advances, Others 141 1,593 1,593 1,593 1,593 Total Current Assets 2,528 3,536 4,678 6,205 8,773 Creditors 569 764 764 764 764 Other Current Liabilities & Provns 2,047 749 749 749 749 Total Current Liabilities 2,615 1,513 1,513 1,513 1,513 Net Current Assets (88) 2,023 3,165 4,692 7,260 TOTAL APPLICATION OF FUNDS 15,657 15,514 16,148 17,474 19,443
Source: Company, HDFC sec Inst Research
Page | 23
SANGHI INDUSTRIES : INITIATING COVERAGE
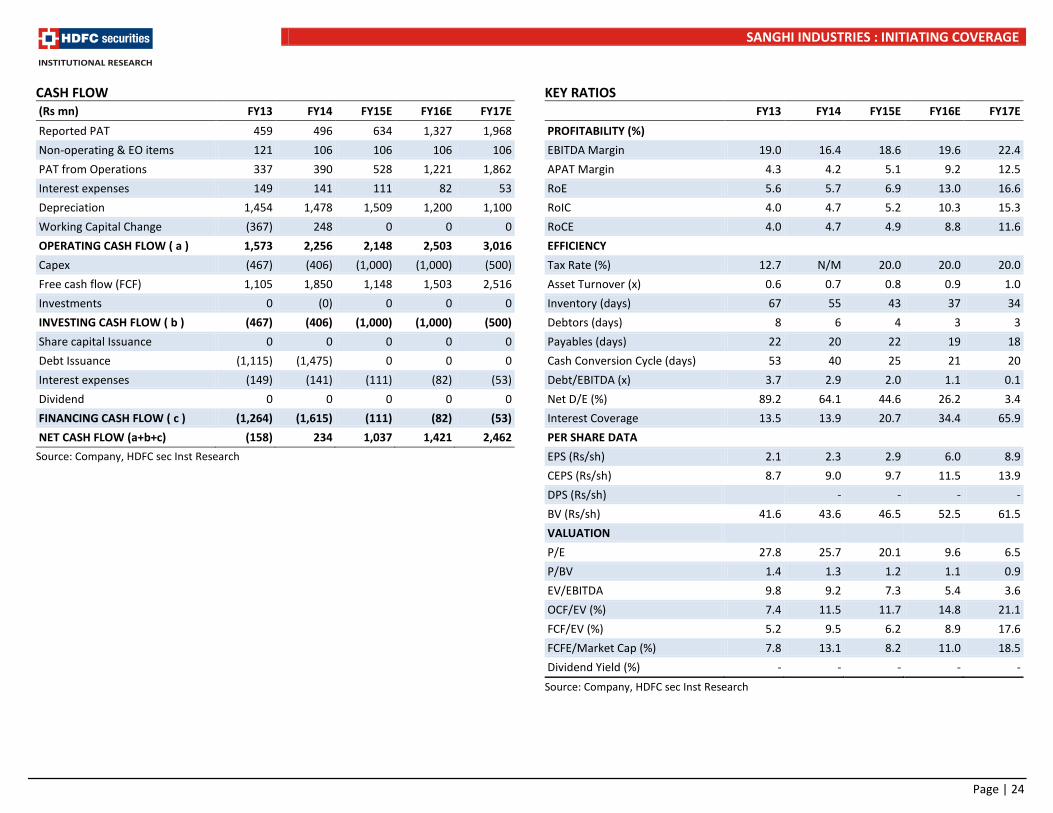
CASH FLOW (Rs mn) FY13 FY14 FY15E FY16E FY17E Reported PAT 459 496 634 1,327 1,968 Non-operating & EO items 121 106 106 106 106 PAT from Operations 337 390 528 1,221 1,862 Interest expenses 149 141 111 82 53 Depreciation 1,454 1,478 1,509 1,200 1,100 Working Capital Change (367) 248 0 0 0 OPERATING CASH FLOW ( a ) 1,573 2,256 2,148 2,503 3,016 Capex (467) (406) (1,000) (1,000) (500) Free cash flow (FCF) 1,105 1,850 1,148 1,503 2,516 Investments 0 (0) 0 0 0 INVESTING CASH FLOW ( b ) (467) (406) (1,000) (1,000) (500) Share capital Issuance 0 0 0 0 0 Debt Issuance (1,115) (1,475) 0 0 0 Interest expenses (149) (141) (111) (82) (53) Dividend 0 0 0 0 0 FINANCING CASH FLOW ( c ) (1,264) (1,615) (111) (82) (53) NET CASH FLOW (a+b+c) (158) 234 1,037 1,421 2,462
Source: Company, HDFC sec Inst Research
KEY RATIOS FY13 FY14 FY15E FY16E FY17E PROFITABILITY (%) EBITDA Margin 19.0 16.4 18.6 19.6 22.4 APAT Margin 4.3 4.2 5.1 9.2 12.5 RoE 5.6 5.7 6.9 13.0 16.6 RoIC 4.0 4.7 5.2 10.3 15.3 RoCE 4.0 4.7 4.9 8.8 11.6 EFFICIENCY Tax Rate (%) 12.7 N/M 20.0 20.0 20.0 Asset Turnover (x) 0.6 0.7 0.8 0.9 1.0 Inventory (days) 67 55 43 37 34 Debtors (days) 8 6 4 3 3 Payables (days) 22 20 22 19 18 Cash Conversion Cycle (days) 53 40 25 21 20 Debt/EBITDA (x) 3.7 2.9 2.0 1.1 0.1 Net D/E (%) 89.2 64.1 44.6 26.2 3.4 Interest Coverage 13.5 13.9 20.7 34.4 65.9 PER SHARE DATA EPS (Rs/sh) 2.1 2.3 2.9 6.0 8.9 CEPS (Rs/sh) 8.7 9.0 9.7 11.5 13.9 DPS (Rs/sh) - - - - BV (Rs/sh) 41.6 43.6 46.5 52.5 61.5 VALUATION P/E 27.8 25.7 20.1 9.6 6.5 P/BV 1.4 1.3 1.2 1.1 0.9 EV/EBITDA 9.8 9.2 7.3 5.4 3.6 OCF/EV (%) 7.4 11.5 11.7 14.8 21.1 FCF/EV (%) 5.2 9.5 6.2 8.9 17.6 FCFE/Market Cap (%) 7.8 13.1 8.2 11.0 18.5 Dividend Yield (%) - - - - -
Source: Company, HDFC sec Inst Research
Page | 24
INITIATING COVERAGE 9 OCT 2014
Mangalam Cement BUY
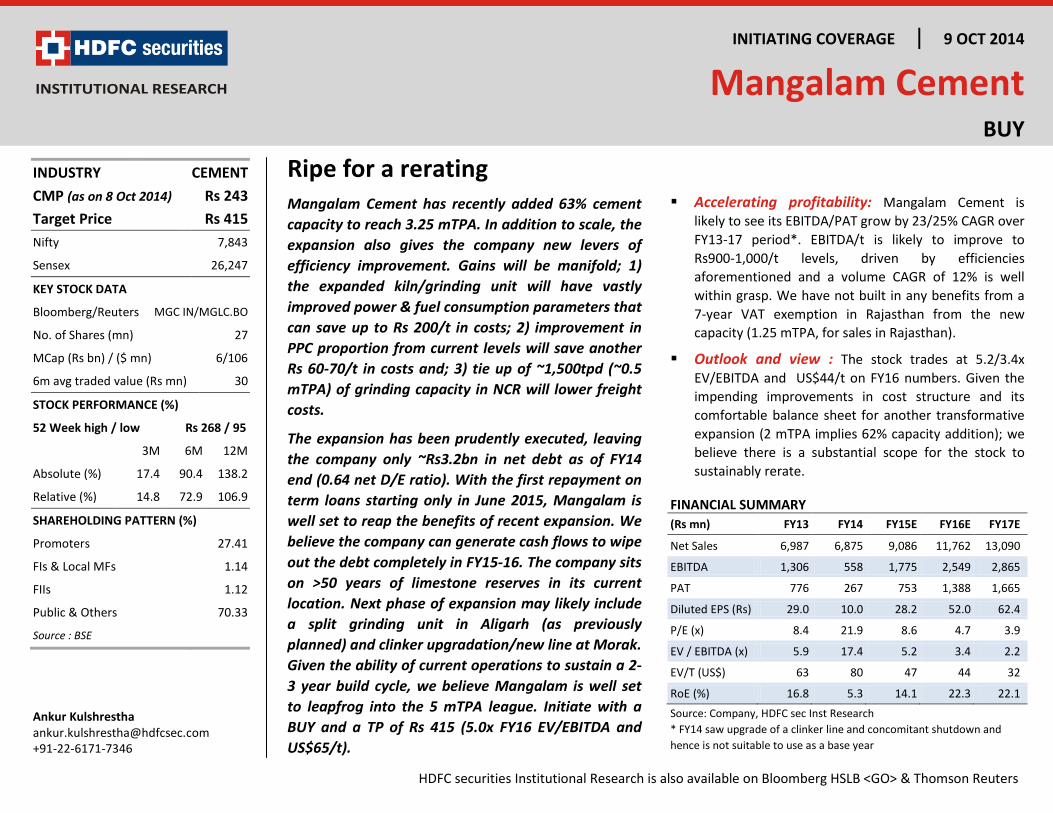
Ripe for a rerating Mangalam Cement has recently added 63% cement capacity to reach 3.25 mTPA. In addition to scale, the expansion also gives the company new levers of efficiency improvement. Gains will be manifold; 1) the expanded kiln/grinding unit will have vastly improved power & fuel consumption parameters that can save up to Rs 200/t in costs; 2) improvement in PPC proportion from current levels will save another Rs 60-70/t in costs and; 3) tie up of ~1,500tpd (~0.5 mTPA) of grinding capacity in NCR will lower freight costs.
The expansion has been prudently executed, leaving the company only ~Rs3.2bn in net debt as of FY14 end (0.64 net D/E ratio). With the first repayment on term loans starting only in June 2015, Mangalam is well set to reap the benefits of recent expansion. We believe the company can generate cash flows to wipe out the debt completely in FY15-16. The company sits on >50 years of limestone reserves in its current location. Next phase of expansion may likely include a split grinding unit in Aligarh (as previously planned) and clinker upgradation/new line at Morak. Given the ability of current operations to sustain a 2-3 year build cycle, we believe Mangalam is well set to leapfrog into the 5 mTPA league. Initiate with a BUY and a TP of Rs 415 (5.0x FY16 EV/EBITDA and US$65/t).
Accelerating profitability: Mangalam Cement is likely to see its EBITDA/PAT grow by 23/25% CAGR over FY13-17 period*. EBITDA/t is likely to improve to Rs900-1,000/t levels, driven by efficiencies aforementioned and a volume CAGR of 12% is well within grasp. We have not built in any benefits from a 7-year VAT exemption in Rajasthan from the new capacity (1.25 mTPA, for sales in Rajasthan).
Outlook and view : The stock trades at 5.2/3.4x EV/EBITDA and US$44/t on FY16 numbers. Given the impending improvements in cost structure and its comfortable balance sheet for another transformative expansion (2 mTPA implies 62% capacity addition); we believe there is a substantial scope for the stock to sustainably rerate.
FINANCIAL SUMMARY (Rs mn) FY13 FY14 FY15E FY16E FY17E
Net Sales 6,987 6,875 9,086 11,762 13,090
EBITDA 1,306 558 1,775 2,549 2,865
PAT 776 267 753 1,388 1,665
Diluted EPS (Rs) 29.0 10.0 28.2 52.0 62.4
P/E (x) 8.4 21.9 8.6 4.7 3.9
EV / EBITDA (x) 5.9 17.4 5.2 3.4 2.2
EV/T (US$) 63 80 47 44 32
RoE (%) 16.8 5.3 14.1 22.3 22.1 Source: Company, HDFC sec Inst Research * FY14 saw upgrade of a clinker line and concomitant shutdown and hence is not suitable to use as a base year
INDUSTRY CEMENT CMP (as on 8 Oct 2014) Rs 243 Target Price Rs 415 Nifty 7,843
Sensex 26,247
KEY STOCK DATA
Bloomberg/Reuters MGC IN/MGLC.BO
No. of Shares (mn) 27
MCap (Rs bn) / ($ mn) 6/106
6m avg traded value (Rs mn) 30
STOCK PERFORMANCE (%)
52 Week high / low Rs 268 / 95
3M 6M 12M
Absolute (%) 17.4 90.4 138.2
Relative (%) 14.8 72.9 106.9
SHAREHOLDING PATTERN (%)
Promoters 27.41
FIs & Local MFs 1.14
FIIs 1.12
Public & Others 70.33
Source : BSE
Ankur Kulshrestha [email protected] +91-22-6171-7346
HDFC securities Institutional Research is also available on Bloomberg HSLB <GO> & Thomson Reuters
MANGALAM CEMENT : INITIATING COVERAGE
Key investment arguments
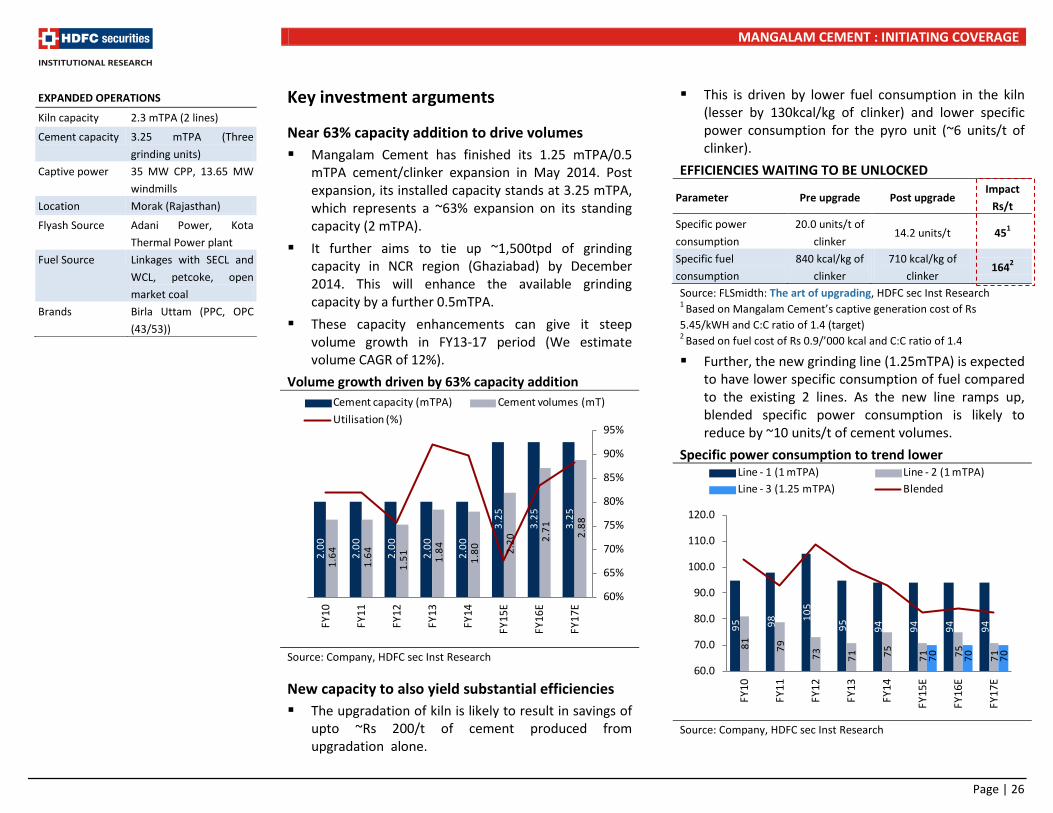
Near 63% capacity addition to drive volumes Mangalam Cement has finished its 1.25 mTPA/0.5
mTPA cement/clinker expansion in May 2014. Post expansion, its installed capacity stands at 3.25 mTPA, which represents a ~63% expansion on its standing capacity (2 mTPA).
It further aims to tie up ~1,500tpd of grinding capacity in NCR region (Ghaziabad) by December 2014. This will enhance the available grinding capacity by a further 0.5mTPA.
These capacity enhancements can give it steep volume growth in FY13-17 period (We estimate volume CAGR of 12%).
Volume growth driven by 63% capacity addition
Source: Company, HDFC sec Inst Research
New capacity to also yield substantial efficiencies The upgradation of kiln is likely to result in savings of
upto ~Rs 200/t of cement produced from upgradation alone.
This is driven by lower fuel consumption in the kiln (lesser by 130kcal/kg of clinker) and lower specific power consumption for the pyro unit (~6 units/t of clinker).
EFFICIENCIES WAITING TO BE UNLOCKED
Parameter Pre upgrade Post upgrade Impact
Rs/t Specific power consumption
20.0 units/t of clinker
14.2 units/t 451
Specific fuel consumption
840 kcal/kg of clinker
710 kcal/kg of clinker
1642
Source: FLSmidth: The art of upgrading, HDFC sec Inst Research 1 Based on Mangalam Cement’s captive generation cost of Rs 5.45/kWH and C:C ratio of 1.4 (target) 2 Based on fuel cost of Rs 0.9/’000 kcal and C:C ratio of 1.4
Further, the new grinding line (1.25mTPA) is expected to have lower specific consumption of fuel compared to the existing 2 lines. As the new line ramps up, blended specific power consumption is likely to reduce by ~10 units/t of cement volumes.
Specific power consumption to trend lower
Source: Company, HDFC sec Inst Research
EXPANDED OPERATIONS
Kiln capacity 2.3 mTPA (2 lines)
Cement capacity 3.25 mTPA (Three grinding units)
Captive power 35 MW CPP, 13.65 MW windmills
Location Morak (Rajasthan)
Flyash Source Adani Power, Kota Thermal Power plant
Fuel Source Linkages with SECL and WCL, petcoke, open market coal
Brands Birla Uttam (PPC, OPC (43/53))
2.00
2.00
2.00
2.00
2.00
3.25
3.25
3.25
1.64
1.64
1.51
1.84
1.80
2.20
2.71
2.88
60%
65%
70%
75%
80%
85%
90%
95%
FY10
FY11
FY12
FY13
FY14
FY15
E
FY16
E
FY17
E
Cement capacity (mTPA) Cement volumes (mT)Utilisation (%)
95
98 10
5
95
94
94
94
94
81
79
73
71
75
71
75
71
70
70
70
60.0
70.0
80.0
90.0
100.0
110.0
120.0
FY10
FY11
FY12
FY13
FY14
FY15
E
FY16
E
FY17
E
Line - 1 (1 mTPA) Line - 2 (1 mTPA)Line - 3 (1.25 mTPA) Blended
Page | 26
MANGALAM CEMENT : INITIATING COVERAGE
Product and geographic mix to further aid margins
Mangalam Cement currently produces 60% PPC cement, which can increase to 85-90%, given its market dynamics. The switch from OPC to PPC can yield further efficiency benefits, especially given the availability of fly ash is available via long term contracts.
The expanded capacity will have VAT exemption in Rajasthan for first 7 years of operations. As a result, the company is likely to increase its supplies to Rajasthan markets (~30% of dispatches at present). In addition to the savings on VAT, this will also result in reduction in lead distance and savings in freight costs.
The grinding capacity tie-up in NCR will also lead to a reduction in freight costs.
Free cash flow to accelerate, wipe out debt
With the full capacity expansion in the bag, FY14 end net debt was Rs 3.2 bn (Net D/E ratio: 0.6).
With a rampup in the new capacity and profitability improvements, we expect the net debt to be wiped out in 2-3 years.
As a result, Mangalam is well placed to embark on a future round of expansion.
Valuations remain attractive
The stock trades at 5.2/3.4x FY15/16 EV/EBITDA and US$44/t (FY16 end).
Page | 27

MANGALAM CEMENT : INITIATING COVERAGE
KEY ASSUMPTIONS Year Ending March FY11 FY12 FY13 FY14 FY15E FY16E FY17E
Cement volumes (mn t) 1.64 1.51 1.84 1.80 2.20 2.71 2.88 % growth -7% 22% -3% 22% 23% 6% Realizations (Rs/t) 3,003 4,108 3,788 3,824 4,130 4,336 4,553 % growth 37% -8% 1% 8% 5% 5% P&F cost/t (Rs/t) 933 1,087 1,088 954 913 949 989 % growth 17% 0% -12% -4% 4% 4% Raw material cost/t (Rs/t) 559 564 610 732 723 746 782 % growth 1% 8% 20% -1% 3% 5% Freight cost/t (Rs/t) 743 1,017 973 1,039 1,091 1,145 1,203 % growth 37% -4% 7% 5% 5% 5% EBITDA/t 359 626 668 256 762 904 962 % growth 74% 7% -62% 198% 19% 7% Source : HDFC sec Inst Research
Page | 28
MANGALAM CEMENT : INITIATING COVERAGE
Recent operational trends QUARTERLY FINANCIALS SNAPSHOT (Rs mn) 1QFY14 2QFY14 3QFY14 4QFY14 1QFY15
Net Sales 1,683 1,449 1,606 2,137 2,281 Power & Fuel 419 359 289 648 549 Freight Expenses 507 489 580 517 611 RM Costs 282 244 279 511 481 Employee costs 99 98 120 109 128 (Increase)/Decrease in stock (4) 88 232 (45) (6) Other Operating Expenses 133 129 176 157 164 EBITDA 247 41 (69) 240 354 Other operating income 10 30 10 47 22 Other Income/(expense) 6 7 8 25 8 Interest Cost 9 9 23 45 67 Depreciation 61 61 70 86 71 PBT 193 9 (145) 181 247 Tax 5 (17) (149) 103 83 APAT 188 26 5 78 164 E/o (adj for tax) 0 0 0 0 34 RPAT 188 26 5 78 129 Source: Company, HDFC sec Inst Research PER TONNE ANALYSIS Per tonne data 1QFY14 2QFY14 3QFY14 4QFY14 1QFY15 Volumes (cement & clinker, mT) 0.45 0.41 0.48 0.53 0.54 Blended realisations (Rs/T) 3,728 3,517 3,346 4,032 4,243 P&F costs (Rs/T) 929 871 602 1,223 1,021 Freight costs (Rs/T) 1,122 1,187 1,208 975 1,136 RM costs (Rs/T) 624 593 581 964 895 Other costs (Rs/T) 505 765 1,099 416 533 Cement EBITDA/T (Rs/t) 548 100 (145) 454 659 Cement costs/t 3,180 3,416 3,491 3,579 3,585 Source: Company, HDFC sec Inst Research
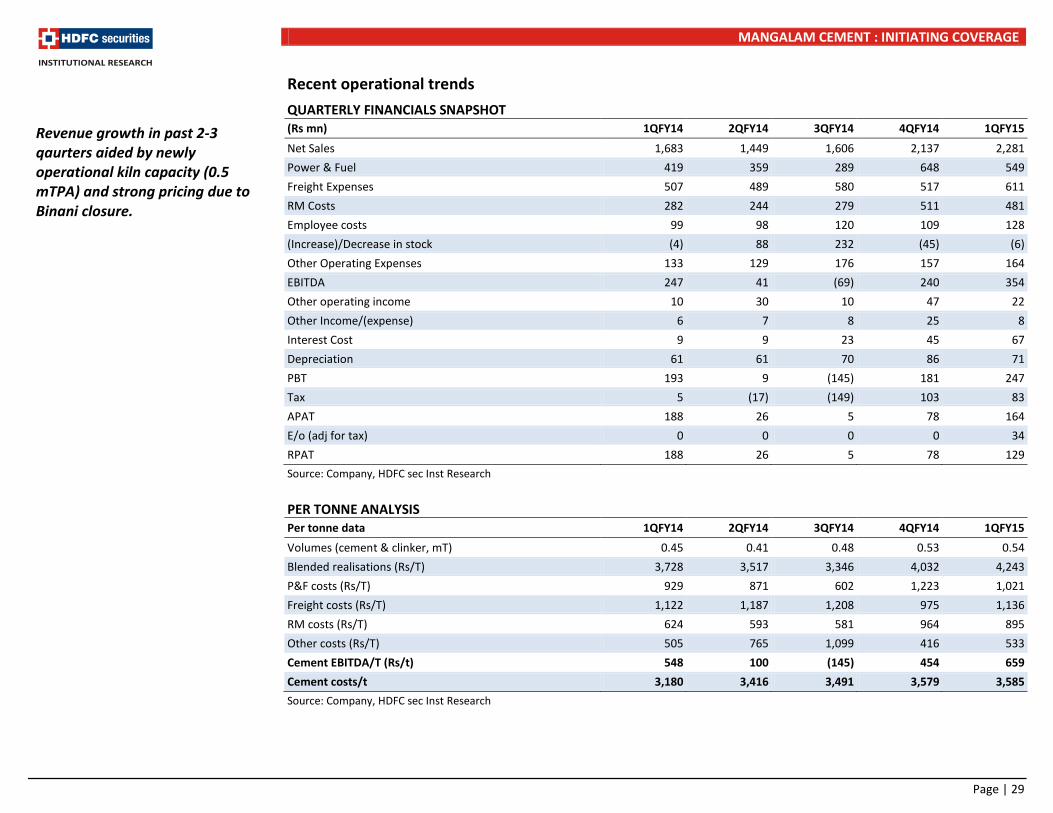
Revenue growth in past 2-3 qaurters aided by newly operational kiln capacity (0.5 mTPA) and strong pricing due to Binani closure.
Page | 29
MANGALAM CEMENT : INITIATING COVERAGE
Volume trend Realisation trend
Source: Company, HDFC sec Inst Research Source: Company, HDFC sec Inst Research EBITDA/t trend Key costs trend
Source: Company, HDFC sec Inst Research Source: Company, HDFC sec Inst Research .
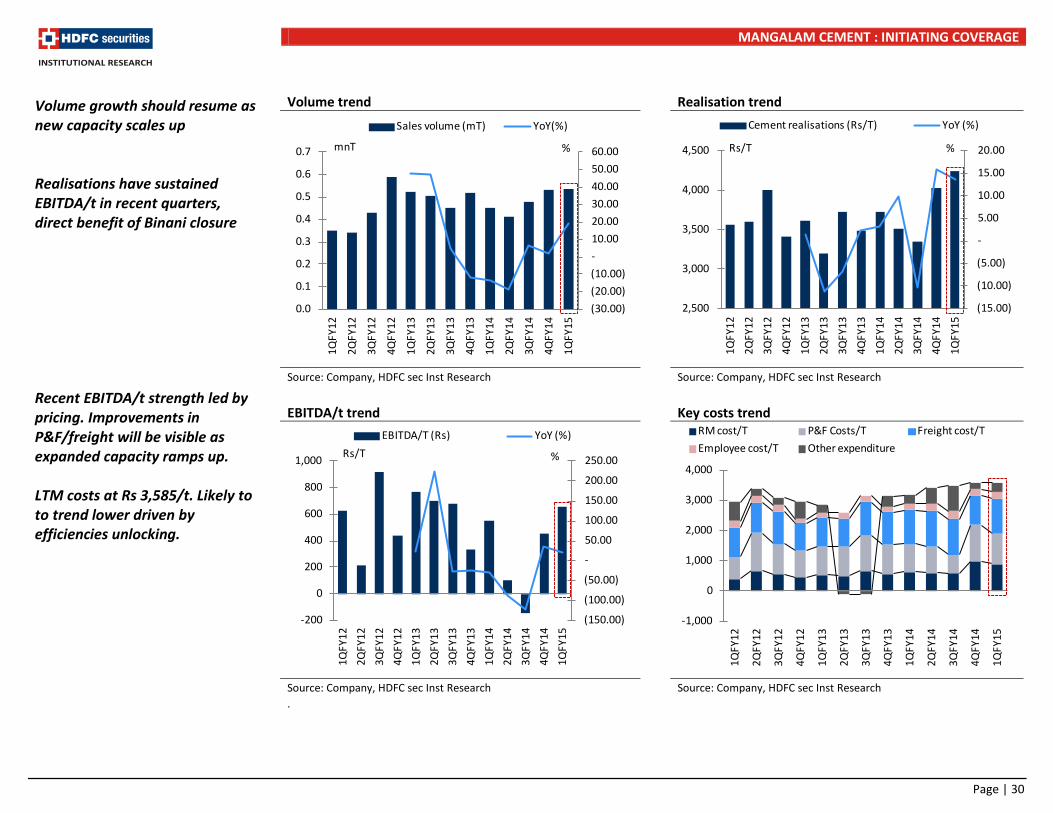
Volume growth should resume as new capacity scales up Realisations have sustained EBITDA/t in recent quarters, direct benefit of Binani closure Recent EBITDA/t strength led by pricing. Improvements in P&F/freight will be visible as expanded capacity ramps up. LTM costs at Rs 3,585/t. Likely to to trend lower driven by efficiencies unlocking.
(30.00)(20.00)(10.00)-10.00 20.00 30.00 40.00 50.00 60.00
0.0
0.1
0.2
0.3
0.4
0.5
0.6
0.7
1QFY
12
2QFY
12
3QFY
12
4QFY
12
1QFY
13
2QFY
13
3QFY
13
4QFY
13
1QFY
14
2QFY
14
3QFY
14
4QFY
14
1QFY
15
Sales volume (mT) YoY(%)
mnT %
(15.00)
(10.00)
(5.00)
-
5.00
10.00
15.00
20.00
2,500
3,000
3,500
4,000
4,500
1QFY
122Q
FY12
3QFY
124Q
FY12
1QFY
132Q
FY13
3QFY
134Q
FY13
1QFY
142Q
FY14
3QFY
144Q
FY14
1QFY
15
Cement realisations (Rs/T) YoY (%)
Rs/T %
(150.00)
(100.00)
(50.00)
-
50.00
100.00
150.00
200.00
250.00
-200
0
200
400
600
800
1,000
1QFY
122Q
FY12
3QFY
124Q
FY12
1QFY
132Q
FY13
3QFY
134Q
FY13
1QFY
142Q
FY14
3QFY
144Q
FY14
1QFY
15
EBITDA/T (Rs) YoY (%)Rs/T %
-1,000
0
1,000
2,000
3,000
4,000
1QFY
12
2QFY
12
3QFY
12
4QFY
12
1QFY
13
2QFY
13
3QFY
13
4QFY
13
1QFY
14
2QFY
14
3QFY
14
4QFY
14
1QFY
15
RM cost/T P&F Costs/T Freight cost/TEmployee cost/T Other expenditure
Page | 30
MANGALAM CEMENT : INITIATING COVERAGE
INCOME STATEMENT (Rs mn) FY13 FY14 FY15E FY16E FY17E Net sales 6,987 6,875 9,086 11,762 13,090 Growth % 12.3 (1.6) 32.2 29.5 11.3 Manufacturing expenses 2,769 3,303 3,599 4,597 5,093 Employee Expenses 381 426 468 515 567 SG&A Expenses 2,036 2,092 2,688 3,480 3,873 Other operating expenses 567 594 654 719 791 Operating profits 1,233 460 1,677 2,451 2,767 Operating Profit Margin (%) 17.6 6.7 18.5 20.8 21.1 Other operating income 73 98 98 98 98 EBITDA 1,306 558 1,775 2,549 2,865 EBITDA % 18.7 8.1 19.5 21.7 21.9 EBITDA Growth % 28.7 (57.3) 218.3 43.6 12.4 Other Income 71 46 46 46 46 Depreciation 251 277 430 488 494 EBIT 1,126 326 1,391 2,107 2,417 Interest 48 87 387 257 197 PBT 1,078 239 1,004 1,850 2,220 Tax 304 (57) 251 463 555 PAT 774 296 753 1,388 1,665 EO items (net of tax) (2) 29 - - - APAT 776 267 753 1,388 1,665 APAT Growth (%) 38.5 (65.5) 181.8 84.2 20.0 EPS 28.98 10.01 28.22 51.98 62.38 EPS Growth (%) 38.2 (65.5) 181.8 84.2 20.0
Source: Company, HDFC sec Inst Research
BALANCE SHEET (Rs mn) FY13 FY14 FY15E FY16E FY17E SOURCES OF FUNDS Share Capital 267 267 267 267 267 Reserves 4,656 4,803 5,356 6,543 8,008 Total Shareholders Funds 4,923 5,070 5,623 6,810 8,275 Long Term Debt 2,110 3,435 3,435 3,435 3,435 Short Term Debt 4 254 121 121 121 Total Debt 2,114 3,688 3,556 3,556 3,556 Deferred Taxes 586 610 610 610 610 Long Term Provisions & Others 824 856 856 856 856 TOTAL SOURCES OF FUNDS 8,447 10,225 10,645 11,832 13,297 APPLICATION OF FUNDS Net Block + CWIP 3,492 5,150 7,270 6,933 6,589 Investments, LT Loans & Advs 797 866 866 866 866 Inventories 1,366 1,159 583 1,673 838 Debtors 302 227 271 374 343 Cash & Equivalents 923 464 1,413 1,918 4,337 ST Loans & Advances, Others 666 1,007 1,007 1,007 1,007 Total Current Assets 3,257 2,857 3,273 4,972 6,526 Creditors 566 689 805 1,129 1,023 Other Current Liabilities & Provns 680 631 631 631 631 Total Current Liabilities 1,246 1,320 1,436 1,760 1,654 Net Current Assets 2,011 1,538 1,837 3,212 4,871 TOTAL APPLICATION OF FUNDS 8,447 10,225 10,645 11,832 13,297
Source: Company, HDFC sec Inst Research
Page | 31
MANGALAM CEMENT : INITIATING COVERAGE
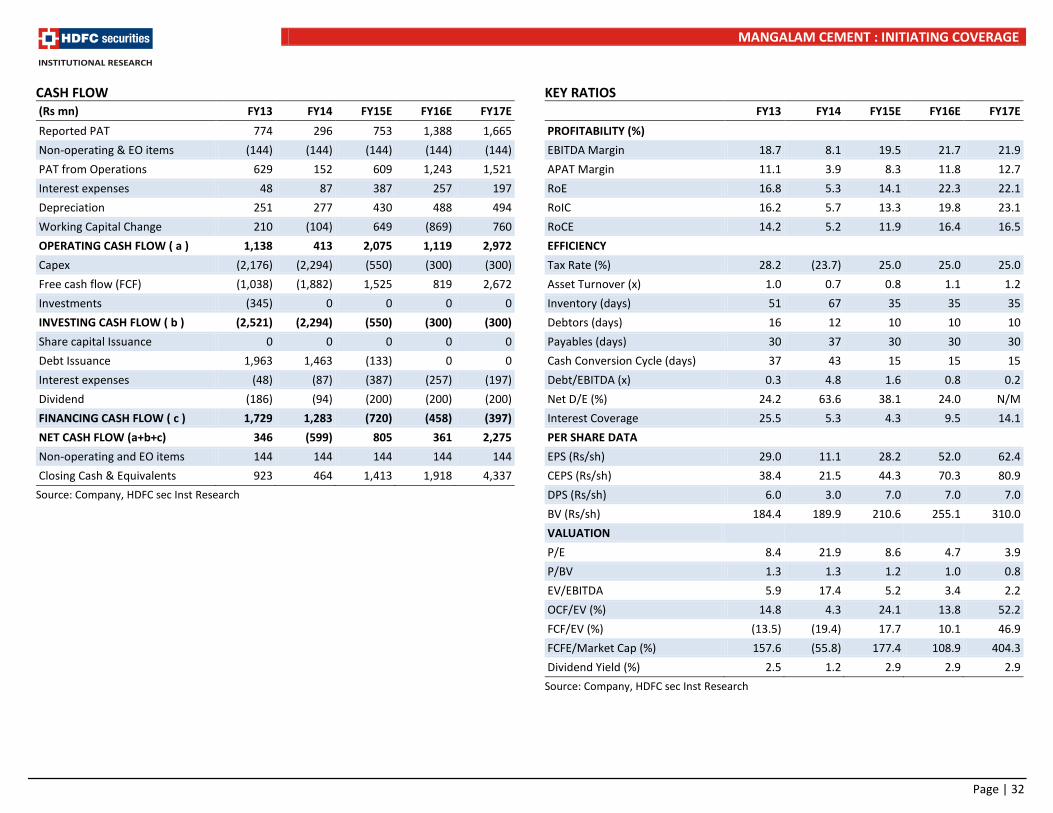
CASH FLOW (Rs mn) FY13 FY14 FY15E FY16E FY17E Reported PAT 774 296 753 1,388 1,665 Non-operating & EO items (144) (144) (144) (144) (144) PAT from Operations 629 152 609 1,243 1,521 Interest expenses 48 87 387 257 197 Depreciation 251 277 430 488 494 Working Capital Change 210 (104) 649 (869) 760 OPERATING CASH FLOW ( a ) 1,138 413 2,075 1,119 2,972 Capex (2,176) (2,294) (550) (300) (300) Free cash flow (FCF) (1,038) (1,882) 1,525 819 2,672 Investments (345) 0 0 0 0 INVESTING CASH FLOW ( b ) (2,521) (2,294) (550) (300) (300) Share capital Issuance 0 0 0 0 0 Debt Issuance 1,963 1,463 (133) 0 0 Interest expenses (48) (87) (387) (257) (197) Dividend (186) (94) (200) (200) (200) FINANCING CASH FLOW ( c ) 1,729 1,283 (720) (458) (397) NET CASH FLOW (a+b+c) 346 (599) 805 361 2,275 Non-operating and EO items 144 144 144 144 144 Closing Cash & Equivalents 923 464 1,413 1,918 4,337
Source: Company, HDFC sec Inst Research
KEY RATIOS
FY13 FY14 FY15E FY16E FY17E PROFITABILITY (%) EBITDA Margin 18.7 8.1 19.5 21.7 21.9 APAT Margin 11.1 3.9 8.3 11.8 12.7 RoE 16.8 5.3 14.1 22.3 22.1 RoIC 16.2 5.7 13.3 19.8 23.1 RoCE 14.2 5.2 11.9 16.4 16.5 EFFICIENCY Tax Rate (%) 28.2 (23.7) 25.0 25.0 25.0 Asset Turnover (x) 1.0 0.7 0.8 1.1 1.2 Inventory (days) 51 67 35 35 35 Debtors (days) 16 12 10 10 10 Payables (days) 30 37 30 30 30 Cash Conversion Cycle (days) 37 43 15 15 15 Debt/EBITDA (x) 0.3 4.8 1.6 0.8 0.2 Net D/E (%) 24.2 63.6 38.1 24.0 N/M Interest Coverage 25.5 5.3 4.3 9.5 14.1 PER SHARE DATA EPS (Rs/sh) 29.0 11.1 28.2 52.0 62.4 CEPS (Rs/sh) 38.4 21.5 44.3 70.3 80.9 DPS (Rs/sh) 6.0 3.0 7.0 7.0 7.0 BV (Rs/sh) 184.4 189.9 210.6 255.1 310.0 VALUATION P/E 8.4 21.9 8.6 4.7 3.9 P/BV 1.3 1.3 1.2 1.0 0.8 EV/EBITDA 5.9 17.4 5.2 3.4 2.2 OCF/EV (%) 14.8 4.3 24.1 13.8 52.2 FCF/EV (%) (13.5) (19.4) 17.7 10.1 46.9 FCFE/Market Cap (%) 157.6 (55.8) 177.4 108.9 404.3 Dividend Yield (%) 2.5 1.2 2.9 2.9 2.9
Source: Company, HDFC sec Inst Research
Page | 32
CEMENT MID-CAP PICKS
Disclaimer: This report has been prepared by HDFC Securities Ltd and is meant for sole use by the recipient and not for circulation. The information and opinions contained herein have been compiled or arrived at, based upon information obtained in good faith from sources believed to be reliable. Such information has not been independently verified and no guaranty, representation of warranty, express or implied, is made as to its accuracy, completeness or correctness. All such information and opinions are subject to change without notice. This document is for information purposes only. Descriptions of any company or companies or their securities mentioned herein are not intended to be complete and this document is not, and should not be construed as an offer or solicitation of an offer, to buy or sell any securities or other financial instruments. This report is not directed to, or intended for display, downloading, printing, reproducing or for distribution to or use by, any person or entity who is a citizen or resident or located in any locality, state, country or other jurisdiction where such distribution, publication, reproduction, availability or use would be contrary to law or regulation or what would subject HDFC Securities Ltd or its affiliates to any registration or licensing requirement within such jurisdiction. If this report is inadvertently send or has reached any individual in such country, especially, USA, the same may be ignored and brought to the attention of the sender. This document may not be reproduced, distributed or published for any purposes without prior written approval of HDFC Securities Ltd . Foreign currencies denominated securities, wherever mentioned, are subject to exchange rate fluctuations, which could have an adverse effect on their value or price, or the income derived from them. In addition, investors in securities such as ADRs, the values of which are influenced by foreign currencies effectively assume currency risk. It should not be considered to be taken as an offer to sell or a solicitation to buy any security. HDFC Securities Ltd may from time to time solicit from, or perform broking, or other services for, any company mentioned in this mail and/or its attachments. HDFC Securities and its affiliated company(ies), their directors and employees may; (a) from time to time, have a long or short position in, and buy or sell the securities of the company(ies) mentioned herein or (b) be engaged in any other transaction involving such securities and earn brokerage or other compensation or act as a market maker in the financial instruments of the company(ies) discussed herein or act as an advisor or lender/borrower to such company(ies) or may have any other potential conflict of interests with respect to any recommendation and other related information and opinions. HDFC Securities Ltd, its directors, analysts or employees do not take any responsibility, financial or otherwise, of the losses or the damages sustained due to the investments made or any action taken on basis of this report, including but not restricted to, fluctuation in the prices of shares and bonds, changes in the currency rates, diminution in the NAVs, reduction in the dividend or income, etc. HDFC Securities Ltd and other group companies, its directors, associates, employees may have various positions in any of the stocks, securities and financial instruments dealt in the report, or may make sell or purchase or other deals in these securities from time to time or may deal in other securities of the companies / organisations described in this report.
HDFC securities Institutional Equities Unit No. 1602, 16th Floor, Tower A, Peninsula Business Park,Senapati Bapat Marg, Lower Parel, Mumbai - 400 013 Board : +91-22-6171 7330 www.hdfcsec.com
Rating Definitions BUY : Where the stock is expected to deliver more than 10% returns over the next 12 month period NEUTRAL : Where the stock is expected to deliver (-)10% to 10% returns over the next 12 month period SELL : Where the stock is expected to deliver less than (-) 10% returns over the next 12 month period
Page | 33