Embed Size (px)
Citation preview

Cement and Concrete Institute Concrete Industry Greenhouse Gas Emissions
Submitted to: Gary Theodosiou
Submitted by:
232 Weltevreden Road Northcliff 2195 Tel: 011 431 1052 Fax: 086 511 9150 [email protected]
30 July 2010

i
Executive Summary
The Cement and Concrete Institute assigned InEnergy to develop a South African model for the determination of carbon dioxide equivalent (CO2e) emissions related to the production of a cubic meter of concrete as per a user defined mix design.
This project considers the activities and components associated with concrete production. The activities that were identified include the transport and mixing of concrete and its components. The components that were identified include admixtures, aggregates, cement, fly ash, GGBS, water and steel reinforcing. When determining the carbon emissions of any process a set of applicable rules need to be used. The set of rules and principles that was used to define the emissions in this study is the internationally recognised GHG protocol (Greenhouse Gas Protocol). This protocol is also used by the WBCSD (World Business Council for Sustainable Development) in the approved cement emission model. The protocol defines three categories of emission sources namely Scope 1 (direct), Scope 2 (indirect) and Scope 3 (other indirect). For this project emission sources were identified for concrete production strictly following the accepted GHG protocol rules of relevance, completeness, consistency, transparency and accuracy. Once the emission sources had been identified a questionnaire was compiled that requested the specific activity data from a sample of a number of sites/companies involved in supplying services and components used for concrete production. InEnergy analysed the data gathered from the 130 questionnaires and the results obtained were used as inputs for the concrete emission model. The WBCSD emission model that is used worldwide within the cement industry was used as a basis model for the concrete emissions determination and was refined further to allow it to be more specifically applicable to concrete. The refined concrete model that was developed allows the user to determine the total resulting GHG emissions for a specific cubic meter of concrete. The model allows the user to select the type of cement used as well as the end application, such as roof tiles, bricks, precast concrete slabs or in-situ concrete.
It was found that an average 30 MPa cubic meter of in-situ concrete containing a CEM I 42.5 with varying degrees of extension and admixture related to an emissions range of between 195 and 483 kg of CO2e/m3 (Scope 1, 2 and 3 emissions), with an unextended mix relating to 298 kg CO2e/m3. It is internationally accepted as a minimum requirement to report on Scope 1 (direct) emission sources. Thus, when comparing these emissions to international studies, Scope 1 (direct) emission statistics are the most readily available. Taking this into consideration, Scope 1 (direct) emissions from the production of an average South African concrete mix using CEM I with an admixture related to an emission of 234kg CO2/m3
compared to Australia with a range of 251 to 273 kg CO2/m3 (Flower and Sanjayan, 2007) and the UK with 266 kg CO2/m3 (Concrete Centre, 2008). A South African extended cement (70/30 fly ash blend) can have a Scope 1 footprint as low as 169 kg CO2/m3 The breakdown of emissions from the production of an average South African mix can be noted in the figure that follows.

ii
CO2 emissions breakdown resulting from a CEM I with admixture
74%
18%
8%
1 Direct
2 Indirect
3 Other Indirect
Figure 1 CO2 emissions types associated with the production of an average concrete mix

iii
Contents
1. Contributing companies ...................................................................................... 1 2. Introduction ........................................................................................................ 2 3. Importance of this project ................................................................................... 3 4. Carbon emissions – the determination process .................................................. 4
4.1. Choice of an accepted reporting standard ................................................... 4 4.2. Definition of boundary & emission types ...................................................... 4
4.2.1. System boundary ................................................................................. 5 4.2.2. Ownership boundary ............................................................................ 5 4.2.3. Emission types ..................................................................................... 6
4.3. Definition of reporting window ..................................................................... 6 4.4. Quantification of GHG emissions and removals .......................................... 7
4.4.1. Identification of GHG sources and sinks ............................................... 7 4.4.2. Quantification methodologies ............................................................... 7 4.4.3. GHG activity data selection and collection ........................................... 8 4.4.4. GHG emission factors .......................................................................... 8 4.4.5. Materiality ............................................................................................ 8 4.4.6. Accuracy .............................................................................................. 9
4.5. Emissions intensity ...................................................................................... 9 5. Components of a concrete mix and related emissions...................................... 10
5.1. Admixtures ................................................................................................ 10 5.2. Water ........................................................................................................ 10 5.3. Cement ..................................................................................................... 10
5.3.1. Scope 1 - Calcination/pyro-processing ............................................... 13 5.3.2. Scope 1 - Fuel burning in pyro-processing ......................................... 13 5.3.3. Scope 1- On site fuels ........................................................................ 13 5.3.4. Scope 1- Explosives ........................................................................... 14 5.3.5. Scope 2- Electricity ............................................................................ 14 5.3.6. Scope 3 - Transport ........................................................................... 14 5.3.7. Scope 3 – Carbonation ...................................................................... 15
5.4. Fly ash ...................................................................................................... 15 5.4.1. Scope 1 – On site vehicles ................................................................. 16 5.4.2. Scope 2 – Electricity ........................................................................... 16
5.5. Ground Granulated Blast furnace Slag (GGBS) ........................................ 16 5.5.1. Scope 1 – Drying ............................................................................... 16 5.5.2. Scope 1 – On site vehicles ................................................................. 16 5.5.3. Scope 2 – Electricity ........................................................................... 17
5.6. Aggregates................................................................................................ 17 5.6.1. Scope 1- Explosives ........................................................................... 18 5.6.2. Scope 1 – On site vehicles ................................................................. 18 5.6.3. Scope 2 – Electricity ........................................................................... 18
5.7. Steel reinforcing ........................................................................................ 18 5.8. In situ concrete and precast products ........................................................ 18
5.8.1. Scope 1 – On site vehicles ................................................................. 19 5.8.2. Scope 1 – Curing fuels ....................................................................... 19 5.8.3. Scope 2 – Electricity ........................................................................... 19 5.8.4. Scope 3 – Transport ........................................................................... 19
6. Emission calculations by spreadsheet models ................................................. 20 6.1. GHG Rules for spreadsheet development ................................................. 20 6.2. Component spreadsheets ......................................................................... 21

iv
6.3. Component spreadsheet extract example ................................................. 22 7. Results ............................................................................................................. 23
7.1. Limitations of results ................................................................................. 23 7.2. Component Emission Results ................................................................... 24
7.2.1. Admixtures ......................................................................................... 25 7.2.2. Aggregates ........................................................................................ 25 7.2.3. Fly Ash ............................................................................................... 25 7.2.4. GGBS ................................................................................................ 26 7.2.5. Water ................................................................................................. 27 7.2.6. Reinforcing ......................................................................................... 27 7.2.7. In situ concrete and precast products ................................................. 28 7.2.8. Cement .............................................................................................. 29
7.3. Combined Emission Results ..................................................................... 30 8. Baseline emissions comparison ....................................................................... 31 9. Concrete mix design comparisons.................................................................... 34
9.1. Specifics about the mixes .......................................................................... 34 10. Future scope expansion ............................................................................... 38 11. Conclusion .................................................................................................... 39 12. References ................................................................................................... 40 13. Appendix A Common cements: SANS 50197-1 ............................................ 43 14. Appendix B Aggregate questionnaire ............................................................ 44 15. Appendix C Admixture questionnaire ............................................................ 45 16. Appendix D Fly ash questionnaire ................................................................ 46 17. Appendix E GGBS questionnaire .................................................................. 47 18. Appendix F Pre-cast questionnaire ............................................................... 48 19. Appendix G Readymix questionnaire ............................................................ 49 20. Appendix H Final model ................................................................................ 50 21. Appendix I Concrete mix designs .................................................................. 51 22. Appendix J: Discussion around transport emissions ..................................... 53

1
1. Contributing companies

2
2. Introduction This project was initiated by the desire of the Cement and Concrete Institute to disclose the CO2e emissions resulting from the production of a cubic meter of a concrete mix, and to be able to differentiate between the emissions of different mixes so as to identify the best combinations of components for a low emission concrete mix. This is in line with the sustainability marketing drive of the Cement and Concrete Institute promoting the use of concrete in the construction industry. Strictly following the Greenhouse Gas Protocol developed by the World Resources Institute and the World Business Council for Sustainable Development, InEnergy used the WBCSD’s GHG cement model and expanded on it to include Scope 2 (indirect) and Scope 3 (other indirect) emissions for the other components of concrete. The results were then used to determine the associated emissions per cubic meter of concrete as poured into its final position on site. The scope of this project covered the components of concrete and included the following materials and processes:
admixtures;
aggregates;
GGBS;
cement;
fly ash;
steel reinforcing;
water;
in-situ concrete; and
precast process
transport.

3
3. Importance of this project It has been estimated that on a global scale, the cement industry contributes between five and eight percent of all CO2e (carbon dioxide equivalent) emissions (CIF, 2003; Flower and Sanjayan, 2007; Ulm, 2007). The growth of the concrete industry is being fuelled by key world economies resulting in an increased demand for construction materials in particular concrete. It is widely accepted that concrete is the most extensively used construction material. The current average consumption of concrete is about one ton per year for every living human being (Lippiatt and Ahmad, 2004; Flower and Sanjayan, 2007). Concrete is the second most consumed material apart from water (Flower and Sanjayan, 2007). The size of the concrete industry has a significant impact on the global emissions of anthropogenic Greenhouse Gases (GHG’s). There are however, very few published studies that have examined emissions attributed to concrete and thus, no accurate world average emissions value per cubic meter could be obtained. Climate change is of ever increasing importance and it is due to this fact that the CO2 emissions resulting from the concrete industry within South Africa should be quantified. Since the beginning of the industrial revolution in 1760, there has been an increased use of fossil fuel energy resulting in amplified emissions of greenhouse gasses, which are responsible for global warming (Slanina, 2004). The most significant of these emissions is Carbon Dioxide (CO2) due to the sheer quantities that are being emitted, even though it does not have the highest greenhouse effect. According to the Carbon Trust (2008), there are two main reasons why a company or organisation may decide to report their specific CO2e emissions. Firstly, to manage their emissions as well as reduce emissions over time and secondly, to report their emissions accurately to a third party for public disclosure. Apart from these two reasons when a company measures the carbon emissions related to its product it can use this information to market itself as a ‘green’ company.

4
4. Carbon emissions – the determination process The aim of this project was to determine the GHG emissions associated with a cubic meter of concrete in South Africa. This chapter explains the emissions determination process that was followed and the rules and protocols that were used in ensuring an accurate output.
4.1. Choice of an accepted reporting standard The first step in the process of determining the emissions footprint of concrete was to confirm the most applicable reporting standard. This chosen standard then dictated the further steps of the process. Two main CO2e calculating protocols are currently in use worldwide. In its Clean Development Mechanism (CDM) information pack the Chamber of Mines (CoM) makes reference to the fact that a number of mining houses are making use of the “Greenhouse Gas Protocol” as developed by the World Resources Institute (WRI) and the World Business Council for Sustainable Development (WBCSD). This is especially popular for reporting initiatives adhering to “Carbon Disclosure Project” (CDP) principles. The Global Reporting Initiative (GRI) also recommends the use of the GHG protocol. Otherwise, SANS 14064-1:2006 is also an available standard, but it is not as comprehensive as the GHG protocol at this stage, nor internationally acceptable. Seeing that the “Greenhouse Gas Protocol” has already been adopted for the cement sector worldwide, this project continues the use of this protocol. A further advantage of using this protocol is that the WBCSD has already prepared a spreadsheet model specifically for determining cement emissions, one of the key components of concrete. Another reporting protocol gaining popularity in the United Kingdom is in fact the PAS 2050; an approach that follows the “lifecycle” emission calculation approach.. In other words the total CO2 emissions associated with a product (i.e. concrete in our case), from the raw materials acquisition to the disposal of the final waste product, are calculated. PAS 2050 is a far more complicated system than the GHG protocol which only considers a specific part of the life cycle of the product. As a future phase of this project it is recommended that Cement and Concrete Institute considers this life cycle CO2 emissions determination approach.
4.2. Definition of boundary & emission types Having accepted the WBCSD GHG Protocol as the reporting standard for this project, the next step in the process was to define the GHG emission boundary and those related emissions that can be attributed to concrete.

5
4.2.1. System boundary Since concrete is a product composing of a number of components with each component contributing to the overall emissions related to concrete production, the services and materials included in the production process of concrete have been identified and depicted below. This figure visualises the defined physical/system boundary.
Figure 2 Concrete CO2 emissions system diagram (Adapted from: Flower and Sanjayan, 2007, p238).
Within this given boundary the component emissions needed to be determined. These individual components and their related emissions are further discussed in chapter 5.
4.2.2. Ownership boundary Having defined the system boundary, emissions generated within that boundary needed to be identified and their “ownership” determined. For example, emissions generated in the generation of slag do not belong to the slag miller milling the slag for use as an extender in cement. The emission belongs to the generator of the product, in this case the iron and steel industry. The CO2 generated through the subsequent transport and the slag milling process does, however, qualify for inclusion in the C&CI model. The WBCSD GHG protocol allows three “ownership” types to be used for reporting:
Financial control This includes the company/operation and any of its group subsidiaries that are financially consolidated into the financial reporting of the company/operation.
Operational control This includes the company/operation and any of its subsidiaries of which it controls the operating policies.

6
Equity share This includes the company/operation and any other company/operation in which it would have a majority shareholding.
Consistent with the WBCSD GHG protocol boundary criteria for cement, this C&CI CO2e project includes “operational control” criteria in its modelling for concrete.
4.2.3. Emission types A third factor that needed to be defined for the GHG boundary is the types of GHG emissions categories to be included. These categories are defined as follows:
Scope 1 (direct) GHG emissions Direct GHG emissions are from sources that are owned or controlled by the reporting entity.
Scope 2 (indirect) GHG emissions
Indirect GHG emissions are emissions that are a consequence of the activities of the reporting entity, but occur at sources owned or controlled by another entity. They include GHG emissions resulting from the consumption of purchased electricity, heat and steam.
Scope 3 (other indirect) GHG emissions
The definition of other indirect GHG emissions may depend on internal reporting requirements, preset reporting standards and CDP requirements. Organisational activities resulting in other indirect emissions include: staff commuting, final production
transportation by a third party and outsourced activities. Consistent with the WBCSD GHG protocol boundary criteria for cement, this C&CI CO2e project includes Scope 1 emissions within the given boundary. In addition to this ,Scope 2 have also been determined. For Scope 3 only transport related emissions were deemed significant enough to be determined. The emission sources and the types of related emissions are discussed in chapter 5.
4.3. Definition of reporting window The C&CI CO2e emission study is the first of its kind in the industry. Accordingly no industry precedent has been set to determine the chronological reporting window i.e. the timeframe for the data collection and input used for the emissions determination. Normal practice for baseline determination or for the quantification of carbon emissions is to consider performance over the last two years. In many cases the GHG emissions can be determined inferentially from production and related information. At the time of initiation of the C&CI CO2e emission project companies participating in the project were able to supply the most complete information for the 2007 production year. As a result InEnergy has utilised this data in the compilation of the initial C&CI CO2e emission

7
report i.e. a single year’s data as compared to the normal practice of two years data mentioned above. For completeness of this project and for industry target setting into the future it is in the interests of the industry to extend the initial reporting window to at least include, now available 2008 input data, and to repeat the exercise on a regular basis into the future.
4.4. Quantification of GHG emissions and removals The next step in the process was to quantify the GHG emissions within the defined GHG boundary and time window. This was done for each component of concrete production where the suppliers of these components had not already determined their emissions per the WBCSD GHG protocol.
4.4.1. Identification of GHG sources and sinks All GHG sources and removals were identified and documented. The GHG’s that were considered are listed in Table 1.
Major Greenhouse Gases
Source % of Total
greenhouse effect
Relative 100 year global warming potential (GWP)
Carbon Dioxide (CO2): Mostly from the combustion of fossil fuels (electricity generation, industry, transport)
70% 1
Methane (CH4) Emitted during waste management and agriculture
20% 23
Nitrous Oxide (N2O) From burning fossil fuels, industrial processes and fertiliser production in particular
6% 296
Hydroflourocarbons (HFC):
These gases do not occur naturally, but are manufactured as a replacement for the older refrigerants – CFCs and HCFCs – which themselves have a negative effect on the ozone layer.
10-12 000
Perfluorocarbons (CF4) The major source of this gas is aluminium production, and also fire extinguishing systems.
> 5 000
Sulphur hexafluoride (SF6)
The major sources of sulphur hexafluoride release include leakage from electrical switchgear, from magnesium smelting processes and use in semiconductor manufacture.
22 200
Table 1 Major Greenhouse Gasses (Third Assessment Report, IPCC, 2001).
4.4.2. Quantification methodologies Depending on the sources of emissions, quantification can be performed by inferential calculation models, by measurement, or by both. The scope of this proposal considers the recommendation of inferential methodologies seeing as this is the most common and most practical method used.

8
The Intergovernmental Panel on Climate Change (IPCC) has developed a large number of carbon equivalent emission factors that make it easier to calculate organisation emissions by inferential techniques. This is especially useful in cases when emissions include not only carbon dioxide but also methane and nitrous oxide for example, which are not normally measured continuously at point of source. If, on the other hand, emissions would include some of the other GHG’s (hydroflourocarbons, perfluorocarbons and sulphur hexafluoride) then inferential calculations would have to suffice for historical determinations. This study has assumed that these other GHG’s are not significant enough for inclusion, but reliable measurements for future reporting would have to be instituted by the companies/operations concerned if these GHG emissions became notable.
4.4.3. GHG activity data selection and collection Activity data are a quantitative measure of on-site activities that result in the generation of GHG emissions, for example a set of activity data would be the mass of coal used to fire a boiler on the production site or the litres of diesel used to power a loader. Activity data were selected for the components of concrete and collected by means of questionnaires as given in Appendix B to G.
4.4.4. GHG emission factors The calculation process of defining GHG emissions from activity data requires emission factors. The most common sources for emission factors are the IPCC and the WBCSD GHG tool. Typical emission factors include the following examples in the table below, taken from the IPCC and other references. They are expressed as the kilograms of CO2e emitted for each gigajoule (GJ) of energy produced, or in other similar formats.
Category IPCC default
kg CO2/GJ Sources Other
than IPCC
Fossil fuels
coal + anthracite + waste coal 96.0
diesel oil 74.1
gasoline (petrol) 69.3
LPG 63.1
Explosives
Explosives Mix (Sasol explo-gel) 200 kg/t
Transport Specific
Diesel trucks (Shell & BP factor) 1.1 kg/km
Electricity
Eskom Factor (CDP, 2006) 1021 kg/MWh
Table 2 Typical emission factors
4.4.5. Materiality In instances some activity based GHG emissions have been excluded from the reporting worksheet due to their relatively small impact on total emissions.

9
4.4.6. Accuracy The accuracy and uncertainty of the emissions data have been cross-checked. Due to the limited scope of this, the first South African concrete emission factor project, it was not possible for InEnergy to conduct sufficient individual site data audits to verify the accuracy of the submitted data. Future reporting should include this audit process to improve the credibility of the findings.
4.5. Emissions intensity Emission intensity relates a defined unit of emission to a defined unit associated to the production process, for example kg CO2e per cubic metre of concrete or per employee or other unit relevant to a desired study outcome. In the case of the concrete industry, the recommended intensity format is kg CO2e emitted per cubic meter of concrete produced. This unit has been utilised to define emission intensity in this study.

10
5. Components of a concrete mix and related emissions Most of the emissions resulting from the production of concrete were expected to be due to energy consumption ( e.g. electricity, coal, diesel). Thus, to determine the CO2 emissions related to each activity it was necessary to primarily quantify the energy consumption of each activity. The only exception to this rule is the cement sector, were it is estimated that 50 percent of the emissions result due to the decomposition of limestone in the kiln, with the remaining 50 percent of emissions resulting from the use of electricity and fuel (Humphreys and Mahasenan, 2002; CIF, 2003). This chapter discusses the various components of a concrete mix and their related emissions.
5.1. Admixtures Admixtures are chemical additives to a concrete mix to enhance or subdue certain properties. These properties may be workability, cement extension or strength. Due to their production process the specific CO2 emission factors of admixtures are high but very small quantities are required in a mix. A typical concrete mix will not have more than two litres of admixtures per cubic meter. Even though the CO2 emission contribution from admixtures is small, it has been included in the calculations.
5.2. Water Water is an essential component of a concrete mix. Water has few associated emissions but the water content determines the amount of cement that is required. Thus the water content is of great significance as it indirectly influences the overall emissions related to a concrete mix. If the water requirements of a mix are too high, however, admixtures can for example be added to “amend” mix properties.
5.3. Cement Cement has received the most attention out of all of the components that contribute to concrete and has been comprehensively scrutinised (Humphreys and Mahasenan, 2002; CIF, 2003; Van der Merwe, 2003). This is due to the fact that it has a relatively high specific emission and is produced in large quantities. In 2007, South Africa produced a little over 15 million tonnes of cement (Cement and Concrete Institute, 2007). The process of cement production releases large quantities of CO2 from the kiln when limestone is decomposed in the preheating and kiln system. According to Flower and Sanjayan (2007) this process releases approximately half a ton of CO2 for every ton of CaO produced. The electricity consumption of the kiln also adds to Scope 2 (indirect) emissions. During the literature study it was noted that extensive research into emissions from cement has been done. There are many authors who have attempted to quantify global as well as localised cement emissions factors. When analysing referenced emissions, it is important to note the reported emission scopes (i.e. Scope 1, 2 or 3) to
11
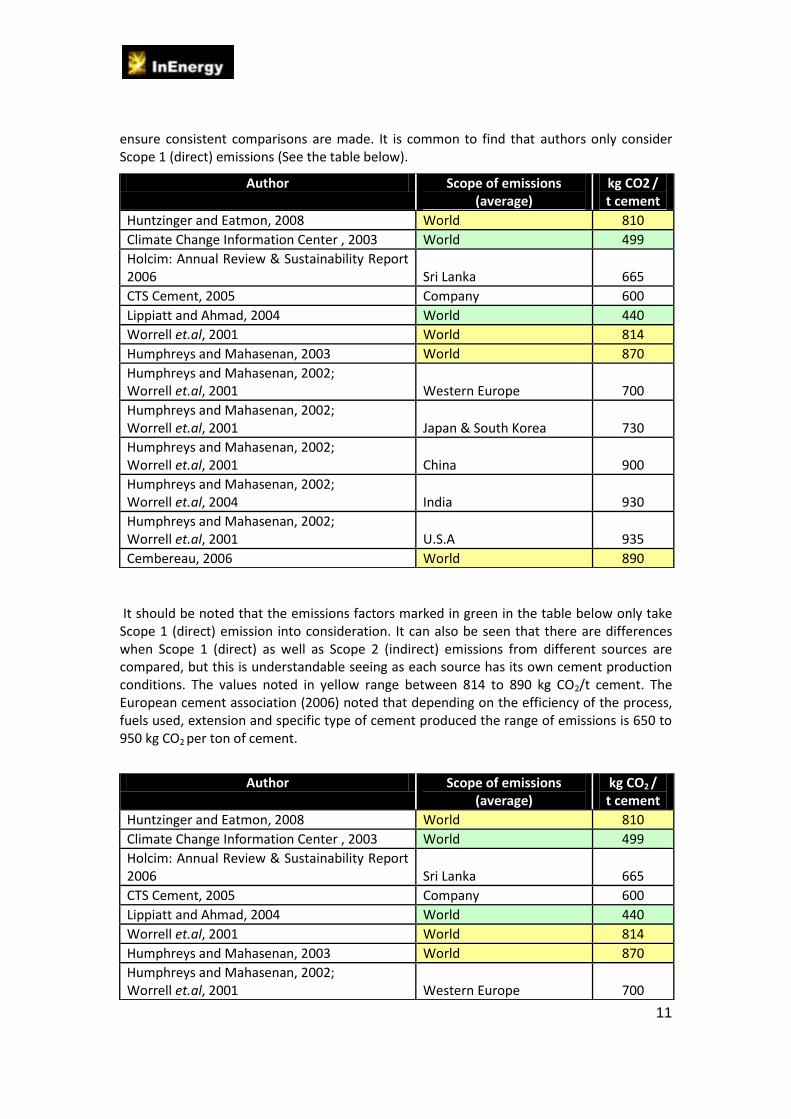
ensure consistent comparisons are made. It is common to find that authors only consider Scope 1 (direct) emissions (See the table below).
It should be noted that the emissions factors marked in green in the table below only take Scope 1 (direct) emission into consideration. It can also be seen that there are differences when Scope 1 (direct) as well as Scope 2 (indirect) emissions from different sources are compared, but this is understandable seeing as each source has its own cement production conditions. The values noted in yellow range between 814 to 890 kg CO2/t cement. The European cement association (2006) noted that depending on the efficiency of the process, fuels used, extension and specific type of cement produced the range of emissions is 650 to 950 kg CO2 per ton of cement.
Author Scope of emissions (average)
kg CO2 / t cement
Huntzinger and Eatmon, 2008 World 810
Climate Change Information Center , 2003 World 499
Holcim: Annual Review & Sustainability Report 2006 Sri Lanka 665
CTS Cement, 2005 Company 600
Lippiatt and Ahmad, 2004 World 440
Worrell et.al, 2001 World 814
Humphreys and Mahasenan, 2003 World 870
Humphreys and Mahasenan, 2002; Worrell et.al, 2001 Western Europe 700
Humphreys and Mahasenan, 2002; Worrell et.al, 2001 Japan & South Korea 730
Humphreys and Mahasenan, 2002; Worrell et.al, 2001 China 900
Humphreys and Mahasenan, 2002; Worrell et.al, 2004 India 930
Humphreys and Mahasenan, 2002; Worrell et.al, 2001 U.S.A 935
Cembereau, 2006 World 890
Author Scope of emissions (average)
kg CO2 / t cement
Huntzinger and Eatmon, 2008 World 810
Climate Change Information Center , 2003 World 499
Holcim: Annual Review & Sustainability Report 2006 Sri Lanka 665
CTS Cement, 2005 Company 600
Lippiatt and Ahmad, 2004 World 440
Worrell et.al, 2001 World 814
Humphreys and Mahasenan, 2003 World 870
Humphreys and Mahasenan, 2002; Worrell et.al, 2001 Western Europe 700

12
Table 3 Exampes Reported GHG emissions resulting from cement manufacture.
Noted in
is an overview of published average CO2 emissions per ton of cement. In South Africa the Association of Cementitious Materials Producers released the following graph showing the steady reduction of relative CO2 emissions over the years. The published local average of approximately 670 kg CO2 per ton of cement only takes Scope 1 (direct) emissions into consideration.
Humphreys and Mahasenan, 2002; Worrell et.al, 2001 Japan & South Korea 730
Humphreys and Mahasenan, 2002; Worrell et.al, 2001 China 900
Humphreys and Mahasenan, 2002; Worrell et.al, 2004 India 930
Humphreys and Mahasenan, 2002; Worrell et.al, 2001 U.S.A 935
Cembereau, 2006 World 890
Author Scope of emissions (average)
kg CO2 / t cement
Huntzinger and Eatmon, 2008 World 810
Climate Change Information Center , 2003 World 499
Holcim: Annual Review & Sustainability Report 2006 Sri Lanka 665
CTS Cement, 2005 Company 600
Lippiatt and Ahmad, 2004 World 440
Worrell et.al, 2001 World 814
Humphreys and Mahasenan, 2003 World 870
Humphreys and Mahasenan, 2002; Worrell et.al, 2001 Western Europe 700
Humphreys and Mahasenan, 2002; Worrell et.al, 2001 Japan & South Korea 730
Humphreys and Mahasenan, 2002; Worrell et.al, 2001 China 900
Humphreys and Mahasenan, 2002; Worrell et.al, 2004 India 930
Humphreys and Mahasenan, 2002; Worrell et.al, 2001 U.S.A 935
Cembereau, 2006 World 890

13
Emissions resulting from cement that have been calculated using the WBCSD cement tool based on the GHG Protocol are the most reliable. This tool is used as a basis for all of InEnergy’s models. The main emission sources related to cement production, identified by the GHG Protocol (2004) are:
5.3.1. Scope 1 - Calcination/pyro-processing The decomposition of limestone is generally the largest source of GHG emissions at a cement plant. Calcination can be expressed by the equation:
CaCO3 + heat CaO + CO2
5.3.2. Scope 1 - Fuel burning in pyro-processing Pyro-processing requires flame temperatures above 2000°C in the kiln. The kilns are primarily fired by coal and emissions can be expressed by the equation: C + O2 CO2
Depending on the raw materials and the actual production process, a cement plant can under normal circumstances consume fuel at a rate between 3,200 and 5,500 mega joules per ton (MJ/t) of clinker (OECD/IEA, 2000).
5.3.3. Scope 1- On site fuels This generally comes from on site transport in the form of quarry haul trucks, front end loaders and personnel transport.
Further, fuels are also sometimes used to dry coal and other raw materials, depending on plant design.
Figure 3 ACMP cement CO2 Scope 1 emissions.

14
5.3.4. Scope 1- Explosives An explosive is a chemical material that, under the influence of thermal or mechanical shock, decomposes extremely rapidly and spontaneously with the evolution of large amounts of heat and gas. Since an adequate supply of oxygen cannot be drawn from the air, a source of oxygen must be incorporated into the explosive mixture. Some explosives, such as trinitrotoluene (TNT), are single chemical species, but most explosives are mixtures of several ingredients. As in other combustion reactions, a deficiency of oxygen favours the formation of carbon monoxide and unburned organic compounds and produces little, if any, nitrogen oxides. An excess of oxygen causes more nitrogen oxides and less carbon monoxide and other unburned organics. For ammonium nitrate and fuel oil (ANFO) mixtures, a fuel oil content of more than 5.5 percent creates a deficiency of oxygen.
The emissions from explosives detonation are influenced by many factors such as explosive composition, product expansion, method of priming, length of charge, and confinement. These factors are difficult to measure and control in the field and are almost impossible to duplicate in a laboratory test facility. With the exception of a few studies in underground mines, most studies have been performed in laboratory test chambers that differ substantially from the actual environment. Any estimates of emissions from explosives use must be regarded as approximations .
Explosives are used for the blasting of limestone reserves. The cement protocol deems these emissions as immaterial, relative to the other emission sources. It should be noted that emissions from explosives have been included in this study for transparency.
5.3.5. Scope 2- Electricity Electricity consumption is generally split and reported for various production departments of a cement plant with the raw milling, kiln and finish milling departments consuming the most electricity. Cement plants are large energy intensive industrial sites. In South Africa, Eskom is the primary provider of electricity and relies on coal combustion to produce electricity. Hence there is a high CO2e emission factor associated with electricity consumption locally.
5.3.6. Scope 3 - Transport This generally comes from off-site transport of raw or intermediate products by road and rail trucks from an initial processing plant to a final processing plant. Transport does not normally have a significant impact on the total CO2 emissions of cement production. The question stands as to who is responsible for these emissions. Based on the chosen boundary standard, the cement plant is the cause of these emissions seeing that without the cement activity, the emissions would not have taken place. Transport emissions at times also occur during delivery of raw materials to the plant as well as during delivery of processed products to the customer. It is logical to examine the Green House Gas Protocol (GHG Protocol) as well as other associated documentation to determine industry standards.
The WRI and the WBCSD do not allow complete exclusion of off-site transports, while the Cement Protocol itself does. What the Cement Protocol does state, however, is that if a cement producer is reporting according to WRI and WBCSD principles then it must report off-site emissions from owned and controlled fleets.
15
The emissions of CO2 due to the delivery of raw materials to the plant and between plants can be included as a Scope 3 (other indirect) emission. Care needs to be taken due to the fact that if not differentiated from other scope emissions the results may not lend themselves well to comparisons across companies (GHG Protocol, 2004).
5.3.7. Scope 3 – Carbonation A phenomenon called carbonation is responsible for the absorption of small amounts of CO2 post concrete production. The effects of carbonation are still being researched. However, the basic process is that the ‘free lime’ in the concrete reacts with CO2 in the atmosphere to produce CaCO3. This process can be represented by the equation:
Ca (OH)2 + CO2 CaCO3 + H2O. Carbonation results in only small quantities of CO2 re-absorption. This is due to the fact that only the surface of a concrete structure (approximately 2 cm after 50 years) can react (Flower and Sanjayan, 2007). Thus, the re-absorption during the concrete’s life time is very small and will not be considered in the calculation in this study. Extensive research, discussions and estimates on the effects of carbonation on concrete can be found in Pade and Guimaraes (2006).
5.4. Fly ash Fly ash is used as extenders in cement and concrete mixes. Fly ash is by definition a pozzolan (Asphalt technology, 2001). Pozzolans are pure siliceous or siliceous aluminous substances which in themselves have little or no cementitious properties. Only when of a sufficient fineness (attained by mechanical or air separation) will they react at ambient temperatures with calcium hydroxide (Portlandite Ca (OH2)) dissolved in water. The source of calcium hydroxide can be from Portland cement clinker or lime. Once this reaction has occurred pozzolans are able to form high strength bonds developing calcium aluminate and calcium silicate compounds. Fly ash is a by-product from the combustion of coal. Fly ash can decrease the water demand as well as increase the workability of concrete (Ash Resources, 2007). The properties of fly ash are primarily impacted by the quality and grade of the coal being fired with the primary composition including silicon dioxide (SiO2) and aluminium trioxide (Al2O3) (NRCNA, 2006; USEPA, 2007; Khandekar et. al, 1999). Fly ash has low associated GHG emissions due to the fact that it is a by-product (USEPA, 2007). Eskom is the main source of fly ash in South Africa and due to the fact that it is a by-product, any fly ash that is not used by the cement industry is generally land filled (Sheath, 2010). Thus, the use of fly ash in cement has inherent environmental benefits, including the requirement of less land fill space and a decreased consumption of clinker (USEPA, 2007). The main emissions related to fly ash preparation are given as follows:

16
5.4.1. Scope 1 – On site vehicles Scope 1 (direct) emissions result from fuel used by onsite vehicles.
5.4.2. Scope 2 – Electricity Generally the fly ash by product from Eskom needs to be classified to provide a quality controlled material for use in cement. This classification process involves the use of electricity to operate. It is very important to note that fly ash is a by-product and that the GHG emissions related to its original production have already been accounted for by the source factory i.e. the power station. The original GHG emissions are NOT attributable to the use of fly ash as an extender. The production of electricity in a coal fired power station emits GHG’s irrespective of whether the by-product fly ash is used to extend cement or not.
5.5. Ground Granulated Blast furnace Slag (GGBS) GGBS is also used as an extender in cement and concrete mixes. A key characteristic of GGBS is that is not a pozzolan and possesses self cementing properties. GGBS can enhance the strength of a cement due to the fact that it has a high proportion of calcium silicate hydrates (Slagment, 2010). GGBS is a by-product of the steel and iron industry. It is also referred to as GGBS cement, GGBS or GGBFS (ground granulated blast furnace GGBS). The granular by-product is dried and ground down to a fine powder. GGBS is often used as a cement extender to increase durability, strength and workability. Research has noted that GGBS has the capability to double the lifespan of buildings (Slagment, 2010). GGBS is a direct replacement for ordinary Portland cement by weight and typically 40 to 50 percent replacement is used. There are also certain architectural and engineering benefits from adding GGBS to cement. GGBS can improve the visual characteristics of the concrete by altering the colour of concrete to a near-white colour. This can be achieved by using 50 to 70 percent replacement levels, up to a maximum of 85 percent replacement. The high GGBS content also produces a smoother more defect free surface (Slagment, 2010). GGBS also has the ability to provide protection from both chloride and sulphate attack as well as reduce the thermal gradient generated when pouring concrete. This in turn reduces the likelihood of micro cracking that would reduce a structure’s strength (US FHA, 2008). The main emissions related to GGBS preparation are given as follows:
5.5.1. Scope 1 – Drying Slag is generally water quenched at the steel works and needs to be dried before being processed further. This drying process is normally done by hot gas generators that run on coal, hence the Scope 1 emissions.
5.5.2. Scope 1 – On site vehicles Scope 1 (direct) emissions also result from fuel used by onsite vehicles.

17
5.5.3. Scope 2 – Electricity Slag brought in from the steel works needs to be milled for use in cement, an energy intensive process in itself. Just like for fly ash it is very important to note that GGBS is a by-product and that the GHG emissions related to its original production have already been accounted for by the source factory i.e. the steel works. The original GHG emissions are NOT attributable to the use of GGBS an extender. This is what makes fly ash and GGBS such an environmentally beneficial component of cement and concrete.
5.6. Aggregates The production of aggregate does not have a large amount of CO2 emissions related to it. There are however, other environmental impacts not related to GHG emissions which should be managed efficiently (Schuurmans et.al, 2005). Aggregate is a coarse material which is a component in a concrete mix. Aggregate is a broad term which includes gravel, sand, crushed stone and recycled concrete. Aggregate is used to add filler to a concrete mix, but it is more important than simply bulking up the mix. According to the CCI (Concrete Countertop Institute) (2006), aggregate occupies most of the volume of the concrete and it is the material that the cement paste coats and binds together. The composition, shape, and size of the aggregate all have significant impact on the workability, durability, strength, weight, and shrinkage of the concrete. Aggregates are mined in quarries where high quality bedrock exists such as limestone, marble or granite. The blasted rock is then crushed into a usable product. Recycled and secondary aggregates are making an increasingly important contribution to sustainable construction by reducing demand for primary aggregates in some countries around the world, but are not extensively used in South Africa due to costs involved when compared to ‘fresh’ aggregate. There are obvious inherent environmental benefits to using recycled aggregate. These include less land fill requirements and decreased mining of natural resources. Recycling of concrete involves breaking, removing, and crushing existing concrete into a material with a specified size and quality. The quality of concrete with recycled aggregate is very dependent on the quality of the recycled material used. Reinforcing steel and other embedded items must be removed, and care must be taken to prevent contamination by other construction materials such as asphalt, soil and glass. The crushing characteristics of hardened concrete are similar to those of natural rock and are not significantly affected by the grade or quality of the original concrete. Recycled concrete aggregates produced from all but the poorest quality original concrete can be expected to pass the same tests required of conventional aggregates. Due to the large quantities of aggregate produced per unit of energy input, the emission factor associated with a tonne of product is relatively low. The main emissions related to aggregate production are given as follows:

18
5.6.1. Scope 1- Explosives Explosives are used for the blasting of geological reserves.
5.6.2. Scope 1 – On site vehicles Scope 1 (direct) emissions result from fuel used by onsite vehicles; mainly for loading and hauling.
5.6.3. Scope 2 – Electricity The crushing operations at a quarry rely on electricity.
5.7. Steel reinforcing Reinforcing is an essential component in reinforced concrete. Concrete has a high compression but very low tensile stress. Due to this fact reinforcing or “rebar” is necessary to provide added tensile strength. The most common form of rebar is metal however; other materials which can be used include plastic or glass fibres. A vital characteristic of reinforcing is that it must have a similar thermal expansion coefficient to that of concrete (BRI, 2004). This ensures that there are no unnecessary perpendicular or longitudinal stresses during setting which may weaken the structure (GFRP Bar Transverse Coefficient of Thermal Expansion Effects on Concrete Cover). Rebar is bent and hooked within the concrete and set into structural members. Concrete normally provides a pH of 12 or more, which prevents decay and rusting of the reinforcing material. This is essential to prevent structural failure. Only recently advanced reinforcement such as glass-fibre and reinforced thermo-set resins generally classified as fibre-reinforced polymer bar is being used in applications such as high corrosive environments. In South Africa, the rebar emissions factor is an average emission per tonne of rebar produced, regardless of its application. The grade and specifications can vary in composition, tensile strength, percentage of elongation as well as yield strength. Rebar strength is measured in ksi, where one ksi is equal to 1000 psi (American Concrete Institute). Emissions related to the manufacture of steel reinforcing have been supplied by Arcelor Mittal without a breakdown per emission type.
5.8. In situ concrete and precast products The concrete material components can generally be used to produce four different types of concrete which are used for specific applications. These types are:
- in-situ concrete, - roof tiles, - precast bricks & blocks and - precast concrete slabs.

19
The services of preparing these concrete end form products also have their own associated emissions. In-situ concrete is made to a set mix design and is produced at a batching plant. The product is then delivered to site by trucks with mounted mixers. Due to the fact that a set mix design is used, this allows for specialty mixtures to be produced. In-situ concrete assists construction as builders do not have to make concrete mixes on site. This also allows for a continuous supply of concrete to the site that is subject to high levels of quality control. Precast concrete products are an alternative to in-situ construction. Concrete is cast in a reusable mould and is then allowed to set under controlled conditions. The precast item is then transported to site and placed. Precast is frequently used in applications such as highway barriers, walls, tunnels as well as storm water and sewerage pipelines. The main emissions related to these services are given as follows:
5.8.1. Scope 1 – On site vehicles Scope 1 (direct) emissions result from fuel used by onsite vehicles.
5.8.2. Scope 1 – Curing fuels Some curing processes require fuels like gas or coal for example.
5.8.3. Scope 2 – Electricity The concrete mixing operations generally make use of electricity for the preparation of a mix and sometimes for mixing itself (depending on the plant type). Some curing processes use electricity.
5.8.4. Scope 3 – Transport The transport of raw materials to this “Service centre” and from the plant to the site have been included under this definition as Scope 3. The emissions resulting from the in-situ concrete and precast process are relatively low. This is due to the fact that the processes are not highly energy intensive. The main Scope 3 emission source that was examined in this study was in fact product transport (See Appendix J).

20
6. Emission calculations by spreadsheet models When considering the CO2 emissions related to concrete, each individual component (service or material as per Figure 2) has been examined individually and then consolidated to determine the total emissions. Using the WBCSD GHG principles and rules as defined in the preceding chapters, the calculation process of the combined emissions related to concrete was streamlined via the use of a series of spreadsheets.
6.1. GHG Rules for spreadsheet development The GHG emissions reporting spreadsheets fulfil the five main GHG Protocol principles: 1. Relevance: The application of the recommended protocol is appropriate to the
intended users, both internal and external.
2. Completeness: All material GHG emissions within the chosen boundaries are included in the worksheet. Scope one (direct), two (indirect) and three (other indirect) emissions are reported.
3. Consistency: Methodologies recommended are applied consistently across all collected data.
4. Transparency: All relevant issues of recommended data sources and auditability are clearly explained.
5. Accuracy: Bias and uncertainties have been reduced as far as realistically possible.

21
6.2. Component spreadsheets With reference to Figure 2 it was necessary to calculate the the emission contributions of all the material, transport and service components making up a cubic metre of concrete. In some cases emission data was available directly from the component suppliers. In other cases InEnergy had to use its own spreadsheets for the determination of the emissions from basic principles; see Table 4:
Components Emission Determination Method
Comments
Mat
eri
al C
om
po
nen
ts
Admixtures InEnergy Spreadsheet Model Model based on GHG Protocol rules
Water Literature Friedrich et.al (2008)
Cement Direct supplier reference Cement producers use WBCSD model based on GHG protocol rules.
Fly Ash InEnergy Spreadsheet Model Model based on GHG Protocol rules
GGBS InEnergy Spreadsheet Model Model based on GHG Protocol rules
Aggregate InEnergy Spreadsheet Model Model based on GHG Protocol rules
Steel Reinforcing Direct supplier reference Arcelor Mittal
Tran
spo
rt
Co
mp
on
ents
Transport of raw materials to concrete batching facility
Included in Readymix InEnergy Spreadsheet Model
Model based on GHG Protocol rules
Transport of concrete to site
Included in Readymix InEnergy Spreadsheet Model
Model based on GHG Protocol rules
Transport of steel to site Deemed relatively insignificant for the purposes of this study.
Serv
ice
Co
mp
on
ents
Ready mix (on site or off site) or Precast production
InEnergy Spreadsheet Model Model based on GHG Protocol rules
Placement of concrete Deemed relatively insignificant for the purposes of this study.
Table 4 Emission determination methods

22
The various InEnergy models consider the various production processes and calculate the CO2e emissions from plant activity data and referenced emissions factors. The table below lists the components of concrete production along with the number of sites that supplied data either in the form of activity data or in finalised emissions.
Plant Information Component No of Respondents
1 Admixtures 0*
2 Aggregates 27
3 Cement 3
4 Fly Ash 3
5 GGBS 3
6 Water 0*
7 Reinforcing steel 1
8 Precast slabs 1
9 Precast roof tiles 1
10 Precast bricks & blocks 11
11 In-situ concrete (Readymix)
68
Table 5 Total plant respondents from each sector.
* Literature data source
6.3. Component spreadsheet extract example An example of how the InEnergy models treat the separate production processes is shown in the table belowError! Reference source not found.. The yellow cells show what data needs to be user input by the plant based on the latest available production data (called “activity” data). Some of the user data can be found in the individual plant CO2 reports, while other data needs to be sourced from technical, production or cost reports InEnergy collected the activity data from the required sites by means of questionnaires as shown in Appendices B to J.
Indirect Emission Sources Example 2006
External Electricity Generation
Consumption of power produced externally [MWh/yr] 150,000
On-site Vehicles (Third Party)
Petrol [kl/yr] 1,000
Diesel [kl/yr] 4,500
Vehicle Type Truck
Distance Travelled [km/yr] 100, 000
Table 6 Spreadsheet extract.

23
7. Results
7.1. Limitations of results The limitations of the results presented in this chapter are as follows:
The component spreadsheets and the concrete model were developed using the WBCSD GHG emissions tool as a basis, strictly following the rules set out in the GHG protocol.
The boundary of the study took all relevant scope one (direct), scope two (indirect) and scope three (other indirect) emissions into consideration. These were considered within the operational control of each site and the specific boundary can be defined as:
o The start boundary can be defined as when the raw materials enter the site. o The end boundary can be defined as the placement of concrete onsite.
CO2 e emissions were determined by inferential techniques based on the following formula: Activity Data x Emission Factor = CO2 e emission factor
1. “Activity data” being the source data used to in the model calculations to
infer emissions. 2. “Emission factors” being the factors used in the model calculation together
with “Activity” data to infer emissions.
The accuracy of the specific emissions of each component are limited to the accuracy of the activity data supplied by the respective sites.
o The activity data has been checked by InEnergy for anomalies but not verified. The data only represents a sample of the data available in the industry seeing as not all the members of the C&CI responded, and seeing that not all companies in the industry are members of the C&CI.
The accuracy of the model is limited to the quality of the emission factors that have been used. Where publically available, local emission factors have been used. IPCC (Intergovernmental Panel for Climate Change) international default factors were used where local factors were unavailable. These factors were applied to the activity data that was collected from the various components of the concrete industry. It is common practice to determine the associated emissions from an activity or process by means of IPCC emission factors.
The compositions of the cement types (i.e. CEM II, CEM III etc.) used in the model are pre-defined. The resultant emissions for a specific cement type have been summed from the individual blend components. Not all cement manufacturers produce all the products and so as not to disclose sensitive blend information of any individual cement producer, the compositions of blended cement types in the model were fixed by the C&CI. Obviously if these averages are compared to individual company emissions, variations will occur. For background information see Appendix

24
A for a list of cement types as per SANS 50197-1.The CEM I emissions are weighted averages from data submitted by the cement manufacturers.
7.2. Component Emission Results The specific emissions that were obtained for the various components can be seen in the table below. The specific emissions for cement types represented are derived from pre-defined cement types (Appendix A). The activity data that were used to define the emission factors noted below were checked interims of validity and accuracy. InEnergy implemented cross checks of the source activity data against each factory as well as available international benchmarks. Thought the compilation of the questionnaires, models and the final report, the GHG protocol rules of relevance, completeness, consistency, transparency and accuracy were strictly followed.
Table 7 Component Specific Emissions.
Table 8 Cement Specific Emissions

25
7.2.1. Admixtures None of the admixture manufacturers supplied their related emissions and hence internal literature sources were used for these specific emissions. Admixtures have a small contribution to the footprint of concrete due to the fact that they are used in very small quantities per cubic meter of concrete.
7.2.2. Aggregates Twenty eight aggregate quarries returned completed questionnaires. The specific emissions value obtained was 5.36kg CO2 / t. The breakdown of emissions can be seen below. Diesel usage accounts for most of the Scope 1 emissions. The bulk of Scope 2 emissions come from the consumption electricity. Due to the fact that explosives are consumed in such small amounts there are very few emissions associated to explosives despite their high specific emissions.
Figure 4 CO2 emission types associated with aggregates.
7.2.3. Fly Ash
The specific emissions associated with fly ash came to 1.51 kg CO2e / t. This took into consideration that fly ash is a by-product of the power industry. Thus, the product would be produced regardless of demand from the concrete and cement industries. Therefore, the specific emissions only took activities into consideration post “primary” production. The vast majority of emissions associated with fly ash preparation is from electricity consumption.
26
Figure 5 CO2 emissions types associated with fly ash
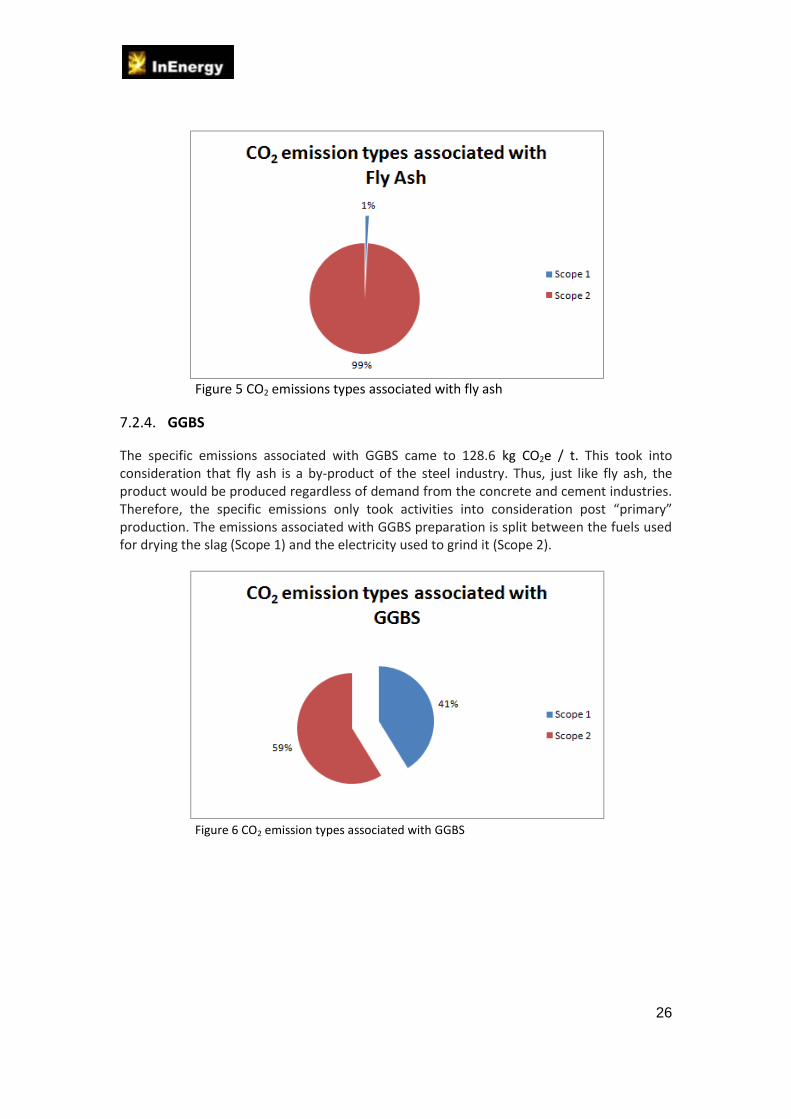
7.2.4. GGBS
The specific emissions associated with GGBS came to 128.6 kg CO2e / t. This took into consideration that fly ash is a by-product of the steel industry. Thus, just like fly ash, the product would be produced regardless of demand from the concrete and cement industries. Therefore, the specific emissions only took activities into consideration post “primary” production. The emissions associated with GGBS preparation is split between the fuels used for drying the slag (Scope 1) and the electricity used to grind it (Scope 2).
Figure 6 CO2 emission types associated with GGBS

27
7.2.5. Water An in-depth study by Friedrich et.al (2008) found that the GHG emissions associated with municipal water in South Africa to be 0.93 kg CO2e per kilolitre. The water and admixture components contributed the least CO2 emissions to a cubic meter of concrete. Other similar studies that were examined excluded these components which contribute less that one half of a percent of CO2 emissions to a cubic meter.
The investigation of emissions associated with water consumption revealed they could in fact be deemed as immaterial. They have, however, been included for a holistic all inclusive representation in this study. Scope 1 (direct) emissions, largely due to waste water purification, slightly outweighed Scope 2 (indirect) emissions .
Figure 7 CO2 emission types associated with water
7.2.6. Reinforcing In South Africa, steel rebar is the primary reinforcing used. It is known that the steel industry is very energy intensive; leading to it having the highest emissions factor of 2735 kg CO2/t. The primary emission source is from on-site coal consumption .

28
to reinforcing steel.
7.2.7. In situ concrete and precast products The in-situ concrete and precast components within the concrete industry contribute few CO2 emissions to a cubic meter of concrete. Other studies that were examined excluded these. When all sources of emissions were included, in-situ concrete and precast services actually accounted for a small but significant fraction of total emissions associated to a concrete mix. The specific emissions associated with in-situ concrete (readymix) came to 10.5 CO2e / m3
Figure 8 CO2 emission types associated with in-situ concrete

29
The specific emissions associated with pre-cast slabs came to 23.9kg CO2e / m3
Figure 9 CO2 emission types associated with Pre-cast slabs
7.2.8. Cement The values that were obtained for cement were based on data from three major suppliers of cement in South Africa. The specific emissions associated with cement CEM I came to 985.4 kg CO2e / t
Figure 10 CO2 emission types associated to CEM I Cement.

30
7.3. Combined Emission Results The individual components’ emission values were used to generate a consolidated concrete emissions model. This model allows the user to define a particular concrete mix for which the model then determines the associated GHG emissions. For comparative purposes various mix designs are given in Appendix I. Dependent on the concrete mix, the range of emissions (including Scope 1, 2 &3) was between 195 (50/50 GGBS with admix), and 483 kg CO2/m3
(decomposed granite sand, no admix). If we use the same boundary definition as the Australian study by Flower and Sanjayan (2007) for comparison purposes the range comes to 142 and 284 kg CO2/m3
(50/50 GGBS with admixture and CEM I no admixture). The Australian concrete had a range of 290 to 320 kg CO2/m3.
Figure 11 Weight contribution of a concrete mix.
Figure 12 CO2 breakdown of a concrete mix
CO2 contribution to 50/50 GGBS with admix
5%
72%
9%
14% Admixtures Aggregates CEM I Fly Ash GGBS Water Reinforcing In-situ concrete
Weight contribution to 50/50 GGBS with admix
81%
6%
6%
7%
Admixtures Aggregates CEM I Fly Ash GGBS Water Reinforcing In-situ concrete

31
8. Baseline emissions comparison There are only two similar studies which examine emissions due to concrete. The research was conducted by Flower and Sanjayan (2007) for Australia and the Concrete Centre (2008) for the United Kingdom. Upon examination of the Australian research, one major factor which needs to be taken into consideration is their sample size. The life cycle inventory data which was used to base their research was collected from three aggregate quarries, six concrete batching plants and ‘several other sources’. This data are insufficient to produce an accurate statistical representation of the industry. It is nevertheless still of value to examine their methods and results obtained. The U.K study on the other hand, takes all plants in the country into consideration. This was possible because their inventory data reporting is mandatory. This allows the Concrete Centre to have all required data immediately on hand. There are around 3200 quarries and concrete production sites in the U.K. The main components that were taken into consideration were cement, aggregates, GGBS and fly ash. Some components were not taken into consideration for the Australian study namely, in-situ concrete, precast, water, admixtures and reinforcing steel. The U.K. study also excluded emissions resulting from reinforcing steel. The Australian study did examine emissions related to water and admixtures, but excluded the results in the calculations due to the fact that they deemed the emissions insignificant. An important fact which Flower and Sanjayan (2007, p282) noted is that “reliable estimates of greenhouse gas emission footprint of various construction materials are becoming important, because of the environmental awareness of the users of construction material”. It is essential to take all components of concrete into consideration to develop a representative and reliable CO2 emissions inventory. This data can then be used to compare competing construction materials such as steel and glass (Jönsson et.al, 1998).If the data gathered does not represent the total emissions of a particular material, inaccurate results will be obtained. Thus, it is essential that all constituents of concrete are considered. The specific emissions that were obtained can be seen in Table 9.

32
Table 9 Final CO2 emission factors, (Flower and Sanjayan, 2007, p282; The Concrete Centre, 2008, p16)
Activity Specific Emissions Unit
Discussions
Australia U.K. S.A
Aggregates average 32 4 5 kg CO2e/tonne S.A and the U.K figures are very close. The Australia figure is higher apparently due to the higher electricity consumption.
Cement Cem I (Scope 1 (direct),)
822 819 818 kg CO2e/tonne All of the cement figures are very comparable and S.A. narrowly results in the lowest CO2 emissions when compared to the two other case studies.
Fly ash 27 4 2 kg CO2e/tonne The emissions from fly ash in Australia are higher due to the location of batching plants relative to the power plants and on average require 100 km of transport. The U.K and S.A figures are closer to each other.
GGBS 143 52 128 kg CO2e/tonne In the U.K, their GGBS does not require as extensive grinding as Australian or South African GGBS. It is owing to this that the U.K has a much lower specific emission for GGBS.
In-situ concrete (Scope 1 (direct))
12 4 9 kg CO2e/m3 This process in general results in very small quantities of CO2. The resulting emissions are from electricity use and from the transport of raw materials to the concrete batching plant or so the site.
Admixtures - 380 220 kg CO2e/l
This value for South Africa is an internet derived value for a Plasticizer. The resulting emissions are insignificant due to the small quantities used. The affect of the admixture is the main reason that it has been included. The figure used for S.A is lower than the U.K, due to the fact that in the U.K. the admixture is usually in a powder form and thus requires drying and milling. In S.A, a liquid form is usually applied.
Pre-cast - 14 18 kg CO2e/tonne This process in general results in small quantities of CO2 .

33
The methodology that was used to produce these emission factors for the U.K study is very similar to the methodology that InEnergy have applied. Flower and Sanjayan (2007), however, performed energy audits on the plants over a period of six months to obtain their data. This seems somewhat unnecessary as plants do keep detailed energy consumption logs which can be inputted into spreadsheets to obtain the required data. Another factor which could skew their results is that they only collected data for the plants over a six month period. It is a normal for cement plants to shut down their kilns for maintenance once a year. If the data was collected over this period, significantly reduced Scope 2 (indirect) emissions from electricity consumption could have been obtained. Some plants also observe annual consumption demand shifts were there are high and low periods of demand. The overall findings of the Australian study were that CO2 emissions resulting from concrete manufacture in 2007 were between 290 and 320 kg CO2/m3. It should be noted that they only included Scope 1 (direct). Another factor is that not all the components were taken into consideration, a major one being reinforcing steel. Further, their sample size was small. Thus, this is not necessarily an accurate representation of the actual emissions associated with a cubic meter of concrete. The U.K study reported minimum emissions of 266 kg CO2/ m3 of concrete, excluding reinforcement.

34
9. Concrete mix design comparisons This section aims to demonstrate the effects on CO2 emissions by varying a concrete mix design. The Cement and Concrete Institute utilised the company ‘Concrete Testing Services’ to design specific mixes. All the mix designs used the raw materials in varying amounts to evaluate the effects of fly ash, GGBS, admixture and aggregate water demand on CO2 emissions. These tests were essential to quantify the effects of each component.
9.1. Specifics about the mixes A total of eight mixes were designed to have strength of 30 MPa and used a CEM I as a base cement. Mixes were done with and without an admixture (Appendix I):
CEM I;
70/30 Fly ash;
50/50 GGBS; and
Decomposed granite sand.
The mixes varied in CEM I content dependent on the mix design to attain the same 30 MPa strength. The above concrete mixes were chosen to demonstrate the effects on the GHG emissions by varying the mix design. These mixes are not average representative mix designs in South Africa. The CEM I was chosen because it is a basis on which comparisons can be made. The fly ash and GGBS mix designs show the effect of extension. The 30 percent fly ash mix and 50 percent GGBS mix were chosen because these are the generally accepted limits of extension. The decomposed granite sand mix was chosen to show the effect of high water demand sand. The increased water demand requires more cement and in turn increases the carbon footprint. The strength selected by the C&CI is a standard industry representative strength. Steel reinforcing has not been included due to the fact that reinforcing is not included in a mix design. It is only included for tensile strength in structure.

35
Figure 13 CO2 emissions resulting from various mix designs
Table 10: Resulting CO2 emissions of the various mix designs
This section of the report has not included a mix design comparing the effects of including a limestone blended cement. The C&CI has acknowledged that limestone does account for a portion of the blends within South Africa. However, this will need to be examined in a further expansion of this report if deemed it necessary. The preceding graph compares the CO2 variations between the designed mixes. It can be noted that whenever an admixture is used the emissions resulting from cement are decreased. Due to the fact that cement has a relatively large emissions factor small changes in content result in significant CO2 variations.

36
70/30 Flyash/Cem I: No Admix
85%
11%
0%
4%
Admixtures
Aggregates
CEM I
Fly Ash
Slagment
Water
Reinforcing
Ready Mix
70/30 Flyash/Cem I: Admix
82%
0%
13% 5%
Admixtures
Aggregates
CEM I
Fly Ash
Slagment
Water
Reinforcing
Ready Mix
50/50 Slagment/Cem I: No Admix
74%
0%
10%
0%0%12% 4%
Admixtures
Aggregates
CEM I
Fly Ash
Slagment
Water
Reinforcing
Ready Mix
50/50 Slagment/Cem I: Admix
72%
9%
0%0%
14%
0%
5%
Admixtures
Aggregates
CEM I
Fly Ash
Slagment
Water
Reinforcing
Ready Mix
Decomposed Granite Sand: No Admix
92%
6%
0%2%
Admixtures
Aggregates
CEM I
Fly Ash
Slagment
Water
Reinforcing
Ready Mix
Decomposed Granite Sand: No Admix
91%
7%0%
2%
Admixtures
Aggregates
CEM I
Fly Ash
Slagment
Water
Reinforcing
Ready Mix
CEM I mix: Admix
87%
0% 10% 3%
Admixtures Aggregates CEM I Fly Ash GGBS
Water Reinforcing Ready Mix
CEM I mix: No Admix
89%
0%
8% 3%
Admixtures Aggregates CEM I Fly Ash GGBS Water Reinforcing Ready Mix

37
Figure 14: Component emissions contribution of varying mix designs
When examining the CEM I mix design it can be noted that the emissions are 356 kg CO2 per ton. This value is used as the baseline to which the other mixes are compared below. Admixture When admixture was added to the CEM I mix design water requirement was reduced by 10 percent resulting in a decreased cement requirement of 17.6 percent. Overall the admixture resulted in a CO2 emissions reduction of 16 percent. This highlights the impact of the plasticizer admixture. Fly ash Fly ash has the capability to reduce associated emissions by 23 percent and when used in association with admixture, emissions are reduced by a further 15 percent, totalling a 38 percent reduction. GGBS Due to the inherent properties of GGBS, cement substitution rates of 50 percent are possible. GGBS has the potential to reduce the associated CO2 emissions by 36 percent and when used with an admixture by 45 percent. Aggregate/sand The final test that was done made use of decomposed granite sand as an aggregate input. The aim of this is to show that the selection of aggregate also has a potential to reduce CO2 emissions. The decomposed granite sand mix has an extremely high water requirement (76% higher) which in turn leads to increased cement requirement of 53 %. Overall this increases the CO2 emissions of the decomposed granite sand mix by 36 percent when compared to the CEM I. When an admixture is included in the mix emissions drop 18%. It should be noted that the decomposed granite sand mix with no admixture has the highest associated CO2 emissions 483 kg CO2/t). It was also found the 50/50 GGBS mix with admixture has the lowest associated emissions (195 kg CO2/t). The ability of extenders to reduce CO2 emissions in a concrete mix are evident. It was also noted that whenever admixture was used emissions were reduced by between 9% and 18% depending on the mix. Based on the results; to reduce CO2 emissions related to concrete the following steps can be taken:
use a cement extended by fly ash or GGBS;
use an admixture; and
use a good quality aggregate and sand with a low water demand.

38
10. Future scope expansion
Annual update of model emission factors.
Building design comparison.
Random selection of plants to verify data inputs.
InEnergy CO2 emissions verification certificate.
Concrete industry CO2 reduction potential and strategy.
Perform operations-specific energy efficiency audits with the goal of reducing CO2e intensity.
Development of Clean Development (CDM) projects to assist companies in reducing their CO2e emissions.

39
11. Conclusion This project has brought along with it a number of lessons learnt and specific outcomes. The ability to quantify the carbon footprint of a concrete mix of a specific mix design, allows the user to evaluate the effect of all the components in that mix. This increases a user’s understanding of what influences the various components of a concrete mix have on the associated GHG emissions. The user of the model now has insight into the interrelationships that occur between components and how to best optimise a mix to reduce GHG emissions. The model that has been developed is a valuable tool that can be used within the industry by cement manufacturers, ready mix producers, site engineers and architects to name a few. The key findings of this report are the emissions associated to the various components of concrete and how they consolidate into a carbon footprint for concrete. The mix design comparisons that have been done show that the emission range of an average concrete mix in South Africa based on a 30 MPa strength fly ash and GGBS blended cement with an admixture is 215 to 240 kg CO2/m3. These figures include all scopes of emission sources and can be brought back to the resulting emissions per tonne range of 85 to 95 kg CO2 / t. By using this model the concrete sector would be leading by example in terms of environmental awareness. Unfortunately, the South African economy is still very power intensive, overall resulting in a very large CO2 emissions footprint. It is due to this fact that the country currently stands as the 16th largest consumer of fossil fuels. With world trends leaning towards decreasing carbon emissions, South African residents, industry and Government will have to take a proactive stance on increasing efficiencies and decreasing overall demand. The new concrete CO2 model is very much aligned with the principles of the WBCSD GHG protocol and its uses include:
establishing the carbon footprints of various concrete mixes;
raising awareness of “green” concretes;
recognising environmental leadership; and
enabling the reduction of the environmental impact of development.

40
12. References ACAA (American Coal Ash Association), 2005: CCP Production and Use Survey. www.acaa-
usa.org. Accessed 16 march 2009 American Concrete Institute, "Building Code Requirements for Structural Concrete (ACI 318-
08) and Commentary," ISBN 978-0-87031-264-9 Asphalt Technology, 2001: Fly Ash- an extender for the cement industry. Construction World, February 2001. ASTM International, 2008: Standard Specification for Coal Fly Ash and Raw or Calcined
Natural Pozzolan for Use in Concrete ASTM International. www.astm.org. Accessed: 17 March 2009. BRI (Basic Rebar Information), 2004: Rebar Background. http://www.usingrebar.com/
Accessed: 11 March 2009 C&CI, 2010, Cement Type Publication. http://www.cnci.org.za/freeslist.html
Accessed: 31 Jul 2010. CDM (Clean Development Mechanism). 2004: Proposed new methodology: Baseline (CDM-
NMB) – Version 01. Carbon Trust, 2008: Carbon footprinting An introduction for organisations.
www.carbontrust.com. Accessed: 17 March 2009 CIF (2003): Cement Industry Environment Report, Cement Industry Federation. CSI Cement Protocol V2, 2005: CO2 Accounting and Reporting Standard for the Cement
Industry. www.csi.com. Accessed: 17 March 2009 Department of the Environment and Heritage, Australian Greenhouse Office. AGO Factors
and Methods Workbook. Canberra: Australian Greenhouse Office, 2006. www.climatechange.gov.au Accessed: 29 January 2009
Ellis, J. 2000. An Initial View on Methodologies for Emission Baselines: Cement Case Study.
OECD and IEA Information Paper, June 2000. European Cement Association, 2004. Sited in: WWF: A blueprint for a climate friendly
cement industry. www.panda.org Accessed: 5 January 2009 Flower DJM, Sanjayan JG (2007): Green House Gas Emissions due to Concrete Manufacture.
Int J LCA 12 (5) 282–288 Friedrich et.al., 2005: The use of life cycle assessment in the selection of water treatment
processes. Final Report to the Water Research Commission. Pollution Research Group.

41
GHGProtocol (Greenhouse Gas Protocol), 2004: The Greenhouse Gas Protocol.
www.ghgprotocol.org Accessed: 18 September 2008 Hammond and Jones, 2008: Inventory of carbon and energy (ICE). www.bath.ac.uk
Accessed: 10 February 2009 Holcim, 2006: Annual Review & Sustainability Report-2006. www.holcim.com .Accessed: 20
February 2009 Humphreys, K. and Mahasenan. M. 2002: Climate Change- Toward a Sustainable Cement
Industry. Battelle - World Business Council for Sustainable Development, March, 2002 Huntzinger, N, D, and T. D. Eatmon, 2008: A life-cycle assessment of portland cement
manufacturing: comparing the traditional process with alternative technologies, J Clean Prod
Jönsson Å, Björklund T and A. M. Tillman, (1998): LCA of Concrete and Steel Building Frames.
Int J LCA 3 (4) 216–224 Khandekar, M. P., Bhide, A. D and K. S. Sajwan, 1999: Biogeochemistry of trace elements in
coal and coal combustion by-products. Kluwer academic/Plenum publishers: New York. Lippiatt, B., and S. Ahmad, “Measuring the Life-Cycle Environmental and Economic
Performance of Concrete: The BEES Approach,” International Workshop on Sustainable Development and Concrete Technology, Beijing, May 20-21, 2004.
NRCNA (National Research Council of the National Academies), 2006: Managing Coal
Combustion Residues in Mines, Committee on Mine Placement of Coal Combustion Wastes.
Pade C, Guimaraes M. 2006: The CO2 Uptake of Concrete during a 100 year Perspective,
Proceedings of Advances in Cement and Concrete X – Sustainability. Davos, Switzerland, July 2006, Engineering Conferences International, pp 114–119
Schuurmans A, Rouwette R, Vonk N, Broers J, Rijnsburger H and H. Pietersen, (2005): LCA of
Finer Sand in Concrete. Int J LCA 10 (2) 131–135 Sheath, J. 2010: The concrete industries “green: component. Cement and Concrete, may 2010. Slanina, J. 2004: Air Pollution from Energy Production and Use. Encyclopedia of Energy, 1,
39-54. Slagment, 2010: AfriSam Products and Services,
http://www.afrisam.co.za/products_slagment.asp . Accessed: 31 July 2010

42
The Concrete Centre, 2008: The concrete industry sustainability performance report: 1st Report. www.concretecentre.com/main.asp?page=1979. Accessed: 20 August 2009.
Ulm, F. J, 2007: Green Concrete Nanoengineered materials. TECHNOLOGY REVIEW
July/August 2007. USEPA (US Environmental Protection Agency), 2007: Human and Ecological Risk Assessment
of Coal Combustion Wastes, RTI, Research Triangle Park. USEPA (U.S. Environmental Protection Agency), 200?: Using Coal Ash in Highway
Construction - A Guide to Benefits and Impacts. www.epa.gov. Accessed: 17 March 2009. US FHA (U.S. Federal Highway Administration): "Ground Granulated Blast-Furnace GGBS".
www.fhwa.dot.gov. Accessed: 17 March 2009. Worrell, E., et al. (2001), Carbon Dioxide Emissions from the Global Cement Industry, Annual
Review of Energy and Environment, Vol 26. Wwf, 2007: A blueprint for a climate friendly cement industry.
www.panda.org/climatesavers.

43
13. Appendix A Common cements: SANS 50197-1
Source: C&CI , 2010.

44
14. Appendix B Aggregate questionnaire

45
15. Appendix C Admixture questionnaire

46
16. Appendix D Fly ash questionnaire

47
17. Appendix E GGBS questionnaire

48
18. Appendix F Pre-cast questionnaire

49
19. Appendix G Readymix questionnaire

50
20. Appendix H Final model

51
21. Appendix I Concrete mix designs CEM I mix design CEM I mix design with admixture
70/30 Fly ash mix design 70/30 Fly ash with admixture

52
50/50 GGBS 50/50 GGBS with admixture
Decomposed granite sand Decomposed granite sand with admixture

53
22. Appendix J: Discussion around transport emissions
Figure 15 Overview of scopes and CO2 emissions (GHG Protocol, 2004, p26).
For the purpose of this study, all direct and indirect emissions have been considered within each specific company’s operational control. The operational boundary was defined as the scope of emissions (Scope 1, 2 and 3), for operations which fall within a company’s established organisational boundary. The specific emissions which have been included are project specific and for comparative purposes, selection of Scope 3 (other indirect) emissions have been carefully chosen (Pade and Guimaraes, 2007; Hammond and Jones, 2008). In a preliminary examination of the various components, there was a dispute as to who accounts for delivery emissions of raw materials to the site as well as delivery of products to the customer. In an extensive examination of international trends and industry standards it should be noted that for the purpose of this project, Scope 3 (other indirect) emissions from the delivery of raw materials to the cement plants have not been included. This is based on the GHG Protocol and aims to prevent double counting. However, the emissions produced from the delivery of products to the customer will be included as a Scope 3 source. The emissions boundary can be defined under the company’s operational control as is illustrated below Error!
Reference source not found. (CSI Cement Protocol V2, 2005; GHG Protocol, 2004). Figure 16 Operational and Organisational boundaries of a company (GHGProtocol, 2004, p25).

54
Some of the primary emissions sources identified within each sector can be seen in the table below. Each of these direct and indirect sources count towards each component’s GHG emissions.
Table 11 Specific sources of emissions for each sector.
Sector Direct Indirect Other Indirect
Cement
Coal firing of kiln On site fuel – vehicles On site fuel – kiln start up Calcination of raw materials
Electricity
Delivery of raw materials to site
In-situ concrete On site fuel - loader
Electricity Delivery of raw materials to site
Fly ash On site fuel - vehicles
Electricity Delivery of raw materials to site
GGBS Coal firing of furnace On site fuel – vehicles On site fuel – furnace start up
Electricity Delivery of raw materials to site
Aggregates On site fuel – vehicles Explosives
Electricity Delivery of raw materials to site
Precast concrete products Coal, gas firing of boilers for water heating
Electricity Delivery of raw materials to site
Admixtures Onsite fuel – vehicles
Electricity Delivery of raw materials to site
Water none Purification
& Pumping None
Reinforcing Onsite fuel - vehicles
Electricity Delivery of raw materials to site
It is very important to note that the CSI Cement Protocol version 2 actually allows for the exclusion of on-site emissions by third parties and all off-site transports. This is a known deviation from the requirements of the WRI and WBCSD and has been recommended in this instance because of the fact that these emissions are small relative to kiln emissions and are often difficult to quantify in a consistent manner. The yellow coloured block in the figure below shows all that is required for transport quantification as per the cement protocol. This was confirmed by the South African cement representatives and exactly the reason why they did not report on off-site transport emissions. While the cement producers’ protocol allows for special treatment of off-site emissions, the purpose of this project is to determine the CO2 emissions of concrete.
Figure 17 Transportation of raw materials and products (CSI Cement Protocol V2, 2005, p9).

55
The reasons for including the offsite delivery transport emissions:
While offsite transport emissions may be small relative to the kiln emissions, they may not necessarily be small relative to the other components of emissions incurred in the production of concrete.
From a public perception, emissions from aggregate and in-situ concrete trucks are considered as significant.
The CO2 emitted in the production of concrete includes numerous steps and components. These components need to be reported on from a “completeness” and “transparency” point of view as per the guidelines of the GHG Protocol.
If transport delivery emissions are included for any one sector, in order to keep a standard emissions should be included for all components involved.
Do not want to be criticised for leaving out delivery emissions and cause findings to be classified as inaccurate or incomplete..
Previous studies (Flower and Sanjayan, 2007) of concrete CO2 emissions have included offsite transport emissions. It is wise to maintain the same rules for benchmarking purposes.
These arguments outweigh the principle of “materiality”. This does not mean that these emissions need to be calculated to the nth degree of accuracy, averages should be provided that accurately represent reality in this respect. Their exactness of determination need not be so high as to be laborious to verify.
It should also be noted that the CO2 emissions of concrete include offsite transport emissions, which have been incorporated within the category of Scope 3 (other indirect). Thus, it was possible to use the data collected to report specifically on Scope 1 (direct) and Scope 2 (indirect) emissions of the different components for the purposes of benchmarking. Scope 3 (other indirect) emissions are not compulsory for a company to report however, are necessary for an accurate representation of the total CO2 emissions. Limited benchmark data are available in literature on relevant Scope 3 (other indirect) emissions. Therefore only Scope 1 (direct) and Scope 2 (indirect) emissions have been be considered when doing the international benchmarking to provide a fair and accurate comparison of the individual components of concrete to other figures from around the world.