Embed Size (px)
Citation preview
CEMENT
Research Analysts:
End of the capex cycle!
Nitin [email protected]: +91 22 3043 3241
March 2016
Achint Bhagat, [email protected]: +91 22 3043 3178
Cement
March 17, 2016 Ambit Capital Pvt. Ltd. Page 2
CONTENTS
SECTOR
End of the capex!.…………………………………………………………………….. 3
Coverage summary …………………………………………………………………..4
Two decades of aggressive expansion …………………………………………….5
Understanding the last capex cycle ………………………………………………..6
How will the next 5year cycle be different? ……………………………………….9
Is the industry finally consolidating? ……………………………………………..13
Demand growth could retrace to 6-8% …………………………………………16
The retail consumer to the rescue 2.0 ……………………………………………18
Prices likely to recover from the lows …………………………………………….21
Costs – headwinds receding ……………………………………………………….22
End of the downgrade cycle ……………………………………………………….24
Ranking the cement peers …………………………………………………………30
Relative valuations …………………………………………………………………32
Regional dynamics ………………………………………………………………….33
COMPANIES
Ultratech Cement (BUY) ……………………………………………………………39
Ambuja Cement (BUY) ……………………………………………………………..55
ACC (BUY) ……………………………………………………………………………71
Ambit Capital and / or its affiliates do and seek to do business including investment banking with companies covered in its research reports. As a result, investors should be aware that Ambit Capital may have a conflict of interest that could affect the objectivity of this report. Investors should not consider this report as the only factor in making their investment decision.
End of the capex cycle!
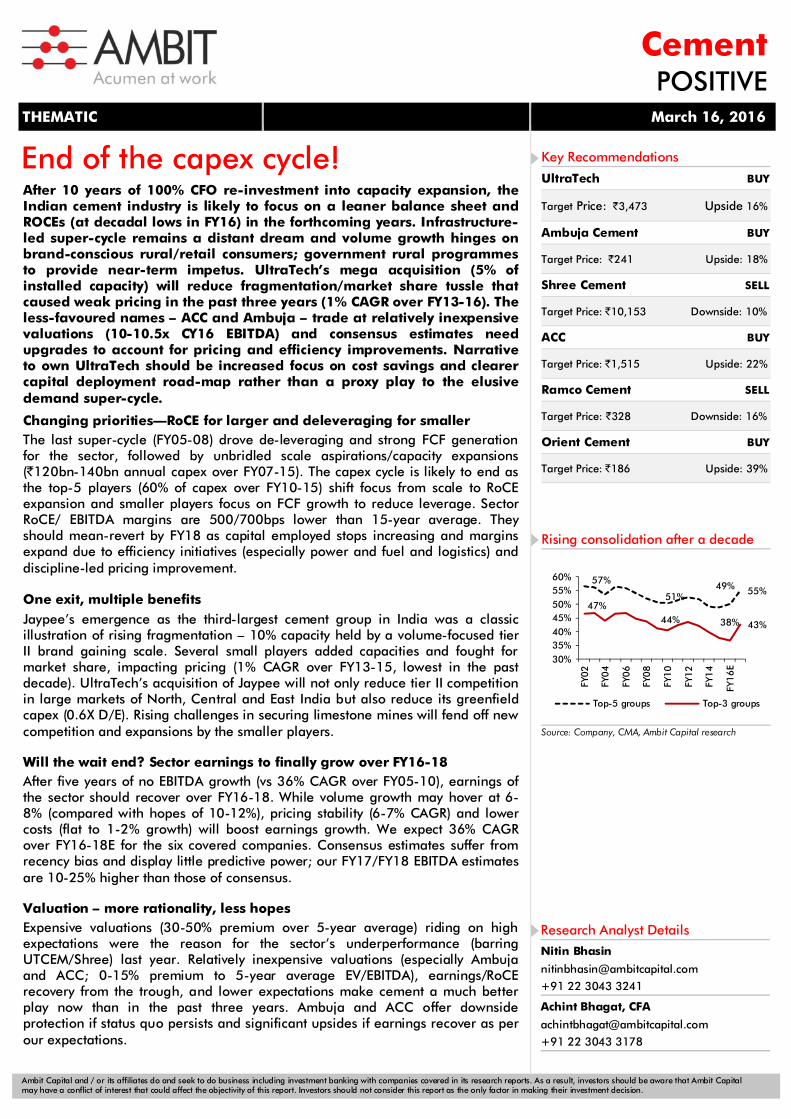
After 10 years of 100% CFO re-investment into capacity expansion, the Indian cement industry is likely to focus on a leaner balance sheet and ROCEs (at decadal lows in FY16) in the forthcoming years. Infrastructure-led super-cycle remains a distant dream and volume growth hinges on brand-conscious rural/retail consumers; government rural programmes to provide near-term impetus. UltraTech’s mega acquisition (5% of installed capacity) will reduce fragmentation/market share tussle that caused weak pricing in the past three years (1% CAGR over FY13-16). The less-favoured names – ACC and Ambuja – trade at relatively inexpensive valuations (10-10.5x CY16 EBITDA) and consensus estimates need upgrades to account for pricing and efficiency improvements. Narrative to own UltraTech should be increased focus on cost savings and clearer capital deployment road-map rather than a proxy play to the elusive demand super-cycle.
Changing priorities—RoCE for larger and deleveraging for smaller The last super-cycle (FY05-08) drove de-leveraging and strong FCF generation for the sector, followed by unbridled scale aspirations/capacity expansions (`120bn-140bn annual capex over FY07-15). The capex cycle is likely to end as the top-5 players (60% of capex over FY10-15) shift focus from scale to RoCE expansion and smaller players focus on FCF growth to reduce leverage. Sector RoCE/ EBITDA margins are 500/700bps lower than 15-year average. They should mean-revert by FY18 as capital employed stops increasing and margins expand due to efficiency initiatives (especially power and fuel and logistics) and discipline-led pricing improvement. One exit, multiple benefits Jaypee’s emergence as the third-largest cement group in India was a classic illustration of rising fragmentation – 10% capacity held by a volume-focused tier II brand gaining scale. Several small players added capacities and fought for market share, impacting pricing (1% CAGR over FY13-15, lowest in the past decade). UltraTech’s acquisition of Jaypee will not only reduce tier II competition in large markets of North, Central and East India but also reduce its greenfield capex (0.6X D/E). Rising challenges in securing limestone mines will fend off new competition and expansions by the smaller players. Will the wait end? Sector earnings to finally grow over FY16-18 After five years of no EBITDA growth (vs 36% CAGR over FY05-10), earnings of the sector should recover over FY16-18. While volume growth may hover at 6-8% (compared with hopes of 10-12%), pricing stability (6-7% CAGR) and lower costs (flat to 1-2% growth) will boost earnings growth. We expect 36% CAGR over FY16-18E for the six covered companies. Consensus estimates suffer from recency bias and display little predictive power; our FY17/FY18 EBITDA estimates are 10-25% higher than those of consensus.
Valuation – more rationality, less hopes Expensive valuations (30-50% premium over 5-year average) riding on high expectations were the reason for the sector’s underperformance (barring UTCEM/Shree) last year. Relatively inexpensive valuations (especially Ambuja and ACC; 0-15% premium to 5-year average EV/EBITDA), earnings/RoCE recovery from the trough, and lower expectations make cement a much better play now than in the past three years. Ambuja and ACC offer downside protection if status quo persists and significant upsides if earnings recover as per our expectations.
THEMATIC March 16, 2016
CementPOSITIVE
Key Recommendations
UltraTech BUY
Target Price: ̀ 3,473 Upside 16%
Ambuja Cement BUY
Target Price: ̀ 241 Upside: 18%
Shree Cement SELL
Target Price: ̀ 10,153 Downside: 10%
ACC BUY
Target Price: ̀ 1,515 Upside: 22%
Ramco Cement SELL
Target Price: `328 Downside: 16%
Orient Cement BUY
Target Price: ̀ 186 Upside: 39%
Rising consolidation after a decade
Source: Company, CMA, Ambit Capital research
57%
51%49% 55%
47%44% 38% 43%
30%35%40%45%50%55%60%
FY02
FY04
FY06
FY08
FY10
FY12
FY14
FY16E
Top-5 groups Top-3 groups
Research Analyst Details
Nitin Bhasin
+91 22 3043 3241
Achint Bhagat, CFA
+91 22 3043 3178
Cement
March 16, 2016 Ambit Capital Pvt. Ltd. Page 4
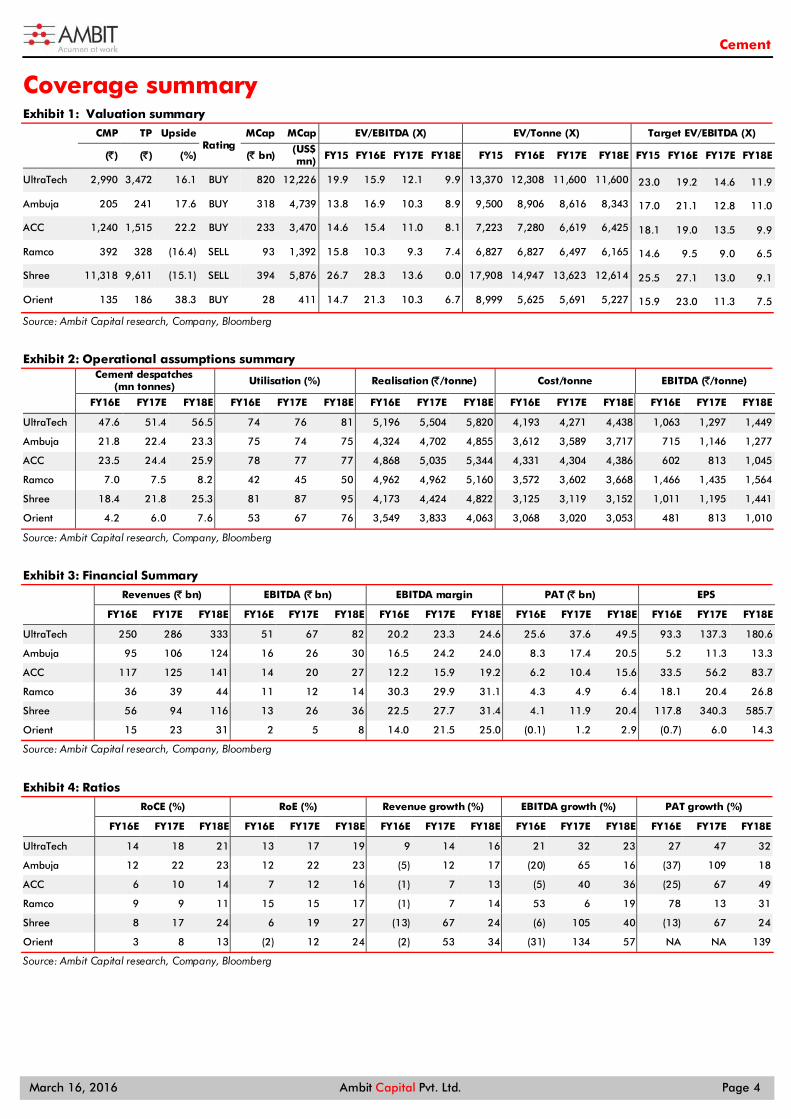
Coverage summary Valuation summary Exhibit 1:
CMP TP Upside Rating
MCap MCap EV/EBITDA (X) EV/Tonne (X) Target EV/EBITDA (X)
(`) (`) (%) (` bn) (US$ mn) FY15 FY16E FY17E FY18E FY15 FY16E FY17E FY18E FY15 FY16E FY17E FY18E
UltraTech 2,990 3,472 16.1 BUY 820 12,226 19.9 15.9 12.1 9.9 13,370 12,308 11,600 11,600 23.0 19.2 14.6 11.9
Ambuja 205 241 17.6 BUY 318 4,739 13.8 16.9 10.3 8.9 9,500 8,906 8,616 8,343 17.0 21.1 12.8 11.0
ACC 1,240 1,515 22.2 BUY 233 3,470 14.6 15.4 11.0 8.1 7,223 7,280 6,619 6,425 18.1 19.0 13.5 9.9
Ramco 392 328 (16.4) SELL 93 1,392 15.8 10.3 9.3 7.4 6,827 6,827 6,497 6,165 14.6 9.5 9.0 6.5
Shree 11,318 9,611 (15.1) SELL 394 5,876 26.7 28.3 13.6 0.0 17,908 14,947 13,623 12,614 25.5 27.1 13.0 9.1
Orient 135 186 38.3 BUY 28 411 14.7 21.3 10.3 6.7 8,999 5,625 5,691 5,227 15.9 23.0 11.3 7.5
Source: Ambit Capital research, Company, Bloomberg
Operational assumptions summary Exhibit 2:
Cement despatches (mn tonnes) Utilisation (%) Realisation (`/tonne) Cost/tonne EBITDA (`/tonne)
FY16E FY17E FY18E FY16E FY17E FY18E FY16E FY17E FY18E FY16E FY17E FY18E FY16E FY17E FY18E
UltraTech 47.6 51.4 56.5 74 76 81 5,196 5,504 5,820 4,193 4,271 4,438 1,063 1,297 1,449
Ambuja 21.8 22.4 23.3 75 74 75 4,324 4,702 4,855 3,612 3,589 3,717 715 1,146 1,277
ACC 23.5 24.4 25.9 78 77 77 4,868 5,035 5,344 4,331 4,304 4,386 602 813 1,045
Ramco 7.0 7.5 8.2 42 45 50 4,962 4,962 5,160 3,572 3,602 3,668 1,466 1,435 1,564
Shree 18.4 21.8 25.3 81 87 95 4,173 4,424 4,822 3,125 3,119 3,152 1,011 1,195 1,441
Orient 4.2 6.0 7.6 53 67 76 3,549 3,833 4,063 3,068 3,020 3,053 481 813 1,010
Source: Ambit Capital research, Company, Bloomberg
Financial Summary Exhibit 3:
Revenues (` bn) EBITDA (` bn) EBITDA margin PAT (` bn) EPS
FY16E FY17E FY18E FY16E FY17E FY18E FY16E FY17E FY18E FY16E FY17E FY18E FY16E FY17E FY18E
UltraTech 250 286 333 51 67 82 20.2 23.3 24.6 25.6 37.6 49.5 93.3 137.3 180.6
Ambuja 95 106 124 16 26 30 16.5 24.2 24.0 8.3 17.4 20.5 5.2 11.3 13.3
ACC 117 125 141 14 20 27 12.2 15.9 19.2 6.2 10.4 15.6 33.5 56.2 83.7
Ramco 36 39 44 11 12 14 30.3 29.9 31.1 4.3 4.9 6.4 18.1 20.4 26.8
Shree 56 94 116 13 26 36 22.5 27.7 31.4 4.1 11.9 20.4 117.8 340.3 585.7
Orient 15 23 31 2 5 8 14.0 21.5 25.0 (0.1) 1.2 2.9 (0.7) 6.0 14.3
Source: Ambit Capital research, Company, Bloomberg
Ratios Exhibit 4:
RoCE (%) RoE (%) Revenue growth (%) EBITDA growth (%) PAT growth (%)
FY16E FY17E FY18E FY16E FY17E FY18E FY16E FY17E FY18E FY16E FY17E FY18E FY16E FY17E FY18E
UltraTech 14 18 21 13 17 19 9 14 16 21 32 23 27 47 32
Ambuja 12 22 23 12 22 23 (5) 12 17 (20) 65 16 (37) 109 18
ACC 6 10 14 7 12 16 (1) 7 13 (5) 40 36 (25) 67 49
Ramco 9 9 11 15 15 17 (1) 7 14 53 6 19 78 13 31
Shree 8 17 24 6 19 27 (13) 67 24 (6) 105 40 (13) 67 24
Orient 3 8 13 (2) 12 24 (2) 53 34 (31) 134 57 NA NA 139
Source: Ambit Capital research, Company, Bloomberg
Cement
March 16, 2016 Ambit Capital Pvt. Ltd. Page 5
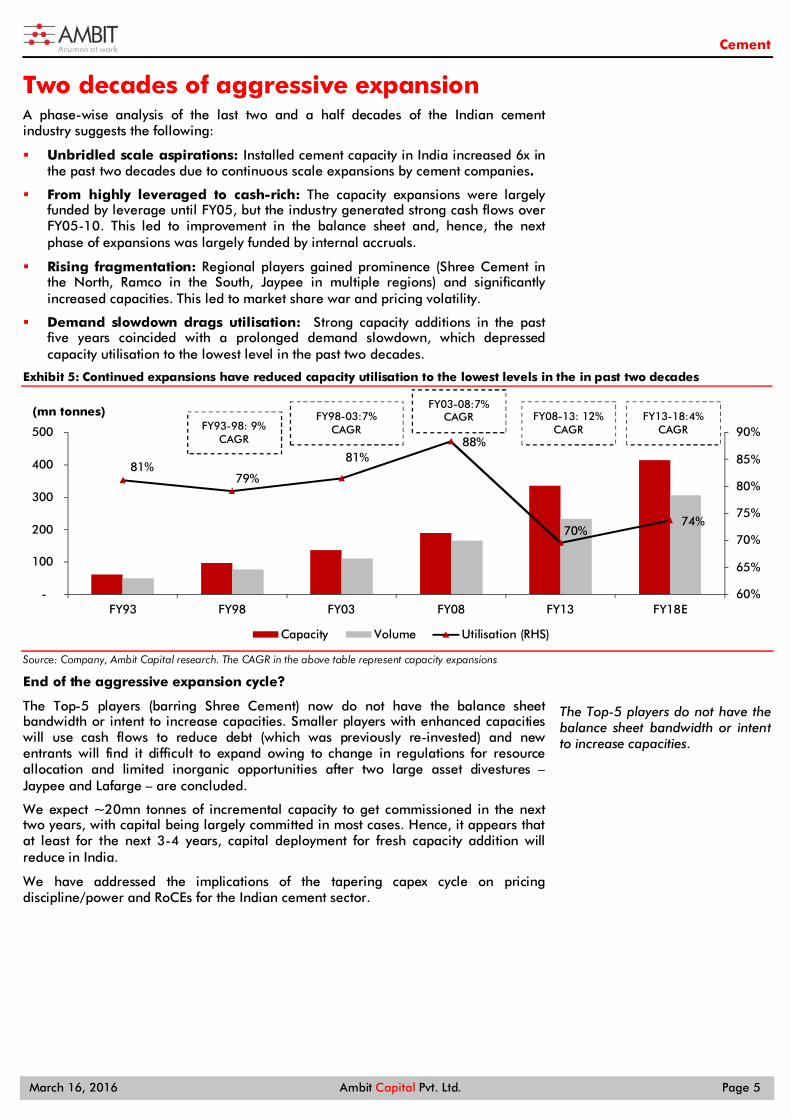
Two decades of aggressive expansion A phase-wise analysis of the last two and a half decades of the Indian cement industry suggests the following:
Unbridled scale aspirations: Installed cement capacity in India increased 6x in the past two decades due to continuous scale expansions by cement companies.
From highly leveraged to cash-rich: The capacity expansions were largely funded by leverage until FY05, but the industry generated strong cash flows over FY05-10. This led to improvement in the balance sheet and, hence, the next phase of expansions was largely funded by internal accruals.
Rising fragmentation: Regional players gained prominence (Shree Cement in the North, Ramco in the South, Jaypee in multiple regions) and significantly increased capacities. This led to market share war and pricing volatility.
Demand slowdown drags utilisation: Strong capacity additions in the past five years coincided with a prolonged demand slowdown, which depressed capacity utilisation to the lowest level in the past two decades.
Continued expansions have reduced capacity utilisation to the lowest levels in the in past two decades Exhibit 5:
Source: Company, Ambit Capital research. The CAGR in the above table represent capacity expansions
End of the aggressive expansion cycle?
The Top-5 players (barring Shree Cement) now do not have the balance sheet bandwidth or intent to increase capacities. Smaller players with enhanced capacities will use cash flows to reduce debt (which was previously re-invested) and new entrants will find it difficult to expand owing to change in regulations for resource allocation and limited inorganic opportunities after two large asset divestures – Jaypee and Lafarge – are concluded.
We expect ~20mn tonnes of incremental capacity to get commissioned in the next two years, with capital being largely committed in most cases. Hence, it appears that at least for the next 3-4 years, capital deployment for fresh capacity addition will reduce in India.
We have addressed the implications of the tapering capex cycle on pricing discipline/power and RoCEs for the Indian cement sector.
81%79%
81%88%
70%74%
60%
65%
70%
75%
80%
85%
90%
-
100
200
300
400
500
FY93 FY98 FY03 FY08 FY13 FY18E
(mn tonnes)
Capacity Volume Utilisation (RHS)
The Top-5 players do not have the balance sheet bandwidth or intent to increase capacities.
FY93-98: 9% CAGR
FY98-03:7% CAGR
FY03-08:7% CAGR FY08-13: 12%
CAGR FY13-18:4%
CAGR
Cement
March 16, 2016 Ambit Capital Pvt. Ltd. Page 6
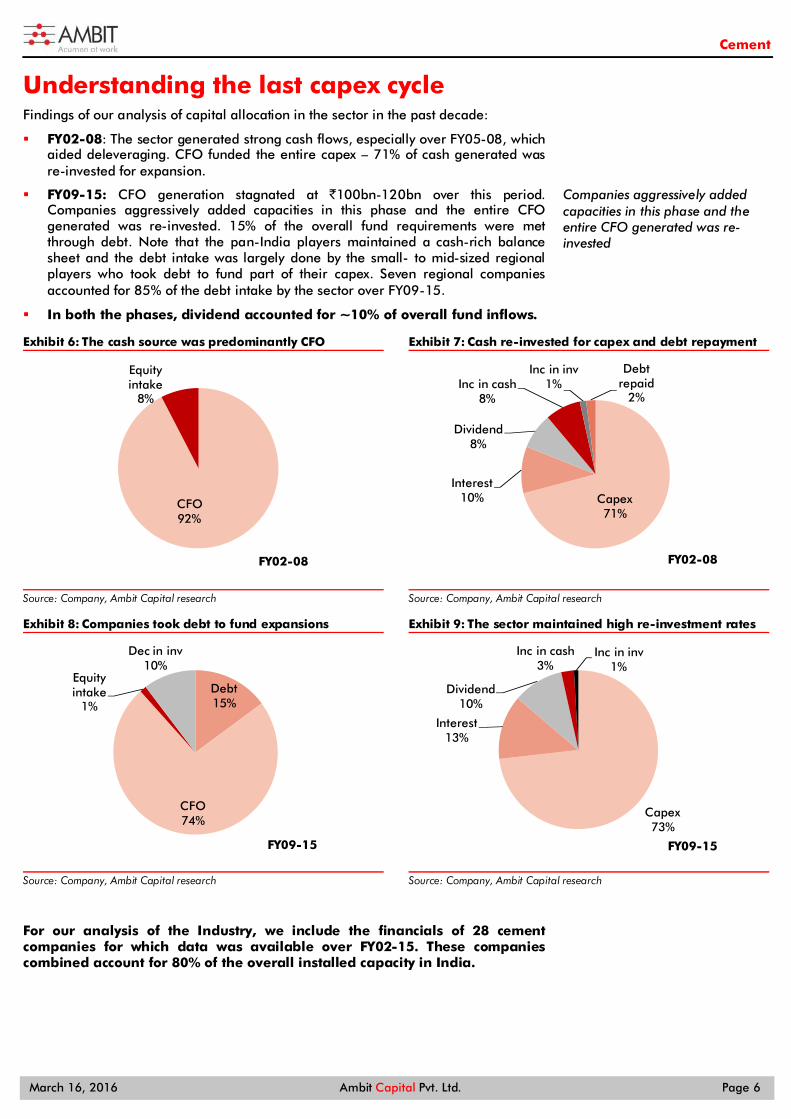
Understanding the last capex cycle Findings of our analysis of capital allocation in the sector in the past decade:
FY02-08: The sector generated strong cash flows, especially over FY05-08, which aided deleveraging. CFO funded the entire capex – 71% of cash generated was re-invested for expansion.
FY09-15: CFO generation stagnated at `100bn-120bn over this period. Companies aggressively added capacities in this phase and the entire CFO generated was re-invested. 15% of the overall fund requirements were met through debt. Note that the pan-India players maintained a cash-rich balance sheet and the debt intake was largely done by the small- to mid-sized regional players who took debt to fund part of their capex. Seven regional companies accounted for 85% of the debt intake by the sector over FY09-15.
In both the phases, dividend accounted for ~10% of overall fund inflows.
The cash source was predominantly CFO Exhibit 6:
Source: Company, Ambit Capital research
Cash re-invested for capex and debt repayment Exhibit 7:
Source: Company, Ambit Capital research
Companies took debt to fund expansions Exhibit 8:
Source: Company, Ambit Capital research
The sector maintained high re-investment rates Exhibit 9:
Source: Company, Ambit Capital research
For our analysis of the Industry, we include the financials of 28 cement companies for which data was available over FY02-15. These companies combined account for 80% of the overall installed capacity in India.
CFO92%
Equity intake
8%
FY02-08
Capex71%
Interest10%
Dividend8%
Inc in cash8%
Inc in inv1%
Debt repaid
2%
FY02-08
Debt15%
CFO74%
Equity intake
1%
Dec in inv10%
FY09-15
Capex73%
Interest13%
Dividend10%
Inc in cash3%
Inc in inv1%
FY09-15
Companies aggressively added capacities in this phase and the entire CFO generated was re-invested
Cement
March 16, 2016 Ambit Capital Pvt. Ltd. Page 7
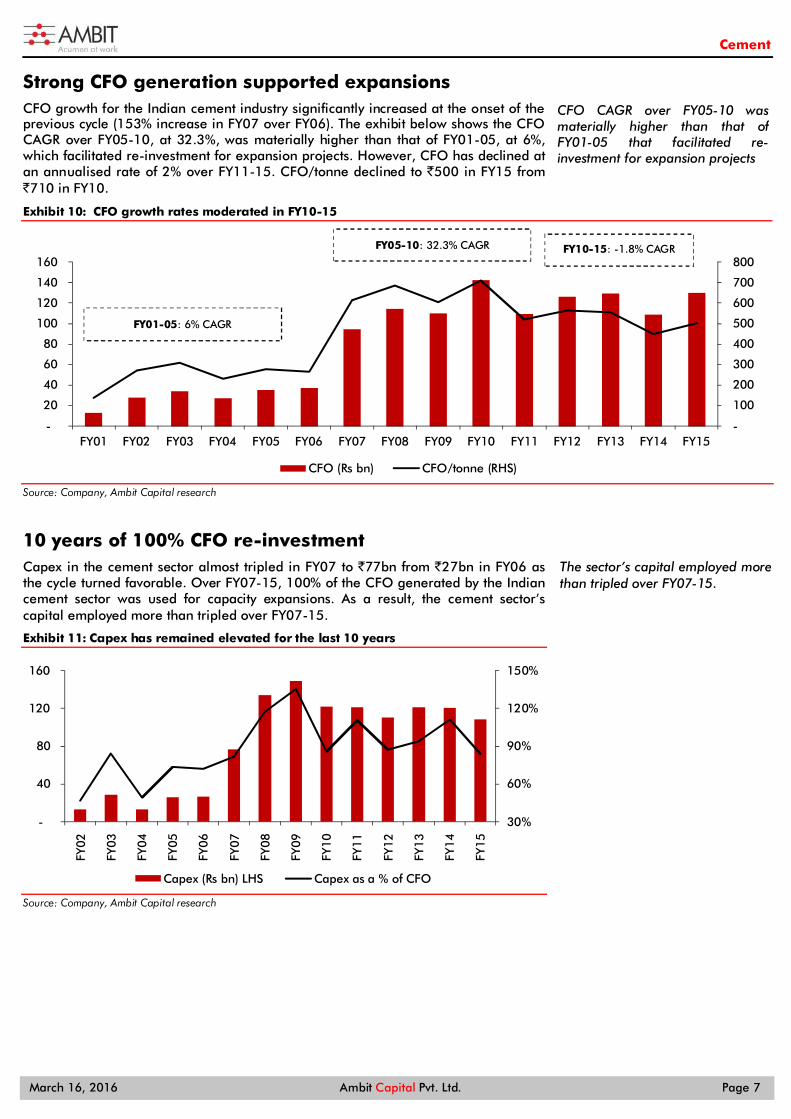
Strong CFO generation supported expansions CFO growth for the Indian cement industry significantly increased at the onset of the previous cycle (153% increase in FY07 over FY06). The exhibit below shows the CFO CAGR over FY05-10, at 32.3%, was materially higher than that of FY01-05, at 6%, which facilitated re-investment for expansion projects. However, CFO has declined at an annualised rate of 2% over FY11-15. CFO/tonne declined to `500 in FY15 from `710 in FY10.
CFO growth rates moderated in FY10-15 Exhibit 10:
Source: Company, Ambit Capital research
10 years of 100% CFO re-investment Capex in the cement sector almost tripled in FY07 to `77bn from `27bn in FY06 as the cycle turned favorable. Over FY07-15, 100% of the CFO generated by the Indian cement sector was used for capacity expansions. As a result, the cement sector’s capital employed more than tripled over FY07-15.
Capex has remained elevated for the last 10 years Exhibit 11:
Source: Company, Ambit Capital research
-
100
200
300
400
500
600
700
800
-
20
40
60
80
100
120
140
160
FY01 FY02 FY03 FY04 FY05 FY06 FY07 FY08 FY09 FY10 FY11 FY12 FY13 FY14 FY15
CFO (Rs bn) CFO/tonne (RHS)
30%
60%
90%
120%
150%
-
40
80
120
160
FY0
2
FY0
3
FY0
4
FY0
5
FY0
6
FY0
7
FY0
8
FY0
9
FY1
0
FY1
1
FY1
2
FY1
3
FY1
4
FY1
5
Capex (Rs bn) LHS Capex as a % of CFO
CFO CAGR over FY05-10 was materially higher than that of FY01-05 that facilitated re-investment for expansion projects
The sector’s capital employed more than tripled over FY07-15.
FY01-05: 6% CAGR
FY05-10: 32.3% CAGR FY10-15: -1.8% CAGR
Cement
March 16, 2016 Ambit Capital Pvt. Ltd. Page 8
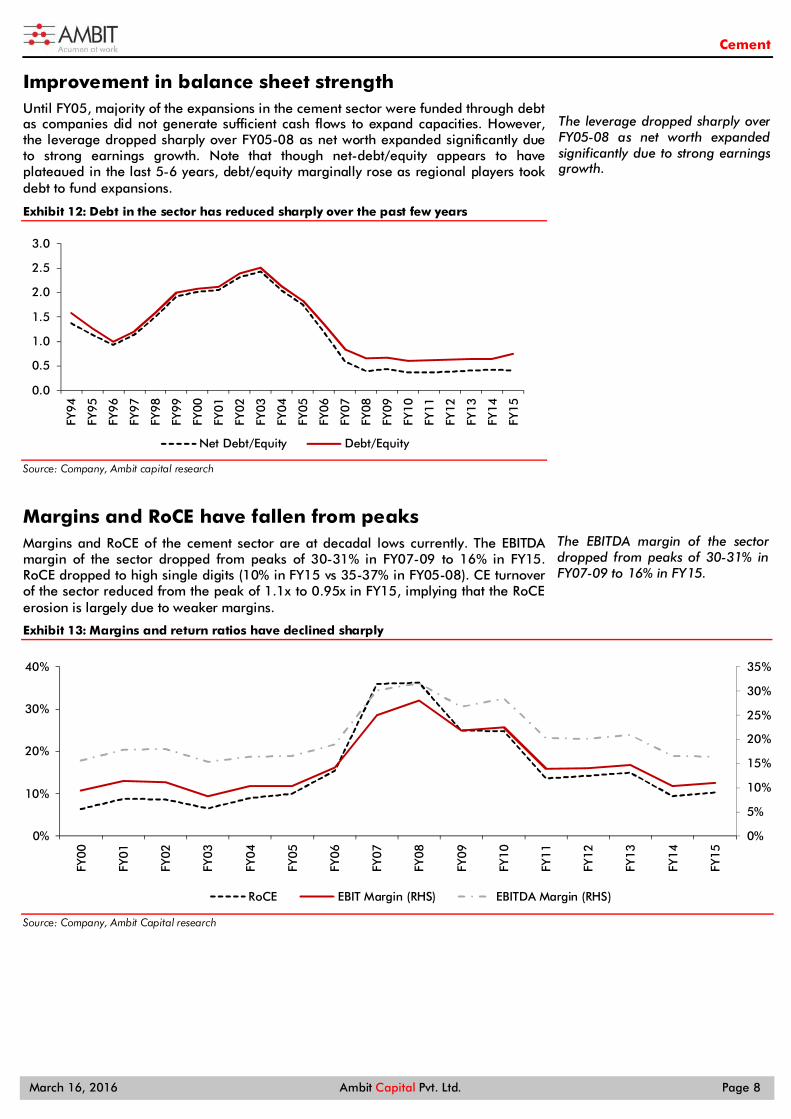
Improvement in balance sheet strength Until FY05, majority of the expansions in the cement sector were funded through debt as companies did not generate sufficient cash flows to expand capacities. However, the leverage dropped sharply over FY05-08 as net worth expanded significantly due to strong earnings growth. Note that though net-debt/equity appears to have plateaued in the last 5-6 years, debt/equity marginally rose as regional players took debt to fund expansions.
Debt in the sector has reduced sharply over the past few years Exhibit 12:
Source: Company, Ambit capital research
Margins and RoCE have fallen from peaks Margins and RoCE of the cement sector are at decadal lows currently. The EBITDA margin of the sector dropped from peaks of 30-31% in FY07-09 to 16% in FY15. RoCE dropped to high single digits (10% in FY15 vs 35-37% in FY05-08). CE turnover of the sector reduced from the peak of 1.1x to 0.95x in FY15, implying that the RoCE erosion is largely due to weaker margins.
Margins and return ratios have declined sharply Exhibit 13:
Source: Company, Ambit Capital research
0.0
0.5
1.0
1.5
2.0
2.5
3.0
FY94
FY95
FY96
FY97
FY98
FY99
FY00
FY01
FY02
FY03
FY04
FY05
FY06
FY07
FY08
FY09
FY10
FY11
FY12
FY13
FY14
FY15
Net Debt/Equity Debt/Equity
0%
5%
10%
15%
20%
25%
30%
35%
0%
10%
20%
30%
40%
FY00
FY01
FY02
FY03
FY04
FY05
FY06
FY07
FY08
FY09
FY10
FY11
FY12
FY13
FY14
FY15
RoCE EBIT Margin (RHS) EBITDA Margin (RHS)
The leverage dropped sharply over FY05-08 as net worth expanded significantly due to strong earnings growth.
The EBITDA margin of the sector dropped from peaks of 30-31% in FY07-09 to 16% in FY15.
Cement
March 16, 2016 Ambit Capital Pvt. Ltd. Page 9
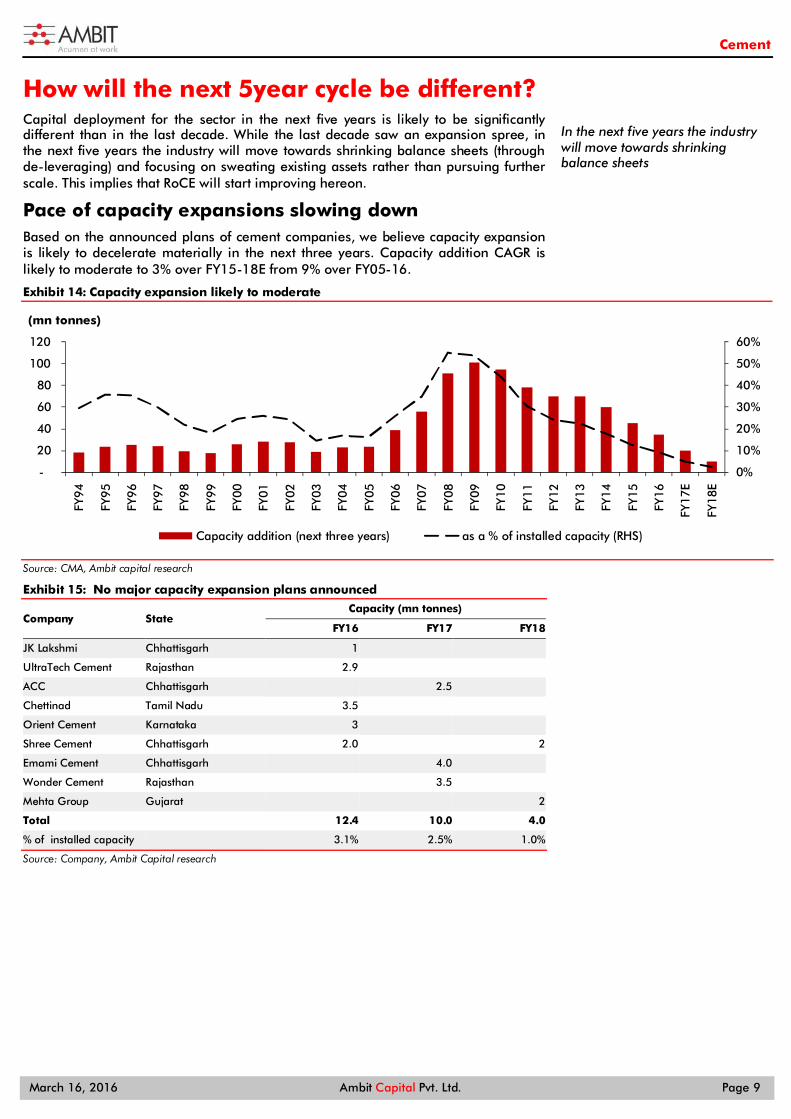
How will the next 5year cycle be different? Capital deployment for the sector in the next five years is likely to be significantly different than in the last decade. While the last decade saw an expansion spree, in the next five years the industry will move towards shrinking balance sheets (through de-leveraging) and focusing on sweating existing assets rather than pursuing further scale. This implies that RoCE will start improving hereon.
Pace of capacity expansions slowing down Based on the announced plans of cement companies, we believe capacity expansion is likely to decelerate materially in the next three years. Capacity addition CAGR is likely to moderate to 3% over FY15-18E from 9% over FY05-16.
Capacity expansion likely to moderate Exhibit 14:
Source: CMA, Ambit capital research
No major capacity expansion plans announced Exhibit 15:
Company State Capacity (mn tonnes)
FY16 FY17 FY18
JK Lakshmi Chhattisgarh 1 UltraTech Cement Rajasthan 2.9 ACC Chhattisgarh 2.5 Chettinad Tamil Nadu 3.5 Orient Cement Karnataka 3 Shree Cement Chhattisgarh 2.0 2
Emami Cement Chhattisgarh 4.0 Wonder Cement Rajasthan 3.5 Mehta Group Gujarat 2
Total 12.4 10.0 4.0
% of installed capacity 3.1% 2.5% 1.0%
Source: Company, Ambit Capital research
0%
10%
20%
30%
40%
50%
60%
-
20
40
60
80
100
120
FY9
4
FY9
5
FY9
6
FY9
7
FY9
8
FY9
9
FY0
0
FY0
1
FY0
2
FY0
3
FY0
4
FY0
5
FY0
6
FY0
7
FY0
8
FY0
9
FY1
0
FY1
1
FY1
2
FY1
3
FY1
4
FY1
5
FY1
6
FY1
7E
FY1
8E
(mn tonnes)
Capacity addition (next three years) as a % of installed capacity (RHS)
In the next five years the industry will move towards shrinking balance sheets
Cement
March 16, 2016 Ambit Capital Pvt. Ltd. Page 10
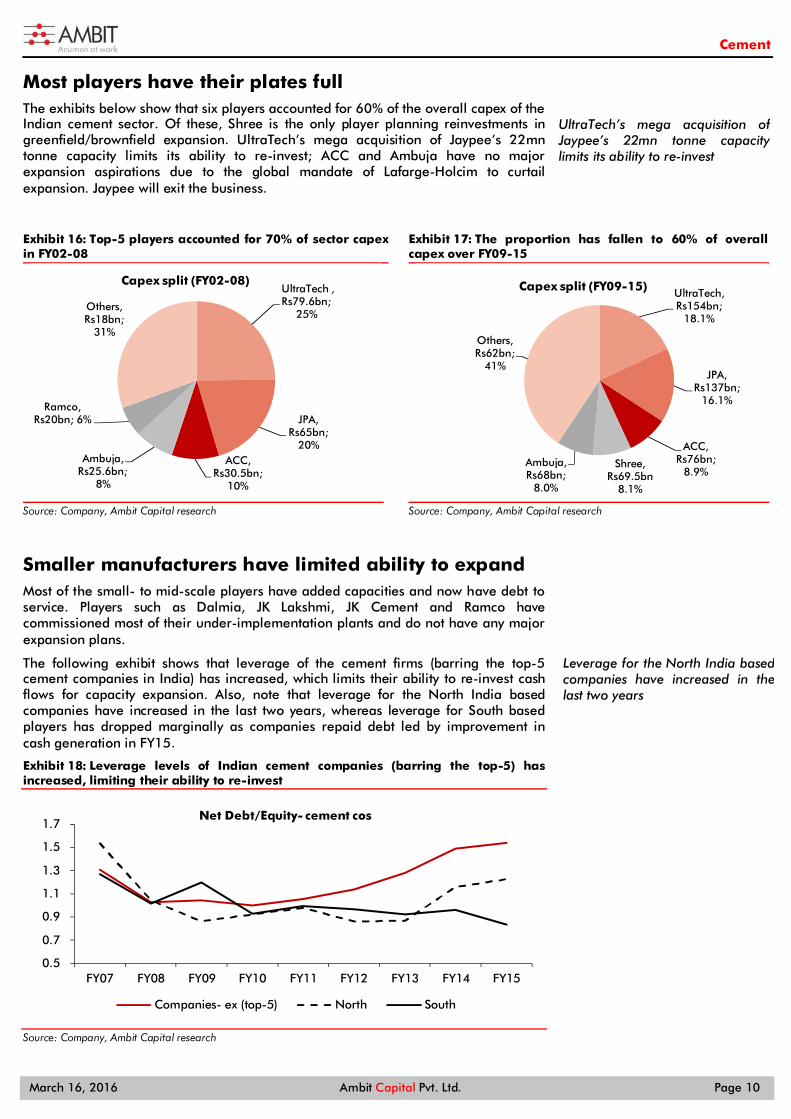
Most players have their plates full The exhibits below show that six players accounted for 60% of the overall capex of the Indian cement sector. Of these, Shree is the only player planning reinvestments in greenfield/brownfield expansion. UltraTech’s mega acquisition of Jaypee’s 22mn tonne capacity limits its ability to re-invest; ACC and Ambuja have no major expansion aspirations due to the global mandate of Lafarge-Holcim to curtail expansion. Jaypee will exit the business.
Top-5 players accounted for 70% of sector capex Exhibit 16:in FY02-08
Source: Company, Ambit Capital research
The proportion has fallen to 60% of overall Exhibit 17:capex over FY09-15
Source: Company, Ambit Capital research
Smaller manufacturers have limited ability to expand Most of the small- to mid-scale players have added capacities and now have debt to service. Players such as Dalmia, JK Lakshmi, JK Cement and Ramco have commissioned most of their under-implementation plants and do not have any major expansion plans.
The following exhibit shows that leverage of the cement firms (barring the top-5 cement companies in India) has increased, which limits their ability to re-invest cash flows for capacity expansion. Also, note that leverage for the North India based companies have increased in the last two years, whereas leverage for South based players has dropped marginally as companies repaid debt led by improvement in cash generation in FY15.
Leverage levels of Indian cement companies (barring the top-5) has Exhibit 18:increased, limiting their ability to re-invest
Source: Company, Ambit Capital research
UltraTech , Rs79.6bn;
25%
JPA, Rs65bn;
20%ACC,
Rs30.5bn; 10%
Ambuja, Rs25.6bn;
8%
Ramco, Rs20bn; 6%
Others, Rs18bn;
31%
Capex split (FY02-08)UltraTech, Rs154bn;
18.1%
JPA, Rs137bn;
16.1%
ACC, Rs76bn;
8.9%Shree,
Rs69.5bn 8.1%
Ambuja, Rs68bn;
8.0%
Others, Rs62bn;
41%
Capex split (FY09-15)
0.5
0.7
0.9
1.1
1.3
1.5
1.7
FY07 FY08 FY09 FY10 FY11 FY12 FY13 FY14 FY15
Net Debt/Equity- cement cos
Companies- ex (top-5) North South
UltraTech’s mega acquisition of Jaypee’s 22mn tonne capacity limits its ability to re-invest
Leverage for the North India based companies have increased in the last two years
Cement
March 16, 2016 Ambit Capital Pvt. Ltd. Page 11
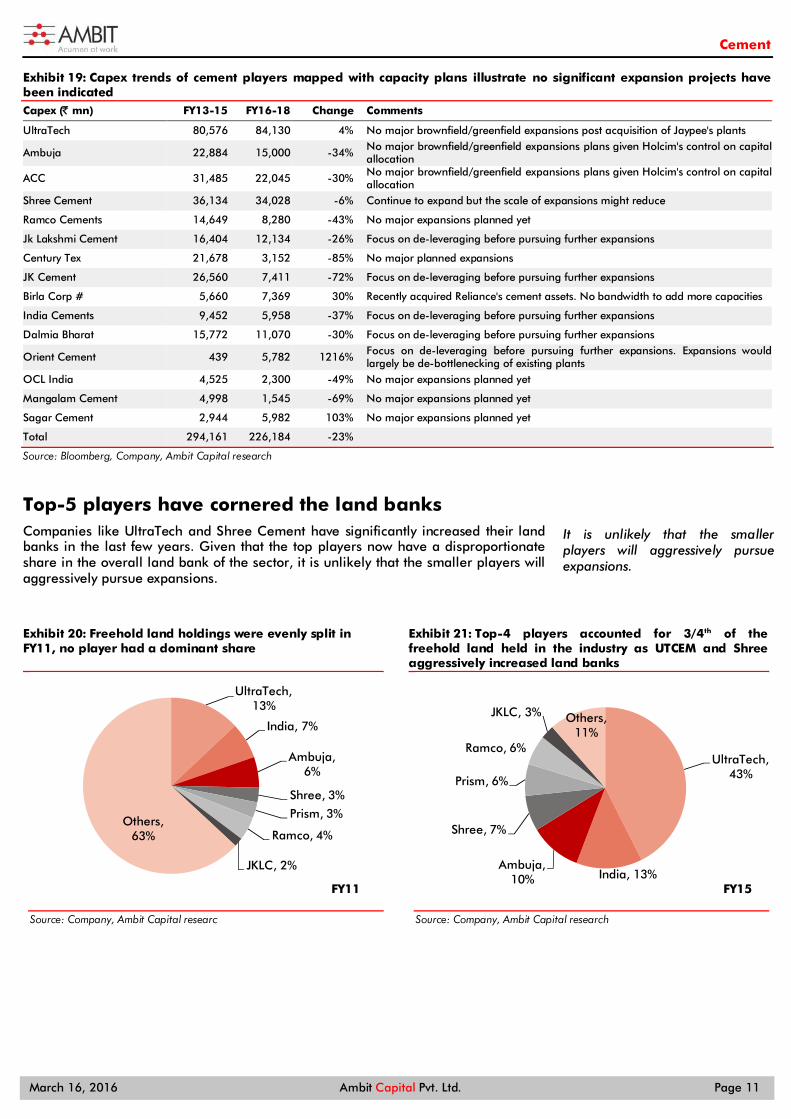
Capex trends of cement players mapped with capacity plans illustrate no significant expansion projects have Exhibit 19:been indicated Capex (̀ mn) FY13-15 FY16-18 Change Comments
UltraTech 80,576 84,130 4% No major brownfield/greenfield expansions post acquisition of Jaypee's plants
Ambuja 22,884 15,000 -34% No major brownfield/greenfield expansions plans given Holcim's control on capital allocation
ACC 31,485 22,045 -30% No major brownfield/greenfield expansions plans given Holcim's control on capital allocation
Shree Cement 36,134 34,028 -6% Continue to expand but the scale of expansions might reduce
Ramco Cements 14,649 8,280 -43% No major expansions planned yet
Jk Lakshmi Cement 16,404 12,134 -26% Focus on de-leveraging before pursuing further expansions
Century Tex 21,678 3,152 -85% No major planned expansions
JK Cement 26,560 7,411 -72% Focus on de-leveraging before pursuing further expansions
Birla Corp # 5,660 7,369 30% Recently acquired Reliance's cement assets. No bandwidth to add more capacities
India Cements 9,452 5,958 -37% Focus on de-leveraging before pursuing further expansions
Dalmia Bharat 15,772 11,070 -30% Focus on de-leveraging before pursuing further expansions
Orient Cement 439 5,782 1216% Focus on de-leveraging before pursuing further expansions. Expansions would largely be de-bottlenecking of existing plants
OCL India 4,525 2,300 -49% No major expansions planned yet
Mangalam Cement 4,998 1,545 -69% No major expansions planned yet
Sagar Cement 2,944 5,982 103% No major expansions planned yet
Total 294,161 226,184 -23% Source: Bloomberg, Company, Ambit Capital research
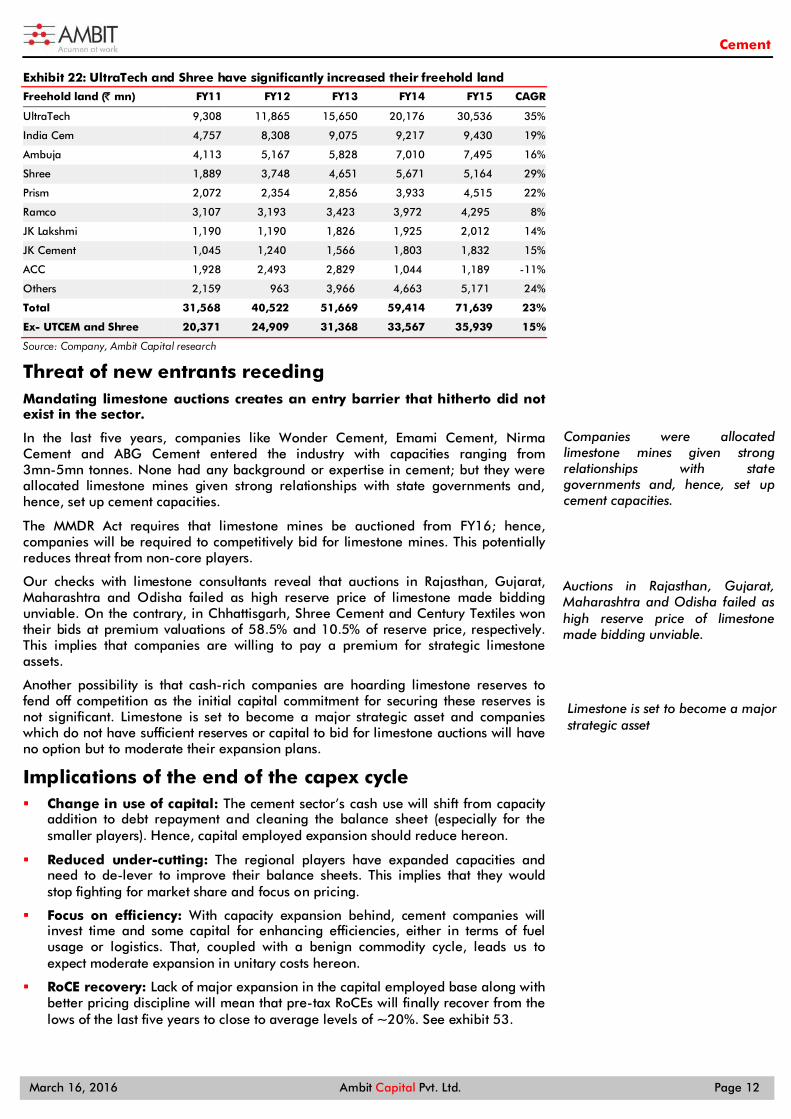
Top-5 players have cornered the land banks Companies like UltraTech and Shree Cement have significantly increased their land banks in the last few years. Given that the top players now have a disproportionate share in the overall land bank of the sector, it is unlikely that the smaller players will aggressively pursue expansions.
Freehold land holdings were evenly split in Exhibit 20:FY11, no player had a dominant share
Source: Company, Ambit Capital researc
Top-4 players accounted for 3/4th of the Exhibit 21:freehold land held in the industry as UTCEM and Shree aggressively increased land banks
Source: Company, Ambit Capital research
UltraTech, 13%
India, 7%
Ambuja, 6%
Shree, 3%
Prism, 3%
Ramco, 4%
JKLC, 2%
Others, 63%
FY11
UltraTech, 43%
India, 13%Ambuja,
10%
Shree, 7%
Prism, 6%
Ramco, 6%
JKLC, 3% Others, 11%
FY15
It is unlikely that the smaller players will aggressively pursue expansions.
Cement
March 16, 2016 Ambit Capital Pvt. Ltd. Page 12
UltraTech and Shree have significantly increased their freehold land Exhibit 22:
Freehold land (̀ mn) FY11 FY12 FY13 FY14 FY15 CAGR
UltraTech 9,308 11,865 15,650 20,176 30,536 35%
India Cem 4,757 8,308 9,075 9,217 9,430 19%
Ambuja 4,113 5,167 5,828 7,010 7,495 16%
Shree 1,889 3,748 4,651 5,671 5,164 29%
Prism 2,072 2,354 2,856 3,933 4,515 22%
Ramco 3,107 3,193 3,423 3,972 4,295 8%
JK Lakshmi 1,190 1,190 1,826 1,925 2,012 14%
JK Cement 1,045 1,240 1,566 1,803 1,832 15%
ACC 1,928 2,493 2,829 1,044 1,189 -11%
Others 2,159 963 3,966 4,663 5,171 24%
Total 31,568 40,522 51,669 59,414 71,639 23%
Ex- UTCEM and Shree 20,371 24,909 31,368 33,567 35,939 15%
Source: Company, Ambit Capital research
Threat of new entrants receding Mandating limestone auctions creates an entry barrier that hitherto did not exist in the sector.
In the last five years, companies like Wonder Cement, Emami Cement, Nirma Cement and ABG Cement entered the industry with capacities ranging from 3mn-5mn tonnes. None had any background or expertise in cement; but they were allocated limestone mines given strong relationships with state governments and, hence, set up cement capacities.
The MMDR Act requires that limestone mines be auctioned from FY16; hence, companies will be required to competitively bid for limestone mines. This potentially reduces threat from non-core players.
Our checks with limestone consultants reveal that auctions in Rajasthan, Gujarat, Maharashtra and Odisha failed as high reserve price of limestone made bidding unviable. On the contrary, in Chhattisgarh, Shree Cement and Century Textiles won their bids at premium valuations of 58.5% and 10.5% of reserve price, respectively. This implies that companies are willing to pay a premium for strategic limestone assets.
Another possibility is that cash-rich companies are hoarding limestone reserves to fend off competition as the initial capital commitment for securing these reserves is not significant. Limestone is set to become a major strategic asset and companies which do not have sufficient reserves or capital to bid for limestone auctions will have no option but to moderate their expansion plans.
Implications of the end of the capex cycle Change in use of capital: The cement sector’s cash use will shift from capacity
addition to debt repayment and cleaning the balance sheet (especially for the smaller players). Hence, capital employed expansion should reduce hereon.
Reduced under-cutting: The regional players have expanded capacities and need to de-lever to improve their balance sheets. This implies that they would stop fighting for market share and focus on pricing.
Focus on efficiency: With capacity expansion behind, cement companies will invest time and some capital for enhancing efficiencies, either in terms of fuel usage or logistics. That, coupled with a benign commodity cycle, leads us to expect moderate expansion in unitary costs hereon.
RoCE recovery: Lack of major expansion in the capital employed base along with better pricing discipline will mean that pre-tax RoCEs will finally recover from the lows of the last five years to close to average levels of ~20%. See exhibit 53.
Companies were allocated limestone mines given strong relationships with state governments and, hence, set up cement capacities.
Auctions in Rajasthan, Gujarat, Maharashtra and Odisha failed as high reserve price of limestone made bidding unviable.
Limestone is set to become a major strategic asset
Cement
March 16, 2016 Ambit Capital Pvt. Ltd. Page 13
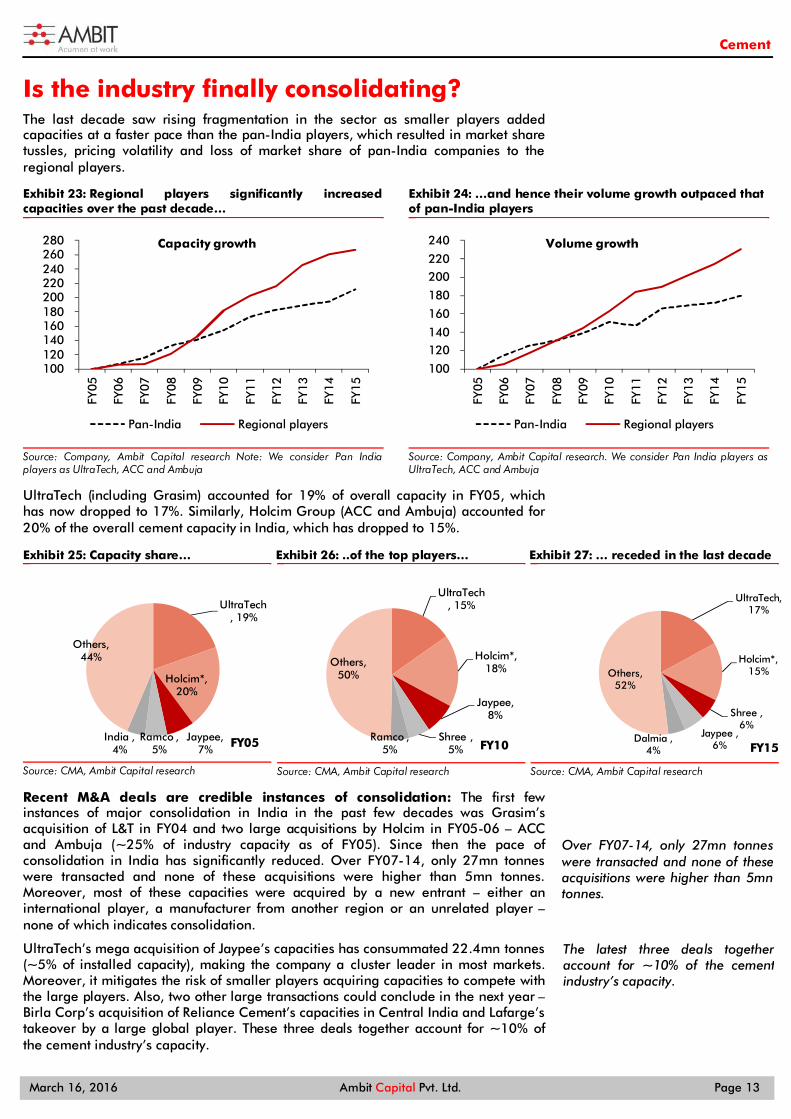
Is the industry finally consolidating? The last decade saw rising fragmentation in the sector as smaller players added capacities at a faster pace than the pan-India players, which resulted in market share tussles, pricing volatility and loss of market share of pan-India companies to the regional players.
Regional players significantly increased Exhibit 23:capacities over the past decade…
Source: Company, Ambit Capital research Note: We consider Pan India players as UltraTech, ACC and Ambuja
…and hence their volume growth outpaced that Exhibit 24:of pan-India players
Source: Company, Ambit Capital research. We consider Pan India players as UltraTech, ACC and Ambuja
UltraTech (including Grasim) accounted for 19% of overall capacity in FY05, which has now dropped to 17%. Similarly, Holcim Group (ACC and Ambuja) accounted for 20% of the overall cement capacity in India, which has dropped to 15%.
Capacity share… Exhibit 25:
Source: CMA, Ambit Capital research
..of the top players… Exhibit 26:
Source: CMA, Ambit Capital research
… receded in the last decade Exhibit 27:
Source: CMA, Ambit Capital research
Recent M&A deals are credible instances of consolidation: The first few instances of major consolidation in India in the past few decades was Grasim’s acquisition of L&T in FY04 and two large acquisitions by Holcim in FY05-06 – ACC and Ambuja (~25% of industry capacity as of FY05). Since then the pace of consolidation in India has significantly reduced. Over FY07-14, only 27mn tonnes were transacted and none of these acquisitions were higher than 5mn tonnes. Moreover, most of these capacities were acquired by a new entrant – either an international player, a manufacturer from another region or an unrelated player – none of which indicates consolidation.
UltraTech’s mega acquisition of Jaypee’s capacities has consummated 22.4mn tonnes (~5% of installed capacity), making the company a cluster leader in most markets. Moreover, it mitigates the risk of smaller players acquiring capacities to compete with the large players. Also, two other large transactions could conclude in the next year – Birla Corp’s acquisition of Reliance Cement’s capacities in Central India and Lafarge’s takeover by a large global player. These three deals together account for ~10% of the cement industry’s capacity.
100 120 140 160 180 200 220 240 260 280
FY05
FY06
FY07
FY08
FY09
FY10
FY11
FY12
FY13
FY14
FY15
Capacity growth
Pan-India Regional players
100
120 140
160
180
200 220
240
FY05
FY06
FY07
FY08
FY09
FY10
FY11
FY12
FY13
FY14
FY15
Volume growth
Pan-India Regional players
UltraTech, 19%
Holcim*, 20%
Jaypee, 7%
Ramco , 5%
India , 4%
Others, 44%
FY05
UltraTech, 15%
Holcim*, 18%
Jaypee, 8%
Shree , 5%
Ramco , 5%
Others, 50%
FY10
UltraTech, 17%
Holcim*, 15%
Shree , 6%
Jaypee , 6%
Dalmia , 4%
Others, 52%
FY15
Over FY07-14, only 27mn tonnes were transacted and none of these acquisitions were higher than 5mn tonnes.
The latest three deals together account for ~10% of the cement industry’s capacity.
Cement
March 16, 2016 Ambit Capital Pvt. Ltd. Page 14
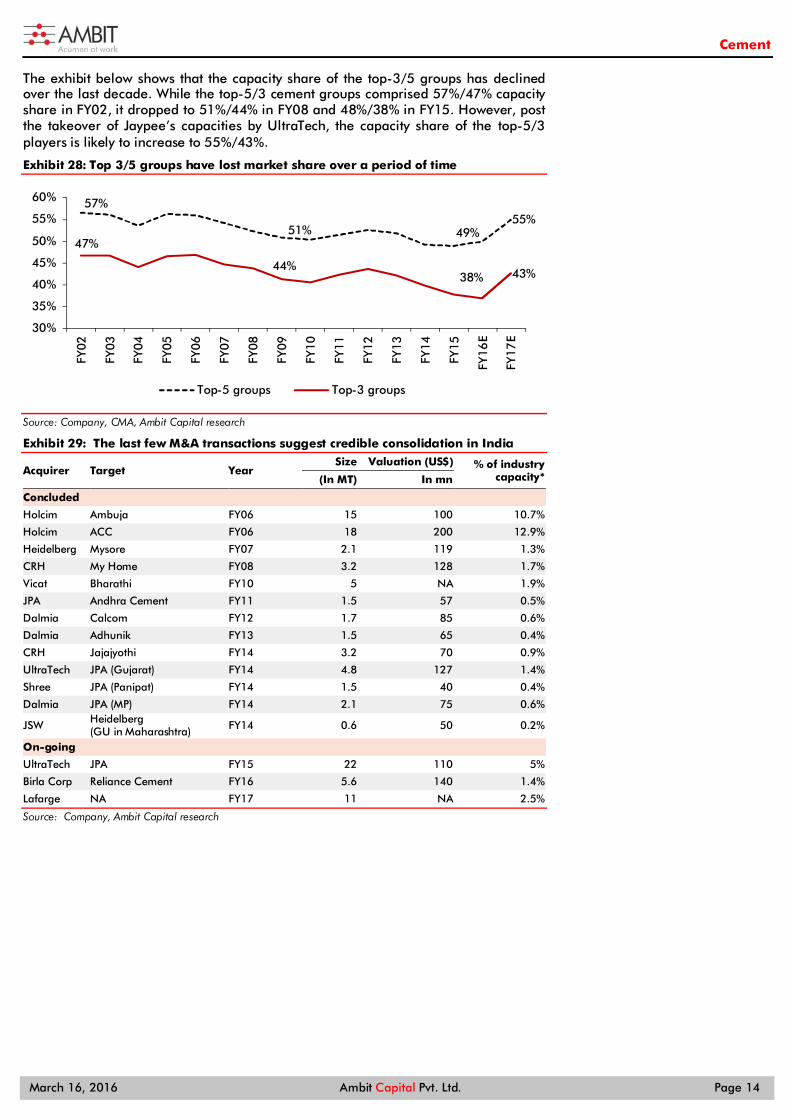
The exhibit below shows that the capacity share of the top-3/5 groups has declined over the last decade. While the top-5/3 cement groups comprised 57%/47% capacity share in FY02, it dropped to 51%/44% in FY08 and 48%/38% in FY15. However, post the takeover of Jaypee’s capacities by UltraTech, the capacity share of the top-5/3 players is likely to increase to 55%/43%.
Top 3/5 groups have lost market share over a period of time Exhibit 28:
Source: Company, CMA, Ambit Capital research
The last few M&A transactions suggest credible consolidation in India Exhibit 29:
Acquirer Target Year Size Valuation (US$) % of industry
capacity* (In MT) In mn
Concluded
Holcim Ambuja FY06 15 100 10.7%
Holcim ACC FY06 18 200 12.9%
Heidelberg Mysore FY07 2.1 119 1.3%
CRH My Home FY08 3.2 128 1.7%
Vicat Bharathi FY10 5 NA 1.9%
JPA Andhra Cement FY11 1.5 57 0.5%
Dalmia Calcom FY12 1.7 85 0.6%
Dalmia Adhunik FY13 1.5 65 0.4%
CRH Jajajyothi FY14 3.2 70 0.9%
UltraTech JPA (Gujarat) FY14 4.8 127 1.4%
Shree JPA (Panipat) FY14 1.5 40 0.4%
Dalmia JPA (MP) FY14 2.1 75 0.6%
JSW Heidelberg (GU in Maharashtra) FY14 0.6 50 0.2%
On-going
UltraTech JPA FY15 22 110 5%
Birla Corp Reliance Cement FY16 5.6 140 1.4%
Lafarge NA FY17 11 NA 2.5%
Source: Company, Ambit Capital research
57%
51% 49%55%
47%
44%38% 43%
30%
35%
40%
45%
50%
55%
60%
FY02
FY03
FY04
FY05
FY06
FY07
FY08
FY09
FY10
FY11
FY12
FY13
FY14
FY15
FY16
E
FY17
E
Top-5 groups Top-3 groups
Cement
March 16, 2016 Ambit Capital Pvt. Ltd. Page 15
UltraTech-Jaypee deal: More than meets the eye Apart from the obvious consolidation, we believe the deal will have significant implications for the industry:
Puts to rest scale ambition of smaller players
Scale enhancement of tier I brand bodes well for pricing in the Indian cement industry. Assuming that Jaypee’s capacities were sold piecemeal, a few regional players such as JSW Cement and Dalmia could have taken over some of the assets. This would have led to regional players gaining scale and aspiring for more (as seen in the past). Now, with one of the largest acquirable capacities out of the market, smaller players will have limited inorganic growth opportunities. Moreover, organic growth opportunities are anyways limited or long gestation due to difficulties in acquiring land and getting limestone leasing rights.
UltraTech’s pursuit of scale is largely satiated
UltraTech has continuously added capacity and significantly increased its land bank. However, for the first time since it was formed, UltraTech has front-loaded capex for the next 3-4 years, which will require debt intake and, hence, leave little headroom for organic capacities. UltraTech’s leadership in key markets, alongside a levered balance sheet, implies that the company will try to enforce discipline in the market rather than entering price wars.
Exit of a tier II, volume-focused brand
Jaypee did not invest in either building a strong brand or a distribution network. So, the only tool at its disposal for gaining market share was price war. Hence, the exit of Jaypee from Central and North India will improve pricing discipline in these markets.
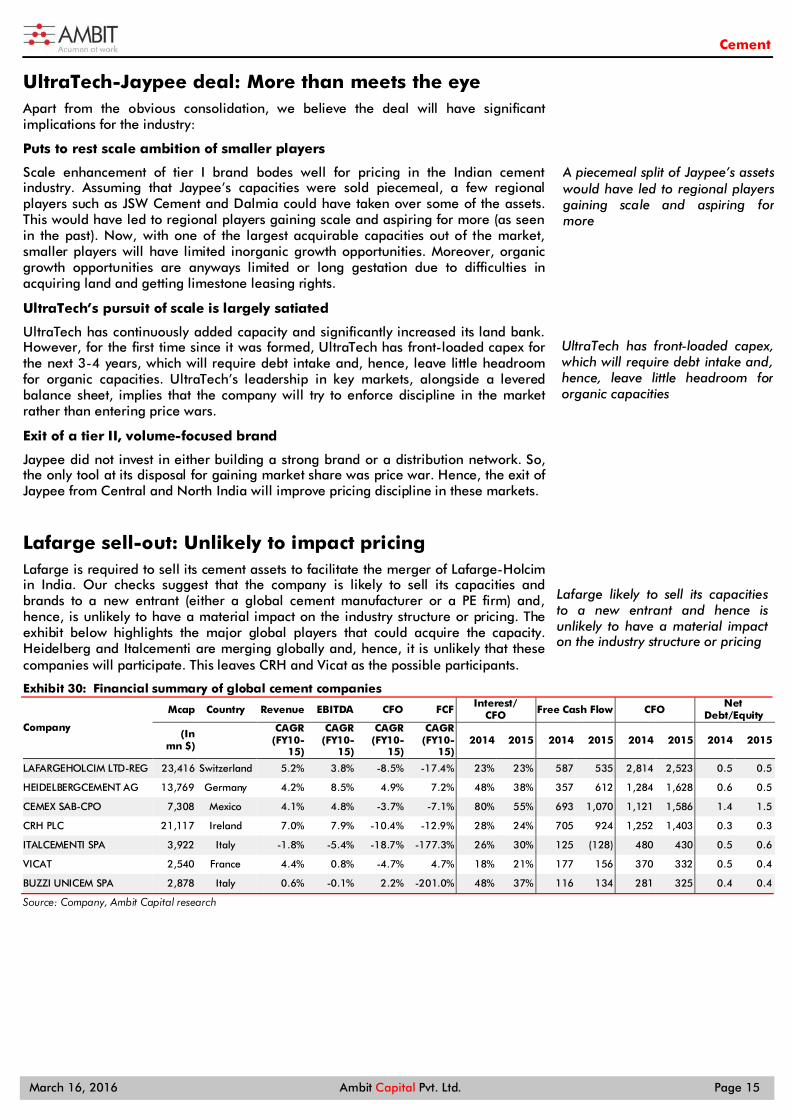
Lafarge sell-out: Unlikely to impact pricing Lafarge is required to sell its cement assets to facilitate the merger of Lafarge-Holcim in India. Our checks suggest that the company is likely to sell its capacities and brands to a new entrant (either a global cement manufacturer or a PE firm) and, hence, is unlikely to have a material impact on the industry structure or pricing. The exhibit below highlights the major global players that could acquire the capacity. Heidelberg and Italcementi are merging globally and, hence, it is unlikely that these companies will participate. This leaves CRH and Vicat as the possible participants.
Financial summary of global cement companies Exhibit 30:
Company
Mcap Country Revenue EBITDA CFO FCF Interest/
CFO Free Cash Flow CFO Net
Debt/Equity
(In mn $)
CAGR (FY10-
15)
CAGR (FY10-
15)
CAGR (FY10-
15)
CAGR (FY10-
15) 2014 2015 2014 2015 2014 2015 2014 2015
LAFARGEHOLCIM LTD-REG 23,416 Switzerland 5.2% 3.8% -8.5% -17.4% 23% 23% 587 535 2,814 2,523 0.5 0.5
HEIDELBERGCEMENT AG 13,769 Germany 4.2% 8.5% 4.9% 7.2% 48% 38% 357 612 1,284 1,628 0.6 0.5
CEMEX SAB-CPO 7,308 Mexico 4.1% 4.8% -3.7% -7.1% 80% 55% 693 1,070 1,121 1,586 1.4 1.5
CRH PLC 21,117 Ireland 7.0% 7.9% -10.4% -12.9% 28% 24% 705 924 1,252 1,403 0.3 0.3
ITALCEMENTI SPA 3,922 Italy -1.8% -5.4% -18.7% -177.3% 26% 30% 125 (128) 480 430 0.5 0.6
VICAT 2,540 France 4.4% 0.8% -4.7% 4.7% 18% 21% 177 156 370 332 0.5 0.4
BUZZI UNICEM SPA 2,878 Italy 0.6% -0.1% 2.2% -201.0% 48% 37% 116 134 281 325 0.4 0.4
Source: Company, Ambit Capital research
A piecemeal split of Jaypee’s assets would have led to regional players gaining scale and aspiring for more
UltraTech has front-loaded capex, which will require debt intake and, hence, leave little headroom for organic capacities
Lafarge likely to sell its capacities to a new entrant and hence is unlikely to have a material impact on the industry structure or pricing
Cement
March 16, 2016 Ambit Capital Pvt. Ltd. Page 16
Demand growth could retrace to 6-8% Cement demand growth in FY16 is likely to be the lowest in the last decade (~3%). As mentioned in several of our recent notes (click here), decline in rural cement demand, lack of significant growth in urban housing, and absence of a major infrastructure-led demand recovery are the key reasons for the weak demand scenario.
Rural demand is likely to pick up from a low base and execution of road and railway projects could also contribute to improvement in volume growth. Other segments will take some time to recover and, hence, restrict overall volume growth for the industry. The real estate slowdown and aversion of Indian corporates to invest (either due to leverage or over-capacity) will be deterrents to runaway volume growth over the next 2-3 years. Hence, overall demand growth is likely to be in the range of 6-8% until FY18E which is materially higher that 3-5% for last few years
Our view on the demand components Rural housing: The Government’s focus on reviving the rural economy will have a direct impact on rural housing construction and, thereby, cement demand. Volume contribution from this segment could grow in high-single-digits and add 150-200bps to volume growth of the industry. More details on rural growth in the following section.
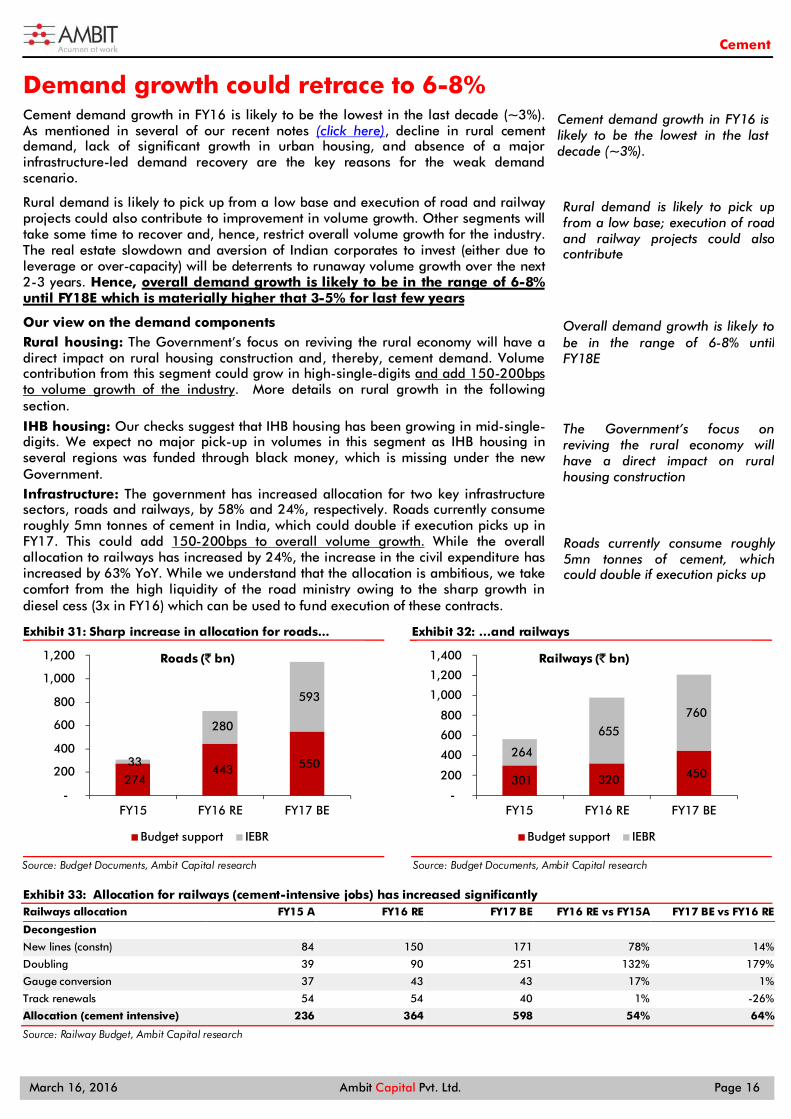
IHB housing: Our checks suggest that IHB housing has been growing in mid-single-digits. We expect no major pick-up in volumes in this segment as IHB housing in several regions was funded through black money, which is missing under the new Government. Infrastructure: The government has increased allocation for two key infrastructure sectors, roads and railways, by 58% and 24%, respectively. Roads currently consume roughly 5mn tonnes of cement in India, which could double if execution picks up in FY17. This could add 150-200bps to overall volume growth. While the overall allocation to railways has increased by 24%, the increase in the civil expenditure has increased by 63% YoY. While we understand that the allocation is ambitious, we take comfort from the high liquidity of the road ministry owing to the sharp growth in diesel cess (3x in FY16) which can be used to fund execution of these contracts.
Sharp increase in allocation for roads... Exhibit 31:
Source: Budget Documents, Ambit Capital research
…and railways Exhibit 32:
Source: Budget Documents, Ambit Capital research
Allocation for railways (cement-intensive jobs) has increased significantly Exhibit 33:Railways allocation FY15 A FY16 RE FY17 BE FY16 RE vs FY15A FY17 BE vs FY16 RE
Decongestion New lines (constn) 84 150 171 78% 14%
Doubling 39 90 251 132% 179%
Gauge conversion 37 43 43 17% 1%
Track renewals 54 54 40 1% -26%
Allocation (cement intensive) 236 364 598 54% 64%
Source: Railway Budget, Ambit Capital research
274 443 550 33
280
593
-
200
400
600
800
1,000
1,200
FY15 FY16 RE FY17 BE
Roads (` bn)
Budget support IEBR
301 320 450
264
655
760
-
200
400
600
800
1,000
1,200
1,400
FY15 FY16 RE FY17 BE
Railways (` bn)
Budget support IEBR
Cement demand growth in FY16 is likely to be the lowest in the last decade (~3%).
Rural demand is likely to pick up from a low base; execution of road and railway projects could also contribute
Overall demand growth is likely to be in the range of 6-8% until FY18E
The Government’s focus on reviving the rural economy will have a direct impact on rural housing construction
Roads currently consume roughly 5mn tonnes of cement, which could double if execution picks up
Cement
March 16, 2016 Ambit Capital Pvt. Ltd. Page 17
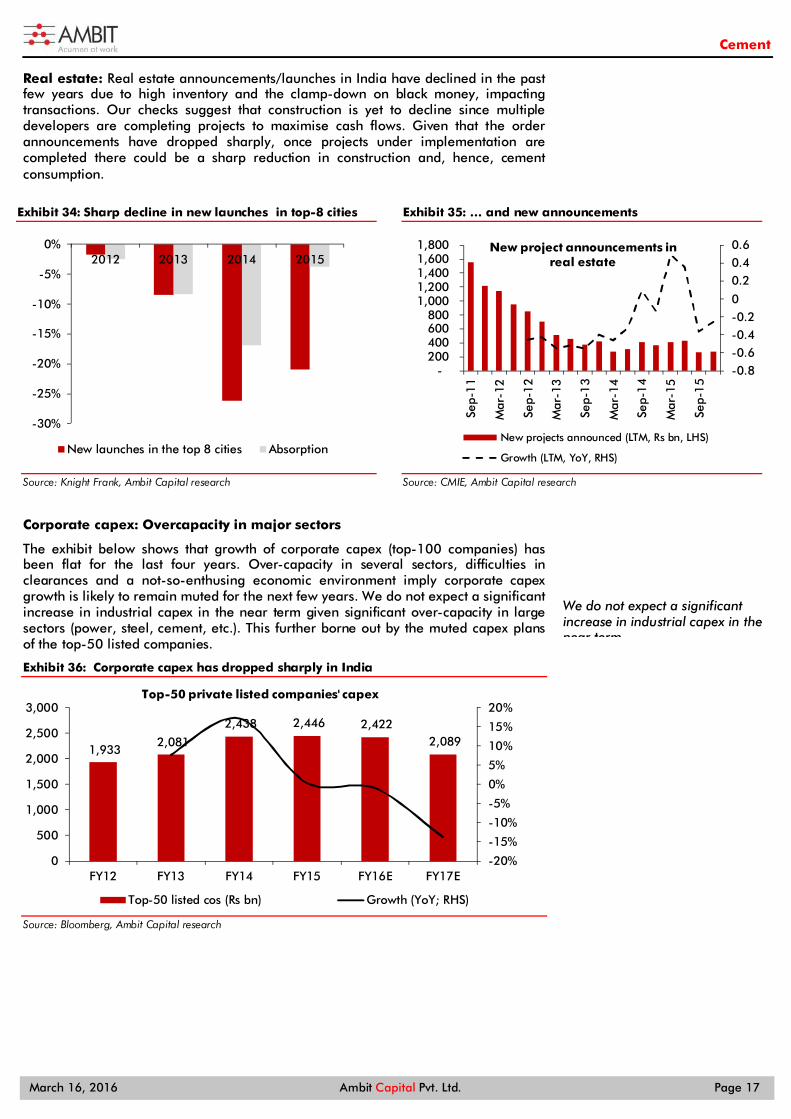
Real estate: Real estate announcements/launches in India have declined in the past few years due to high inventory and the clamp-down on black money, impacting transactions. Our checks suggest that construction is yet to decline since multiple developers are completing projects to maximise cash flows. Given that the order announcements have dropped sharply, once projects under implementation are completed there could be a sharp reduction in construction and, hence, cement consumption.
Corporate capex: Overcapacity in major sectors
The exhibit below shows that growth of corporate capex (top-100 companies) has been flat for the last four years. Over-capacity in several sectors, difficulties in clearances and a not-so-enthusing economic environment imply corporate capex growth is likely to remain muted for the next few years. We do not expect a significant increase in industrial capex in the near term given significant over-capacity in large sectors (power, steel, cement, etc.). This further borne out by the muted capex plans of the top-50 listed companies.
Corporate capex has dropped sharply in India Exhibit 36:
Source: Bloomberg, Ambit Capital research
1,933 2,081
2,438 2,446 2,422 2,089
-20%
-15%
-10%
-5%
0%
5%
10%
15%
20%
0
500
1,000
1,500
2,000
2,500
3,000
FY12 FY13 FY14 FY15 FY16E FY17E
Top-50 private listed companies' capex
Top-50 listed cos (Rs bn) Growth (YoY; RHS)
Sharp decline in new launches in top-8 cities Exhibit 34:
Source: Knight Frank, Ambit Capital research
… and new announcements Exhibit 35:
Source: CMIE, Ambit Capital research
We do not expect a significant increase in industrial capex in the near term
-30%
-25%
-20%
-15%
-10%
-5%
0%2012 2013 2014 2015
New launches in the top 8 cities Absorption
-0.8-0.6-0.4-0.20
0.20.40.6
- 200 400 600 800
1,000 1,200 1,400 1,600 1,800
Sep-
11
Mar
-12
Sep-
12
Mar
-13
Sep-
13
Mar
-14
Sep-
14
Mar
-15
Sep-
15
New project announcements in real estate
New projects announced (LTM, Rs bn, LHS)
Growth (LTM, YoY, RHS)
Cement
March 16, 2016 Ambit Capital Pvt. Ltd. Page 18
The retail consumer to the rescue 2.0 In our thematic note dated 19 Dec 2011, we highlighted that strong retail demand has a significant bearing on cement prices as the bargaining power of tier I brands strengthens over the regional players. Below is an excerpt from it:
“Low demand from bulk-buying-price-bargaining institutional clients and steady demand from the fragmented-low-bargaining-power brand-seeking Individual House Builder (IHB) is helping producers raise cement prices higher despite lower industry utilisation. Pricing power with the IHB consumer base will limit the drop in RoCEs and maintain strong cash flows for the larger players, thus supporting premium valuations and relative outperformance.”
From Ambit’s cement thematic
Understanding rural housing Rural housing can be divided into two parts: Self-construction – kutcha to pucca: Largely dependent on normal monsoons and crop prices. Housing construction/upgradation is the second-largest expenditure of rural households. The order is as follows: (a) reinvestment in farm, (b) housing and (c) marriage. Non-farm income (construction jobs in roads, factories, real estate) also has a significant impact on rural housing. This accounts for 85% of the overall rural housing expenditure in India. Rural schemes (15% of overall rural housing): The three key rural schemes which impact cement consumption are Indira Aawas Yojana, MNREGA and PMGSY. These together account for 15% of overall rural housing expenditure in India, with IAY alone accounting for 12.5% Impact of rural housing on cement
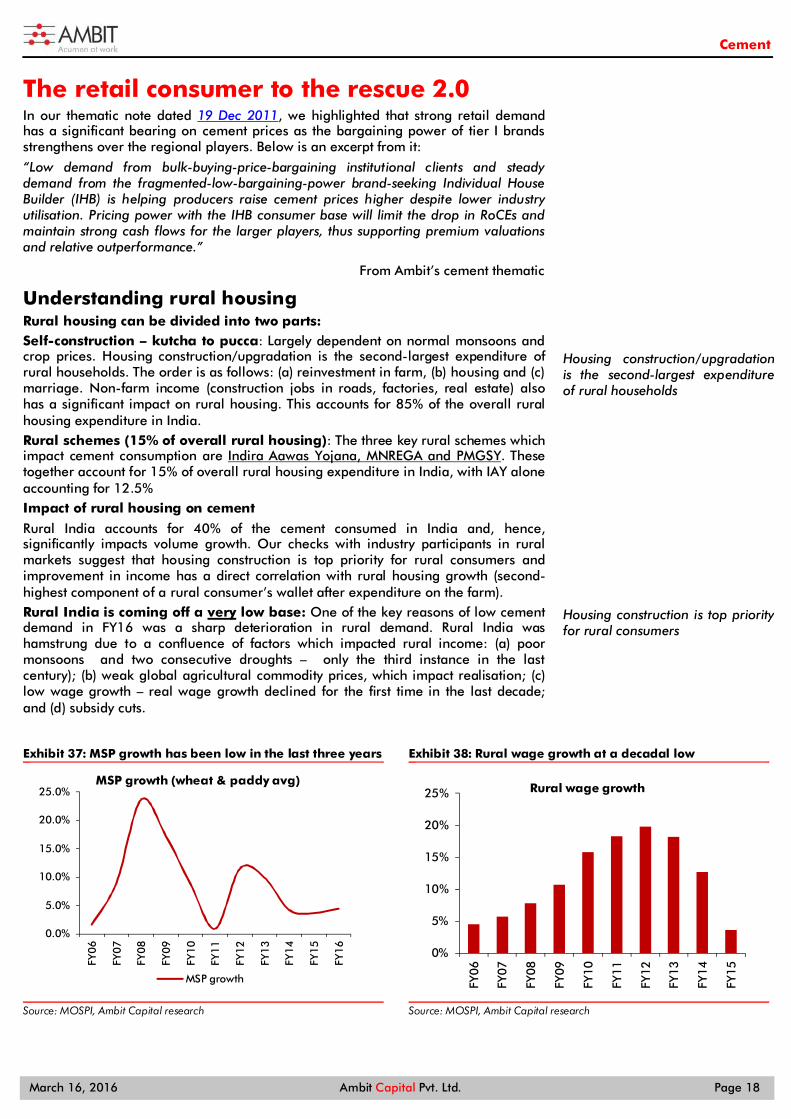
Rural India accounts for 40% of the cement consumed in India and, hence, significantly impacts volume growth. Our checks with industry participants in rural markets suggest that housing construction is top priority for rural consumers and improvement in income has a direct correlation with rural housing growth (second-highest component of a rural consumer’s wallet after expenditure on the farm). Rural India is coming off a very low base: One of the key reasons of low cement demand in FY16 was a sharp deterioration in rural demand. Rural India was hamstrung due to a confluence of factors which impacted rural income: (a) poor monsoons and two consecutive droughts – only the third instance in the last century); (b) weak global agricultural commodity prices, which impact realisation; (c) low wage growth – real wage growth declined for the first time in the last decade; and (d) subsidy cuts.
MSP growth has been low in the last three years Exhibit 37:
Source: MOSPI, Ambit Capital research
Rural wage growth at a decadal low Exhibit 38:
Source: MOSPI, Ambit Capital research
0.0%
5.0%
10.0%
15.0%
20.0%
25.0%
FY06
FY07
FY08
FY09
FY10
FY11
FY12
FY13
FY14
FY15
FY16
MSP growth (wheat & paddy avg)
MSP growth
0%
5%
10%
15%
20%
25%
FY06
FY07
FY08
FY09
FY10
FY11
FY12
FY13
FY14
FY15
Rural wage growth
Housing construction/upgradation is the second-largest expenditure of rural households
Housing construction is top priority for rural consumers
Cement
March 16, 2016 Ambit Capital Pvt. Ltd. Page 19
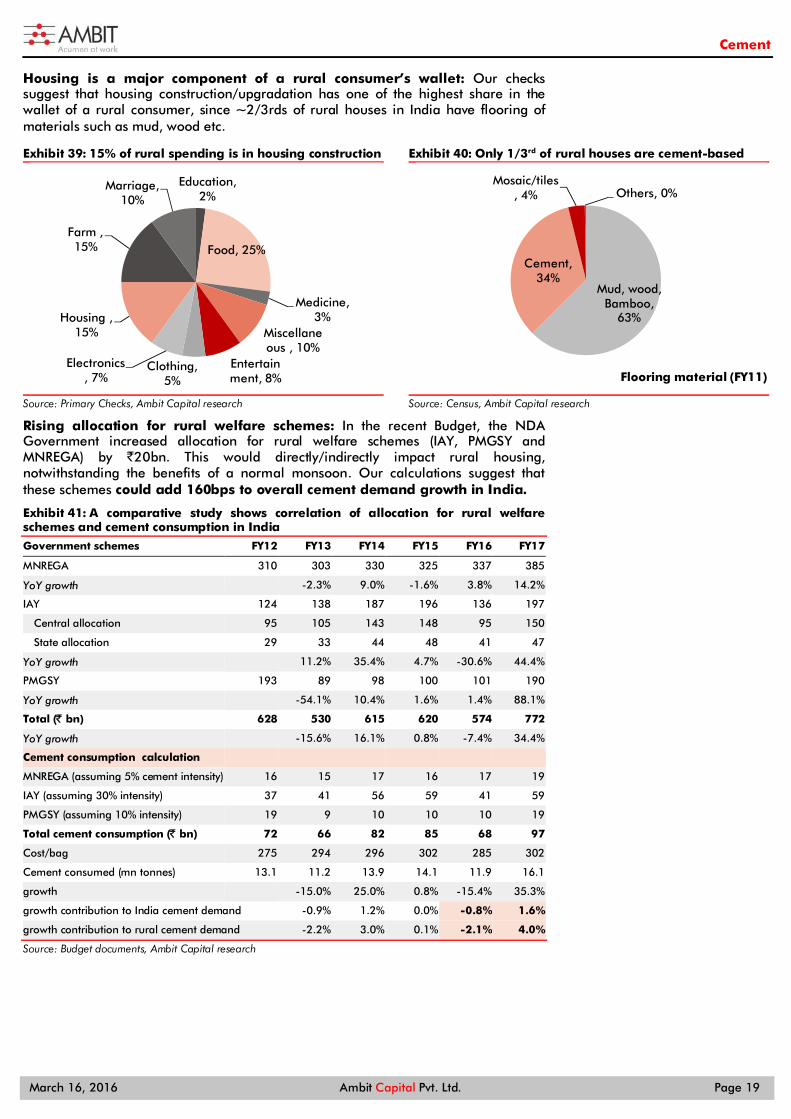
Housing is a major component of a rural consumer’s wallet: Our checks suggest that housing construction/upgradation has one of the highest share in the wallet of a rural consumer, since ~2/3rds of rural houses in India have flooring of materials such as mud, wood etc.
15% of rural spending is in housing construction Exhibit 39:
Source: Primary Checks, Ambit Capital research
Only 1/3rd of rural houses are cement-based Exhibit 40:
Source: Census, Ambit Capital research
Rising allocation for rural welfare schemes: In the recent Budget, the NDA Government increased allocation for rural welfare schemes (IAY, PMGSY and MNREGA) by `20bn. This would directly/indirectly impact rural housing, notwithstanding the benefits of a normal monsoon. Our calculations suggest that these schemes could add 160bps to overall cement demand growth in India.
A comparative study shows correlation of allocation for rural welfare Exhibit 41:schemes and cement consumption in India
Government schemes FY12 FY13 FY14 FY15 FY16 FY17
MNREGA 310 303 330 325 337 385
YoY growth -2.3% 9.0% -1.6% 3.8% 14.2%
IAY 124 138 187 196 136 197
Central allocation 95 105 143 148 95 150
State allocation 29 33 44 48 41 47
YoY growth 11.2% 35.4% 4.7% -30.6% 44.4%
PMGSY 193 89 98 100 101 190
YoY growth -54.1% 10.4% 1.6% 1.4% 88.1%
Total (̀ bn) 628 530 615 620 574 772
YoY growth -15.6% 16.1% 0.8% -7.4% 34.4%
Cement consumption calculation MNREGA (assuming 5% cement intensity) 16 15 17 16 17 19
IAY (assuming 30% intensity) 37 41 56 59 41 59
PMGSY (assuming 10% intensity) 19 9 10 10 10 19
Total cement consumption (̀ bn) 72 66 82 85 68 97
Cost/bag 275 294 296 302 285 302
Cement consumed (mn tonnes) 13.1 11.2 13.9 14.1 11.9 16.1
growth -15.0% 25.0% 0.8% -15.4% 35.3%
growth contribution to India cement demand -0.9% 1.2% 0.0% -0.8% 1.6%
growth contribution to rural cement demand -2.2% 3.0% 0.1% -2.1% 4.0%
Source: Budget documents, Ambit Capital research
Education, 2%
Food, 25%
Medicine, 3%
Miscellaneous , 10%
Entertainment, 8%
Clothing, 5%
Electronics, 7%
Housing , 15%
Farm , 15%
Marriage, 10%
Mud, wood, Bamboo,
63%
Cement, 34%
Mosaic/tiles, 4% Others, 0%
Flooring material (FY11)
Cement
March 16, 2016 Ambit Capital Pvt. Ltd. Page 20
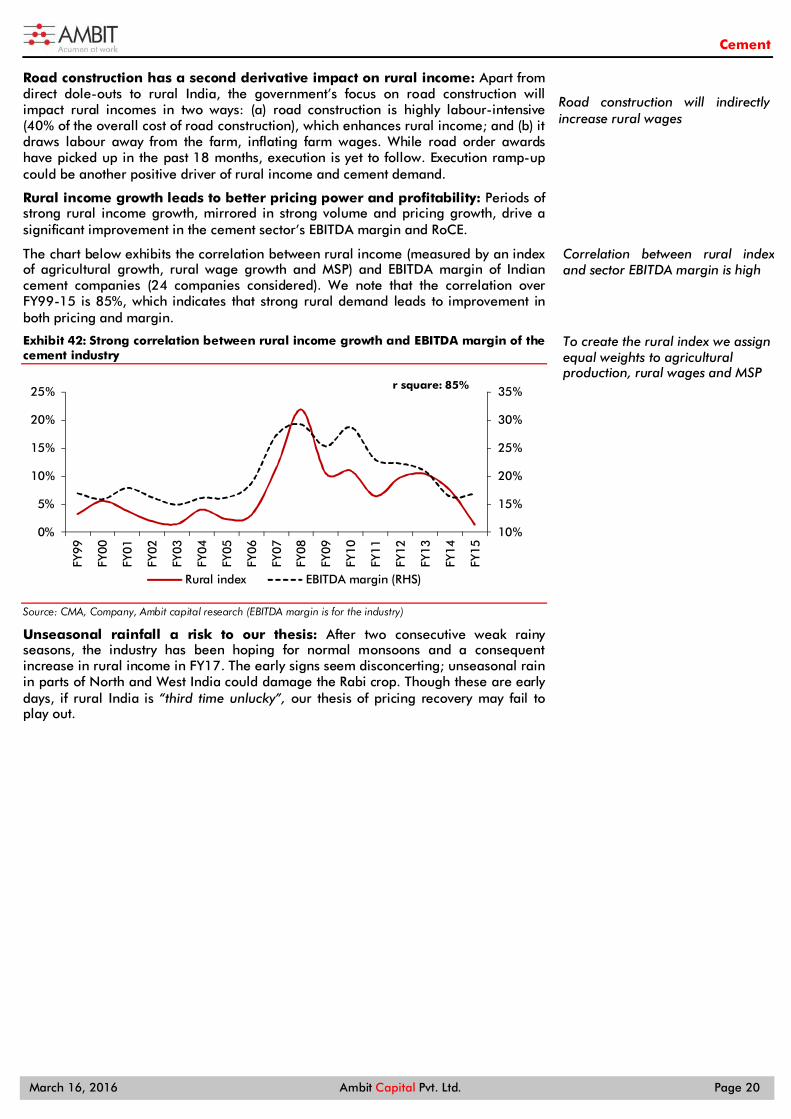
Road construction has a second derivative impact on rural income: Apart from direct dole-outs to rural India, the government’s focus on road construction will impact rural incomes in two ways: (a) road construction is highly labour-intensive (40% of the overall cost of road construction), which enhances rural income; and (b) it draws labour away from the farm, inflating farm wages. While road order awards have picked up in the past 18 months, execution is yet to follow. Execution ramp-up could be another positive driver of rural income and cement demand.
Rural income growth leads to better pricing power and profitability: Periods of strong rural income growth, mirrored in strong volume and pricing growth, drive a significant improvement in the cement sector’s EBITDA margin and RoCE.
The chart below exhibits the correlation between rural income (measured by an index of agricultural growth, rural wage growth and MSP) and EBITDA margin of Indian cement companies (24 companies considered). We note that the correlation over FY99-15 is 85%, which indicates that strong rural demand leads to improvement in both pricing and margin.
Strong correlation between rural income growth and EBITDA margin of the Exhibit 42:cement industry
Source: CMA, Company, Ambit capital research (EBITDA margin is for the industry)
Unseasonal rainfall a risk to our thesis: After two consecutive weak rainy seasons, the industry has been hoping for normal monsoons and a consequent increase in rural income in FY17. The early signs seem disconcerting; unseasonal rain in parts of North and West India could damage the Rabi crop. Though these are early days, if rural India is “third time unlucky”, our thesis of pricing recovery may fail to play out.
10%
15%
20%
25%
30%
35%
0%
5%
10%
15%
20%
25%
FY99
FY00
FY01
FY02
FY03
FY04
FY05
FY06
FY07
FY08
FY09
FY10
FY11
FY12
FY13
FY14
FY15
r square: 85%
Rural index EBITDA margin (RHS)
Road construction will indirectly increase rural wages
Correlation between rural index and sector EBITDA margin is high
To create the rural index we assign equal weights to agricultural production, rural wages and MSP
Cement
March 16, 2016 Ambit Capital Pvt. Ltd. Page 21
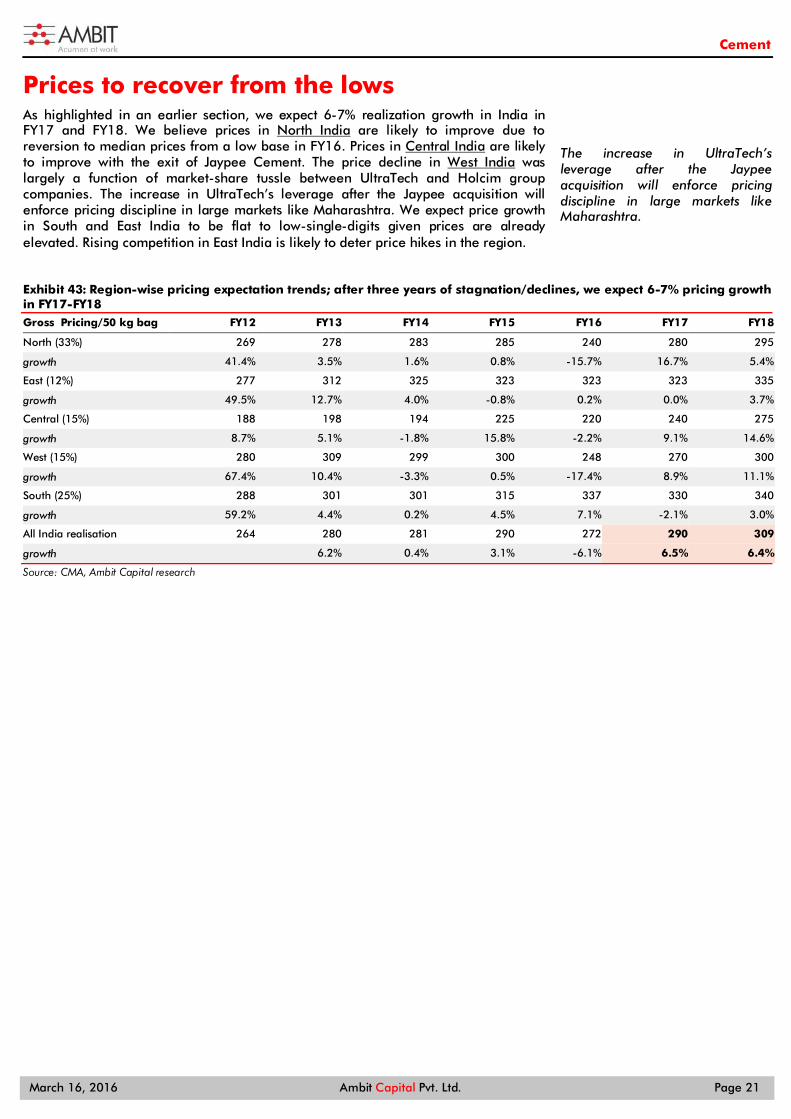
Prices to recover from the lows As highlighted in an earlier section, we expect 6-7% realization growth in India in FY17 and FY18. We believe prices in North India are likely to improve due to reversion to median prices from a low base in FY16. Prices in Central India are likely to improve with the exit of Jaypee Cement. The price decline in West India was largely a function of market-share tussle between UltraTech and Holcim group companies. The increase in UltraTech’s leverage after the Jaypee acquisition will enforce pricing discipline in large markets like Maharashtra. We expect price growth in South and East India to be flat to low-single-digits given prices are already elevated. Rising competition in East India is likely to deter price hikes in the region.
Region-wise pricing expectation trends; after three years of stagnation/declines, we expect 6-7% pricing growth Exhibit 43:in FY17-FY18 Gross Pricing/50 kg bag FY12 FY13 FY14 FY15 FY16 FY17 FY18
North (33%) 269 278 283 285 240 280 295
growth 41.4% 3.5% 1.6% 0.8% -15.7% 16.7% 5.4%
East (12%) 277 312 325 323 323 323 335
growth 49.5% 12.7% 4.0% -0.8% 0.2% 0.0% 3.7%
Central (15%) 188 198 194 225 220 240 275
growth 8.7% 5.1% -1.8% 15.8% -2.2% 9.1% 14.6%
West (15%) 280 309 299 300 248 270 300
growth 67.4% 10.4% -3.3% 0.5% -17.4% 8.9% 11.1%
South (25%) 288 301 301 315 337 330 340
growth 59.2% 4.4% 0.2% 4.5% 7.1% -2.1% 3.0%
All India realisation 264 280 281 290 272 290 309
growth 6.2% 0.4% 3.1% -6.1% 6.5% 6.4%
Source: CMA, Ambit Capital research
The increase in UltraTech’s leverage after the Jaypee acquisition will enforce pricing discipline in large markets like Maharashtra.

Cement
March 16, 2016 Ambit Capital Pvt. Ltd. Page 22
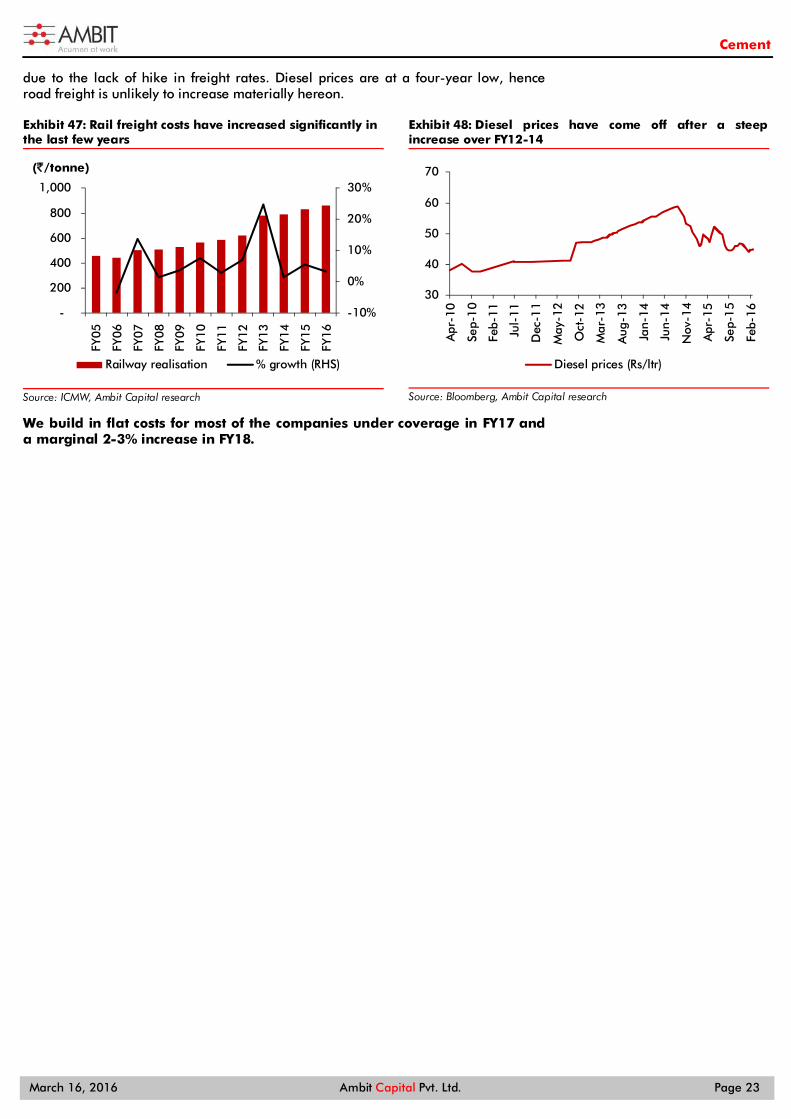
Costs – headwinds receding Operating costs for the Indian cement industry have increased materially in the past five years and especially over FY11-13 when a sharp rise in international coal costs inflated power and fuel costs.
The Indian government increased freight rates in each of the last five years, which inflated transportation costs for cement manufacturers, especially for players like ACC that are highly dependent on rail freight.
The chart below shows power & fuel (P&F) and freight costs, measured using an index of 11 companies, accounting for 60% of the industry’s capacities/volumes, registered 9% and 14% CAGR respectively over FY09-15. However, in 9MFY16, P&F costs fell by 15% while freight declined fell by 2%.
Sharp increase in key cost elements Exhibit 44:
Source: Company, Ambit Capital research. The above is an average of 11 cement companies - UltraTech,ACEM, ACC, Shree, JKLC, Mangalam, Ramco, ICEM, JKCE, Sagar, HEID
Power & fuel costs: The global commodity downcycle decreased international coal and petcoke costs significantly in the last two years. YTD, petcoke and international coal costs are down 35% and 10% respectively. Moreover, prices of domestic coal remains stable given Coal India’s agenda to increase production and lower demand from domestic power producers. In such a scenario, it is highly likely that fuel prices remain benign for the next 1- 2 years, which can support EBITDA/tonne expansion.
Petcoke costs declined by 35% in FY16 Exhibit 45:
Source: ICMW, Ambit Capital research
International coal prices down 10% YTD Exhibit 46:
Source: Bloomberg, Ambit Capital research
Freight costs: For the first time in last 10 years, the Government has kept rail freight rate unchanged in its budget. The exhibit below shows rail freight realisation of the Government clocked an 11% CAGR over FY10-13 due to significant hikes in those years. Realisations have been at 3% over FY13-FY16 and are likely to recede further
627 610 771 881 917 911 1,041 887
469 490 646
739 869 952 1,011
990
-
500
1,000
1,500
2,000
2,500
FY09 FY10 FY11 FY12 FY13 FY14 FY15 9MFY16
(`/tonne)
P&F Freight
3,000
3,500
4,000
4,500
5,000
5,500
6,000
6,500
7,000
Aug
-14
Oct
-14
Dec
-14
Feb-
15
Apr
-15
Jun-
15
Aug
-15
Oct
-15
Dec
-15
Feb-
16
1,500
1,800
2,100
2,400
2,700
3,000
3,300
Mar
-09
Sep-
09
Mar
-10
Sep-
10
Mar
-11
Sep-
11
Mar
-12
Sep-
12
Mar
-13
Sep-
13
Mar
-14
Sep-
14
Mar
-15
Sep-
15
Mar
-16
Indonesian coal (`/tonne)
It is highly likely that fuel prices remain benign for the next 1- 2 years, which can support EBITDA/tonne expansion.
Diesel prices are at a four-year low, hence road freight is unlikely to increase materially hereon.
Cement
March 16, 2016 Ambit Capital Pvt. Ltd. Page 23
due to the lack of hike in freight rates. Diesel prices are at a four-year low, hence road freight is unlikely to increase materially hereon.
Rail freight costs have increased significantly in Exhibit 47:the last few years
Source: ICMW, Ambit Capital research
Diesel prices have come off after a steep Exhibit 48:increase over FY12-14
Source: Bloomberg, Ambit Capital research
We build in flat costs for most of the companies under coverage in FY17 and a marginal 2-3% increase in FY18.
-10%
0%
10%
20%
30%
-
200
400
600
800
1,000
FY0
5
FY0
6
FY0
7
FY0
8
FY0
9
FY1
0
FY1
1
FY1
2
FY1
3
FY1
4
FY1
5
FY1
6
(`/tonne)
Railway realisation % growth (RHS)
30
40
50
60
70
Apr
-10
Sep-
10
Feb-
11
Jul-
11
Dec
-11
May
-12
Oct
-12
Mar
-13
Aug
-13
Jan-
14
Jun-
14
Nov
-14
Apr
-15
Sep-
15
Feb-
16
Diesel prices (Rs/ltr)
Cement
March 16, 2016 Ambit Capital Pvt. Ltd. Page 24
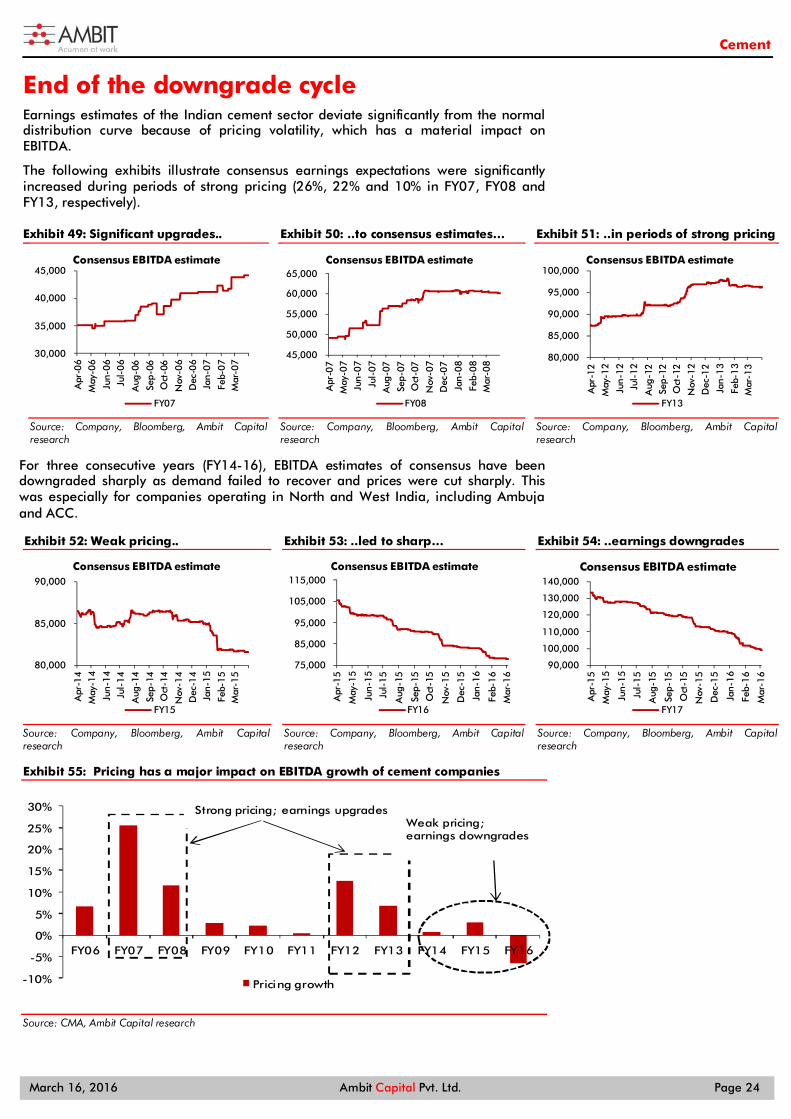
End of the downgrade cycle Earnings estimates of the Indian cement sector deviate significantly from the normal distribution curve because of pricing volatility, which has a material impact on EBITDA.
The following exhibits illustrate consensus earnings expectations were significantly increased during periods of strong pricing (26%, 22% and 10% in FY07, FY08 and FY13, respectively).
Significant upgrades.. Exhibit 49:
Source: Company, Bloomberg, Ambit Capital research
..to consensus estimates… Exhibit 50:
Source: Company, Bloomberg, Ambit Capital research
..in periods of strong pricing Exhibit 51:
Source: Company, Bloomberg, Ambit Capital research
For three consecutive years (FY14-16), EBITDA estimates of consensus have been downgraded sharply as demand failed to recover and prices were cut sharply. This was especially for companies operating in North and West India, including Ambuja and ACC.
Weak pricing.. Exhibit 52:
Source: Company, Bloomberg, Ambit Capital research
..led to sharp… Exhibit 53:
Source: Company, Bloomberg, Ambit Capital research
..earnings downgrades Exhibit 54:
Source: Company, Bloomberg, Ambit Capital research
Pricing has a major impact on EBITDA growth of cement companies Exhibit 55:
Source: CMA, Ambit Capital research
30,000
35,000
40,000
45,000
Apr
-06
May
-06
Jun-
06
Jul-
06
Aug
-06
Sep-
06O
ct-0
6
Nov
-06
Dec
-06
Jan-
07
Feb-
07
Mar
-07
Consensus EBITDA estimate
FY07
45,000
50,000
55,000
60,000
65,000
Apr
-07
May
-07
Jun-0
7
Jul-
07
Aug
-07
Sep-0
7O
ct-0
7
Nov
-07
Dec
-07
Jan-0
8
Feb-
08
Mar
-08
Consensus EBITDA estimate
FY08
80,000
85,000
90,000
95,000
100,000
Apr
-12
May
-12
Jun-
12
Jul-
12
Aug
-12
Sep-
12O
ct-1
2
Nov
-12
Dec
-12
Jan-
13
Feb-
13
Mar
-13
Consensus EBITDA estimate
FY13
80,000
85,000
90,000
Apr
-14
May
-14
Jun-
14
Jul-
14
Aug
-14
Sep-
14O
ct-1
4
Nov
-14
Dec
-14
Jan-
15
Feb-
15
Mar
-15
Consensus EBITDA estimate
FY15
75,000
85,000
95,000
105,000
115,000
Apr
-15
May
-15
Jun-
15
Jul-
15
Aug
-15
Sep-
15
Oct
-15
Nov
-15
Dec
-15
Jan-
16
Feb-
16
Mar
-16
Consensus EBITDA estimate
FY16
90,000
100,000
110,000
120,000
130,000
140,000A
pr-1
5
May
-15
Jun-
15
Jul-
15
Aug
-15
Sep-
15
Oct
-15
Nov
-15
Dec
-15
Jan-
16
Feb-
16
Mar
-16
Consensus EBITDA estimate
FY17
-10%
-5%
0%
5%
10%
15%
20%
25%
30%
FY06 FY07 FY08 FY09 FY10 FY11 FY12 FY13 FY14 FY15 FY16
Pricing growth
Strong pricing; earnings upgradesWeak pricing; earnings downgrades
Cement
March 16, 2016 Ambit Capital Pvt. Ltd. Page 25
Valuations – what has changed? The first question investors are likely to ask us is – after finding valuations expensive for the past three-and-a-half years why suddenly a change of heart?
In our cement thematic note last year, we questioned “How expensive can it get?” given earnings multiples expansion for the sector were driven by unreasonable hope and not justified by on-ground realities. As shown in the exhibit below, in the past year, Ambuja and ACC underperformed the Sensex by 7% and 10% respectively, while UltraTech and Shree Cement outperformed the index by 15% and 1% respectively.
We believe that UltraTech and Shree Cement outperformed the Sensex due to unavailability of credible infra proxies and hopes that a demand recovery will benefit these names the most. Moreover, cost savings in power and fuel due to a sharp decline in international coal/petcoke prices and a higher proportion of petcoke in the fuel mix supported earnings even as realisations declined.
Some rationality in trading multiples and earnings expectations: One of the key reasons we have been sellers on the cement stocks was that we were not comfortable with unrealistic earning assumptions (which were eventually cut to account for reality). After sharp earning cuts in the past year, we do not see any further scope of earning downgrades. In fact, for the first time in the last four years, there is a likelihood of earning upgrades given the beaten down expectations and our view of an improvement in pricing because of the end of the capex cycle.
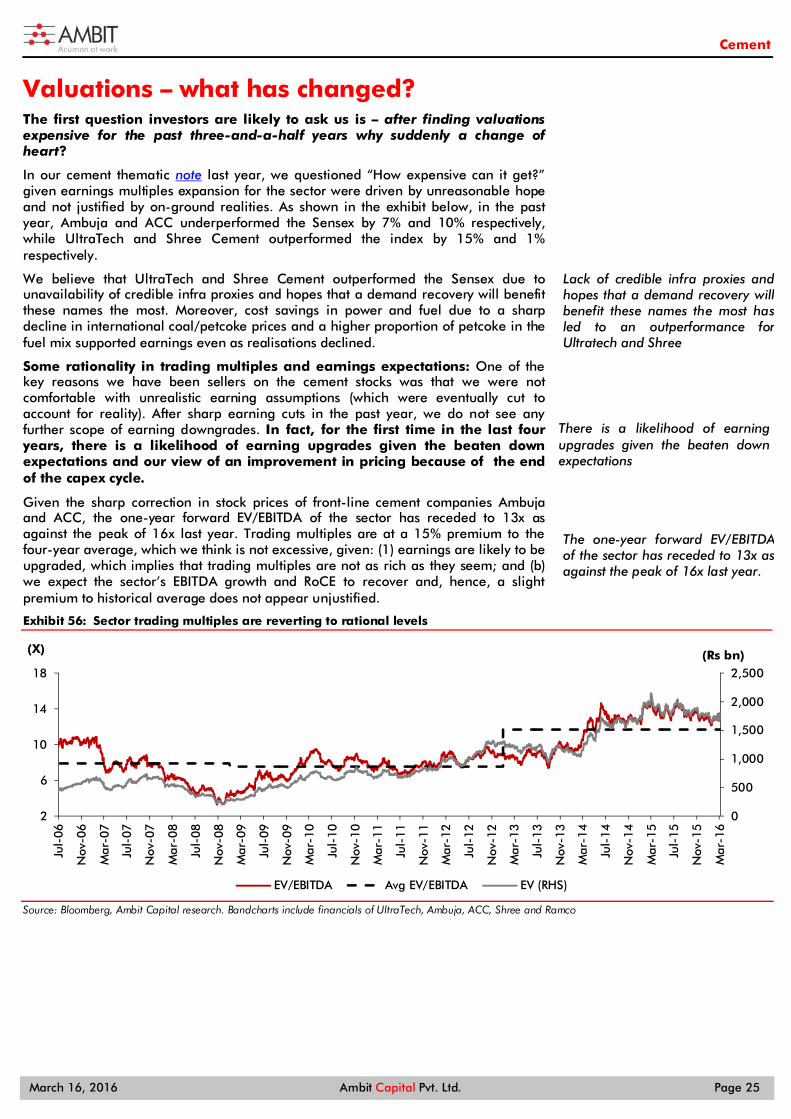
Given the sharp correction in stock prices of front-line cement companies Ambuja and ACC, the one-year forward EV/EBITDA of the sector has receded to 13x as against the peak of 16x last year. Trading multiples are at a 15% premium to the four-year average, which we think is not excessive, given: (1) earnings are likely to be upgraded, which implies that trading multiples are not as rich as they seem; and (b) we expect the sector’s EBITDA growth and RoCE to recover and, hence, a slight premium to historical average does not appear unjustified.
Sector trading multiples are reverting to rational levels Exhibit 56:
Source: Bloomberg, Ambit Capital research. Bandcharts include financials of UltraTech, Ambuja, ACC, Shree and Ramco
0
500
1,000
1,500
2,000
2,500
2
6
10
14
18
Jul-
06
Nov
-06
Mar
-07
Jul-
07
Nov
-07
Mar
-08
Jul-
08
Nov
-08
Mar
-09
Jul-
09
Nov
-09
Mar
-10
Jul-
10
Nov
-10
Mar
-11
Jul-
11
Nov
-11
Mar
-12
Jul-
12
Nov
-12
Mar
-13
Jul-
13
Nov
-13
Mar
-14
Jul-
14
Nov
-14
Mar
-15
Jul-
15
Nov
-15
Mar
-16
(Rs bn)(X)
EV/EBITDA Avg EV/EBITDA EV (RHS)
Lack of credible infra proxies and hopes that a demand recovery will benefit these names the most has led to an outperformance for Ultratech and Shree
There is a likelihood of earning upgrades given the beaten down expectations
The one-year forward EV/EBITDA of the sector has receded to 13x as against the peak of 16x last year.
Cement
March 16, 2016 Ambit Capital Pvt. Ltd. Page 26
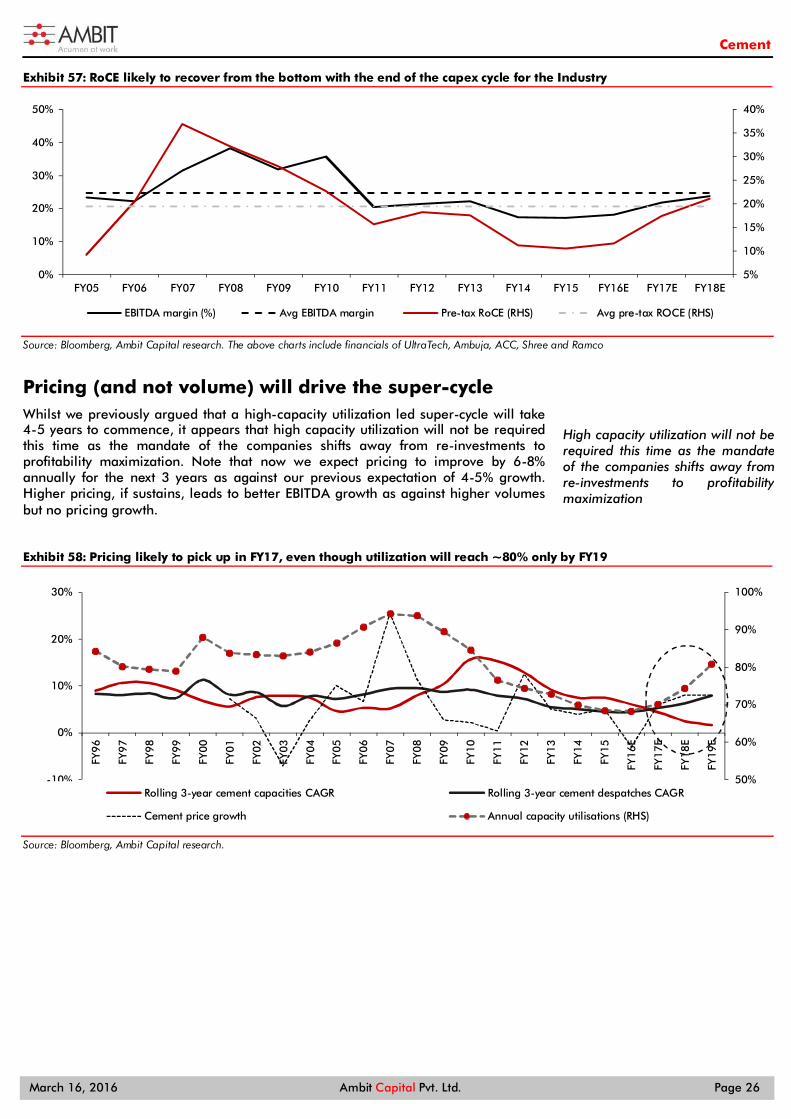
RoCE likely to recover from the bottom with the end of the capex cycle for the Industry Exhibit 57:
Source: Bloomberg, Ambit Capital research. The above charts include financials of UltraTech, Ambuja, ACC, Shree and Ramco
Pricing (and not volume) will drive the super-cycle Whilst we previously argued that a high-capacity utilization led super-cycle will take 4-5 years to commence, it appears that high capacity utilization will not be required this time as the mandate of the companies shifts away from re-investments to profitability maximization. Note that now we expect pricing to improve by 6-8% annually for the next 3 years as against our previous expectation of 4-5% growth. Higher pricing, if sustains, leads to better EBITDA growth as against higher volumes but no pricing growth.
Pricing likely to pick up in FY17, even though utilization will reach ~80% only by FY19 Exhibit 58:
Source: Bloomberg, Ambit Capital research.
5%
10%
15%
20%
25%
30%
35%
40%
0%
10%
20%
30%
40%
50%
FY05 FY06 FY07 FY08 FY09 FY10 FY11 FY12 FY13 FY14 FY15 FY16E FY17E FY18E
EBITDA margin (%) Avg EBITDA margin Pre-tax RoCE (RHS) Avg pre-tax ROCE (RHS)
50%
60%
70%
80%
90%
100%
-10%
0%
10%
20%
30%
FY96
FY97
FY98
FY99
FY00
FY01
FY02
FY03
FY04
FY05
FY06
FY07
FY08
FY09
FY10
FY11
FY12
FY13
FY14
FY15
FY16
E
FY17
E
FY18
E
FY19
E
Rolling 3-year cement capacities CAGR Rolling 3-year cement despatches CAGR
Cement price growth Annual capacity utilisations (RHS)
High capacity utilization will not be required this time as the mandate of the companies shifts away from re-investments to profitability maximization
Cement
March 16, 2016 Ambit Capital Pvt. Ltd. Page 27
Prefer ACC and Ambuja over UltraTech ACC and Ambuja have been the “poor cousins” of UltraTech in investor minds since these companies have not added capacities as aggressively, implying that these companies would lag when demand recovers. We believe ACC and Ambuja are safer and better bets than UltraTech at current valuation multiples. Key reasons:
Pricing growth could lead to sharper earning upgrades for ACC and Ambuja: Earning cuts for Ambuja and ACC were significantly higher than UltraTech’s since they have a higher exposure to markets where prices dropped sharply (North, West and Central India) and lower exposure to markets where prices have been strong (East and South India). A pricing recovery in the former markets will mean that earnings estimates will be upgraded. We hear that prices in North and West India have improved by 15-20% in recent months.
ACC and Ambuja have higher exposure to markets where pricing recovery Exhibit 59:is impending Company North West Central East South
UltraTech 21% 31% 11% 19% 18%
Ambuja 39% 41% 5% 15% -
ACC 25% 22% 23% 22% 8%
Source: Company, Ambit Capital research
Volume growth still uncertain: The key reason to own UltraTech is an expected volume recovery. Our experience of covering cement companies in India suggests that predicting volume growth is like throwing darts in a dark room. With infra demand likely only from roads and railway, it is essential for retail demand to recover, which also hinges disproportionately on rural income. If rural income fails to recover, it will be another year of volume growth disappointment. Hence, ACC and Ambuja (where expectations are beaten down) make for relatively safe plays.
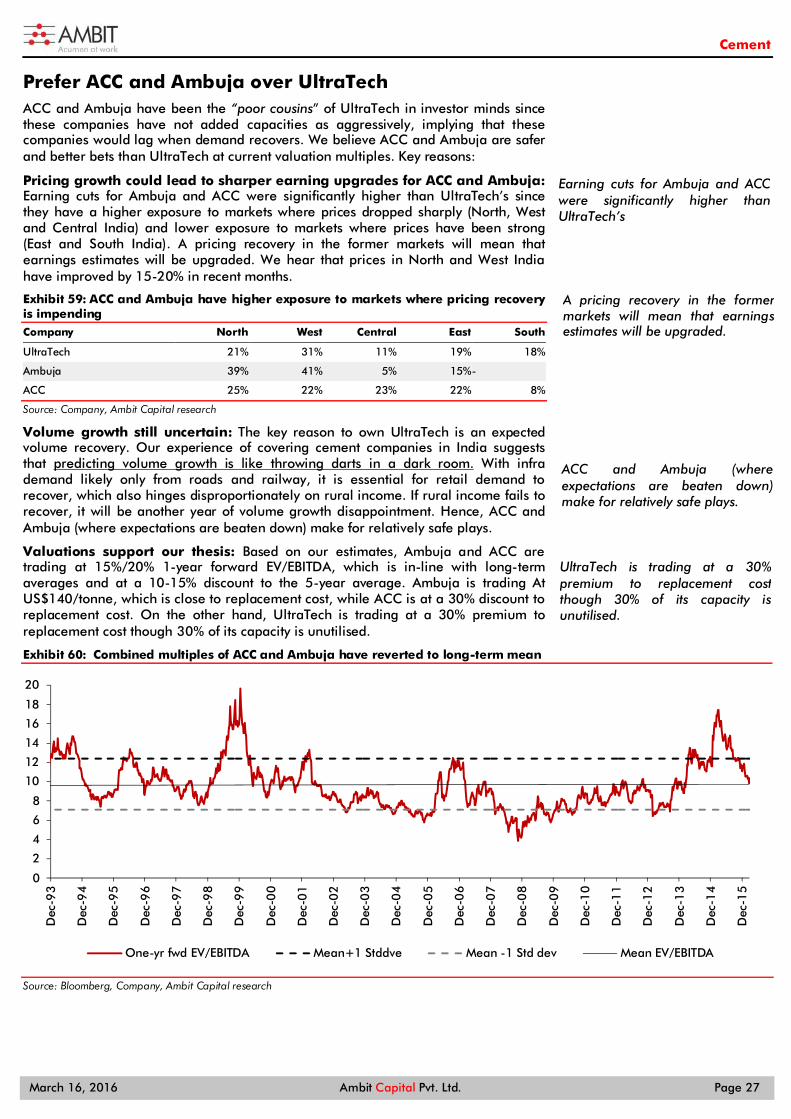
Valuations support our thesis: Based on our estimates, Ambuja and ACC are trading at 15%/20% 1-year forward EV/EBITDA, which is in-line with long-term averages and at a 10-15% discount to the 5-year average. Ambuja is trading At US$140/tonne, which is close to replacement cost, while ACC is at a 30% discount to replacement cost. On the other hand, UltraTech is trading at a 30% premium to replacement cost though 30% of its capacity is unutilised.
Combined multiples of ACC and Ambuja have reverted to long-term mean Exhibit 60:
Source: Bloomberg, Company, Ambit Capital research
0
2
4
6
8
10
12
14
16
18
20
Dec
-93
Dec
-94
Dec
-95
Dec
-96
Dec
-97
Dec
-98
Dec
-99
Dec
-00
Dec
-01
Dec
-02
Dec
-03
Dec
-04
Dec
-05
Dec
-06
Dec
-07
Dec
-08
Dec
-09
Dec
-10
Dec
-11
Dec
-12
Dec
-13
Dec
-14
Dec
-15
One-yr fwd EV/EBITDA Mean+1 Stddve Mean -1 Std dev Mean EV/EBITDA
Earning cuts for Ambuja and ACC were significantly higher than UltraTech’s
A pricing recovery in the former markets will mean that earnings estimates will be upgraded.
ACC and Ambuja (where expectations are beaten down) make for relatively safe plays.
UltraTech is trading at a 30% premium to replacement cost though 30% of its capacity is unutilised.
Cement
March 16, 2016 Ambit Capital Pvt. Ltd. Page 28
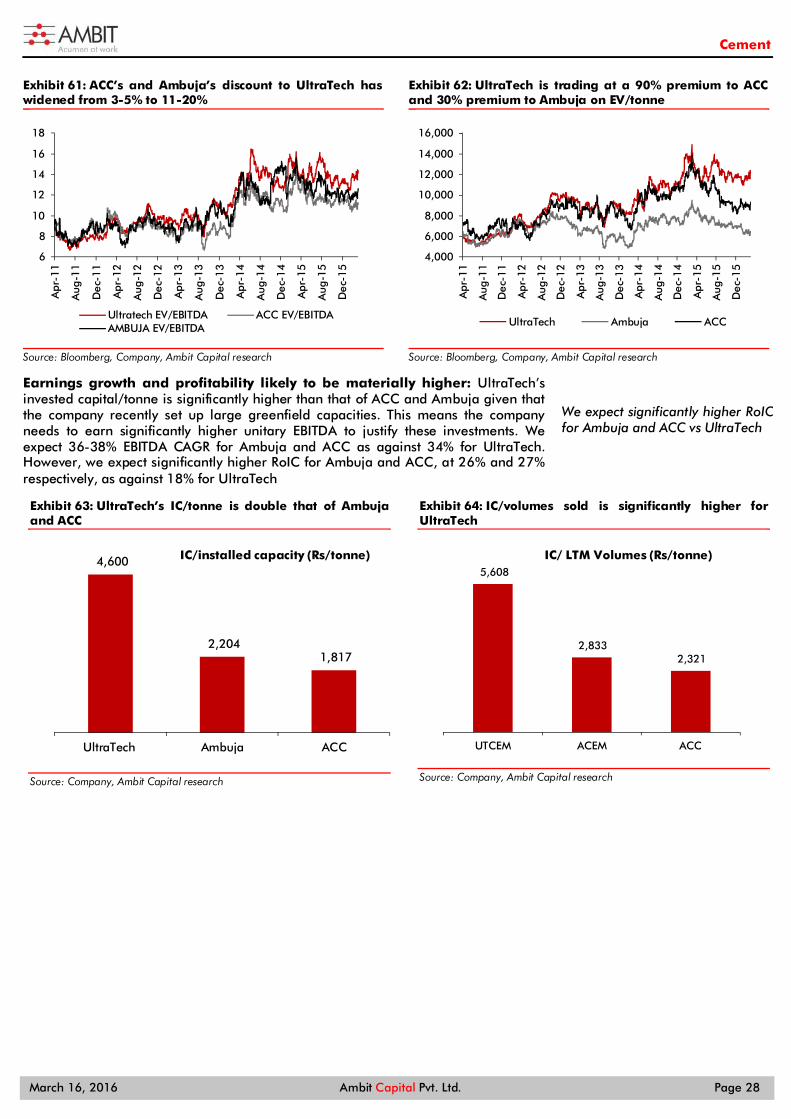
ACC’s and Ambuja’s discount to UltraTech has Exhibit 61:widened from 3-5% to 11-20%
Source: Bloomberg, Company, Ambit Capital research
UltraTech is trading at a 90% premium to ACC Exhibit 62:and 30% premium to Ambuja on EV/tonne
Source: Bloomberg, Company, Ambit Capital research
Earnings growth and profitability likely to be materially higher: UltraTech’s invested capital/tonne is significantly higher than that of ACC and Ambuja given that the company recently set up large greenfield capacities. This means the company needs to earn significantly higher unitary EBITDA to justify these investments. We expect 36-38% EBITDA CAGR for Ambuja and ACC as against 34% for UltraTech. However, we expect significantly higher RoIC for Ambuja and ACC, at 26% and 27% respectively, as against 18% for UltraTech
UltraTech’s IC/tonne is double that of Ambuja Exhibit 63:and ACC
Source: Company, Ambit Capital research
IC/volumes sold is significantly higher for Exhibit 64:UltraTech
Source: Company, Ambit Capital research
6
8
10
12
14
16
18
Apr
-11
Aug
-11
Dec
-11
Apr
-12
Aug
-12
Dec
-12
Apr
-13
Aug
-13
Dec
-13
Apr
-14
Aug
-14
Dec
-14
Apr
-15
Aug
-15
Dec
-15
Ultratech EV/EBITDA ACC EV/EBITDAAMBUJA EV/EBITDA
4,000
6,000
8,000
10,000
12,000
14,000
16,000
Apr
-11
Aug
-11
Dec
-11
Apr
-12
Aug
-12
Dec
-12
Apr
-13
Aug
-13
Dec
-13
Apr
-14
Aug
-14
Dec
-14
Apr
-15
Aug
-15
Dec
-15
UltraTech Ambuja ACC
4,600
2,204 1,817
UltraTech Ambuja ACC
IC/installed capacity (Rs/tonne)5,608
2,833 2,321
UTCEM ACEM ACC
IC/ LTM Volumes (Rs/tonne)
We expect significantly higher RoIC for Ambuja and ACC vs UltraTech
Cement
March 16, 2016 Ambit Capital Pvt. Ltd. Page 29
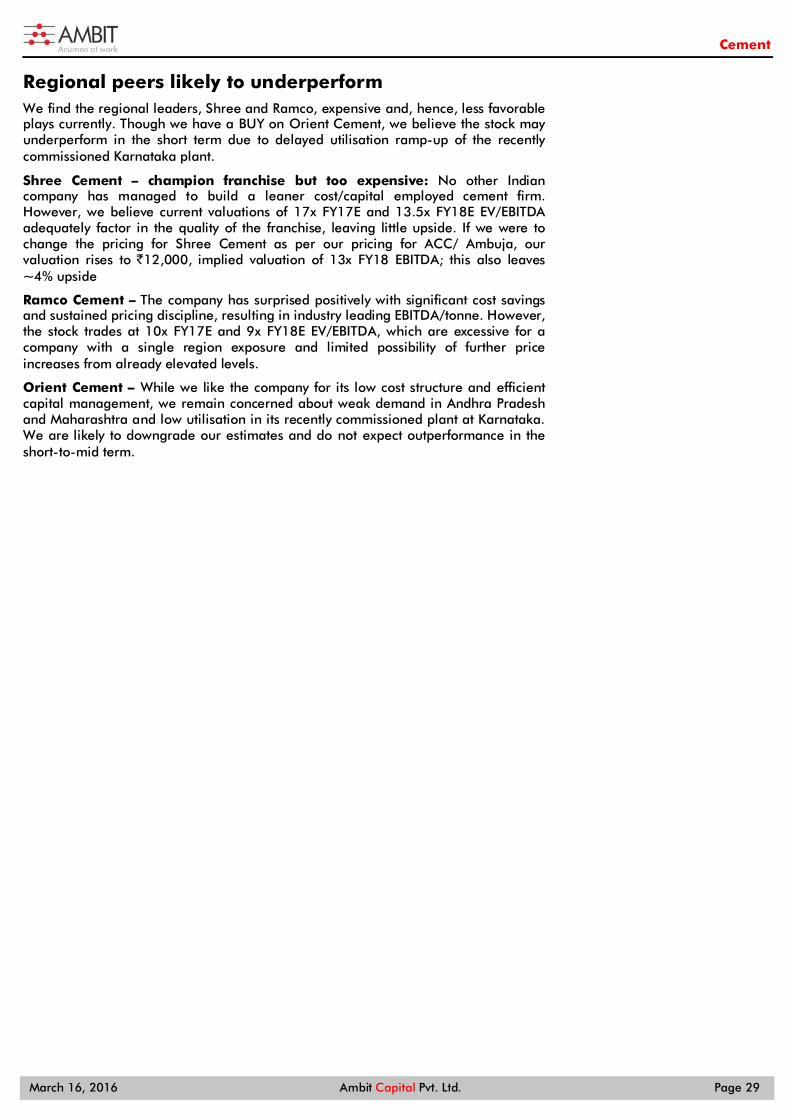
Regional peers likely to underperform We find the regional leaders, Shree and Ramco, expensive and, hence, less favorable plays currently. Though we have a BUY on Orient Cement, we believe the stock may underperform in the short term due to delayed utilisation ramp-up of the recently commissioned Karnataka plant.
Shree Cement – champion franchise but too expensive: No other Indian company has managed to build a leaner cost/capital employed cement firm. However, we believe current valuations of 17x FY17E and 13.5x FY18E EV/EBITDA adequately factor in the quality of the franchise, leaving little upside. If we were to change the pricing for Shree Cement as per our pricing for ACC/ Ambuja, our valuation rises to `12,000, implied valuation of 13x FY18 EBITDA; this also leaves ~4% upside
Ramco Cement – The company has surprised positively with significant cost savings and sustained pricing discipline, resulting in industry leading EBITDA/tonne. However, the stock trades at 10x FY17E and 9x FY18E EV/EBITDA, which are excessive for a company with a single region exposure and limited possibility of further price increases from already elevated levels.
Orient Cement – While we like the company for its low cost structure and efficient capital management, we remain concerned about weak demand in Andhra Pradesh and Maharashtra and low utilisation in its recently commissioned plant at Karnataka. We are likely to downgrade our estimates and do not expect outperformance in the short-to-mid term.
Cement
March 16, 2016 Ambit Capital Pvt. Ltd. Page 30
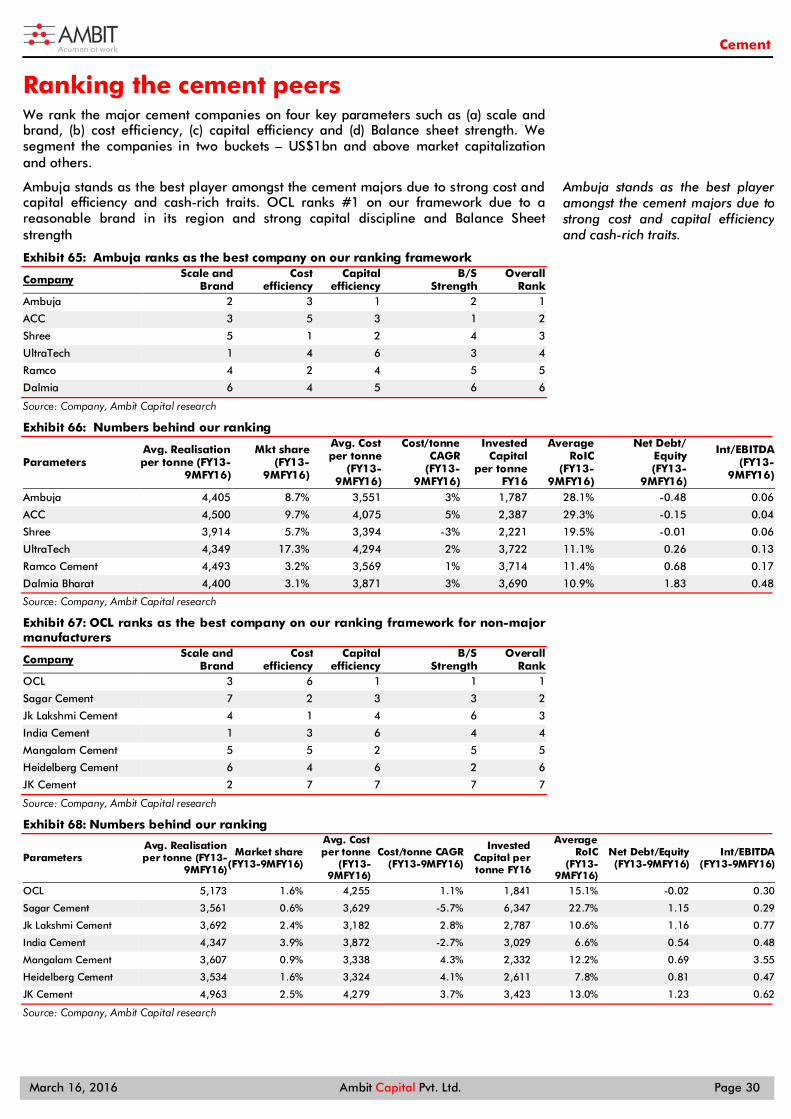
Ranking the cement peers We rank the major cement companies on four key parameters such as (a) scale and brand, (b) cost efficiency, (c) capital efficiency and (d) Balance sheet strength. We segment the companies in two buckets – US$1bn and above market capitalization and others.
Ambuja stands as the best player amongst the cement majors due to strong cost and capital efficiency and cash-rich traits. OCL ranks #1 on our framework due to a reasonable brand in its region and strong capital discipline and Balance Sheet strength
Ambuja ranks as the best company on our ranking framework Exhibit 65:
Company Scale and Brand
Cost efficiency
Capital efficiency
B/S Strength
Overall Rank
Ambuja 2 3 1 2 1
ACC 3 5 3 1 2
Shree 5 1 2 4 3
UltraTech 1 4 6 3 4
Ramco 4 2 4 5 5
Dalmia 6 4 5 6 6
Source: Company, Ambit Capital research
Numbers behind our ranking Exhibit 66:
Parameters Avg. Realisation per tonne (FY13-
9MFY16)
Mkt share (FY13-
9MFY16)
Avg. Cost per tonne
(FY13-9MFY16)
Cost/tonne CAGR
(FY13-9MFY16)
Invested Capital
per tonne FY16
Average RoIC
(FY13-9MFY16)
Net Debt/ Equity (FY13-
9MFY16)
Int/EBITDA (FY13-
9MFY16)
Ambuja 4,405 8.7% 3,551 3% 1,787 28.1% -0.48 0.06
ACC 4,500 9.7% 4,075 5% 2,387 29.3% -0.15 0.04
Shree 3,914 5.7% 3,394 -3% 2,221 19.5% -0.01 0.06
UltraTech 4,349 17.3% 4,294 2% 3,722 11.1% 0.26 0.13
Ramco Cement 4,493 3.2% 3,569 1% 3,714 11.4% 0.68 0.17
Dalmia Bharat 4,400 3.1% 3,871 3% 3,690 10.9% 1.83 0.48
Source: Company, Ambit Capital research
OCL ranks as the best company on our ranking framework for non-major Exhibit 67:manufacturers
Company Scale and Brand
Cost efficiency
Capital efficiency
B/S Strength
Overall Rank
OCL 3 6 1 1 1
Sagar Cement 7 2 3 3 2
Jk Lakshmi Cement 4 1 4 6 3
India Cement 1 3 6 4 4
Mangalam Cement 5 5 2 5 5
Heidelberg Cement 6 4 6 2 6
JK Cement 2 7 7 7 7
Source: Company, Ambit Capital research
Numbers behind our ranking Exhibit 68:
Parameters Avg. Realisation per tonne (FY13-
9MFY16)
Market share (FY13-9MFY16)
Avg. Cost per tonne
(FY13-9MFY16)
Cost/tonne CAGR (FY13-9MFY16)
Invested Capital per tonne FY16
Average RoIC
(FY13-9MFY16)
Net Debt/Equity (FY13-9MFY16)
Int/EBITDA (FY13-9MFY16)
OCL 5,173 1.6% 4,255 1.1% 1,841 15.1% -0.02 0.30
Sagar Cement 3,561 0.6% 3,629 -5.7% 6,347 22.7% 1.15 0.29
Jk Lakshmi Cement 3,692 2.4% 3,182 2.8% 2,787 10.6% 1.16 0.77
India Cement 4,347 3.9% 3,872 -2.7% 3,029 6.6% 0.54 0.48
Mangalam Cement 3,607 0.9% 3,338 4.3% 2,332 12.2% 0.69 3.55
Heidelberg Cement 3,534 1.6% 3,324 4.1% 2,611 7.8% 0.81 0.47
JK Cement 4,963 2.5% 4,279 3.7% 3,423 13.0% 1.23 0.62
Source: Company, Ambit Capital research
Ambuja stands as the best player amongst the cement majors due to strong cost and capital efficiency and cash-rich traits.
Cement
March 16, 2016 Ambit Capital Pvt. Ltd. Page 31
The parameters behind our ranking are as follows: #1: Scale and Brand: Here we compare the average realization over the last four years (as a proxy to brand strength) and market share. UltraTech is the clear leader in this parameter given strong brand and highest market share. India Cement ranks #1 amongst the smaller players due to highest scale and realisations (due to strong brand in South India, where prices have been at a premium compared to other regions.
#2: Cost efficiency: Shree Cement ranks the best amongst the larger peers due to unmatched cost efficiency and continuous cost savings evident from declining unitary costs over FY13-16. Ambuja ranks the second best. JK Lakshmi ranks the best amongst smaller peers in this parameter
#3: Capital efficiency: Ambuja ranks the best in this parameter since the company has historically been prudent in cost of capacity creation, which manifests in lowest invested capital per tonne and highest RoICs. Shree ranks second, despite keen focus on capital efficiencies as its invested capital/tonne has increased in recent years, due to greenfield expansions. Amongst, the smaller players OCL ranks the best due to low cost capacity expansions.
#4: Balance Sheet strength: The cash rich companies, Ambuja and ACC rank the best in this parameter, followed by Shree. Amongst the smaller player OCL ranks the best due to a cash rich balance sheet and hence no major interest/debt to service.
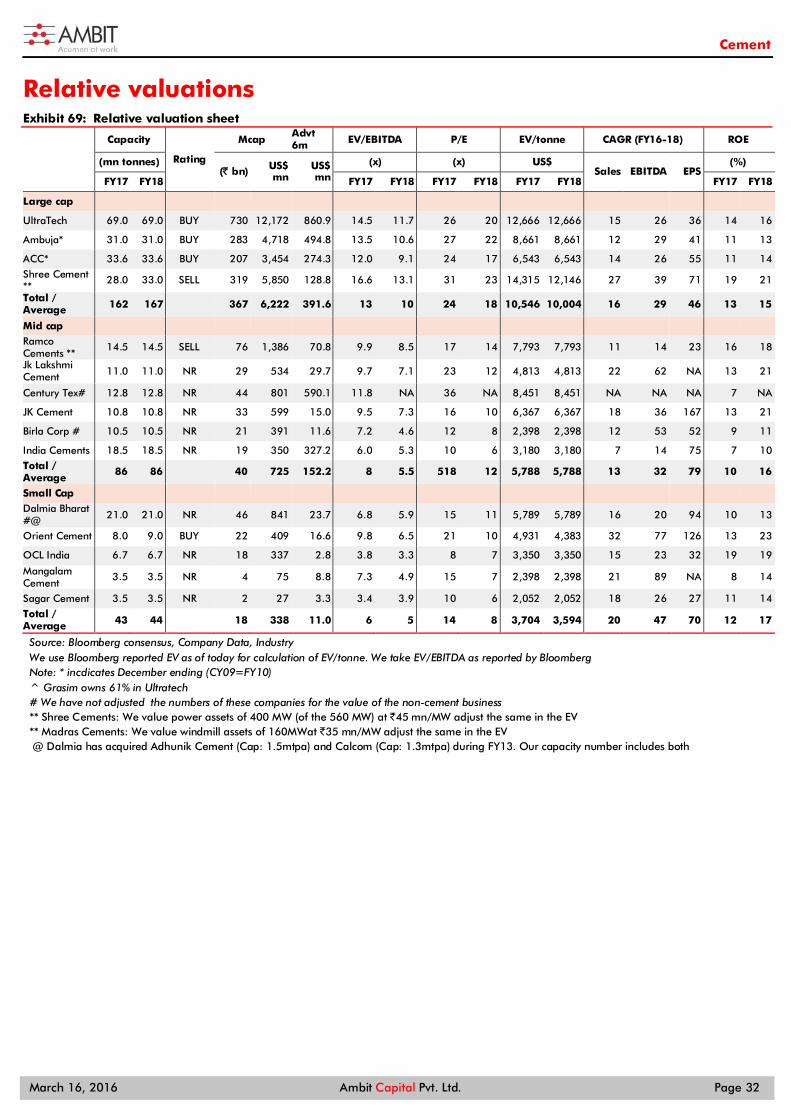
Cement
March 16, 2016 Ambit Capital Pvt. Ltd. Page 32
Relative valuations Relative valuation sheet Exhibit 69:
Capacity
Rating
Mcap Advt 6m EV/EBITDA P/E EV/tonne CAGR (FY16-18) ROE
(mn tonnes) (` bn) US$
mn US$ mn
(x) (x) US$ Sales EBITDA EPS
(%)
FY17 FY18 FY17 FY18 FY17 FY18 FY17 FY18 FY17 FY18
Large cap
UltraTech 69.0 69.0 BUY 730 12,172 860.9 14.5 11.7 26 20 12,666 12,666 15 26 36 14 16
Ambuja* 31.0 31.0 BUY 283 4,718 494.8 13.5 10.6 27 22 8,661 8,661 12 29 41 11 13
ACC* 33.6 33.6 BUY 207 3,454 274.3 12.0 9.1 24 17 6,543 6,543 14 26 55 11 14
Shree Cement **
28.0 33.0 SELL 319 5,850 128.8 16.6 13.1 31 23 14,315 12,146 27 39 71 19 21
Total / Average 162 167 367 6,222 391.6 13 10 24 18 10,546 10,004 16 29 46 13 15
Mid cap
Ramco Cements **
14.5 14.5 SELL 76 1,386 70.8 9.9 8.5 17 14 7,793 7,793 11 14 23 16 18
Jk Lakshmi Cement 11.0 11.0 NR 29 534 29.7 9.7 7.1 23 12 4,813 4,813 22 62 NA 13 21
Century Tex# 12.8 12.8 NR 44 801 590.1 11.8 NA 36 NA 8,451 8,451 NA NA NA 7 NA
JK Cement 10.8 10.8 NR 33 599 15.0 9.5 7.3 16 10 6,367 6,367 18 36 167 13 21
Birla Corp # 10.5 10.5 NR 21 391 11.6 7.2 4.6 12 8 2,398 2,398 12 53 52 9 11
India Cements 18.5 18.5 NR 19 350 327.2 6.0 5.3 10 6 3,180 3,180 7 14 75 7 10
Total / Average
86 86 40 725 152.2 8 5.5 518 12 5,788 5,788 13 32 79 10 16
Small Cap Dalmia Bharat #@ 21.0 21.0 NR 46 841 23.7 6.8 5.9 15 11 5,789 5,789 16 20 94 10 13
Orient Cement 8.0 9.0 BUY 22 409 16.6 9.8 6.5 21 10 4,931 4,383 32 77 126 13 23
OCL India 6.7 6.7 NR 18 337 2.8 3.8 3.3 8 7 3,350 3,350 15 23 32 19 19
Mangalam Cement
3.5 3.5 NR 4 75 8.8 7.3 4.9 15 7 2,398 2,398 21 89 NA 8 14
Sagar Cement 3.5 3.5 NR 2 27 3.3 3.4 3.9 10 6 2,052 2,052 18 26 27 11 14
Total / Average 43 44 18 338 11.0 6 5 14 8 3,704 3,594 20 47 70 12 17
Source: Bloomberg consensus, Company Data, Industry We use Bloomberg reported EV as of today for calculation of EV/tonne. We take EV/EBITDA as reported by Bloomberg Note: * incdicates December ending (CY09=FY10) ^ Grasim owns 61% in Ultratech # We have not adjusted the numbers of these companies for the value of the non-cement business ** Shree Cements: We value power assets of 400 MW (of the 560 MW) at `45 mn/MW adjust the same in the EV ** Madras Cements: We value windmill assets of 160MWat `35 mn/MW adjust the same in the EV @ Dalmia has acquired Adhunik Cement (Cap: 1.5mtpa) and Calcom (Cap: 1.3mtpa) during FY13. Our capacity number includes both
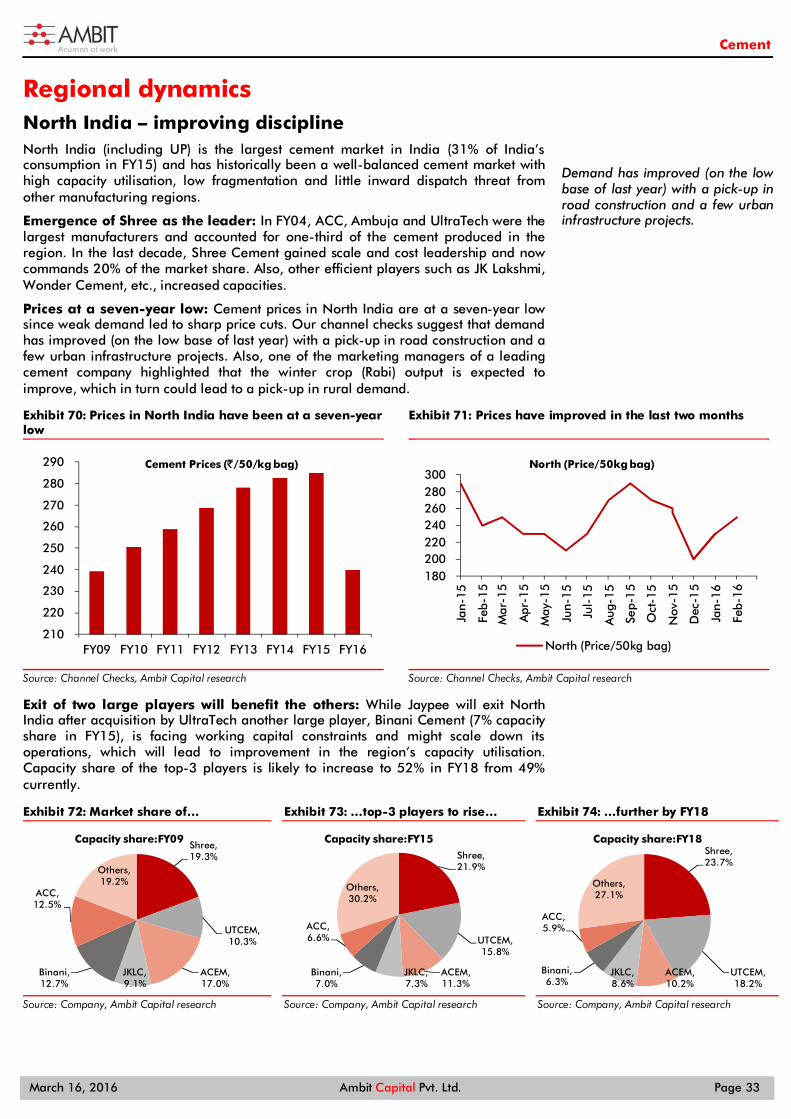
Cement
March 16, 2016 Ambit Capital Pvt. Ltd. Page 33
Regional dynamics North India – improving discipline North India (including UP) is the largest cement market in India (31% of India’s consumption in FY15) and has historically been a well-balanced cement market with high capacity utilisation, low fragmentation and little inward dispatch threat from other manufacturing regions.
Emergence of Shree as the leader: In FY04, ACC, Ambuja and UltraTech were the largest manufacturers and accounted for one-third of the cement produced in the region. In the last decade, Shree Cement gained scale and cost leadership and now commands 20% of the market share. Also, other efficient players such as JK Lakshmi, Wonder Cement, etc., increased capacities.
Prices at a seven-year low: Cement prices in North India are at a seven-year low since weak demand led to sharp price cuts. Our channel checks suggest that demand has improved (on the low base of last year) with a pick-up in road construction and a few urban infrastructure projects. Also, one of the marketing managers of a leading cement company highlighted that the winter crop (Rabi) output is expected to improve, which in turn could lead to a pick-up in rural demand.
Prices in North India have been at a seven-year Exhibit 70:low
Source: Channel Checks, Ambit Capital research
Prices have improved in the last two months Exhibit 71:
Source: Channel Checks, Ambit Capital research
Exit of two large players will benefit the others: While Jaypee will exit North India after acquisition by UltraTech another large player, Binani Cement (7% capacity share in FY15), is facing working capital constraints and might scale down its operations, which will lead to improvement in the region’s capacity utilisation. Capacity share of the top-3 players is likely to increase to 52% in FY18 from 49% currently.
Market share of… Exhibit 72:
Source: Company, Ambit Capital research
…top-3 players to rise… Exhibit 73:
Source: Company, Ambit Capital research
…further by FY18 Exhibit 74:
Source: Company, Ambit Capital research
210
220
230
240
250
260
270
280
290
FY09 FY10 FY11 FY12 FY13 FY14 FY15 FY16
Cement Prices (`/50/kg bag)
180 200 220 240 260 280 300
Jan-
15
Feb-
15
Mar
-15
Apr
-15
May
-15
Jun-
15
Jul-
15
Aug
-15
Sep-
15
Oct
-15
Nov
-15
Dec
-15
Jan-
16
Feb-
16
North (Price/50kg bag)
North (Price/50kg bag)
Shree, 19.3%
UTCEM, 10.3%
ACEM, 17.0%
JKLC, 9.1%
Binani, 12.7%
ACC, 12.5%
Others, 19.2%
Capacity share:FY09Shree, 21.9%
UTCEM, 15.8%
ACEM, 11.3%
JKLC, 7.3%
Binani, 7.0%
ACC, 6.6%
Others, 30.2%
Capacity share:FY15Shree, 23.7%
UTCEM, 18.2%
ACEM, 10.2%
JKLC, 8.6%
Binani, 6.3%
ACC, 5.9%
Others, 27.1%
Capacity share:FY18
Demand has improved (on the low base of last year) with a pick-up in road construction and a few urban infrastructure projects.
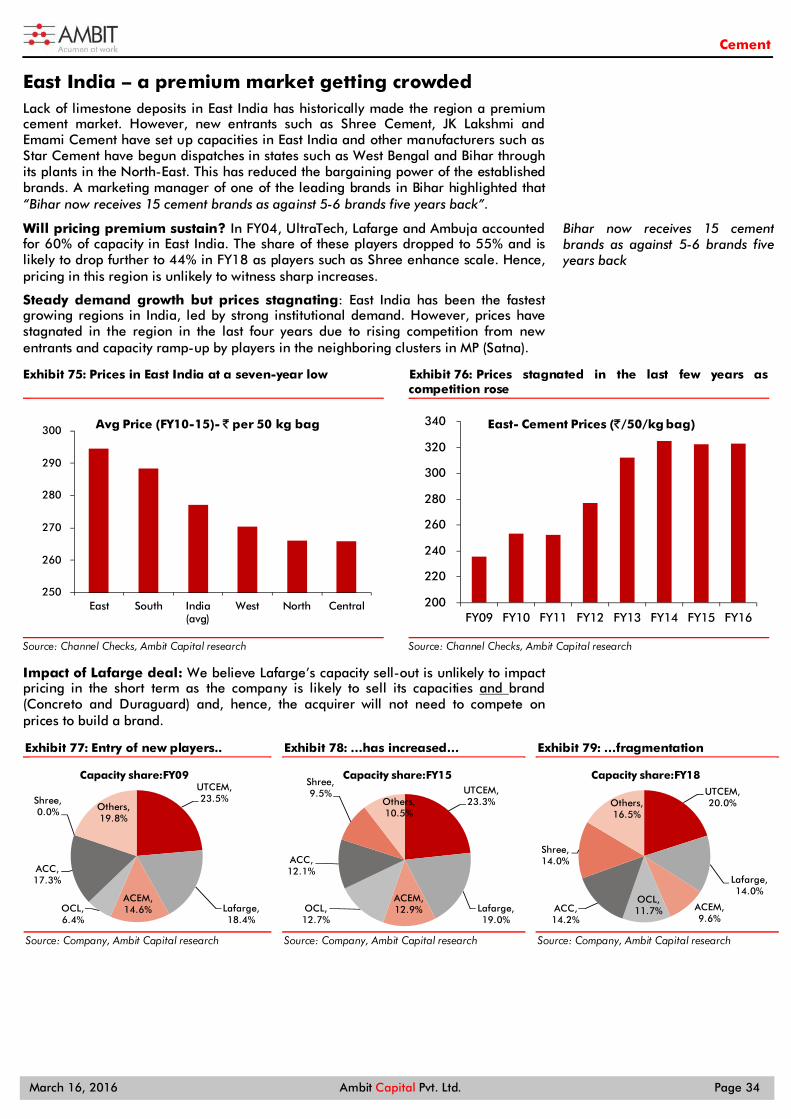
Cement
March 16, 2016 Ambit Capital Pvt. Ltd. Page 34
East India – a premium market getting crowded Lack of limestone deposits in East India has historically made the region a premium cement market. However, new entrants such as Shree Cement, JK Lakshmi and Emami Cement have set up capacities in East India and other manufacturers such as Star Cement have begun dispatches in states such as West Bengal and Bihar through its plants in the North-East. This has reduced the bargaining power of the established brands. A marketing manager of one of the leading brands in Bihar highlighted that “Bihar now receives 15 cement brands as against 5-6 brands five years back”.
Will pricing premium sustain? In FY04, UltraTech, Lafarge and Ambuja accounted for 60% of capacity in East India. The share of these players dropped to 55% and is likely to drop further to 44% in FY18 as players such as Shree enhance scale. Hence, pricing in this region is unlikely to witness sharp increases.
Steady demand growth but prices stagnating: East India has been the fastest growing regions in India, led by strong institutional demand. However, prices have stagnated in the region in the last four years due to rising competition from new entrants and capacity ramp-up by players in the neighboring clusters in MP (Satna).
Prices in East India at a seven-year low Exhibit 75:
Source: Channel Checks, Ambit Capital research
Prices stagnated in the last few years as Exhibit 76:competition rose
Source: Channel Checks, Ambit Capital research
Impact of Lafarge deal: We believe Lafarge’s capacity sell-out is unlikely to impact pricing in the short term as the company is likely to sell its capacities and brand (Concreto and Duraguard) and, hence, the acquirer will not need to compete on prices to build a brand.
Entry of new players.. Exhibit 77:
Source: Company, Ambit Capital research
…has increased… Exhibit 78:
Source: Company, Ambit Capital research
…fragmentation Exhibit 79:
Source: Company, Ambit Capital research
250
260
270
280
290
300
East South India(avg)
West North Central
Avg Price (FY10-15)- ` per 50 kg bag
200
220
240
260
280
300
320
340
FY09 FY10 FY11 FY12 FY13 FY14 FY15 FY16
East- Cement Prices (`/50/kg bag)
UTCEM, 23.5%
Lafarge, 18.4%
ACEM, 14.6%OCL,
6.4%
ACC, 17.3%
Shree, 0.0% Others,
19.8%
Capacity share:FY09UTCEM, 23.3%
Lafarge, 19.0%
ACEM, 12.9%OCL,
12.7%
ACC, 12.1%
Shree, 9.5%
Others, 10.5%
Capacity share:FY15UTCEM, 20.0%
Lafarge, 14.0%
ACEM, 9.6%
OCL, 11.7%ACC,
14.2%
Shree, 14.0%
Others, 16.5%
Capacity share:FY18
Bihar now receives 15 cement brands as against 5-6 brands five years back
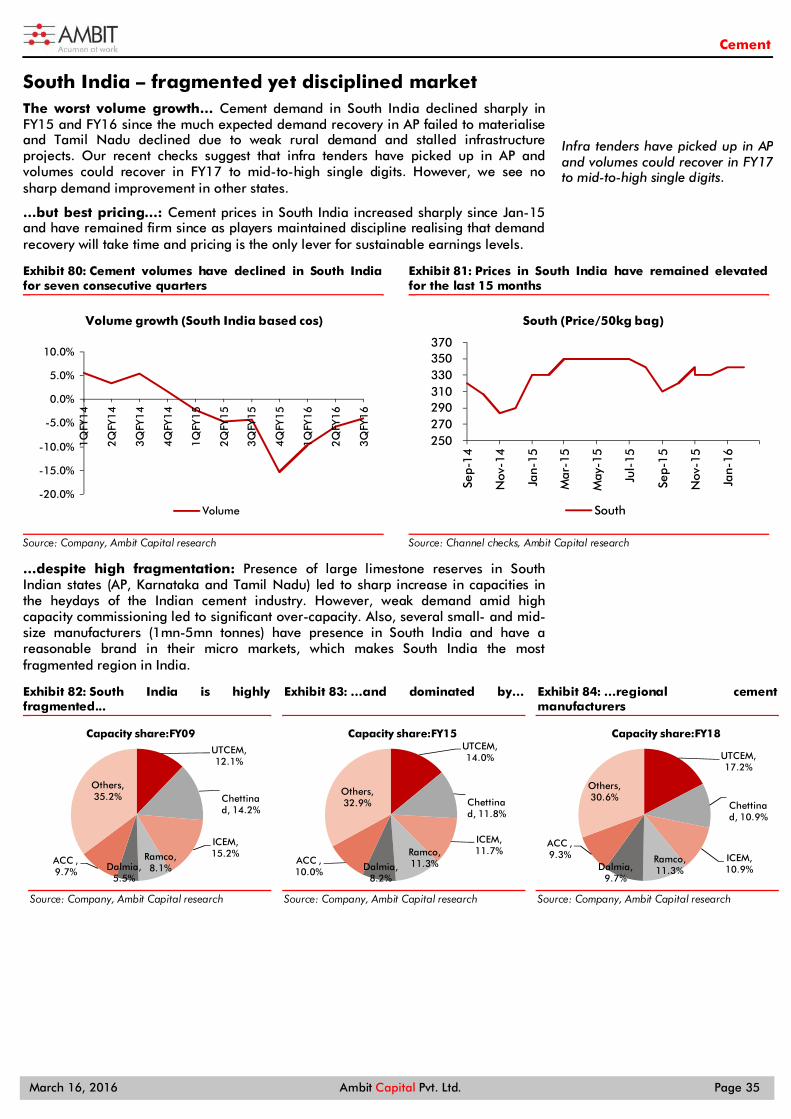
Cement
March 16, 2016 Ambit Capital Pvt. Ltd. Page 35
South India – fragmented yet disciplined market The worst volume growth… Cement demand in South India declined sharply in FY15 and FY16 since the much expected demand recovery in AP failed to materialise and Tamil Nadu declined due to weak rural demand and stalled infrastructure projects. Our recent checks suggest that infra tenders have picked up in AP and volumes could recover in FY17 to mid-to-high single digits. However, we see no sharp demand improvement in other states.
…but best pricing…: Cement prices in South India increased sharply since Jan-15 and have remained firm since as players maintained discipline realising that demand recovery will take time and pricing is the only lever for sustainable earnings levels.
Cement volumes have declined in South India Exhibit 80:for seven consecutive quarters
Source: Company, Ambit Capital research
Prices in South India have remained elevated Exhibit 81:for the last 15 months
Source: Channel checks, Ambit Capital research
…despite high fragmentation: Presence of large limestone reserves in South Indian states (AP, Karnataka and Tamil Nadu) led to sharp increase in capacities in the heydays of the Indian cement industry. However, weak demand amid high capacity commissioning led to significant over-capacity. Also, several small- and mid-size manufacturers (1mn-5mn tonnes) have presence in South India and have a reasonable brand in their micro markets, which makes South India the most fragmented region in India.
South India is highly Exhibit 82:fragmented...
Source: Company, Ambit Capital research
…and dominated by… Exhibit 83:
Source: Company, Ambit Capital research
…regional cement Exhibit 84:manufacturers
Source: Company, Ambit Capital research
-20.0%
-15.0%
-10.0%
-5.0%
0.0%
5.0%
10.0%
1QFY
14
2QFY
14
3QFY
14
4QFY
14
1QFY
15
2QFY
15
3QFY
15
4QFY
15
1QFY
16
2QFY
16
3QFY
16
Volume growth (South India based cos)
Volume
250 270 290 310 330 350 370
Sep-
14
Nov
-14
Jan-
15
Mar
-15
May
-15
Jul-
15
Sep-
15
Nov
-15
Jan-
16
South (Price/50kg bag)
South
UTCEM, 12.1%
Chettinad, 14.2%
ICEM, 15.2%Ramco,
8.1%Dalmia, 5.5%
ACC , 9.7%
Others, 35.2%
Capacity share:FY09UTCEM, 14.0%
Chettinad, 11.8%
ICEM, 11.7%Ramco,
11.3%Dalmia, 8.2%
ACC , 10.0%
Others, 32.9%
Capacity share:FY15
UTCEM, 17.2%
Chettinad, 10.9%
ICEM, 10.9%
Ramco, 11.3%Dalmia,
9.7%
ACC , 9.3%
Others, 30.6%
Capacity share:FY18
Infra tenders have picked up in AP and volumes could recover in FY17 to mid-to-high single digits.
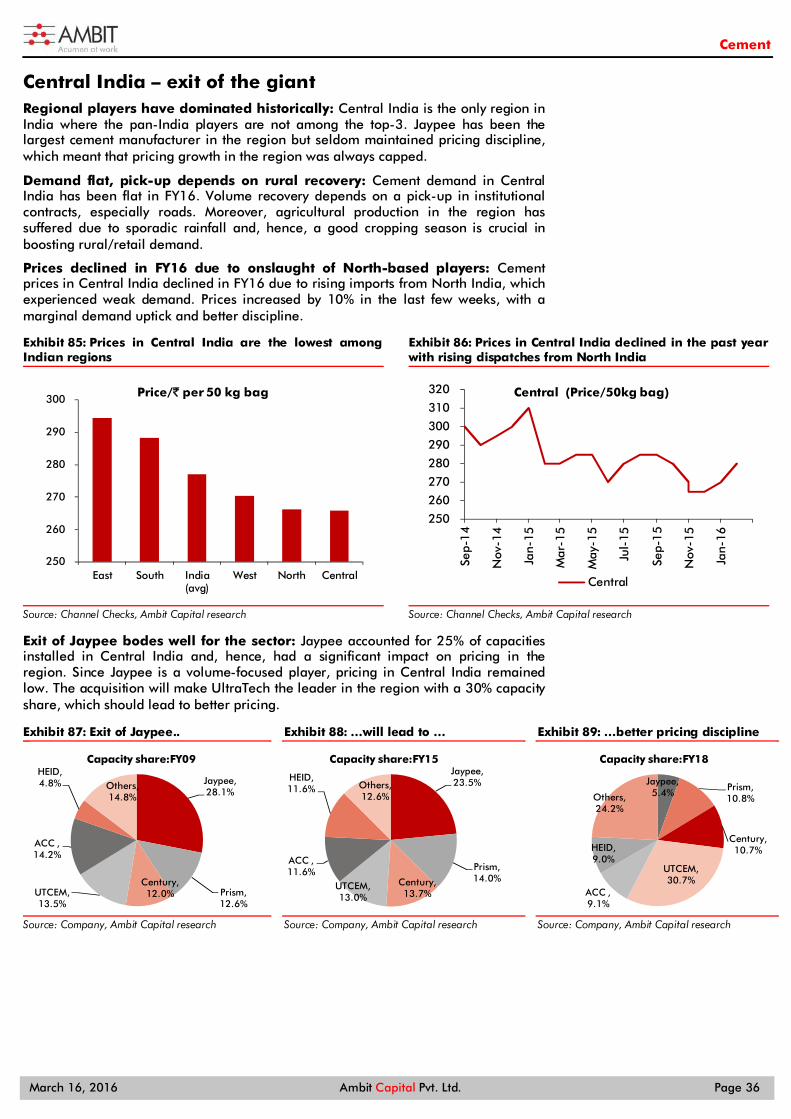
Cement
March 16, 2016 Ambit Capital Pvt. Ltd. Page 36
Central India – exit of the giant Regional players have dominated historically: Central India is the only region in India where the pan-India players are not among the top-3. Jaypee has been the largest cement manufacturer in the region but seldom maintained pricing discipline, which meant that pricing growth in the region was always capped.
Demand flat, pick-up depends on rural recovery: Cement demand in Central India has been flat in FY16. Volume recovery depends on a pick-up in institutional contracts, especially roads. Moreover, agricultural production in the region has suffered due to sporadic rainfall and, hence, a good cropping season is crucial in boosting rural/retail demand.
Prices declined in FY16 due to onslaught of North-based players: Cement prices in Central India declined in FY16 due to rising imports from North India, which experienced weak demand. Prices increased by 10% in the last few weeks, with a marginal demand uptick and better discipline.
Prices in Central India are the lowest among Exhibit 85:Indian regions
Source: Channel Checks, Ambit Capital research
Prices in Central India declined in the past year Exhibit 86:with rising dispatches from North India
Source: Channel Checks, Ambit Capital research
Exit of Jaypee bodes well for the sector: Jaypee accounted for 25% of capacities installed in Central India and, hence, had a significant impact on pricing in the region. Since Jaypee is a volume-focused player, pricing in Central India remained low. The acquisition will make UltraTech the leader in the region with a 30% capacity share, which should lead to better pricing.
Exit of Jaypee.. Exhibit 87:
Source: Company, Ambit Capital research
…will lead to … Exhibit 88:
Source: Company, Ambit Capital research
…better pricing discipline Exhibit 89:
Source: Company, Ambit Capital research
250
260
270
280
290
300
East South India(avg)
West North Central
Price/` per 50 kg bag
250
260
270
280
290
300
310
320
Sep-
14
Nov
-14
Jan-
15
Mar
-15
May
-15
Jul-
15
Sep-
15
Nov
-15
Jan-
16
Central (Price/50kg bag)
Central
Jaypee, 28.1%
Prism, 12.6%
Century, 12.0%UTCEM,
13.5%
ACC , 14.2%
HEID, 4.8% Others,
14.8%
Capacity share:FY09Jaypee, 23.5%
Prism, 14.0%Century,
13.7%UTCEM, 13.0%
ACC , 11.6%
HEID, 11.6% Others,
12.6%
Capacity share:FY15
Jaypee, 5.4%
Prism, 10.8%
Century, 10.7%
UTCEM, 30.7%
ACC , 9.1%
HEID, 9.0%
Others, 24.2%
Capacity share:FY18
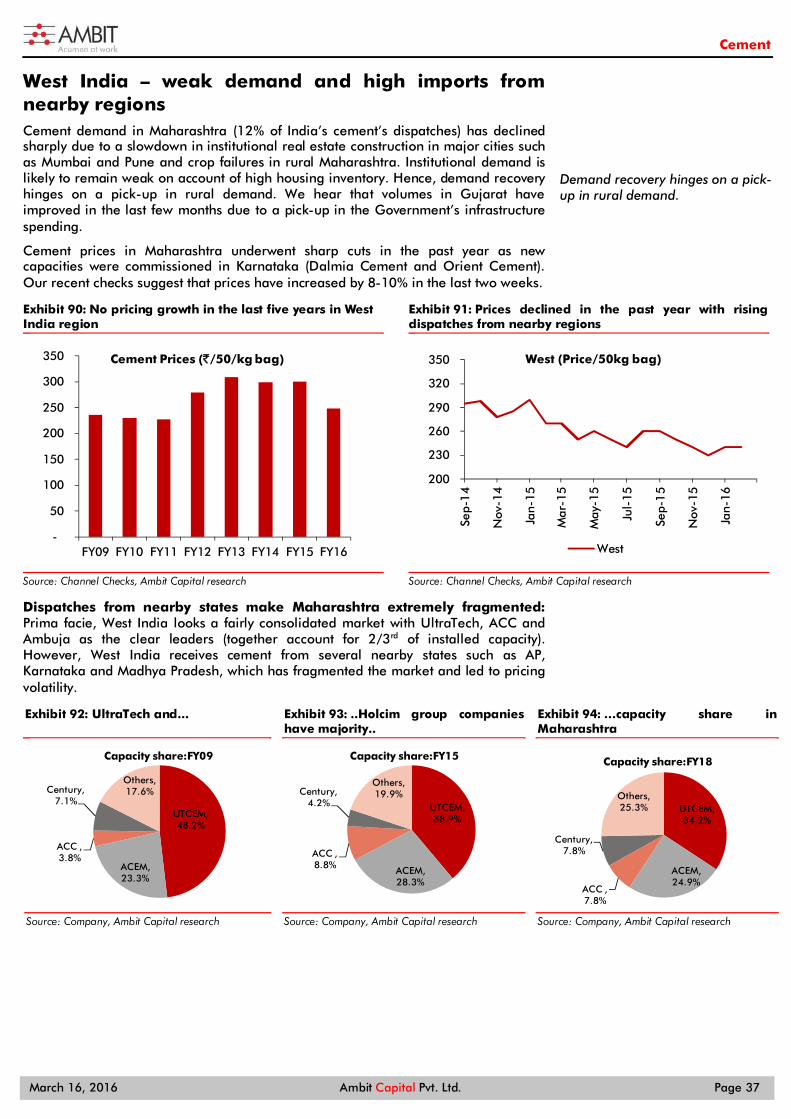
Cement
March 16, 2016 Ambit Capital Pvt. Ltd. Page 37
West India – weak demand and high imports from nearby regions Cement demand in Maharashtra (12% of India’s cement’s dispatches) has declined sharply due to a slowdown in institutional real estate construction in major cities such as Mumbai and Pune and crop failures in rural Maharashtra. Institutional demand is likely to remain weak on account of high housing inventory. Hence, demand recovery hinges on a pick-up in rural demand. We hear that volumes in Gujarat have improved in the last few months due to a pick-up in the Government’s infrastructure spending.
Cement prices in Maharashtra underwent sharp cuts in the past year as new capacities were commissioned in Karnataka (Dalmia Cement and Orient Cement). Our recent checks suggest that prices have increased by 8-10% in the last two weeks.
No pricing growth in the last five years in West Exhibit 90:India region
Source: Channel Checks, Ambit Capital research
Prices declined in the past year with rising Exhibit 91:dispatches from nearby regions
Source: Channel Checks, Ambit Capital research
Dispatches from nearby states make Maharashtra extremely fragmented: Prima facie, West India looks a fairly consolidated market with UltraTech, ACC and Ambuja as the clear leaders (together account for 2/3rd of installed capacity). However, West India receives cement from several nearby states such as AP, Karnataka and Madhya Pradesh, which has fragmented the market and led to pricing volatility.
UltraTech and... Exhibit 92:
Source: Company, Ambit Capital research
..Holcim group companies Exhibit 93:have majority..
Source: Company, Ambit Capital research
…capacity share in Exhibit 94:Maharashtra
Source: Company, Ambit Capital research
-
50
100
150
200
250
300
350
FY09 FY10 FY11 FY12 FY13 FY14 FY15 FY16
Cement Prices (`/50/kg bag)
200
230
260
290
320
350
Sep-
14
Nov
-14
Jan-
15
Mar
-15
May
-15
Jul-
15
Sep-
15
Nov
-15
Jan-
16
West (Price/50kg bag)
West
UTCEM, 48.2%
ACEM, 23.3%
ACC , 3.8%
Century, 7.1%
Others, 17.6%
Capacity share:FY09
UTCEM, 38.9%
ACEM, 28.3%
ACC , 8.8%
Century, 4.2%
Others, 19.9%
Capacity share:FY15
UTCEM, 34.2%
ACEM, 24.9%
ACC , 7.8%
Century, 7.8%
Others, 25.3%
Capacity share:FY18
Demand recovery hinges on a pick-up in rural demand.

Cement
March 16, 2016 Ambit Capital Pvt. Ltd. Page 38
This page has been intentionally left blank
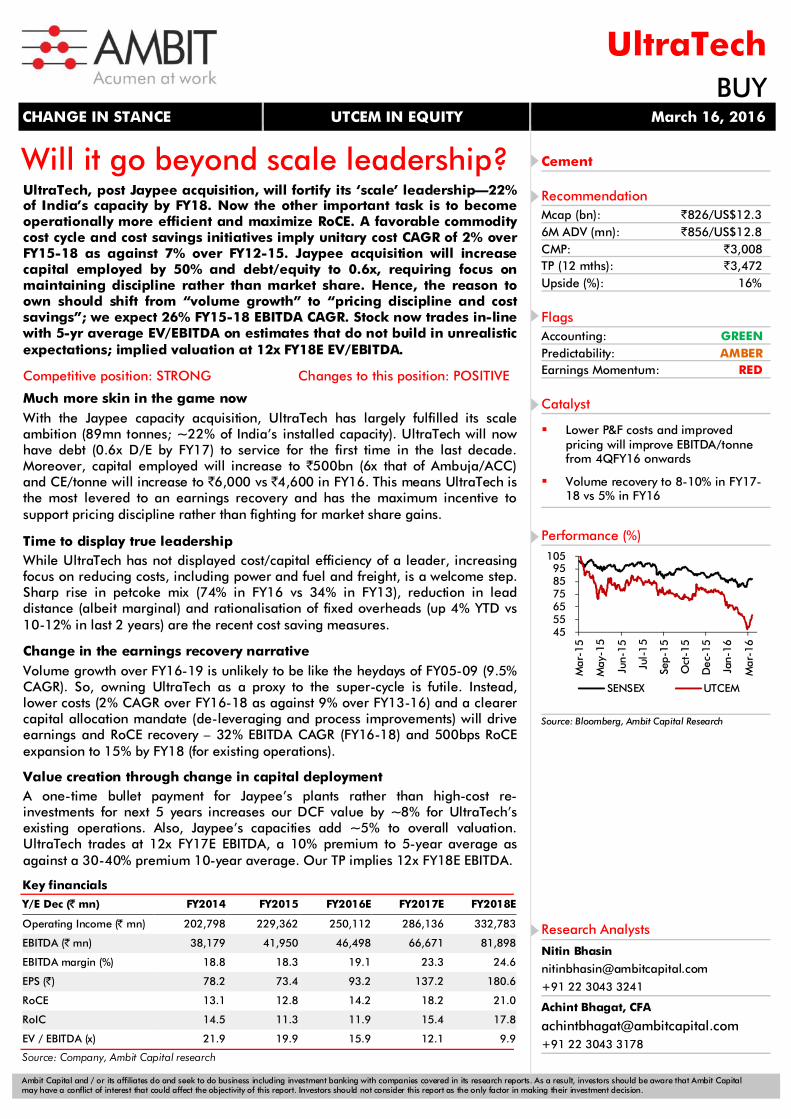
Ambit Capital and / or its affiliates do and seek to do business including investment banking with companies covered in its research reports. As a result, investors should be aware that Ambit Capital may have a conflict of interest that could affect the objectivity of this report. Investors should not consider this report as the only factor in making their investment decision.
Will it go beyond scale leadership?
UltraTech, post Jaypee acquisition, will fortify its ‘scale’ leadership—22% of India’s capacity by FY18. Now the other important task is to become operationally more efficient and maximize RoCE. A favorable commodity cost cycle and cost savings initiatives imply unitary cost CAGR of 2% over FY15-18 as against 7% over FY12-15. Jaypee acquisition will increase capital employed by 50% and debt/equity to 0.6x, requiring focus on maintaining discipline rather than market share. Hence, the reason to own should shift from “volume growth” to “pricing discipline and cost savings”; we expect 26% FY15-18 EBITDA CAGR. Stock now trades in-line with 5-yr average EV/EBITDA on estimates that do not build in unrealistic expectations; implied valuation at 12x FY18E EV/EBITDA.
Competitive position: STRONG Changes to this position: POSITIVE Much more skin in the game now With the Jaypee capacity acquisition, UltraTech has largely fulfilled its scale ambition (89mn tonnes; ~22% of India’s installed capacity). UltraTech will now have debt (0.6x D/E by FY17) to service for the first time in the last decade. Moreover, capital employed will increase to `500bn (6x that of Ambuja/ACC) and CE/tonne will increase to `6,000 vs `4,600 in FY16. This means UltraTech is the most levered to an earnings recovery and has the maximum incentive to support pricing discipline rather than fighting for market share gains. Time to display true leadership While UltraTech has not displayed cost/capital efficiency of a leader, increasing focus on reducing costs, including power and fuel and freight, is a welcome step. Sharp rise in petcoke mix (74% in FY16 vs 34% in FY13), reduction in lead distance (albeit marginal) and rationalisation of fixed overheads (up 4% YTD vs 10-12% in last 2 years) are the recent cost saving measures. Change in the earnings recovery narrative Volume growth over FY16-19 is unlikely to be like the heydays of FY05-09 (9.5% CAGR). So, owning UltraTech as a proxy to the super-cycle is futile. Instead, lower costs (2% CAGR over FY16-18 as against 9% over FY13-16) and a clearer capital allocation mandate (de-leveraging and process improvements) will drive earnings and RoCE recovery – 32% EBITDA CAGR (FY16-18) and 500bps RoCE expansion to 15% by FY18 (for existing operations). Value creation through change in capital deployment A one-time bullet payment for Jaypee’s plants rather than high-cost re-investments for next 5 years increases our DCF value by ~8% for UltraTech’s existing operations. Also, Jaypee’s capacities add ~5% to overall valuation. UltraTech trades at 12x FY17E EBITDA, a 10% premium to 5-year average as against a 30-40% premium 10-year average. Our TP implies 12x FY18E EBITDA.
CHANGE IN STANCE UTCEM IN EQUITY March 16, 2016
UltraTechBUY
Cement
Recommendation Mcap (bn): `826/US$12.3 6M ADV (mn): `856/US$12.8 CMP: `3,008 TP (12 mths): `3,472 Upside (%): 16%
Flags Accounting: GREEN Predictability: AMBER Earnings Momentum: RED
Catalyst
Lower P&F costs and improved pricing will improve EBITDA/tonne from 4QFY16 onwards
Volume recovery to 8-10% in FY17-18 vs 5% in FY16
Performance (%)
Source: Bloomberg, Ambit Capital Research
45 55 65 75 85 95
105
Mar
-15
May
-15
Jun-
15
Jul-
15
Sep-
15
Oct
-15
Dec
-15
Jan-
16
Mar
-16
SENSEX UTCEM
Key financials
Y/E Dec (̀ mn) FY2014 FY2015 FY2016E FY2017E FY2018E
Operating Income (̀ mn) 202,798 229,362 250,112 286,136 332,783
EBITDA (` mn) 38,179 41,950 46,498 66,671 81,898
EBITDA margin (%) 18.8 18.3 19.1 23.3 24.6
EPS (`) 78.2 73.4 93.2 137.2 180.6
RoCE 13.1 12.8 14.2 18.2 21.0
RoIC 14.5 11.3 11.9 15.4 17.8
EV / EBITDA (x) 21.9 19.9 15.9 12.1 9.9
Source: Company, Ambit Capital research
Research Analysts
Nitin Bhasin
+91 22 3043 3241
Achint Bhagat, CFA
+91 22 3043 3178
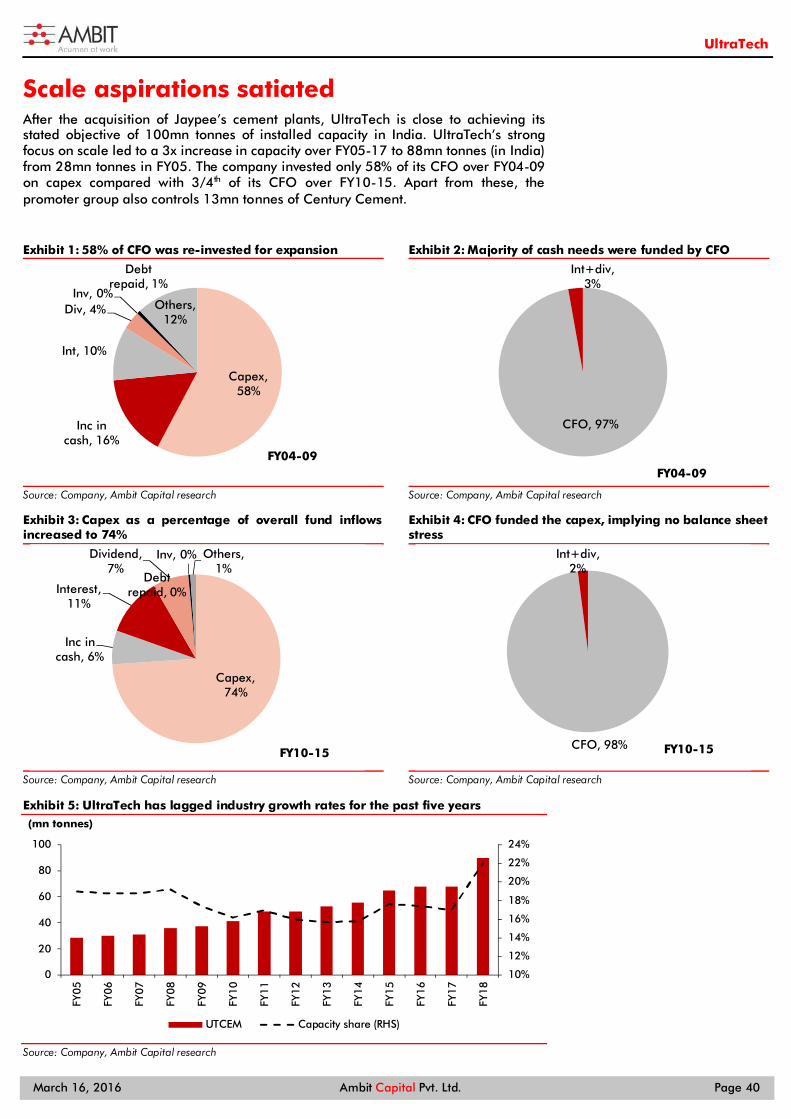
March 16, 2016 Ambit Capital Pvt. Ltd. Page 40
UltraTech
Scale aspirations satiated After the acquisition of Jaypee’s cement plants, UltraTech is close to achieving its stated objective of 100mn tonnes of installed capacity in India. UltraTech’s strong focus on scale led to a 3x increase in capacity over FY05-17 to 88mn tonnes (in India) from 28mn tonnes in FY05. The company invested only 58% of its CFO over FY04-09 on capex compared with 3/4th of its CFO over FY10-15. Apart from these, the promoter group also controls 13mn tonnes of Century Cement.
Exhibit 1: 58% of CFO was re-invested for expansion
Source: Company, Ambit Capital research
Exhibit 2: Majority of cash needs were funded by CFO
Source: Company, Ambit Capital research
Exhibit 3: Capex as a percentage of overall fund inflows increased to 74%
Source: Company, Ambit Capital research
Exhibit 4: CFO funded the capex, implying no balance sheet stress
Source: Company, Ambit Capital research
Exhibit 5: UltraTech has lagged industry growth rates for the past five years
Source: Company, Ambit Capital research
Capex, 58%
Inc in cash, 16%
Int, 10%
Div, 4%Inv, 0%
Debt repaid, 1%
Others, 12%
FY04-09
CFO, 97%
Int+div, 3%
FY04-09
Capex, 74%
Inc in cash, 6%
Interest, 11%
Dividend, 7%
Inv, 0%
Debt repaid, 0%
Others, 1%
FY10-15CFO, 98%
Int+div, 2%
FY10-15
10%
12%
14%
16%
18%
20%
22%
24%
0
20
40
60
80
100
FY05
FY06
FY07
FY08
FY09
FY10
FY11
FY12
FY13
FY14
FY15
FY16
FY17
FY18
(mn tonnes)
UTCEM Capacity share (RHS)
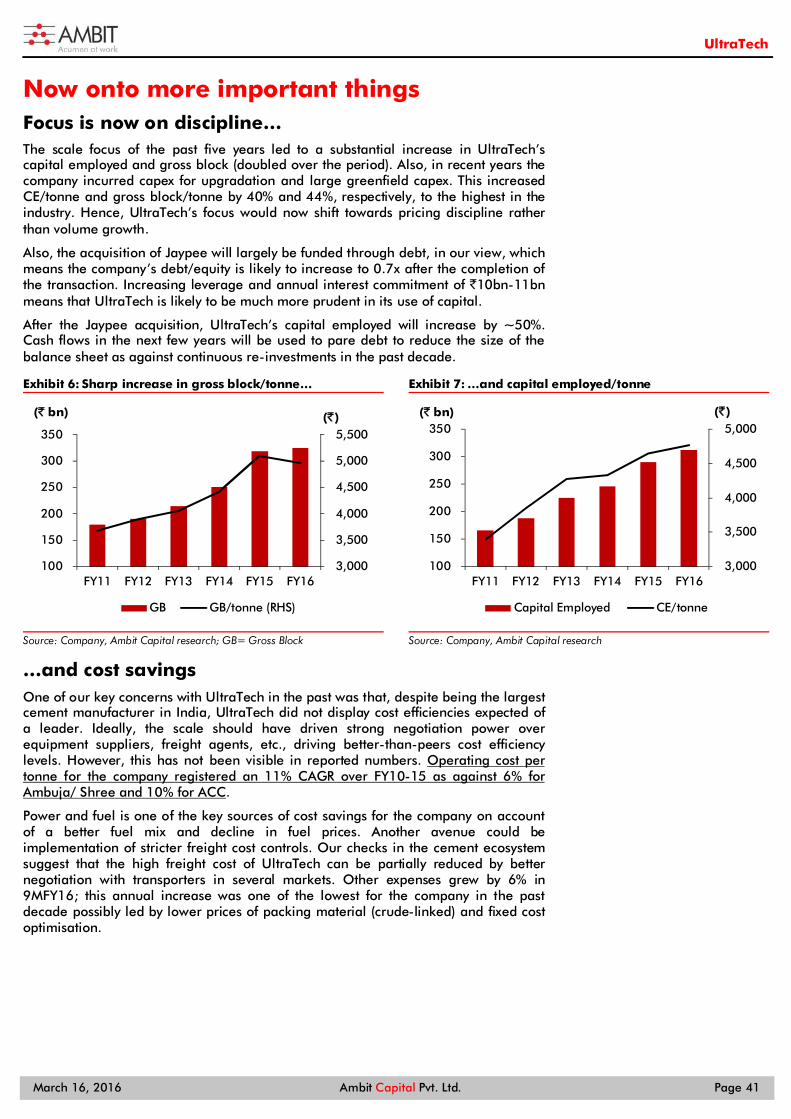
March 16, 2016 Ambit Capital Pvt. Ltd. Page 41
UltraTech
Now onto more important things Focus is now on discipline… The scale focus of the past five years led to a substantial increase in UltraTech’s capital employed and gross block (doubled over the period). Also, in recent years the company incurred capex for upgradation and large greenfield capex. This increased CE/tonne and gross block/tonne by 40% and 44%, respectively, to the highest in the industry. Hence, UltraTech’s focus would now shift towards pricing discipline rather than volume growth.
Also, the acquisition of Jaypee will largely be funded through debt, in our view, which means the company’s debt/equity is likely to increase to 0.7x after the completion of the transaction. Increasing leverage and annual interest commitment of `10bn-11bn means that UltraTech is likely to be much more prudent in its use of capital.
After the Jaypee acquisition, UltraTech’s capital employed will increase by ~50%. Cash flows in the next few years will be used to pare debt to reduce the size of the balance sheet as against continuous re-investments in the past decade.
Exhibit 6: Sharp increase in gross block/tonne…
Source: Company, Ambit Capital research; GB= Gross Block
Exhibit 7: …and capital employed/tonne
Source: Company, Ambit Capital research
…and cost savings One of our key concerns with UltraTech in the past was that, despite being the largest cement manufacturer in India, UltraTech did not display cost efficiencies expected of a leader. Ideally, the scale should have driven strong negotiation power over equipment suppliers, freight agents, etc., driving better-than-peers cost efficiency levels. However, this has not been visible in reported numbers. Operating cost per tonne for the company registered an 11% CAGR over FY10-15 as against 6% for Ambuja/ Shree and 10% for ACC.
Power and fuel is one of the key sources of cost savings for the company on account of a better fuel mix and decline in fuel prices. Another avenue could be implementation of stricter freight cost controls. Our checks in the cement ecosystem suggest that the high freight cost of UltraTech can be partially reduced by better negotiation with transporters in several markets. Other expenses grew by 6% in 9MFY16; this annual increase was one of the lowest for the company in the past decade possibly led by lower prices of packing material (crude-linked) and fixed cost optimisation.
3,000
3,500
4,000
4,500
5,000
5,500
100
150
200
250
300
350
FY11 FY12 FY13 FY14 FY15 FY16
(`)(` bn)
GB GB/tonne (RHS)
3,000
3,500
4,000
4,500
5,000
100
150
200
250
300
350
FY11 FY12 FY13 FY14 FY15 FY16
(`)(` bn)
Capital Employed CE/tonne
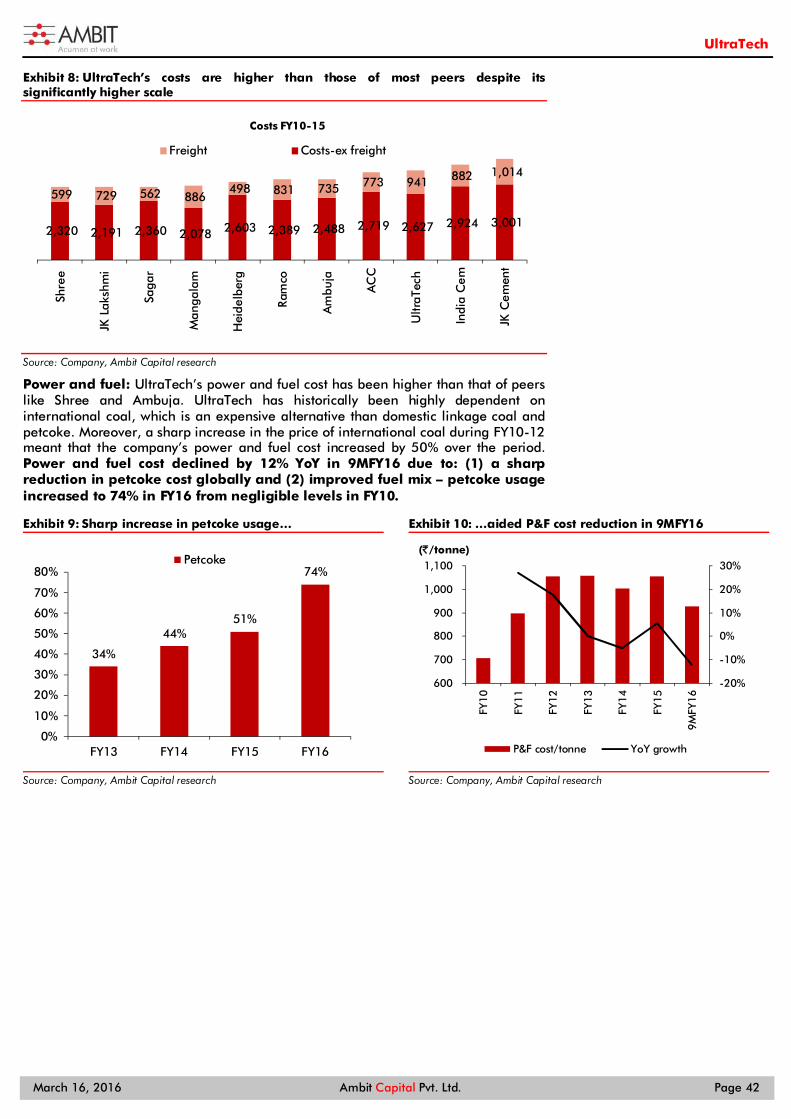
March 16, 2016 Ambit Capital Pvt. Ltd. Page 42
UltraTech
Exhibit 8: UltraTech’s costs are higher than those of most peers despite its significantly higher scale
Source: Company, Ambit Capital research
Power and fuel: UltraTech’s power and fuel cost has been higher than that of peers like Shree and Ambuja. UltraTech has historically been highly dependent on international coal, which is an expensive alternative than domestic linkage coal and petcoke. Moreover, a sharp increase in the price of international coal during FY10-12 meant that the company’s power and fuel cost increased by 50% over the period. Power and fuel cost declined by 12% YoY in 9MFY16 due to: (1) a sharp reduction in petcoke cost globally and (2) improved fuel mix – petcoke usage increased to 74% in FY16 from negligible levels in FY10.
Exhibit 9: Sharp increase in petcoke usage…
Source: Company, Ambit Capital research
Exhibit 10: …aided P&F cost reduction in 9MFY16
Source: Company, Ambit Capital research
2,320 2,191 2,360 2,078 2,603 2,389 2,488 2,719 2,627 2,924 3,001
599 729 562 886 498 831 735 773 941 882 1,014
Shre
e
JK L
aksh
mi
Saga
r
Man
gala
m
Hei
delb
erg
Ram
co
Am
buja
AC
C
Ultr
aTec
h
Indi
a C
em
JK C
emen
t
Costs FY10-15
Freight Costs-ex freight
34%
44%51%
74%
0%
10%
20%
30%
40%
50%
60%
70%
80%
FY13 FY14 FY15 FY16
Petcoke
-20%
-10%
0%
10%
20%
30%
600
700
800
900
1,000
1,100
FY10
FY11
FY12
FY13
FY14
FY15
9MFY
16
(`/tonne)
P&F cost/tonne YoY growth
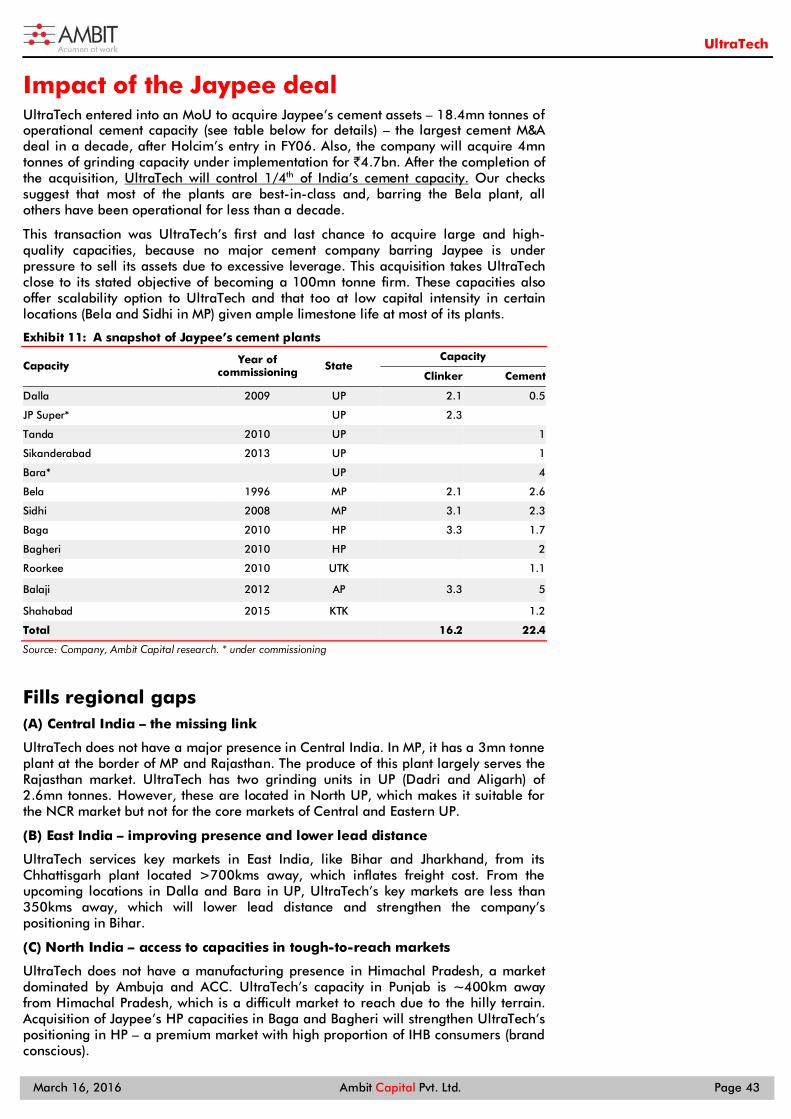
March 16, 2016 Ambit Capital Pvt. Ltd. Page 43
UltraTech
Impact of the Jaypee deal UltraTech entered into an MoU to acquire Jaypee’s cement assets – 18.4mn tonnes of operational cement capacity (see table below for details) – the largest cement M&A deal in a decade, after Holcim’s entry in FY06. Also, the company will acquire 4mn tonnes of grinding capacity under implementation for `4.7bn. After the completion of the acquisition, UltraTech will control 1/4th of India’s cement capacity. Our checks suggest that most of the plants are best-in-class and, barring the Bela plant, all others have been operational for less than a decade.
This transaction was UltraTech’s first and last chance to acquire large and high-quality capacities, because no major cement company barring Jaypee is under pressure to sell its assets due to excessive leverage. This acquisition takes UltraTech close to its stated objective of becoming a 100mn tonne firm. These capacities also offer scalability option to UltraTech and that too at low capital intensity in certain locations (Bela and Sidhi in MP) given ample limestone life at most of its plants.
Exhibit 11: A snapshot of Jaypee’s cement plants
Capacity Year of commissioning State
Capacity
Clinker Cement
Dalla 2009 UP 2.1 0.5
JP Super* UP 2.3 Tanda 2010 UP 1
Sikanderabad 2013 UP 1
Bara* UP 4
Bela 1996 MP 2.1 2.6
Sidhi 2008 MP 3.1 2.3
Baga 2010 HP 3.3 1.7
Bagheri 2010 HP 2
Roorkee 2010 UTK 1.1
Balaji 2012 AP 3.3 5
Shahabad 2015 KTK 1.2
Total 16.2 22.4
Source: Company, Ambit Capital research. * under commissioning
Fills regional gaps (A) Central India – the missing link
UltraTech does not have a major presence in Central India. In MP, it has a 3mn tonne plant at the border of MP and Rajasthan. The produce of this plant largely serves the Rajasthan market. UltraTech has two grinding units in UP (Dadri and Aligarh) of 2.6mn tonnes. However, these are located in North UP, which makes it suitable for the NCR market but not for the core markets of Central and Eastern UP.
(B) East India – improving presence and lower lead distance
UltraTech services key markets in East India, like Bihar and Jharkhand, from its Chhattisgarh plant located >700kms away, which inflates freight cost. From the upcoming locations in Dalla and Bara in UP, UltraTech’s key markets are less than 350kms away, which will lower lead distance and strengthen the company’s positioning in Bihar.
(C) North India – access to capacities in tough-to-reach markets
UltraTech does not have a manufacturing presence in Himachal Pradesh, a market dominated by Ambuja and ACC. UltraTech’s capacity in Punjab is ~400km away from Himachal Pradesh, which is a difficult market to reach due to the hilly terrain. Acquisition of Jaypee’s HP capacities in Baga and Bagheri will strengthen UltraTech’s positioning in HP – a premium market with high proportion of IHB consumers (brand conscious).
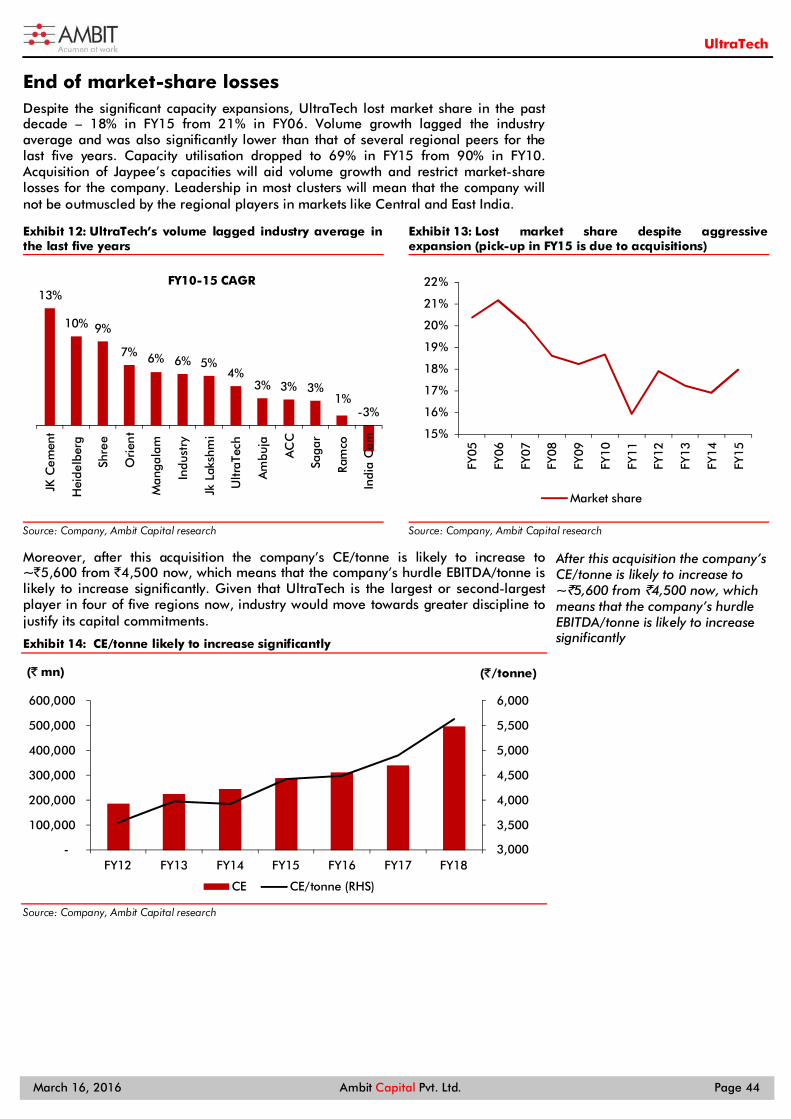
March 16, 2016 Ambit Capital Pvt. Ltd. Page 44
UltraTech
End of market-share losses Despite the significant capacity expansions, UltraTech lost market share in the past decade – 18% in FY15 from 21% in FY06. Volume growth lagged the industry average and was also significantly lower than that of several regional peers for the last five years. Capacity utilisation dropped to 69% in FY15 from 90% in FY10. Acquisition of Jaypee’s capacities will aid volume growth and restrict market-share losses for the company. Leadership in most clusters will mean that the company will not be outmuscled by the regional players in markets like Central and East India.
Exhibit 12: UltraTech’s volume lagged industry average in the last five years
Source: Company, Ambit Capital research
Exhibit 13: Lost market share despite aggressive expansion (pick-up in FY15 is due to acquisitions)
Source: Company, Ambit Capital research
Moreover, after this acquisition the company’s CE/tonne is likely to increase to ~`5,600 from `4,500 now, which means that the company’s hurdle EBITDA/tonne is likely to increase significantly. Given that UltraTech is the largest or second-largest player in four of five regions now, industry would move towards greater discipline to justify its capital commitments.
Exhibit 14: CE/tonne likely to increase significantly
Source: Company, Ambit Capital research
13%
10% 9%
7% 6% 6% 5%4%
3% 3% 3%1%
-3%
JK C
emen
t
Hei
delb
erg
Shre
e
Ori
ent
Man
gala
m
Indu
stry
Jk L
aksh
mi
Ultr
aTec
h
Am
buja
AC
C
Saga
r
Ram
co
Indi
a C
em
FY10-15 CAGR
15%
16%
17%
18%
19%
20%
21%
22%
FY05
FY06
FY07
FY08
FY09
FY10
FY11
FY12
FY13
FY14
FY15
Market share
3,000
3,500
4,000
4,500
5,000
5,500
6,000
-
100,000
200,000
300,000
400,000
500,000
600,000
FY12 FY13 FY14 FY15 FY16 FY17 FY18
(`/tonne)(` mn)
CE CE/tonne (RHS)
After this acquisition the company’s CE/tonne is likely to increase to ~`5,600 from `4,500 now, which means that the company’s hurdle EBITDA/tonne is likely to increase significantly
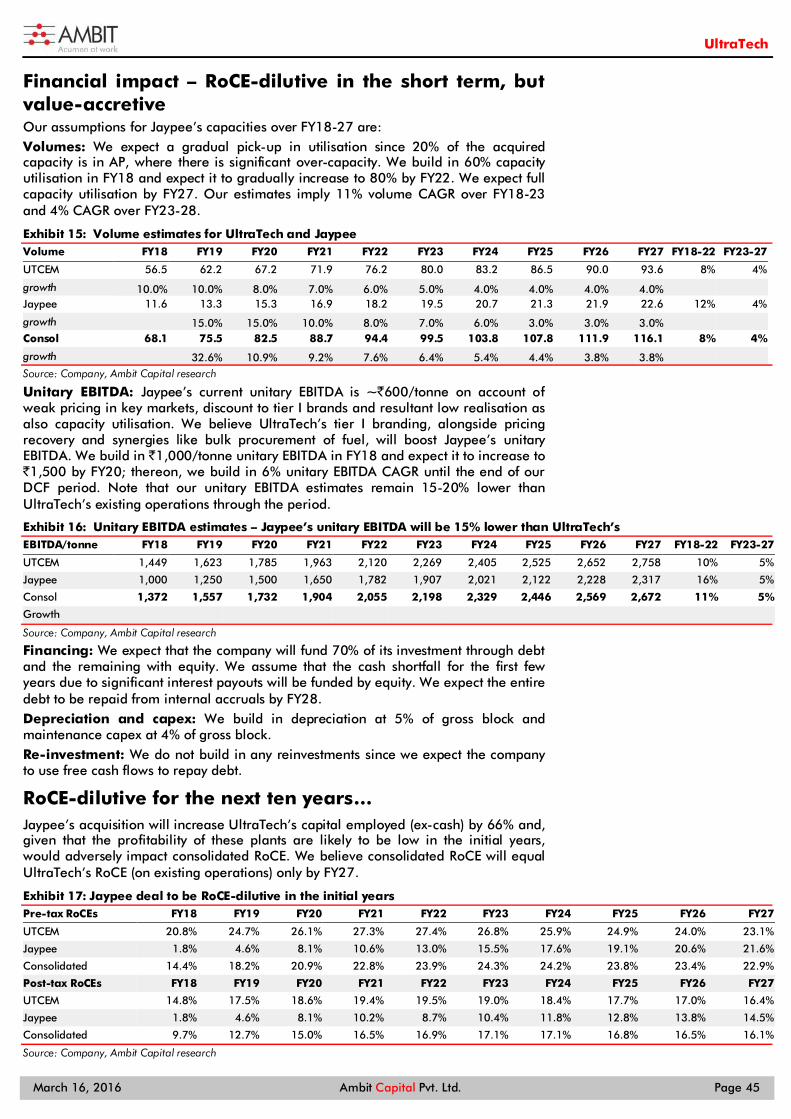
March 16, 2016 Ambit Capital Pvt. Ltd. Page 45
UltraTech
Financial impact – RoCE-dilutive in the short term, but value-accretive Our assumptions for Jaypee’s capacities over FY18-27 are: Volumes: We expect a gradual pick-up in utilisation since 20% of the acquired capacity is in AP, where there is significant over-capacity. We build in 60% capacity utilisation in FY18 and expect it to gradually increase to 80% by FY22. We expect full capacity utilisation by FY27. Our estimates imply 11% volume CAGR over FY18-23 and 4% CAGR over FY23-28.
Exhibit 15: Volume estimates for UltraTech and Jaypee Volume FY18 FY19 FY20 FY21 FY22 FY23 FY24 FY25 FY26 FY27 FY18-22 FY23-27
UTCEM 56.5 62.2 67.2 71.9 76.2 80.0 83.2 86.5 90.0 93.6 8% 4%
growth 10.0% 10.0% 8.0% 7.0% 6.0% 5.0% 4.0% 4.0% 4.0% 4.0%
Jaypee 11.6 13.3 15.3 16.9 18.2 19.5 20.7 21.3 21.9 22.6 12% 4%
growth 15.0% 15.0% 10.0% 8.0% 7.0% 6.0% 3.0% 3.0% 3.0%
Consol 68.1 75.5 82.5 88.7 94.4 99.5 103.8 107.8 111.9 116.1 8% 4%
growth 32.6% 10.9% 9.2% 7.6% 6.4% 5.4% 4.4% 3.8% 3.8%
Source: Company, Ambit Capital research
Unitary EBITDA: Jaypee’s current unitary EBITDA is ~`600/tonne on account of weak pricing in key markets, discount to tier I brands and resultant low realisation as also capacity utilisation. We believe UltraTech’s tier I branding, alongside pricing recovery and synergies like bulk procurement of fuel, will boost Jaypee’s unitary EBITDA. We build in `1,000/tonne unitary EBITDA in FY18 and expect it to increase to `1,500 by FY20; thereon, we build in 6% unitary EBITDA CAGR until the end of our DCF period. Note that our unitary EBITDA estimates remain 15-20% lower than UltraTech’s existing operations through the period.
Exhibit 16: Unitary EBITDA estimates – Jaypee’s unitary EBITDA will be 15% lower than UltraTech’s EBITDA/tonne FY18 FY19 FY20 FY21 FY22 FY23 FY24 FY25 FY26 FY27 FY18-22 FY23-27
UTCEM 1,449 1,623 1,785 1,963 2,120 2,269 2,405 2,525 2,652 2,758 10% 5%
Jaypee 1,000 1,250 1,500 1,650 1,782 1,907 2,021 2,122 2,228 2,317 16% 5%
Consol 1,372 1,557 1,732 1,904 2,055 2,198 2,329 2,446 2,569 2,672 11% 5%
Growth
Source: Company, Ambit Capital research
Financing: We expect that the company will fund 70% of its investment through debt and the remaining with equity. We assume that the cash shortfall for the first few years due to significant interest payouts will be funded by equity. We expect the entire debt to be repaid from internal accruals by FY28. Depreciation and capex: We build in depreciation at 5% of gross block and maintenance capex at 4% of gross block. Re-investment: We do not build in any reinvestments since we expect the company to use free cash flows to repay debt.
RoCE-dilutive for the next ten years… Jaypee’s acquisition will increase UltraTech’s capital employed (ex-cash) by 66% and, given that the profitability of these plants are likely to be low in the initial years, would adversely impact consolidated RoCE. We believe consolidated RoCE will equal UltraTech’s RoCE (on existing operations) only by FY27.
Exhibit 17: Jaypee deal to be RoCE-dilutive in the initial years Pre-tax RoCEs FY18 FY19 FY20 FY21 FY22 FY23 FY24 FY25 FY26 FY27
UTCEM 20.8% 24.7% 26.1% 27.3% 27.4% 26.8% 25.9% 24.9% 24.0% 23.1%
Jaypee 1.8% 4.6% 8.1% 10.6% 13.0% 15.5% 17.6% 19.1% 20.6% 21.6%
Consolidated 14.4% 18.2% 20.9% 22.8% 23.9% 24.3% 24.2% 23.8% 23.4% 22.9%
Post-tax RoCEs FY18 FY19 FY20 FY21 FY22 FY23 FY24 FY25 FY26 FY27
UTCEM 14.8% 17.5% 18.6% 19.4% 19.5% 19.0% 18.4% 17.7% 17.0% 16.4%
Jaypee 1.8% 4.6% 8.1% 10.2% 8.7% 10.4% 11.8% 12.8% 13.8% 14.5%
Consolidated 9.7% 12.7% 15.0% 16.5% 16.9% 17.1% 17.1% 16.8% 16.5% 16.1%
Source: Company, Ambit Capital research
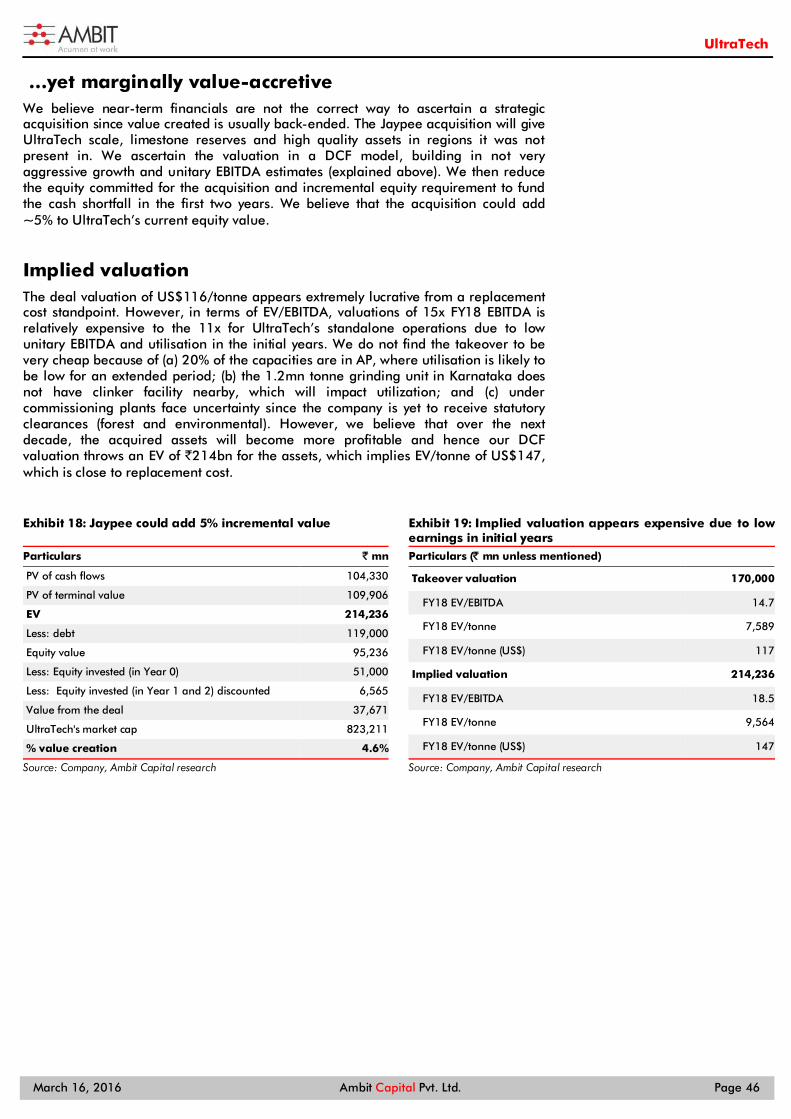
March 16, 2016 Ambit Capital Pvt. Ltd. Page 46
UltraTech
…yet marginally value-accretive We believe near-term financials are not the correct way to ascertain a strategic acquisition since value created is usually back-ended. The Jaypee acquisition will give UltraTech scale, limestone reserves and high quality assets in regions it was not present in. We ascertain the valuation in a DCF model, building in not very aggressive growth and unitary EBITDA estimates (explained above). We then reduce the equity committed for the acquisition and incremental equity requirement to fund the cash shortfall in the first two years. We believe that the acquisition could add ~5% to UltraTech’s current equity value.
Implied valuation The deal valuation of US$116/tonne appears extremely lucrative from a replacement cost standpoint. However, in terms of EV/EBITDA, valuations of 15x FY18 EBITDA is relatively expensive to the 11x for UltraTech’s standalone operations due to low unitary EBITDA and utilisation in the initial years. We do not find the takeover to be very cheap because of (a) 20% of the capacities are in AP, where utilisation is likely to be low for an extended period; (b) the 1.2mn tonne grinding unit in Karnataka does not have clinker facility nearby, which will impact utilization; and (c) under commissioning plants face uncertainty since the company is yet to receive statutory clearances (forest and environmental). However, we believe that over the next decade, the acquired assets will become more profitable and hence our DCF valuation throws an EV of `214bn for the assets, which implies EV/tonne of US$147, which is close to replacement cost.
Exhibit 18: Jaypee could add 5% incremental value Particulars ` mn
PV of cash flows 104,330
PV of terminal value 109,906
EV 214,236
Less: debt 119,000
Equity value 95,236
Less: Equity invested (in Year 0) 51,000
Less: Equity invested (in Year 1 and 2) discounted 6,565
Value from the deal 37,671
UltraTech's market cap 823,211
% value creation 4.6%
Source: Company, Ambit Capital research
Exhibit 19: Implied valuation appears expensive due to low earnings in initial years Particulars (̀ mn unless mentioned)
Takeover valuation 170,000
FY18 EV/EBITDA 14.7
FY18 EV/tonne 7,589
FY18 EV/tonne (US$) 117
Implied valuation 214,236
FY18 EV/EBITDA 18.5
FY18 EV/tonne 9,564
FY18 EV/tonne (US$) 147
Source: Company, Ambit Capital research
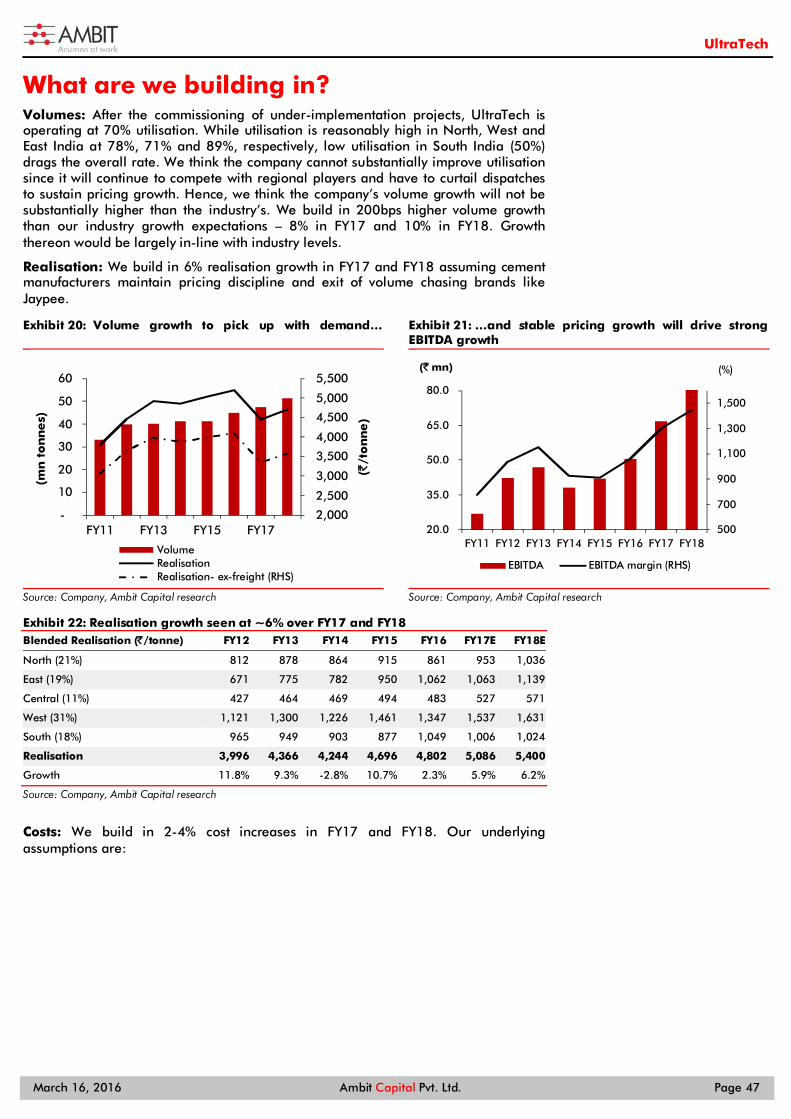
March 16, 2016 Ambit Capital Pvt. Ltd. Page 47
UltraTech
What are we building in? Volumes: After the commissioning of under-implementation projects, UltraTech is operating at 70% utilisation. While utilisation is reasonably high in North, West and East India at 78%, 71% and 89%, respectively, low utilisation in South India (50%) drags the overall rate. We think the company cannot substantially improve utilisation since it will continue to compete with regional players and have to curtail dispatches to sustain pricing growth. Hence, we think the company’s volume growth will not be substantially higher than the industry’s. We build in 200bps higher volume growth than our industry growth expectations – 8% in FY17 and 10% in FY18. Growth thereon would be largely in-line with industry levels.
Realisation: We build in 6% realisation growth in FY17 and FY18 assuming cement manufacturers maintain pricing discipline and exit of volume chasing brands like Jaypee.
Exhibit 20: Volume growth to pick up with demand…
Source: Company, Ambit Capital research
Exhibit 21: …and stable pricing growth will drive strong EBITDA growth
Source: Company, Ambit Capital research
Exhibit 22: Realisation growth seen at ~6% over FY17 and FY18 Blended Realisation (̀ /tonne) FY12 FY13 FY14 FY15 FY16 FY17E FY18E
North (21%) 812 878 864 915 861 953 1,036
East (19%) 671 775 782 950 1,062 1,063 1,139
Central (11%) 427 464 469 494 483 527 571
West (31%) 1,121 1,300 1,226 1,461 1,347 1,537 1,631
South (18%) 965 949 903 877 1,049 1,006 1,024
Realisation 3,996 4,366 4,244 4,696 4,802 5,086 5,400
Growth 11.8% 9.3% -2.8% 10.7% 2.3% 5.9% 6.2%
Source: Company, Ambit Capital research
Costs: We build in 2-4% cost increases in FY17 and FY18. Our underlying assumptions are:
2,000
2,500
3,000
3,500
4,000
4,500
5,000
5,500
-
10
20
30
40
50
60
FY11 FY13 FY15 FY17
(`/t
on
ne
)
(mn
to
nn
es)
VolumeRealisationRealisation- ex-freight (RHS)
500
700
900
1,100
1,300
1,500
20.0
35.0
50.0
65.0
80.0
FY11 FY12 FY13 FY14 FY15 FY16 FY17 FY18
(%)(` mn)
EBITDA EBITDA margin (RHS)
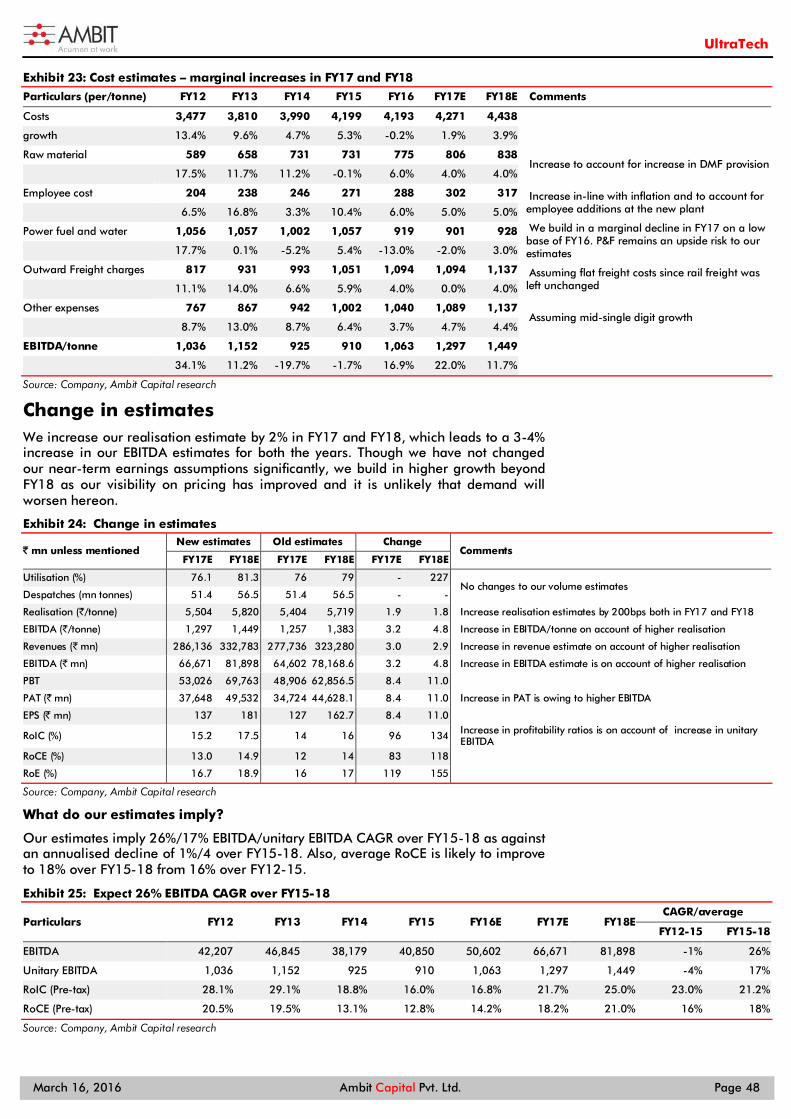
March 16, 2016 Ambit Capital Pvt. Ltd. Page 48
UltraTech
Exhibit 23: Cost estimates – marginal increases in FY17 and FY18
Particulars (per/tonne) FY12 FY13 FY14 FY15 FY16 FY17E FY18E Comments
Costs 3,477 3,810 3,990 4,199 4,193 4,271 4,438 growth 13.4% 9.6% 4.7% 5.3% -0.2% 1.9% 3.9% Raw material 589 658 731 731 775 806 838
Increase to account for increase in DMF provision 17.5% 11.7% 11.2% -0.1% 6.0% 4.0% 4.0%
Employee cost 204 238 246 271 288 302 317 Increase in-line with inflation and to account for employee additions at the new plant
6.5% 16.8% 3.3% 10.4% 6.0% 5.0% 5.0%
Power fuel and water 1,056 1,057 1,002 1,057 919 901 928 We build in a marginal decline in FY17 on a low base of FY16. P&F remains an upside risk to our estimates 17.7% 0.1% -5.2% 5.4% -13.0% -2.0% 3.0%
Outward Freight charges 817 931 993 1,051 1,094 1,094 1,137 Assuming flat freight costs since rail freight was left unchanged
11.1% 14.0% 6.6% 5.9% 4.0% 0.0% 4.0%
Other expenses 767 867 942 1,002 1,040 1,089 1,137 Assuming mid-single digit growth
8.7% 13.0% 8.7% 6.4% 3.7% 4.7% 4.4%
EBITDA/tonne 1,036 1,152 925 910 1,063 1,297 1,449 34.1% 11.2% -19.7% -1.7% 16.9% 22.0% 11.7%
Source: Company, Ambit Capital research
Change in estimates We increase our realisation estimate by 2% in FY17 and FY18, which leads to a 3-4% increase in our EBITDA estimates for both the years. Though we have not changed our near-term earnings assumptions significantly, we build in higher growth beyond FY18 as our visibility on pricing has improved and it is unlikely that demand will worsen hereon.
Exhibit 24: Change in estimates
` mn unless mentioned New estimates Old estimates Change
Comments FY17E FY18E FY17E FY18E FY17E FY18E
Utilisation (%) 76.1 81.3 76 79 - 227 No changes to our volume estimates
Despatches (mn tonnes) 51.4 56.5 51.4 56.5 - -
Realisation (`/tonne) 5,504 5,820 5,404 5,719 1.9 1.8 Increase realisation estimates by 200bps both in FY17 and FY18
EBITDA (`/tonne) 1,297 1,449 1,257 1,383 3.2 4.8 Increase in EBITDA/tonne on account of higher realisation
Revenues ( ̀mn) 286,136 332,783 277,736 323,280 3.0 2.9 Increase in revenue estimate on account of higher realisation
EBITDA (` mn) 66,671 81,898 64,602 78,168.6 3.2 4.8 Increase in EBITDA estimate is on account of higher realisation
PBT 53,026 69,763 48,906 62,856.5 8.4 11.0
Increase in PAT is owing to higher EBITDA PAT (` mn) 37,648 49,532 34,724 44,628.1 8.4 11.0
EPS (̀ mn) 137 181 127 162.7 8.4 11.0
RoIC (%) 15.2 17.5 14 16 96 134 Increase in profitability ratios is on account of increase in unitary EBITDA
RoCE (%) 13.0 14.9 12 14 83 118
RoE (%) 16.7 18.9 16 17 119 155
Source: Company, Ambit Capital research
What do our estimates imply?
Our estimates imply 26%/17% EBITDA/unitary EBITDA CAGR over FY15-18 as against an annualised decline of 1%/4 over FY15-18. Also, average RoCE is likely to improve to 18% over FY15-18 from 16% over FY12-15.
Exhibit 25: Expect 26% EBITDA CAGR over FY15-18
Particulars FY12 FY13 FY14 FY15 FY16E FY17E FY18E CAGR/average
FY12-15 FY15-18
EBITDA 42,207 46,845 38,179 40,850 50,602 66,671 81,898 -1% 26%
Unitary EBITDA 1,036 1,152 925 910 1,063 1,297 1,449 -4% 17%
RoIC (Pre-tax) 28.1% 29.1% 18.8% 16.0% 16.8% 21.7% 25.0% 23.0% 21.2%
RoCE (Pre-tax) 20.5% 19.5% 13.1% 12.8% 14.2% 18.2% 21.0% 16% 18%
Source: Company, Ambit Capital research
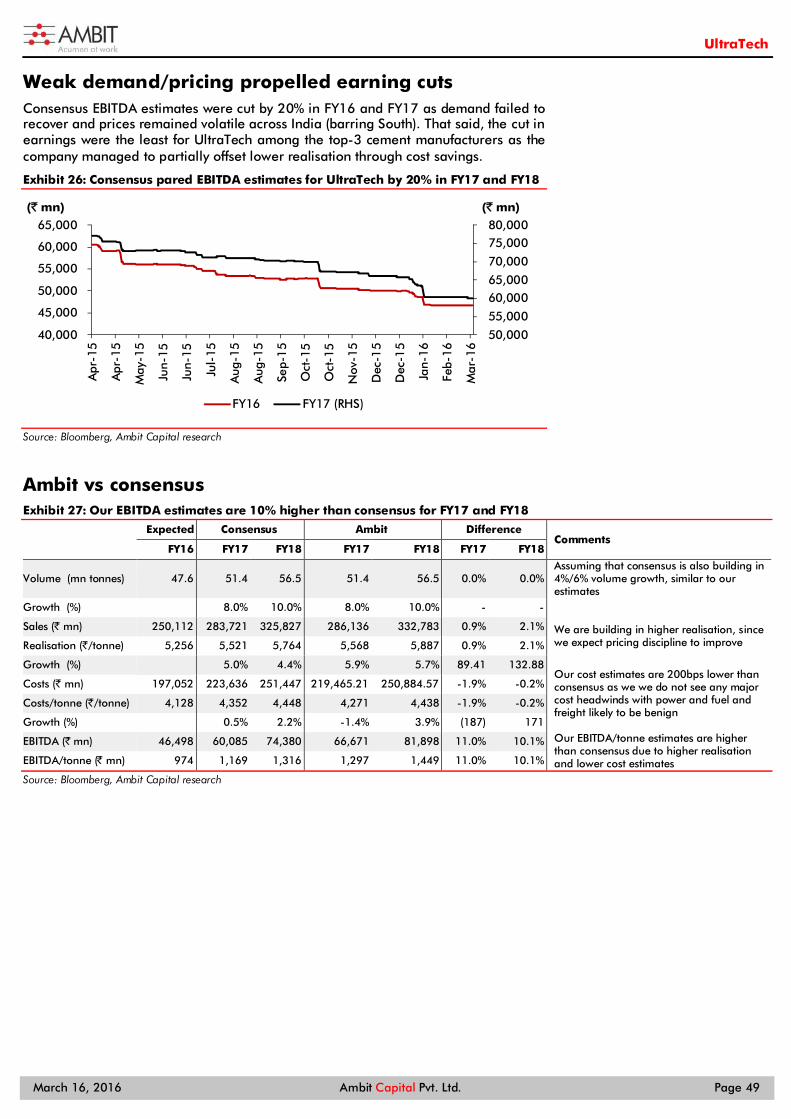
March 16, 2016 Ambit Capital Pvt. Ltd. Page 49
UltraTech
Weak demand/pricing propelled earning cuts Consensus EBITDA estimates were cut by 20% in FY16 and FY17 as demand failed to recover and prices remained volatile across India (barring South). That said, the cut in earnings were the least for UltraTech among the top-3 cement manufacturers as the company managed to partially offset lower realisation through cost savings.
Exhibit 26: Consensus pared EBITDA estimates for UltraTech by 20% in FY17 and FY18
Source: Bloomberg, Ambit Capital research
Ambit vs consensus Exhibit 27: Our EBITDA estimates are 10% higher than consensus for FY17 and FY18
Expected Consensus Ambit Difference Comments
FY16 FY17 FY18 FY17 FY18 FY17 FY18
Volume (mn tonnes) 47.6 51.4 56.5 51.4 56.5 0.0% 0.0% Assuming that consensus is also building in 4%/6% volume growth, similar to our estimates
Growth (%) 8.0% 10.0% 8.0% 10.0% - - Sales (` mn) 250,112 283,721 325,827 286,136 332,783 0.9% 2.1% We are building in higher realisation, since
we expect pricing discipline to improve Realisation (`/tonne) 5,256 5,521 5,764 5,568 5,887 0.9% 2.1%
Growth (%) 5.0% 4.4% 5.9% 5.7% 89.41 132.88 Our cost estimates are 200bps lower than consensus as we we do not see any major cost headwinds with power and fuel and freight likely to be benign
Costs (` mn) 197,052 223,636 251,447 219,465.21 250,884.57 -1.9% -0.2%
Costs/tonne (`/tonne) 4,128 4,352 4,448 4,271 4,438 -1.9% -0.2%
Growth (%) 0.5% 2.2% -1.4% 3.9% (187) 171
EBITDA (` mn) 46,498 60,085 74,380 66,671 81,898 11.0% 10.1% Our EBITDA/tonne estimates are higher than consensus due to higher realisation and lower cost estimates EBITDA/tonne (̀ mn) 974 1,169 1,316 1,297 1,449 11.0% 10.1%
Source: Bloomberg, Ambit Capital research
50,000
55,000
60,000 65,000
70,000
75,000 80,000
40,000
45,000
50,000
55,000
60,000
65,000
Apr
-15
Apr
-15
May
-15
Jun-
15
Jun-
15
Jul-
15
Aug
-15
Aug
-15
Sep-
15
Oct
-15
Oct
-15
Nov
-15
Dec
-15
Dec
-15
Jan-
16
Feb-
16
Mar
-16
(` mn)(` mn)
FY16 FY17 (RHS)
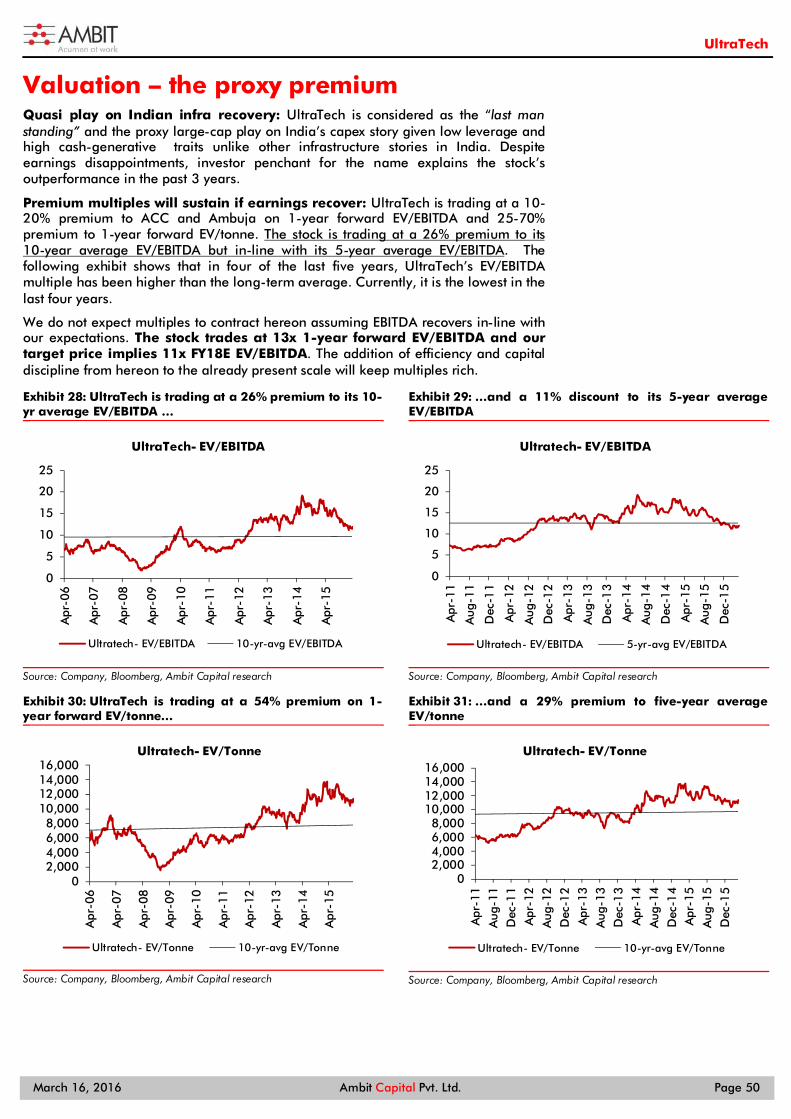
March 16, 2016 Ambit Capital Pvt. Ltd. Page 50
UltraTech
Valuation – the proxy premium Quasi play on Indian infra recovery: UltraTech is considered as the “last man standing” and the proxy large-cap play on India’s capex story given low leverage and high cash-generative traits unlike other infrastructure stories in India. Despite earnings disappointments, investor penchant for the name explains the stock’s outperformance in the past 3 years.
Premium multiples will sustain if earnings recover: UltraTech is trading at a 10-20% premium to ACC and Ambuja on 1-year forward EV/EBITDA and 25-70% premium to 1-year forward EV/tonne. The stock is trading at a 26% premium to its 10-year average EV/EBITDA but in-line with its 5-year average EV/EBITDA. The following exhibit shows that in four of the last five years, UltraTech’s EV/EBITDA multiple has been higher than the long-term average. Currently, it is the lowest in the last four years.
We do not expect multiples to contract hereon assuming EBITDA recovers in-line with our expectations. The stock trades at 13x 1-year forward EV/EBITDA and our target price implies 11x FY18E EV/EBITDA. The addition of efficiency and capital discipline from hereon to the already present scale will keep multiples rich.
Exhibit 28: UltraTech is trading at a 26% premium to its 10-yr average EV/EBITDA …
Source: Company, Bloomberg, Ambit Capital research
Exhibit 29: …and a 11% discount to its 5-year average EV/EBITDA
Source: Company, Bloomberg, Ambit Capital research
Exhibit 30: UltraTech is trading at a 54% premium on 1-year forward EV/tonne…
Source: Company, Bloomberg, Ambit Capital research
Exhibit 31: …and a 29% premium to five-year average EV/tonne
Source: Company, Bloomberg, Ambit Capital research
0
5
10
15
20
25
Apr
-06
Apr
-07
Apr
-08
Apr
-09
Apr
-10
Apr
-11
Apr
-12
Apr
-13
Apr
-14
Apr
-15
UltraTech- EV/EBITDA
Ultratech- EV/EBITDA 10-yr-avg EV/EBITDA
0
5
10
15
20
25
Apr
-11
Aug
-11
Dec
-11
Apr
-12
Aug
-12
Dec
-12
Apr
-13
Aug
-13
Dec
-13
Apr
-14
Aug
-14
Dec
-14
Apr
-15
Aug
-15
Dec
-15
Ultratech- EV/EBITDA
Ultratech- EV/EBITDA 5-yr-avg EV/EBITDA
02,0004,0006,0008,000
10,00012,00014,00016,000
Apr
-06
Apr
-07
Apr
-08
Apr
-09
Apr
-10
Apr
-11
Apr
-12
Apr
-13
Apr
-14
Apr
-15
Ultratech- EV/Tonne
Ultratech- EV/Tonne 10-yr-avg EV/Tonne
02,0004,0006,0008,000
10,00012,00014,00016,000
Apr
-11
Aug
-11
Dec
-11
Apr
-12
Aug
-12
Dec
-12
Apr
-13
Aug
-13
Dec
-13
Apr
-14
Aug
-14
Dec
-14
Apr
-15
Aug
-15
Dec
-15
Ultratech- EV/Tonne
Ultratech- EV/Tonne 10-yr-avg EV/Tonne
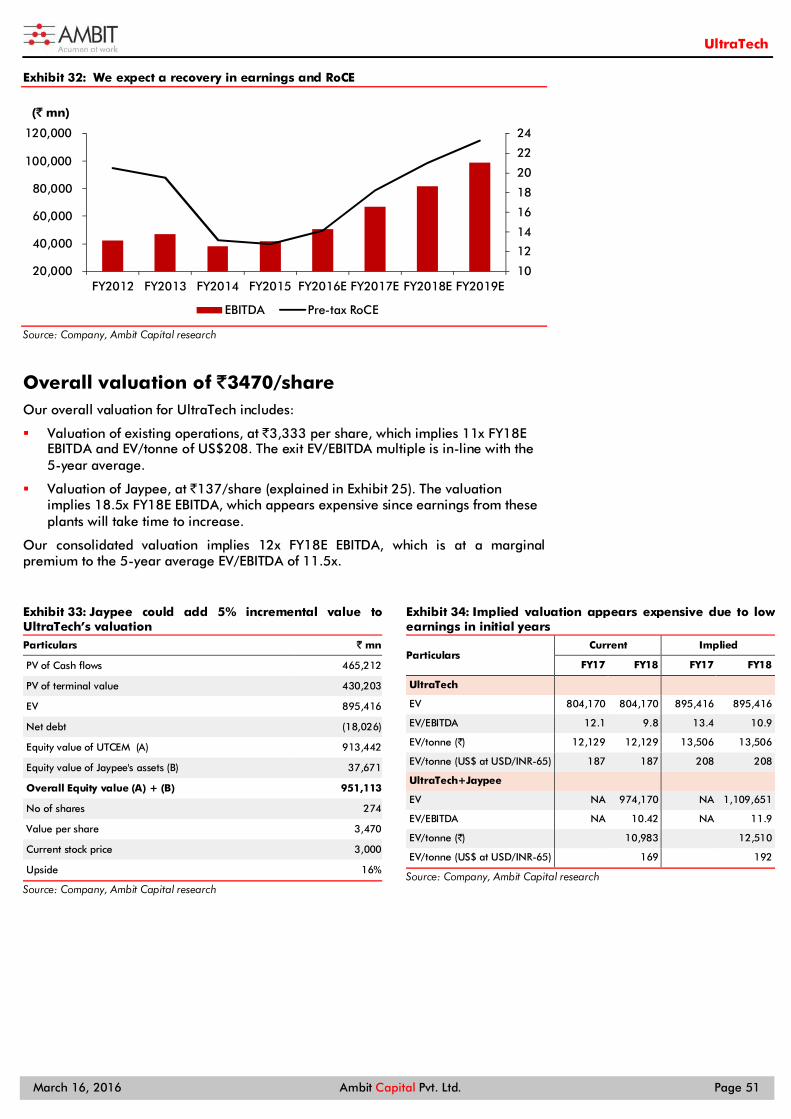
March 16, 2016 Ambit Capital Pvt. Ltd. Page 51
UltraTech
Exhibit 32: We expect a recovery in earnings and RoCE
Source: Company, Ambit Capital research
Overall valuation of `3470/share Our overall valuation for UltraTech includes:
Valuation of existing operations, at `3,333 per share, which implies 11x FY18E EBITDA and EV/tonne of US$208. The exit EV/EBITDA multiple is in-line with the 5-year average.
Valuation of Jaypee, at `137/share (explained in Exhibit 25). The valuation implies 18.5x FY18E EBITDA, which appears expensive since earnings from these plants will take time to increase.
Our consolidated valuation implies 12x FY18E EBITDA, which is at a marginal premium to the 5-year average EV/EBITDA of 11.5x.
Exhibit 33: Jaypee could add 5% incremental value to UltraTech’s valuation Particulars ` mn
PV of Cash flows 465,212
PV of terminal value 430,203
EV 895,416
Net debt (18,026)
Equity value of UTCEM (A) 913,442
Equity value of Jaypee's assets (B) 37,671
Overall Equity value (A) + (B) 951,113
No of shares 274
Value per share 3,470
Current stock price 3,000
Upside 16%
Source: Company, Ambit Capital research
Exhibit 34: Implied valuation appears expensive due to low earnings in initial years
Particulars Current Implied
FY17 FY18 FY17 FY18
UltraTech
EV 804,170 804,170 895,416 895,416
EV/EBITDA 12.1 9.8 13.4 10.9
EV/tonne ( )̀ 12,129 12,129 13,506 13,506
EV/tonne (US$ at USD/INR-65) 187 187 208 208
UltraTech+Jaypee
EV NA 974,170 NA 1,109,651
EV/EBITDA NA 10.42 NA 11.9
EV/tonne ( )̀
10,983
12,510
EV/tonne (US$ at USD/INR-65)
169
192
Source: Company, Ambit Capital research
10
12
14
16
18
20
22
24
20,000
40,000
60,000
80,000
100,000
120,000
FY2012 FY2013 FY2014 FY2015 FY2016E FY2017E FY2018E FY2019E
(` mn)
EBITDA Pre-tax RoCE
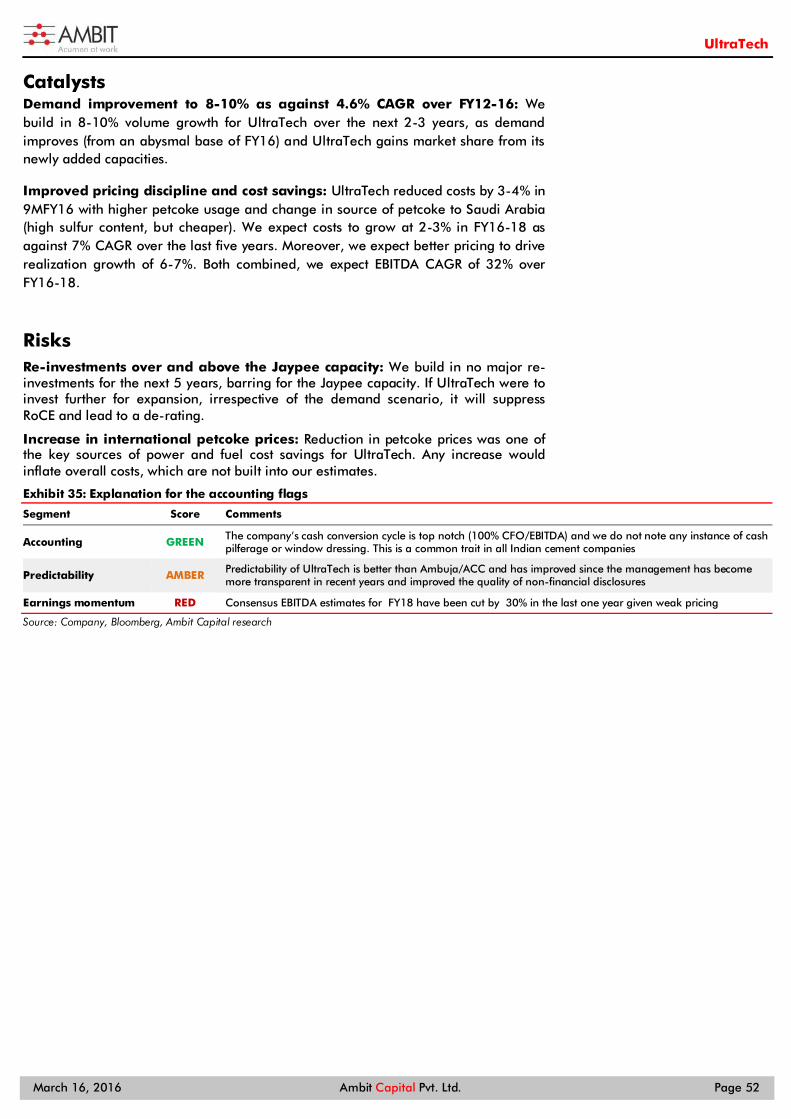
March 16, 2016 Ambit Capital Pvt. Ltd. Page 52
UltraTech
Catalysts Demand improvement to 8-10% as against 4.6% CAGR over FY12-16: We build in 8-10% volume growth for UltraTech over the next 2-3 years, as demand improves (from an abysmal base of FY16) and UltraTech gains market share from its newly added capacities.
Improved pricing discipline and cost savings: UltraTech reduced costs by 3-4% in 9MFY16 with higher petcoke usage and change in source of petcoke to Saudi Arabia (high sulfur content, but cheaper). We expect costs to grow at 2-3% in FY16-18 as against 7% CAGR over the last five years. Moreover, we expect better pricing to drive realization growth of 6-7%. Both combined, we expect EBITDA CAGR of 32% over FY16-18.
Risks Re-investments over and above the Jaypee capacity: We build in no major re-investments for the next 5 years, barring for the Jaypee capacity. If UltraTech were to invest further for expansion, irrespective of the demand scenario, it will suppress RoCE and lead to a de-rating.
Increase in international petcoke prices: Reduction in petcoke prices was one of the key sources of power and fuel cost savings for UltraTech. Any increase would inflate overall costs, which are not built into our estimates.
Exhibit 35: Explanation for the accounting flags
Segment Score Comments
Accounting GREEN The company’s cash conversion cycle is top notch (100% CFO/EBITDA) and we do not note any instance of cash pilferage or window dressing. This is a common trait in all Indian cement companies
Predictability AMBER Predictability of UltraTech is better than Ambuja/ACC and has improved since the management has become more transparent in recent years and improved the quality of non-financial disclosures
Earnings momentum RED Consensus EBITDA estimates for FY18 have been cut by 30% in the last one year given weak pricing
Source: Company, Bloomberg, Ambit Capital research
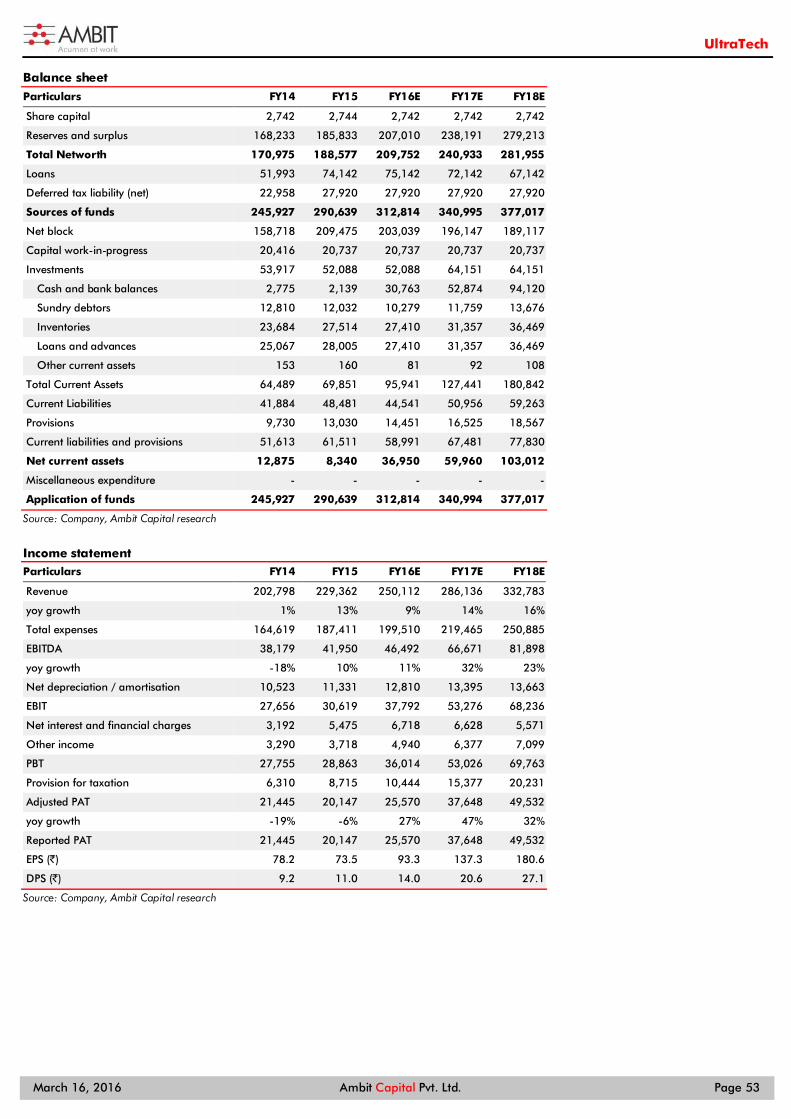
March 16, 2016 Ambit Capital Pvt. Ltd. Page 53
UltraTech
Balance sheet
Particulars FY14 FY15 FY16E FY17E FY18E
Share capital 2,742 2,744 2,742 2,742 2,742
Reserves and surplus 168,233 185,833 207,010 238,191 279,213
Total Networth 170,975 188,577 209,752 240,933 281,955
Loans 51,993 74,142 75,142 72,142 67,142
Deferred tax liability (net) 22,958 27,920 27,920 27,920 27,920
Sources of funds 245,927 290,639 312,814 340,995 377,017
Net block 158,718 209,475 203,039 196,147 189,117
Capital work-in-progress 20,416 20,737 20,737 20,737 20,737
Investments 53,917 52,088 52,088 64,151 64,151
Cash and bank balances 2,775 2,139 30,763 52,874 94,120
Sundry debtors 12,810 12,032 10,279 11,759 13,676
Inventories 23,684 27,514 27,410 31,357 36,469
Loans and advances 25,067 28,005 27,410 31,357 36,469
Other current assets 153 160 81 92 108
Total Current Assets 64,489 69,851 95,941 127,441 180,842
Current Liabilities 41,884 48,481 44,541 50,956 59,263
Provisions 9,730 13,030 14,451 16,525 18,567
Current liabilities and provisions 51,613 61,511 58,991 67,481 77,830
Net current assets 12,875 8,340 36,950 59,960 103,012
Miscellaneous expenditure - - - - -
Application of funds 245,927 290,639 312,814 340,994 377,017
Source: Company, Ambit Capital research
Income statement Particulars FY14 FY15 FY16E FY17E FY18E
Revenue 202,798 229,362 250,112 286,136 332,783
yoy growth 1% 13% 9% 14% 16%
Total expenses 164,619 187,411 199,510 219,465 250,885
EBITDA 38,179 41,950 46,492 66,671 81,898
yoy growth -18% 10% 11% 32% 23%
Net depreciation / amortisation 10,523 11,331 12,810 13,395 13,663
EBIT 27,656 30,619 37,792 53,276 68,236
Net interest and financial charges 3,192 5,475 6,718 6,628 5,571
Other income 3,290 3,718 4,940 6,377 7,099
PBT 27,755 28,863 36,014 53,026 69,763
Provision for taxation 6,310 8,715 10,444 15,377 20,231
Adjusted PAT 21,445 20,147 25,570 37,648 49,532
yoy growth -19% -6% 27% 47% 32%
Reported PAT 21,445 20,147 25,570 37,648 49,532
EPS (`) 78.2 73.5 93.3 137.3 180.6
DPS (`) 9.2 11.0 14.0 20.6 27.1
Source: Company, Ambit Capital research
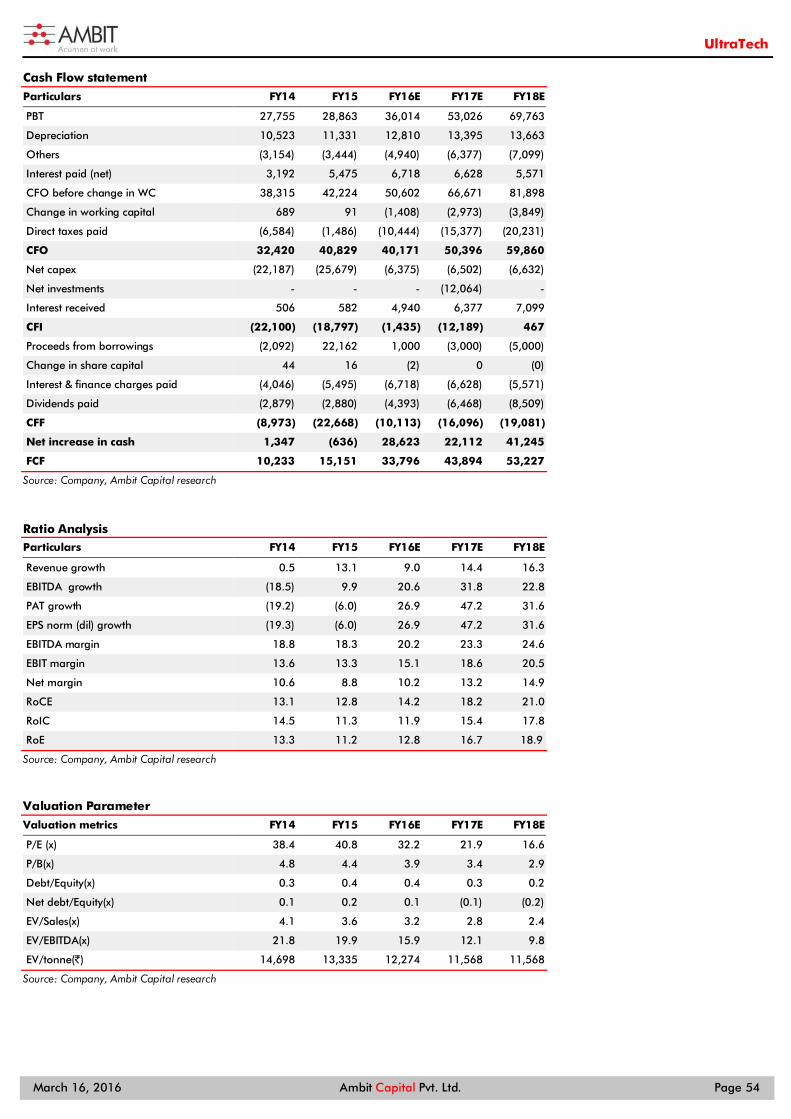
March 16, 2016 Ambit Capital Pvt. Ltd. Page 54
UltraTech
Cash Flow statement
Particulars FY14 FY15 FY16E FY17E FY18E
PBT 27,755 28,863 36,014 53,026 69,763
Depreciation 10,523 11,331 12,810 13,395 13,663
Others (3,154) (3,444) (4,940) (6,377) (7,099)
Interest paid (net) 3,192 5,475 6,718 6,628 5,571
CFO before change in WC 38,315 42,224 50,602 66,671 81,898
Change in working capital 689 91 (1,408) (2,973) (3,849)
Direct taxes paid (6,584) (1,486) (10,444) (15,377) (20,231)
CFO 32,420 40,829 40,171 50,396 59,860
Net capex (22,187) (25,679) (6,375) (6,502) (6,632)
Net investments - - - (12,064) -
Interest received 506 582 4,940 6,377 7,099
CFI (22,100) (18,797) (1,435) (12,189) 467
Proceeds from borrowings (2,092) 22,162 1,000 (3,000) (5,000)
Change in share capital 44 16 (2) 0 (0)
Interest & finance charges paid (4,046) (5,495) (6,718) (6,628) (5,571)
Dividends paid (2,879) (2,880) (4,393) (6,468) (8,509)
CFF (8,973) (22,668) (10,113) (16,096) (19,081)
Net increase in cash 1,347 (636) 28,623 22,112 41,245
FCF 10,233 15,151 33,796 43,894 53,227
Source: Company, Ambit Capital research
Ratio Analysis Particulars FY14 FY15 FY16E FY17E FY18E
Revenue growth 0.5 13.1 9.0 14.4 16.3
EBITDA growth (18.5) 9.9 20.6 31.8 22.8
PAT growth (19.2) (6.0) 26.9 47.2 31.6
EPS norm (dil) growth (19.3) (6.0) 26.9 47.2 31.6
EBITDA margin 18.8 18.3 20.2 23.3 24.6
EBIT margin 13.6 13.3 15.1 18.6 20.5
Net margin 10.6 8.8 10.2 13.2 14.9
RoCE 13.1 12.8 14.2 18.2 21.0
RoIC 14.5 11.3 11.9 15.4 17.8
RoE 13.3 11.2 12.8 16.7 18.9
Source: Company, Ambit Capital research
Valuation Parameter
Valuation metrics FY14 FY15 FY16E FY17E FY18E
P/E (x) 38.4 40.8 32.2 21.9 16.6
P/B(x) 4.8 4.4 3.9 3.4 2.9
Debt/Equity(x) 0.3 0.4 0.4 0.3 0.2
Net debt/Equity(x) 0.1 0.2 0.1 (0.1) (0.2)
EV/Sales(x) 4.1 3.6 3.2 2.8 2.4
EV/EBITDA(x) 21.8 19.9 15.9 12.1 9.8
EV/tonne(`) 14,698 13,335 12,274 11,568 11,568
Source: Company, Ambit Capital research
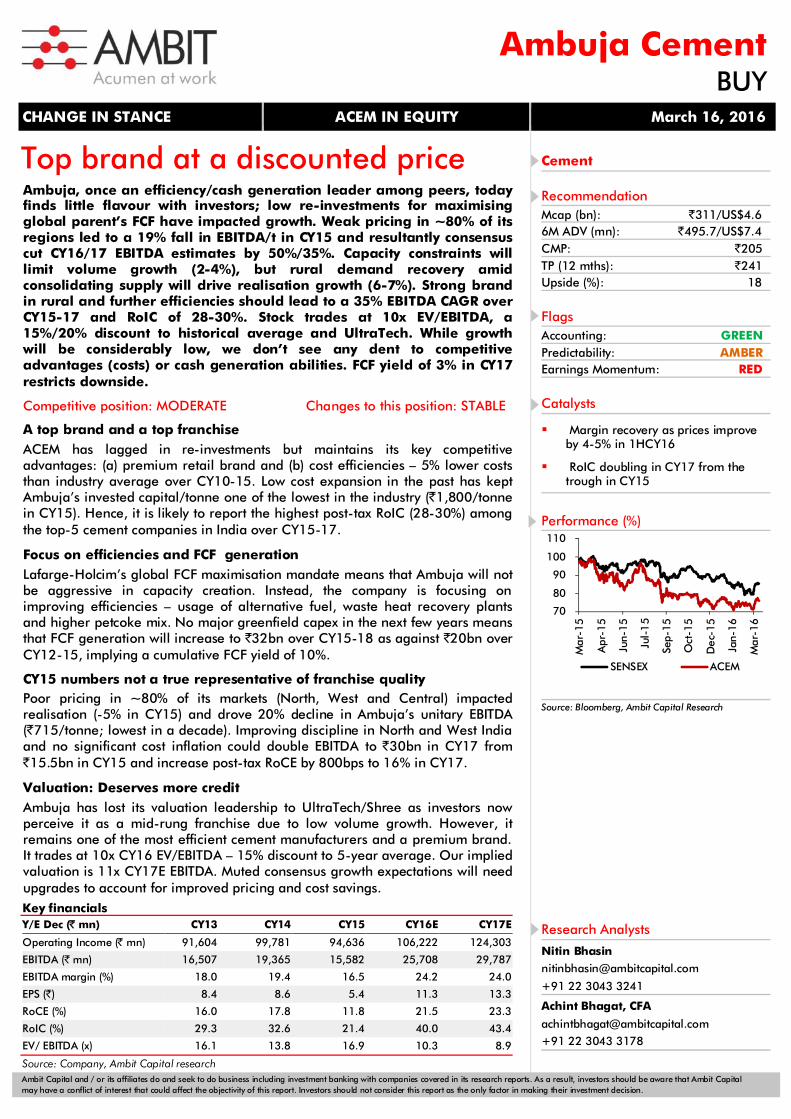
Ambit Capital and / or its affiliates do and seek to do business including investment banking with companies covered in its research reports. As a result, investors should be aware that Ambit Capital may have a conflict of interest that could affect the objectivity of this report. Investors should not consider this report as the only factor in making their investment decision.
Top brand at a discounted price
Ambuja, once an efficiency/cash generation leader among peers, today finds little flavour with investors; low re-investments for maximising global parent’s FCF have impacted growth. Weak pricing in ~80% of its regions led to a 19% fall in EBITDA/t in CY15 and resultantly consensus cut CY16/17 EBITDA estimates by 50%/35%. Capacity constraints will limit volume growth (2-4%), but rural demand recovery amid consolidating supply will drive realisation growth (6-7%). Strong brand in rural and further efficiencies should lead to a 35% EBITDA CAGR over CY15-17 and RoIC of 28-30%. Stock trades at 10x EV/EBITDA, a 15%/20% discount to historical average and UltraTech. While growth will be considerably low, we don’t see any dent to competitive advantages (costs) or cash generation abilities. FCF yield of 3% in CY17 restricts downside.
Competitive position: MODERATE Changes to this position: STABLE A top brand and a top franchise ACEM has lagged in re-investments but maintains its key competitive advantages: (a) premium retail brand and (b) cost efficiencies – 5% lower costs than industry average over CY10-15. Low cost expansion in the past has kept Ambuja’s invested capital/tonne one of the lowest in the industry (`1,800/tonne in CY15). Hence, it is likely to report the highest post-tax RoIC (28-30%) among the top-5 cement companies in India over CY15-17. Focus on efficiencies and FCF generation Lafarge-Holcim’s global FCF maximisation mandate means that Ambuja will not be aggressive in capacity creation. Instead, the company is focusing on improving efficiencies – usage of alternative fuel, waste heat recovery plants and higher petcoke mix. No major greenfield capex in the next few years means that FCF generation will increase to `32bn over CY15-18 as against `20bn over CY12-15, implying a cumulative FCF yield of 10%. CY15 numbers not a true representative of franchise quality Poor pricing in ~80% of its markets (North, West and Central) impacted realisation (-5% in CY15) and drove 20% decline in Ambuja’s unitary EBITDA (`715/tonne; lowest in a decade). Improving discipline in North and West India and no significant cost inflation could double EBITDA to `30bn in CY17 from `15.5bn in CY15 and increase post-tax RoCE by 800bps to 16% in CY17. however we hear incipient signs of improving demand/pricing discipline in these Valuation: Deserves more credit Ambuja has lost its valuation leadership to UltraTech/Shree as investors now perceive it as a mid-rung franchise due to low volume growth. However, it remains one of the most efficient cement manufacturers and a premium brand. It trades at 10x CY16 EV/EBITDA – 15% discount to 5-year average. Our implied valuation is 11x CY17E EBITDA. Muted consensus growth expectations will need upgrades to account for improved pricing and cost savings.
CHANGE IN STANCE ACEM IN EQUITY March 16, 2016
Ambuja CementBUY
Cement
Recommendation Mcap (bn): `311/US$4.6 6M ADV (mn): `495.7/US$7.4 CMP: `205 TP (12 mths): `241 Upside (%): 18
Flags Accounting: GREEN Predictability: AMBER Earnings Momentum: RED
Catalysts
Margin recovery as prices improve by 4-5% in 1HCY16
RoIC doubling in CY17 from the trough in CY15
Performance (%)
Source: Bloomberg, Ambit Capital Research
70
80
90
100
110
Mar
-15
Apr
-15
Jun-
15
Jul-
15
Sep-
15
Oct
-15
Dec
-15
Jan-
16
Mar
-16
SENSEX ACEM
Research Analysts
Nitin Bhasin [email protected]
+91 22 3043 3241
Achint Bhagat, CFA
+91 22 3043 3178
Key financials Y/E Dec (̀ mn) CY13 CY14 CY15 CY16E CY17E
Operating Income (̀ mn) 91,604 99,781 94,636 106,222 124,303
EBITDA (` mn) 16,507 19,365 15,582 25,708 29,787
EBITDA margin (%) 18.0 19.4 16.5 24.2 24.0
EPS (`) 8.4 8.6 5.4 11.3 13.3
RoCE (%) 16.0 17.8 11.8 21.5 23.3
RoIC (%) 29.3 32.6 21.4 40.0 43.4
EV/ EBITDA (x) 16.1 13.8 16.9 10.3 8.9
Source: Company, Ambit Capital research
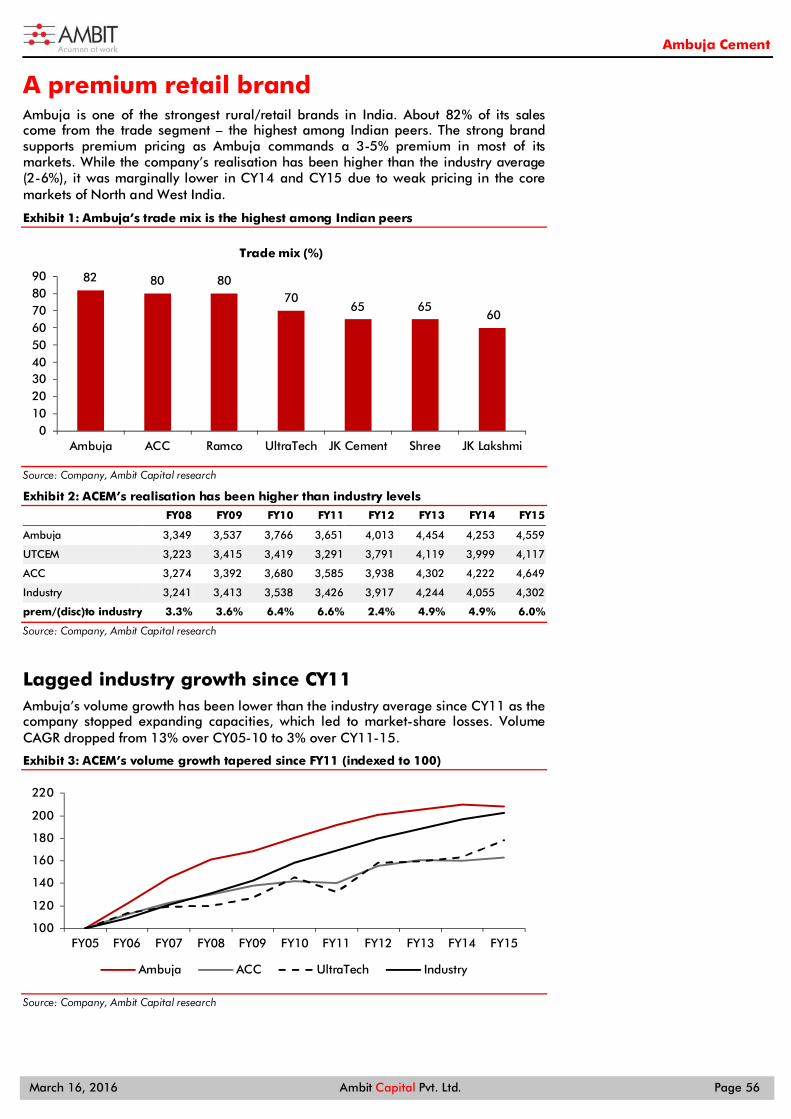
Ambuja Cement
March 16, 2016 Ambit Capital Pvt. Ltd. Page 56
A premium retail brand Ambuja is one of the strongest rural/retail brands in India. About 82% of its sales come from the trade segment – the highest among Indian peers. The strong brand supports premium pricing as Ambuja commands a 3-5% premium in most of its markets. While the company’s realisation has been higher than the industry average (2-6%), it was marginally lower in CY14 and CY15 due to weak pricing in the core markets of North and West India.
Exhibit 1: Ambuja’s trade mix is the highest among Indian peers
Source: Company, Ambit Capital research
Exhibit 2: ACEM’s realisation has been higher than industry levels
FY08 FY09 FY10 FY11 FY12 FY13 FY14 FY15
Ambuja 3,349 3,537 3,766 3,651 4,013 4,454 4,253 4,559
UTCEM 3,223 3,415 3,419 3,291 3,791 4,119 3,999 4,117
ACC 3,274 3,392 3,680 3,585 3,938 4,302 4,222 4,649
Industry 3,241 3,413 3,538 3,426 3,917 4,244 4,055 4,302
prem/(disc)to industry 3.3% 3.6% 6.4% 6.6% 2.4% 4.9% 4.9% 6.0%
Source: Company, Ambit Capital research
Lagged industry growth since CY11 Ambuja’s volume growth has been lower than the industry average since CY11 as the company stopped expanding capacities, which led to market-share losses. Volume CAGR dropped from 13% over CY05-10 to 3% over CY11-15.
Exhibit 3: ACEM’s volume growth tapered since FY11 (indexed to 100)
Source: Company, Ambit Capital research
82 80 8070
65 6560
0102030405060708090
Ambuja ACC Ramco UltraTech JK Cement Shree JK Lakshmi
Trade mix (%)
100
120
140
160
180
200
220
FY05 FY06 FY07 FY08 FY09 FY10 FY11 FY12 FY13 FY14 FY15
Ambuja ACC UltraTech Industry
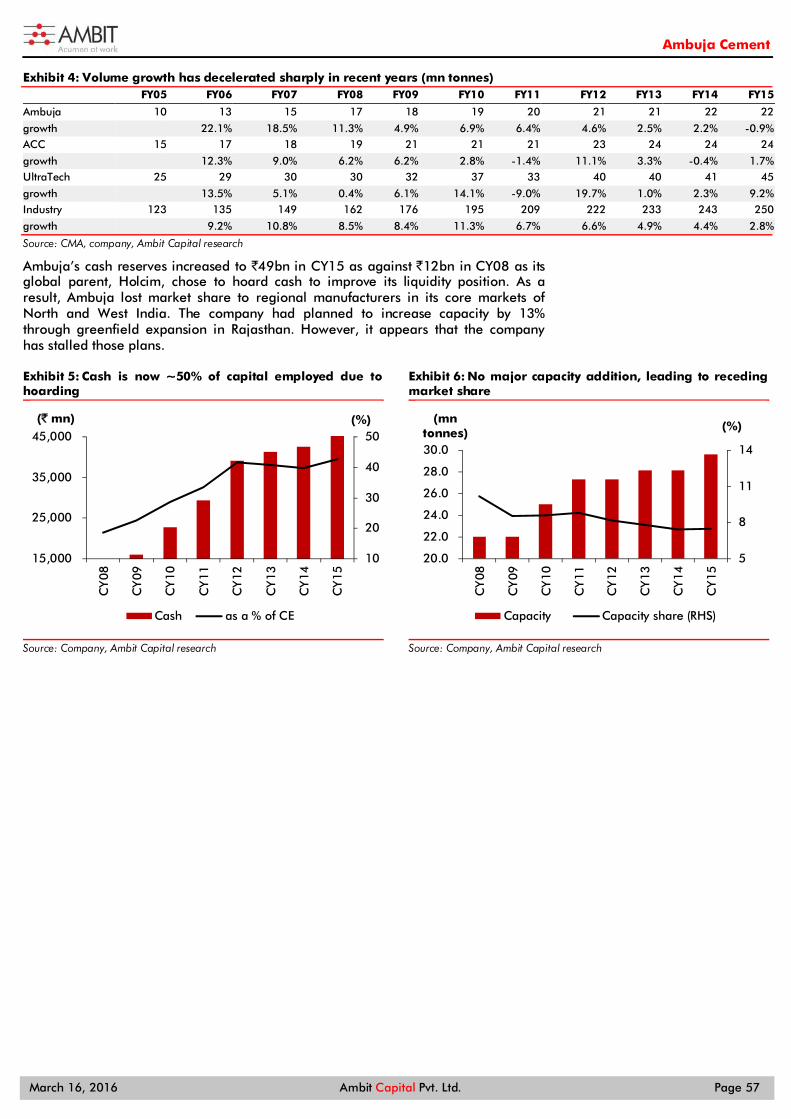
Ambuja Cement
March 16, 2016 Ambit Capital Pvt. Ltd. Page 57
Exhibit 4: Volume growth has decelerated sharply in recent years (mn tonnes)
FY05 FY06 FY07 FY08 FY09 FY10 FY11 FY12 FY13 FY14 FY15
Ambuja 10 13 15 17 18 19 20 21 21 22 22
growth 22.1% 18.5% 11.3% 4.9% 6.9% 6.4% 4.6% 2.5% 2.2% -0.9% ACC 15 17 18 19 21 21 21 23 24 24 24
growth 12.3% 9.0% 6.2% 6.2% 2.8% -1.4% 11.1% 3.3% -0.4% 1.7% UltraTech 25 29 30 30 32 37 33 40 40 41 45
growth 13.5% 5.1% 0.4% 6.1% 14.1% -9.0% 19.7% 1.0% 2.3% 9.2% Industry 123 135 149 162 176 195 209 222 233 243 250
growth 9.2% 10.8% 8.5% 8.4% 11.3% 6.7% 6.6% 4.9% 4.4% 2.8%
Source: CMA, company, Ambit Capital research
Ambuja’s cash reserves increased to `49bn in CY15 as against `12bn in CY08 as its global parent, Holcim, chose to hoard cash to improve its liquidity position. As a result, Ambuja lost market share to regional manufacturers in its core markets of North and West India. The company had planned to increase capacity by 13% through greenfield expansion in Rajasthan. However, it appears that the company has stalled those plans.
Exhibit 5: Cash is now ~50% of capital employed due to hoarding
Source: Company, Ambit Capital research
Exhibit 6: No major capacity addition, leading to receding market share
Source: Company, Ambit Capital research
10
20
30
40
50
15,000
25,000
35,000
45,000
CY
08
CY
09
CY
10
CY
11
CY
12
CY
13
CY
14
CY
15
(%)(` mn)
Cash as a % of CE
5
8
11
14
20.0
22.0
24.0
26.0
28.0
30.0
CY
08
CY
09
CY
10
CY
11
CY
12
CY
13
CY
14
CY
15
(%)(mn
tonnes)
Capacity Capacity share (RHS)
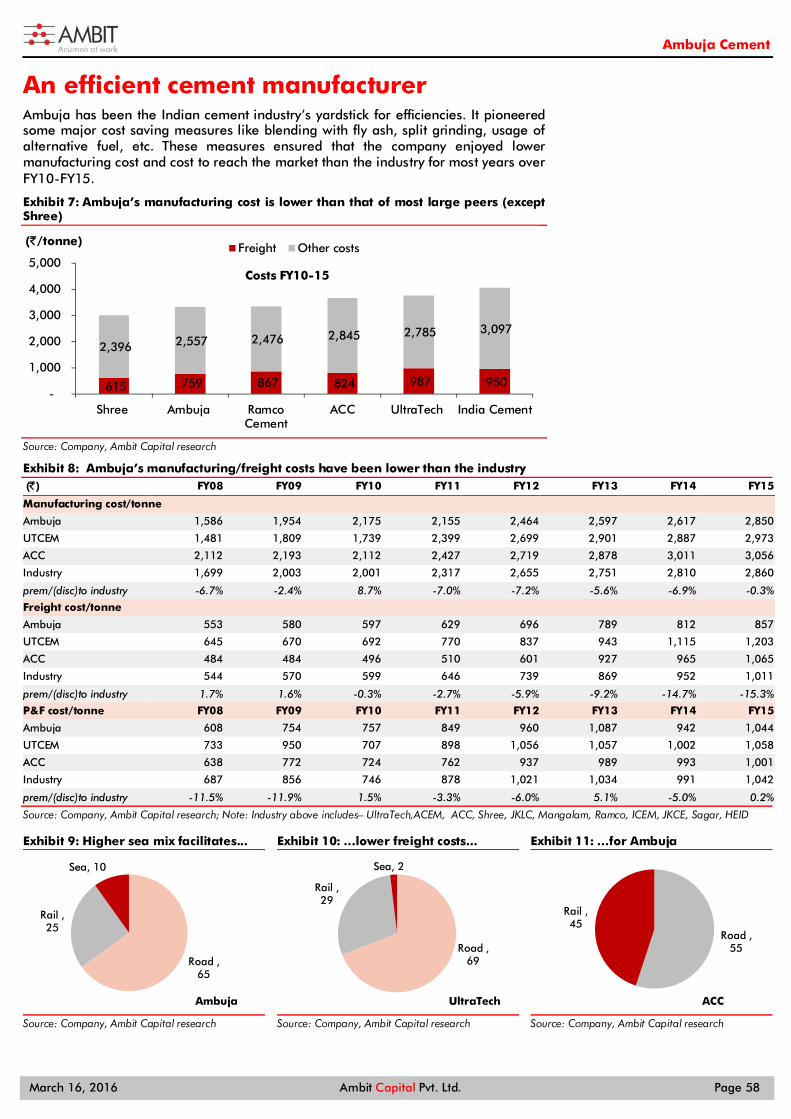
Ambuja Cement
March 16, 2016 Ambit Capital Pvt. Ltd. Page 58
An efficient cement manufacturer Ambuja has been the Indian cement industry’s yardstick for efficiencies. It pioneered some major cost saving measures like blending with fly ash, split grinding, usage of alternative fuel, etc. These measures ensured that the company enjoyed lower manufacturing cost and cost to reach the market than the industry for most years over FY10-FY15.
Exhibit 7: Ambuja’s manufacturing cost is lower than that of most large peers (except Shree)
Source: Company, Ambit Capital research
Exhibit 8: Ambuja’s manufacturing/freight costs have been lower than the industry (̀ ) FY08 FY09 FY10 FY11 FY12 FY13 FY14 FY15
Manufacturing cost/tonne
Ambuja 1,586 1,954 2,175 2,155 2,464 2,597 2,617 2,850
UTCEM 1,481 1,809 1,739 2,399 2,699 2,901 2,887 2,973
ACC 2,112 2,193 2,112 2,427 2,719 2,878 3,011 3,056
Industry 1,699 2,003 2,001 2,317 2,655 2,751 2,810 2,860
prem/(disc)to industry -6.7% -2.4% 8.7% -7.0% -7.2% -5.6% -6.9% -0.3%
Freight cost/tonne
Ambuja 553 580 597 629 696 789 812 857
UTCEM 645 670 692 770 837 943 1,115 1,203
ACC 484 484 496 510 601 927 965 1,065
Industry 544 570 599 646 739 869 952 1,011
prem/(disc)to industry 1.7% 1.6% -0.3% -2.7% -5.9% -9.2% -14.7% -15.3%
P&F cost/tonne FY08 FY09 FY10 FY11 FY12 FY13 FY14 FY15
Ambuja 608 754 757 849 960 1,087 942 1,044
UTCEM 733 950 707 898 1,056 1,057 1,002 1,058
ACC 638 772 724 762 937 989 993 1,001
Industry 687 856 746 878 1,021 1,034 991 1,042
prem/(disc)to industry -11.5% -11.9% 1.5% -3.3% -6.0% 5.1% -5.0% 0.2%
Source: Company, Ambit Capital research; Note: Industry above includes– UltraTech,ACEM, ACC, Shree, JKLC, Mangalam, Ramco, ICEM, JKCE, Sagar, HEID
Exhibit 9: Higher sea mix facilitates...
Source: Company, Ambit Capital research
Exhibit 10: …lower freight costs...
Source: Company, Ambit Capital research
Exhibit 11: …for Ambuja
Source: Company, Ambit Capital research
615 759 867 824 987 950
2,396 2,557 2,476 2,845 2,785 3,097
-
1,000
2,000
3,000
4,000
5,000
Shree Ambuja RamcoCement
ACC UltraTech India Cement
(`/tonne)
Costs FY10-15
Freight Other costs
Road , 65
Rail , 25
Sea, 10
Ambuja
Road , 69
Rail , 29
Sea, 2
UltraTech
Road , 55
Rail , 45
ACC
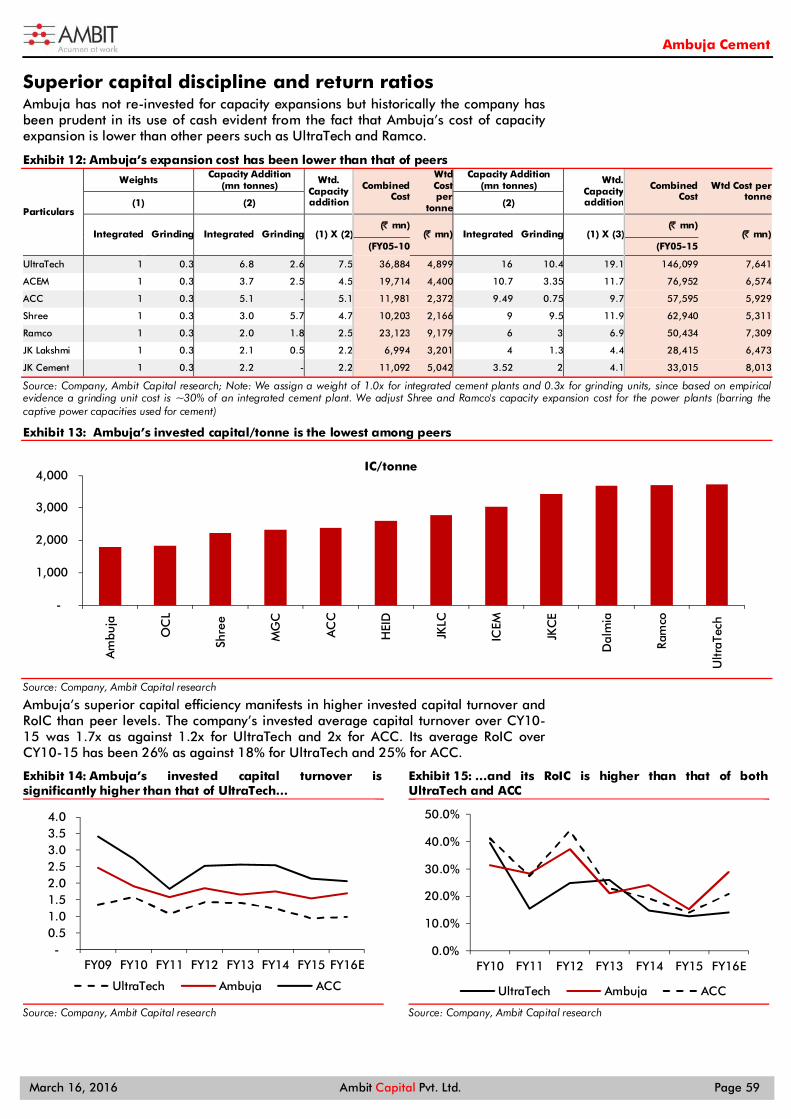
Ambuja Cement
March 16, 2016 Ambit Capital Pvt. Ltd. Page 59
Superior capital discipline and return ratios Ambuja has not re-invested for capacity expansions but historically the company has been prudent in its use of cash evident from the fact that Ambuja’s cost of capacity expansion is lower than other peers such as UltraTech and Ramco.
Exhibit 12: Ambuja’s expansion cost has been lower than that of peers
Particulars
Weights Capacity Addition (mn tonnes) Wtd.
Capacity addition
Combined Cost
Wtd Cost per
tonne
Capacity Addition (mn tonnes) Wtd.
Capacity addition
Combined Cost
Wtd Cost per tonne
(1) (2) (2)
Integrated Grinding Integrated Grinding (1) X (2)(̀ mn)
(̀ mn) Integrated Grinding (1) X (3)(̀ mn)
(̀ mn) (FY05-10 (FY05-15
UltraTech 1 0.3 6.8 2.6 7.5 36,884 4,899 16 10.4 19.1 146,099 7,641
ACEM 1 0.3 3.7 2.5 4.5 19,714 4,400 10.7 3.35 11.7 76,952 6,574
ACC 1 0.3 5.1 - 5.1 11,981 2,372 9.49 0.75 9.7 57,595 5,929
Shree 1 0.3 3.0 5.7 4.7 10,203 2,166 9 9.5 11.9 62,940 5,311
Ramco 1 0.3 2.0 1.8 2.5 23,123 9,179 6 3 6.9 50,434 7,309
JK Lakshmi 1 0.3 2.1 0.5 2.2 6,994 3,201 4 1.3 4.4 28,415 6,473
JK Cement 1 0.3 2.2 - 2.2 11,092 5,042 3.52 2 4.1 33,015 8,013
Source: Company, Ambit Capital research; Note: We assign a weight of 1.0x for integrated cement plants and 0.3x for grinding units, since based on empirical evidence a grinding unit cost is ~30% of an integrated cement plant. We adjust Shree and Ramco's capacity expansion cost for the power plants (barring the captive power capacities used for cement)
Exhibit 13: Ambuja’s invested capital/tonne is the lowest among peers
Source: Company, Ambit Capital research
Ambuja’s superior capital efficiency manifests in higher invested capital turnover and RoIC than peer levels. The company’s invested average capital turnover over CY10-15 was 1.7x as against 1.2x for UltraTech and 2x for ACC. Its average RoIC over CY10-15 has been 26% as against 18% for UltraTech and 25% for ACC.
Exhibit 14: Ambuja’s invested capital turnover is significantly higher than that of UltraTech…
Source: Company, Ambit Capital research
Exhibit 15: …and its RoIC is higher than that of both UltraTech and ACC
Source: Company, Ambit Capital research
-
1,000
2,000
3,000
4,000
Am
buja
OC
L
Shre
e
MG
C
AC
C
HEI
D
JKLC
ICEM
JKC
E
Dal
mia
Ram
co
Ultr
aTec
h
IC/tonne
- 0.5 1.0 1.5 2.0 2.5 3.0 3.5 4.0
FY09 FY10 FY11 FY12 FY13 FY14 FY15 FY16E
UltraTech Ambuja ACC
0.0%
10.0%
20.0%
30.0%
40.0%
50.0%
FY10 FY11 FY12 FY13 FY14 FY15 FY16E
UltraTech Ambuja ACC
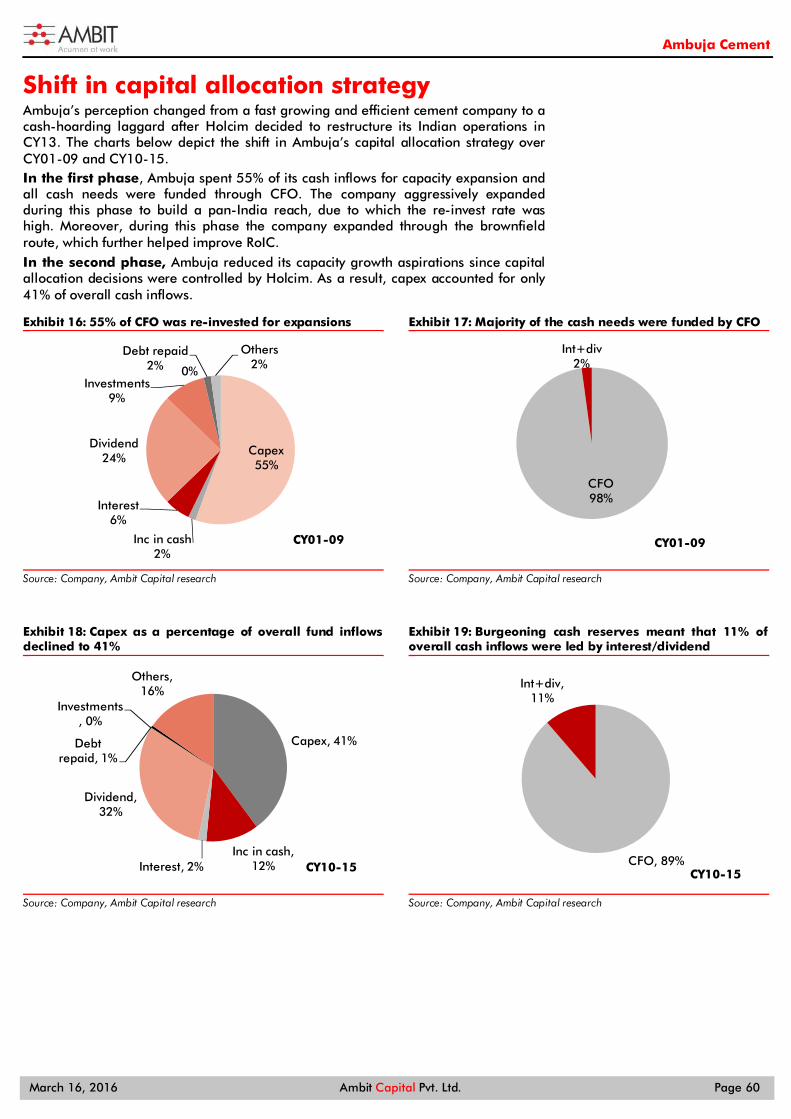
Ambuja Cement
March 16, 2016 Ambit Capital Pvt. Ltd. Page 60
Shift in capital allocation strategy Ambuja’s perception changed from a fast growing and efficient cement company to a cash-hoarding laggard after Holcim decided to restructure its Indian operations in CY13. The charts below depict the shift in Ambuja’s capital allocation strategy over CY01-09 and CY10-15. In the first phase, Ambuja spent 55% of its cash inflows for capacity expansion and all cash needs were funded through CFO. The company aggressively expanded during this phase to build a pan-India reach, due to which the re-invest rate was high. Moreover, during this phase the company expanded through the brownfield route, which further helped improve RoIC. In the second phase, Ambuja reduced its capacity growth aspirations since capital allocation decisions were controlled by Holcim. As a result, capex accounted for only 41% of overall cash inflows.
Exhibit 16: 55% of CFO was re-invested for expansions
Source: Company, Ambit Capital research
Exhibit 17: Majority of the cash needs were funded by CFO
Source: Company, Ambit Capital research
Exhibit 18: Capex as a percentage of overall fund inflows declined to 41%
Source: Company, Ambit Capital research
Exhibit 19: Burgeoning cash reserves meant that 11% of overall cash inflows were led by interest/dividend
Source: Company, Ambit Capital research
Capex55%
Inc in cash2%
Interest6%
Dividend24%
Investments 9%
0%
Debt repaid2%
Others2%
CY01-09
CFO98%
Int+div2%
CY01-09
Capex, 41%
Inc in cash, 12%Interest, 2%
Dividend, 32%
Investments , 0%
Debt repaid, 1%
Others, 16%
CY10-15 CFO, 89%
Int+div, 11%
CY10-15
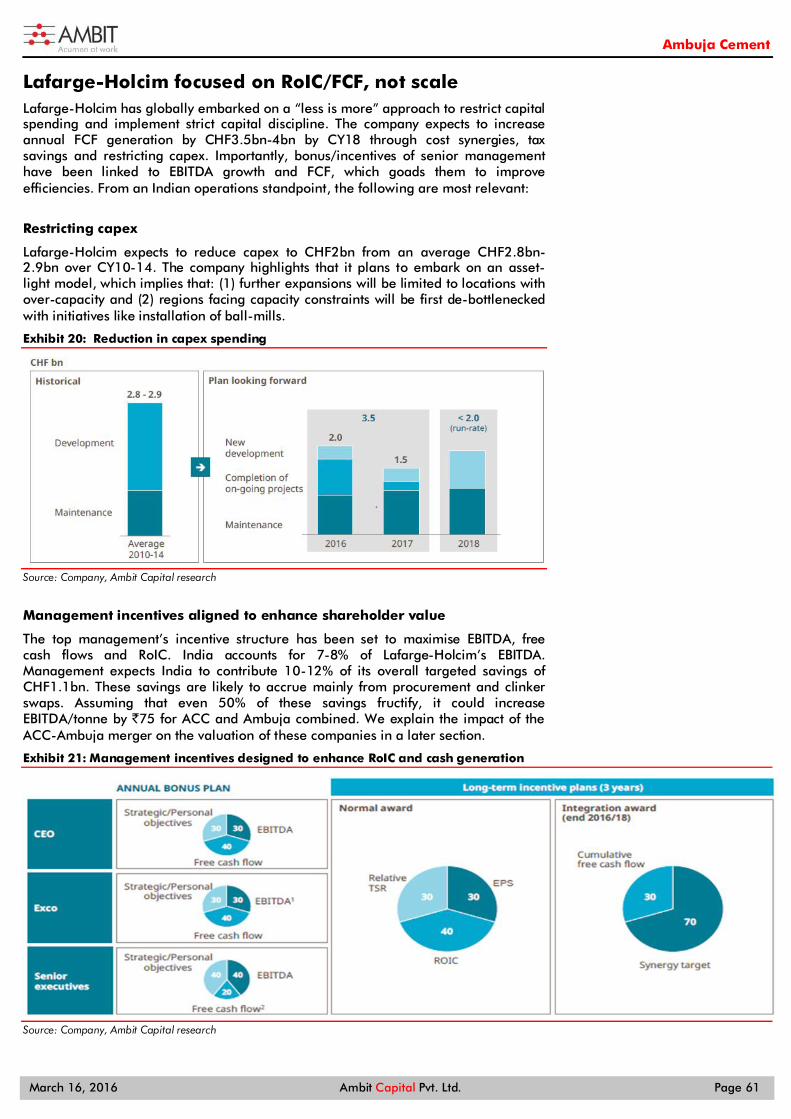
Ambuja Cement
March 16, 2016 Ambit Capital Pvt. Ltd. Page 61
Lafarge-Holcim focused on RoIC/FCF, not scale Lafarge-Holcim has globally embarked on a “less is more” approach to restrict capital spending and implement strict capital discipline. The company expects to increase annual FCF generation by CHF3.5bn-4bn by CY18 through cost synergies, tax savings and restricting capex. Importantly, bonus/incentives of senior management have been linked to EBITDA growth and FCF, which goads them to improve efficiencies. From an Indian operations standpoint, the following are most relevant:
Restricting capex
Lafarge-Holcim expects to reduce capex to CHF2bn from an average CHF2.8bn-2.9bn over CY10-14. The company highlights that it plans to embark on an asset-light model, which implies that: (1) further expansions will be limited to locations with over-capacity and (2) regions facing capacity constraints will be first de-bottlenecked with initiatives like installation of ball-mills.
Exhibit 20: Reduction in capex spending
Source: Company, Ambit Capital research
Management incentives aligned to enhance shareholder value
The top management’s incentive structure has been set to maximise EBITDA, free cash flows and RoIC. India accounts for 7-8% of Lafarge-Holcim’s EBITDA. Management expects India to contribute 10-12% of its overall targeted savings of CHF1.1bn. These savings are likely to accrue mainly from procurement and clinker swaps. Assuming that even 50% of these savings fructify, it could increase EBITDA/tonne by `75 for ACC and Ambuja combined. We explain the impact of the ACC-Ambuja merger on the valuation of these companies in a later section.
Exhibit 21: Management incentives designed to enhance RoIC and cash generation
Source: Company, Ambit Capital research
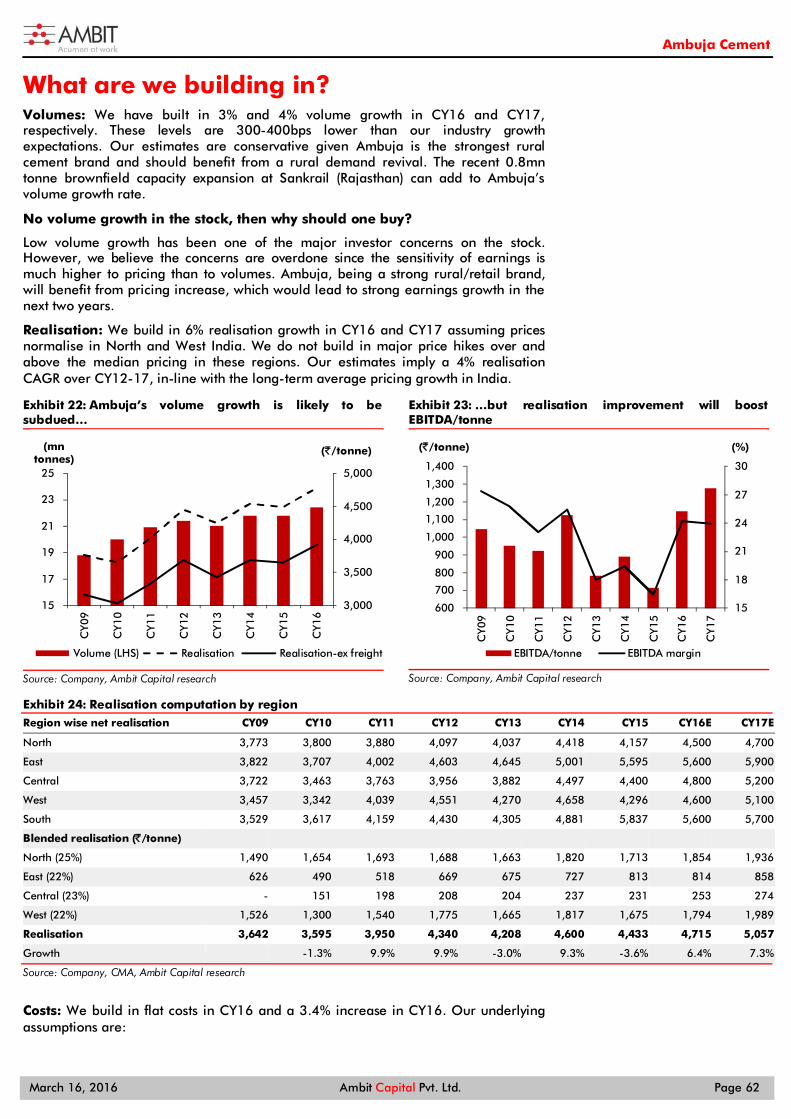
Ambuja Cement
March 16, 2016 Ambit Capital Pvt. Ltd. Page 62
What are we building in? Volumes: We have built in 3% and 4% volume growth in CY16 and CY17, respectively. These levels are 300-400bps lower than our industry growth expectations. Our estimates are conservative given Ambuja is the strongest rural cement brand and should benefit from a rural demand revival. The recent 0.8mn tonne brownfield capacity expansion at Sankrail (Rajasthan) can add to Ambuja’s volume growth rate.
No volume growth in the stock, then why should one buy?
Low volume growth has been one of the major investor concerns on the stock. However, we believe the concerns are overdone since the sensitivity of earnings is much higher to pricing than to volumes. Ambuja, being a strong rural/retail brand, will benefit from pricing increase, which would lead to strong earnings growth in the next two years.
Realisation: We build in 6% realisation growth in CY16 and CY17 assuming prices normalise in North and West India. We do not build in major price hikes over and above the median pricing in these regions. Our estimates imply a 4% realisation CAGR over CY12-17, in-line with the long-term average pricing growth in India.
Exhibit 22: Ambuja’s volume growth is likely to be subdued…
Source: Company, Ambit Capital research
Exhibit 23: …but realisation improvement will boost EBITDA/tonne
Source: Company, Ambit Capital research
Exhibit 24: Realisation computation by region Region wise net realisation CY09 CY10 CY11 CY12 CY13 CY14 CY15 CY16E CY17E
North 3,773 3,800 3,880 4,097 4,037 4,418 4,157 4,500 4,700
East 3,822 3,707 4,002 4,603 4,645 5,001 5,595 5,600 5,900
Central 3,722 3,463 3,763 3,956 3,882 4,497 4,400 4,800 5,200
West 3,457 3,342 4,039 4,551 4,270 4,658 4,296 4,600 5,100
South 3,529 3,617 4,159 4,430 4,305 4,881 5,837 5,600 5,700
Blended realisation (̀ /tonne)
North (25%) 1,490 1,654 1,693 1,688 1,663 1,820 1,713 1,854 1,936
East (22%) 626 490 518 669 675 727 813 814 858
Central (23%) - 151 198 208 204 237 231 253 274
West (22%) 1,526 1,300 1,540 1,775 1,665 1,817 1,675 1,794 1,989
Realisation 3,642 3,595 3,950 4,340 4,208 4,600 4,433 4,715 5,057
Growth -1.3% 9.9% 9.9% -3.0% 9.3% -3.6% 6.4% 7.3%
Source: Company, CMA, Ambit Capital research
Costs: We build in flat costs in CY16 and a 3.4% increase in CY16. Our underlying assumptions are:
3,000
3,500
4,000
4,500
5,000
15
17
19
21
23
25
CY0
9
CY1
0
CY1
1
CY1
2
CY1
3
CY1
4
CY1
5
CY1
6
(`/tonne)(mn tonnes)
Volume (LHS) Realisation Realisation-ex freight
15
18
21
24
27
30
600
700
800
900
1,000
1,100
1,200
1,300
1,400C
Y09
CY1
0
CY1
1
CY1
2
CY1
3
CY1
4
CY1
5
CY1
6
CY1
7
(%)(`/tonne)
EBITDA/tonne EBITDA margin
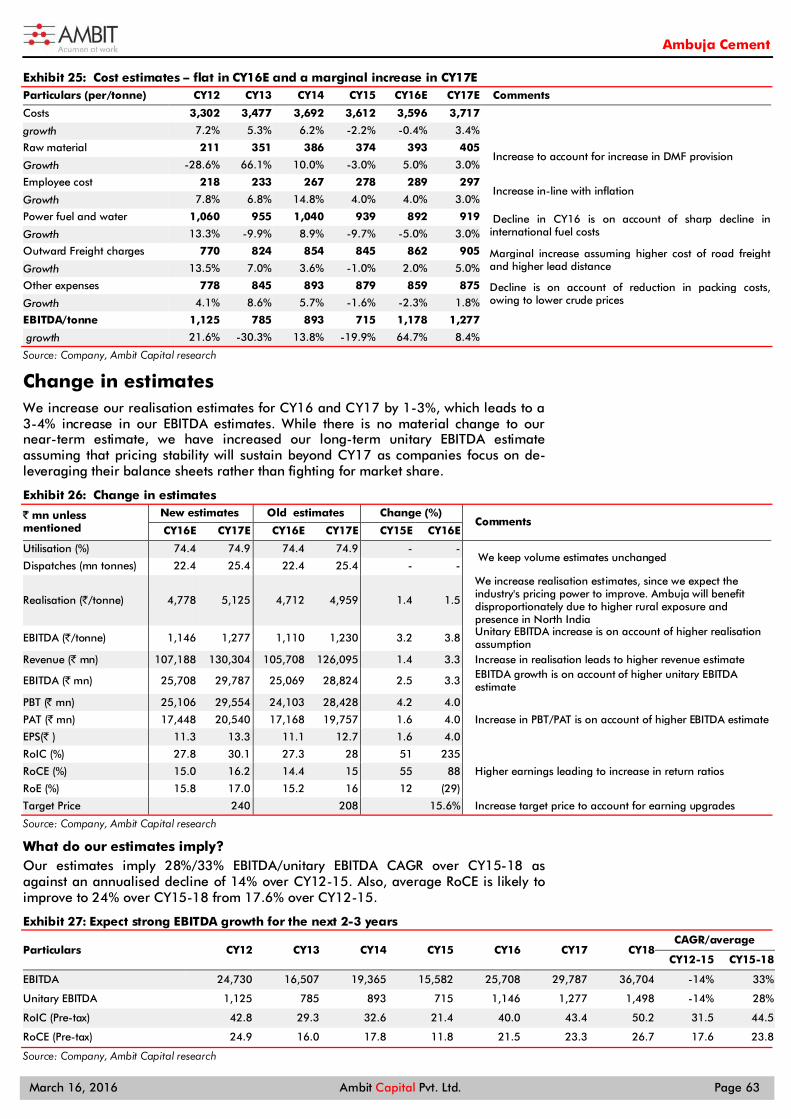
Ambuja Cement
March 16, 2016 Ambit Capital Pvt. Ltd. Page 63
Exhibit 25: Cost estimates – flat in CY16E and a marginal increase in CY17E Particulars (per/tonne) CY12 CY13 CY14 CY15 CY16E CY17E Comments
Costs 3,302 3,477 3,692 3,612 3,596 3,717 growth 7.2% 5.3% 6.2% -2.2% -0.4% 3.4% Raw material 211 351 386 374 393 405
Increase to account for increase in DMF provision Growth -28.6% 66.1% 10.0% -3.0% 5.0% 3.0%
Employee cost 218 233 267 278 289 297 Increase in-line with inflation
Growth 7.8% 6.8% 14.8% 4.0% 4.0% 3.0%
Power fuel and water 1,060 955 1,040 939 892 919 Decline in CY16 is on account of sharp decline in international fuel costs Growth 13.3% -9.9% 8.9% -9.7% -5.0% 3.0%
Outward Freight charges 770 824 854 845 862 905 Marginal increase assuming higher cost of road freight and higher lead distance Growth 13.5% 7.0% 3.6% -1.0% 2.0% 5.0%
Other expenses 778 845 893 879 859 875 Decline is on account of reduction in packing costs, owing to lower crude prices Growth 4.1% 8.6% 5.7% -1.6% -2.3% 1.8%
EBITDA/tonne 1,125 785 893 715 1,178 1,277 growth 21.6% -30.3% 13.8% -19.9% 64.7% 8.4%
Source: Company, Ambit Capital research
Change in estimates We increase our realisation estimates for CY16 and CY17 by 1-3%, which leads to a 3-4% increase in our EBITDA estimates. While there is no material change to our near-term estimate, we have increased our long-term unitary EBITDA estimate assuming that pricing stability will sustain beyond CY17 as companies focus on de-leveraging their balance sheets rather than fighting for market share.
Exhibit 26: Change in estimates
` mn unless mentioned
New estimates Old estimates Change (%) Comments
CY16E CY17E CY16E CY17E CY15E CY16E
Utilisation (%) 74.4 74.9 74.4 74.9 - - We keep volume estimates unchanged
Dispatches (mn tonnes) 22.4 25.4 22.4 25.4 - -
Realisation (`/tonne) 4,778 5,125 4,712 4,959 1.4 1.5
We increase realisation estimates, since we expect the industry's pricing power to improve. Ambuja will benefit disproportionately due to higher rural exposure and presence in North India
EBITDA (`/tonne) 1,146 1,277 1,110 1,230 3.2 3.8 Unitary EBITDA increase is on account of higher realisation assumption
Revenue (` mn) 107,188 130,304 105,708 126,095 1.4 3.3 Increase in realisation leads to higher revenue estimate
EBITDA (` mn) 25,708 29,787 25,069 28,824 2.5 3.3 EBITDA growth is on account of higher unitary EBITDA estimate
PBT (̀ mn) 25,106 29,554 24,103 28,428 4.2 4.0
Increase in PBT/PAT is on account of higher EBITDA estimate PAT (` mn) 17,448 20,540 17,168 19,757 1.6 4.0
EPS(` ) 11.3 13.3 11.1 12.7 1.6 4.0
RoIC (%) 27.8 30.1 27.3 28 51 235
Higher earnings leading to increase in return ratios RoCE (%) 15.0 16.2 14.4 15 55 88
RoE (%) 15.8 17.0 15.2 16 12 (29)
Target Price 240 208 15.6% Increase target price to account for earning upgrades
Source: Company, Ambit Capital research
What do our estimates imply? Our estimates imply 28%/33% EBITDA/unitary EBITDA CAGR over CY15-18 as against an annualised decline of 14% over CY12-15. Also, average RoCE is likely to improve to 24% over CY15-18 from 17.6% over CY12-15.
Exhibit 27: Expect strong EBITDA growth for the next 2-3 years
Particulars CY12 CY13 CY14 CY15 CY16 CY17 CY18 CAGR/average
CY12-15 CY15-18
EBITDA 24,730 16,507 19,365 15,582 25,708 29,787 36,704 -14% 33%
Unitary EBITDA 1,125 785 893 715 1,146 1,277 1,498 -14% 28%
RoIC (Pre-tax) 42.8 29.3 32.6 21.4 40.0 43.4 50.2 31.5 44.5
RoCE (Pre-tax) 24.9 16.0 17.8 11.8 21.5 23.3 26.7 17.6 23.8
Source: Company, Ambit Capital research
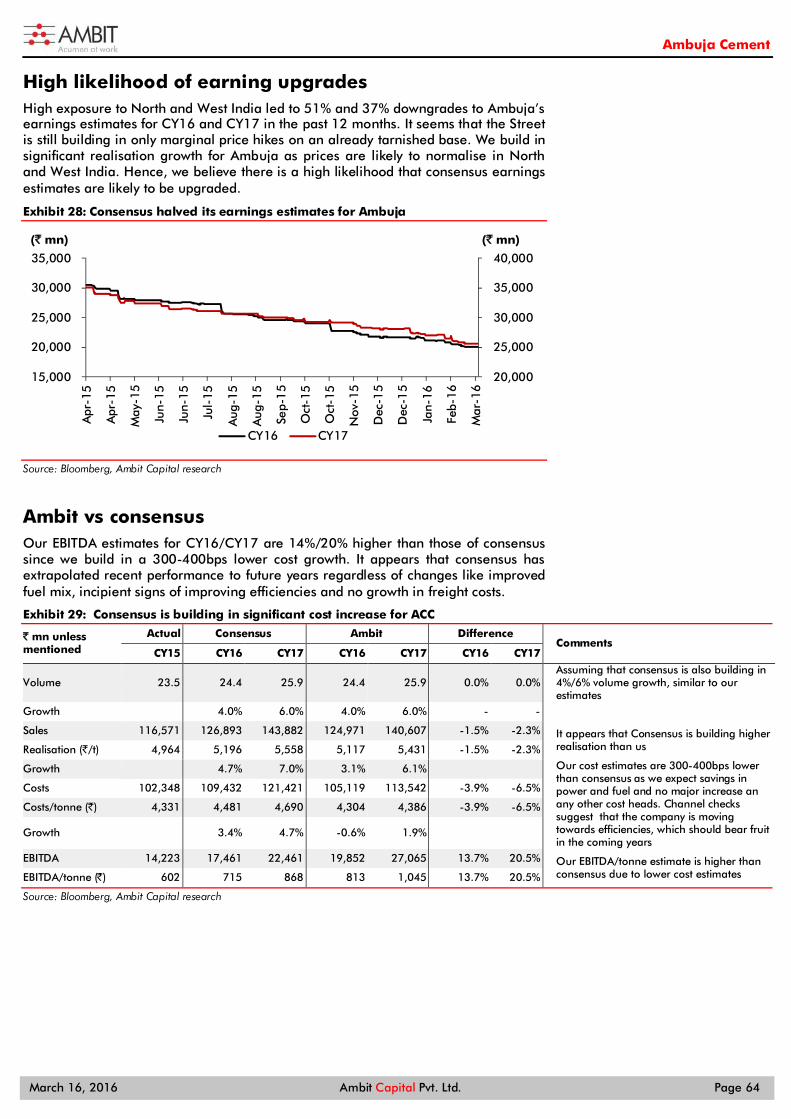
Ambuja Cement
March 16, 2016 Ambit Capital Pvt. Ltd. Page 64
High likelihood of earning upgrades High exposure to North and West India led to 51% and 37% downgrades to Ambuja’s earnings estimates for CY16 and CY17 in the past 12 months. It seems that the Street is still building in only marginal price hikes on an already tarnished base. We build in significant realisation growth for Ambuja as prices are likely to normalise in North and West India. Hence, we believe there is a high likelihood that consensus earnings estimates are likely to be upgraded.
Exhibit 28: Consensus halved its earnings estimates for Ambuja
Source: Bloomberg, Ambit Capital research
Ambit vs consensus Our EBITDA estimates for CY16/CY17 are 14%/20% higher than those of consensus since we build in a 300-400bps lower cost growth. It appears that consensus has extrapolated recent performance to future years regardless of changes like improved fuel mix, incipient signs of improving efficiencies and no growth in freight costs.
Exhibit 29: Consensus is building in significant cost increase for ACC
` mn unless mentioned
Actual Consensus Ambit Difference Comments
CY15 CY16 CY17 CY16 CY17 CY16 CY17
Volume 23.5 24.4 25.9 24.4 25.9 0.0% 0.0% Assuming that consensus is also building in 4%/6% volume growth, similar to our estimates
Growth 4.0% 6.0% 4.0% 6.0% - - Sales 116,571 126,893 143,882 124,971 140,607 -1.5% -2.3% It appears that Consensus is building higher
realisation than us Realisation (`/t) 4,964 5,196 5,558 5,117 5,431 -1.5% -2.3%
Growth 4.7% 7.0% 3.1% 6.1% Our cost estimates are 300-400bps lower than consensus as we expect savings in power and fuel and no major increase an any other cost heads. Channel checks suggest that the company is moving towards efficiencies, which should bear fruit in the coming years
Costs 102,348 109,432 121,421 105,119 113,542 -3.9% -6.5%
Costs/tonne (`) 4,331 4,481 4,690 4,304 4,386 -3.9% -6.5%
Growth 3.4% 4.7% -0.6% 1.9%
EBITDA 14,223 17,461 22,461 19,852 27,065 13.7% 20.5% Our EBITDA/tonne estimate is higher than consensus due to lower cost estimates EBITDA/tonne (̀ ) 602 715 868 813 1,045 13.7% 20.5%
Source: Bloomberg, Ambit Capital research
20,000
25,000
30,000
35,000
40,000
15,000
20,000
25,000
30,000
35,000
Apr
-15
Apr
-15
May
-15
Jun-
15
Jun-
15
Jul-
15
Aug
-15
Aug
-15
Sep-
15
Oct
-15
Oct
-15
Nov
-15
Dec
-15
Dec
-15
Jan-
16
Feb-
16
Mar
-16
(` mn)(` mn)
CY16 CY17
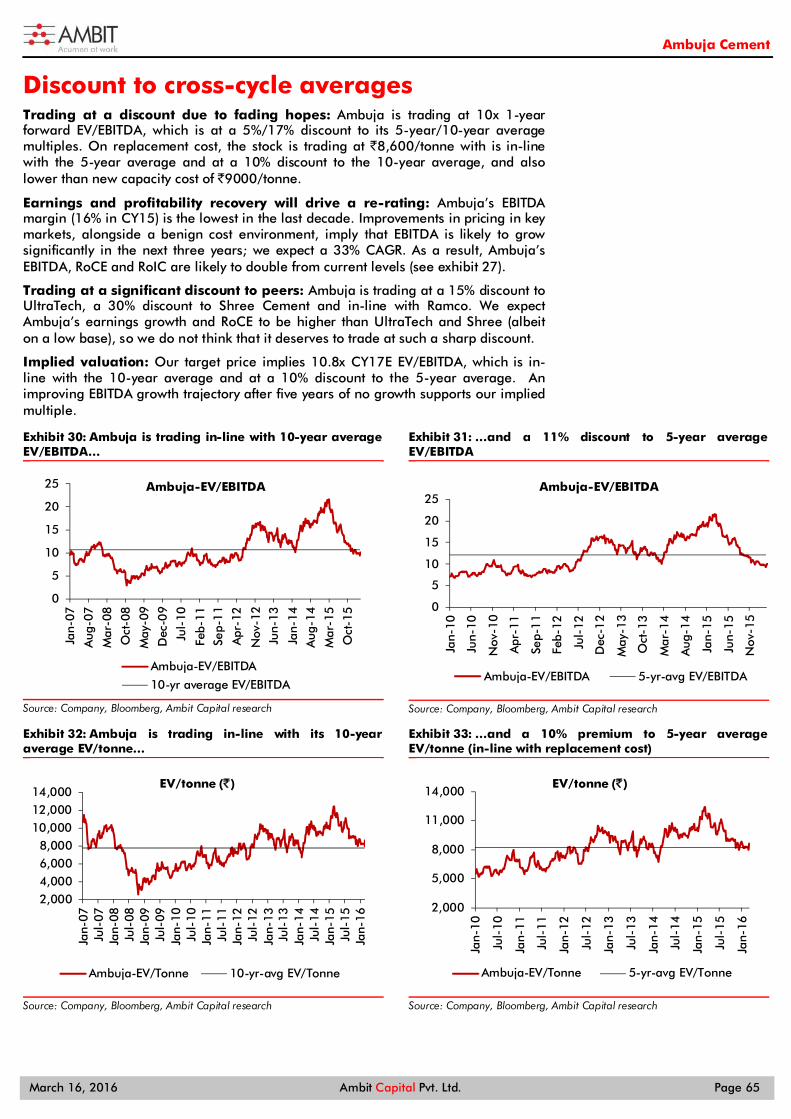
Ambuja Cement
March 16, 2016 Ambit Capital Pvt. Ltd. Page 65
Discount to cross-cycle averages Trading at a discount due to fading hopes: Ambuja is trading at 10x 1-year forward EV/EBITDA, which is at a 5%/17% discount to its 5-year/10-year average multiples. On replacement cost, the stock is trading at `8,600/tonne with is in-line with the 5-year average and at a 10% discount to the 10-year average, and also lower than new capacity cost of `9000/tonne.
Earnings and profitability recovery will drive a re-rating: Ambuja’s EBITDA margin (16% in CY15) is the lowest in the last decade. Improvements in pricing in key markets, alongside a benign cost environment, imply that EBITDA is likely to grow significantly in the next three years; we expect a 33% CAGR. As a result, Ambuja’s EBITDA, RoCE and RoIC are likely to double from current levels (see exhibit 27).
Trading at a significant discount to peers: Ambuja is trading at a 15% discount to UltraTech, a 30% discount to Shree Cement and in-line with Ramco. We expect Ambuja’s earnings growth and RoCE to be higher than UltraTech and Shree (albeit on a low base), so we do not think that it deserves to trade at such a sharp discount.
Implied valuation: Our target price implies 10.8x CY17E EV/EBITDA, which is in-line with the 10-year average and at a 10% discount to the 5-year average. An improving EBITDA growth trajectory after five years of no growth supports our implied multiple.
Exhibit 30: Ambuja is trading in-line with 10-year average EV/EBITDA…
Source: Company, Bloomberg, Ambit Capital research
Exhibit 31: …and a 11% discount to 5-year average EV/EBITDA
Source: Company, Bloomberg, Ambit Capital research
Exhibit 32: Ambuja is trading in-line with its 10-year average EV/tonne…
Source: Company, Bloomberg, Ambit Capital research
Exhibit 33: …and a 10% premium to 5-year average EV/tonne (in-line with replacement cost)
Source: Company, Bloomberg, Ambit Capital research
0
5
10
15
20
25
Jan-
07
Aug
-07
Mar
-08
Oct
-08
May
-09
Dec
-09
Jul-
10
Feb-
11Se
p-1
1
Apr
-12
Nov
-12
Jun-
13
Jan-
14A
ug-1
4
Mar
-15
Oct
-15
Ambuja-EV/EBITDA
Ambuja-EV/EBITDA
10-yr average EV/EBITDA
0
5
10
15
20
25
Jan-
10
Jun-
10
Nov
-10
Apr
-11
Sep-
11
Feb-
12
Jul-
12
Dec
-12
May
-13
Oct
-13
Mar
-14
Aug
-14
Jan-
15
Jun-
15
Nov
-15
Ambuja-EV/EBITDA
Ambuja-EV/EBITDA 5-yr-avg EV/EBITDA
2,0004,0006,0008,000
10,00012,00014,000
Jan-
07Ju
l-07
Jan-
08Ju
l-08
Jan-
09Ju
l-09
Jan-
10Ju
l-10
Jan-
11Ju
l-11
Jan-
12Ju
l-12
Jan-
13Ju
l-13
Jan-
14Ju
l-14
Jan-
15Ju
l-15
Jan-
16
EV/tonne (`)
Ambuja-EV/Tonne 10-yr-avg EV/Tonne
2,000
5,000
8,000
11,000
14,000
Jan-
10
Jul-
10
Jan-
11
Jul-
11
Jan-
12
Jul-
12
Jan-
13
Jul-
13
Jan-
14
Jul-
14
Jan-
15
Jul-
15
Jan-
16
EV/tonne (`)
Ambuja-EV/Tonne 5-yr-avg EV/Tonne
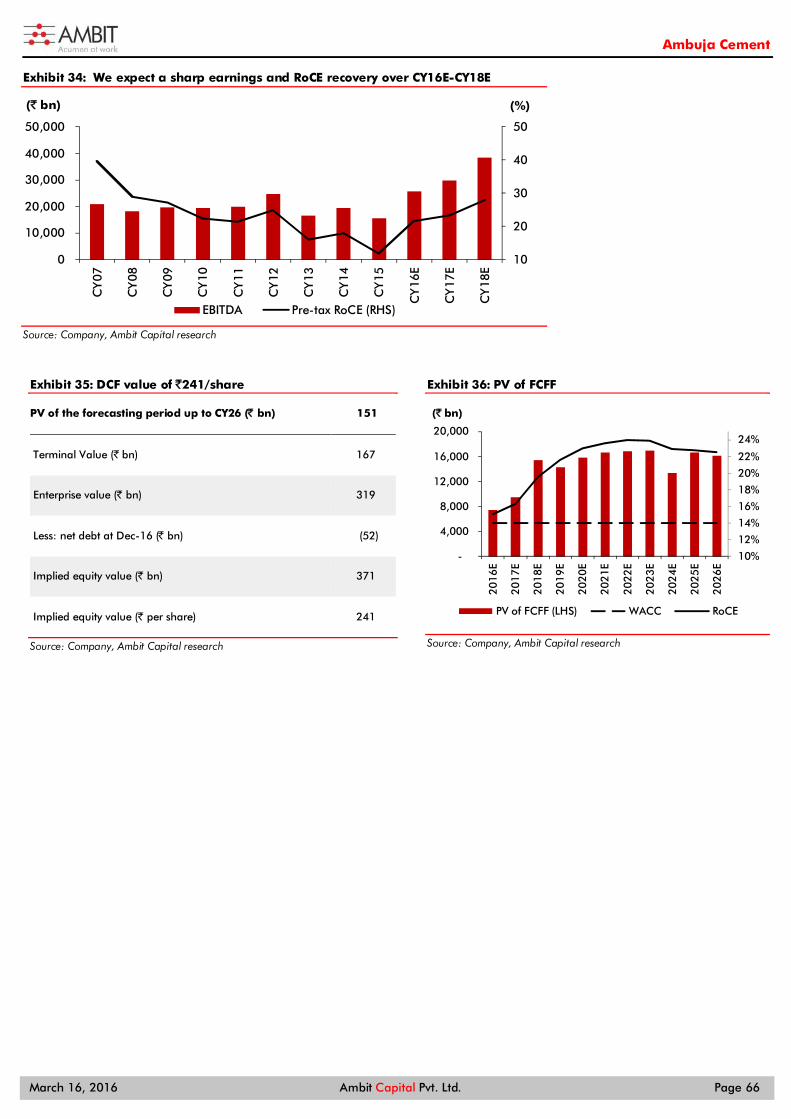
Ambuja Cement
March 16, 2016 Ambit Capital Pvt. Ltd. Page 66
Exhibit 34: We expect a sharp earnings and RoCE recovery over CY16E-CY18E
Source: Company, Ambit Capital research
Exhibit 35: DCF value of ̀ 241/share
PV of the forecasting period up to CY26 (̀ bn) 151
Terminal Value (` bn) 167
Enterprise value (` bn) 319
Less: net debt at Dec-16 (̀ bn) (52)
Implied equity value (` bn) 371
Implied equity value (` per share) 241
Source: Company, Ambit Capital research
Exhibit 36: PV of FCFF
Source: Company, Ambit Capital research
10
20
30
40
50
0
10,000
20,000
30,000
40,000
50,000
CY
07
CY
08
CY
09
CY
10
CY
11
CY
12
CY
13
CY
14
CY
15
CY
16E
CY
17E
CY
18E
(%)(` bn)
EBITDA Pre-tax RoCE (RHS)
10%
12%
14%
16%
18%
20%
22%
24%
-
4,000
8,000
12,000
16,000
20,000
2016
E
2017
E
2018
E
2019
E
2020
E
2021
E
2022
E
2023
E
2024
E
2025
E
2026
E
(` bn)
PV of FCFF (LHS) WACC RoCE
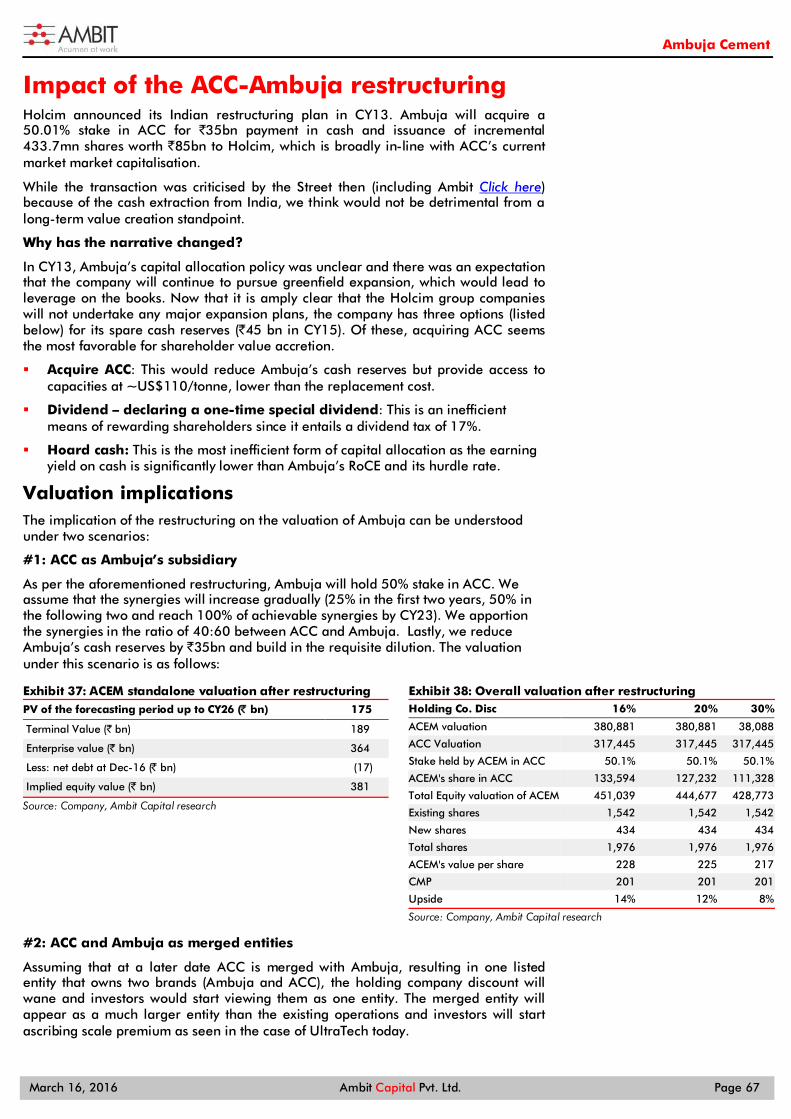
Ambuja Cement
March 16, 2016 Ambit Capital Pvt. Ltd. Page 67
Impact of the ACC-Ambuja restructuring Holcim announced its Indian restructuring plan in CY13. Ambuja will acquire a 50.01% stake in ACC for `35bn payment in cash and issuance of incremental 433.7mn shares worth `85bn to Holcim, which is broadly in-line with ACC’s current market market capitalisation.
While the transaction was criticised by the Street then (including Ambit Click here) because of the cash extraction from India, we think would not be detrimental from a long-term value creation standpoint.
Why has the narrative changed?
In CY13, Ambuja’s capital allocation policy was unclear and there was an expectation that the company will continue to pursue greenfield expansion, which would lead to leverage on the books. Now that it is amply clear that the Holcim group companies will not undertake any major expansion plans, the company has three options (listed below) for its spare cash reserves (`45 bn in CY15). Of these, acquiring ACC seems the most favorable for shareholder value accretion.
Acquire ACC: This would reduce Ambuja’s cash reserves but provide access to capacities at ~US$110/tonne, lower than the replacement cost.
Dividend – declaring a one-time special dividend: This is an inefficient means of rewarding shareholders since it entails a dividend tax of 17%.
Hoard cash: This is the most inefficient form of capital allocation as the earning yield on cash is significantly lower than Ambuja’s RoCE and its hurdle rate.
Valuation implications The implication of the restructuring on the valuation of Ambuja can be understood under two scenarios:
#1: ACC as Ambuja’s subsidiary
As per the aforementioned restructuring, Ambuja will hold 50% stake in ACC. We assume that the synergies will increase gradually (25% in the first two years, 50% in the following two and reach 100% of achievable synergies by CY23). We apportion the synergies in the ratio of 40:60 between ACC and Ambuja. Lastly, we reduce Ambuja’s cash reserves by `35bn and build in the requisite dilution. The valuation under this scenario is as follows:
Exhibit 37: ACEM standalone valuation after restructuring PV of the forecasting period up to CY26 (̀ bn) 175
Terminal Value (` bn) 189
Enterprise value (` bn) 364
Less: net debt at Dec-16 (̀ bn) (17)
Implied equity value (` bn) 381
Source: Company, Ambit Capital research
Exhibit 38: Overall valuation after restructuring Holding Co. Disc 16% 20% 30%
ACEM valuation 380,881 380,881 38,088
ACC Valuation 317,445 317,445 317,445
Stake held by ACEM in ACC 50.1% 50.1% 50.1%
ACEM's share in ACC 133,594 127,232 111,328
Total Equity valuation of ACEM 451,039 444,677 428,773
Existing shares 1,542 1,542 1,542
New shares 434 434 434
Total shares 1,976 1,976 1,976
ACEM's value per share 228 225 217
CMP 201 201 201
Upside 14% 12% 8%
Source: Company, Ambit Capital research
#2: ACC and Ambuja as merged entities
Assuming that at a later date ACC is merged with Ambuja, resulting in one listed entity that owns two brands (Ambuja and ACC), the holding company discount will wane and investors would start viewing them as one entity. The merged entity will appear as a much larger entity than the existing operations and investors will start ascribing scale premium as seen in the case of UltraTech today.
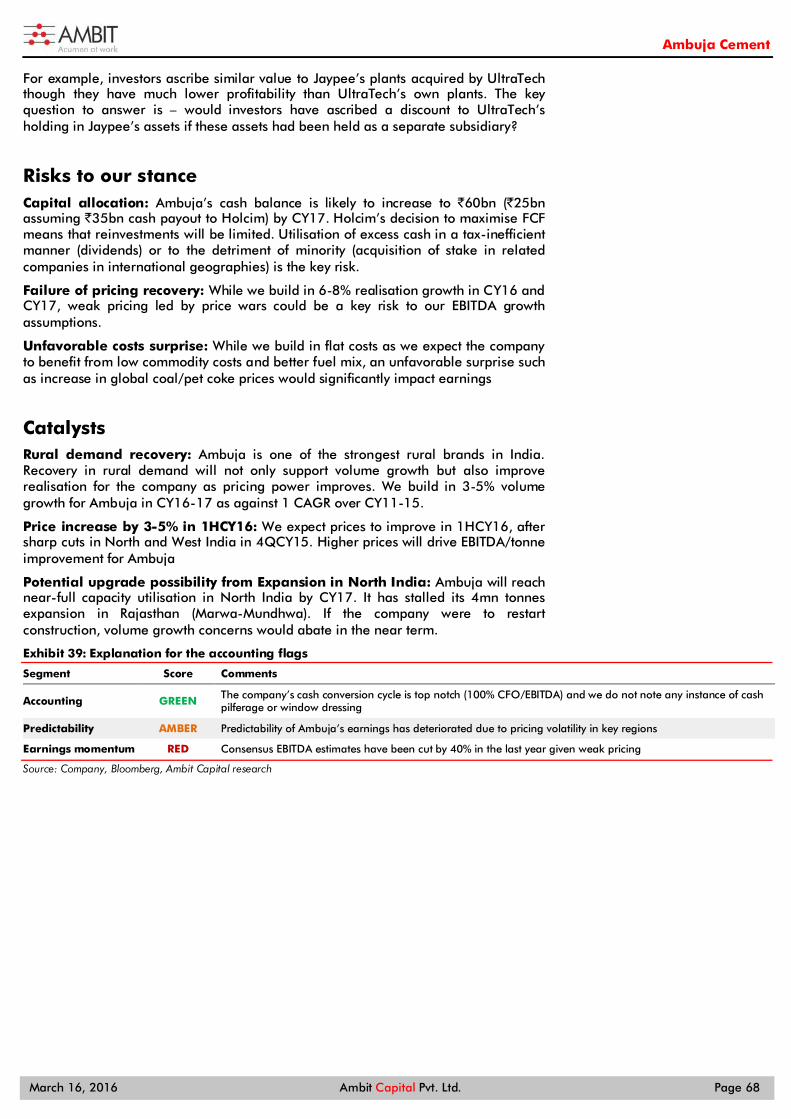
Ambuja Cement
March 16, 2016 Ambit Capital Pvt. Ltd. Page 68
For example, investors ascribe similar value to Jaypee’s plants acquired by UltraTech though they have much lower profitability than UltraTech’s own plants. The key question to answer is – would investors have ascribed a discount to UltraTech’s holding in Jaypee’s assets if these assets had been held as a separate subsidiary?
Risks to our stance Capital allocation: Ambuja’s cash balance is likely to increase to `60bn (`25bn assuming `35bn cash payout to Holcim) by CY17. Holcim’s decision to maximise FCF means that reinvestments will be limited. Utilisation of excess cash in a tax-inefficient manner (dividends) or to the detriment of minority (acquisition of stake in related companies in international geographies) is the key risk.
Failure of pricing recovery: While we build in 6-8% realisation growth in CY16 and CY17, weak pricing led by price wars could be a key risk to our EBITDA growth assumptions.
Unfavorable costs surprise: While we build in flat costs as we expect the company to benefit from low commodity costs and better fuel mix, an unfavorable surprise such as increase in global coal/pet coke prices would significantly impact earnings
Catalysts Rural demand recovery: Ambuja is one of the strongest rural brands in India. Recovery in rural demand will not only support volume growth but also improve realisation for the company as pricing power improves. We build in 3-5% volume growth for Ambuja in CY16-17 as against 1 CAGR over CY11-15.
Price increase by 3-5% in 1HCY16: We expect prices to improve in 1HCY16, after sharp cuts in North and West India in 4QCY15. Higher prices will drive EBITDA/tonne improvement for Ambuja
Potential upgrade possibility from Expansion in North India: Ambuja will reach near-full capacity utilisation in North India by CY17. It has stalled its 4mn tonnes expansion in Rajasthan (Marwa-Mundhwa). If the company were to restart construction, volume growth concerns would abate in the near term.
Exhibit 39: Explanation for the accounting flags
Segment Score Comments
Accounting GREEN The company’s cash conversion cycle is top notch (100% CFO/EBITDA) and we do not note any instance of cash pilferage or window dressing
Predictability AMBER Predictability of Ambuja’s earnings has deteriorated due to pricing volatility in key regions
Earnings momentum RED Consensus EBITDA estimates have been cut by 40% in the last year given weak pricing
Source: Company, Bloomberg, Ambit Capital research
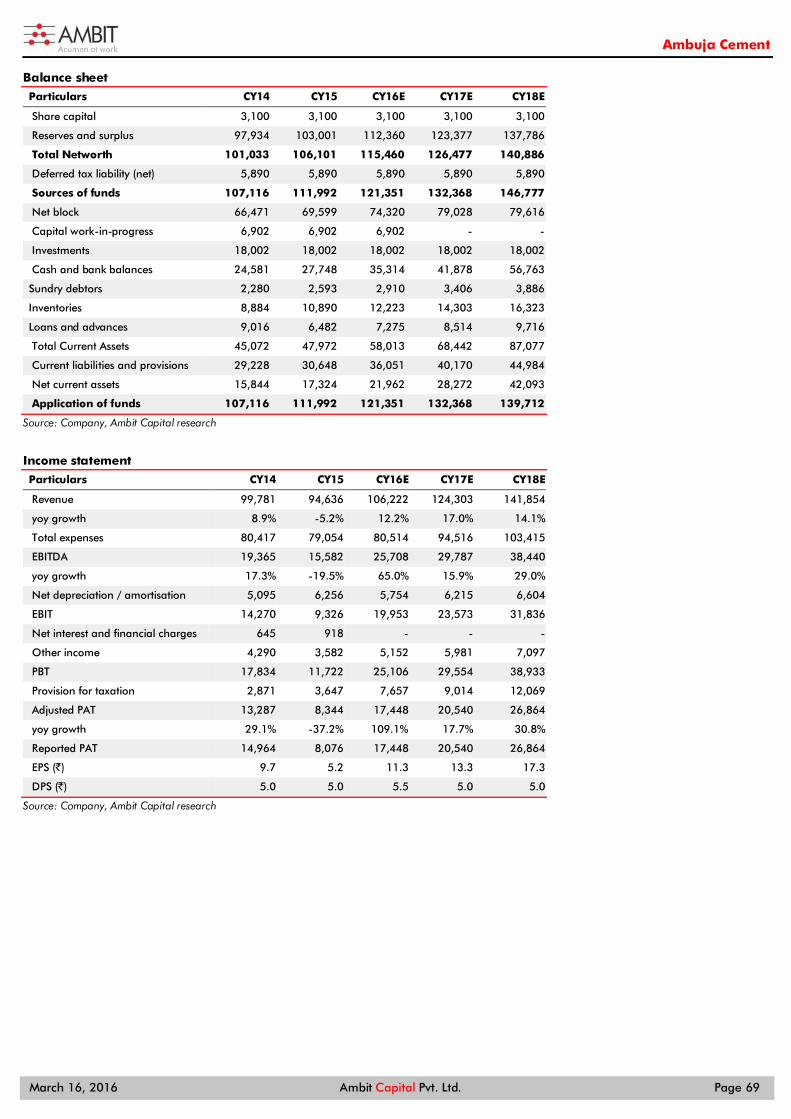
Ambuja Cement
March 16, 2016 Ambit Capital Pvt. Ltd. Page 69
Balance sheet
Particulars CY14 CY15 CY16E CY17E CY18E
Share capital 3,100 3,100 3,100 3,100 3,100
Reserves and surplus 97,934 103,001 112,360 123,377 137,786
Total Networth 101,033 106,101 115,460 126,477 140,886
Deferred tax liability (net) 5,890 5,890 5,890 5,890 5,890
Sources of funds 107,116 111,992 121,351 132,368 146,777
Net block 66,471 69,599 74,320 79,028 79,616
Capital work-in-progress 6,902 6,902 6,902 - -
Investments 18,002 18,002 18,002 18,002 18,002
Cash and bank balances 24,581 27,748 35,314 41,878 56,763
Sundry debtors 2,280 2,593 2,910 3,406 3,886
Inventories 8,884 10,890 12,223 14,303 16,323
Loans and advances 9,016 6,482 7,275 8,514 9,716
Total Current Assets 45,072 47,972 58,013 68,442 87,077
Current liabilities and provisions 29,228 30,648 36,051 40,170 44,984
Net current assets 15,844 17,324 21,962 28,272 42,093
Application of funds 107,116 111,992 121,351 132,368 139,712
Source: Company, Ambit Capital research
Income statement
Particulars CY14 CY15 CY16E CY17E CY18E
Revenue 99,781 94,636 106,222 124,303 141,854
yoy growth 8.9% -5.2% 12.2% 17.0% 14.1%
Total expenses 80,417 79,054 80,514 94,516 103,415
EBITDA 19,365 15,582 25,708 29,787 38,440
yoy growth 17.3% -19.5% 65.0% 15.9% 29.0%
Net depreciation / amortisation 5,095 6,256 5,754 6,215 6,604
EBIT 14,270 9,326 19,953 23,573 31,836
Net interest and financial charges 645 918 - - -
Other income 4,290 3,582 5,152 5,981 7,097
PBT 17,834 11,722 25,106 29,554 38,933
Provision for taxation 2,871 3,647 7,657 9,014 12,069
Adjusted PAT 13,287 8,344 17,448 20,540 26,864
yoy growth 29.1% -37.2% 109.1% 17.7% 30.8%
Reported PAT 14,964 8,076 17,448 20,540 26,864
EPS (`) 9.7 5.2 11.3 13.3 17.3
DPS (`) 5.0 5.0 5.5 5.0 5.0
Source: Company, Ambit Capital research
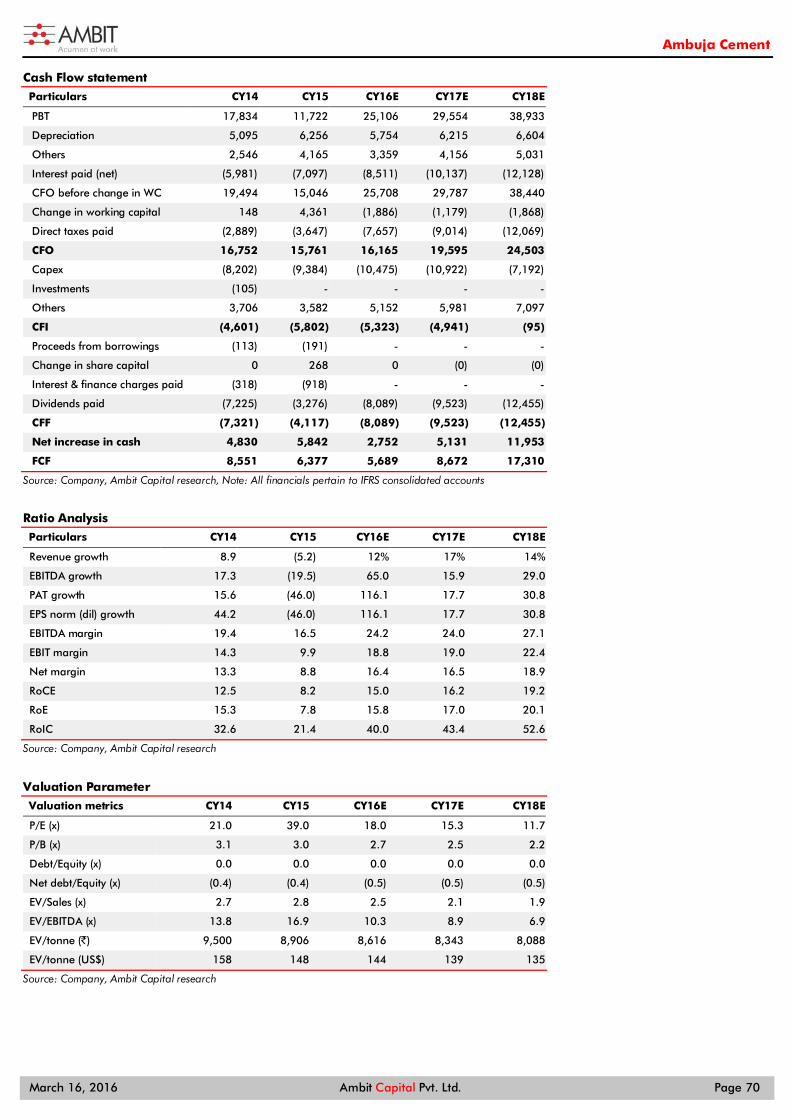
Ambuja Cement
March 16, 2016 Ambit Capital Pvt. Ltd. Page 70
Cash Flow statement
Particulars CY14 CY15 CY16E CY17E CY18E
PBT 17,834 11,722 25,106 29,554 38,933
Depreciation 5,095 6,256 5,754 6,215 6,604
Others 2,546 4,165 3,359 4,156 5,031
Interest paid (net) (5,981) (7,097) (8,511) (10,137) (12,128)
CFO before change in WC 19,494 15,046 25,708 29,787 38,440
Change in working capital 148 4,361 (1,886) (1,179) (1,868)
Direct taxes paid (2,889) (3,647) (7,657) (9,014) (12,069)
CFO 16,752 15,761 16,165 19,595 24,503
Capex (8,202) (9,384) (10,475) (10,922) (7,192)
Investments (105) - - - -
Others 3,706 3,582 5,152 5,981 7,097
CFI (4,601) (5,802) (5,323) (4,941) (95)
Proceeds from borrowings (113) (191) - - -
Change in share capital 0 268 0 (0) (0)
Interest & finance charges paid (318) (918) - - -
Dividends paid (7,225) (3,276) (8,089) (9,523) (12,455)
CFF (7,321) (4,117) (8,089) (9,523) (12,455)
Net increase in cash 4,830 5,842 2,752 5,131 11,953
FCF 8,551 6,377 5,689 8,672 17,310
Source: Company, Ambit Capital research, Note: All financials pertain to IFRS consolidated accounts
Ratio Analysis
Particulars CY14 CY15 CY16E CY17E CY18E
Revenue growth 8.9 (5.2) 12% 17% 14%
EBITDA growth 17.3 (19.5) 65.0 15.9 29.0
PAT growth 15.6 (46.0) 116.1 17.7 30.8
EPS norm (dil) growth 44.2 (46.0) 116.1 17.7 30.8
EBITDA margin 19.4 16.5 24.2 24.0 27.1
EBIT margin 14.3 9.9 18.8 19.0 22.4
Net margin 13.3 8.8 16.4 16.5 18.9
RoCE 12.5 8.2 15.0 16.2 19.2
RoE 15.3 7.8 15.8 17.0 20.1
RoIC 32.6 21.4 40.0 43.4 52.6
Source: Company, Ambit Capital research
Valuation Parameter
Valuation metrics CY14 CY15 CY16E CY17E CY18E
P/E (x) 21.0 39.0 18.0 15.3 11.7
P/B (x) 3.1 3.0 2.7 2.5 2.2
Debt/Equity (x) 0.0 0.0 0.0 0.0 0.0
Net debt/Equity (x) (0.4) (0.4) (0.5) (0.5) (0.5)
EV/Sales (x) 2.7 2.8 2.5 2.1 1.9
EV/EBITDA (x) 13.8 16.9 10.3 8.9 6.9
EV/tonne (`) 9,500 8,906 8,616 8,343 8,088
EV/tonne (US$) 158 148 144 139 135
Source: Company, Ambit Capital research

Ambit Capital and / or its affiliates do and seek to do business including investment banking with companies covered in its research reports. As a result, investors should be aware that Ambit Capital may have a conflict of interest that could affect the objectivity of this report. Investors should not consider this report as the only factor in making their investment decision.
CHANGE IN STANCE ACC IN EQUITY March 16, 2016
No pressure of expectations
Five years of flat volumes, declining EBITDA (-5% annualised) and single-digit RoCE have made ACC the least favored pan-India cement stock. Forward looking consensus estimates suffer from recency bias and do not regard: (a) a high likelihood of better pricing discipline in North, West and Central India, (b) cost efficiencies from improving fuel mix (27% petcoke) and (c) upcoming capacities in East India. EBITDA trajectory over CY15-18E (32% CAGR) should be materially superior to CY12-15 (13% decline) and recovering RoIC (13.4% in CY15-18 vs 8.7% in CY12-15). At 10x CY16E EBITDA (in-line with 10-year average) and 30% discount to replacement cost, upsides from an earnings recovery are not factored in but downsides are covered if our thesis doesn’t play out.
Competitive position: MODERATE Changes to this position: STABLE A tier I brand but not a tier I cement franchise
ACC remains one of the best retail cement brands in India, but its unitary EBITDA is the lowest among the top-5 cement manufacturers (16% lower than the average). Continuous market-share loss and inability to offset rising freight and power costs (either through pricing or cost efficiencies) eroded both RoCE (to decadal lows of 6% vs 10-year average of 17%) and investor affinity. Higher pricing discipline in core regions bodes well
Market-share tussle by the top cement groups in West and North India hit pricing, leading to a sharp decline in ACC’s unitary EBITDA (50% exposure to these markets). Incipient signs of better pricing discipline, improvement in power efficiencies (see exhibits 6 & 7) and flat rail freight cost almost double the company’s unitary EBITDA to `1,171 by CY18 from `602 in CY15.
Consensus estimates suffer from recency bias
A few quarters of weak pricing and consensus cut ACC’s EBITDA estimate by 35%/50% in CY16/CY17. Our not-so-aggressive CY16/CY17 assumptions build in: (a) 4%/6% volume growth, (b) 6% pricing growth, and (c) 1.5% cost increase, resulting in 22% unitary EBITDA CAGR (on a low base). Our CY16/CY17 estimates are 14%/20% higher than those of consensus. Valuation: High margin of safety
ACC is not a stock to “own” till perpetuity but one can “rent” it to play the expectations arbitrage. Current valuations are reasonable (10x CY16 EV/EBITDA; in-line with cross-cycle average) and should be seen in light of a superior earnings trajectory (albeit on a low base) and a 1,000bps improvement in RoIC over CY15-18 to 23.5%. The risks of weak demand and volatile pricing are adequately factored in the stock price. We see limited downside hereon.
ACCBUY
Cement
Recommendation Mcap (bn): `230/US$3.4 6M ADV (mn): `271.2/US$4 CMP: `1240 TP (12 mths): `1514 Upside (%): 22
Flags Accounting: GREEN Predictability: AMBER Earnings Momentum: RED
Catalysts
Efficiencies from fuel mix and new plant from 2HCY16 to improve EBITDA margin
Price recovery in core markets in 1HCY16 will further support EBITDA/tonne growth
Performance (%)
Source: Bloomberg, Ambit Capital Research
70
80
90
100Ja
n-00
Apr
-15
Jun
-15
Jul-
15
Sep-
15
Oct
-15
Dec
-15
Jan-
16
Feb-
16
SENSEX ACC
Research Analysts
Nitin Bhasin
+91 22 3043 3241
Achint Bhagat, CFA [email protected]
+91 22 3043 3178
Key financials
Y/E Dec (̀ mn) CY2013 CY2014 CY2015 CY2016E CY2017E
Operating Income (̀ mn) 124,971 117,382 116,571 124,971 140,607
EBITDA (` mn) 19,852 14,896 14,223 19,852 27,065
EBITDA margin (%) 15.9 12.7 12.2 15.9 19.2
EPS (`) 56.1 44.7 33.5 56.1 83.5
RoCE (%) 10.1 7.6 6.0 10.1 14.0
RoIC(%) 22.8 20.2 14.9 22.8 30.0
EV/ EBITDA (x) 10.9 14.4 15.2 10.9 8.0
Source: Company, Ambit Capital research
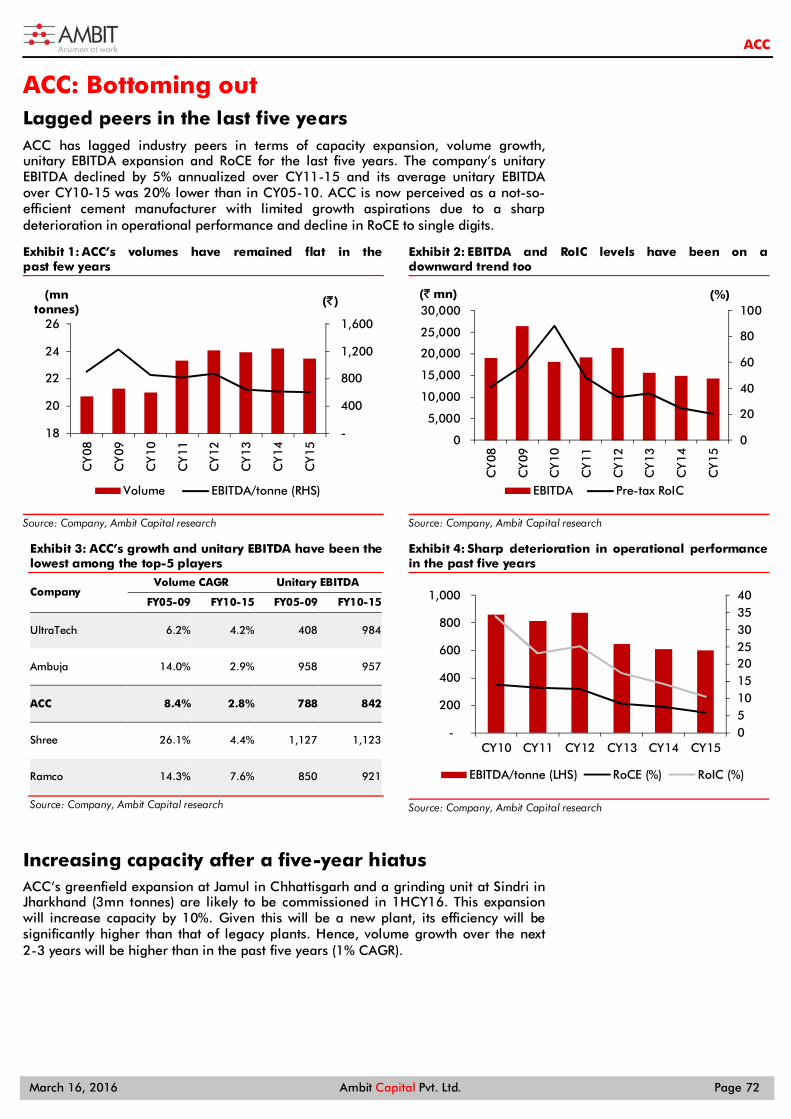
ACC
March 16, 2016 Ambit Capital Pvt. Ltd. Page 72
ACC: Bottoming out Lagged peers in the last five years ACC has lagged industry peers in terms of capacity expansion, volume growth, unitary EBITDA expansion and RoCE for the last five years. The company’s unitary EBITDA declined by 5% annualized over CY11-15 and its average unitary EBITDA over CY10-15 was 20% lower than in CY05-10. ACC is now perceived as a not-so-efficient cement manufacturer with limited growth aspirations due to a sharp deterioration in operational performance and decline in RoCE to single digits.
Exhibit 1: ACC’s volumes have remained flat in the past few years
Source: Company, Ambit Capital research
Exhibit 2: EBITDA and RoIC levels have been on a downward trend too
Source: Company, Ambit Capital research
Exhibit 3: ACC’s growth and unitary EBITDA have been the lowest among the top-5 players
Company Volume CAGR Unitary EBITDA
FY05-09 FY10-15 FY05-09 FY10-15
UltraTech 6.2% 4.2% 408 984
Ambuja 14.0% 2.9% 958 957
ACC 8.4% 2.8% 788 842
Shree 26.1% 4.4% 1,127 1,123
Ramco 14.3% 7.6% 850 921
Source: Company, Ambit Capital research
Exhibit 4: Sharp deterioration in operational performance in the past five years
Source: Company, Ambit Capital research
Increasing capacity after a five-year hiatus ACC’s greenfield expansion at Jamul in Chhattisgarh and a grinding unit at Sindri in Jharkhand (3mn tonnes) are likely to be commissioned in 1HCY16. This expansion will increase capacity by 10%. Given this will be a new plant, its efficiency will be significantly higher than that of legacy plants. Hence, volume growth over the next 2-3 years will be higher than in the past five years (1% CAGR).
-
400
800
1,200
1,600
18
20
22
24
26
CY
08
CY
09
CY
10
CY
11
CY
12
CY
13
CY
14
CY
15(`)(mn
tonnes)
Volume EBITDA/tonne (RHS)
0
20
40
60
80
100
0
5,000
10,000
15,000
20,000
25,000
30,000
CY
08
CY
09
CY
10
CY
11
CY
12
CY
13
CY
14
CY
15
(%)(` mn)
EBITDA Pre-tax RoIC
0510152025303540
-
200
400
600
800
1,000
CY10 CY11 CY12 CY13 CY14 CY15
EBITDA/tonne (LHS) RoCE (%) RoIC (%)
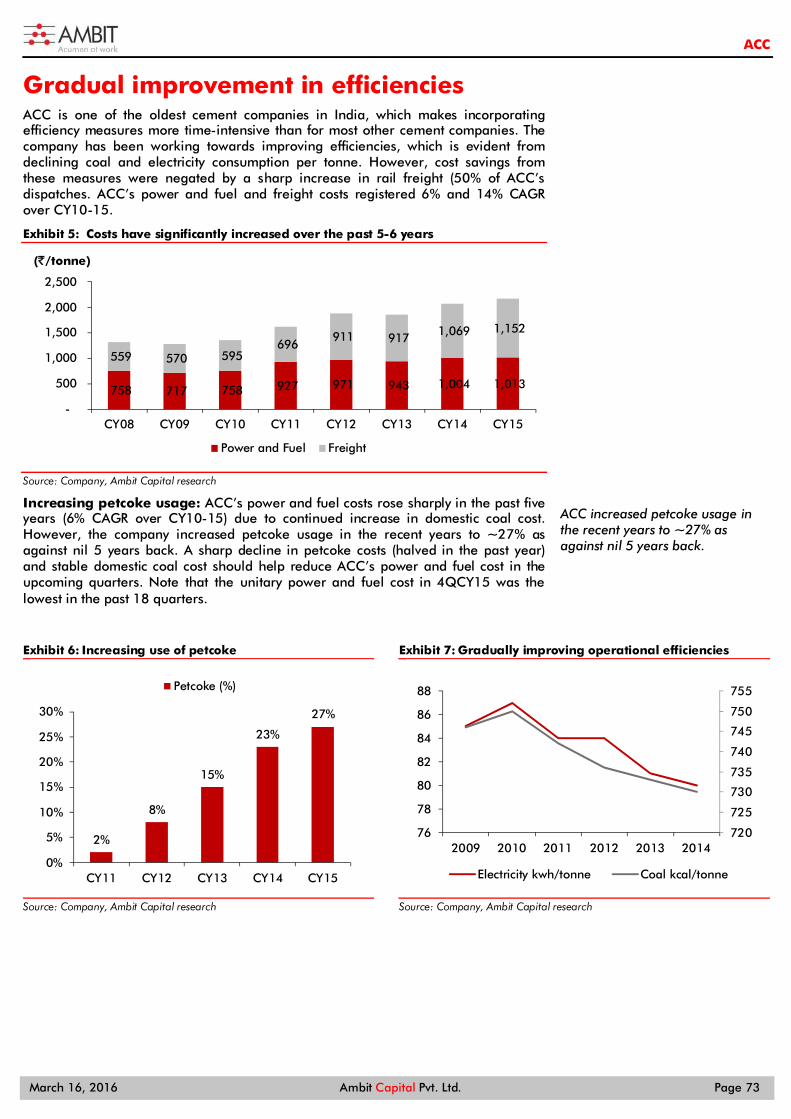
ACC
March 16, 2016 Ambit Capital Pvt. Ltd. Page 73
Gradual improvement in efficiencies ACC is one of the oldest cement companies in India, which makes incorporating efficiency measures more time-intensive than for most other cement companies. The company has been working towards improving efficiencies, which is evident from declining coal and electricity consumption per tonne. However, cost savings from these measures were negated by a sharp increase in rail freight (50% of ACC’s dispatches. ACC’s power and fuel and freight costs registered 6% and 14% CAGR over CY10-15.
Exhibit 5: Costs have significantly increased over the past 5-6 years
Source: Company, Ambit Capital research
Increasing petcoke usage: ACC’s power and fuel costs rose sharply in the past five years (6% CAGR over CY10-15) due to continued increase in domestic coal cost. However, the company increased petcoke usage in the recent years to ~27% as against nil 5 years back. A sharp decline in petcoke costs (halved in the past year) and stable domestic coal cost should help reduce ACC’s power and fuel cost in the upcoming quarters. Note that the unitary power and fuel cost in 4QCY15 was the lowest in the past 18 quarters.
Exhibit 6: Increasing use of petcoke
Source: Company, Ambit Capital research
Exhibit 7: Gradually improving operational efficiencies
Source: Company, Ambit Capital research
758 717 758 927 971 943 1,004 1,013
559 570 595 696
911 917 1,069 1,152
-
500
1,000
1,500
2,000
2,500
CY08 CY09 CY10 CY11 CY12 CY13 CY14 CY15
(`/tonne)
Power and Fuel Freight
2%
8%
15%
23%
27%
0%
5%
10%
15%
20%
25%
30%
CY11 CY12 CY13 CY14 CY15
Petcoke (%)
720
725
730
735
740
745
750
755
76
78
80
82
84
86
88
2009 2010 2011 2012 2013 2014
Electricity kwh/tonne Coal kcal/tonne
ACC increased petcoke usage in the recent years to ~27% as against nil 5 years back.
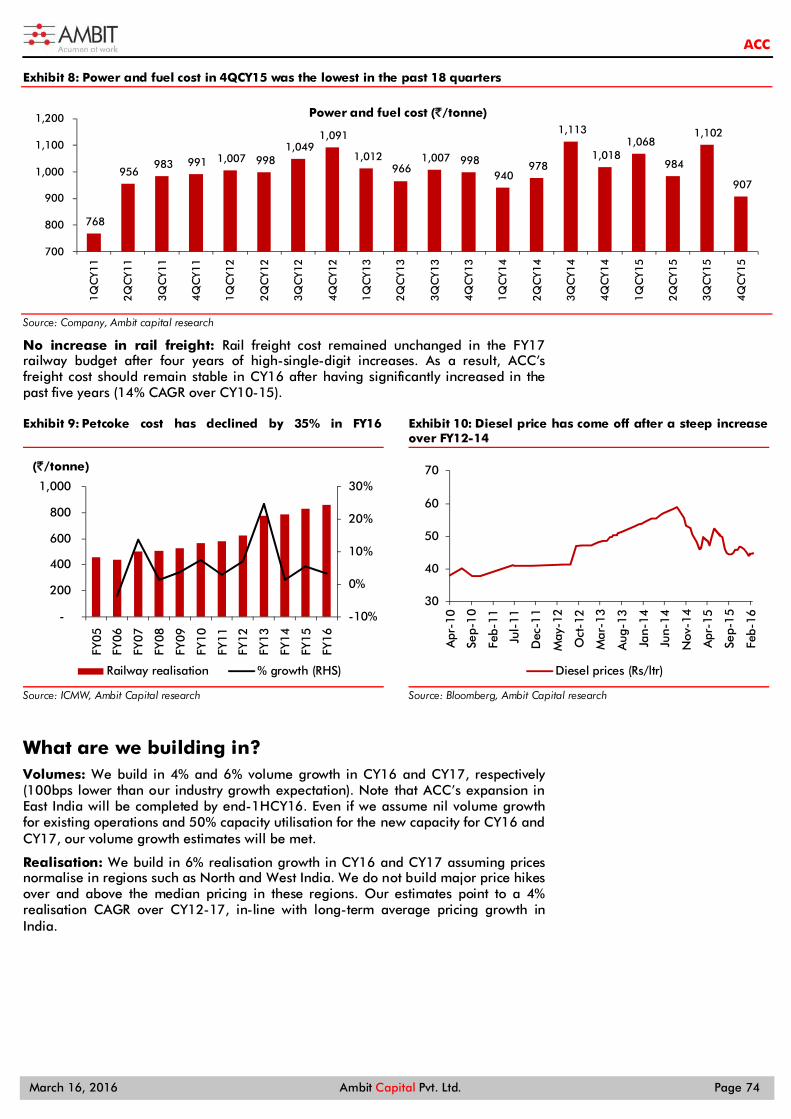
ACC
March 16, 2016 Ambit Capital Pvt. Ltd. Page 74
Exhibit 8: Power and fuel cost in 4QCY15 was the lowest in the past 18 quarters
Source: Company, Ambit capital research
No increase in rail freight: Rail freight cost remained unchanged in the FY17 railway budget after four years of high-single-digit increases. As a result, ACC’s freight cost should remain stable in CY16 after having significantly increased in the past five years (14% CAGR over CY10-15).
Exhibit 9: Petcoke cost has declined by 35% in FY16
Source: ICMW, Ambit Capital research
Exhibit 10: Diesel price has come off after a steep increase over FY12-14
Source: Bloomberg, Ambit Capital research
What are we building in? Volumes: We build in 4% and 6% volume growth in CY16 and CY17, respectively (100bps lower than our industry growth expectation). Note that ACC’s expansion in East India will be completed by end-1HCY16. Even if we assume nil volume growth for existing operations and 50% capacity utilisation for the new capacity for CY16 and CY17, our volume growth estimates will be met.
Realisation: We build in 6% realisation growth in CY16 and CY17 assuming prices normalise in regions such as North and West India. We do not build major price hikes over and above the median pricing in these regions. Our estimates point to a 4% realisation CAGR over CY12-17, in-line with long-term average pricing growth in India.
768
956 983 991 1,007 998
1,049 1,091
1,012 966
1,007 998 940
978
1,113
1,018 1,068
984
1,102
907
700
800
900
1,000
1,100
1,200
1QC
Y11
2QC
Y11
3QC
Y11
4QC
Y11
1QC
Y12
2QC
Y12
3QC
Y12
4QC
Y12
1QC
Y13
2QC
Y13
3QC
Y13
4QC
Y13
1QC
Y14
2QC
Y14
3QC
Y14
4QC
Y14
1QC
Y15
2QC
Y15
3QC
Y15
4QC
Y15
Power and fuel cost (`/tonne)
-10%
0%
10%
20%
30%
-
200
400
600
800
1,000
FY0
5
FY0
6
FY0
7
FY0
8
FY0
9
FY1
0
FY1
1
FY1
2
FY1
3
FY1
4
FY1
5
FY1
6
(`/tonne)
Railway realisation % growth (RHS)
30
40
50
60
70
Apr
-10
Sep-
10
Feb-
11
Jul-
11
Dec
-11
May
-12
Oct
-12
Mar
-13
Aug
-13
Jan-
14
Jun-
14
Nov
-14
Apr
-15
Sep-
15
Feb-
16
Diesel prices (Rs/ltr)
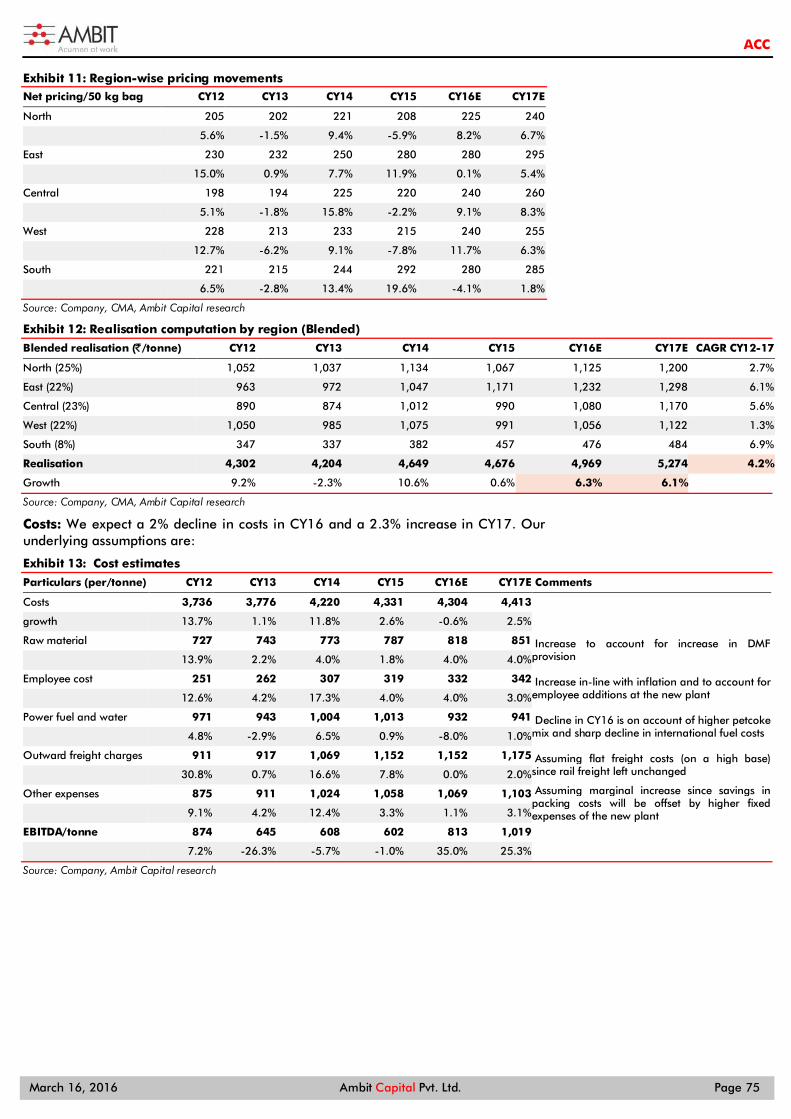
ACC
March 16, 2016 Ambit Capital Pvt. Ltd. Page 75
Exhibit 11: Region-wise pricing movements Net pricing/50 kg bag CY12 CY13 CY14 CY15 CY16E CY17E
North 205 202 221 208 225 240
5.6% -1.5% 9.4% -5.9% 8.2% 6.7%
East 230 232 250 280 280 295
15.0% 0.9% 7.7% 11.9% 0.1% 5.4%
Central 198 194 225 220 240 260
5.1% -1.8% 15.8% -2.2% 9.1% 8.3%
West 228 213 233 215 240 255
12.7% -6.2% 9.1% -7.8% 11.7% 6.3%
South 221 215 244 292 280 285
6.5% -2.8% 13.4% 19.6% -4.1% 1.8%
Source: Company, CMA, Ambit Capital research
Exhibit 12: Realisation computation by region (Blended)
Blended realisation (̀ /tonne) CY12 CY13 CY14 CY15 CY16E CY17E CAGR CY12-17
North (25%) 1,052 1,037 1,134 1,067 1,125 1,200 2.7%
East (22%) 963 972 1,047 1,171 1,232 1,298 6.1%
Central (23%) 890 874 1,012 990 1,080 1,170 5.6%
West (22%) 1,050 985 1,075 991 1,056 1,122 1.3%
South (8%) 347 337 382 457 476 484 6.9%
Realisation 4,302 4,204 4,649 4,676 4,969 5,274 4.2%
Growth 9.2% -2.3% 10.6% 0.6% 6.3% 6.1% Source: Company, CMA, Ambit Capital research
Costs: We expect a 2% decline in costs in CY16 and a 2.3% increase in CY17. Our underlying assumptions are:
Exhibit 13: Cost estimates
Particulars (per/tonne) CY12 CY13 CY14 CY15 CY16E CY17E Comments
Costs 3,736 3,776 4,220 4,331 4,304 4,413 growth 13.7% 1.1% 11.8% 2.6% -0.6% 2.5% Raw material 727 743 773 787 818 851 Increase to account for increase in DMF
provision 13.9% 2.2% 4.0% 1.8% 4.0% 4.0%
Employee cost 251 262 307 319 332 342 Increase in-line with inflation and to account for employee additions at the new plant
12.6% 4.2% 17.3% 4.0% 4.0% 3.0%
Power fuel and water 971 943 1,004 1,013 932 941 Decline in CY16 is on account of higher petcoke mix and sharp decline in international fuel costs
4.8% -2.9% 6.5% 0.9% -8.0% 1.0%
Outward freight charges 911 917 1,069 1,152 1,152 1,175 Assuming flat freight costs (on a high base) since rail freight left unchanged
30.8% 0.7% 16.6% 7.8% 0.0% 2.0%
Other expenses 875 911 1,024 1,058 1,069 1,103 Assuming marginal increase since savings in packing costs will be offset by higher fixed expenses of the new plant 9.1% 4.2% 12.4% 3.3% 1.1% 3.1%
EBITDA/tonne 874 645 608 602 813 1,019 7.2% -26.3% -5.7% -1.0% 35.0% 25.3%
Source: Company, Ambit Capital research
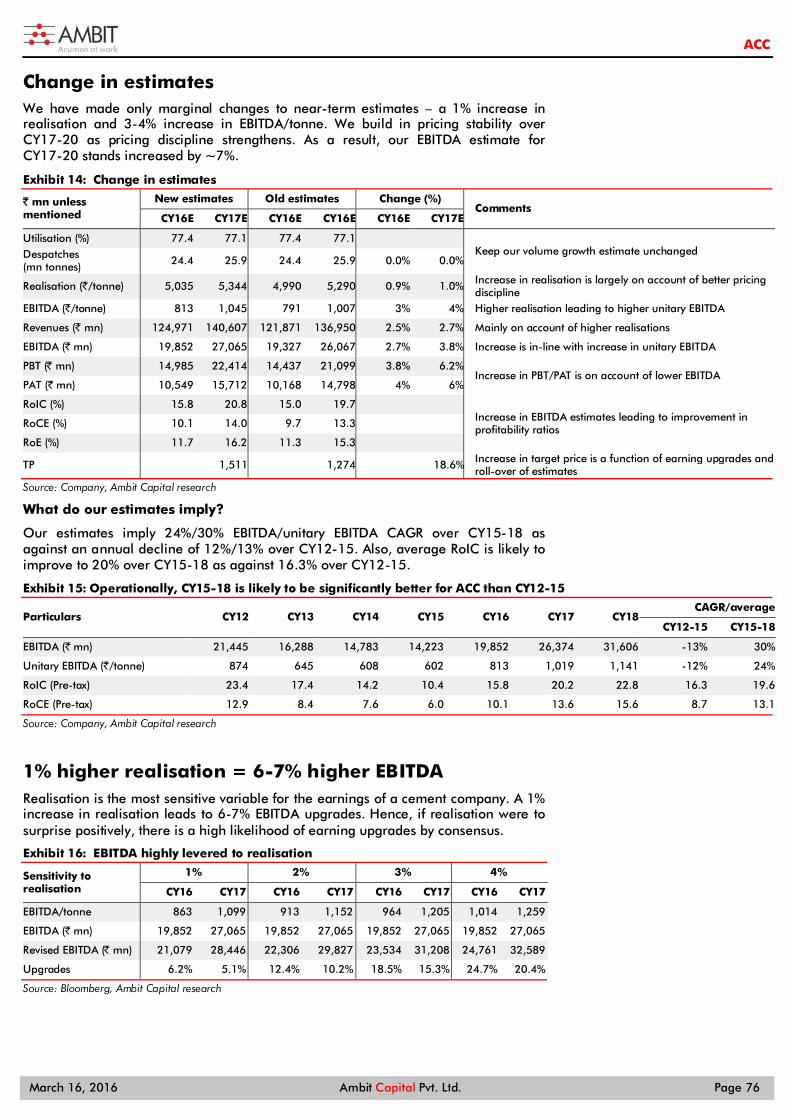
ACC
March 16, 2016 Ambit Capital Pvt. Ltd. Page 76
Change in estimates We have made only marginal changes to near-term estimates – a 1% increase in realisation and 3-4% increase in EBITDA/tonne. We build in pricing stability over CY17-20 as pricing discipline strengthens. As a result, our EBITDA estimate for CY17-20 stands increased by ~7%.
Exhibit 14: Change in estimates
` mn unless mentioned
New estimates Old estimates Change (%) Comments
CY16E CY17E CY16E CY16E CY16E CY17E
Utilisation (%) 77.4 77.1 77.4 77.1 Keep our volume growth estimate unchanged Despatches (mn tonnes) 24.4 25.9 24.4 25.9 0.0% 0.0%
Realisation (`/tonne) 5,035 5,344 4,990 5,290 0.9% 1.0% Increase in realisation is largely on account of better pricing discipline
EBITDA (`/tonne) 813 1,045 791 1,007 3% 4% Higher realisation leading to higher unitary EBITDA
Revenues (` mn) 124,971 140,607 121,871 136,950 2.5% 2.7% Mainly on account of higher realisations
EBITDA (` mn) 19,852 27,065 19,327 26,067 2.7% 3.8% Increase is in-line with increase in unitary EBITDA
PBT (̀ mn) 14,985 22,414 14,437 21,099 3.8% 6.2% Increase in PBT/PAT is on account of lower EBITDA
PAT (` mn) 10,549 15,712 10,168 14,798 4% 6%
RoIC (%) 15.8 20.8 15.0 19.7 Increase in EBITDA estimates leading to improvement in profitability ratios RoCE (%) 10.1 14.0 9.7 13.3
RoE (%) 11.7 16.2 11.3 15.3
TP 1,511 1,274 18.6% Increase in target price is a function of earning upgrades and roll-over of estimates
Source: Company, Ambit Capital research
What do our estimates imply?
Our estimates imply 24%/30% EBITDA/unitary EBITDA CAGR over CY15-18 as against an annual decline of 12%/13% over CY12-15. Also, average RoIC is likely to improve to 20% over CY15-18 as against 16.3% over CY12-15.
Exhibit 15: Operationally, CY15-18 is likely to be significantly better for ACC than CY12-15
Particulars CY12 CY13 CY14 CY15 CY16 CY17 CY18 CAGR/average
CY12-15 CY15-18
EBITDA (` mn) 21,445 16,288 14,783 14,223 19,852 26,374 31,606 -13% 30%
Unitary EBITDA (`/tonne) 874 645 608 602 813 1,019 1,141 -12% 24%
RoIC (Pre-tax) 23.4 17.4 14.2 10.4 15.8 20.2 22.8 16.3 19.6
RoCE (Pre-tax) 12.9 8.4 7.6 6.0 10.1 13.6 15.6 8.7 13.1
Source: Company, Ambit Capital research
1% higher realisation = 6-7% higher EBITDA Realisation is the most sensitive variable for the earnings of a cement company. A 1% increase in realisation leads to 6-7% EBITDA upgrades. Hence, if realisation were to surprise positively, there is a high likelihood of earning upgrades by consensus.
Exhibit 16: EBITDA highly levered to realisation
Sensitivity to realisation
1% 2% 3% 4%
CY16 CY17 CY16 CY17 CY16 CY17 CY16 CY17
EBITDA/tonne 863 1,099 913 1,152 964 1,205 1,014 1,259
EBITDA (` mn) 19,852 27,065 19,852 27,065 19,852 27,065 19,852 27,065
Revised EBITDA (̀ mn) 21,079 28,446 22,306 29,827 23,534 31,208 24,761 32,589
Upgrades 6.2% 5.1% 12.4% 10.2% 18.5% 15.3% 24.7% 20.4%
Source: Bloomberg, Ambit Capital research
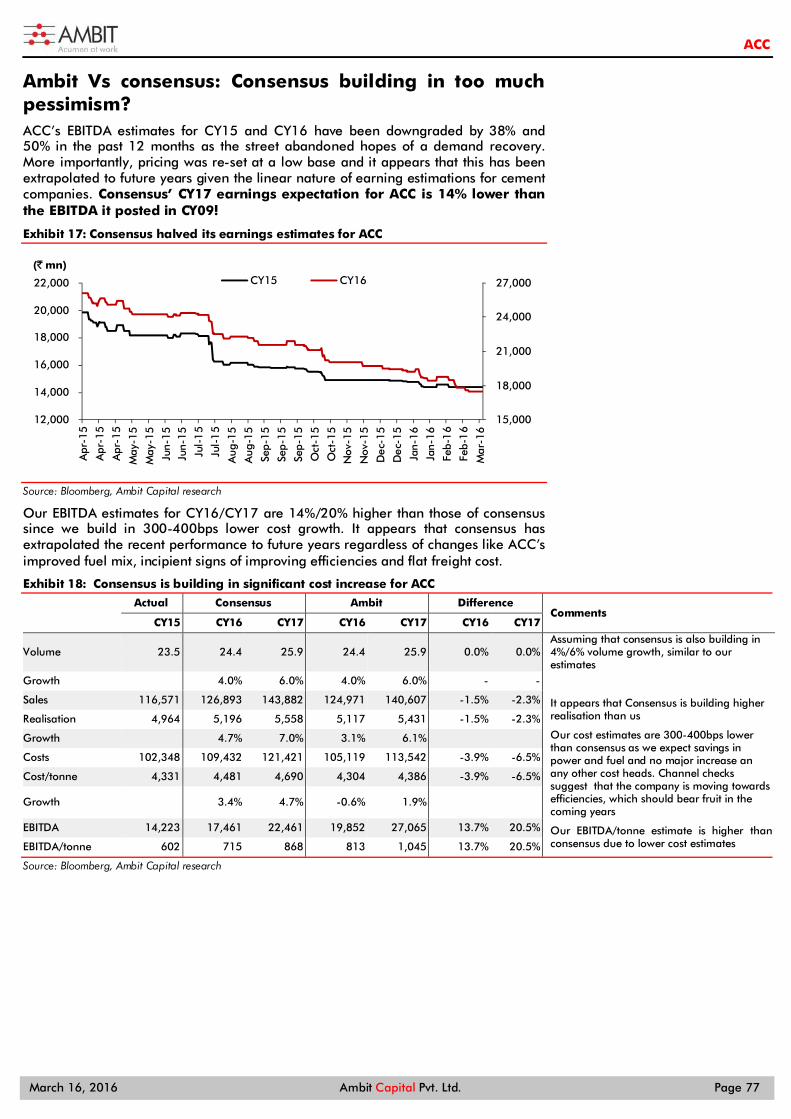
ACC
March 16, 2016 Ambit Capital Pvt. Ltd. Page 77
Ambit Vs consensus: Consensus building in too much pessimism? ACC’s EBITDA estimates for CY15 and CY16 have been downgraded by 38% and 50% in the past 12 months as the street abandoned hopes of a demand recovery. More importantly, pricing was re-set at a low base and it appears that this has been extrapolated to future years given the linear nature of earning estimations for cement companies. Consensus’ CY17 earnings expectation for ACC is 14% lower than the EBITDA it posted in CY09!
Exhibit 17: Consensus halved its earnings estimates for ACC
Source: Bloomberg, Ambit Capital research
Our EBITDA estimates for CY16/CY17 are 14%/20% higher than those of consensus since we build in 300-400bps lower cost growth. It appears that consensus has extrapolated the recent performance to future years regardless of changes like ACC’s improved fuel mix, incipient signs of improving efficiencies and flat freight cost.
Exhibit 18: Consensus is building in significant cost increase for ACC
Actual Consensus Ambit Difference Comments
CY15 CY16 CY17 CY16 CY17 CY16 CY17
Volume 23.5 24.4 25.9 24.4 25.9 0.0% 0.0% Assuming that consensus is also building in 4%/6% volume growth, similar to our estimates
Growth 4.0% 6.0% 4.0% 6.0% - - Sales 116,571 126,893 143,882 124,971 140,607 -1.5% -2.3% It appears that Consensus is building higher
realisation than us Realisation 4,964 5,196 5,558 5,117 5,431 -1.5% -2.3%
Growth 4.7% 7.0% 3.1% 6.1% Our cost estimates are 300-400bps lower than consensus as we expect savings in power and fuel and no major increase an any other cost heads. Channel checks suggest that the company is moving towards efficiencies, which should bear fruit in the coming years
Costs 102,348 109,432 121,421 105,119 113,542 -3.9% -6.5%
Cost/tonne 4,331 4,481 4,690 4,304 4,386 -3.9% -6.5%
Growth 3.4% 4.7% -0.6% 1.9%
EBITDA 14,223 17,461 22,461 19,852 27,065 13.7% 20.5% Our EBITDA/tonne estimate is higher than consensus due to lower cost estimates EBITDA/tonne 602 715 868 813 1,045 13.7% 20.5%
Source: Bloomberg, Ambit Capital research
15,000
18,000
21,000
24,000
27,000
12,000
14,000
16,000
18,000
20,000
22,000
Apr
-15
Apr
-15
Apr
-15
May
-15
May
-15
Jun-
15Ju
n-15
Jul-
15
Jul-
15
Aug
-15
Aug
-15
Sep-
15
Sep-
15
Sep-
15
Oct
-15
Oct
-15
Nov
-15
Nov
-15
Dec
-15
Dec
-15
Jan-
16
Jan-
16
Feb-
16
Feb-
16
Mar
-16
(` mn)CY15 CY16
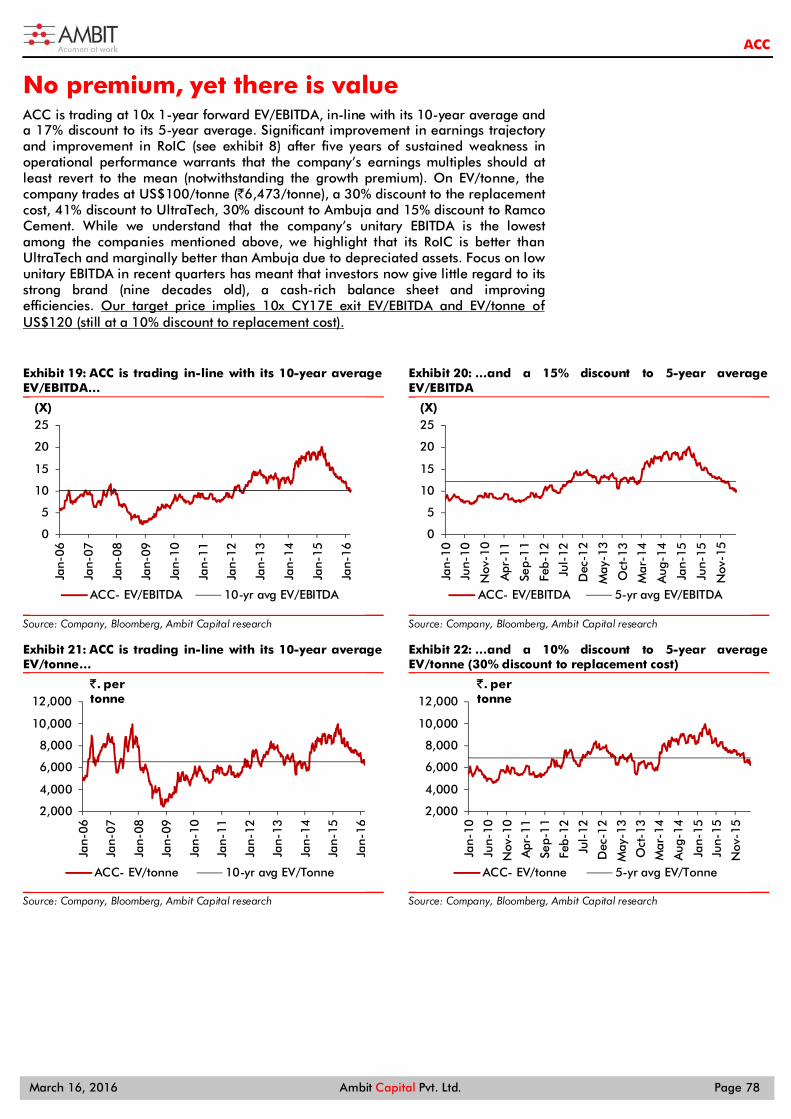
ACC
March 16, 2016 Ambit Capital Pvt. Ltd. Page 78
No premium, yet there is value ACC is trading at 10x 1-year forward EV/EBITDA, in-line with its 10-year average and a 17% discount to its 5-year average. Significant improvement in earnings trajectory and improvement in RoIC (see exhibit 8) after five years of sustained weakness in operational performance warrants that the company’s earnings multiples should at least revert to the mean (notwithstanding the growth premium). On EV/tonne, the company trades at US$100/tonne (`6,473/tonne), a 30% discount to the replacement cost, 41% discount to UltraTech, 30% discount to Ambuja and 15% discount to Ramco Cement. While we understand that the company’s unitary EBITDA is the lowest among the companies mentioned above, we highlight that its RoIC is better than UltraTech and marginally better than Ambuja due to depreciated assets. Focus on low unitary EBITDA in recent quarters has meant that investors now give little regard to its strong brand (nine decades old), a cash-rich balance sheet and improving efficiencies. Our target price implies 10x CY17E exit EV/EBITDA and EV/tonne of US$120 (still at a 10% discount to replacement cost).
Exhibit 19: ACC is trading in-line with its 10-year average EV/EBITDA…
Source: Company, Bloomberg, Ambit Capital research
Exhibit 20: …and a 15% discount to 5-year average EV/EBITDA
Source: Company, Bloomberg, Ambit Capital research
Exhibit 21: ACC is trading in-line with its 10-year average EV/tonne…
Source: Company, Bloomberg, Ambit Capital research
Exhibit 22: …and a 10% discount to 5-year average EV/tonne (30% discount to replacement cost)
Source: Company, Bloomberg, Ambit Capital research
0
5
10
15
20
25
Jan-
06
Jan-
07
Jan-
08
Jan-
09
Jan-
10
Jan-
11
Jan-
12
Jan-
13
Jan-
14
Jan-
15
Jan-
16
(X)
ACC- EV/EBITDA 10-yr avg EV/EBITDA
0
5
10
15
20
25
Jan-
10
Jun-
10
Nov
-10
Apr
-11
Sep-
11
Feb-
12
Jul-
12
Dec
-12
May
-13
Oct
-13
Mar
-14
Aug
-14
Jan-
15
Jun-
15
Nov
-15
(X)
ACC- EV/EBITDA 5-yr avg EV/EBITDA
2,000
4,000
6,000
8,000
10,000
12,000
Jan-
06
Jan-
07
Jan-
08
Jan-
09
Jan-
10
Jan-
11
Jan-
12
Jan-
13
Jan-
14
Jan-
15
Jan-
16
`. per tonne
ACC- EV/tonne 10-yr avg EV/Tonne
2,000
4,000
6,000
8,000
10,000
12,000
Jan-
10
Jun-
10
Nov
-10
Apr
-11
Sep-
11
Feb-
12
Jul-
12
Dec
-12
May
-13
Oct
-13
Mar
-14
Aug
-14
Jan-
15
Jun-
15
Nov
-15
`. per tonne
ACC- EV/tonne 5-yr avg EV/Tonne
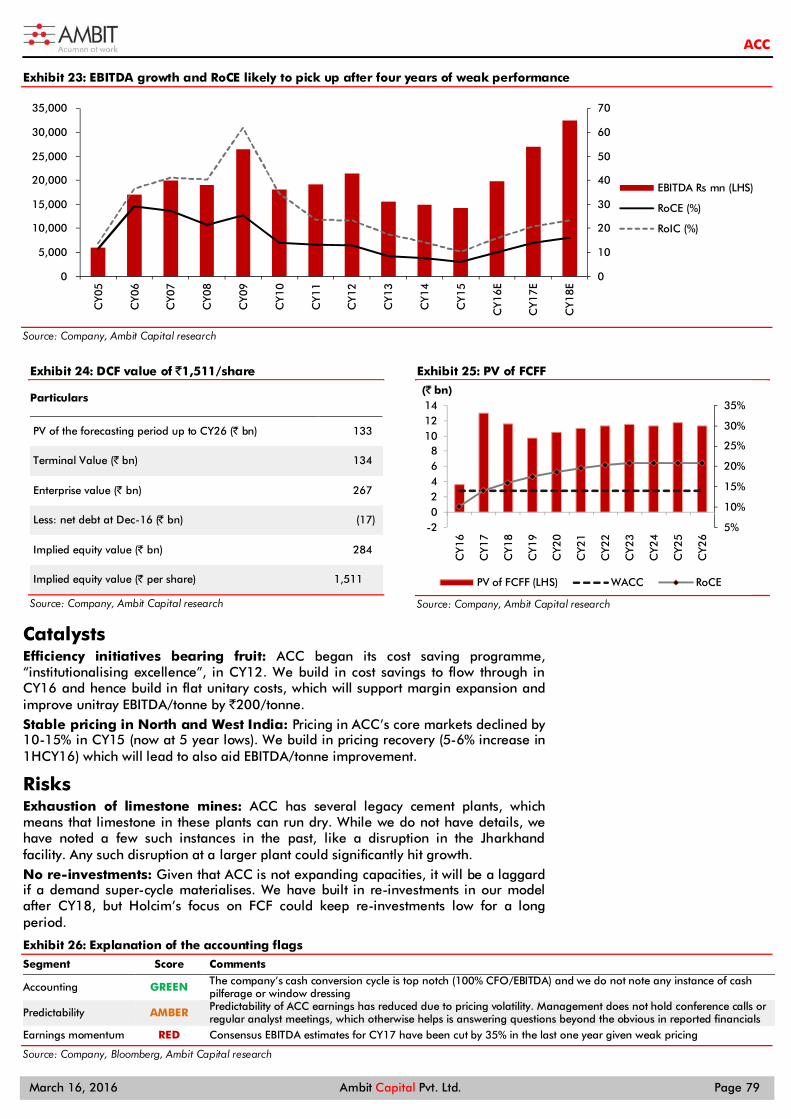
ACC
March 16, 2016 Ambit Capital Pvt. Ltd. Page 79
Exhibit 23: EBITDA growth and RoCE likely to pick up after four years of weak performance
Source: Company, Ambit Capital research
Exhibit 24: DCF value of ̀ 1,511/share
Particulars
PV of the forecasting period up to CY26 (` bn) 133
Terminal Value (` bn) 134
Enterprise value (` bn) 267
Less: net debt at Dec-16 (̀ bn) (17)
Implied equity value (` bn) 284
Implied equity value (` per share) 1,511
Source: Company, Ambit Capital research
Exhibit 25: PV of FCFF
Source: Company, Ambit Capital research
Catalysts Efficiency initiatives bearing fruit: ACC began its cost saving programme, “institutionalising excellence”, in CY12. We build in cost savings to flow through in CY16 and hence build in flat unitary costs, which will support margin expansion and improve unitray EBITDA/tonne by `200/tonne. Stable pricing in North and West India: Pricing in ACC’s core markets declined by 10-15% in CY15 (now at 5 year lows). We build in pricing recovery (5-6% increase in 1HCY16) which will lead to also aid EBITDA/tonne improvement.
Risks Exhaustion of limestone mines: ACC has several legacy cement plants, which means that limestone in these plants can run dry. While we do not have details, we have noted a few such instances in the past, like a disruption in the Jharkhand facility. Any such disruption at a larger plant could significantly hit growth. No re-investments: Given that ACC is not expanding capacities, it will be a laggard if a demand super-cycle materialises. We have built in re-investments in our model after CY18, but Holcim’s focus on FCF could keep re-investments low for a long period.
Exhibit 26: Explanation of the accounting flags
Segment Score Comments
Accounting GREEN The company’s cash conversion cycle is top notch (100% CFO/EBITDA) and we do not note any instance of cash pilferage or window dressing
Predictability AMBER Predictability of ACC earnings has reduced due to pricing volatility. Management does not hold conference calls or regular analyst meetings, which otherwise helps is answering questions beyond the obvious in reported financials
Earnings momentum RED Consensus EBITDA estimates for CY17 have been cut by 35% in the last one year given weak pricing
Source: Company, Bloomberg, Ambit Capital research
0
10
20
30
40
50
60
70
0
5,000
10,000
15,000
20,000
25,000
30,000
35,000C
Y05
CY0
6
CY0
7
CY0
8
CY0
9
CY1
0
CY1
1
CY1
2
CY1
3
CY1
4
CY1
5
CY1
6E
CY1
7E
CY1
8E
EBITDA Rs mn (LHS)
RoCE (%)
RoIC (%)
5%
10%
15%
20%
25%
30%
35%
-202468
101214
CY1
6
CY1
7
CY1
8
CY1
9
CY2
0
CY2
1
CY2
2
CY2
3
CY2
4
CY2
5
CY2
6
(` bn)
PV of FCFF (LHS) WACC RoCE
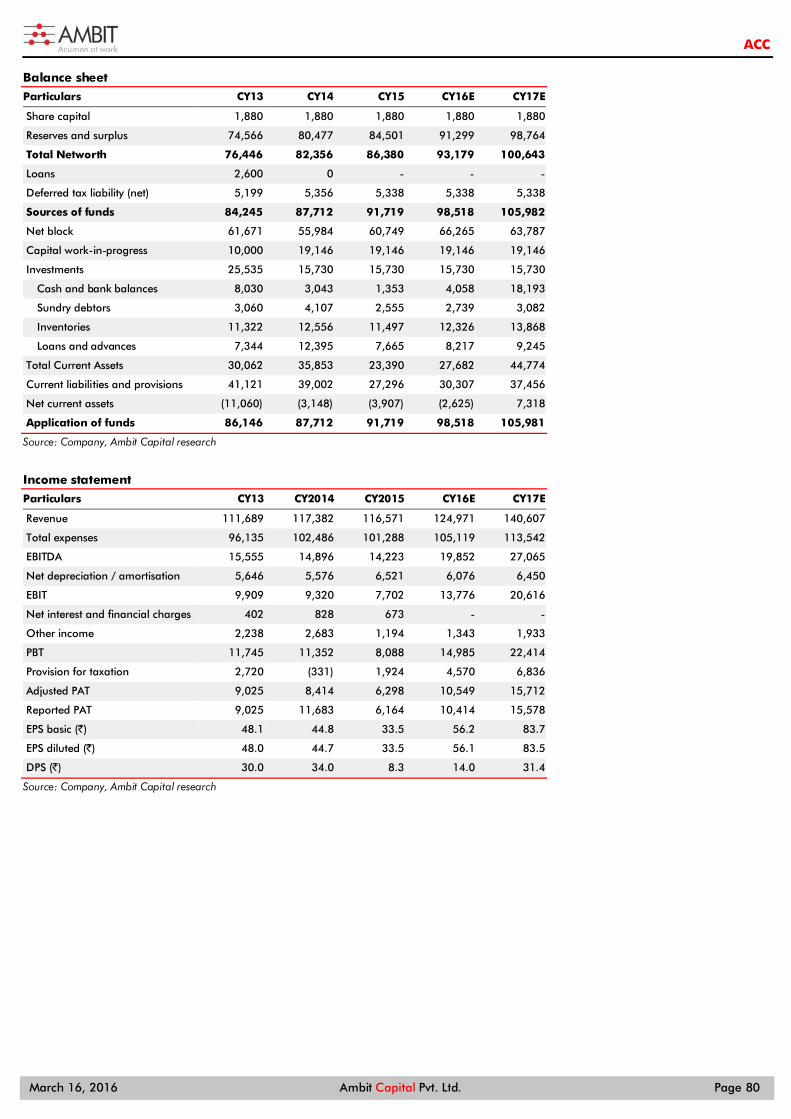
ACC
March 16, 2016 Ambit Capital Pvt. Ltd. Page 80
Balance sheet
Particulars CY13 CY14 CY15 CY16E CY17E
Share capital 1,880 1,880 1,880 1,880 1,880
Reserves and surplus 74,566 80,477 84,501 91,299 98,764
Total Networth 76,446 82,356 86,380 93,179 100,643
Loans 2,600 0 - - -
Deferred tax liability (net) 5,199 5,356 5,338 5,338 5,338
Sources of funds 84,245 87,712 91,719 98,518 105,982
Net block 61,671 55,984 60,749 66,265 63,787
Capital work-in-progress 10,000 19,146 19,146 19,146 19,146
Investments 25,535 15,730 15,730 15,730 15,730
Cash and bank balances 8,030 3,043 1,353 4,058 18,193
Sundry debtors 3,060 4,107 2,555 2,739 3,082
Inventories 11,322 12,556 11,497 12,326 13,868
Loans and advances 7,344 12,395 7,665 8,217 9,245
Total Current Assets 30,062 35,853 23,390 27,682 44,774
Current liabilities and provisions 41,121 39,002 27,296 30,307 37,456
Net current assets (11,060) (3,148) (3,907) (2,625) 7,318
Application of funds 86,146 87,712 91,719 98,518 105,981
Source: Company, Ambit Capital research
Income statement
Particulars CY13 CY2014 CY2015 CY16E CY17E
Revenue 111,689 117,382 116,571 124,971 140,607
Total expenses 96,135 102,486 101,288 105,119 113,542
EBITDA 15,555 14,896 14,223 19,852 27,065
Net depreciation / amortisation 5,646 5,576 6,521 6,076 6,450
EBIT 9,909 9,320 7,702 13,776 20,616
Net interest and financial charges 402 828 673 - -
Other income 2,238 2,683 1,194 1,343 1,933
PBT 11,745 11,352 8,088 14,985 22,414
Provision for taxation 2,720 (331) 1,924 4,570 6,836
Adjusted PAT 9,025 8,414 6,298 10,549 15,712
Reported PAT 9,025 11,683 6,164 10,414 15,578
EPS basic (`) 48.1 44.8 33.5 56.2 83.7
EPS diluted (`) 48.0 44.7 33.5 56.1 83.5
DPS (`) 30.0 34.0 8.3 14.0 31.4
Source: Company, Ambit Capital research
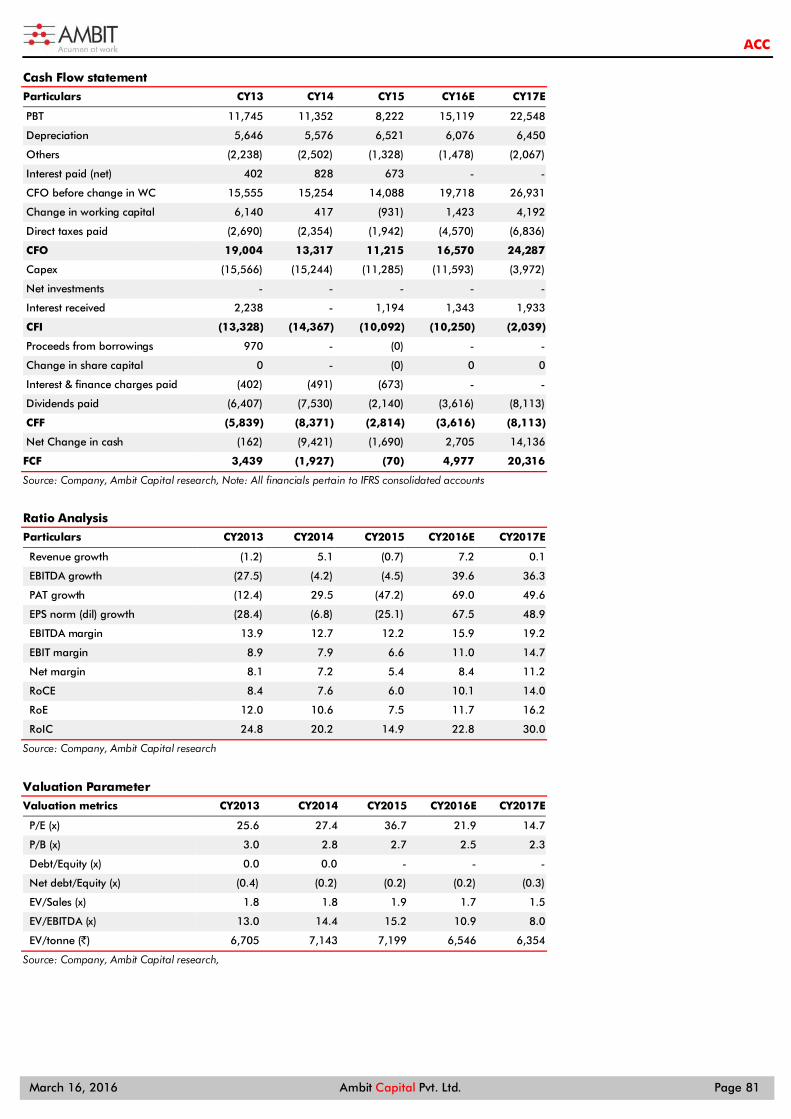
ACC
March 16, 2016 Ambit Capital Pvt. Ltd. Page 81
Cash Flow statement
Particulars CY13 CY14 CY15 CY16E CY17E
PBT 11,745 11,352 8,222 15,119 22,548
Depreciation 5,646 5,576 6,521 6,076 6,450
Others (2,238) (2,502) (1,328) (1,478) (2,067)
Interest paid (net) 402 828 673 - -
CFO before change in WC 15,555 15,254 14,088 19,718 26,931
Change in working capital 6,140 417 (931) 1,423 4,192
Direct taxes paid (2,690) (2,354) (1,942) (4,570) (6,836)
CFO 19,004 13,317 11,215 16,570 24,287
Capex (15,566) (15,244) (11,285) (11,593) (3,972)
Net investments - - - - -
Interest received 2,238 - 1,194 1,343 1,933
CFI (13,328) (14,367) (10,092) (10,250) (2,039)
Proceeds from borrowings 970 - (0) - -
Change in share capital 0 - (0) 0 0
Interest & finance charges paid (402) (491) (673) - -
Dividends paid (6,407) (7,530) (2,140) (3,616) (8,113)
CFF (5,839) (8,371) (2,814) (3,616) (8,113)
Net Change in cash (162) (9,421) (1,690) 2,705 14,136
FCF 3,439 (1,927) (70) 4,977 20,316
Source: Company, Ambit Capital research, Note: All financials pertain to IFRS consolidated accounts
Ratio Analysis
Particulars CY2013 CY2014 CY2015 CY2016E CY2017E
Revenue growth (1.2) 5.1 (0.7) 7.2 0.1
EBITDA growth (27.5) (4.2) (4.5) 39.6 36.3
PAT growth (12.4) 29.5 (47.2) 69.0 49.6
EPS norm (dil) growth (28.4) (6.8) (25.1) 67.5 48.9
EBITDA margin 13.9 12.7 12.2 15.9 19.2
EBIT margin 8.9 7.9 6.6 11.0 14.7
Net margin 8.1 7.2 5.4 8.4 11.2
RoCE 8.4 7.6 6.0 10.1 14.0
RoE 12.0 10.6 7.5 11.7 16.2
RoIC 24.8 20.2 14.9 22.8 30.0
Source: Company, Ambit Capital research
Valuation Parameter
Valuation metrics CY2013 CY2014 CY2015 CY2016E CY2017E
P/E (x) 25.6 27.4 36.7 21.9 14.7
P/B (x) 3.0 2.8 2.7 2.5 2.3
Debt/Equity (x) 0.0 0.0 - - -
Net debt/Equity (x) (0.4) (0.2) (0.2) (0.2) (0.3)
EV/Sales (x) 1.8 1.8 1.9 1.7 1.5
EV/EBITDA (x) 13.0 14.4 15.2 10.9 8.0
EV/tonne (`) 6,705 7,143 7,199 6,546 6,354
Source: Company, Ambit Capital research,
ACC
March 16, 2016 Ambit Capital Pvt. Ltd. Page 82
Institutional Equities Team Saurabh Mukherjea, CFA CEO, Institutional Equities (022) 30433174 [email protected]
Research
Analysts Industry Sectors Desk-Phone E-mail
Nitin Bhasin - Head of Research E&C / Infra / Cement / Industrials (022) 30433241 [email protected]
Aadesh Mehta, CFA Banking / Financial Services (022) 30433239 [email protected]
Aakash Adukia Oil & Gas / Chemicals / Agri Inputs (022) 30433273 [email protected]
Abhishek Ranganathan, CFA Retail / Mid-caps (022) 30433085 [email protected]
Achint Bhagat, CFA Cement / Roads / Home Building (022) 30433178 [email protected]
Ashvin Shetty, CFA Automobile (022) 30433285 [email protected]
Bhargav Buddhadev Power Utilities / Capital Goods (022) 30433252 [email protected]
Deepesh Agarwal, CFA Power Utilities / Capital Goods (022) 30433275 [email protected] Dhiraj Mistry, CFA Consumer (022) 30433264 [email protected]
Gaurav Khandelwal, CFA Automobile (022) 30433132 [email protected] Girisha Saraf Mid-caps / Small-caps (022) 30433211 [email protected]
Karan Khanna, CFA Strategy (022) 30433251 [email protected]
Kushank Poddar Technology (022) 30433203 [email protected] Pankaj Agarwal, CFA Banking / Financial Services (022) 30433206 [email protected]
Paresh Dave, CFA Healthcare (022) 30433212 [email protected]
Parita Ashar, CFA Metals & Mining (022) 30433223 [email protected]
Prashant Mittal, CFA Derivatives (022) 30433218 [email protected]
Rahil Shah Banking / Financial Services (022) 30433217 [email protected]
Rakshit Ranjan, CFA Consumer (022) 30433201 [email protected]
Ravi Singh Banking / Financial Services (022) 30433181 [email protected]
Ritesh Gupta, CFA Oil & Gas / Chemicals / Agri Inputs (022) 30433242 [email protected]
Ritesh Vaidya, CFA Consumer (022) 30433246 [email protected] Ritika Mankar Mukherjee, CFA Economy / Strategy (022) 30433175 [email protected]
Ritu Modi Automobile (022) 30433292 [email protected]
Sagar Rastogi Technology (022) 30433291 [email protected]
Sumit Shekhar Economy / Strategy (022) 30433229 [email protected]
Utsav Mehta, CFA E&C / Industrials (022) 30433209 [email protected]
Vivekanand Subbaraman, CFA Media (022) 30433261 [email protected]
Sales
Name Regions Desk-Phone E-mail
Sarojini Ramachandran - Head of Sales UK +44 (0) 20 7614 8374 [email protected]
Dharmen Shah India / Asia (022) 30433289 [email protected]
Dipti Mehta India / USA (022) 30433053 [email protected]
Hitakshi Mehra India (022) 30433204 [email protected]
Krishnan V India / Asia (022) 30433295 [email protected]
Nityam Shah, CFA USA / Europe (022) 30433259 [email protected]
Parees Purohit, CFA UK / USA (022) 30433169 [email protected]
Praveena Pattabiraman India / Asia (022) 30433268 [email protected]
Shaleen Silori India (022) 30433256 [email protected]
Singapore
Pramod Gubbi, CFA – Director Singapore +65 8606 6476 [email protected]
Shashank Abhisheik Singapore +65 6536 1935 [email protected]
USA / Canada
Ravilochan Pola - CEO Americas +1(646) 361 3107 [email protected]
Production
Sajid Merchant Production (022) 30433247 [email protected]
Sharoz G Hussain Production (022) 30433183 [email protected]
Nikhil Pillai Database (022) 30433265 [email protected]
E&C = Engineering & Construction
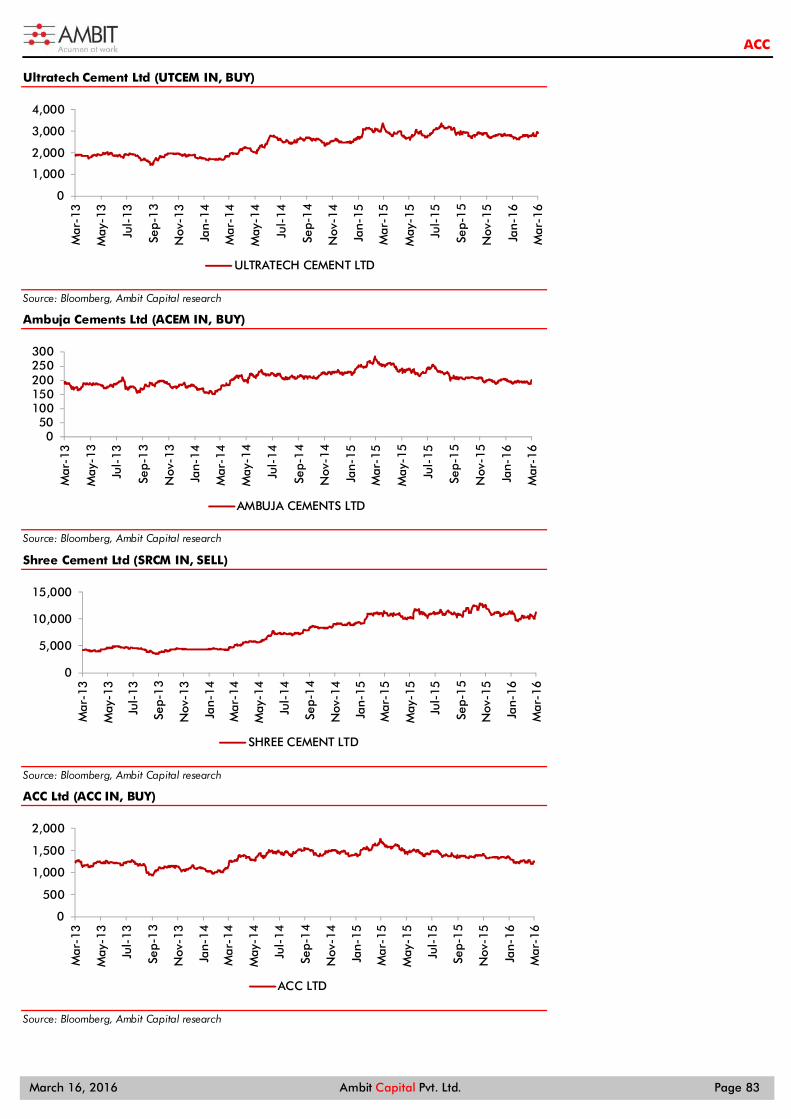
ACC
March 16, 2016 Ambit Capital Pvt. Ltd. Page 83
Ultratech Cement Ltd (UTCEM IN, BUY)
Source: Bloomberg, Ambit Capital research
Ambuja Cements Ltd (ACEM IN, BUY)
Source: Bloomberg, Ambit Capital research
Shree Cement Ltd (SRCM IN, SELL)
Source: Bloomberg, Ambit Capital research
ACC Ltd (ACC IN, BUY)
Source: Bloomberg, Ambit Capital research
0
1,000
2,000
3,000
4,000
Mar
-13
May
-13
Jul-
13
Sep-
13
Nov
-13
Jan-
14
Mar
-14
May
-14
Jul-
14
Sep-
14
Nov
-14
Jan-
15
Mar
-15
May
-15
Jul-
15
Sep-
15
Nov
-15
Jan-
16
Mar
-16
ULTRATECH CEMENT LTD
050
100150200250300
Mar
-13
May
-13
Jul-
13
Sep-
13
Nov
-13
Jan-
14
Mar
-14
May
-14
Jul-
14
Sep-
14
Nov
-14
Jan-
15
Mar
-15
May
-15
Jul-
15
Sep-
15
Nov
-15
Jan-
16
Mar
-16
AMBUJA CEMENTS LTD
0
5,000
10,000
15,000
Mar
-13
May
-13
Jul-
13
Sep-
13
Nov
-13
Jan-
14
Mar
-14
May
-14
Jul-
14
Sep-
14
Nov
-14
Jan-
15
Mar
-15
May
-15
Jul-
15
Sep-
15
Nov
-15
Jan-
16
Mar
-16
SHREE CEMENT LTD
0
500
1,000
1,500
2,000
Mar
-13
May
-13
Jul-
13
Sep-
13
Nov
-13
Jan-
14
Mar
-14
May
-14
Jul-
14
Sep-
14
Nov
-14
Jan-
15
Mar
-15
May
-15
Jul-
15
Sep-
15
Nov
-15
Jan-
16
Mar
-16
ACC LTD
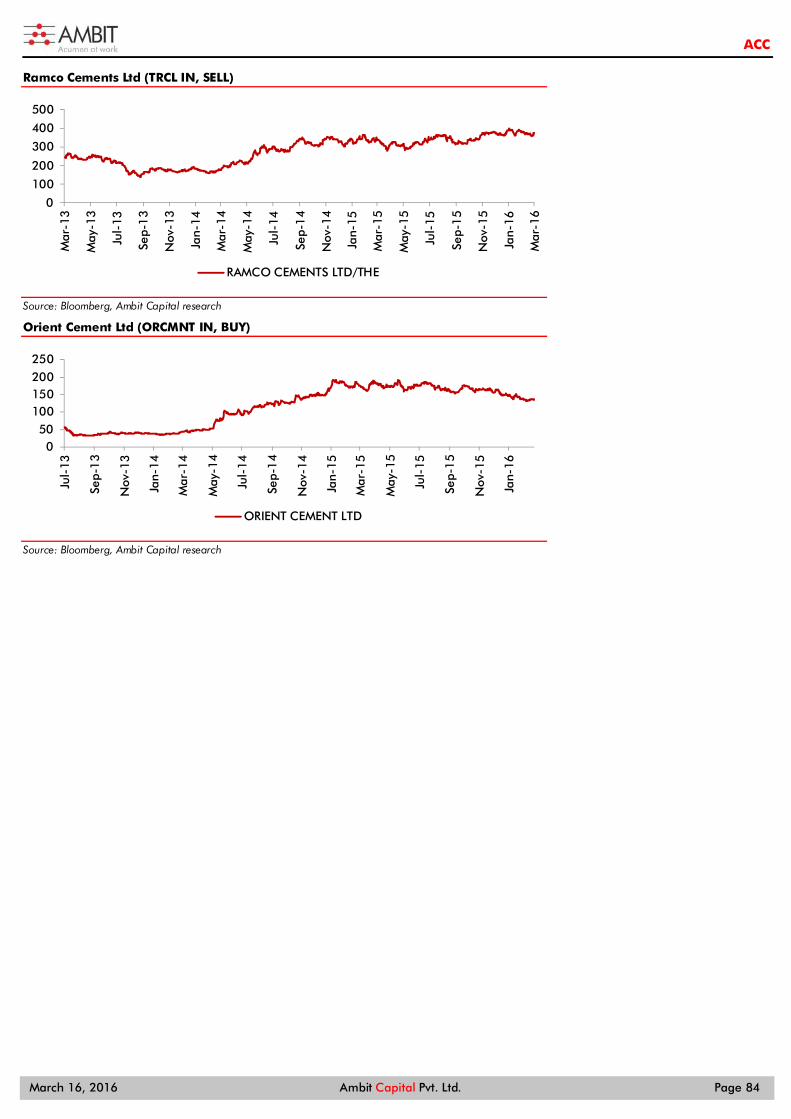
ACC
March 16, 2016 Ambit Capital Pvt. Ltd. Page 84
Ramco Cements Ltd (TRCL IN, SELL)
Source: Bloomberg, Ambit Capital research
Orient Cement Ltd (ORCMNT IN, BUY)
Source: Bloomberg, Ambit Capital research
0
100
200
300
400
500
Mar
-13
May
-13
Jul-
13
Sep-
13
Nov
-13
Jan-
14
Mar
-14
May
-14
Jul-
14
Sep-
14
Nov
-14
Jan-
15
Mar
-15
May
-15
Jul-
15
Sep-
15
Nov
-15
Jan-
16
Mar
-16
RAMCO CEMENTS LTD/THE
050
100150200250
Jul-
13
Sep-
13
Nov
-13
Jan-
14
Mar
-14
May
-14
Jul-
14
Sep-
14
Nov
-14
Jan-
15
Mar
-15
May
-15
Jul-
15
Sep-
15
Nov
-15
Jan-
16ORIENT CEMENT LTD
ACC
March 16, 2016 Ambit Capital Pvt. Ltd. Page 85
Explanation of Investment Rating
Investment Rating Expected return (over 12-month)
BUY >10%
SELL <10%
NO STANCE We have forward looking estimates for the stock but we refrain from assigning valuation and recommendation
UNDER REVIEW We will revisit our recommendation, valuation and estimates on the stock following recent events
NOT RATED We do not have any forward looking estimates, valuation or recommendation for the stock Disclaimer
This report or any portion hereof may not be reprinted, sold or redistributed without the written consent of Ambit Capital . AMBIT Capital Research is disseminated and available primarily electronically, and, in some cases,
in printed form.
Additional information on recommended securities is available on request.
Disclaimer
1. AMBIT Capital Private Limited (“AMBIT Capital”) and its affiliates are a full service, integrated investment banking, investment advisory and brokerage group. AMBIT Capital is a Stock Broker, Portfolio Manager and Depository Participant regis tered with Securities and Exchange Board of India Limited (SEBI) and is regulated by SEBI
2. AMBIT Capital makes bes t endeavours to ensure that the research analyst(s ) use current, reliable, comprehensive information and obtain such information from sources which the analyst(s) believes to be reliable. However, such information has not been independently veri fied by AMBIT Capital and/or the analys t(s ) and no representation or warranty, express or implied, is made as to the accuracy or completeness of any information obtained from third parties . The information, opinions, views expressed in this Research Report are those of the research analys t as at the date of this Research Report which are subject to change and do not represent to be an authority on the subject. AMBIT Capital may or may not subscribe to any and/ or all the views expressed herein.
3. This Research Report should be read and relied upon at the sole discretion and risk of the recipient. If you are dissatisfied with the contents of this complimentary Research Report or with the terms of this Disclaimer, your sole and exclusive remedy is to stop using this Research Report and AMBIT Capital or its affiliates shall not be responsible and/ or liable for any direct/consequential loss howsoever directly or indirectly, from any use of this Research Report.
4. If this Research Report is received by any client of AMBIT Capital or i ts affiliate, the relationship of AMBIT Capital/i ts affiliate with such client will continue to be governed by the terms and conditions in place between AMBIT Capital/ such affiliate and the client.
5. This Research Report is issued for information only and the 'Buy', 'Sell' , or ‘Other Recommendation’ made in this Research Report such should not be cons trued as an inves tment advice to any recipient to acquire, subscribe, purchase, sell , dispose of, retain any securities and should not be intended or treated as a substi tute for necessary review or validation or any professional advice. Recipients should consider this Research Report as only a single factor in making any investment decisions . This Research Report is not an offer to sell or the solici tation of an offer to purchase or subscribe for any investment or as an official endorsement of any investment.
6. This Research Report is being supplied to you solely for your information and may not be reproduced, redis tributed or passed on, directly or indirectly, to any other person or published, copied in whole or in part, for any purpose. Neither this Research Report nor any copy of i t may be taken or transmitted or distributed, directly or indirectly within India or into any other country including United States (to US Persons), Canada or Japan or to any resident thereof. The distribution of this Research Report in other jurisdictions may be strictly res tricted and/ or prohibited by law or contract, and persons into whose possession this Research Report comes should inform themselves about such restriction and/ or prohibition, and observe any such restrictions and/ or prohibition.
7. Ambit Capital Private Limited is regis tered as a Research Enti ty under the SEBI (Research Analysts ) Regulations, 2014. SEBI Reg.No.- INH000000313. Conflict of Interests
8. In the normal course of AMBIT Capital ’s business circumstances may arise that could result in the interests of AMBIT Capital conflicting with the interests of clients or one client’s interes ts conflicting with the interest of another client. AMBIT Capital makes bes t efforts to ensure that conflicts are identi fied and managed and that clients ’ interes ts are protected. AMBIT Capital has policies and procedures in place to control the flow and use of non-public, price sensitive information and employees’ personal account trading. Where appropriate and reasonably achievable, AMBIT Capital segregates the activities of staff working in areas where conflicts of interest may arise. However, clients/potential clients of AMBIT Capital should be aware of these possible conflicts of interests and should make informed decisions in relation to AMBIT Capital’s services .
9. AMBIT Capital and/or its affiliates may from time to time have or solicit inves tment banking, investment advisory and other business relationships with companies covered in this Research Report and may receive compensation for the same.
Additional Disclaimer for U.S. Persons
10. The research report is solely a product of AMBIT Capital
11. AMBIT Capital is the employer of the research analyst(s) who has prepared the research report
12. Any subsequent transactions in securities discussed in the research reports should be effected through Enclave Capital LLC. (“Enclave”).
13. Enclave does not accept or receive any compensation of any kind for the dissemination of the AMBIT Capital research reports .
14. The research analyst(s) preparing the email / Research Report/ attachment is resident outside the United States and is/are not associated persons of any U.S. regulated broker-dealer and that therefore the analyst(s ) is/are not subject to supervision by a U.S. broker-dealer, and is/are not required to satisfy the regulatory licensing requirements of FINRA or required to otherwise comply with U.S. rules or regulations regarding, among other things, communications with a subject company, public appearances and trading securi ties held by a research analyst account.
15. This report is prepared, approved, published and distributed by the Ambit Capital located outside of the United States (a non-US Group Company”). This report is dis tributed in the U.S.by Enclave Capital LLC, a U.S. regis tered broker dealer, on behalf of Ambit Capital only to major U.S. ins titutional investors (as defined in Rule 15a-6 under the U.S. Securi ties Exchange Act of 1934 (the “Exchange Act”)) pursuant to the exemption in Rule 15a-6 and any transaction effected by a U.S. customer in the securi ties described in this report must be effected through Enclave Capital LLC (19 West 44th Street, suite 1700, New York, NY 10036).
16. As of the publication of this report Enclave Capital LLC, does not make a market in the subject securi ties. 17. This document does not cons titute an offer of, or an invi tation by or on behalf of Ambit Capital or its affiliates or any other company to any person, to buy or sell any securi ty. The information contained herein has
been obtained from published information and other sources, which Ambit Capital or i ts Affiliates consider to be reliable. None of Ambit Capital accepts any liability or responsibili ty whatsoever for the accuracy or completeness of any such information. All estimates, expressions of opinion and other subjective judgments contained herein are made as of the date of this document. Emerging securi ties markets may be subject to risks significantly higher than more established markets. In particular, the political and economic environment, company practices and market prices and volumes may be subject to significant variations. The ability to assess such risks may also be limited due to significantly lower information quantity and quality. By accepting this document, you agree to be bound by all the foregoing provisions.
Additional Disclaimer for Canadian Persons
18. AMBIT Capital is not registered in the Province of Ontario and /or Province of Québec to trade in securities and/or to provide advice with respect to securi ties.
19. AMBIT Capital's head office or principal place of business is located in India.
20. All or substantially all of AMBIT Capital's assets may be situated outside of Canada. 21. It may be difficult for enforcing legal rights against AMBIT Capital because of the above.
22. Name and address of AMBIT Capital's agent for service of process in the Province of Ontario is: Torys LLP, 79 Wellington St. W., 30th Floor, Box 270, TD South Tower, Toronto, Ontario M5K 1N2 Canada.
23. Name and address of AMBIT Capital's agent for service of process in the Province of Montréal is Torys Law Firm LLP, 1 Place Ville Marie, Suite 1919 Montréal, Québec H3B 2C3 Canada. Additional Disclaimer for Singapore Persons
24. This Report is prepared and distributed by Ambit Capital Private Limited and dis tributed as per the approved arrangement under Paragraph 9 of Third Schedule of Securities and Futures Act (CAP 289) and Paragraph 11 of the Firs t Schedule to the Financial Advisors Act (CAP 110) provided to Ambit Singapore Pte. Limited by Monetary Authority of Singapore.
25. This Report is only available to persons in Singapore who are insti tutional investors (as defined in section 4A of the Securi ties and Futures Act (Cap. 289) of Singapore (the “SFA”).” Accordingly, if a Singapore Person is not or ceases to be such an ins titutional investor, such Singapore Person must immediately discontinue any use of this Report and inform Ambit Singapore Pte. Limited.
Disclosures 26. The analyst (s ) has/have not served as an officer, director or employee of the subject company. 27. There is no material disciplinary action that has been taken by any regulatory authority impacting equity research analysis activities . 28. All market data included in this report are dated as at the previous s tock market closing day from the date of this report. Analyst Certif ication Each of the analysts identified in this report certi fies , with respect to the companies or securi ties that the individual analyses, that (1) the views expressed in this report reflect his or her personal views about all of the subject companies and securities and (2) no part of his or her compensation was, is or will be directly or indirectly dependent on the specific recommendations or views expressed in this report. © Copyright 2015 AMBIT Capital Private Limited. All rights reserved.
Ambit Capital Pvt. Ltd. Ambit House, 3rd Floor. 449, Senapati Bapat Marg, Lower Parel, Mumbai 400 013, India. Phone: +91-22-3043 3000 | Fax: +91-22-3043 3100 CIN: U74140MH1997PTC107598 www.ambitcapital.com