Embed Size (px)
Citation preview
8/13/2019 CEM PartVI-Chap5p1, Fundamentals of Design
http://slidepdf.com/reader/full/cem-partvi-chap5p1-fundamentals-of-design 1/150
Fundamentals of Design VI-5-i
Chapter 5 EM 1110-2-1100
FUNDAMENTALS OF DESIGN (Part VI)Proposed publishing date: 30 April 2003
Hans F. Burcharth and Steven A. Hughes
Table of Contents
Page
VI-5-1. Introduction . . . . . . . . . . . . . . . . . . . . . . . . . . . . . . . . . . . . . . . . . . . . . . . . . . . . . . . . . . . VI-5-1
a. Overview . . . . . . . . . . . . . . . . . . . . . . . . . . . . . . . . . . . . . . . . . . . . . . . . . . . . . . . . . . . . . VI-5-1
b. Wave/structure interaction . . . . . . . . . . . . . . . . . . . . . . . . . . . . . . . . . . . . . . . . . . . . . . . VI-5-2
(1) Hydraulic response . . . . . . . . . . . . . . . . . . . . . . . . . . . . . . . . . . . . . . . . . . . . . . . . . . VI-5-2
(2) Wave loadings and related structural response . . . . . . . . . . . . . . . . . . . . . . . . . . . . . VI-5-3
VI-5-2. Structure Hydraulic Response . . . . . . . . . . . . . . . . . . . . . . . . . . . . . . . . . . . . . . . . . . VI-5-3
a. Wave runup and rundown on structures . . . . . . . . . . . . . . . . . . . . . . . . . . . . . . . . . . . . . VI-5-3
(1) Introduction . . . . . . . . . . . . . . . . . . . . . . . . . . . . . . . . . . . . . . . . . . . . . . . . . . . . . . . . VI-5-3 (2) Surf similarity parameter . . . . . . . . . . . . . . . . . . . . . . . . . . . . . . . . . . . . . . . . . . . . . . VI-5-5
(3) Wave runup and rundown on impermeable slopes . . . . . . . . . . . . . . . . . . . . . . . . . . VI-5-7
(a) Smooth slope, irregular long-crested head-on waves . . . . . . . . . . . . . . . . . . . . . . VI-5-8
(b) Rock armored slopes, irregular long-crested head-on waves . . . . . . . . . . . . . . . VI-5-15
(4) Wave runup and rundown on permeable slopes . . . . . . . . . . . . . . . . . . . . . . . . . . . VI-5-16
(a) Rock armored slopes, irregular long-crested head-on waves . . . . . . . . . . . . . . . VI-5-18
(b) Statistical distribution of runup . . . . . . . . . . . . . . . . . . . . . . . . . . . . . . . . . . . . . VI-5-18
b. Wave overtopping of structures . . . . . . . . . . . . . . . . . . . . . . . . . . . . . . . . . . . . . . . . . . . VI-5-19
(1) Admissible average overtopping discharge . . . . . . . . . . . . . . . . . . . . . . . . . . . . . . . VI-5-19
(2) Average overtopping discharge formulas . . . . . . . . . . . . . . . . . . . . . . . . . . . . . . . . VI-5-20
(a) Sloping structures . . . . . . . . . . . . . . . . . . . . . . . . . . . . . . . . . . . . . . . . . . . . . . . . VI-5-20
(b) Vertical front structures . . . . . . . . . . . . . . . . . . . . . . . . . . . . . . . . . . . . . . . . . . . VI-5-24 (3) Overtopping volumes of individual waves . . . . . . . . . . . . . . . . . . . . . . . . . . . . . . . VI-5-24
c. Wave reflection . . . . . . . . . . . . . . . . . . . . . . . . . . . . . . . . . . . . . . . . . . . . . . . . . . . . . . . VI-5-33
(1) Introduction . . . . . . . . . . . . . . . . . . . . . . . . . . . . . . . . . . . . . . . . . . . . . . . . . . . . . . . VI-5-33
(2) Reflection from non-overtopped sloping structures . . . . . . . . . . . . . . . . . . . . . . . . VI-5-34
(3) Reflection from vertical walls . . . . . . . . . . . . . . . . . . . . . . . . . . . . . . . . . . . . . . . . . VI-5-34
(4) Kinematics of reflected irregular waves . . . . . . . . . . . . . . . . . . . . . . . . . . . . . . . . . VI-5-36
d. Wave transmission . . . . . . . . . . . . . . . . . . . . . . . . . . . . . . . . . . . . . . . . . . . . . . . . . . . . . VI-5-44
(1) Introduction . . . . . . . . . . . . . . . . . . . . . . . . . . . . . . . . . . . . . . . . . . . . . . . . . . . . . . . VI-5-44
(2) Wave transmission through and over sloping structures . . . . . . . . . . . . . . . . . . . . . VI-5-45
(3) Wave transmission for vertical structures . . . . . . . . . . . . . . . . . . . . . . . . . . . . . . . . VI-5-45
VI-5-3. Rubble-Mound Structure Loading and Response . . . . . . . . . . . . . . . . . . . . . . . . VI-5-48a. Armor layer stability . . . . . . . . . . . . . . . . . . . . . . . . . . . . . . . . . . . . . . . . . . . . . . . . . . . VI-5-48
(1) Introduction . . . . . . . . . . . . . . . . . . . . . . . . . . . . . . . . . . . . . . . . . . . . . . . . . . . . . . . VI-5-48
(2) Stability parmaeters and structure of stability formulae . . . . . . . . . . . . . . . . . . . . . VI-5-48
(3) Definition of armor layer damage . . . . . . . . . . . . . . . . . . . . . . . . . . . . . . . . . . . . . . VI-5-56
(4) Armor layer damage progression . . . . . . . . . . . . . . . . . . . . . . . . . . . . . . . . . . . . . . VI-5-61
(5) Practical formulae for hydraulic stability of armor layers . . . . . . . . . . . . . . . . . . . VI-5-63
(6) Structure head section stability . . . . . . . . . . . . . . . . . . . . . . . . . . . . . . . . . . . . . . . . VI-5-81
8/13/2019 CEM PartVI-Chap5p1, Fundamentals of Design
http://slidepdf.com/reader/full/cem-partvi-chap5p1-fundamentals-of-design 2/150
8/13/2019 CEM PartVI-Chap5p1, Fundamentals of Design
http://slidepdf.com/reader/full/cem-partvi-chap5p1-fundamentals-of-design 3/150
EM 1110-2-1100 (Part VI)Proposed Publishing Date: 30 Apr 03
Fundamentals of Design VI-5-iii
(2) Waves at concave corners . . . . . . . . . . . . . . . . . . . . . . . . . . . . . . . . . . . . . . . . . . . VI-5-169
(a) Vertical structures with concave corners . . . . . . . . . . . . . . . . . . . . . . . . . . . . . VI-5-169
(b) Sloping structures with concave corners . . . . . . . . . . . . . . . . . . . . . . . . . . . . . VI-5-170
f. Uplift forces . . . . . . . . . . . . . . . . . . . . . . . . . . . . . . . . . . . . . . . . . . . . . . . . . . . . . . . . . VI-5-170
(1) Submerged or partially submerged structure . . . . . . . . . . . . . . . . . . . . . . . . . . . . . VI-5-170
(2) Emergent structures . . . . . . . . . . . . . . . . . . . . . . . . . . . . . . . . . . . . . . . . . . . . . . . . VI-5-172
VI-5-5. Foundation Loads . . . . . . . . . . . . . . . . . . . . . . . . . . . . . . . . . . . . . . . . . . . . . . . . . . . . VI-5-174
a. Introduction . . . . . . . . . . . . . . . . . . . . . . . . . . . . . . . . . . . . . . . . . . . . . . . . . . . . . . . . . VI-5-174
b. Soil and rock properties . . . . . . . . . . . . . . . . . . . . . . . . . . . . . . . . . . . . . . . . . . . . . . . VI-5-175
(1) Grain sizes . . . . . . . . . . . . . . . . . . . . . . . . . . . . . . . . . . . . . . . . . . . . . . . . . . . . . . . VI-5-175
(2) Bulk density . . . . . . . . . . . . . . . . . . . . . . . . . . . . . . . . . . . . . . . . . . . . . . . . . . . . . . VI-5-176
(3) Volume of voids . . . . . . . . . . . . . . . . . . . . . . . . . . . . . . . . . . . . . . . . . . . . . . . . . . VI-5-176
(4) Relative density . . . . . . . . . . . . . . . . . . . . . . . . . . . . . . . . . . . . . . . . . . . . . . . . . . . VI-5-177
(5) Plasticity index . . . . . . . . . . . . . . . . . . . . . . . . . . . . . . . . . . . . . . . . . . . . . . . . . . . VI-5-178
(6) Total and effective stresses . . . . . . . . . . . . . . . . . . . . . . . . . . . . . . . . . . . . . . . . . . VI-5-178
(7) Geostatic stress . . . . . . . . . . . . . . . . . . . . . . . . . . . . . . . . . . . . . . . . . . . . . . . . . . . VI-5-179
(8) Stresses within soil deposits . . . . . . . . . . . . . . . . . . . . . . . . . . . . . . . . . . . . . . . . . VI-5-179
(9) Stresses due to externally applied surface loads . . . . . . . . . . . . . . . . . . . . . . . . . . VI-5-179 (10) Overconsolidation ratio . . . . . . . . . . . . . . . . . . . . . . . . . . . . . . . . . . . . . . . . . . . . VI-5-179
(11) Deformation moduli . . . . . . . . . . . . . . . . . . . . . . . . . . . . . . . . . . . . . . . . . . . . . . . VI-5-179
(12) Damping ratio . . . . . . . . . . . . . . . . . . . . . . . . . . . . . . . . . . . . . . . . . . . . . . . . . . . . VI-5-185
c. Strength parameters . . . . . . . . . . . . . . . . . . . . . . . . . . . . . . . . . . . . . . . . . . . . . . . . . . VI-5-186
(1) Mohr-Coulomb failure criterion . . . . . . . . . . . . . . . . . . . . . . . . . . . . . . . . . . . . . . VI-5-186
(2) Noncohesive soils . . . . . . . . . . . . . . . . . . . . . . . . . . . . . . . . . . . . . . . . . . . . . . . . . VI-5-187
(3) Dilatancy . . . . . . . . . . . . . . . . . . . . . . . . . . . . . . . . . . . . . . . . . . . . . . . . . . . . . . . . VI-5-188
(4) Cohesive soils . . . . . . . . . . . . . . . . . . . . . . . . . . . . . . . . . . . . . . . . . . . . . . . . . . . . VI-5-191
d. Hydraulic gradient and flow forces in soils . . . . . . . . . . . . . . . . . . . . . . . . . . . . . . . . VI-5-192
(1) Hydraulic gradient . . . . . . . . . . . . . . . . . . . . . . . . . . . . . . . . . . . . . . . . . . . . . . . . . VI-5-192
(2) Permeability . . . . . . . . . . . . . . . . . . . . . . . . . . . . . . . . . . . . . . . . . . . . . . . . . . . . . . VI-5-193
(3) Wave-induced internal setup . . . . . . . . . . . . . . . . . . . . . . . . . . . . . . . . . . . . . . . . . VI-5-193 (4) Pore pressure gradients in sloping rubble-mound structures . . . . . . . . . . . . . . . . . VI-5-194
e. Cyclic loading of soils . . . . . . . . . . . . . . . . . . . . . . . . . . . . . . . . . . . . . . . . . . . . . . . . . VI-5-198
(1) Time scale of drainage and consolidation . . . . . . . . . . . . . . . . . . . . . . . . . . . . . . . VI-5-198
(2) Wave load transmission to monolithic structure foundations . . . . . . . . . . . . . . . . VI-5-199
(3) Noncohesive soil exposed to wave-induced cyclic loadings . . . . . . . . . . . . . . . . . VI-5-203
(4) Cohesive soil exposed to wave-induced cyclic loadings . . . . . . . . . . . . . . . . . . . . VI-5-206
f. Dynamic loading of soils under monolithic structures . . . . . . . . . . . . . . . . . . . . . . . . VI-5-210
g. Slip surface and zone failures . . . . . . . . . . . . . . . . . . . . . . . . . . . . . . . . . . . . . . . . . . . VI-5-212
h. Settlement . . . . . . . . . . . . . . . . . . . . . . . . . . . . . . . . . . . . . . . . . . . . . . . . . . . . . . . . . . VI-5-229
VI-5-6. Scour and Scour Protection . . . . . . . . . . . . . . . . . . . . . . . . . . . . . . . . . . . . . . . . . . . VI-5-231
a. Scour problems in coastal engineering . . . . . . . . . . . . . . . . . . . . . . . . . . . . . . . . . . . . VI-5-231 (1) Physical processes of scour . . . . . . . . . . . . . . . . . . . . . . . . . . . . . . . . . . . . . . . . . . VI-5-231
(2) Common scour problems . . . . . . . . . . . . . . . . . . . . . . . . . . . . . . . . . . . . . . . . . . . . VI-5-232
b. Prediction of scour . . . . . . . . . . . . . . . . . . . . . . . . . . . . . . . . . . . . . . . . . . . . . . . . . . . VI-5-235
(1) Scour at vertical walls . . . . . . . . . . . . . . . . . . . . . . . . . . . . . . . . . . . . . . . . . . . . . . VI-5-235
(a) Nonbreaking waves . . . . . . . . . . . . . . . . . . . . . . . . . . . . . . . . . . . . . . . . . . . . . . VI-5-235
(b) Breaking waves . . . . . . . . . . . . . . . . . . . . . . . . . . . . . . . . . . . . . . . . . . . . . . . . . VI-5-239
(2) Scour at sloping structures . . . . . . . . . . . . . . . . . . . . . . . . . . . . . . . . . . . . . . . . . . . VI-5-242
8/13/2019 CEM PartVI-Chap5p1, Fundamentals of Design
http://slidepdf.com/reader/full/cem-partvi-chap5p1-fundamentals-of-design 4/150
EM 1110-2-1100 (Part VI)Proposed Publishing Date: 30 Apr 03
VI-5-iv Fundamentals of Design
(a) Rules of thumb . . . . . . . . . . . . . . . . . . . . . . . . . . . . . . . . . . . . . . . . . . . . . . . . . VI-5-242
(b) Scour at head of sloping breakwater . . . . . . . . . . . . . . . . . . . . . . . . . . . . . . . . . VI-5-242
(3) Scour at piles . . . . . . . . . . . . . . . . . . . . . . . . . . . . . . . . . . . . . . . . . . . . . . . . . . . . . VI-5-243
(a) Scour at small diameter vertical piles . . . . . . . . . . . . . . . . . . . . . . . . . . . . . . . . VI-5-244
(b) Scour at large diameter vertical piles . . . . . . . . . . . . . . . . . . . . . . . . . . . . . . . . VI-5-247
(4) Scour at submerged pipelines . . . . . . . . . . . . . . . . . . . . . . . . . . . . . . . . . . . . . . . . VI-5-247
(a) Pipeline scour by currents . . . . . . . . . . . . . . . . . . . . . . . . . . . . . . . . . . . . . . . . . VI-5-248 (b) Pipeline scour by waves . . . . . . . . . . . . . . . . . . . . . . . . . . . . . . . . . . . . . . . . . . VI-5-249
(c) Pipeline scour by waves and currents . . . . . . . . . . . . . . . . . . . . . . . . . . . . . . . . VI-5-250
(d) Pipelines in the nearshore . . . . . . . . . . . . . . . . . . . . . . . . . . . . . . . . . . . . . . . . . VI-5-250
(5) Other scour problems . . . . . . . . . . . . . . . . . . . . . . . . . . . . . . . . . . . . . . . . . . . . . . . VI-5-250
c. Design of scour protection . . . . . . . . . . . . . . . . . . . . . . . . . . . . . . . . . . . . . . . . . . . . . VI-5-250
(1) Scour protection for vertical walls . . . . . . . . . . . . . . . . . . . . . . . . . . . . . . . . . . . . . VI-5-251
(2) Scour protection for sloping structures . . . . . . . . . . . . . . . . . . . . . . . . . . . . . . . . . VI-5-252
(3) Scour protection for piles . . . . . . . . . . . . . . . . . . . . . . . . . . . . . . . . . . . . . . . . . . . . VI-5-253
(4) Scour protection for submerged pipelines . . . . . . . . . . . . . . . . . . . . . . . . . . . . . . . VI-5-254
VI-5-7 Wave Forces on Slender Cylindrical Piles . . . . . . . . . . . . . . . . . . . . . . . . . . . . . . VI-5-255
a. Introduction . . . . . . . . . . . . . . . . . . . . . . . . . . . . . . . . . . . . . . . . . . . . . . . . . . . . . . . . . VI-5-255b. Vertical cylindrical piles and nonbreaking waves . . . . . . . . . . . . . . . . . . . . . . . . . . . VI-5-256
(1) Basic concepts . . . . . . . . . . . . . . . . . . . . . . . . . . . . . . . . . . . . . . . . . . . . . . . . . . . . VI-5-256
(2) Calculation of forces and moments . . . . . . . . . . . . . . . . . . . . . . . . . . . . . . . . . . . . VI-5-257
(a) Linear wave theory . . . . . . . . . . . . . . . . . . . . . . . . . . . . . . . . . . . . . . . . . . . . . . VI-5-258
(b) Nonlinear wave theory . . . . . . . . . . . . . . . . . . . . . . . . . . . . . . . . . . . . . . . . . . . VI-5-260
(3) Transverse forces due to eddy shedding . . . . . . . . . . . . . . . . . . . . . . . . . . . . . . . . VI-5-270
c. Selection of hydrodynamic force coefficients C D , C M , and C L . . . . . . . . . . . . . . . . . . VI-5-275
d. Safety factors in pile design . . . . . . . . . . . . . . . . . . . . . . . . . . . . . . . . . . . . . . . . . . . . . VI-5-279
e. Other considerations related to forces on slender cylindrical piles . . . . . . . . . . . . . . VI-5-280
VI-5-8. Other Forces and Interactions . . . . . . . . . . . . . . . . . . . . . . . . . . . . . . . . . . . . . . . . . VI-5-281
a. Impact forces . . . . . . . . . . . . . . . . . . . . . . . . . . . . . . . . . . . . . . . . . . . . . . . . . . . . . . . . VI-5-281b. Ice forces . . . . . . . . . . . . . . . . . . . . . . . . . . . . . . . . . . . . . . . . . . . . . . . . . . . . . . . . . . . VI-5-281
(1) Horizontal ice forces . . . . . . . . . . . . . . . . . . . . . . . . . . . . . . . . . . . . . . . . . . . . . . . VI-5-282
(a) Solid ice forces . . . . . . . . . . . . . . . . . . . . . . . . . . . . . . . . . . . . . . . . . . . . . . . . . VI-5-282
(b) Localized ice crushing forces . . . . . . . . . . . . . . . . . . . . . . . . . . . . . . . . . . . . . . VI-5-283
(c) Thermal ice forces . . . . . . . . . . . . . . . . . . . . . . . . . . . . . . . . . . . . . . . . . . . . . . . VI-5-284
(2) Ice forces on slopes . . . . . . . . . . . . . . . . . . . . . . . . . . . . . . . . . . . . . . . . . . . . . . . . VI-5-285
(a) Ride-up of ice on slopes . . . . . . . . . . . . . . . . . . . . . . . . . . . . . . . . . . . . . . . . . . VI-5-285
(b) Adfreeze loads . . . . . . . . . . . . . . . . . . . . . . . . . . . . . . . . . . . . . . . . . . . . . . . . . VI-5-287
(3) Vertical ice forces . . . . . . . . . . . . . . . . . . . . . . . . . . . . . . . . . . . . . . . . . . . . . . . . . VI-5-287
(a) Cylindrical piles . . . . . . . . . . . . . . . . . . . . . . . . . . . . . . . . . . . . . . . . . . . . . . . . VI-5-287
(b) Vertical walls . . . . . . . . . . . . . . . . . . . . . . . . . . . . . . . . . . . . . . . . . . . . . . . . . . VI-5-288
(c) Sloping structures . . . . . . . . . . . . . . . . . . . . . . . . . . . . . . . . . . . . . . . . . . . . . . . VI-5-289 (4) Aspects of slope protection design . . . . . . . . . . . . . . . . . . . . . . . . . . . . . . . . . . . . VI-5-289
VI-5-9. References . . . . . . . . . . . . . . . . . . . . . . . . . . . . . . . . . . . . . . . . . . . . . . . . . . . . . . . . . . VI-5-290
8/13/2019 CEM PartVI-Chap5p1, Fundamentals of Design
http://slidepdf.com/reader/full/cem-partvi-chap5p1-fundamentals-of-design 5/150
EM 1110-2-1100 (Part VI)Proposed Publishing Date: 30 Apr 03
Fundamentals of Design VI-5-v
List of Figures
Page
Figure VI-5-1. Illustration of runup and rundown . . . . . . . . . . . . . . . . . . . . . . . . . . . . . . . . . . . . . VI-5-4
Figure VI-5-2. Typical velocity field for the porous flow in a breakwater. Numericalcalculation . . . . . . . . . . . . . . . . . . . . . . . . . . . . . . . . . . . . . . . . . . . . . . . . . . . . . . . VI-5-5
Figure VI-5-3. Ru2% for head-on waves on smooth slopes . . . . . . . . . . . . . . . . . . . . . . . . . . . . . . . VI-5-8
Figure VI-5-4. Rus for head-on waves on smooth slopes . . . . . . . . . . . . . . . . . . . . . . . . . . . . . . . . VI-5-9
Figure VI-5-5. Ru2 percent for long-crested head-on waves on smooth slopes . . . . . . . . . . . . . . VI-5-10
Figure VI-5-6. Parameters in berm test program at Delft Hydraulics . . . . . . . . . . . . . . . . . . . . . VI-5-11
Figure VI-5-7. Definition of αeq and α in Equation VI-5-9 . . . . . . . . . . . . . . . . . . . . . . . . . . . . . . VI-5-12
Figure VI-5-8. Evaluation of the use of ξeq to account for the influence of a berm . . . . . . . . . . . VI-5-13
Figure VI-5-9. Test program for wave runup on smooth slopes conducted at Delft
Hydraulics, de Waal and van der Meer (1992) . . . . . . . . . . . . . . . . . . . . . . . . . . VI-5-14
Figure VI-5-10. Influence of angle of incidence β and directional spreading on runup on
smooth slopes conducted at Delft Hydraulics; de Waal and van der Meer
(1992) . . . . . . . . . . . . . . . . . . . . . . . . . . . . . . . . . . . . . . . . . . . . . . . . . . . . . . . . . . VI-5-14
Figure VI-5-11. Notational permeability coefficients . . . . . . . . . . . . . . . . . . . . . . . . . . . . . . . . . . VI-5-16
Figure VI-5-12. 2 percent and significant runup of irregular head-on waves on impermeable and permeablerock slopes . . . . . . . . . . . . . . . . . . . . . . . . . . . . . . . . . . . . . . . . . . . . . . . . . . . . . . VI-5-17
Figure VI-5-13. Definition of crest freeboard, Rc . . . . . . . . . . . . . . . . . . . . . . . . . . . . . . . . . . . . . . VI-5-19
Figure VI-5-14. Structure profile geometrical parameters related to overtopping . . . . . . . . . . . . . VI-5-22
Figure VI-5-15. Wave overtopping data as basis for Equations VI-5-24 and VI-5-25 . . . . . . . . . VI-5-30
Figure VI-5-16. Vertical wall wave overtopping data plotted with γ s = 1.0 . . . . . . . . . . . . . . . . . . VI-5-32
Figure VI-5-17. Vertical wall wave overtopping data with fitted mean and 95 percent
confidence bands . . . . . . . . . . . . . . . . . . . . . . . . . . . . . . . . . . . . . . . . . . . . . . . . . VI-5-32
Figure VI-5-18. Reflection coefficients for concrete armor unit slopes . . . . . . . . . . . . . . . . . . . . . VI-5-36
Figure VI-5-19. Wave reflection coefficients for rock armored slope with berm at SWL . . . . . . . VI-5-37
Figure VI-5-20. Wave reflection coefficients for plain vertical breakwater on 1:50 seabed . . . . . VI-5-38
8/13/2019 CEM PartVI-Chap5p1, Fundamentals of Design
http://slidepdf.com/reader/full/cem-partvi-chap5p1-fundamentals-of-design 6/150
8/13/2019 CEM PartVI-Chap5p1, Fundamentals of Design
http://slidepdf.com/reader/full/cem-partvi-chap5p1-fundamentals-of-design 7/150
EM 1110-2-1100 (Part VI)Proposed Publishing Date: 30 Apr 03
Fundamentals of Design VI-5-vii
Figure VI-5-42. Breakage formula for tetrapods . . . . . . . . . . . . . . . . . . . . . . . . . . . . . . . . . . . . . . VI-5-93
Figure VI-5-43. Wave height versus maximum flexural tensile stress for several dolos
waist ratios . . . . . . . . . . . . . . . . . . . . . . . . . . . . . . . . . . . . . . . . . . . . . . . . . . . . . . VI-5-96
Figure VI-5-44. Dolos mass versus maximum flexural tensile stress for several dolos
waist ratios . . . . . . . . . . . . . . . . . . . . . . . . . . . . . . . . . . . . . . . . . . . . . . . . . . . . . . VI-5-97
Figure VI-5-45. Example of calculation of thermal stresses and cracked regions in a
70-tonne cube 100 hr after casting . . . . . . . . . . . . . . . . . . . . . . . . . . . . . . . . . . . VI-5-100
Figure VI-5-46. Examples of temperature development during curing in 30-tonne modified
cubes with and without a hole . . . . . . . . . . . . . . . . . . . . . . . . . . . . . . . . . . . . . . VI-5-101
Figure VI-5-47. Typical toe and toe berm solutions in rubble-mound breakwater design . . . . . . VI-5-103
Figure VI-5-48. Example of potential instability of the stones placed on rock seabed . . . . . . . . VI-5-104
Figure VI-5-49. Support of the stones by a trench or anchor bolts . . . . . . . . . . . . . . . . . . . . . . . VI-5-104
Figure VI-5-50. Typical seawall to designs where scour is foreseen . . . . . . . . . . . . . . . . . . . . . . VI-5-105
Figure VI-5-51. Illustration of foot protection blocks for vertical structures . . . . . . . . . . . . . . . . VI-5-111
Figure VI-5-52. Example of Japanese foot protection block . . . . . . . . . . . . . . . . . . . . . . . . . . . . VI-5-112
Figure VI-5-53. Design of foot protection blocks according to Japanese practice . . . . . . . . . . . . VI-5-112
Figure VI-5-54. Rubble-mound section for seaward wave exposure with zero-to-moderate
overtopping conditions . . . . . . . . . . . . . . . . . . . . . . . . . . . . . . . . . . . . . . . . . . . . VI-5-116
Figure VI-5-55. Rubble-mound section for wave exposure on both sides with moderate
overtopping conditions . . . . . . . . . . . . . . . . . . . . . . . . . . . . . . . . . . . . . . . . . . . . VI-5-117
Figure VI-5-56. Logic diagram for preliminary design of rubble-mound structures . . . . . . . . . . VI-5-120
Figure VI-5-57. Illustration of vertical wall wave forces from nonbreaking and breaking
waves . . . . . . . . . . . . . . . . . . . . . . . . . . . . . . . . . . . . . . . . . . . . . . . . . . . . . . . . . VI-5-133
Figure VI-5-58. Identification of types of total horizontal wave loadins on vertical wall
structure exposed to head-on long-crested irregular waves . . . . . . . . . . . . . . . . VI-5-135
Figure VI-5-59. Pressure distributions for nonbreaking waves . . . . . . . . . . . . . . . . . . . . . . . . . . VI-5-136
Figure VI-5-60. Pressure distributions on overtopped vertical wall . . . . . . . . . . . . . . . . . . . . . . . VI-5-136
Figure VI-5-61. Wave barrier definition sketch . . . . . . . . . . . . . . . . . . . . . . . . . . . . . . . . . . . . . . VI-5-147
Figure VI-5-62. Best-fit to wave barrier force data . . . . . . . . . . . . . . . . . . . . . . . . . . . . . . . . . . . VI-5-158
Figure VI-5-63. Power curve exponents . . . . . . . . . . . . . . . . . . . . . . . . . . . . . . . . . . . . . . . . . . . . VI-5-148
8/13/2019 CEM PartVI-Chap5p1, Fundamentals of Design
http://slidepdf.com/reader/full/cem-partvi-chap5p1-fundamentals-of-design 8/150
EM 1110-2-1100 (Part VI)Proposed Publishing Date: 30 Apr 03
VI-5-viii Fundamentals of Design
Figure VI-5-64. Comparison of Equation VI-5-139 to data used in empirical curve fits . . . . . . . VI-5-149
Figure VI-5-65. Variation of wave height along a semi-infinite, fully reflecting breakwater
exposed to head-on, long-crested waves . . . . . . . . . . . . . . . . . . . . . . . . . . . . . . VI-5-151
Figure VI-5-66. Peak-delay force reduction for oblique regular waves . . . . . . . . . . . . . . . . . . . . VI-5-152
Figure VI-5-67. Numerical simulation of peak-delay reduction, long-crested waves.
Example of uncertainty calculation for wave train with 500 waves . . . . . . . . . . VI-5-152
Figure VI-5-68. Example of peak-delay force reduction for short-crested waves . . . . . . . . . . . . VI-5-153
Figure VI-5-69. Nondimensional amplitude of horizontal turning moment around the
center of the caisson exposed to oblique nonbreaking regular waves . . . . . . . . VI-5-154
Figure VI-5-70. Example of force reduction from model tests with short-crested breaking
waves . . . . . . . . . . . . . . . . . . . . . . . . . . . . . . . . . . . . . . . . . . . . . . . . . . . . . . . . . VI-5-155
Figure VI-5-71. Broken wave forces on wall seaward of shoreline . . . . . . . . . . . . . . . . . . . . . . . VI-5-156
Figure VI-5-72. Broken wave forces on wall landwater of shoreline . . . . . . . . . . . . . . . . . . . . . VI-5-157
Figure VI-5-73. Illustration of forces on a superstructure . . . . . . . . . . . . . . . . . . . . . . . . . . . . . . VI-5-158
Figure VI-5-74. Illustration of comparison between base plate pore pressure distributions
(under quasi-static porous flow conditions) and the approximated linear
distribution . . . . . . . . . . . . . . . . . . . . . . . . . . . . . . . . . . . . . . . . . . . . . . . . . . . . . VI-5-159
Figure VI-5-75. Impulsive pressure force caused by wave breaking on the wave wall . . . . . . . . VI-5-160
Figure VI-5-76. Typical crown wall configurations . . . . . . . . . . . . . . . . . . . . . . . . . . . . . . . . . . . VI-5-160
Figure VI-5-77. Comparison of predictions to measurements using the methods in
Table VI-5-61 . . . . . . . . . . . . . . . . . . . . . . . . . . . . . . . . . . . . . . . . . . . . . . . . . . . VI-5-163
Figure VI-5-78. Convex and concave corners and bends at vertical walls . . . . . . . . . . . . . . . . . . VI-5-167
Figure VI-5-79. Mach reflection at a vertical wall . . . . . . . . . . . . . . . . . . . . . . . . . . . . . . . . . . . . VI-5-168
Figure VI-5-80. Total stresses in a soil element . . . . . . . . . . . . . . . . . . . . . . . . . . . . . . . . . . . . . . VI-5-178
Figure VI-5-81. Illustration of shear modulus G and bulk modulus K for granular soils
exposed to initial and repeated (cyclic) loadings . . . . . . . . . . . . . . . . . . . . . . . . VI-5-181
Figure VI-5-82. In-situ secant values of shear modulus G for quasi static loaded
saturated clays . . . . . . . . . . . . . . . . . . . . . . . . . . . . . . . . . . . . . . . . . . . . . . . . . . VI-5-183
Figure VI-5-83. Static and secant cyclic shear modulus, g , for Drammen clay . . . . . . . . . . . . . VI-5-184
Figure VI-5-84. Values of G/Gmax for sands and gravels . . . . . . . . . . . . . . . . . . . . . . . . . . . . . . VI-5-185
8/13/2019 CEM PartVI-Chap5p1, Fundamentals of Design
http://slidepdf.com/reader/full/cem-partvi-chap5p1-fundamentals-of-design 9/150
EM 1110-2-1100 (Part VI)Proposed Publishing Date: 30 Apr 03
Fundamentals of Design VI-5-ix
Figure VI-5-85. Damping ratios for sands and saturated clays . . . . . . . . . . . . . . . . . . . . . . . . . . VI-5-186
Figure VI-5-86. Mohr envelope for stresses of failure . . . . . . . . . . . . . . . . . . . . . . . . . . . . . . . . VI-5-187
Figure VI-5-87. Illustration of straight-line approximations to curved Mohr envelopes
corresponding to drained conditions . . . . . . . . . . . . . . . . . . . . . . . . . . . . . . . . . VI-5-187
Figure VI-5-88. Angle of friction in rock fill of different grading and porosity with
maximum diameter in the range 70-200 mm . . . . . . . . . . . . . . . . . . . . . . . . . . VI-5-189
Figure VI-5-89. Crude visualization of dilatancy and angle of dilation ψ . . . . . . . . . . . . . . . . . VI-5-190
Figure VI-5-90. Failure criterion for a water-saturated clay in undrained condition defined
from Mohr envelope . . . . . . . . . . . . . . . . . . . . . . . . . . . . . . . . . . . . . . . . . . . . . VI-5-191
Figure VI-5-91. Representation of flow regimes for stationary porous flow based on
a Forchheimer equation formulation . . . . . . . . . . . . . . . . . . . . . . . . . . . . . . . . . VI-5-194
Figure VI-5-92. Illustration of wave induced forces on caisson foundation and related stressvariations in the subsoil . . . . . . . . . . . . . . . . . . . . . . . . . . . . . . . . . . . . . . . . . . VI-5-201
Figure VI-5-93. Illustration of approximate cyclic wave loading and related cyclic shear
stress variation in a subsoil element during a storm sequence . . . . . . . . . . . . . VI-5-202
Figure VI-5-94. Simplified stress conditions for some elements along a potential failure
surface . . . . . . . . . . . . . . . . . . . . . . . . . . . . . . . . . . . . . . . . . . . . . . . . . . . . . . . . VI-5-203
Figure VI-5-95. Illustration of (a) stabilization and pore pressure build-up, and
(b) liquefaction undrained triaxial test on sand . . . . . . . . . . . . . . . . . . . . . . . . VI-5-204
Figure VI-5-96. Illustration of effective stress paths for clay samples in undrained triaxialtests . . . . . . . . . . . . . . . . . . . . . . . . . . . . . . . . . . . . . . . . . . . . . . . . . . . . . . . . . . VI-5-207
Figure VI-5-97. Stress strain behavior of Drammen clay under various cyclic loading
conditions corresponding to OCR = 4 . . . . . . . . . . . . . . . . . . . . . . . . . . . . . . . VI-5-208
Figure VI-5-98. Result of cyclic tests on normally consolidated Drammen clay with
OCR = 1, and I p = 27 percent . . . . . . . . . . . . . . . . . . . . . . . . . . . . . . . . . . . . . . VI-5-209
Figure VI-5-99. Example of normalized diagrams for cyclic loading of Drammen clay with
OCR = 1, in triaxial tests (a), and DSS tests (b) . . . . . . . . . . . . . . . . . . . . . . . . VI-5-209
Figure VI-5-100. Cyclic shear strength of Drammen clay with OCR = 1 . . . . . . . . . . . . . . . . . . VI-5-210
Figure VI-5-101. Approximation to horizontal wave load history for waves breaking
directly on vertical walls . . . . . . . . . . . . . . . . . . . . . . . . . . . . . . . . . . . . . . . . . . VI-5-211
8/13/2019 CEM PartVI-Chap5p1, Fundamentals of Design
http://slidepdf.com/reader/full/cem-partvi-chap5p1-fundamentals-of-design 10/150
EM 1110-2-1100 (Part VI)Proposed Publishing Date: 30 Apr 03
VI-5-x Fundamentals of Design
Figure VI-5-102. Definition of translatory and rotational motions and dimensions for
caisson structure and parapet wave wall exposed to dynamic loading . . . . . . . VI-5-211
Figure VI-5-103. Amplification factors for translatory and rotational motions for caisson
structure with square footing and triangular load shape . . . . . . . . . . . . . . . . . . VI-5-213
Figure VI-5-104. Illustration of flow nets in a homogenous isotropic breakwater for twoinstantaneous wave load situations . . . . . . . . . . . . . . . . . . . . . . . . . . . . . . . . . . VI-5-215
Figure VI-5-105. Illustration of instantaneous flow net in a homogeneous isotropic seabed
under wave action . . . . . . . . . . . . . . . . . . . . . . . . . . . . . . . . . . . . . . . . . . . . . . . VI-5-216
Figure VI-5-106. Illustration of forces to be considered in slope stability analysis . . . . . . . . . . . VI-5-218
Figure VI-5-107. Illustration of logarthmic spiral . . . . . . . . . . . . . . . . . . . . . . . . . . . . . . . . . . . . VI-5-219
Figure VI-5-108. Illustration of failure surface in case of weak stratum . . . . . . . . . . . . . . . . . . . VI-5-220
Figure VI-5-109. Illustration of forces on a soil slice in the method of slices slopestability analysis . . . . . . . . . . . . . . . . . . . . . . . . . . . . . . . . . . . . . . . . . . . . . . . . VI-5-221
Figure VI-5-110. Illustration of safety factor F for three-dimensional slope failure . . . . . . . . . . VI-5-222
Figure VI-5-111. Illustration of fictitious footing to replace real footing under eccentric
loading conditions . . . . . . . . . . . . . . . . . . . . . . . . . . . . . . . . . . . . . . . . . . . . . . . VI-5-226
Figure VI-5-112. Simplified base and rear slope geometries to be applied in the general
bearing capacity formula Table VI-5-86 . . . . . . . . . . . . . . . . . . . . . . . . . . . . . VI-5-226
Figure VI-5-113. Illustration of passive earth pressure P to be included in the
determination of the foundation load resultant R in place of thedepth coefficients in Equations VI-5-248 and VI-5-250 . . . . . . . . . . . . . . . . . VI-5-228
Figure VI-5-114. Coastal scour problems . . . . . . . . . . . . . . . . . . . . . . . . . . . . . . . . . . . . . . . . . . . VI-5-233
Figure VI-5-115. Regular and irregular wave-scoured profiles at a vertical-front structure . . . . VI-5-236
Figure VI-5-116. Scour prediction for nonbreaking waves at vertical wall . . . . . . . . . . . . . . . . . VI-5-238
Figure VI-5-117. Scour due to breaking waves at a vertical seawall . . . . . . . . . . . . . . . . . . . . . . VI-5-240
Figure VI-5-118. Relative scour depth as a function of relative depth at a vertical wall . . . . . . . VI-5-241
Figure VI-5-119. Correction factor, k 1, for pile/pier shape . . . . . . . . . . . . . . . . . . . . . . . . . . . . . . VI-5-245
Figure VI-5-120. Wave-induced equilibrium scour depth at a vertical pile . . . . . . . . . . . . . . . . . VI-5-246
Figure VI-5-121. Wave and current scour around large vertical piles . . . . . . . . . . . . . . . . . . . . . VI-5-248
Figure VI-5-122. Pipeline scour and pipeline embedment . . . . . . . . . . . . . . . . . . . . . . . . . . . . . . VI-5-248
8/13/2019 CEM PartVI-Chap5p1, Fundamentals of Design
http://slidepdf.com/reader/full/cem-partvi-chap5p1-fundamentals-of-design 11/150
EM 1110-2-1100 (Part VI)Proposed Publishing Date: 30 Apr 03
Fundamentals of Design VI-5-xi
Figure VI-5-123. Scour apron for vertical pile in a current . . . . . . . . . . . . . . . . . . . . . . . . . . . . . VI-5-253
Figure VI-5-124. Stone blanket scour protection for submerged pipelines . . . . . . . . . . . . . . . . . VI-5-254
Figure VI-5-125. Definition sketch of wave forces on a vertical cylinder . . . . . . . . . . . . . . . . . . VI-5-255
Figure VI-5-126. K im versus relative depth, d/gT 2 . . . . . . . . . . . . . . . . . . . . . . . . . . . . . . . . . . . . . VI-5-261
Figure VI-5-127. K Dm versus relative depth, d/gT 2 . . . . . . . . . . . . . . . . . . . . . . . . . . . . . . . . . . . . VI-5-262
Figure VI-5-128. Inertia force moment arm S im versus relative depth, d/gT 2 . . . . . . . . . . . . . . . . VI-5-263
Figure VI-5-129. Drag force moment arm S Dm versus relative depth, d/gT 2 . . . . . . . . . . . . . . . . . VI-5-264
Figure VI-5-130. Breaking wave height and regions of validity of various wave theories . . . . . VI-5-265
Figure VI-5-131. Isolines of nm versus H/gT 2 and d/gT 2 (W = 0.05) . . . . . . . . . . . . . . . . . . . . . . VI-5-266
Figure VI-5-132. Isolines of nm versus H/gT 2 and d/gT 2 (W = 0.10) . . . . . . . . . . . . . . . . . . . . . . VI-5-267
Figure VI-5-133. Isolines of nm versus H/gT 2 and d/gT 2 (W = 0.50) . . . . . . . . . . . . . . . . . . . . . . VI-5-268
Figure VI-5-134. Isolines of nm versus H/gT 2 and d/gT 2 (W = 1.0) . . . . . . . . . . . . . . . . . . . . . . . VI-5-269
Figure VI-5-135. Isolines of αm versus H/gT 2 and d/gT 2 (W = 0.05) . . . . . . . . . . . . . . . . . . . . . . VI-5-271
Figure VI-5-136. Isolines of αm versus H/gT 2 and d/gT 2 (W = 0.10) . . . . . . . . . . . . . . . . . . . . . . VI-5-272
Figure VI-5-137. Isolines of αm versus H/gT 2 and d/gT 2 (W = 0.5) . . . . . . . . . . . . . . . . . . . . . . . VI-5-273
Figure VI-5-138. Isolines of αm versus H/gT 2 and d/gT 2 (W = 1.0) . . . . . . . . . . . . . . . . . . . . . . . VI-5-274
Figure VI-5-139. Drag coefficient C D as a function of KC and constant values of
Rc or β for smooth cylinders . . . . . . . . . . . . . . . . . . . . . . . . . . . . . . . . . . . . . . . VI-5-276
Figure VI-5-140. Inertia coefficient C M as a function of KC and constant values of
Re or β for smooth cylinders . . . . . . . . . . . . . . . . . . . . . . . . . . . . . . . . . . . . . . . VI-5-277
Figure VI-5-141. Lift coefficient C L as a function of KC and constant values of
Re or β for smooth cylinders . . . . . . . . . . . . . . . . . . . . . . . . . . . . . . . . . . . . . . . VI-5-277
Figure VI-5-142. Drag coefficient C D as a function of Reynolds number for rough cylinders . . VI-5-278
Figure VI-5-143. Inertia coefficient C M as a function of Reynolds number for rough
cylinders . . . . . . . . . . . . . . . . . . . . . . . . . . . . . . . . . . . . . . . . . . . . . . . . . . . . . . VI-5-278
Figure VI-5-144. Ice riding up on structure slope . . . . . . . . . . . . . . . . . . . . . . . . . . . . . . . . . . . . VI-5-285
Figure VI-5-145. Vertical ice forces on a cylindrical pile . . . . . . . . . . . . . . . . . . . . . . . . . . . . . . VI-5-288
8/13/2019 CEM PartVI-Chap5p1, Fundamentals of Design
http://slidepdf.com/reader/full/cem-partvi-chap5p1-fundamentals-of-design 12/150
EM 1110-2-1100 (Part VI)Proposed Publishing Date: 30 Apr 03
VI-5-xii Fundamentals of Design
List of Tables
Page
Table VI-5-1. Types of Wave Breaking on Impermeable Slopes and Related ξo Values . . . . . . . . VI-5-6
Table VI-5-2. Coefficients in Equation VI-5-3 for Runup of Long-Crested Irregular Waves on
Smooth Impermeable Slopes . . . . . . . . . . . . . . . . . . . . . . . . . . . . . . . . . . . . . . . . . . VI-5-9
Table VI-5-3. Surface Roughness Reduction Factor γr in Equation VI-3-5, Valid for
1 < ξop < 3-4 . . . . . . . . . . . . . . . . . . . . . . . . . . . . . . . . . . . . . . . . . . . . . . . . . . . . . . VI-5-11
Table VI-5-4. Test Program . . . . . . . . . . . . . . . . . . . . . . . . . . . . . . . . . . . . . . . . . . . . . . . . . . . . . VI-5-15
Table VI-5-5. Coefficients in Equations VI-5-12 and VI-5-13 for Runup of Irregular
Head-On Waves on Impermeable and Permeable Rock Armored Slopes . . . . . . . VI-5-17
Table VI-5-6. Critical Values of Average Overtopping Discharges . . . . . . . . . . . . . . . . . . . . . . . VI-5-21
Table VI-5-7. Models for Average Overtopping Discharge Formulae . . . . . . . . . . . . . . . . . . . . . VI-5-23
Table VI-5-8. Overtopping Formula by Owen (1980, 1982) . . . . . . . . . . . . . . . . . . . . . . . . . . . . VI-5-25
Table VI-5-9. Overtopping Formula by Bradbury and Allsop (1988) . . . . . . . . . . . . . . . . . . . . . VI-5-26
Table VI-5-10. Coefficients by Aminti and Franco (1988) for Overtopping Formula by
Bradbury and Allsop in Table VI-5-9 . . . . . . . . . . . . . . . . . . . . . . . . . . . . . . . . . . VI-5-27
Table VI-5-11. Overtopping Formula by van der Meer and Janssen (1995) . . . . . . . . . . . . . . . . . VI-5-28
Table VI-5-12. Overtopping formula by Pedersen and Burcharth (1992), Pedersen (1996) . . . . . VI-5-29
Table VI-5-13. Overtopping Formula by Franco and Franco (1999) . . . . . . . . . . . . . . . . . . . . . . . VI-5-31
Table VI-5-14. Wave Reflection Coefficients for Non-Overtopped Sloping Structures Based
on Seelig (1983) Equation . . . . . . . . . . . . . . . . . . . . . . . . . . . . . . . . . . . . . . . . . . . VI-5-35
Table VI-5-15. Wave Transmission Formula by van der Meer and d’Angremond (1991) for Rock Armored
Low-crested, Submerged, and Reef Breakwaters . . . . . . . . . . . . . . . . . . . . . . . . . VI-5-47
Table VI-5-16. Wave Transmission Formula by Goda (1969) . . . . . . . . . . . . . . . . . . . . . . . . . . . . VI-5-49
Table VI-5-17. Wave Transmission Formula by Takahashi (1996) . . . . . . . . . . . . . . . . . . . . . . . . VI-5-50
Table VI-5-18. Parameters Influencing Hydraulic Stability of Armor Layers . . . . . . . . . . . . . . . . VI-5-55
Table VI-5-19. Definition of Damage Parameters D, N od and S . . . . . . . . . . . . . . . . . . . . . . . . . . . VI-5-58
Table VI-5-20. Examples of Experimentally Determined Relationships Between N od and S . . . . . VI-5-59
8/13/2019 CEM PartVI-Chap5p1, Fundamentals of Design
http://slidepdf.com/reader/full/cem-partvi-chap5p1-fundamentals-of-design 13/150
EM 1110-2-1100 (Part VI)Proposed Publishing Date: 30 Apr 03
Fundamentals of Design VI-5-xiii
Table VI-5-21. Damage Classification and Related Values of the Damage Parameters
D, N od and S . . . . . . . . . . . . . . . . . . . . . . . . . . . . . . . . . . . . . . . . . . . . . . . . . . . . . . VI-5-60
Table VI-5-22. Rock, Two-Layer Armored Non-Overtopped Slopes (Hudson 1974) . . . . . . . . . . VI-5-65
Table VI-5-23. Rock, Two-Layer Armored Non-Overtopped Slopes (van der Meer 1988) . . . . . VI-5-66
Table VI-5-24. Rock, Two-Layer Armored Overtopped, but Not Submerged,
Low-Crested Slopes . . . . . . . . . . . . . . . . . . . . . . . . . . . . . . . . . . . . . . . . . . . . . . . . VI-5-76
Table VI-5-25. Rock, Submerged Breakwaters with Two-Layer Armor on Front, Crest and
Rear Slope (van der Meer 1991) . . . . . . . . . . . . . . . . . . . . . . . . . . . . . . . . . . . . . . VI-5-68
Table VI-5-26. Rock, Two-layer Armored Low-Crested and Submerged Breakwaters
(Vidal et al. 1992) . . . . . . . . . . . . . . . . . . . . . . . . . . . . . . . . . . . . . . . . . . . . . . . . . VI-5-69
Table VI-5-27. Rock, Low-Crested Reef Breakwaters Built Using Only One Class of Stone . . . . VI-5-70
Table VI-5-28. Rock, Rear Slope Stability of Two-Layer Armored Breakwaters WithoutSuperstructures (Jensen 1984) . . . . . . . . . . . . . . . . . . . . . . . . . . . . . . . . . . . . . . . . VI-5-71
Table VI-5-29. Concrete Cubes, Two-Layer Armored Non-Overtopped Slopes . . . . . . . . . . . . . . VI-5-72
Table VI-5-30. Tetrapods, Two-Layer Armored Non-Overtopped Slopes . . . . . . . . . . . . . . . . . . . VI-5-73
Table VI-5-31. Dolos, Non-Overtopped Slopes (Burcharth and Liu 1992) . . . . . . . . . . . . . . . . . . VI-5-74
Table VI-5-32. ACCROPODE® (van der Meer 1988b) . . . . . . . . . . . . . . . . . . . . . . . . . . . . . . . . VI-5-76
Table VI-5-33. ACCROPODE®, Non-Overtoped or Marginally Overtopped Slopes
(Burcharth et al. 1998) . . . . . . . . . . . . . . . . . . . . . . . . . . . . . . . . . . . . . . . . . . . . . . VI-5-77
Table VI-5-34. CORE-LOC®, Non or Marginally Overtopped Slopes (Melby and Turk
1994; Turk and Melby 1997) . . . . . . . . . . . . . . . . . . . . . . . . . . . . . . . . . . . . . . . . . VI-5-78
Table VI-5-35. Tetrapods, Horizontally Composite Breakwaters (Hanzawa et al. 1996) . . . . . . . VI-5-79
Table VI-5-36. Tribars, non-Overtopped or Minor Overtopped Slopes, Random and
Uniform Placement . . . . . . . . . . . . . . . . . . . . . . . . . . . . . . . . . . . . . . . . . . . . . . . . VI-5-80
Table VI-5-37. Rock and Dolos Breakwater Head Stability, No Overtopping ( Carver and
Heimbaugh 1989) . . . . . . . . . . . . . . . . . . . . . . . . . . . . . . . . . . . . . . . . . . . . . . . . . . VI-5-82
Table VI-5-38. Tetrapod and Tribar Breakwater Head Section Stability, No Overtopping . . . . . . VI-5-83
Table VI-5-39. Types and Origins of Loads on Armor Units (Burcharth 1993b) . . . . . . . . . . . . . VI-5-91
Table VI-5-40. Breakage Formula for Dolosse and Tetrapods . . . . . . . . . . . . . . . . . . . . . . . . . . . . VI-5-92
Table VI-5-41. Stress Prediction Formulae for Dolosse . . . . . . . . . . . . . . . . . . . . . . . . . . . . . . . . . VI-5-94
8/13/2019 CEM PartVI-Chap5p1, Fundamentals of Design
http://slidepdf.com/reader/full/cem-partvi-chap5p1-fundamentals-of-design 14/150
EM 1110-2-1100 (Part VI)Proposed Publishing Date: 30 Apr 03
VI-5-xiv Fundamentals of Design
Table VI-5-42. Approximate Values of Ultimate Rigid Body Impact Velocities for Concrete
Armor Units . . . . . . . . . . . . . . . . . . . . . . . . . . . . . . . . . . . . . . . . . . . . . . . . . . . . . . VI-5-99
Table VI-5-43. Drawbacks Related to Crack-Reducing Procedures . . . . . . . . . . . . . . . . . . . . . . VI-5-100
Table VI-5-44. Fatigue for Conventional Unreinforced Concrete Exposed to Uniaxial and
Flexural Stress Conditions With Zero Mean Stress . . . . . . . . . . . . . . . . . . . . . . . VI-5-102
Table VI-5-45. Stability of Toe Berm Tested in Regular Waves . . . . . . . . . . . . . . . . . . . . . . . . . VI-5-106
Table VI-5-46. Stability of Toe Berm Formed by 2 Layers of Stone Having Density
2.68 tonnes/m3. Variable Berm Width, and Sloping Structures . . . . . . . . . . . . . VI-5-107
Table VI-5-47. Stability of Toe Berm Formed by Two Layers of Stones or Parallellepiped
Concrete Blocks . . . . . . . . . . . . . . . . . . . . . . . . . . . . . . . . . . . . . . . . . . . . . . . . . . VI-5-109
Table VI-5-48. Stability of Toe Berm Formed by Two Layers of Stones in Front of Vertical Impermeable
Wall Structure . . . . . . . . . . . . . . . . . . . . . . . . . . . . . . . . . . . . . . . . . . . . . . . . . . . VI-5-110
Table VI-5-49. Stability Under Combined Waves and Currents . . . . . . . . . . . . . . . . . . . . . . . . . VI-5-114
Table VI-5-50. Weight and Size Selection Dimensions of Quarrystone . . . . . . . . . . . . . . . . . . . VI-5-118
Table VI-5-51. Layer Coefficient and Porosity for Various Armor Units . . . . . . . . . . . . . . . . . . VI-5-123
Table VI-5-52. The Sainflou Formula for Head-on, Fully Reflected, Standing Regular
Waves . . . . . . . . . . . . . . . . . . . . . . . . . . . . . . . . . . . . . . . . . . . . . . . . . . . . . . . . . VI-5-138
Table VI-5-53. Goda Formula for Irregular Waves . . . . . . . . . . . . . . . . . . . . . . . . . . . . . . . . . . . VI-5-139
Table VI-5-54. Goda Formula Modified to Include Impulsive Forces from Head-onBreaking Waves . . . . . . . . . . . . . . . . . . . . . . . . . . . . . . . . . . . . . . . . . . . . . . . . . . VI-5-140
Table VI-5-55. Resulting Wave Induced Forces and Moments, and Related Uncertainties
and Bias When Calculated from Wave Load Equations by Goda and
Takahashi . . . . . . . . . . . . . . . . . . . . . . . . . . . . . . . . . . . . . . . . . . . . . . . . . . . . . . . VI-5-141
Table VI-5-56. Wave Loads on Impermeable Inclined Walls . . . . . . . . . . . . . . . . . . . . . . . . . . . VI-5-142
Table VI-5-57. Wave Loads on Sloping Top Structures . . . . . . . . . . . . . . . . . . . . . . . . . . . . . . . VI-5-143
Table VI-5-58. Wave Loads on Vertical Walls Protected by a Rubble-Mound Structure . . . . . . VI-5-144
Table VI-5-59. Wave Pressures from Regular Head-on Waves on Caissons with Vertical
Slit Front Face and Open Wave Chamber . . . . . . . . . . . . . . . . . . . . . . . . . . . . . . VI-5-145
Table VI-5-60. Horizontal Wave Force on Concrete Caps . . . . . . . . . . . . . . . . . . . . . . . . . . . . . . VI-5-161
Table VI-5-61. Horizontal Wave Force, Uplift Wave Pressure and Turning Moment on
Concrete Caps . . . . . . . . . . . . . . . . . . . . . . . . . . . . . . . . . . . . . . . . . . . . . . . . . . . VI-5-162
8/13/2019 CEM PartVI-Chap5p1, Fundamentals of Design
http://slidepdf.com/reader/full/cem-partvi-chap5p1-fundamentals-of-design 15/150
EM 1110-2-1100 (Part VI)Proposed Publishing Date: 30 Apr 03
Fundamentals of Design VI-5-xv
Table VI-5-62. Experimental Test Results of Friction Coefficient Conducted in Japan . . . . . . . VI-5-165
Table VI-5-63. Experimental Test Results of Friction Coefficient . . . . . . . . . . . . . . . . . . . . . . . . VI-5-165
Table VI-5-64. Dynamic Friction Coefficient Between Caisson Bottom and Rubble-Mound . . . VI-5-166
Table VI-5-65. Fractional Limits of Grain Sizes According ISO/CEN . . . . . . . . . . . . . . . . . . . . VI-5-176
Table VI-5-66. Typical Bulk Density Values . . . . . . . . . . . . . . . . . . . . . . . . . . . . . . . . . . . . . . . . VI-5-176
Table VI-5-67. Typical Values of Void Ratio e and porosity n for Granular Soils . . . . . . . . . . . VI-5-177
Table VI-5-68. Density Characterization of Granular Soils . . . . . . . . . . . . . . . . . . . . . . . . . . . . . VI-5-177
Table VI-5-69. Deformation of Moduli for Elastic Material . . . . . . . . . . . . . . . . . . . . . . . . . . . . VI-5-180
Table VI-5-70. Typical Values of Poisson’s Ratio, ν . . . . . . . . . . . . . . . . . . . . . . . . . . . . . . . . . . VI-5-180
Table VI-5-71. Example Values of Secant Young’s Modulus E in MN/m2 for sand . . . . . . . . . . VI-5-182
Table VI-5-72. Typical Values of Secant Young’s Modulus, E , for Clay . . . . . . . . . . . . . . . . . . VI-5-182
Table VI-5-73. Typical Secant Values of Deformation-Moduli G, K and M for
Quasi-Static Loaded Quartz Sand . . . . . . . . . . . . . . . . . . . . . . . . . . . . . . . . . . . . VI-5-182
Table VI-5-74. Typical Values of Triaxial Test Friction Angle ns for Quartz Sand . . . . . . . . . . VI-5-188
Table VI-5-75. Critical Value of Angle of Friction, nNcrit . . . . . . . . . . . . . . . . . . . . . . . . . . . . . . . VI-5-190
Table VI-5-76. Typical Values of ψmax for Quartz Sand and Quarried Granitic Gneiss . . . . . . . . VI-5-191
Table VI-5-77. Classification of Clay According to Undrained Shear Strength, cu . . . . . . . . . . . VI-5-192
Table VI-5-78. One-Dimensional Porous Flow Equation . . . . . . . . . . . . . . . . . . . . . . . . . . . . . . VI-5-195
Table VI-5-79. Typical Values of Permeability, k , for Fine Materials . . . . . . . . . . . . . . . . . . . . . VI-5-195
Table VI-5-80. Typical Values of Permeability, k , for Stone Materials . . . . . . . . . . . . . . . . . . . . VI-5-195
Table VI-5-81. Wave Induced Set-up in Sloping Rubble Mound Structures . . . . . . . . . . . . . . . . VI-5-196
Table VI-5-82. Horizontal Wave Induced Pore Pressure Gradients in the Core
Rubble-Mound Breakwaters . . . . . . . . . . . . . . . . . . . . . . . . . . . . . . . . . . . . . . . . VI-5-197
Table VI-5-83. Classification of Loading and Soil Conditions . . . . . . . . . . . . . . . . . . . . . . . . . . VI-5-199
Table VI-5-84. Example of Consolidation Times for Sand . . . . . . . . . . . . . . . . . . . . . . . . . . . . . VI-5-200
Table VI-5-85. Wave and Tide Induced Pore Pressures in Permeable Seabeds . . . . . . . . . . . . . . VI-5-217

8/13/2019 CEM PartVI-Chap5p1, Fundamentals of Design
http://slidepdf.com/reader/full/cem-partvi-chap5p1-fundamentals-of-design 16/150
EM 1110-2-1100 (Part VI)Proposed Publishing Date: 30 Apr 03
VI-5-xvi Fundamentals of Design
Table VI-5-86. Bearing Capacity Formula for Rectangular Concentrically Statically
Loaded Horizontal Footings . . . . . . . . . . . . . . . . . . . . . . . . . . . . . . . . . . . . . . . . VI-5-224
Table VI-5-87. Bearing Capacity Formula for Rectangular Statically Loaded
Horizontal Footing . . . . . . . . . . . . . . . . . . . . . . . . . . . . . . . . . . . . . . . . . . . . . . . . VI-5-225
Table VI-5-88. General Bearing Capacity Formula for Rectangular Statically LoadedInclined Footing on Cohesionless Soil in Vicinity of Slope . . . . . . . . . . . . . . . . VI-5-227
Table VI-5-89. Values if Skin Friction Coefficient, C sf . . . . . . . . . . . . . . . . . . . . . . . . . . . . . . . . VI-5-282
Table VI-5-90. Values of Effective Ice Crushing Strength, σc . . . . . . . . . . . . . . . . . . . . . . . . . . . VI-5-284
8/13/2019 CEM PartVI-Chap5p1, Fundamentals of Design
http://slidepdf.com/reader/full/cem-partvi-chap5p1-fundamentals-of-design 17/150
EM 1110-2-1100 (Part VI)Proposed Publishing Date: 30 Apr 03
Fundamentals of Design VI-5-1
Chapter VI-5
Fundamentals of Design
VI-5-1. Introduction
a. Overview.
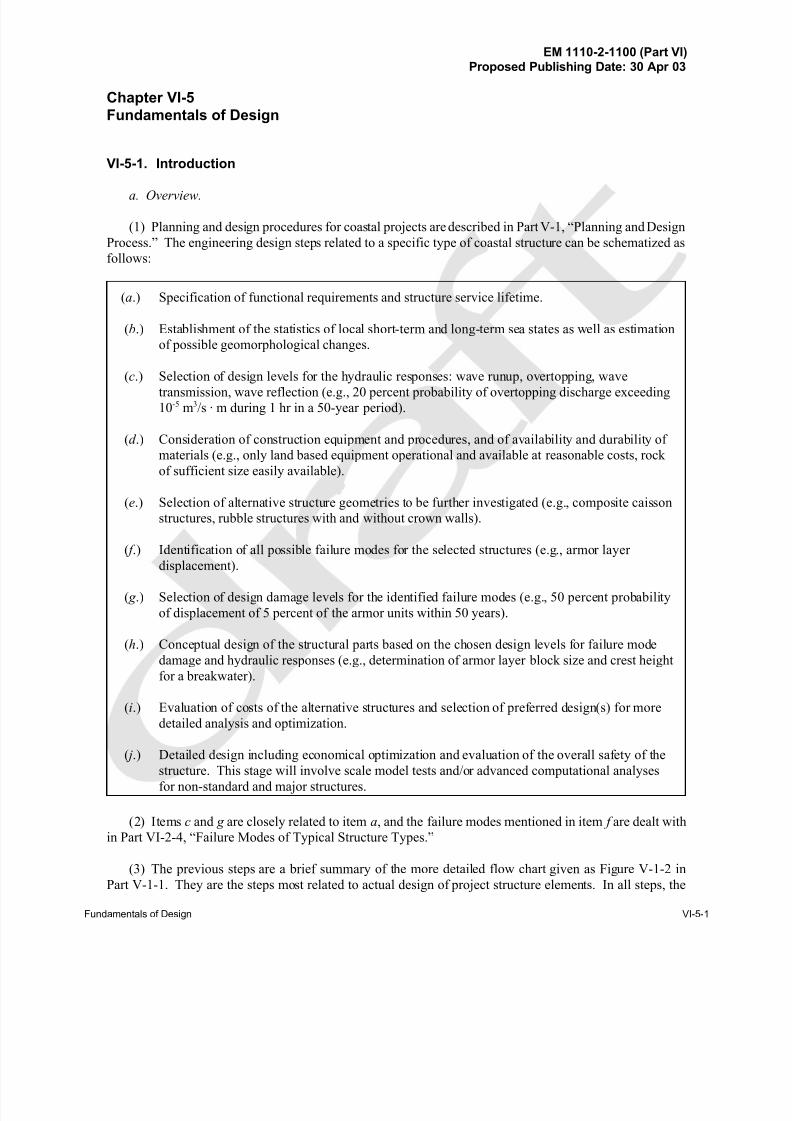
(1) Planning and design procedures for coastal projects are described in Part V-1, “Planning and Design
Process.” The engineering design steps related to a specific type of coastal structure can be schematized as
follows:
(a.) Specification of functional requirements and structure service lifetime.
(b.) Establishment of the statistics of local short-term and long-term sea states as well as estimation
of possible geomorphological changes.
(c.) Selection of design levels for the hydraulic responses: wave runup, overtopping, wavetransmission, wave reflection (e.g., 20 percent probability of overtopping discharge exceeding
10-5 m3/s · m during 1 hr in a 50-year period).
(d .) Consideration of construction equipment and procedures, and of availability and durability of
materials (e.g., only land based equipment operational and available at reasonable costs, rock
of sufficient size easily available).
(e.) Selection of alternative structure geometries to be further investigated (e.g., composite caisson
structures, rubble structures with and without crown walls).
( f .) Identification of all possible failure modes for the selected structures (e.g., armor layer
displacement).
( g .) Selection of design damage levels for the identified failure modes (e.g., 50 percent probability
of displacement of 5 percent of the armor units within 50 years).
(h.) Conceptual design of the structural parts based on the chosen design levels for failure mode
damage and hydraulic responses (e.g., determination of armor layer block size and crest height
for a breakwater).
(i.) Evaluation of costs of the alternative structures and selection of preferred design(s) for more
detailed analysis and optimization.
( j.) Detailed design including economical optimization and evaluation of the overall safety of thestructure. This stage will involve scale model tests and/or advanced computational analyses
for non-standard and major structures.
(2) Items c and g are closely related to item a, and the failure modes mentioned in item f are dealt with
in Part VI-2-4, “Failure Modes of Typical Structure Types.”
(3) The previous steps are a brief summary of the more detailed flow chart given as Figure V-1-2 in
Part V-1-1. They are the steps most related to actual design of project structure elements. In all steps, the
8/13/2019 CEM PartVI-Chap5p1, Fundamentals of Design
http://slidepdf.com/reader/full/cem-partvi-chap5p1-fundamentals-of-design 18/150
EM 1110-2-1100 (Part VI)Proposed Publishing Date: 30 Apr 03
VI-5-2 Fundamentals of Design
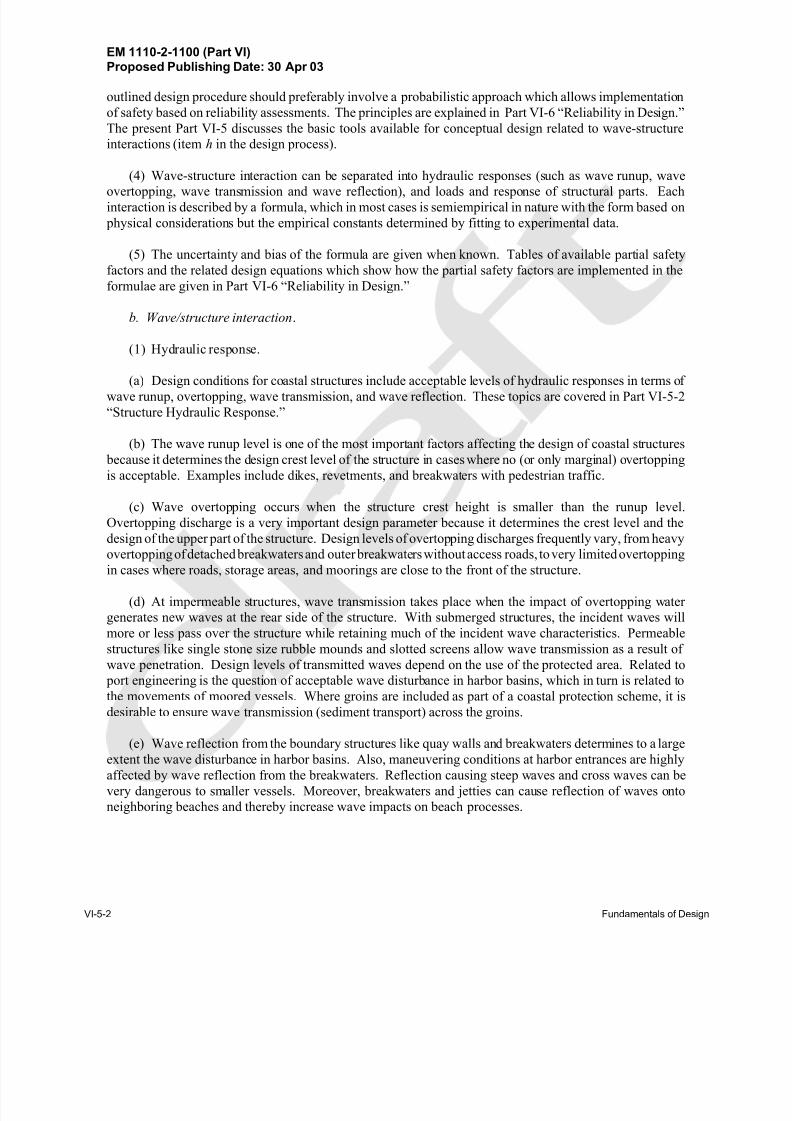
outlined design procedure should preferably involve a probabilistic approach which allows implementation
of safety based on reliability assessments. The principles are explained in Part VI-6 “Reliability in Design.”
The present Part VI-5 discusses the basic tools available for conceptual design related to wave-structure
interactions (item h in the design process).
(4) Wave-structure interaction can be separated into hydraulic responses (such as wave runup, wave
overtopping, wave transmission and wave reflection), and loads and response of structural parts. Eachinteraction is described by a formula, which in most cases is semiempirical in nature with the form based on
physical considerations but the empirical constants determined by fitting to experimental data.
(5) The uncertainty and bias of the formula are given when known. Tables of available partial safety
factors and the related design equations which show how the partial safety factors are implemented in the
formulae are given in Part VI-6 “Reliability in Design.”
b. Wave/structure interaction.
(1) Hydraulic response.
(a) Design conditions for coastal structures include acceptable levels of hydraulic responses in terms of wave runup, overtopping, wave transmission, and wave reflection. These topics are covered in Part VI-5-2
“Structure Hydraulic Response.”
(b) The wave runup level is one of the most important factors affecting the design of coastal structures
because it determines the design crest level of the structure in cases where no (or only marginal) overtopping
is acceptable. Examples include dikes, revetments, and breakwaters with pedestrian traffic.
(c) Wave overtopping occurs when the structure crest height is smaller than the runup level.
Overtopping discharge is a very important design parameter because it determines the crest level and the
design of the upper part of the structure. Design levels of overtopping discharges frequently vary, from heavy
overtopping of detached breakwaters and outer breakwaters without access roads, to very limited overtopping
in cases where roads, storage areas, and moorings are close to the front of the structure.
(d) At impermeable structures, wave transmission takes place when the impact of overtopping water
generates new waves at the rear side of the structure. With submerged structures, the incident waves will
more or less pass over the structure while retaining much of the incident wave characteristics. Permeable
structures like single stone size rubble mounds and slotted screens allow wave transmission as a result of
wave penetration. Design levels of transmitted waves depend on the use of the protected area. Related to
port engineering is the question of acceptable wave disturbance in harbor basins, which in turn is related to
the movements of moored vessels. Where groins are included as part of a coastal protection scheme, it is
desirable to ensure wave transmission (sediment transport) across the groins.
(e) Wave reflection from the boundary structures like quay walls and breakwaters determines to a large
extent the wave disturbance in harbor basins. Also, maneuvering conditions at harbor entrances are highlyaffected by wave reflection from the breakwaters. Reflection causing steep waves and cross waves can be
very dangerous to smaller vessels. Moreover, breakwaters and jetties can cause reflection of waves onto
neighboring beaches and thereby increase wave impacts on beach processes.
8/13/2019 CEM PartVI-Chap5p1, Fundamentals of Design
http://slidepdf.com/reader/full/cem-partvi-chap5p1-fundamentals-of-design 19/150
EM 1110-2-1100 (Part VI)Proposed Publishing Date: 30 Apr 03
Fundamentals of Design VI-5-3
(2) Wave loadings and related structural response.
(a) An important part of the design procedure for structures in general is the determination of the loads
and the related stresses, deformations, and stability conditions of the structural members.
(b) In the case of rubble-mound structures exposed to waves, such procedures cannot be followed
because the wave loading on single stones or blocks cannot be determined by theory, by normal scale modeltests, or by prototype recordings. Instead a black box approach is used in which experiments are used to
establish relationships between certain wave characteristics and the structural response, usually expressed in
terms of armor movements. The related stresses, e.g., in concrete armor blocks, are known only for a few
types of blocks for which special investigations have been performed. Rubble-mound structures are covered
in Part VI-5-3, “Rubble-Mound Structure Loading and Response.”
For vertical-front monolithic structures like breakwater caissons and seawalls it is possible either from theory
or experiments to estimate the wave loadings and subsequently determine stresses, deformations, and stability.
Vertical-front structures are covered in Part VI-5-4, “Vertical-Front Structure Loading and Response.”
VI-5-2. Structure Hydraulic Response
a. Wave runup and rundown on structures.
(1) Introduction.
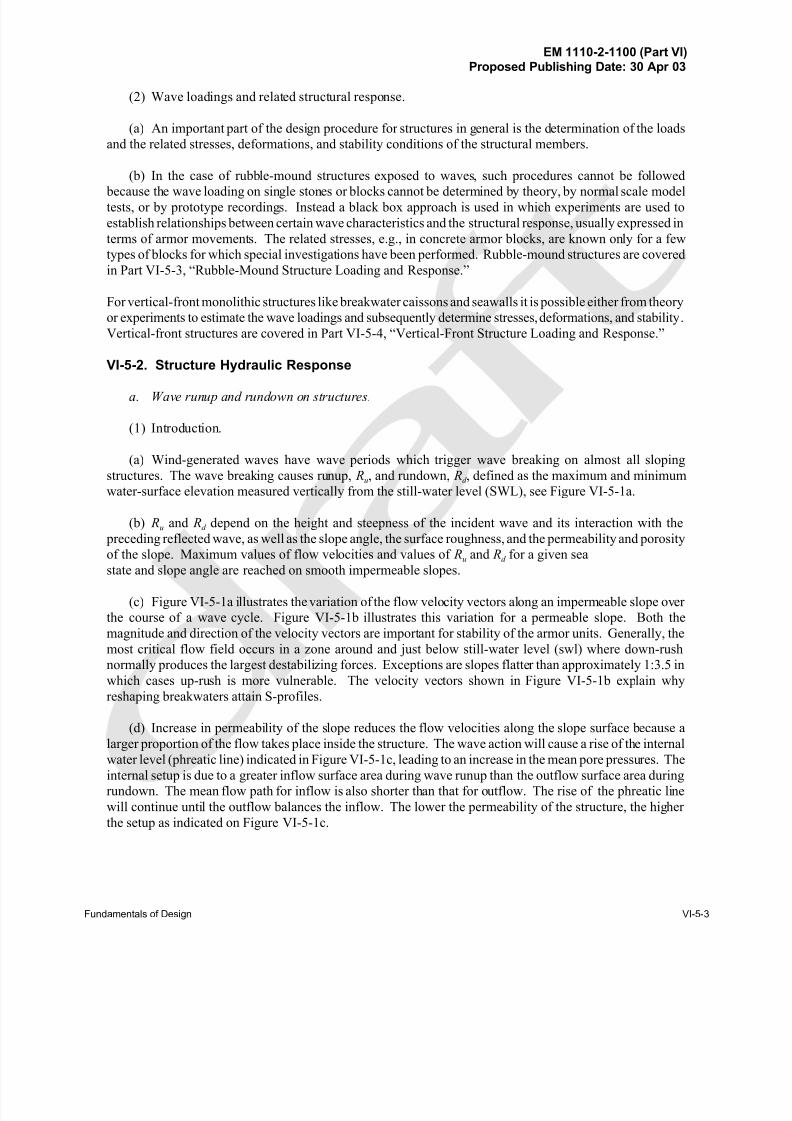
(a) Wind-generated waves have wave periods which trigger wave breaking on almost all sloping
structures. The wave breaking causes runup, Ru, and rundown, Rd , defined as the maximum and minimum
water-surface elevation measured vertically from the still-water level (SWL), see Figure VI-5-1a.
(b) Ru and Rd depend on the height and steepness of the incident wave and its interaction with the
preceding reflected wave, as well as the slope angle, the surface roughness, and the permeability and porosity
of the slope. Maximum values of flow velocities and values of Ru and Rd for a given sea
state and slope angle are reached on smooth impermeable slopes.
(c) Figure VI-5-1a illustrates the variation of the flow velocity vectors along an impermeable slope over
the course of a wave cycle. Figure VI-5-1b illustrates this variation for a permeable slope. Both the
magnitude and direction of the velocity vectors are important for stability of the armor units. Generally, the
most critical flow field occurs in a zone around and just below still-water level (swl) where down-rush
normally produces the largest destabilizing forces. Exceptions are slopes flatter than approximately 1:3.5 in
which cases up-rush is more vulnerable. The velocity vectors shown in Figure VI-5-1b explain why
reshaping breakwaters attain S-profiles.
(d) Increase in permeability of the slope reduces the flow velocities along the slope surface because a
larger proportion of the flow takes place inside the structure. The wave action will cause a rise of the internal
water level (phreatic line) indicated in Figure VI-5-1c, leading to an increase in the mean pore pressures. Theinternal setup is due to a greater inflow surface area during wave runup than the outflow surface area during
rundown. The mean flow path for inflow is also shorter than that for outflow. The rise of the phreatic line
will continue until the outflow balances the inflow. The lower the permeability of the structure, the higher
the setup as indicated on Figure VI-5-1c.
8/13/2019 CEM PartVI-Chap5p1, Fundamentals of Design
http://slidepdf.com/reader/full/cem-partvi-chap5p1-fundamentals-of-design 20/150
EM 1110-2-1100 (Part VI)Proposed Publishing Date: 30 Apr 03
VI-5-4 Fundamentals of Design
Figure VI-5-1. Illustration of runup and rundown (Burcharth 1993)
(e) Barends (1988) suggested practical formulae for calculation of the penetration length and the
maximum average setup which occurs after several cycles. Two cases are considered: a conventional
breakwater structure with open (permeable) rear side, and a structure with a closed (impermeable) rear side.
The latter case causes the largest setup.
8/13/2019 CEM PartVI-Chap5p1, Fundamentals of Design
http://slidepdf.com/reader/full/cem-partvi-chap5p1-fundamentals-of-design 21/150
EM 1110-2-1100 (Part VI)Proposed Publishing Date: 30 Apr 03
Fundamentals of Design VI-5-5
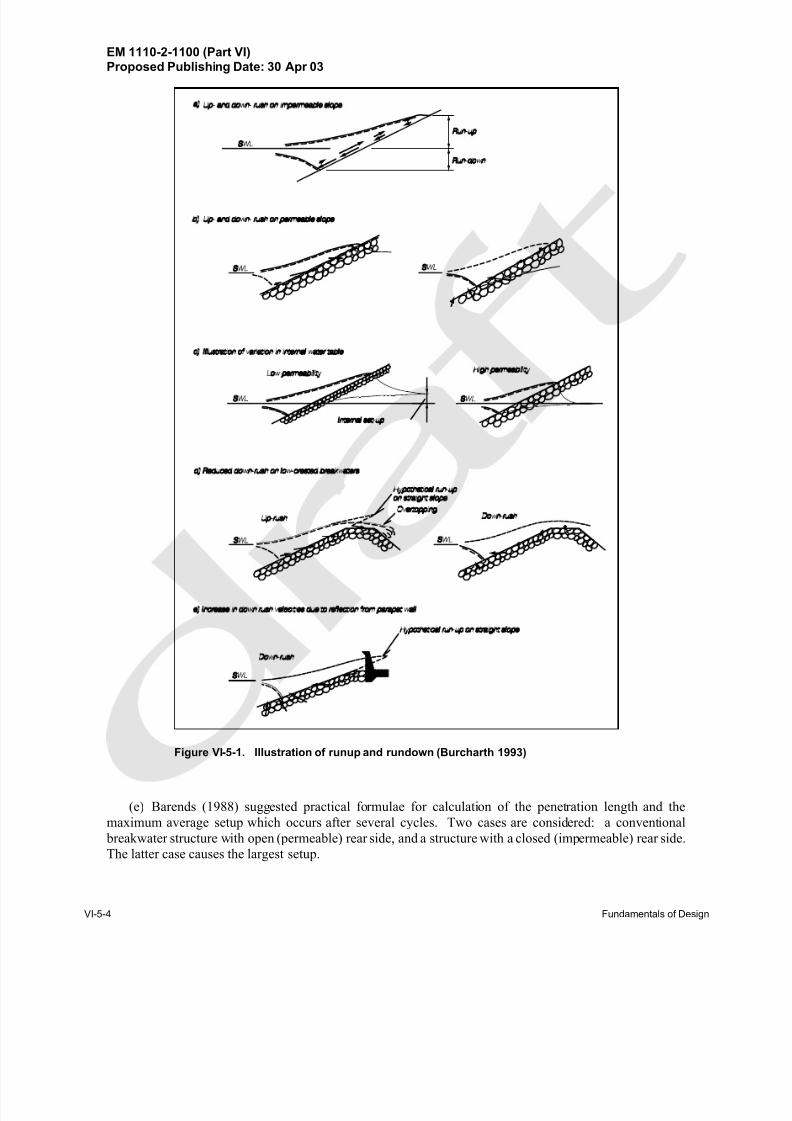
Figure VI-5-2. Typical velocity field for the porous flow in a breakwater. Numerical calculation.
(Barends et al. 1983)
(f) An example of a numerical calculation of the internal flow patterns in a breakwater exposed to regular
waves is shown in Figure VI-5-2. The strong outflow in the zone just below SWL when maximum rundown
occurs is clearly seen.
(g) Increasing structure porosity also reduces the overflow velocities because a larger portion of the
incoming water volume can be stored in the pores which then act as reservoirs. The destabilizing forces on
armor units are thereby reduced. This positive reservoir effect is reduced in the case of a large internal setup
of the water table.
(h) Breakwaters with crest levels lower than the runup level are called low-crested breakwaters.
Although the runup velocities are almost unchanged compared to nonovertopped slopes, the rundown
velocities are reduced due to the overtopping of some part of the incoming wave as seen in Figure VI-5-1d.
Greater overtopping reduces rundown, and thus, lessens the destabilizing flow forces on the armor units.
Parapet walls which cut off the hypothetical runup wedge (shown in Figure VI-5-1e) will increase the
down-rush velocities and thereby increase the destabilizing flow forces on the armor units.
(2) Surf similarity parameter (Iribarren number).
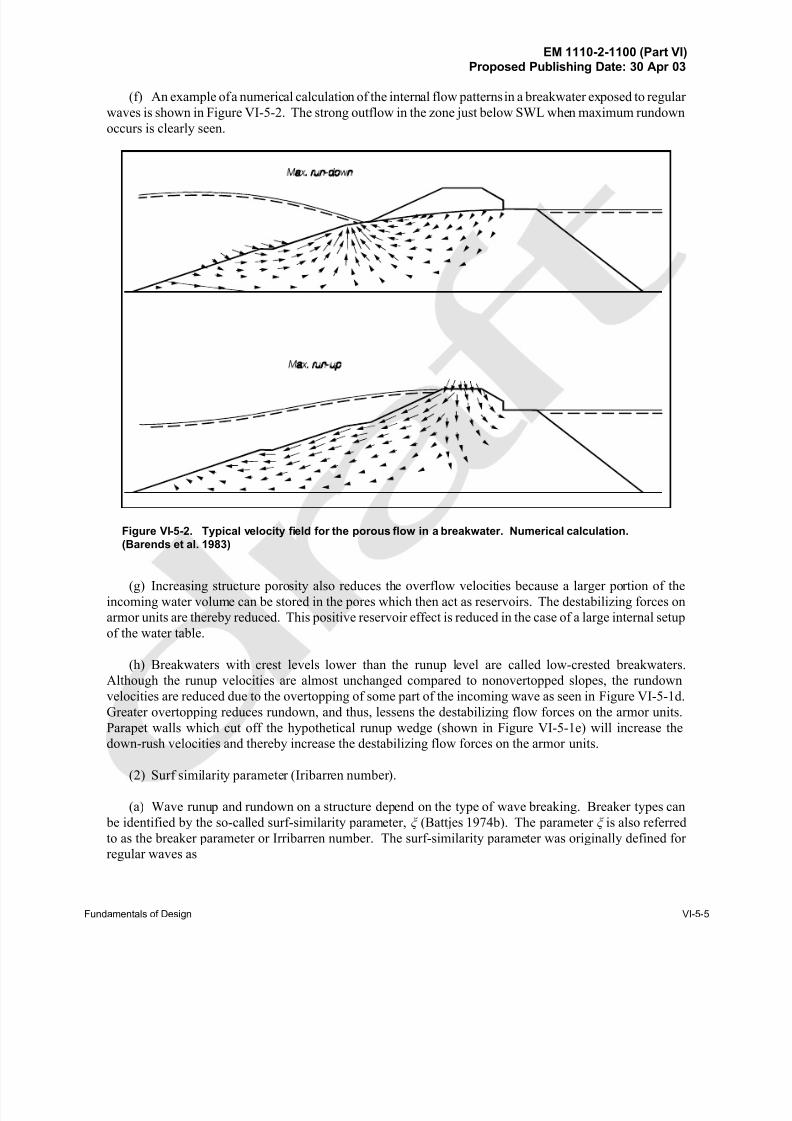
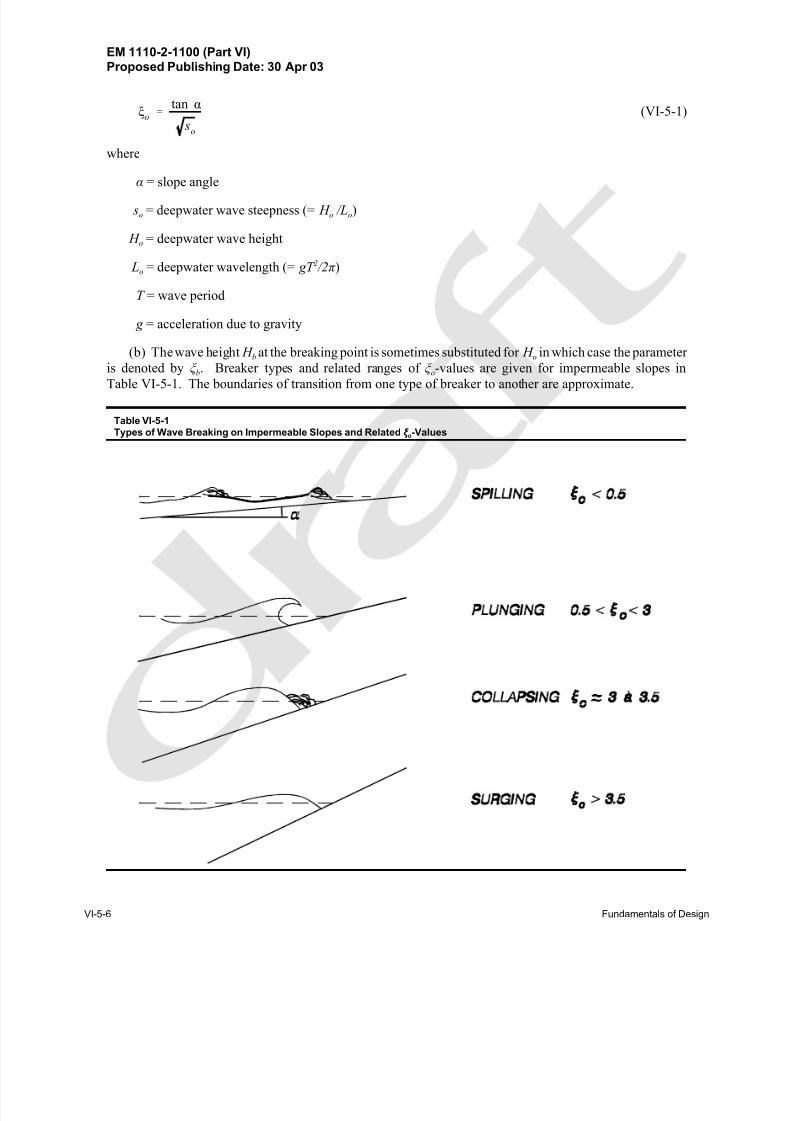
(a) Wave runup and rundown on a structure depend on the type of wave breaking. Breaker types can
be identified by the so-called surf-similarity parameter, ξ (Battjes 1974b). The parameter ξ is also referred
to as the breaker parameter or Irribarren number. The surf-similarity parameter was originally defined for
regular waves as
8/13/2019 CEM PartVI-Chap5p1, Fundamentals of Design
http://slidepdf.com/reader/full/cem-partvi-chap5p1-fundamentals-of-design 22/150
EM 1110-2-1100 (Part VI)Proposed Publishing Date: 30 Apr 03
VI-5-6 Fundamentals of Design
(VI-5-1)ξo '
tan α
so
where
α = slope angle
so = deepwater wave steepness (= H o /Lo)
H o = deepwater wave height
Lo = deepwater wavelength (= gT 2 /2π )
T = wave period
g = acceleration due to gravity
(b) The wave height H b at the breaking point is sometimes substituted for H o in which case the parameter
is denoted by ξ b. Breaker types and related ranges of ξ o-values are given for impermeable slopes in
Table VI-5-1. The boundaries of transition from one type of breaker to another are approximate.
Table VI-5-1Types of Wave Breaking on Impermeable Slopes and Related ξ o-Values
8/13/2019 CEM PartVI-Chap5p1, Fundamentals of Design
http://slidepdf.com/reader/full/cem-partvi-chap5p1-fundamentals-of-design 23/150
EM 1110-2-1100 (Part VI)Proposed Publishing Date: 30 Apr 03
Fundamentals of Design VI-5-7
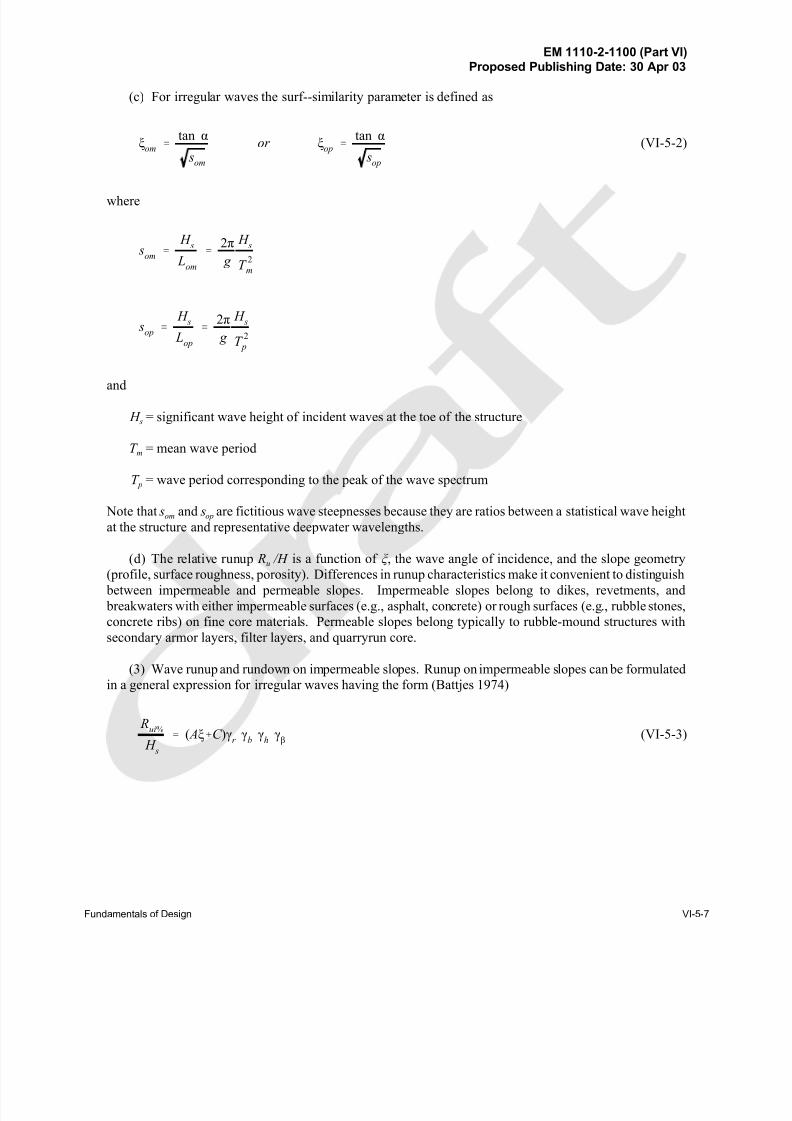
(c) For irregular waves the surf--similarity parameter is defined as
(VI-5-2)ξom
'tan α
som
or ξop '
tan α
sop
where
som
'
H s
Lom
'2π
g
H s
T 2
m
sop '
H s
Lop
'2π
g
H s
T 2
p
and
H s = significant wave height of incident waves at the toe of the structure
T m = mean wave period
T p = wave period corresponding to the peak of the wave spectrum
Note that som and sop are fictitious wave steepnesses because they are ratios between a statistical wave height
at the structure and representative deepwater wavelengths.
(d) The relative runup Ru /H is a function of ξ , the wave angle of incidence, and the slope geometry
(profile, surface roughness, porosity). Differences in runup characteristics make it convenient to distinguish
between impermeable and permeable slopes. Impermeable slopes belong to dikes, revetments, and
breakwaters with either impermeable surfaces (e.g., asphalt, concrete) or rough surfaces (e.g., rubble stones,
concrete ribs) on fine core materials. Permeable slopes belong typically to rubble-mound structures with
secondary armor layers, filter layers, and quarryrun core.
(3) Wave runup and rundown on impermeable slopes. Runup on impermeable slopes can be formulated
in a general expression for irregular waves having the form (Battjes 1974)
(VI-5-3) R
ui%
H s
' ( Aξ%C )γr γ
b γ
h γ
β
8/13/2019 CEM PartVI-Chap5p1, Fundamentals of Design
http://slidepdf.com/reader/full/cem-partvi-chap5p1-fundamentals-of-design 24/150
EM 1110-2-1100 (Part VI)Proposed Publishing Date: 30 Apr 03
VI-5-8 Fundamentals of Design
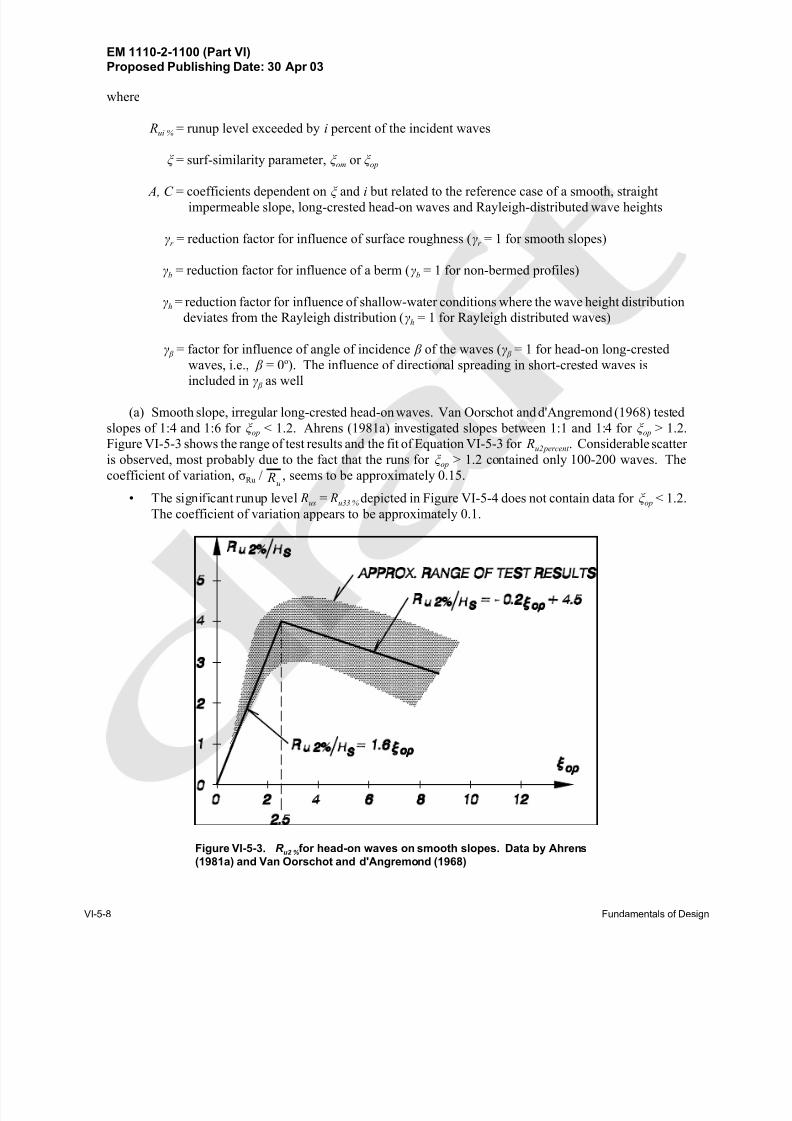
Figure VI-5-3. R u2 %for head-on waves on smooth slopes. Data by Ahrens
(1981a) and Van Oorschot and d'Angremond (1968)
where
Rui % = runup level exceeded by i percent of the incident waves
ξ = surf-similarity parameter, ξ om or ξ op
A, C = coefficients dependent on ξ and i but related to the reference case of a smooth, straight impermeable slope, long-crested head-on waves and Rayleigh-distributed wave heights
γr = reduction factor for influence of surface roughness (γr = 1 for smooth slopes)
γb = reduction factor for influence of a berm (γb = 1 for non-bermed profiles)
γh = reduction factor for influence of shallow-water conditions where the wave height distribution
deviates from the Rayleigh distribution (γh = 1 for Rayleigh distributed waves)
γ β = factor for influence of angle of incidence β of the waves (γ β = 1 for head-on long-crested
waves, i.e., β = 0o). The influence of directional spreading in short-crested waves is
included in γ β as well
(a) Smooth slope, irregular long-crested head-on waves. Van Oorschot and d'Angremond (1968) tested
slopes of 1:4 and 1:6 for ξ op < 1.2. Ahrens (1981a) investigated slopes between 1:1 and 1:4 for ξ op > 1.2.
Figure VI-5-3 shows the range of test results and the fit of Equation VI-5-3 for Ru2 percent . Considerable scatter
is observed, most probably due to the fact that the runs for ξ op > 1.2 contained only 100-200 waves. The
coefficient of variation, σRu / , seems to be approximately 0.15. Ru
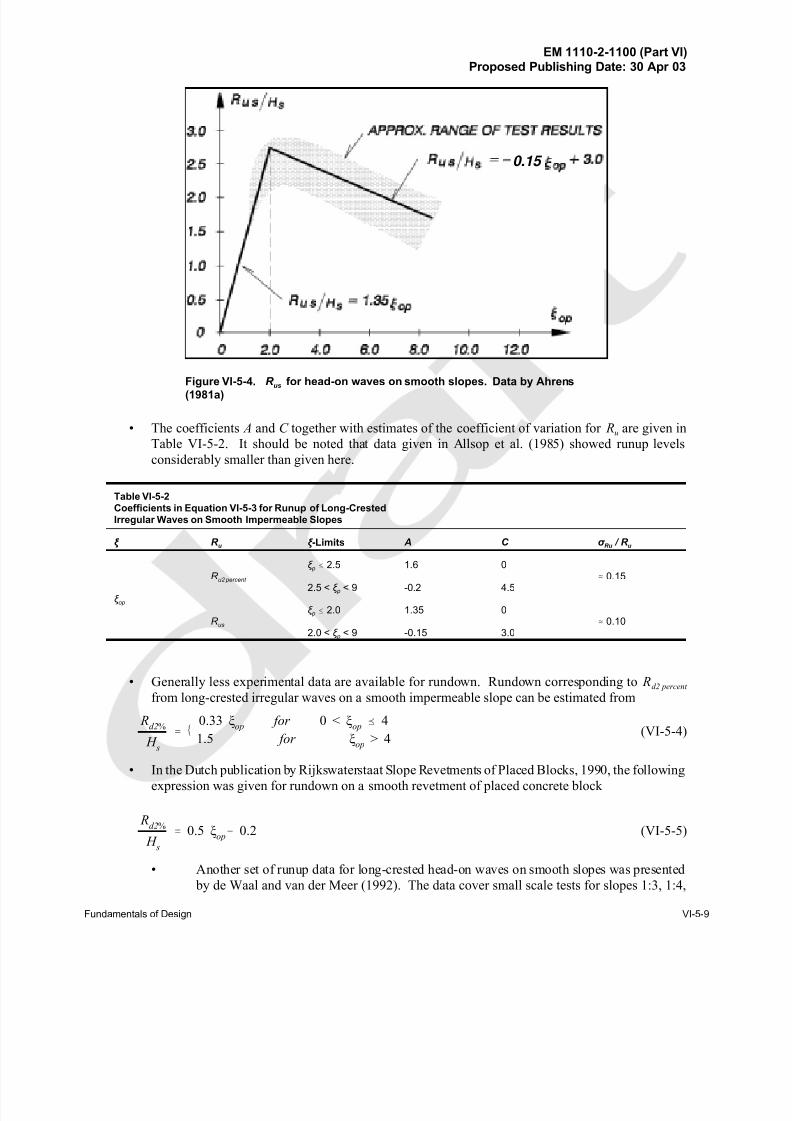
• The significant runup level Rus = Ru33 % depicted in Figure VI-5-4 does not contain data for ξ op < 1.2.
The coefficient of variation appears to be approximately 0.1.
8/13/2019 CEM PartVI-Chap5p1, Fundamentals of Design
http://slidepdf.com/reader/full/cem-partvi-chap5p1-fundamentals-of-design 25/150
EM 1110-2-1100 (Part VI)Proposed Publishing Date: 30 Apr 03
Fundamentals of Design VI-5-9
0.15
Figure VI-5-4. R us for head-on waves on smooth slopes. Data by Ahrens(1981a)
• The coefficients A and C together with estimates of the coefficient of variation for Ru are given in
Table VI-5-2. It should be noted that data given in Allsop et al. (1985) showed runup levels
considerably smaller than given here.
Table VI-5-2Coefficients in Equation VI-5-3 for Runup of Long-CrestedIrregular Waves on Smooth Impermeable Slopes
ξ R u ξ -Limits A C σ Ru / R u
ξ op
R u2 percent ξ p
#
2.5
2.5 < ξ p < 9
1.6
-0.2
0
4.5. 0.15
R us
ξ p # 2.0
2.0 < ξ p < 9
1.35
-0.15
0
3.0. 0.10
• Generally less experimental data are available for rundown. Rundown corresponding to Rd2 percent
from long-crested irregular waves on a smooth impermeable slope can be estimated from
(VI-5-4) R
d2%
H s
' 60.33 ξ
op for 0 < ξ
op ˜ 4
1.5 for ξop
> 4
• In the Dutch publication by Rijkswaterstaat Slope Revetments of Placed Blocks, 1990, the following
expression was given for rundown on a smooth revetment of placed concrete block
(VI-5-5) R
d2%
H s
' 0.5 ξop& 0.2
• Another set of runup data for long-crested head-on waves on smooth slopes was presented
by de Waal and van der Meer (1992). The data cover small scale tests for slopes 1:3, 1:4,
8/13/2019 CEM PartVI-Chap5p1, Fundamentals of Design
http://slidepdf.com/reader/full/cem-partvi-chap5p1-fundamentals-of-design 26/150
EM 1110-2-1100 (Part VI)Proposed Publishing Date: 30 Apr 03
VI-5-10 Fundamentals of Design
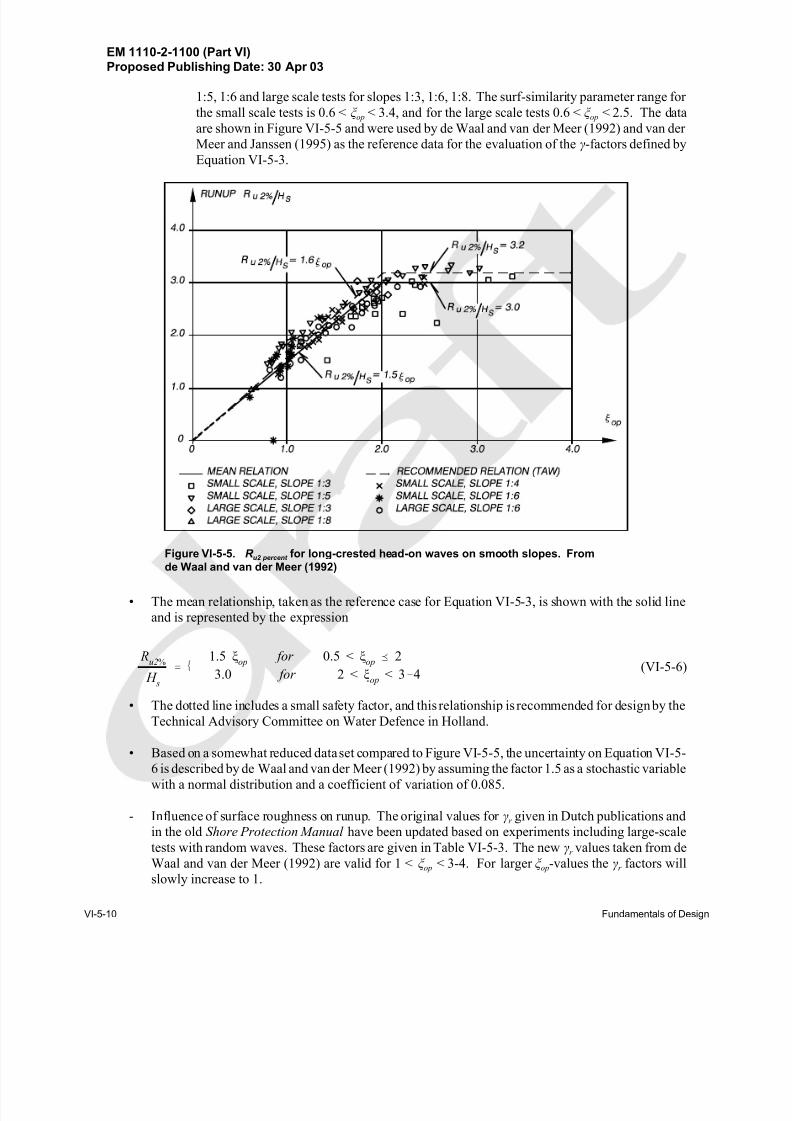
Figure VI-5-5. R u2 percent for long-crested head-on waves on smooth slopes. From
de Waal and van der Meer (1992)
1:5, 1:6 and large scale tests for slopes 1:3, 1:6, 1:8. The surf-similarity parameter range for
the small scale tests is 0.6 < ξ op < 3.4, and for the large scale tests 0.6 < ξ op < 2.5. The data
are shown in Figure VI-5-5 and were used by de Waal and van der Meer (1992) and van der
Meer and Janssen (1995) as the reference data for the evaluation of the γ-factors defined by
Equation VI-5-3.
• The mean relationship, taken as the reference case for Equation VI-5-3, is shown with the solid line
and is represented by the expression
(VI-5-6) R
u2%
H s
' 61.5 ξ
op for 0.5 < ξ
op ˜ 2
3.0 for 2 < ξop
< 3&4
• The dotted line includes a small safety factor, and this relationship is recommended for design by the
Technical Advisory Committee on Water Defence in Holland.
• Based on a somewhat reduced data set compared to Figure VI-5-5, the uncertainty on Equation VI-5-6 is described by de Waal and van der Meer (1992) by assuming the factor 1.5 as a stochastic variable
with a normal distribution and a coefficient of variation of 0.085.
- Influence of surface roughness on runup. The original values for γr given in Dutch publications and
in the old Shore Protection Manual have been updated based on experiments including large-scale
tests with random waves. These factors are given in Table VI-5-3. The new γr values taken from de
Waal and van der Meer (1992) are valid for 1 < ξ op < 3-4. For larger ξ op-values the γr factors will
slowly increase to 1.
8/13/2019 CEM PartVI-Chap5p1, Fundamentals of Design
http://slidepdf.com/reader/full/cem-partvi-chap5p1-fundamentals-of-design 27/150
EM 1110-2-1100 (Part VI)Proposed Publishing Date: 30 Apr 03
Fundamentals of Design VI-5-11
Figure VI-5-6. Parameters in berm test program at Delft Hydraulics
Table VI-5-3
Surface Roughness Reduction Factor γ r in Equation VI-5-3, Valid for 1 < ξ op < 3-4
Type of Slope Surface γ r
Smooth, concrete, asphaltSmooth block revetmentGrass (3 cm length)
1 layer of rock, diameter D, (H s /D = 1.5 - 3.0)2 or more layers of rock, (H
s /D = 1.5 - 6.0)
1.01.00.90 - 1.0
0.55 - 0.60.50 - 0.55
Roughness elements on smooth surface(length parallel to waterline = R , width = b, height = h)
Quadratic blocks, R = b
h/b b/H s area coverage
0.88 0.12 - 0.19 1/90.88 0.12 - 0.24 1/250.44 0.12 - 0.24 1/250.88 0.12 - 0.18 1/25 (above SWL)0.18 0.55 - 1.10 1/4
Ribs
1.00 0.12 - 0.19 1/7.5
0.70 - 0.750.75 - 0.850.85 - 0.950.85 - 0.950.75 - 0.85
0.60 - 0.70
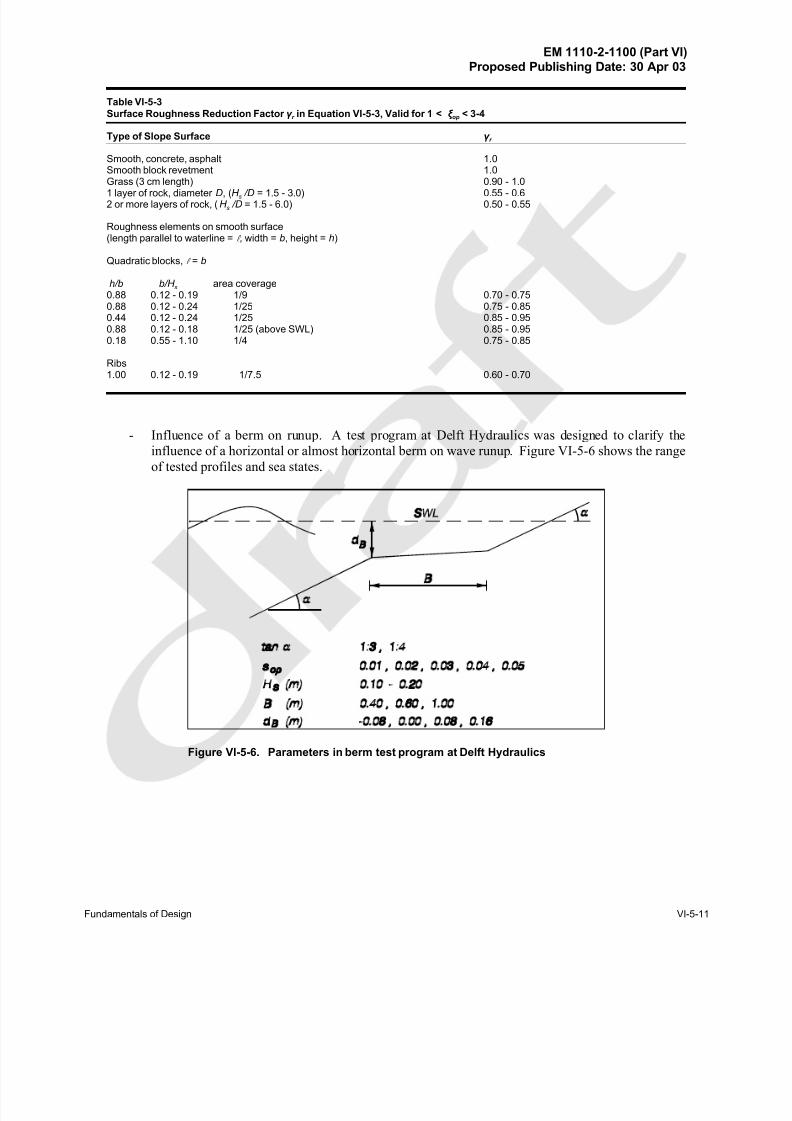
- Influence of a berm on runup. A test program at Delft Hydraulics was designed to clarify the
influence of a horizontal or almost horizontal berm on wave runup. Figure VI-5-6 shows the range
of tested profiles and sea states.
8/13/2019 CEM PartVI-Chap5p1, Fundamentals of Design
http://slidepdf.com/reader/full/cem-partvi-chap5p1-fundamentals-of-design 28/150
EM 1110-2-1100 (Part VI)Proposed Publishing Date: 30 Apr 03
VI-5-12 Fundamentals of Design
Figure VI-5-7. Definition of α eq and α in Equation VI-5-9
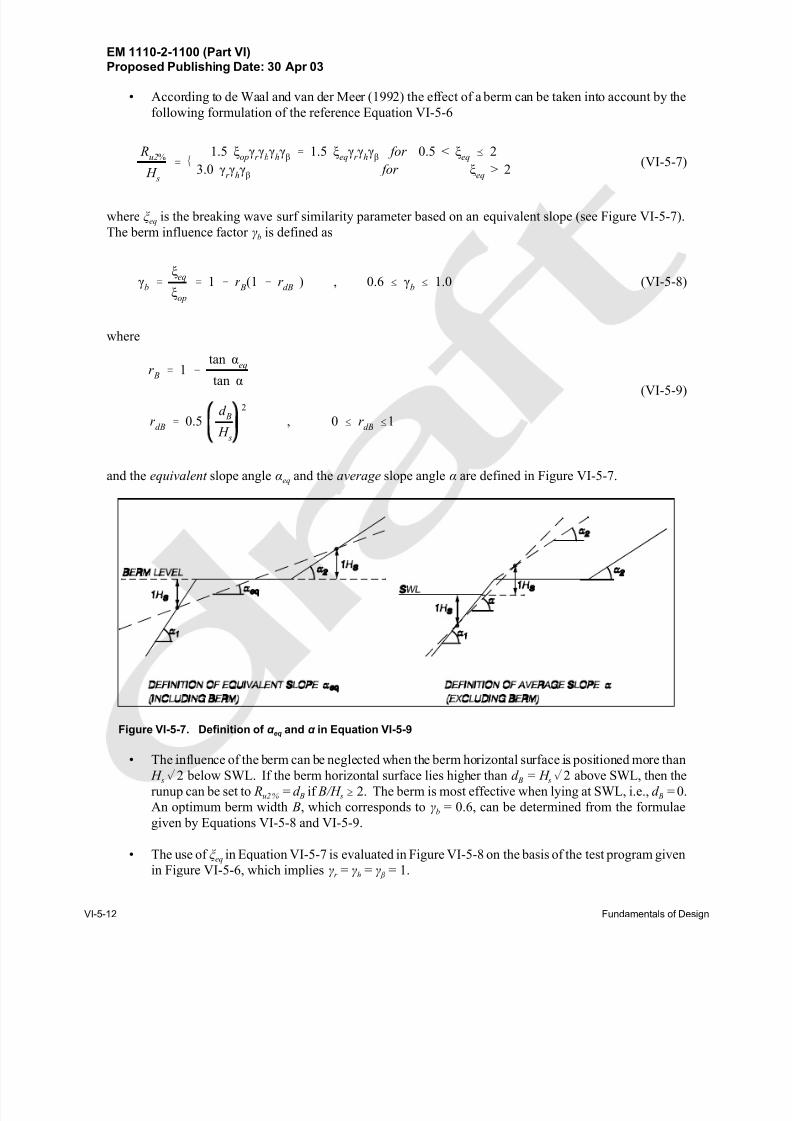
• According to de Waal and van der Meer (1992) the effect of a berm can be taken into account by the
following formulation of the reference Equation VI-5-6
(VI-5-7) R
u2%
H s
' 61.5 ξ
opγ
r γ
bγ
hγβ ' 1.5 ξ
eqγ
r γ
hγβ
for 0.5 < ξeq ˜
2
3.0 γr γ
hγβ
for ξeq
> 2
where ξ eq is the breaking wave surf similarity parameter based on an equivalent slope (see Figure VI-5-7).
The berm influence factor γb is defined as
(VI-5-8)γb '
ξeq
ξop
' 1 & r B
(1 & r dB
) , 0.6 # γb #
1.0
where
(VI-5-9)
r B
' 1 &
tan αeq
tan α
r dB ' 0.5
d B
H s
2
, 0 # r dB #1
and the equivalent slope angle αeq and the average slope angle α are defined in Figure VI-5-7.
• The influence of the berm can be neglected when the berm horizontal surface is positioned more than H s % 2$ below SWL. If the berm horizontal surface lies higher than d B = H s %2$ above SWL, then the
runup can be set to Ru2 % = d B if B/H s $ 2. The berm is most effective when lying at SWL, i.e., d B = 0.
An optimum berm width B, which corresponds to γb = 0.6, can be determined from the formulae
given by Equations VI-5-8 and VI-5-9.
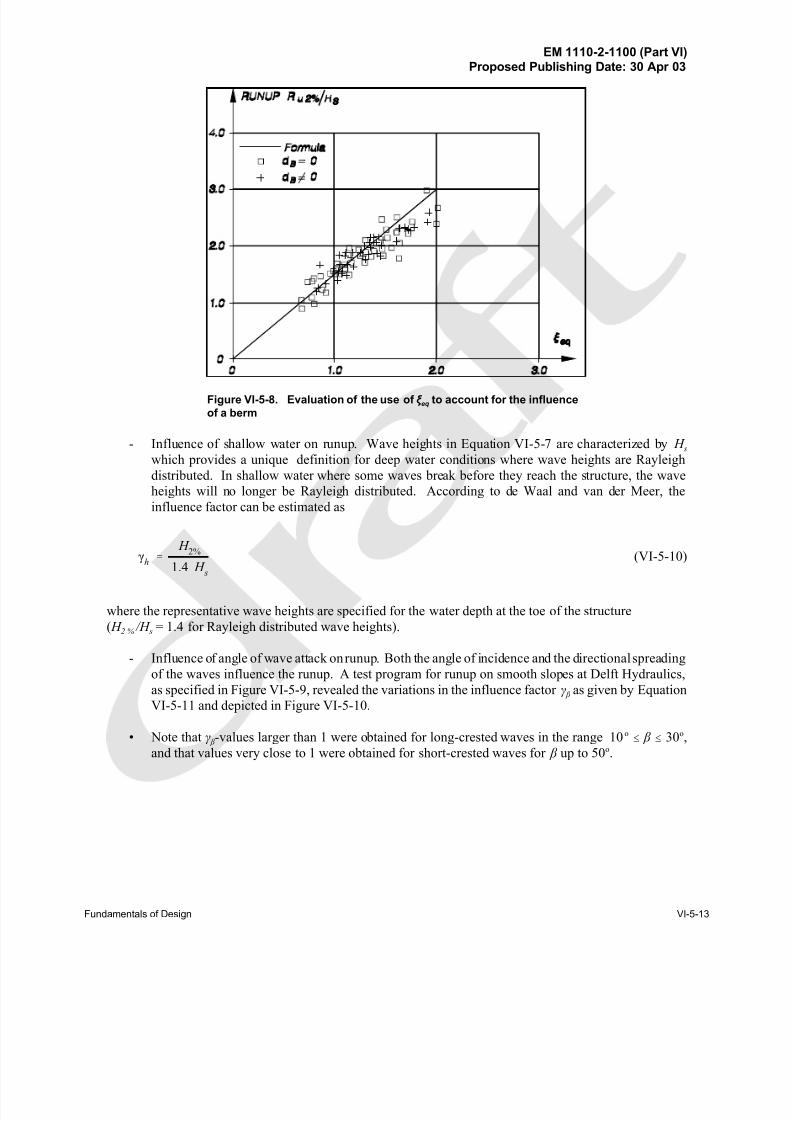
• The use of ξ eq in Equation VI-5-7 is evaluated in Figure VI-5-8 on the basis of the test program given
in Figure VI-5-6, which implies γr = γh = γ β = 1.
8/13/2019 CEM PartVI-Chap5p1, Fundamentals of Design
http://slidepdf.com/reader/full/cem-partvi-chap5p1-fundamentals-of-design 29/150
EM 1110-2-1100 (Part VI)Proposed Publishing Date: 30 Apr 03
Fundamentals of Design VI-5-13
Figure VI-5-8. Evaluation of the use of ξ eq to account for the influence
of a berm
- Influence of shallow water on runup. Wave heights in Equation VI-5-7 are characterized by H swhich provides a unique definition for deep water conditions where wave heights are Rayleigh
distributed. In shallow water where some waves break before they reach the structure, the wave
heights will no longer be Rayleigh distributed. According to de Waal and van der Meer, the
influence factor can be estimated as
(VI-5-10)γh '
H 2%
1.4 H s
where the representative wave heights are specified for the water depth at the toe of the structure
( H 2 % /H s = 1.4 for Rayleigh distributed wave heights).
- Influence of angle of wave attack on runup. Both the angle of incidence and the directional spreading
of the waves influence the runup. A test program for runup on smooth slopes at Delft Hydraulics,
as specified in Figure VI-5-9, revealed the variations in the influence factor γ β as given by Equation
VI-5-11 and depicted in Figure VI-5-10.
• Note that γ β -values larger than 1 were obtained for long-crested waves in the range 10o # β # 30o,
and that values very close to 1 were obtained for short-crested waves for β up to 50o
.
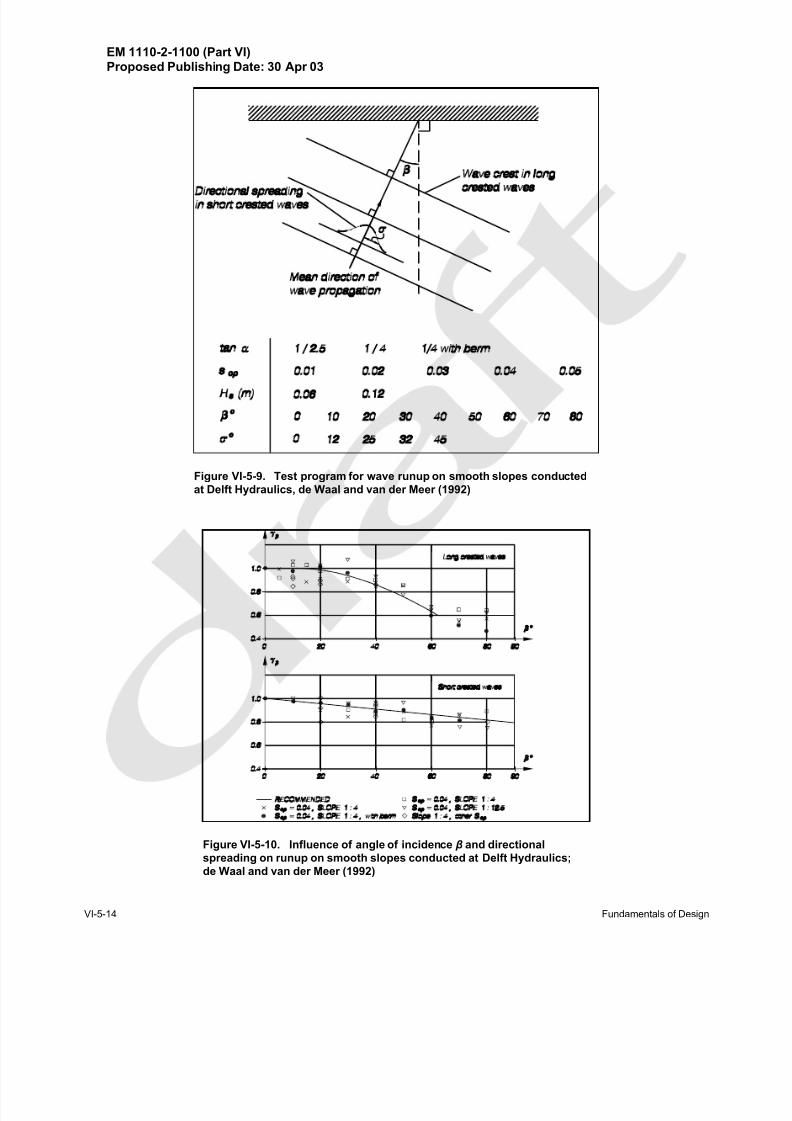
8/13/2019 CEM PartVI-Chap5p1, Fundamentals of Design
http://slidepdf.com/reader/full/cem-partvi-chap5p1-fundamentals-of-design 30/150
EM 1110-2-1100 (Part VI)Proposed Publishing Date: 30 Apr 03
VI-5-14 Fundamentals of Design
Figure VI-5-9. Test program for wave runup on smooth slopes conducted
at Delft Hydraulics, de Waal and van der Meer (1992)
Figure VI-5-10. Influence of angle of incidence β and directional
spreading on runup on smooth slopes conducted at Delft Hydraulics;
de Waal and van der Meer (1992)
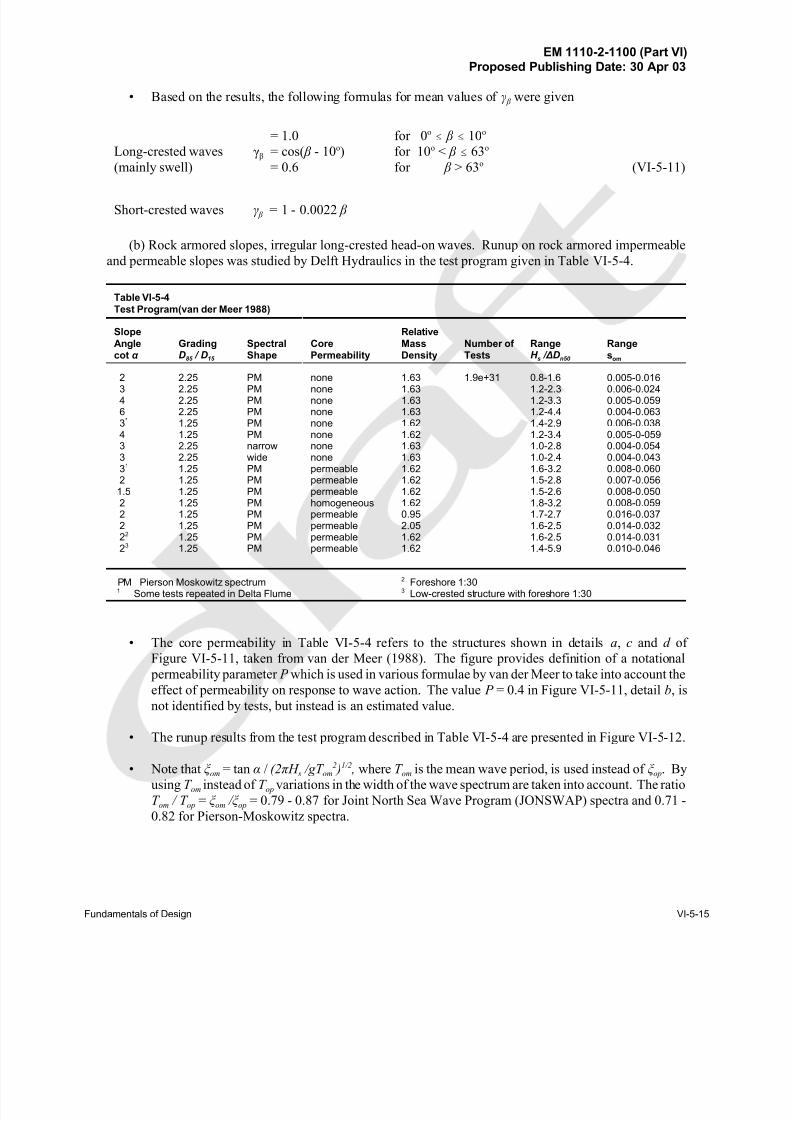
8/13/2019 CEM PartVI-Chap5p1, Fundamentals of Design
http://slidepdf.com/reader/full/cem-partvi-chap5p1-fundamentals-of-design 31/150
EM 1110-2-1100 (Part VI)Proposed Publishing Date: 30 Apr 03
Fundamentals of Design VI-5-15
• Based on the results, the following formulas for mean values of γ β were given
Long-crested waves
(mainly swell)
= 1.0
γβ = cos( β - 10o)
= 0.6
for 0o # β # 10o
for 10o < β # 63o
for β > 63o (VI-5-11)
Short-crested waves γ β = 1 - 0.0022 β
(b) Rock armored slopes, irregular long-crested head-on waves. Runup on rock armored impermeable
and permeable slopes was studied by Delft Hydraulics in the test program given in Table VI-5-4.
Table VI-5-4
Test Program(van der Meer 1988)
Slope
Anglecot α
GradingD85 / D15
SpectralShape
CorePermeability
Relative
MassDensity
Number of Tests
RangeH s / ∆Dn50
Rangesom
2 3 4 6 3*
4 3 3 31
2 1.5 2 2 2 22
23
2.252.252.252.251.251.252.252.251.251.251.251.251.251.251.251.25
PMPMPMPMPMPMnarrowwidePMPMPMPMPMPMPMPM
nonenonenonenonenonenonenonenonepermeablepermeablepermeablehomogeneouspermeablepermeablepermeablepermeable
1.631.631.631.631.621.621.631.631.621.621.621.620.952.051.621.62
1.9e+31 0.8-1.61.2-2.31.2-3.31.2-4.41.4-2.91.2-3.41.0-2.81.0-2.41.6-3.21.5-2.81.5-2.61.8-3.21.7-2.71.6-2.51.6-2.51.4-5.9
0.005-0.0160.006-0.0240.005-0.0590.004-0.0630.006-0.0380.005-0-0590.004-0.0540.004-0.0430.008-0.0600.007-0.0560.008-0.0500.008-0.0590.016-0.0370.014-0.0320.014-0.0310.010-0.046
PM Pierson Moskowitz spectrum 1 Some tests repeated in Delta Flume
2 Foreshore 1:303 Low-crested structure with foreshore 1:30
• The core permeability in Table VI-5-4 refers to the structures shown in details a, c and d of
Figure VI-5-11, taken from van der Meer (1988). The figure provides definition of a notational
permeability parameter P which is used in various formulae by van der Meer to take into account the
effect of permeability on response to wave action. The value P = 0.4 in Figure VI-5-11, detail b, is
not identified by tests, but instead is an estimated value.
• The runup results from the test program described in Table VI-5-4 are presented in Figure VI-5-12.
• Note that ξ om = tan α / (2π H s /gT om2 )1/2 , where T om is the mean wave period, is used instead of ξ op. By
using T om instead of T op variations in the width of the wave spectrum are taken into account. The ratio
T om / T op = ξ om / ξ op = 0.79 - 0.87 for Joint North Sea Wave Program (JONSWAP) spectra and 0.71 -
0.82 for Pierson-Moskowitz spectra.
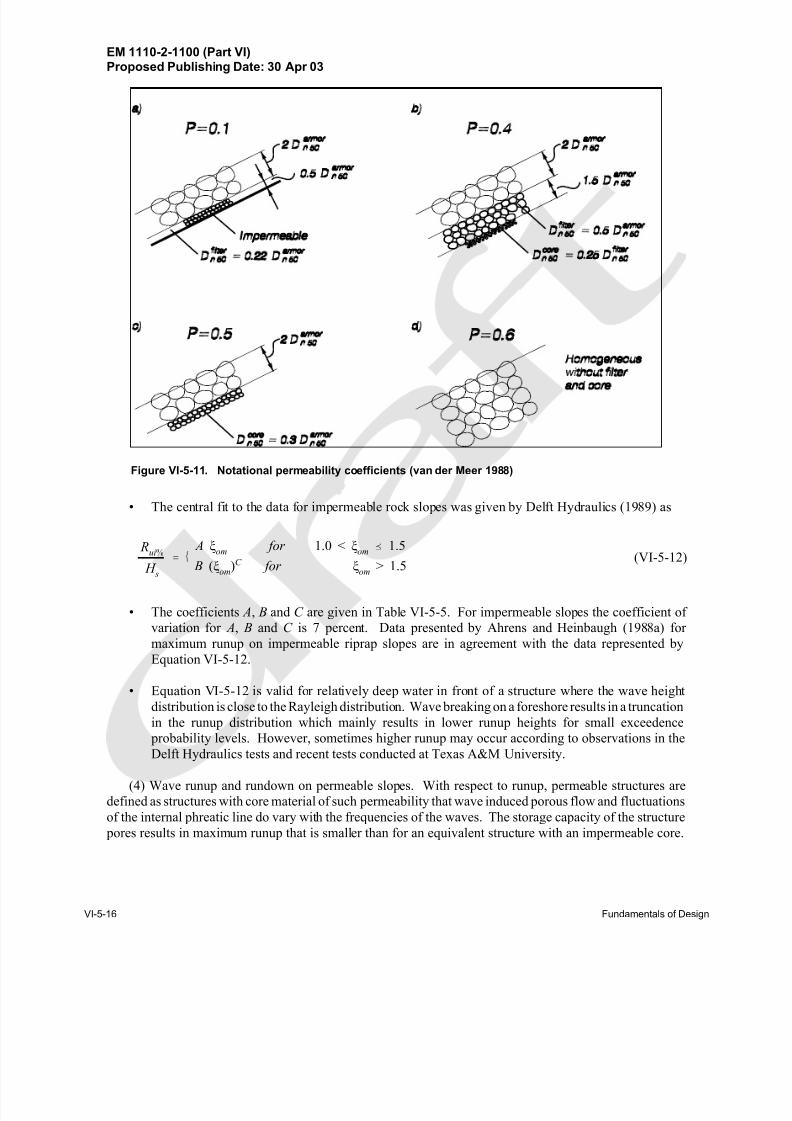
8/13/2019 CEM PartVI-Chap5p1, Fundamentals of Design
http://slidepdf.com/reader/full/cem-partvi-chap5p1-fundamentals-of-design 32/150
EM 1110-2-1100 (Part VI)Proposed Publishing Date: 30 Apr 03
VI-5-16 Fundamentals of Design
Figure VI-5-11. Notational permeability coefficients (van der Meer 1988)
• The central fit to the data for impermeable rock slopes was given by Delft Hydraulics (1989) as
(VI-5-12) R
ui%
H s' 6
A ξom
for 1.0 < ξom
˜ 1.5
B (ξom)C
for ξom > 1.5
• The coefficients A, B and C are given in Table VI-5-5. For impermeable slopes the coefficient of
variation for A, B and C is 7 percent. Data presented by Ahrens and Heinbaugh (1988a) for
maximum runup on impermeable riprap slopes are in agreement with the data represented by
Equation VI-5-12.
• Equation VI-5-12 is valid for relatively deep water in front of a structure where the wave height
distribution is close to the Rayleigh distribution. Wave breaking on a foreshore results in a truncation
in the runup distribution which mainly results in lower runup heights for small exceedence
probability levels. However, sometimes higher runup may occur according to observations in the
Delft Hydraulics tests and recent tests conducted at Texas A&M University.
(4) Wave runup and rundown on permeable slopes. With respect to runup, permeable structures are
defined as structures with core material of such permeability that wave induced porous flow and fluctuations
of the internal phreatic line do vary with the frequencies of the waves. The storage capacity of the structure
pores results in maximum runup that is smaller than for an equivalent structure with an impermeable core.
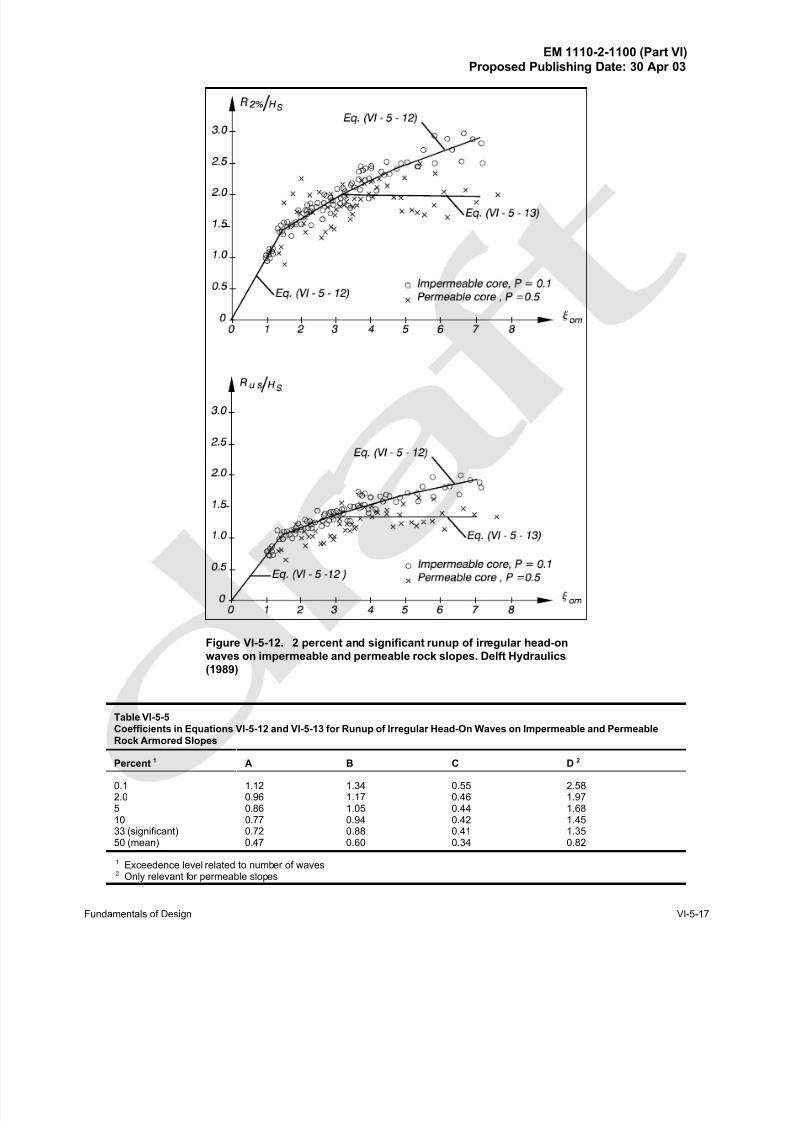
8/13/2019 CEM PartVI-Chap5p1, Fundamentals of Design
http://slidepdf.com/reader/full/cem-partvi-chap5p1-fundamentals-of-design 33/150
EM 1110-2-1100 (Part VI)Proposed Publishing Date: 30 Apr 03
Fundamentals of Design VI-5-17
Figure VI-5-12. 2 percent and significant runup of irregular head-on
waves on impermeable and permeable rock slopes. Delft Hydraulics
(1989)
Table VI-5-5Coefficients in Equations VI-5-12 and VI-5-13 for Runup of Irregular Head-On Waves on Impermeable and Permeable
Rock Armored Slopes
Percent 1 A B C D 2
0.12.051033 (significant)50 (mean)
1.120.960.860.770.720.47
1.341.171.050.940.880.60
0.550.460.440.420.410.34
2.581.971.681.451.350.82
1 Exceedence level related to number of waves 2 Only relevant for permeable slopes
8/13/2019 CEM PartVI-Chap5p1, Fundamentals of Design
http://slidepdf.com/reader/full/cem-partvi-chap5p1-fundamentals-of-design 34/150
EM 1110-2-1100 (Part VI)Proposed Publishing Date: 30 Apr 03
VI-5-18 Fundamentals of Design
(a) Rock armored slopes, irregular long-crested head-on waves. Rock armored permeable slopes with
notational permeability P = 0.5, as shown in detail c of Figure VI-5-11, were tested in irregular head-on
waves by Delft Hydraulics in the program specified in Table VI-5-4. The results are shown in
Figure VI-5-12, and the corresponding equation for the central fit to the data is given by
Rui % /H s = A ξ om = B ( ξ om )
C
= D
for 1.0 < ξ om #
1.5for 1.5 < ξ om # (D/B)1/C
for (D/B)1/C # ξ om < 7.5
(VI-5-13)
• The coefficients A, B, C and D are listed in Table VI-5-5. For permeable structures the coefficient
of variation for A, B, C and D is 12 percent. Tests with homogeneous rock structures with notational
permeability P = 0.6, as shown in detail d of Figure VI-5-11, showed results almost similar to the test
results corresponding to P = 0.5 as shown in Figure VI-5-12.
• Equation VI-5-13 is valid for relatively deepwater conditions with wave height distributions close
to a Rayleigh distribution. Wave breaking due to depth limitations in front of the structure cause
truncation of the runup distribution and thereby lower runup heights for small exceedence probability
levels. However, higher runup might also occur according to observations in the Delft Hydraulicstests, van der Meer and Stam (1992). The influence on runup for the shallow-water conditions
included in the test program given in Table VI-5-4 were investigated for the rock armored permeable
slope. However, no systematic deviations from Equation VI-5-13 were observed.
(b) Statistical distribution of runup. The runup of waves with approximately Rayleigh distributed wave
heights on rock armored permeable slopes with tan α $ 2 were characterized by van der Meer and Stam
(1992) with a best-fit two-parameter Weibull distribution as follows:
or (VI-5-14) Prob ( Ru
> Rup%
) ' exp &
Rup%
B
C
(VI-5-15) Rup%
' B (&ln p)1/C
where
Rup % = Runup level exceeded by p % of the runup
(VI-5-16) B ' H s[0.4 ( s
om)&1/4 (cot α)&0.2]
(VI-5-17)C ' 63.0(ξ
om)&3/4 for ξ
om ˜ ξomc
( plunging waves)
0.52 P &0.3(ξom
) P cot α for ξom
> ξomc
( surging waves)
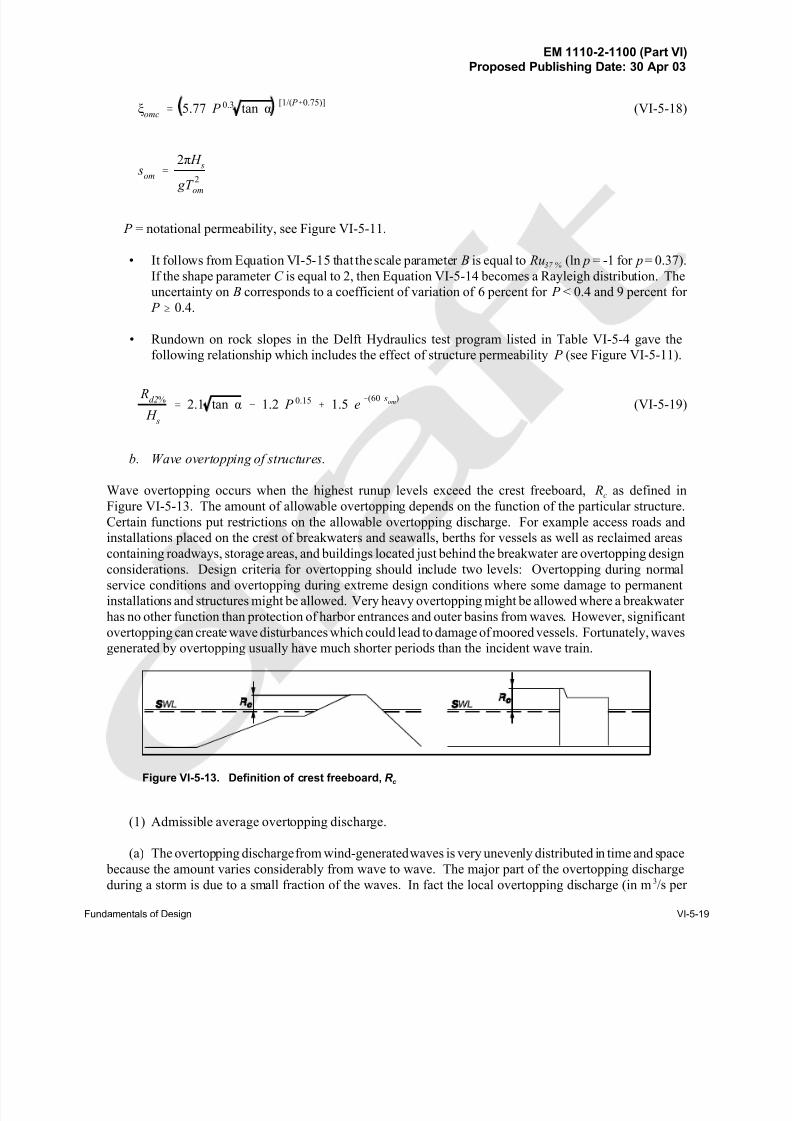
8/13/2019 CEM PartVI-Chap5p1, Fundamentals of Design
http://slidepdf.com/reader/full/cem-partvi-chap5p1-fundamentals-of-design 35/150
EM 1110-2-1100 (Part VI)Proposed Publishing Date: 30 Apr 03
Fundamentals of Design VI-5-19
Figure VI-5-13. Definition of crest freeboard, R c
(VI-5-18)ξomc
' 5.77 P 0.3 tan α[1/( P %0.75)]
som
'
2π H s
gT
2
om
P = notational permeability, see Figure VI-5-11.
• It follows from Equation VI-5-15 that the scale parameter B is equal to Ru37 % (ln p = -1 for p = 0.37).
If the shape parameter C is equal to 2, then Equation VI-5-14 becomes a Rayleigh distribution. The
uncertainty on B corresponds to a coefficient of variation of 6 percent for P < 0.4 and 9 percent for
P $ 0.4.
• Rundown on rock slopes in the Delft Hydraulics test program listed in Table VI-5-4 gave the
following relationship which includes the effect of structure permeability P (see Figure VI-5-11).
(VI-5-19) R
d2%
H s
' 2.1 tan α & 1.2 P 0.15% 1.5 e
&(60 som)
b. Wave overtopping of structures.
Wave overtopping occurs when the highest runup levels exceed the crest freeboard, Rc as defined in
Figure VI-5-13. The amount of allowable overtopping depends on the function of the particular structure.
Certain functions put restrictions on the allowable overtopping discharge. For example access roads and
installations placed on the crest of breakwaters and seawalls, berths for vessels as well as reclaimed areas
containing roadways, storage areas, and buildings located just behind the breakwater are overtopping design
considerations. Design criteria for overtopping should include two levels: Overtopping during normalservice conditions and overtopping during extreme design conditions where some damage to permanent
installations and structures might be allowed. Very heavy overtopping might be allowed where a breakwater
has no other function than protection of harbor entrances and outer basins from waves. However, significant
overtopping can create wave disturbances which could lead to damage of moored vessels. Fortunately, waves
generated by overtopping usually have much shorter periods than the incident wave train.
(1) Admissible average overtopping discharge.
(a) The overtopping discharge from wind-generated waves is very unevenly distributed in time and space
because the amount varies considerably from wave to wave. The major part of the overtopping discharge
during a storm is due to a small fraction of the waves. In fact the local overtopping discharge (in m3/s per
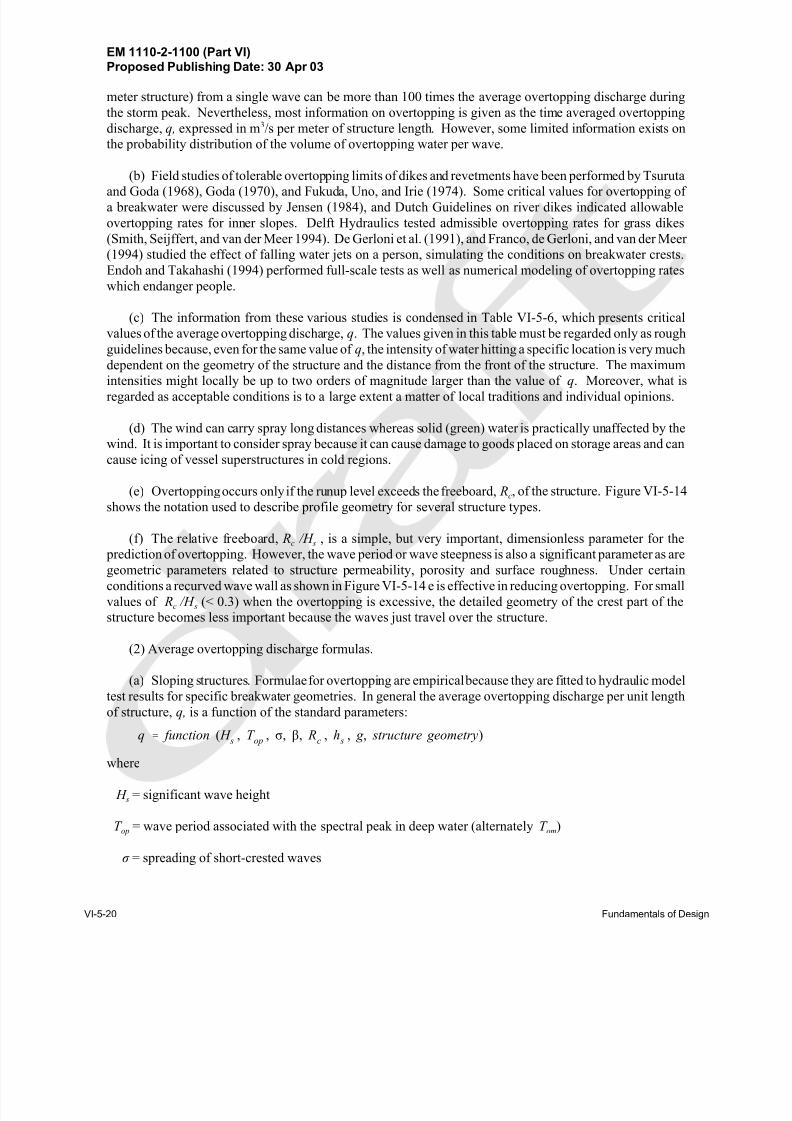
8/13/2019 CEM PartVI-Chap5p1, Fundamentals of Design
http://slidepdf.com/reader/full/cem-partvi-chap5p1-fundamentals-of-design 36/150
EM 1110-2-1100 (Part VI)Proposed Publishing Date: 30 Apr 03
VI-5-20 Fundamentals of Design
meter structure) from a single wave can be more than 100 times the average overtopping discharge during
the storm peak. Nevertheless, most information on overtopping is given as the time averaged overtopping
discharge, q, expressed in m3/s per meter of structure length. However, some limited information exists on
the probability distribution of the volume of overtopping water per wave.
(b) Field studies of tolerable overtopping limits of dikes and revetments have been performed by Tsuruta
and Goda (1968), Goda (1970), and Fukuda, Uno, and Irie (1974). Some critical values for overtopping of a breakwater were discussed by Jensen (1984), and Dutch Guidelines on river dikes indicated allowable
overtopping rates for inner slopes. Delft Hydraulics tested admissible overtopping rates for grass dikes
(Smith, Seijffert, and van der Meer 1994). De Gerloni et al. (1991), and Franco, de Gerloni, and van der Meer
(1994) studied the effect of falling water jets on a person, simulating the conditions on breakwater crests.
Endoh and Takahashi (1994) performed full-scale tests as well as numerical modeling of overtopping rates
which endanger people.
(c) The information from these various studies is condensed in Table VI-5-6, which presents critical
values of the average overtopping discharge, q. The values given in this table must be regarded only as rough
guidelines because, even for the same value of q, the intensity of water hitting a specific location is very much
dependent on the geometry of the structure and the distance from the front of the structure. The maximum
intensities might locally be up to two orders of magnitude larger than the value of q. Moreover, what isregarded as acceptable conditions is to a large extent a matter of local traditions and individual opinions.
(d) The wind can carry spray long distances whereas solid (green) water is practically unaffected by the
wind. It is important to consider spray because it can cause damage to goods placed on storage areas and can
cause icing of vessel superstructures in cold regions.
(e) Overtopping occurs only if the runup level exceeds the freeboard, Rc, of the structure. Figure VI-5-14
shows the notation used to describe profile geometry for several structure types.
(f) The relative freeboard, Rc /H s , is a simple, but very important, dimensionless parameter for the
prediction of overtopping. However, the wave period or wave steepness is also a significant parameter as are
geometric parameters related to structure permeability, porosity and surface roughness. Under certainconditions a recurved wave wall as shown in Figure VI-5-14 e is effective in reducing overtopping. For small
values of Rc /H s (< 0.3) when the overtopping is excessive, the detailed geometry of the crest part of the
structure becomes less important because the waves just travel over the structure.
(2) Average overtopping discharge formulas.
(a) Sloping structures. Formulae for overtopping are empirical because they are fitted to hydraulic model
test results for specific breakwater geometries. In general the average overtopping discharge per unit length
of structure, q, is a function of the standard parameters:
q ' function ( H s
, T op
, σ, β, Rc
, h s
, g , structure geometry)
where
H s = significant wave height
T op = wave period associated with the spectral peak in deep water (alternately T om)
σ = spreading of short-crested waves
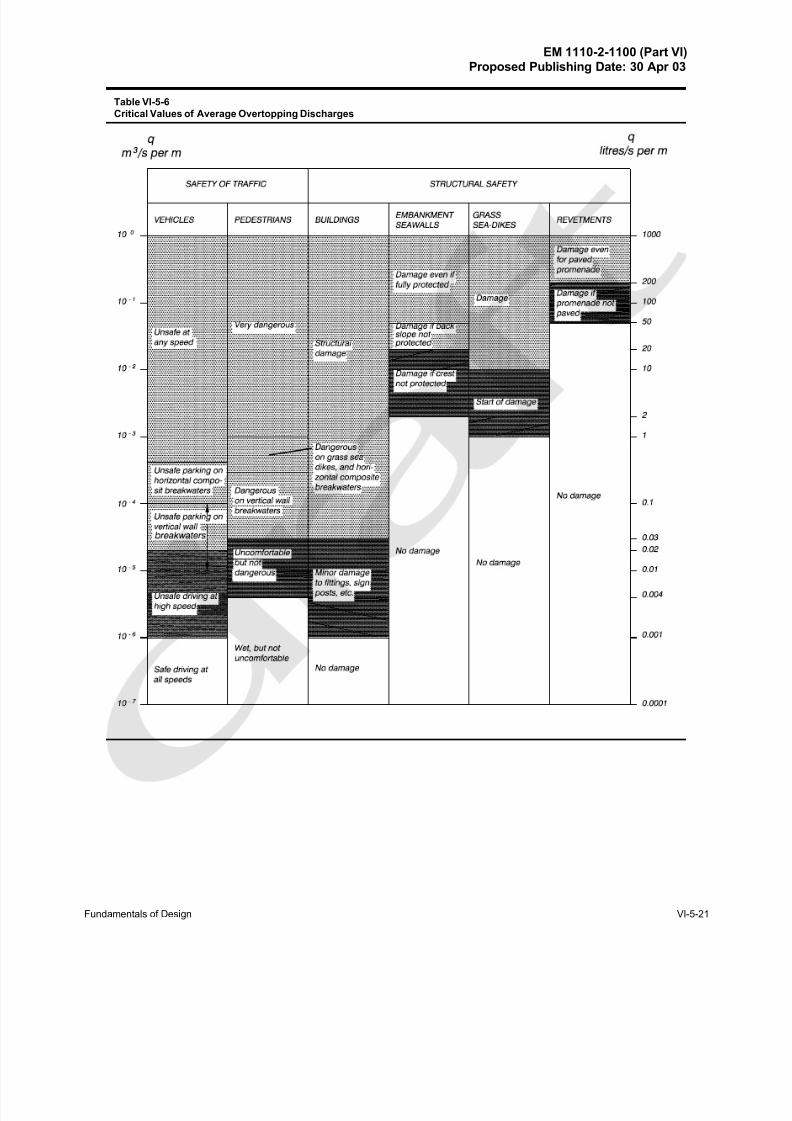
8/13/2019 CEM PartVI-Chap5p1, Fundamentals of Design
http://slidepdf.com/reader/full/cem-partvi-chap5p1-fundamentals-of-design 37/150
EM 1110-2-1100 (Part VI)Proposed Publishing Date: 30 Apr 03
Fundamentals of Design VI-5-21
Table VI-5-6
Critical Values of Average Overtopping Discharges
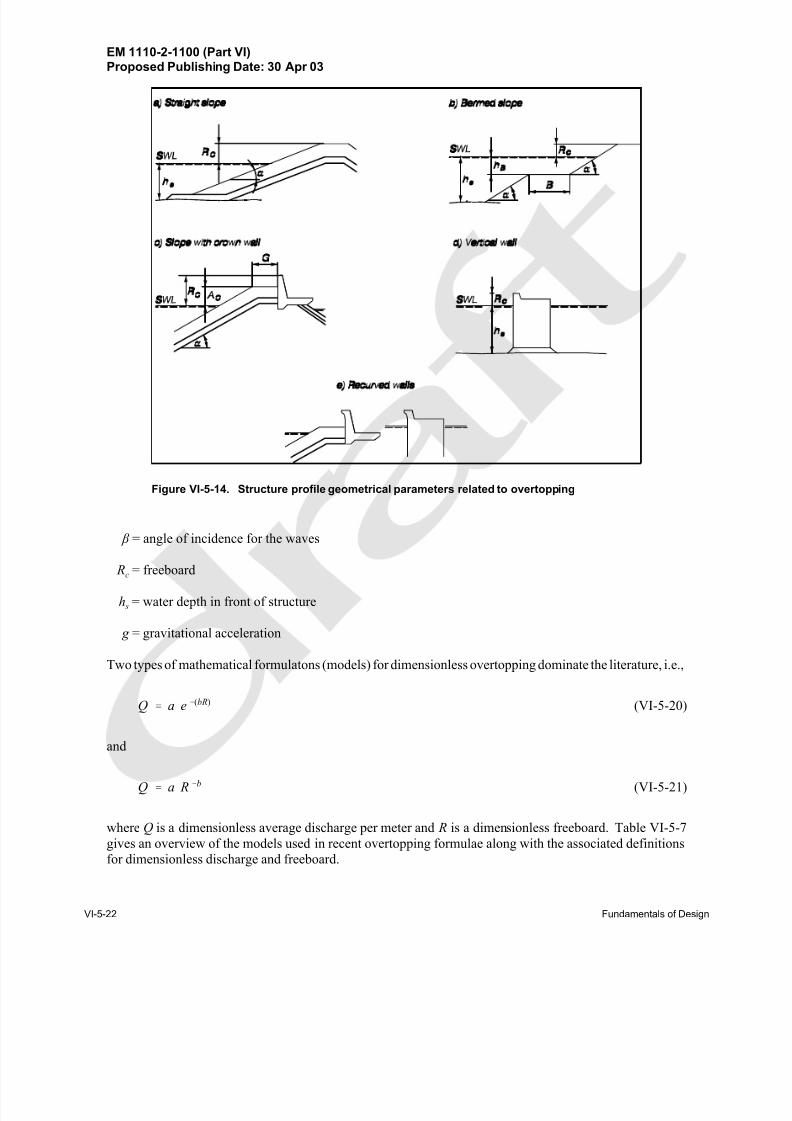
8/13/2019 CEM PartVI-Chap5p1, Fundamentals of Design
http://slidepdf.com/reader/full/cem-partvi-chap5p1-fundamentals-of-design 38/150
EM 1110-2-1100 (Part VI)Proposed Publishing Date: 30 Apr 03
VI-5-22 Fundamentals of Design
Figure VI-5-14. Structure profile geometrical parameters related to overtopping
β = angle of incidence for the waves
Rc = freeboard
h s = water depth in front of structure
g = gravitational acceleration
Two types of mathematical formulatons (models) for dimensionless overtopping dominate the literature, i.e.,
(VI-5-20)Q ' a e &(bR)
and
(VI-5-21)Q ' a R &b
where Q is a dimensionless average discharge per meter and R is a dimensionless freeboard. Table VI-5-7
gives an overview of the models used in recent overtopping formulae along with the associated definitions
for dimensionless discharge and freeboard.
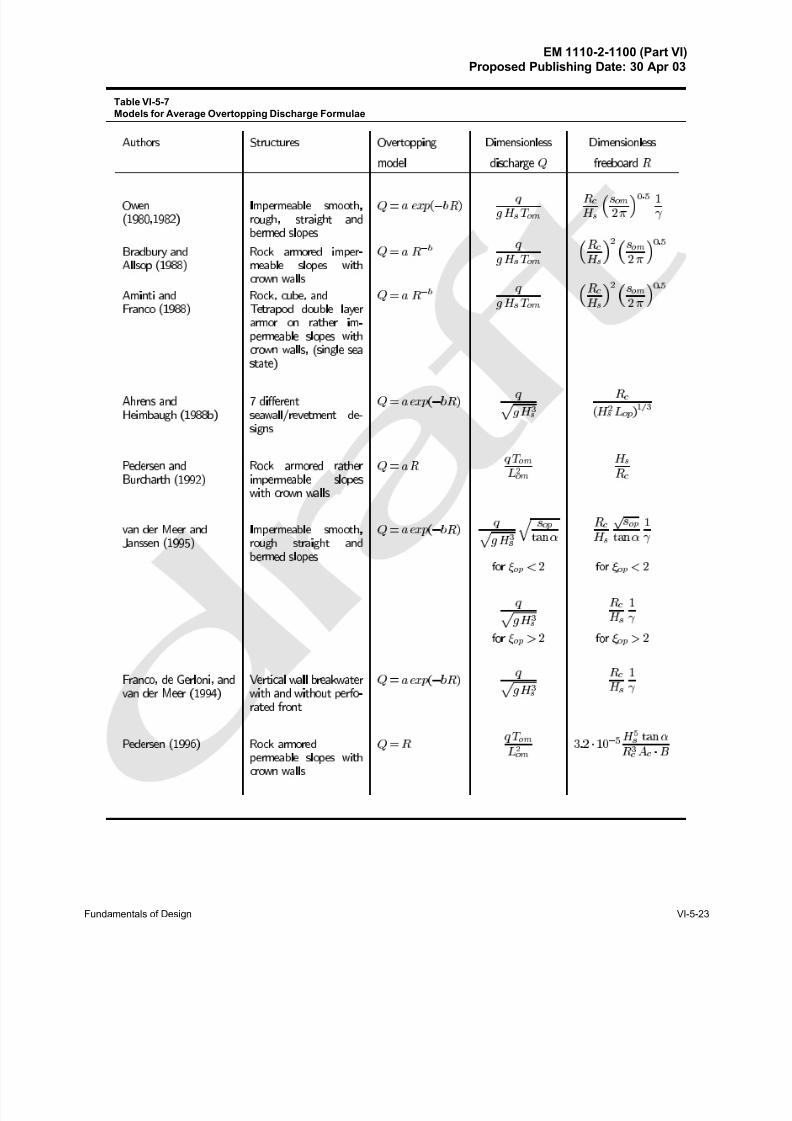
8/13/2019 CEM PartVI-Chap5p1, Fundamentals of Design
http://slidepdf.com/reader/full/cem-partvi-chap5p1-fundamentals-of-design 39/150
EM 1110-2-1100 (Part VI)Proposed Publishing Date: 30 Apr 03
Fundamentals of Design VI-5-23
Table VI-5-7
Models for Average Overtopping Discharge Formulae
8/13/2019 CEM PartVI-Chap5p1, Fundamentals of Design
http://slidepdf.com/reader/full/cem-partvi-chap5p1-fundamentals-of-design 40/150
EM 1110-2-1100 (Part VI)Proposed Publishing Date: 30 Apr 03
VI-5-24 Fundamentals of Design
(b) The fitted coefficients a and b in Equations VI-5-20 and VI-5-21 are specific to the front geometry
of the structure and must be given in tables. So far no general model for the influence of front geometry
exists except for rubble-mound slopes with a seawall (Pedersen 1996), in which case the front geometry
(described by the front berm width B, berm crest height Ac , and slope angle α), as well as Rc, enters into R.
(c) Some formulae take into account the reduction in overtopping due to slope surface roughness, berm,
shallow water, angle of wave incidence and shortcrestedness, and specific front geometries by dividing R bythe respective reduction coefficients: γr (Table VI-5-3), γb (Equation VI-5-8), γh (Equation VI-5-10), γ β (Equations VI-5-11, VI-5-26, VI-5-29), and γ s (Table VI-5-13).
(d) Goda (1985) presented diagrams for wave overtopping of vertical revetments and block-mound
seawalls on bottom slopes of 1:10 and 1:30. The diagrams are based on model tests with irregular long-
crested head-on waves and express average discharge per meter width as a function of wave height, wave
steepness, freeboard, and water depth.
• Sloping structures. Tables VI-5-8 to VI-5-12 pertain to sloping-front structures.
• Figure VI-5-15 shows the data basis for Equations VI-5-24 and VI-5-25 which includes the data of
Owen (1980, 1982) for straight slopes, data of Führböter, Sparboom, and Witte (1989) and variousdata sets of Delft Hydraulics. It is seen that Equation VI-5-24 contains some bias for small values
of q.
(b) Vertical front structures.
• Figure VI-5-16 shows the data used to establish Equation VI-5-28. Appropriate values of γ β from
Table VI-5-13 were used in plotting Figure VI-5-16; however γ s was taken as unity (plain
impermeable wall).
• Figure VI-5-17 shows the same vertical wall overtopping data plotted with appropriate values of γ β and γ s from Table VI-5-13. The solid line is Equation VI-5-28.
(3) Overtopping volumes of individual waves. The average overtopping discharge q provides no
information about the discharge intensity of the individual overtopping waves. However, such information
is important because most damaging impacts on persons, vehicles, and structures are caused by overtopping
of large single waves. The overtopping volume per wave has been recorded in model tests and it was found
that the probability distribution function for overtopping volume per wave per unit width (V m3/m) follows
a Weibull distribution as given in Equation VI-5-30 (Franco, de Gerloni, and van der Meer 1994; van der
Meer and Jansson 1995).
or (VI-5-30) prob (v > V ) ' exp &
V
B
3/4
(VI-5-31)V ' B &ln[ prob (v > V )] 4/3
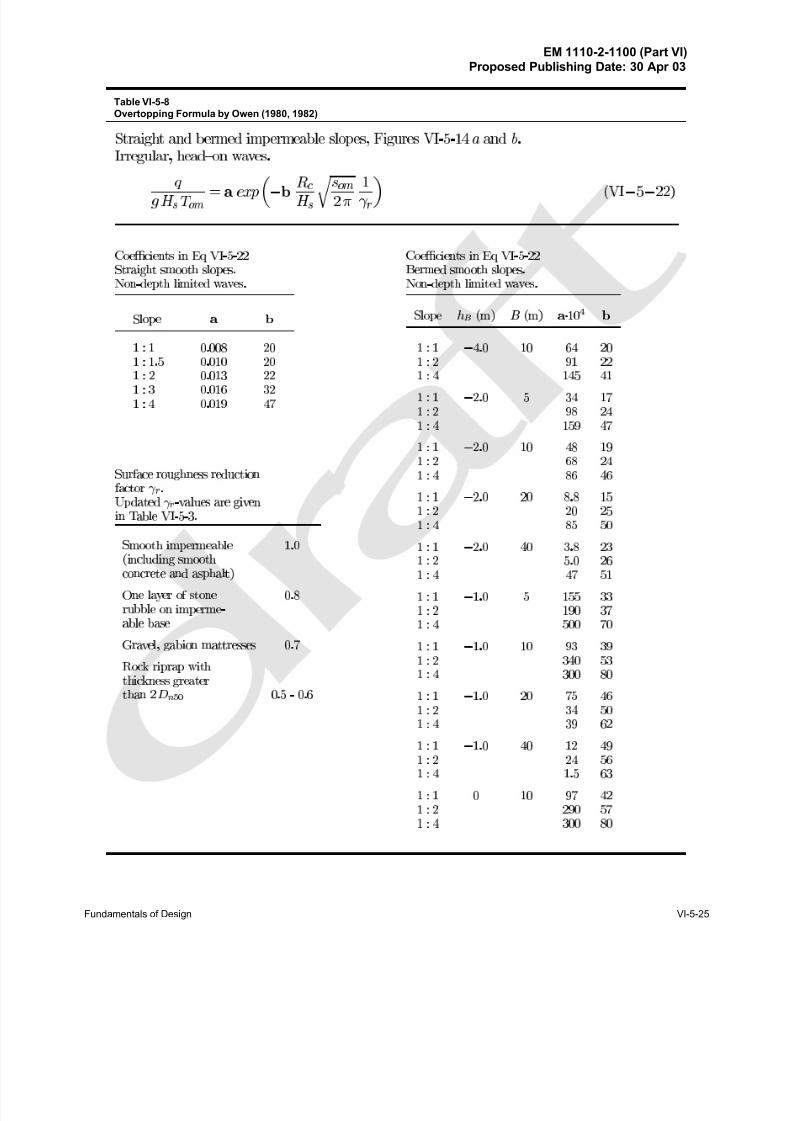
8/13/2019 CEM PartVI-Chap5p1, Fundamentals of Design
http://slidepdf.com/reader/full/cem-partvi-chap5p1-fundamentals-of-design 41/150
EM 1110-2-1100 (Part VI)Proposed Publishing Date: 30 Apr 03
Fundamentals of Design VI-5-25
Æ
Æ
Table VI-5-8
Overtopping Formula by Owen (1980, 1982)
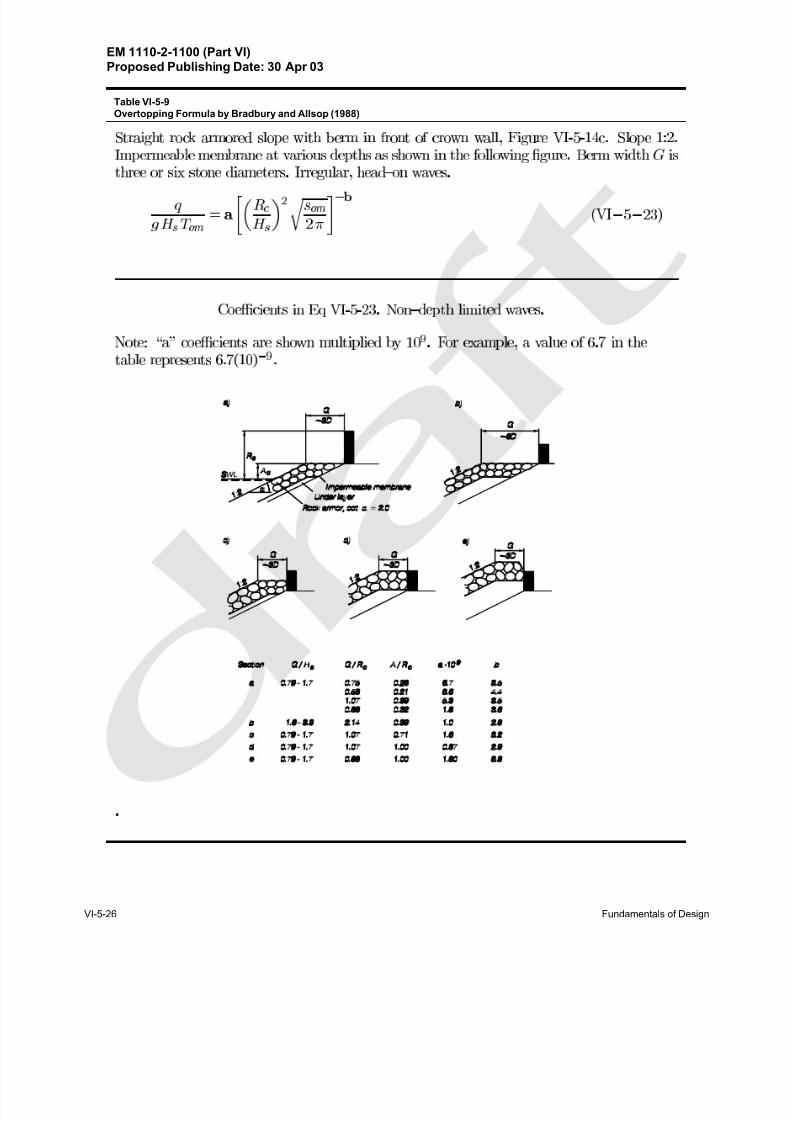
8/13/2019 CEM PartVI-Chap5p1, Fundamentals of Design
http://slidepdf.com/reader/full/cem-partvi-chap5p1-fundamentals-of-design 42/150
EM 1110-2-1100 (Part VI)Proposed Publishing Date: 30 Apr 03
VI-5-26 Fundamentals of Design
Æ
Æ
Table VI-5-9
Overtopping Formula by Bradbury and Allsop (1988)
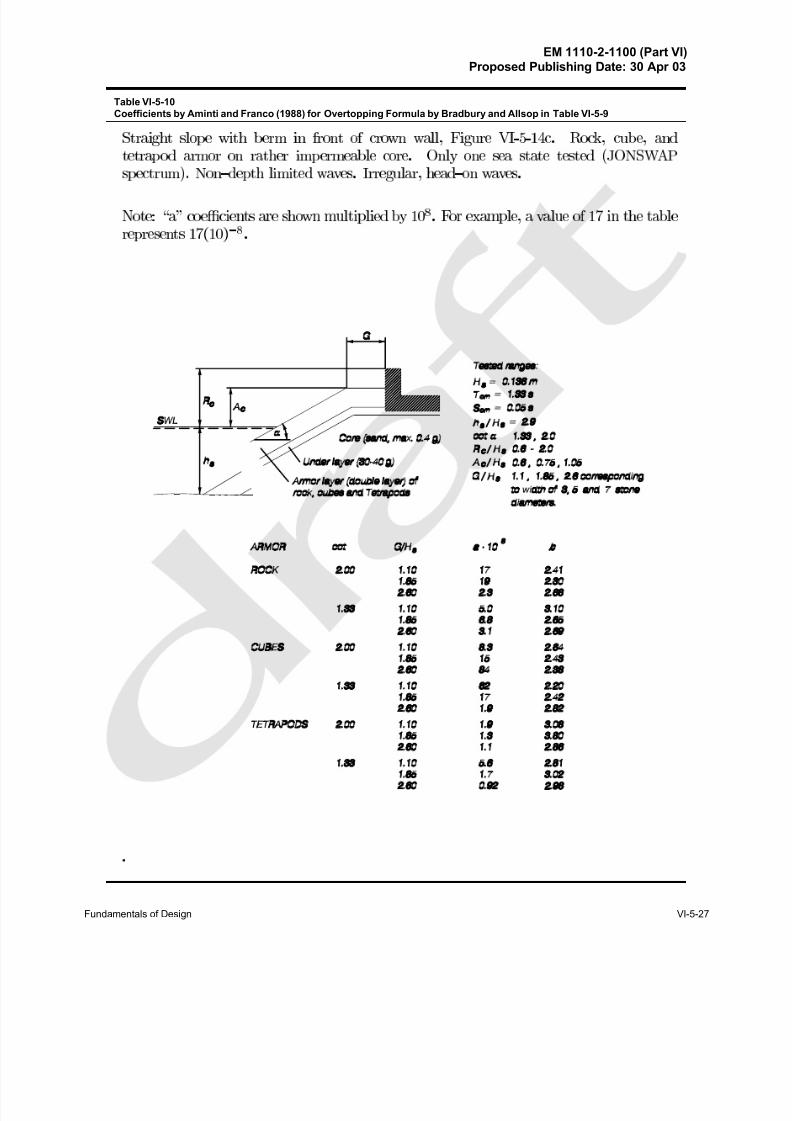
8/13/2019 CEM PartVI-Chap5p1, Fundamentals of Design
http://slidepdf.com/reader/full/cem-partvi-chap5p1-fundamentals-of-design 43/150
EM 1110-2-1100 (Part VI)Proposed Publishing Date: 30 Apr 03
Fundamentals of Design VI-5-27
Æ
Table VI-5-10
Coefficients by Aminti and Franco (1988) for Overtopping Formula by Bradbury and Allsop in Table VI-5-9
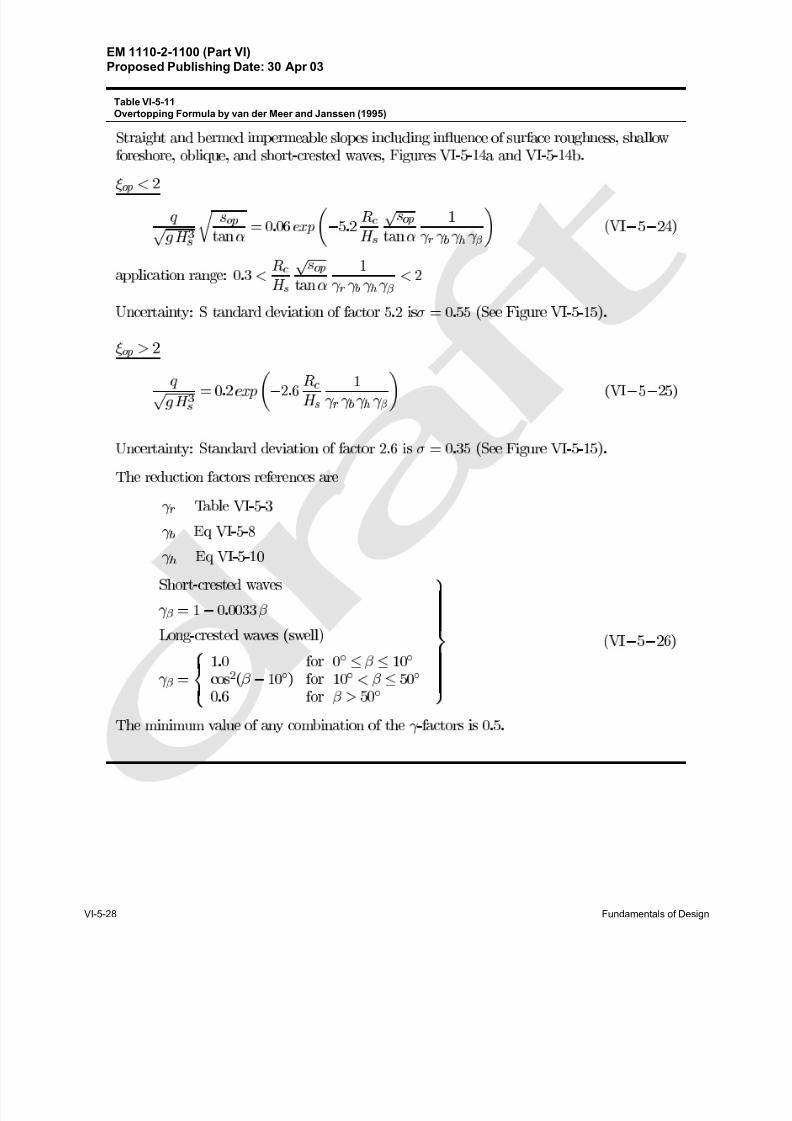
8/13/2019 CEM PartVI-Chap5p1, Fundamentals of Design
http://slidepdf.com/reader/full/cem-partvi-chap5p1-fundamentals-of-design 44/150
EM 1110-2-1100 (Part VI)Proposed Publishing Date: 30 Apr 03
VI-5-28 Fundamentals of Design
Æ
Æ
Æ
Æ
Æ
Æ
Table VI-5-11
Overtopping Formula by van der Meer and Janssen (1995)
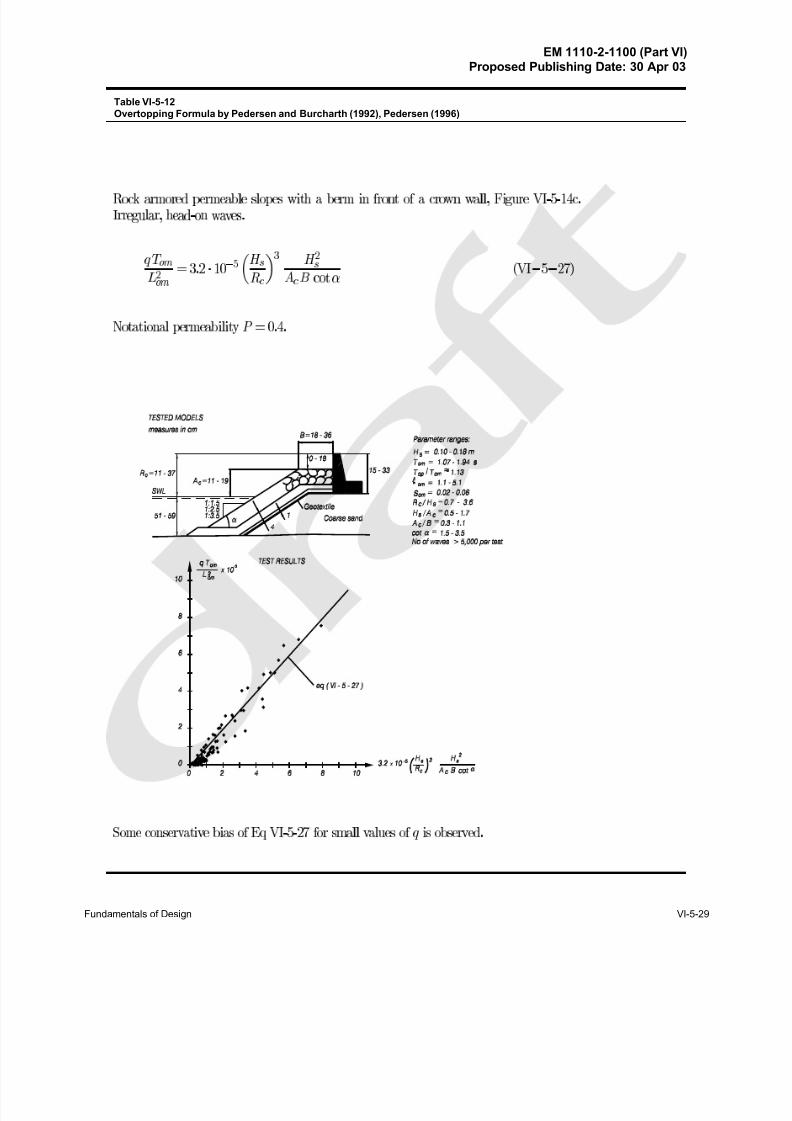
8/13/2019 CEM PartVI-Chap5p1, Fundamentals of Design
http://slidepdf.com/reader/full/cem-partvi-chap5p1-fundamentals-of-design 45/150
EM 1110-2-1100 (Part VI)Proposed Publishing Date: 30 Apr 03
Fundamentals of Design VI-5-29
Table VI-5-12
Overtopping Formula by Pedersen and Burcharth (1992), Pedersen (1996)
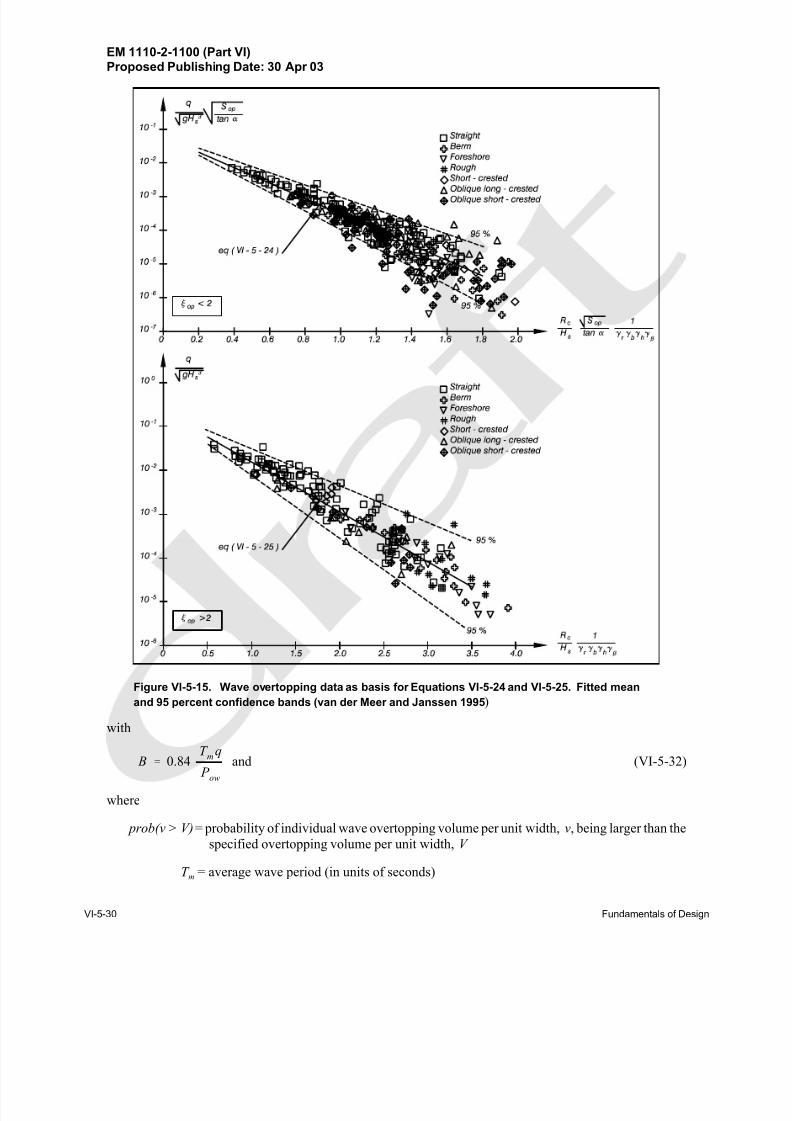
8/13/2019 CEM PartVI-Chap5p1, Fundamentals of Design
http://slidepdf.com/reader/full/cem-partvi-chap5p1-fundamentals-of-design 46/150
EM 1110-2-1100 (Part VI)Proposed Publishing Date: 30 Apr 03
VI-5-30 Fundamentals of Design
Figure VI-5-15. Wave overtopping data as basis for Equations VI-5-24 and VI-5-25. Fitted mean
and 95 percent confidence bands (van der Meer and Janssen 1995)
with
and (VI-5-32) B ' 0.84 T mq P
ow
where
prob(v > V) = probability of individual wave overtopping volume per unit width, v, being larger than the
specified overtopping volume per unit width, V
T m = average wave period (in units of seconds)
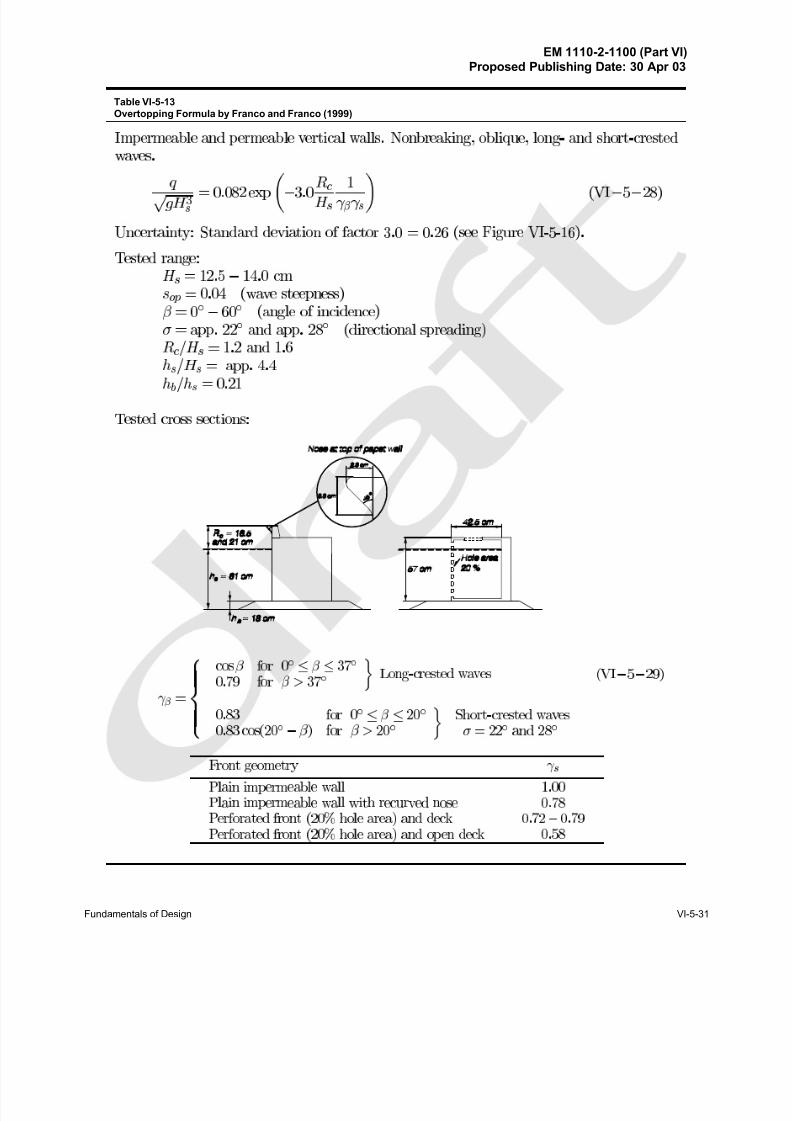
8/13/2019 CEM PartVI-Chap5p1, Fundamentals of Design
http://slidepdf.com/reader/full/cem-partvi-chap5p1-fundamentals-of-design 47/150
EM 1110-2-1100 (Part VI)Proposed Publishing Date: 30 Apr 03
Fundamentals of Design VI-5-31
Æ
Æ
Æ
Æ
Æ
Æ
Æ
Æ
Æ
Æ
Æ
Æ
Æ
Table VI-5-13
Overtopping Formula by Franco and Franco (1999)
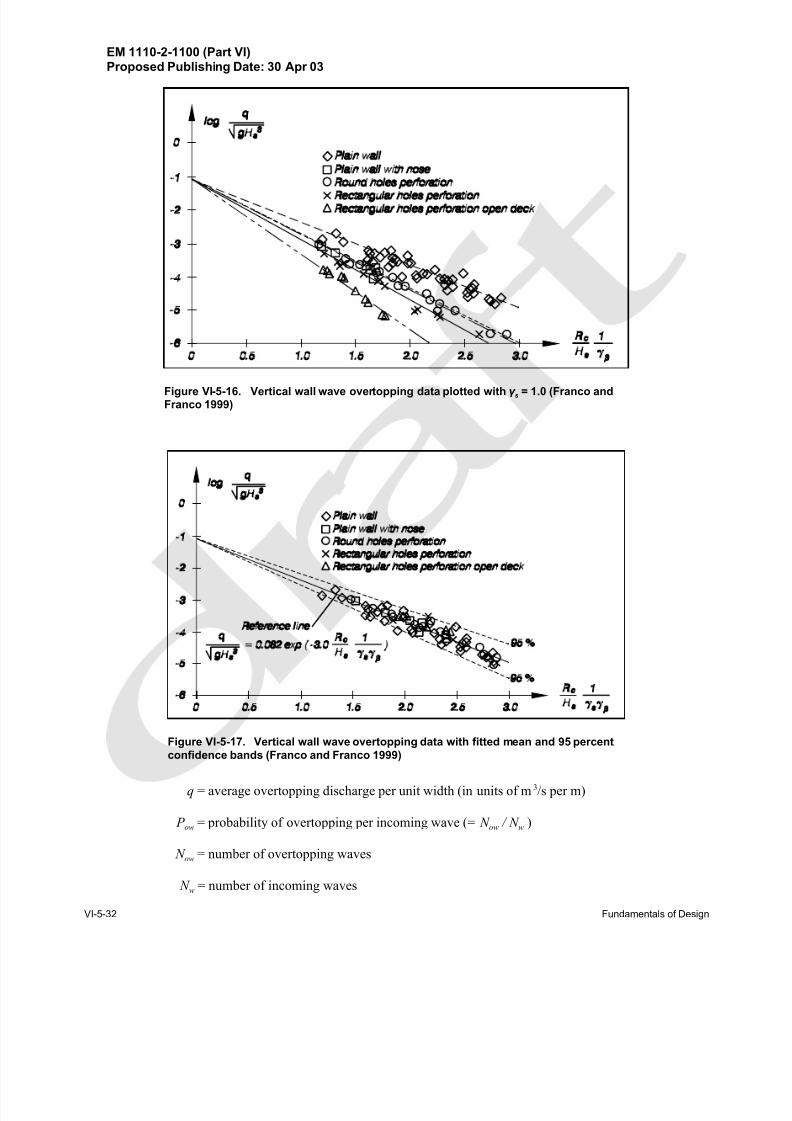
8/13/2019 CEM PartVI-Chap5p1, Fundamentals of Design
http://slidepdf.com/reader/full/cem-partvi-chap5p1-fundamentals-of-design 48/150
EM 1110-2-1100 (Part VI)Proposed Publishing Date: 30 Apr 03
VI-5-32 Fundamentals of Design
Figure VI-5-16. Vertical wall wave overtopping data plotted with γ s = 1.0 (Franco and
Franco 1999)
Figure VI-5-17. Vertical wall wave overtopping data with fitted mean and 95 percent
confidence bands (Franco and Franco 1999)
q = average overtopping discharge per unit width (in units of m3/s per m)
P ow = probability of overtopping per incoming wave (= N ow / N w )
N ow = number of overtopping waves
N w = number of incoming waves
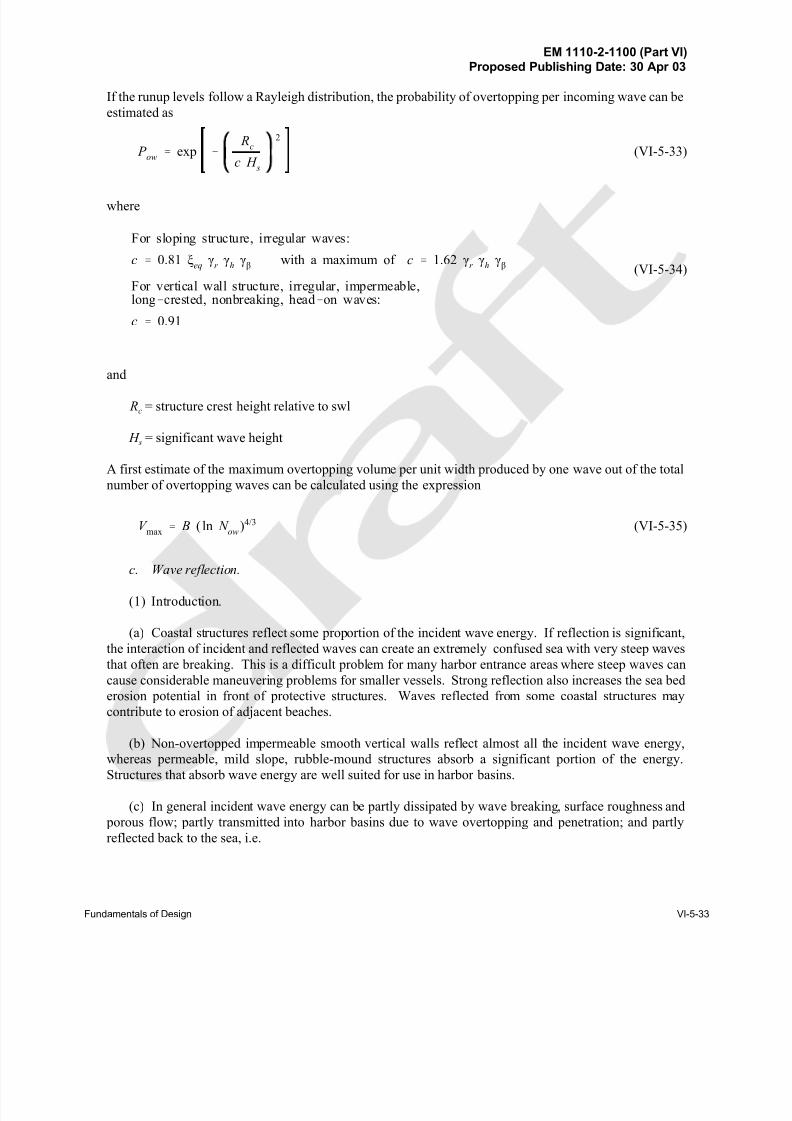
8/13/2019 CEM PartVI-Chap5p1, Fundamentals of Design
http://slidepdf.com/reader/full/cem-partvi-chap5p1-fundamentals-of-design 49/150
EM 1110-2-1100 (Part VI)Proposed Publishing Date: 30 Apr 03
Fundamentals of Design VI-5-33
If the runup levels follow a Rayleigh distribution, the probability of overtopping per incoming wave can be
estimated as
(VI-5-33) P ow
' exp &
Rc
c H s
2
where
(VI-5-34)
For sloping structure, irregular waves:
c ' 0.81 ξeq γ
r γ
h γ
βwith a maximum of c ' 1.62 γ
r γ
h γ
β
For vertical wall structure, irregular, impermeable,long&crested, nonbreaking, head&on waves:
c ' 0.91
and
Rc = structure crest height relative to swl
H s = significant wave height
A first estimate of the maximum overtopping volume per unit width produced by one wave out of the total
number of overtopping waves can be calculated using the expression
(VI-5-35)V max
' B ( ln N ow
)4/3
c. Wave reflection.
(1) Introduction.
(a) Coastal structures reflect some proportion of the incident wave energy. If reflection is significant,
the interaction of incident and reflected waves can create an extremely confused sea with very steep waves
that often are breaking. This is a difficult problem for many harbor entrance areas where steep waves can
cause considerable maneuvering problems for smaller vessels. Strong reflection also increases the sea bed
erosion potential in front of protective structures. Waves reflected from some coastal structures may
contribute to erosion of adjacent beaches.
(b) Non-overtopped impermeable smooth vertical walls reflect almost all the incident wave energy,
whereas permeable, mild slope, rubble-mound structures absorb a significant portion of the energy.Structures that absorb wave energy are well suited for use in harbor basins.
(c) In general incident wave energy can be partly dissipated by wave breaking, surface roughness and
porous flow; partly transmitted into harbor basins due to wave overtopping and penetration; and partly
reflected back to the sea, i.e.
8/13/2019 CEM PartVI-Chap5p1, Fundamentals of Design
http://slidepdf.com/reader/full/cem-partvi-chap5p1-fundamentals-of-design 50/150
EM 1110-2-1100 (Part VI)Proposed Publishing Date: 30 Apr 03
VI-5-34 Fundamentals of Design
(VI-5-36) E i
' E d
% E t
% E r
where E i , E d , E t , and E r are incident, dissipated, transmitted, and reflected energy, respectively.
(d) Reflection can be quantified by the bulk reflection coefficient
(VI-5-37)C r
'
H sr
H s
'
E r
E i
1/2
where H s and H sr are the significant wave heights of incident and reflected waves, respectively, at that
position; and E i and E r are the related wave energies.
(2) Reflection from non-overtopped sloping structures.
(a) Very long waves such as infragravity and tidal waves are almost fully reflected by any type of
impervious structure. Wind-generated waves generally break on slopes (see Table VI-5-1) with the type of
wave breaking given as a function of the surf-similarity parameter ξ , defined by Equation VI-5-2. Wave
energy dissipation by wave breaking is much greater than dissipation due to surface roughness and porousflow for conventional coastal structures. Therefore, it is relevant to relate the bulk reflection coefficient,
C r , to ξ , (Battjes 1974b; Seelig 1983).
(b) The bulk reflection coefficient for straight non-overtopped impermeable smooth slopes and
conventional rubble-mound breakwaters can be estimated from Equation VI-5-38 (Seelig 1983) given in
Table VI-5-14. Figure VI-5-18 shows the fitting of the model test results by Allsop and Hettiarachichi
(1988). Some scatter in the fitting can be seen.
(c) An alternative formula to Equation VI-5-38 was given by Postma (1989), who analyzed van der
Meer's (1988) reflection data (see Table VI-5-4) for non-overtopped rock slopes. Postma introduced the
notational permeability P (shown on Figure VI-5-11), the slope angle α and the wave steepness sop in the
formula
(VI-5-39)C r
' 0.071 ( P )&0.082 (cot α)&0.62 ( sop
)&0.46
(d) The uncertainty of Equation VI-5-39 corresponds to a variational coefficient of 0.036.
(e) The effect of a berm in a slope is generally a reduction in C r . Figure VI-5-19 shows C r values for
a rubble-mound structure with berms of varying width at SWL (Allsop 1990).
(3) Reflection from vertical walls.
(a) Bulk reflection coefficients for plain vertical breakwaters on seabed, for plain vertical breakwaters
on rubble foundation, for horizontal composite breakwaters, for sloping top caissons, for single perforated
screens, and for perforated caissions are given in Figures VI-5-20, VI-5-21, VI-5-22, VI-5-23, VI-5-24, and
VI-5-25, respectively. They were obtained from scaled model tests with irregular, head-on waves. The effect
of oblique waves and wave shortcrestedness on plain and perforated vertical wall caissons is shown in
Figure VI-5-26.
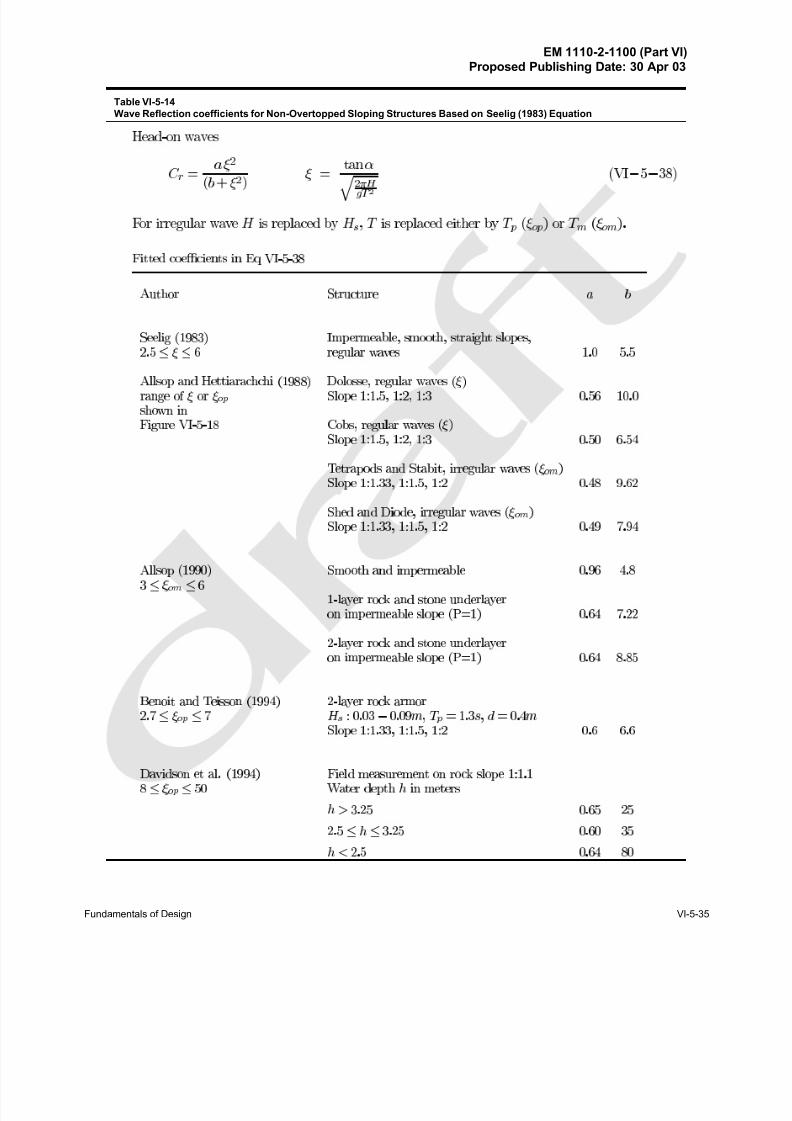
8/13/2019 CEM PartVI-Chap5p1, Fundamentals of Design
http://slidepdf.com/reader/full/cem-partvi-chap5p1-fundamentals-of-design 51/150
EM 1110-2-1100 (Part VI)Proposed Publishing Date: 30 Apr 03
Fundamentals of Design VI-5-35
Æ
Table VI-5-14
Wave Reflection coefficients for Non-Overtopped Sloping Structures Based on Seelig (1983) Equation
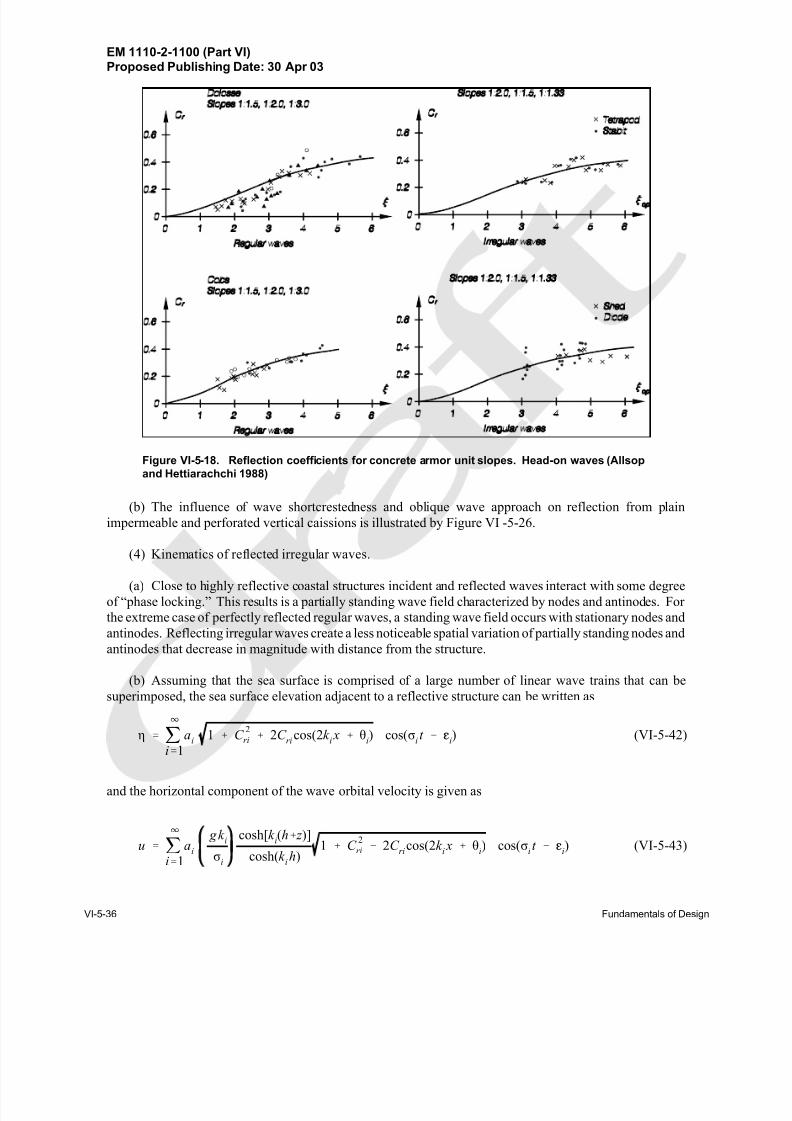
8/13/2019 CEM PartVI-Chap5p1, Fundamentals of Design
http://slidepdf.com/reader/full/cem-partvi-chap5p1-fundamentals-of-design 52/150
EM 1110-2-1100 (Part VI)Proposed Publishing Date: 30 Apr 03
VI-5-36 Fundamentals of Design
Figure VI-5-18. Reflection coefficients for concrete armor unit slopes. Head-on waves (Allsop
and Hettiarachchi 1988)
(b) The influence of wave shortcrestedness and oblique wave approach on reflection from plain
impermeable and perforated vertical caissions is illustrated by Figure VI -5-26.
(4) Kinematics of reflected irregular waves.
(a) Close to highly reflective coastal structures incident and reflected waves interact with some degree
of “phase locking.” This results is a partially standing wave field characterized by nodes and antinodes. For
the extreme case of perfectly reflected regular waves, a standing wave field occurs with stationary nodes and
antinodes. Reflecting irregular waves create a less noticeable spatial variation of partially standing nodes and
antinodes that decrease in magnitude with distance from the structure.
(b) Assuming that the sea surface is comprised of a large number of linear wave trains that can be
superimposed, the sea surface elevation adjacent to a reflective structure can be written as
(VI-5-42)η '
4
ji'1
ai
1 % C 2
ri % 2C ri
cos(2k i x % θ
i) cos(σ
it & g
i)
and the horizontal component of the wave orbital velocity is given as
(VI-5-43)u '
4
ji'1
ai
gk i
σi
cosh[k i(h% z )]
cosh(k ih)
1 % C 2
ri & 2C ri
cos(2k i x % θ
i) cos(σ
it & g
i)
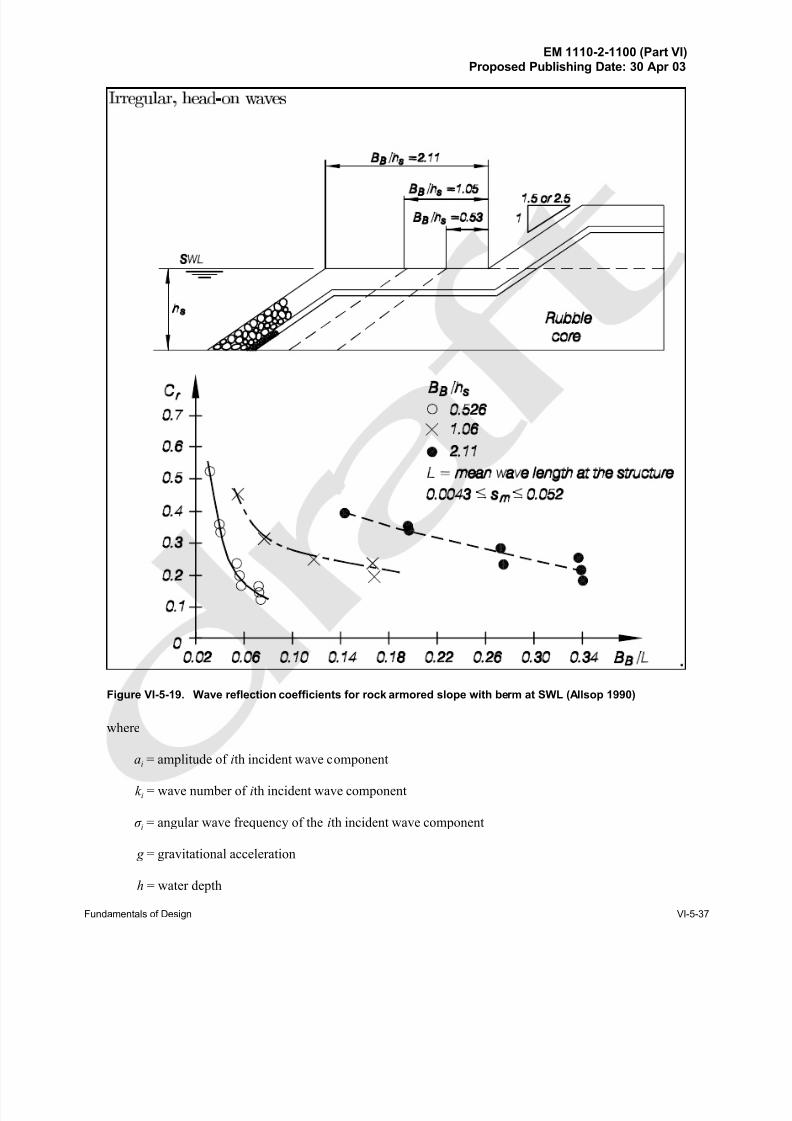
8/13/2019 CEM PartVI-Chap5p1, Fundamentals of Design
http://slidepdf.com/reader/full/cem-partvi-chap5p1-fundamentals-of-design 53/150
EM 1110-2-1100 (Part VI)Proposed Publishing Date: 30 Apr 03
Fundamentals of Design VI-5-37
Figure VI-5-19. Wave reflection coefficients for rock armored slope with berm at SWL (Allsop 1990)
where
ai = amplitude of ith incident wave component
k i = wave number of ith incident wave component
σ i = angular wave frequency of the ith incident wave component
g = gravitational acceleration
h = water depth
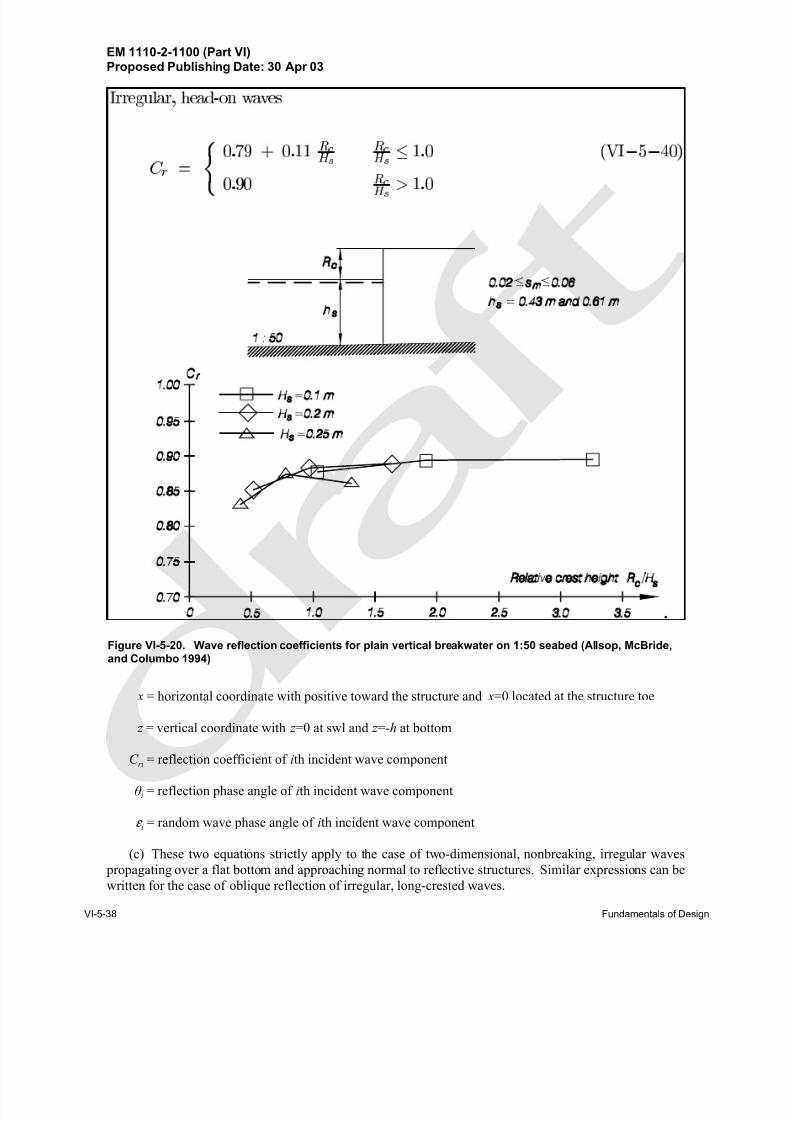
8/13/2019 CEM PartVI-Chap5p1, Fundamentals of Design
http://slidepdf.com/reader/full/cem-partvi-chap5p1-fundamentals-of-design 54/150
EM 1110-2-1100 (Part VI)Proposed Publishing Date: 30 Apr 03
VI-5-38 Fundamentals of Design
Figure VI-5-20. Wave reflection coefficients for plain vertical breakwater on 1:50 seabed (Allsop, McBride,
and Columbo 1994)
x = horizontal coordinate with positive toward the structure and x=0 located at the structure toe
z = vertical coordinate with z =0 at swl and z =-h at bottom
C ri = reflection coefficient of ith incident wave component
θ i = reflection phase angle of ith incident wave component
g i = random wave phase angle of ith incident wave component
(c) These two equations strictly apply to the case of two-dimensional, nonbreaking, irregular waves
propagating over a flat bottom and approaching normal to reflective structures. Similar expressions can be
written for the case of oblique reflection of irregular, long-crested waves.
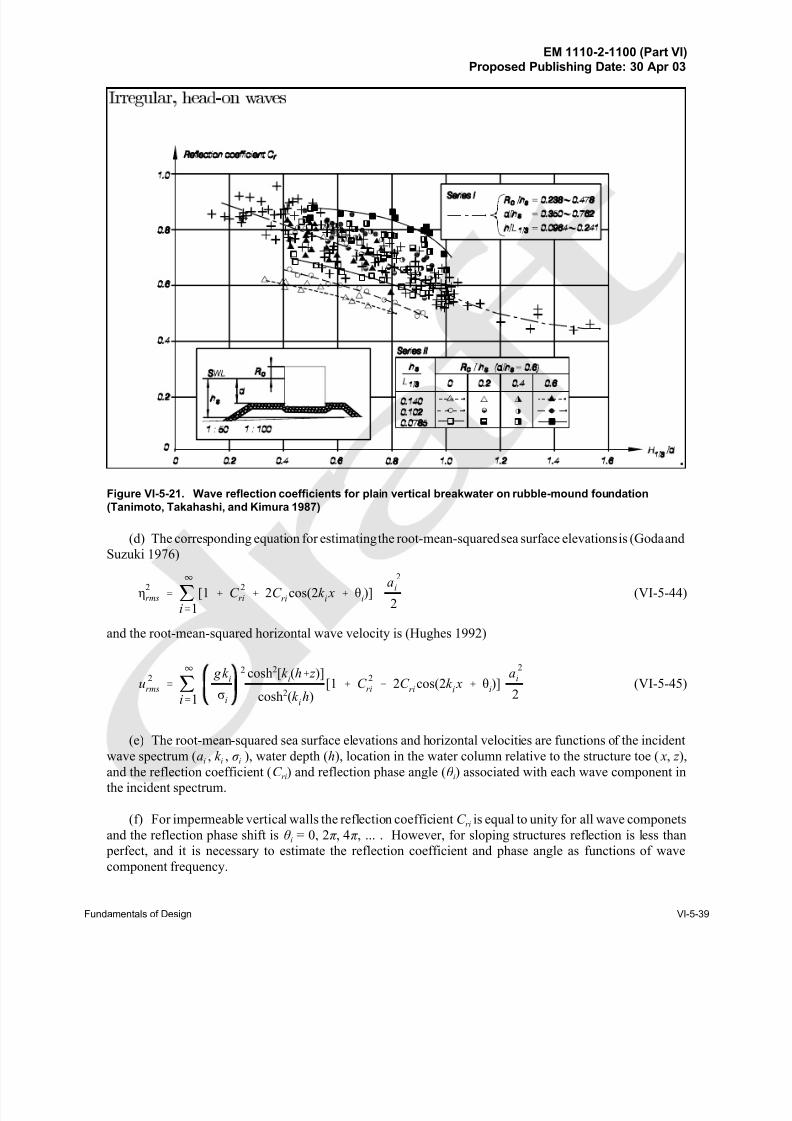
8/13/2019 CEM PartVI-Chap5p1, Fundamentals of Design
http://slidepdf.com/reader/full/cem-partvi-chap5p1-fundamentals-of-design 55/150
EM 1110-2-1100 (Part VI)Proposed Publishing Date: 30 Apr 03
Fundamentals of Design VI-5-39
Figure VI-5-21. Wave reflection coefficients for plain vertical breakwater on rubble-mound foundation
(Tanimoto, Takahashi, and Kimura 1987)
(d) The corresponding equation for estimating the root-mean-squared sea surface elevations is (Goda and
Suzuki 1976)
(VI-5-44)η2
rms '
4
ji'1
[1 % C 2
ri % 2C ri
cos(2k i x % θ
i)]
a2
i
2
and the root-mean-squared horizontal wave velocity is (Hughes 1992)
(VI-5-45)u2
rms '
4
ji'1
gk i
σi
2 cosh2[k i(h% z )]
cosh2(k ih)
[1 % C 2
ri & 2C ri
cos(2k i x % θ
i)]
a2
i
2
(e) The root-mean-squared sea surface elevations and horizontal velocities are functions of the incident
wave spectrum (ai , k i , σ i ), water depth (h), location in the water column relative to the structure toe ( x, z ),and the reflection coefficient (C ri) and reflection phase angle (θ i) associated with each wave component in
the incident spectrum.
(f) For impermeable vertical walls the reflection coefficient C ri is equal to unity for all wave componets
and the reflection phase shift is θ i = 0, 2π , 4π , ... . However, for sloping structures reflection is less than
perfect, and it is necessary to estimate the reflection coefficient and phase angle as functions of wave
component frequency.
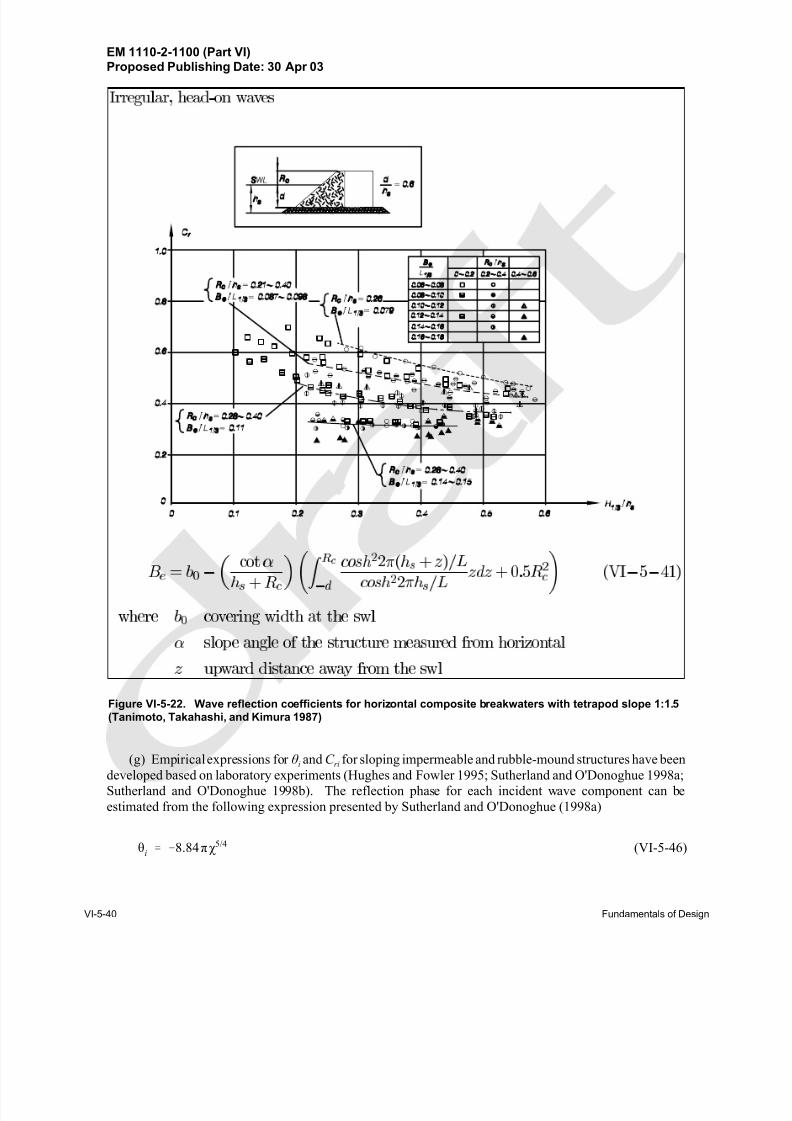
8/13/2019 CEM PartVI-Chap5p1, Fundamentals of Design
http://slidepdf.com/reader/full/cem-partvi-chap5p1-fundamentals-of-design 56/150
EM 1110-2-1100 (Part VI)Proposed Publishing Date: 30 Apr 03
VI-5-40 Fundamentals of Design
Figure VI-5-22. Wave reflection coefficients for horizontal composite breakwaters with tetrapod slope 1:1.5(Tanimoto, Takahashi, and Kimura 1987)
(g) Empirical expressions for θ i and C ri for sloping impermeable and rubble-mound structures have beendeveloped based on laboratory experiments (Hughes and Fowler 1995; Sutherland and O'Donoghue 1998a;
Sutherland and O'Donoghue 1998b). The reflection phase for each incident wave component can be
estimated from the following expression presented by Sutherland and O'Donoghue (1998a)
(VI-5-46)θi
' &8.84πχ 5/4
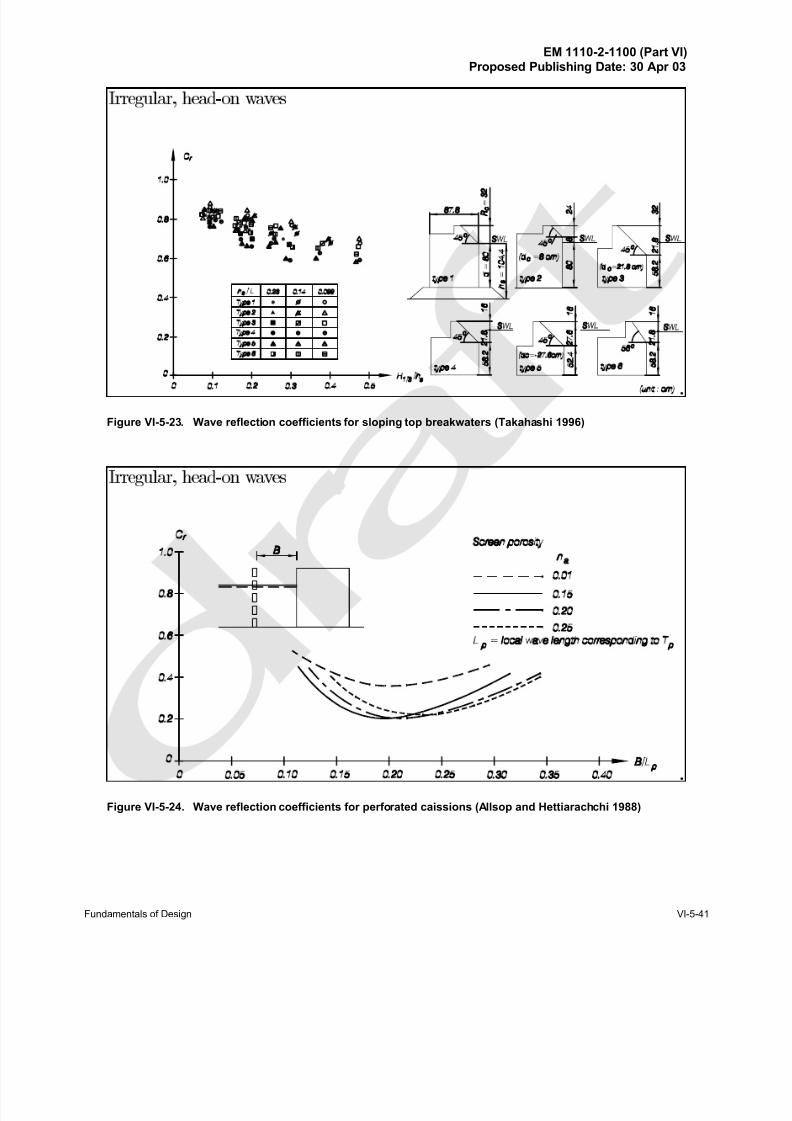
8/13/2019 CEM PartVI-Chap5p1, Fundamentals of Design
http://slidepdf.com/reader/full/cem-partvi-chap5p1-fundamentals-of-design 57/150
EM 1110-2-1100 (Part VI)Proposed Publishing Date: 30 Apr 03
Fundamentals of Design VI-5-41
Figure VI-5-23. Wave reflection coefficients for sloping top breakwaters (Takahashi 1996)
Figure VI-5-24. Wave reflection coefficients for perforated caissions (Allsop and Hettiarachchi 1988)
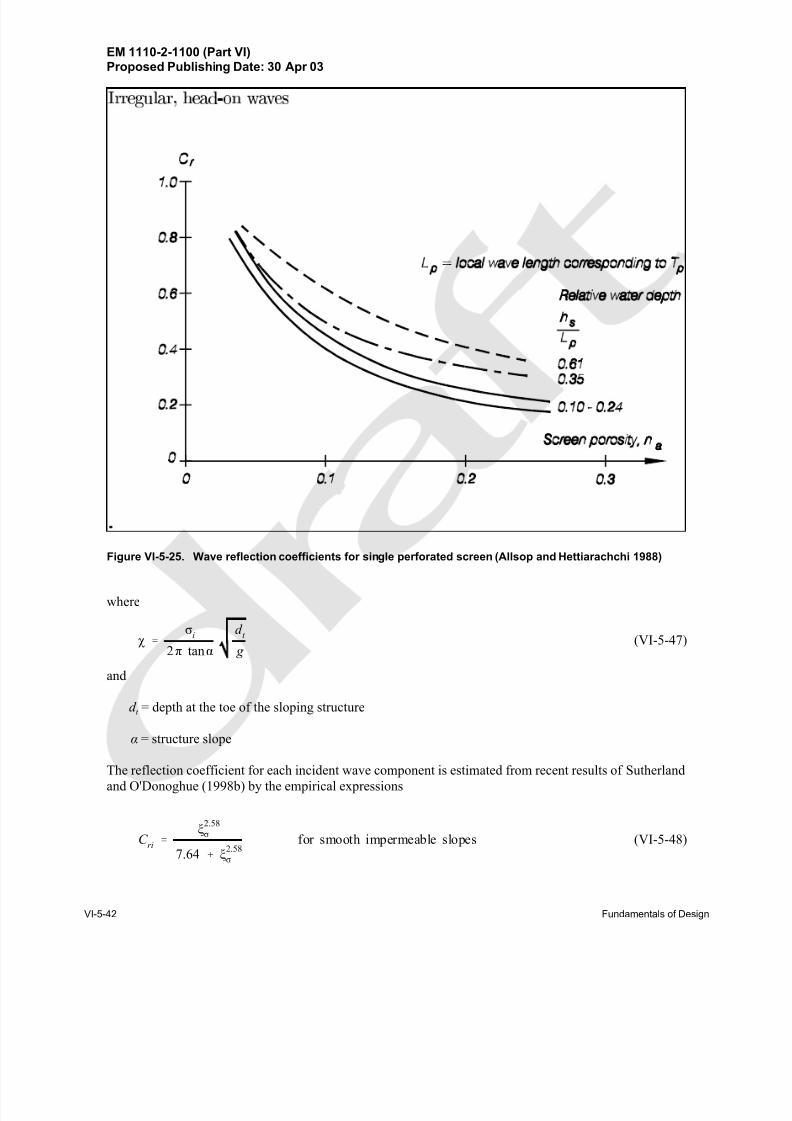
8/13/2019 CEM PartVI-Chap5p1, Fundamentals of Design
http://slidepdf.com/reader/full/cem-partvi-chap5p1-fundamentals-of-design 58/150
EM 1110-2-1100 (Part VI)Proposed Publishing Date: 30 Apr 03
VI-5-42 Fundamentals of Design
Figure VI-5-25. Wave reflection coefficients for single perforated screen (Allsop and Hettiarachchi 1988)
where
(VI-5-47)χ '
σi
2π tanα
d t
g
and
d t = depth at the toe of the sloping structure
α = structure slope
The reflection coefficient for each incident wave component is estimated from recent results of Sutherland
and O'Donoghue (1998b) by the empirical expressions
(VI-5-48)C ri
'
ξ2.58
σ
7.64 % ξ2.58
σ
for smooth impermeable slopes
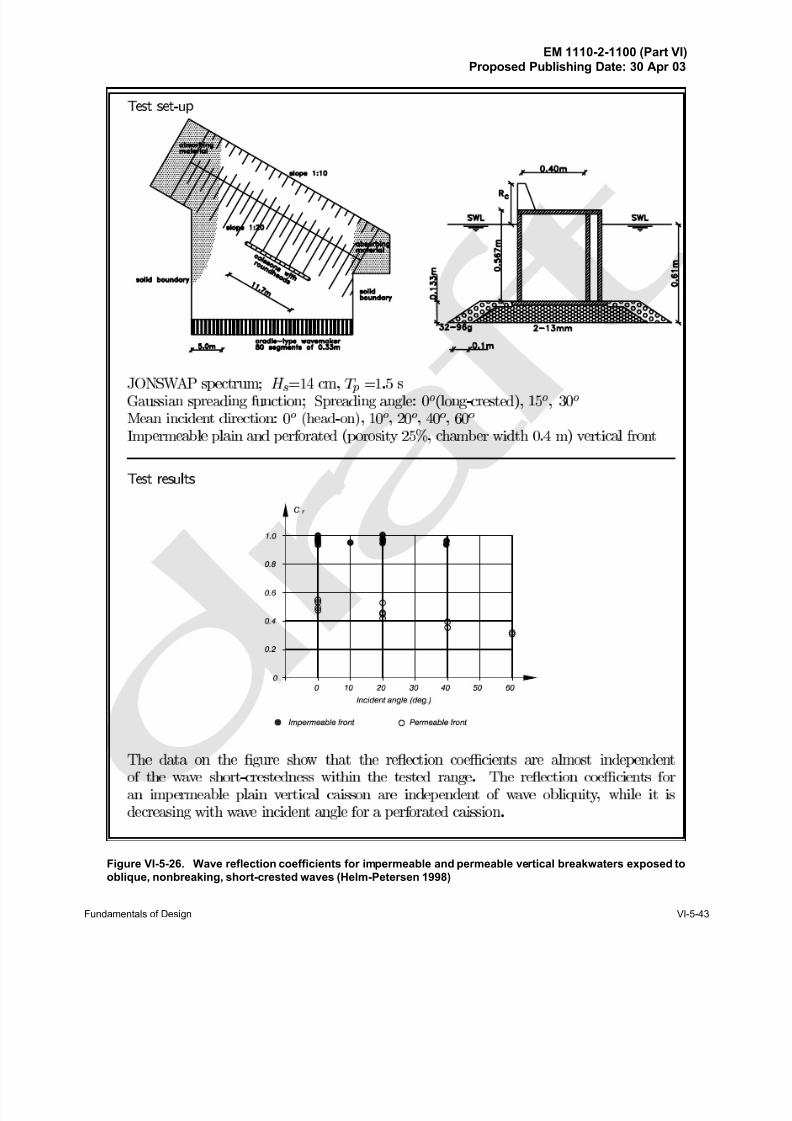
8/13/2019 CEM PartVI-Chap5p1, Fundamentals of Design
http://slidepdf.com/reader/full/cem-partvi-chap5p1-fundamentals-of-design 59/150
EM 1110-2-1100 (Part VI)Proposed Publishing Date: 30 Apr 03
Fundamentals of Design VI-5-43
Æ
Æ
Figure VI-5-26. Wave reflection coefficients for impermeable and permeable vertical breakwaters exposed to
oblique, nonbreaking, short-crested waves (Helm-Petersen 1998)
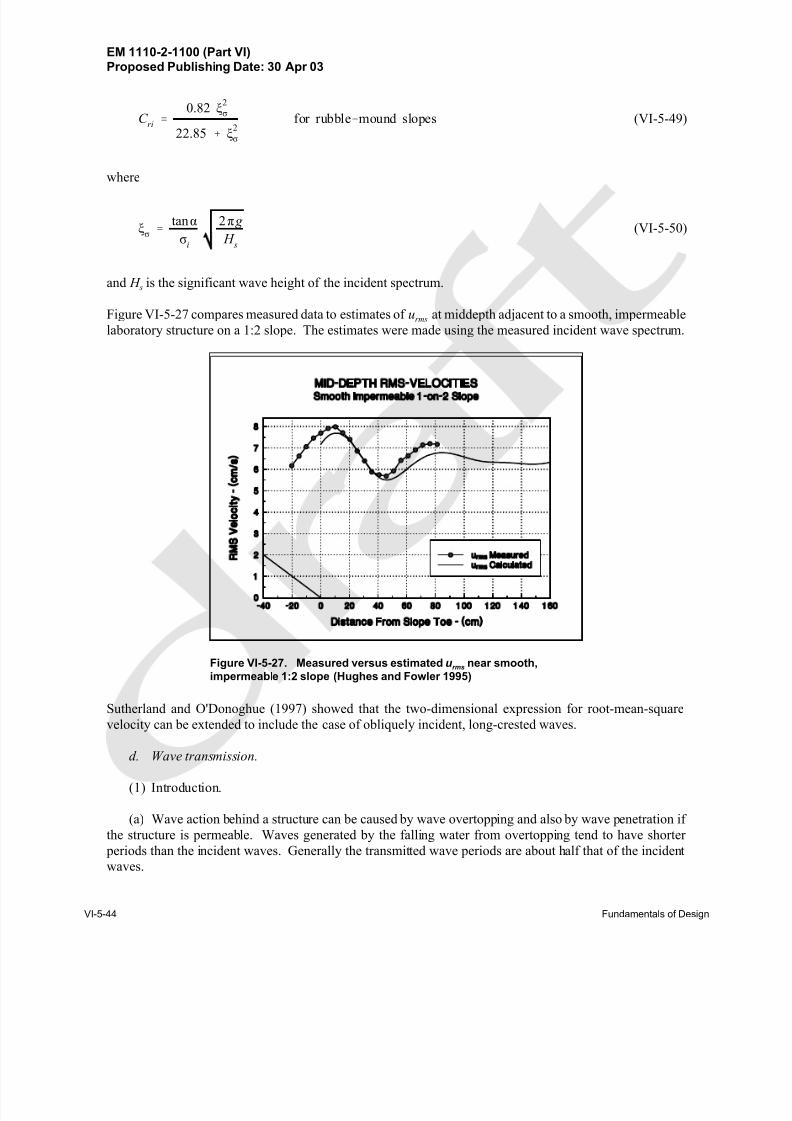
8/13/2019 CEM PartVI-Chap5p1, Fundamentals of Design
http://slidepdf.com/reader/full/cem-partvi-chap5p1-fundamentals-of-design 60/150
EM 1110-2-1100 (Part VI)Proposed Publishing Date: 30 Apr 03
VI-5-44 Fundamentals of Design
Figure VI-5-27. Measured versus estimated u rms
near smooth,
impermeable 1:2 slope (Hughes and Fowler 1995)
(VI-5-49)C ri
'
0.82 ξ2
σ
22.85 % ξ2
σ
for rubble&mound slopes
where
(VI-5-50)ξσ
'tanα
σi
2π g
H s
and H s is the significant wave height of the incident spectrum.
Figure VI-5-27 compares measured data to estimates of urms at middepth adjacent to a smooth, impermeable
laboratory structure on a 1:2 slope. The estimates were made using the measured incident wave spectrum.
Sutherland and O'Donoghue (1997) showed that the two-dimensional expression for root-mean-square
velocity can be extended to include the case of obliquely incident, long-crested waves.
d. Wave transmission.
(1) Introduction.
(a) Wave action behind a structure can be caused by wave overtopping and also by wave penetration if
the structure is permeable. Waves generated by the falling water from overtopping tend to have shorter
periods than the incident waves. Generally the transmitted wave periods are about half that of the incident
waves.
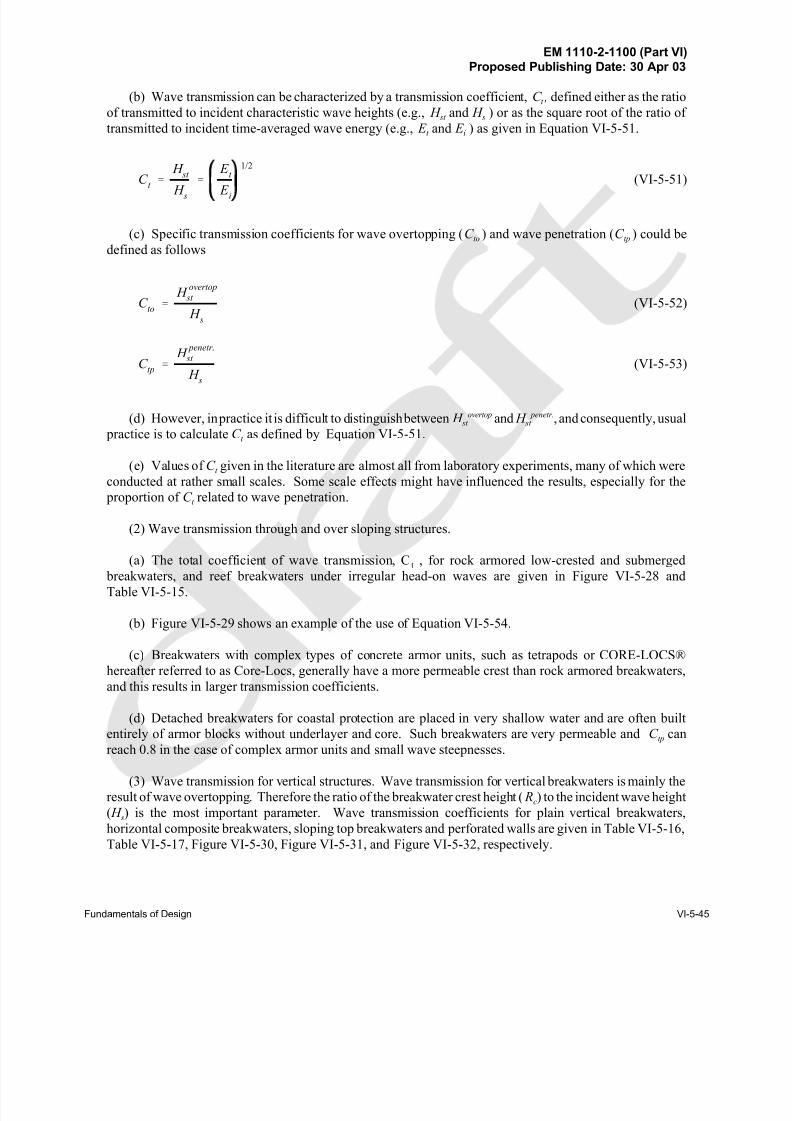
8/13/2019 CEM PartVI-Chap5p1, Fundamentals of Design
http://slidepdf.com/reader/full/cem-partvi-chap5p1-fundamentals-of-design 61/150
EM 1110-2-1100 (Part VI)Proposed Publishing Date: 30 Apr 03
Fundamentals of Design VI-5-45
(b) Wave transmission can be characterized by a transmission coefficient, C t , defined either as the ratio
of transmitted to incident characteristic wave heights (e.g., H st and H s ) or as the square root of the ratio of
transmitted to incident time-averaged wave energy (e.g., E t and E i ) as given in Equation VI-5-51.
(VI-5-51)C t
'
H st
H s'
E t
E i
1/2
(c) Specific transmission coefficients for wave overtopping (C to ) and wave penetration (C tp ) could be
defined as follows
(VI-5-52)C to
'
H overtop
st
H s
(VI-5-53)C tp
'
H penetr .
st
H s
(d) However, in practice it is difficult to distinguish between H st overtop and H st
penetr., and consequently, usual
practice is to calculate C t as defined by Equation VI-5-51.
(e) Values of C t given in the literature are almost all from laboratory experiments, many of which were
conducted at rather small scales. Some scale effects might have influenced the results, especially for the
proportion of C t related to wave penetration.
(2) Wave transmission through and over sloping structures.
(a) The total coefficient of wave transmission, Ct
, for rock armored low-crested and submerged
breakwaters, and reef breakwaters under irregular head-on waves are given in Figure VI-5-28 and
Table VI-5-15.
(b) Figure VI-5-29 shows an example of the use of Equation VI-5-54.
(c) Breakwaters with complex types of concrete armor units, such as tetrapods or CORE-LOCS®
hereafter referred to as Core-Locs, generally have a more permeable crest than rock armored breakwaters,
and this results in larger transmission coefficients.
(d) Detached breakwaters for coastal protection are placed in very shallow water and are often built
entirely of armor blocks without underlayer and core. Such breakwaters are very permeable and C tp can
reach 0.8 in the case of complex armor units and small wave steepnesses.
(3) Wave transmission for vertical structures. Wave transmission for vertical breakwaters is mainly the
result of wave overtopping. Therefore the ratio of the breakwater crest height ( Rc) to the incident wave height
( H s) is the most important parameter. Wave transmission coefficients for plain vertical breakwaters,
horizontal composite breakwaters, sloping top breakwaters and perforated walls are given in Table VI-5-16,
Table VI-5-17, Figure VI-5-30, Figure VI-5-31, and Figure VI-5-32, respectively.
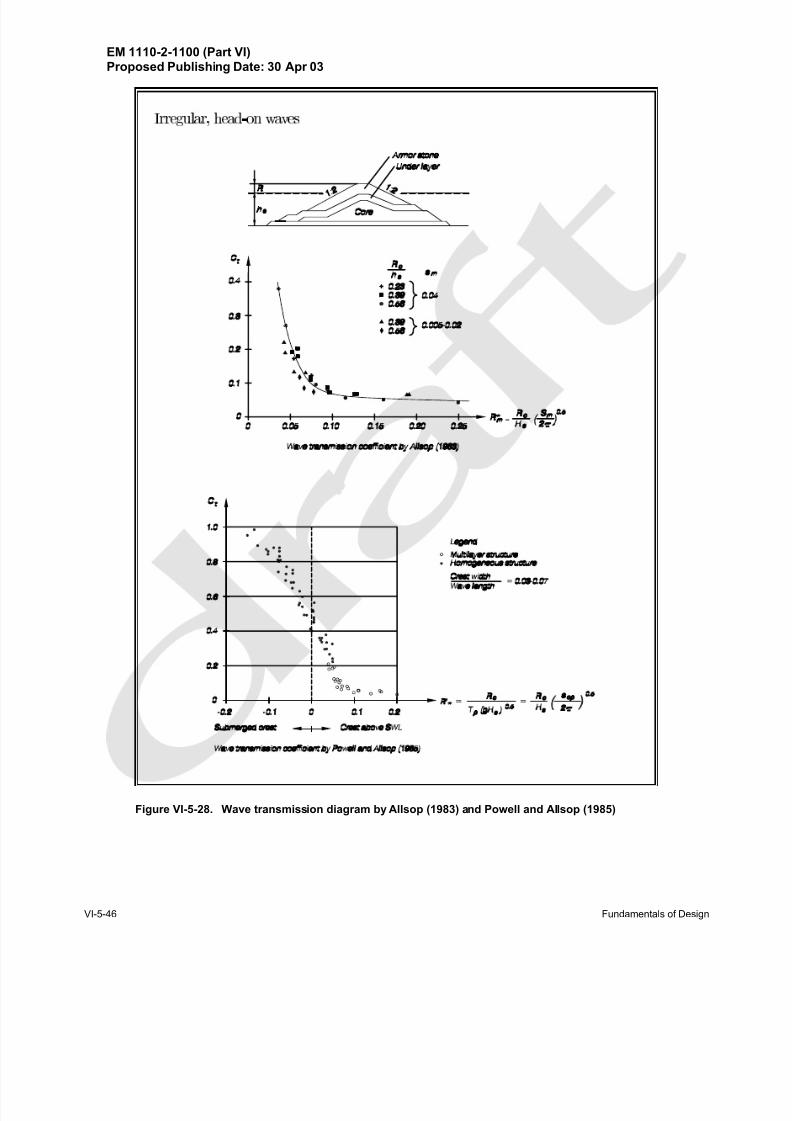
8/13/2019 CEM PartVI-Chap5p1, Fundamentals of Design
http://slidepdf.com/reader/full/cem-partvi-chap5p1-fundamentals-of-design 62/150
EM 1110-2-1100 (Part VI)Proposed Publishing Date: 30 Apr 03
VI-5-46 Fundamentals of Design
I r r e g u l a r , h e a d - o n w a v e s
Figure VI-5-28. Wave transmission diagram by Allsop (1983) and Powell and Allsop (1985)
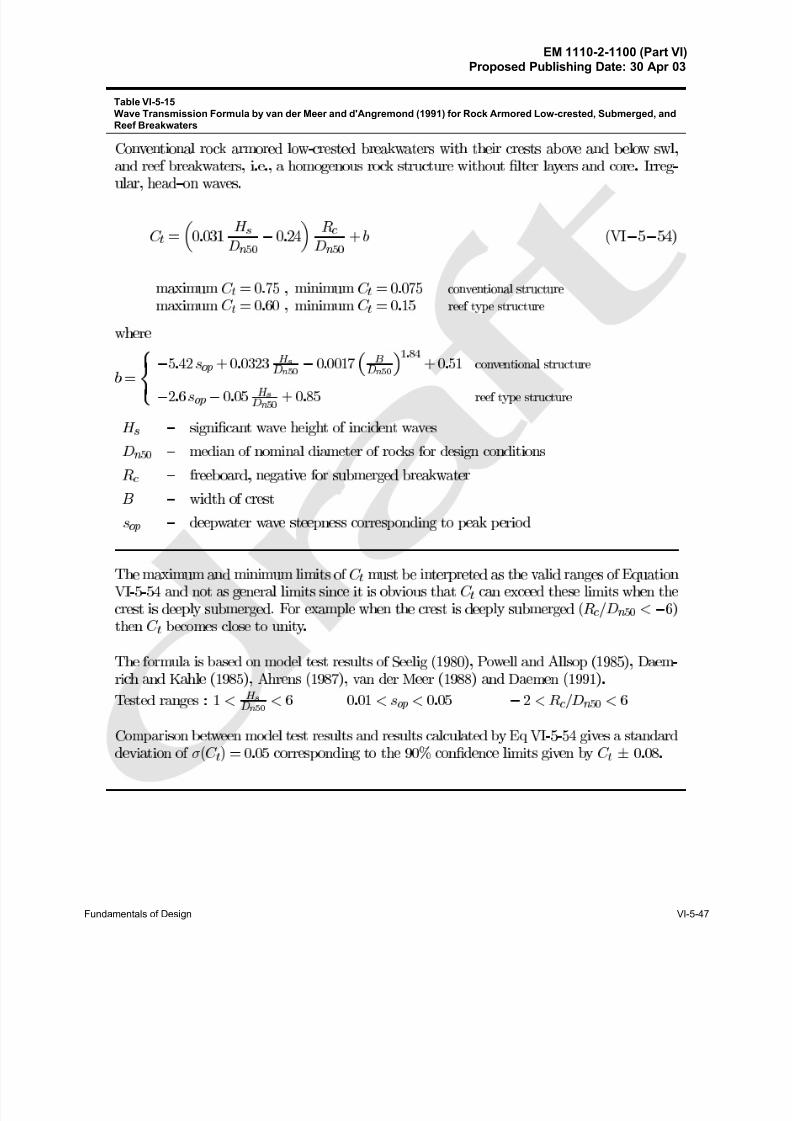
8/13/2019 CEM PartVI-Chap5p1, Fundamentals of Design
http://slidepdf.com/reader/full/cem-partvi-chap5p1-fundamentals-of-design 63/150
EM 1110-2-1100 (Part VI)Proposed Publishing Date: 30 Apr 03
Fundamentals of Design VI-5-47
Table VI-5-15
Wave Transmission Formula by van der Meer and d'Angremond (1991) for Rock Armored Low-crested, Submerged, andReef Breakwaters
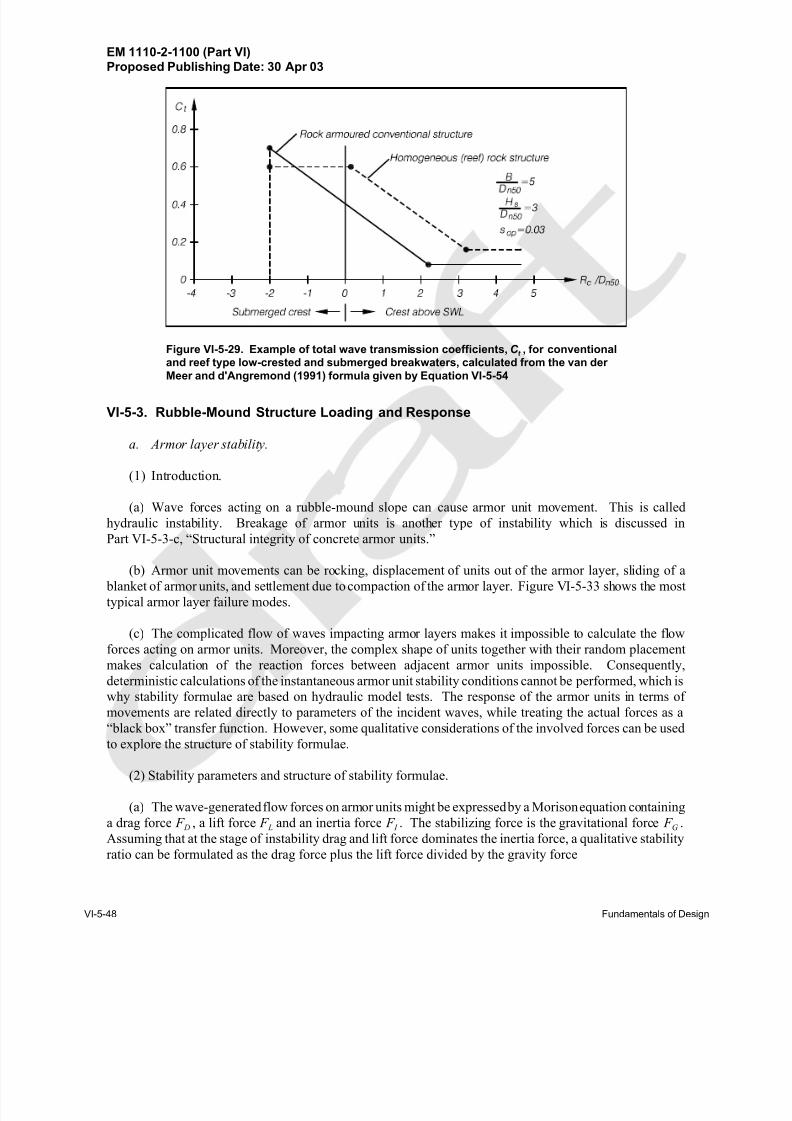
8/13/2019 CEM PartVI-Chap5p1, Fundamentals of Design
http://slidepdf.com/reader/full/cem-partvi-chap5p1-fundamentals-of-design 64/150
EM 1110-2-1100 (Part VI)Proposed Publishing Date: 30 Apr 03
VI-5-48 Fundamentals of Design
Figure VI-5-29. Example of total wave transmission coefficients, C t , for conventionaland reef type low-crested and submerged breakwaters, calculated from the van der
Meer and d'Angremond (1991) formula given by Equation VI-5-54
VI-5-3. Rubble-Mound Structure Loading and Response
a. Armor layer stability.
(1) Introduction.
(a) Wave forces acting on a rubble-mound slope can cause armor unit movement. This is called
hydraulic instability. Breakage of armor units is another type of instability which is discussed in
Part VI-5-3-c, “Structural integrity of concrete armor units.”
(b) Armor unit movements can be rocking, displacement of units out of the armor layer, sliding of a blanket of armor units, and settlement due to compaction of the armor layer. Figure VI-5-33 shows the most
typical armor layer failure modes.
(c) The complicated flow of waves impacting armor layers makes it impossible to calculate the flow
forces acting on armor units. Moreover, the complex shape of units together with their random placement
makes calculation of the reaction forces between adjacent armor units impossible. Consequently,
deterministic calculations of the instantaneous armor unit stability conditions cannot be performed, which is
why stability formulae are based on hydraulic model tests. The response of the armor units in terms of
movements are related directly to parameters of the incident waves, while treating the actual forces as a
“black box” transfer function. However, some qualitative considerations of the involved forces can be used
to explore the structure of stability formulae.
(2) Stability parameters and structure of stability formulae.
(a) The wave-generated flow forces on armor units might be expressed by a Morison equation containing
a drag force F D , a lift force F L and an inertia force F I . The stabilizing force is the gravitational force F G .
Assuming that at the stage of instability drag and lift force dominates the inertia force, a qualitative stability
ratio can be formulated as the drag force plus the lift force divided by the gravity force
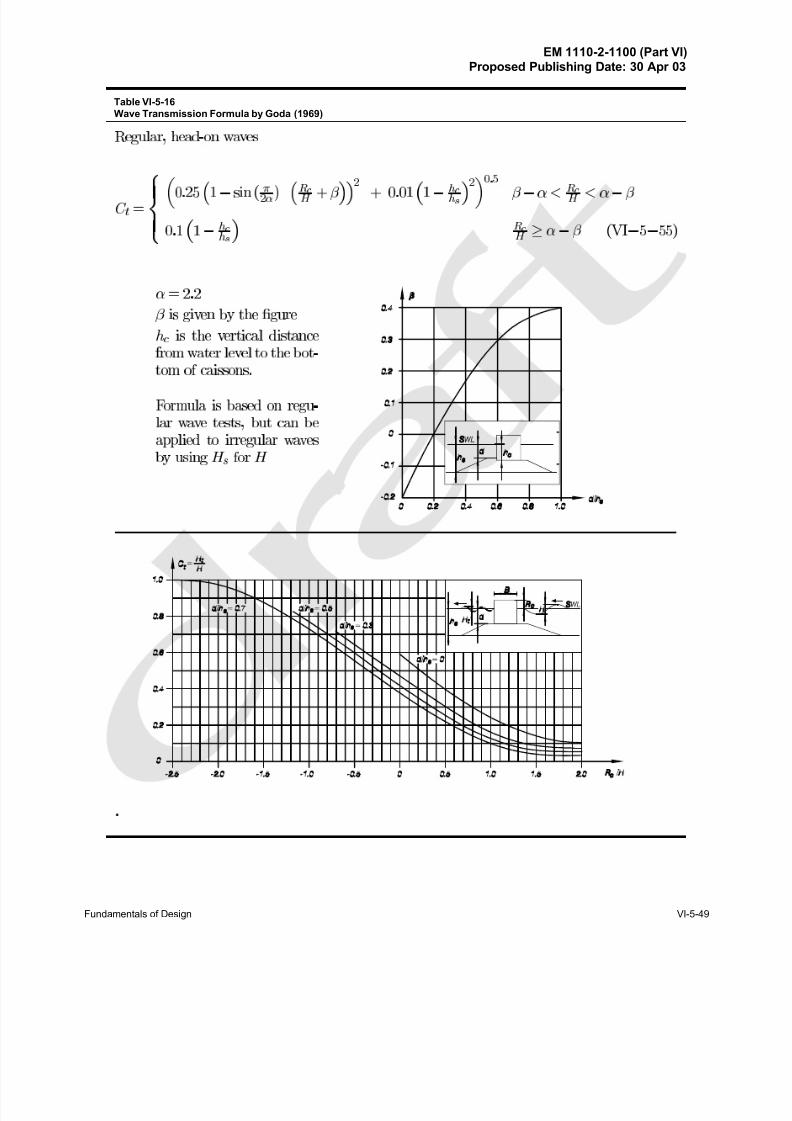
8/13/2019 CEM PartVI-Chap5p1, Fundamentals of Design
http://slidepdf.com/reader/full/cem-partvi-chap5p1-fundamentals-of-design 65/150
EM 1110-2-1100 (Part VI)Proposed Publishing Date: 30 Apr 03
Fundamentals of Design VI-5-49
R e g u l a r , h e a d - o n w a v e s
C
t
=
8
>
>
>
<
>
>
>
:
0 : 2 5
1 ; s i n
;
2
R
c
H
+
2
+ 0 : 0 1
1 ;
h
c
h
s
2
0 5
; <
R
c
H
< ;
0 : 1
1 ;
h
c
h
s
R
c
H
; ( V I ; 5 ; 5 5 )
= 2 : 2
i s g i v e n b y t h e g u r e
h
c
i s t h e v e r t i c a l d i s t a n c e
f r o m w a t e r l e v e l t o t h e b o t -
t o m o f c a i s s o n s .
F o r m u l a i s b a s e d o n r e g u -
l a r w a v e t e s t s , b u t c a n b e
a p p l i e d t o i r r e g u l a r w a v e s
b y u s i n g H
s
f o r H
.
Table VI-5-16
Wave Transmission Formula by Goda (1969)
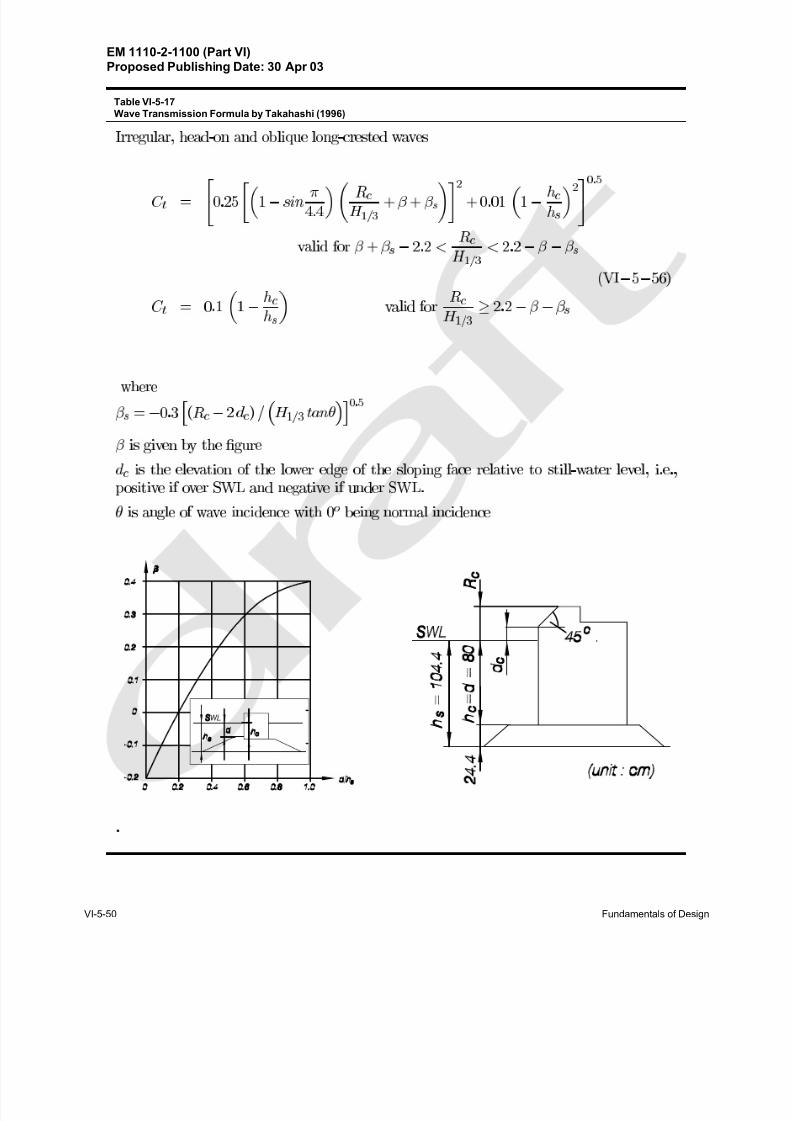
8/13/2019 CEM PartVI-Chap5p1, Fundamentals of Design
http://slidepdf.com/reader/full/cem-partvi-chap5p1-fundamentals-of-design 66/150
EM 1110-2-1100 (Part VI)Proposed Publishing Date: 30 Apr 03
VI-5-50 Fundamentals of Design
Table VI-5-17
Wave Transmission Formula by Takahashi (1996)
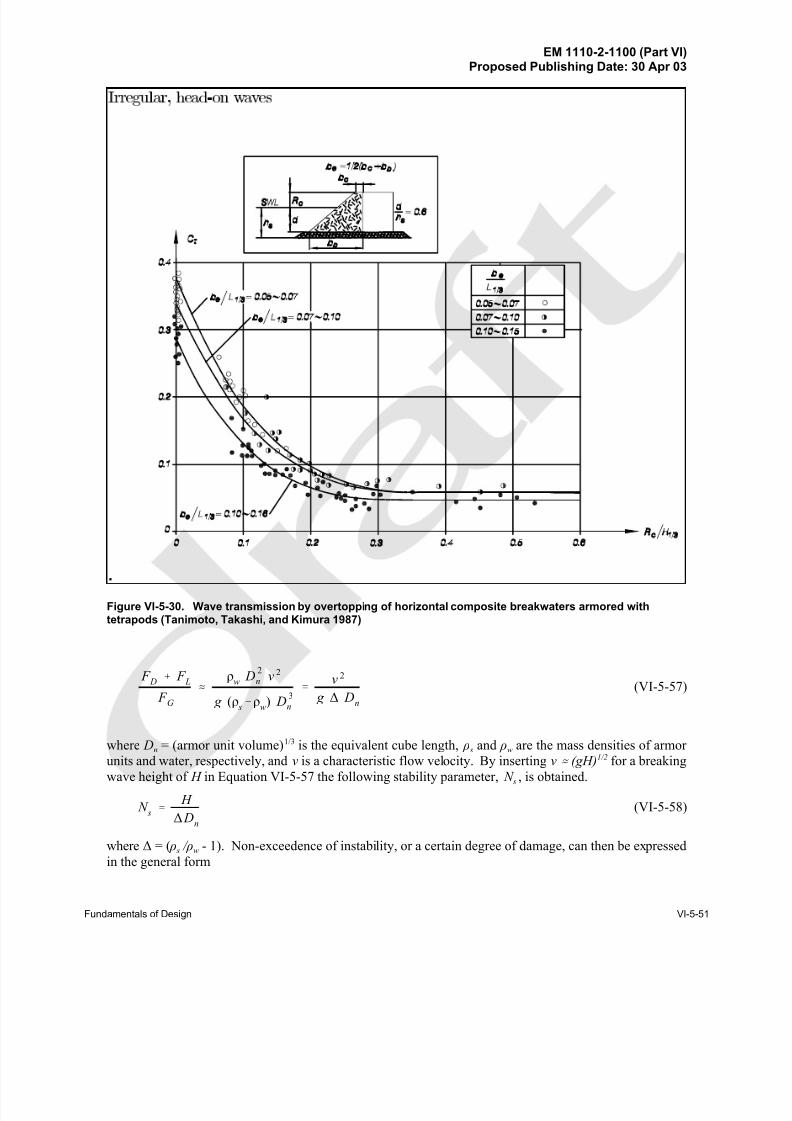
8/13/2019 CEM PartVI-Chap5p1, Fundamentals of Design
http://slidepdf.com/reader/full/cem-partvi-chap5p1-fundamentals-of-design 67/150
EM 1110-2-1100 (Part VI)Proposed Publishing Date: 30 Apr 03
Fundamentals of Design VI-5-51
Figure VI-5-30. Wave transmission by overtopping of horizontal composite breakwaters armored withtetrapods (Tanimoto, Takashi, and Kimura 1987)
(VI-5-57) F
D % F
L
F G
.
ρw
D2
n v 2
g (ρ s&ρ
w) D
3
n
'v 2
g ∆ Dn
where Dn = (armor unit volume)1/3 is the equivalent cube length, ρ s and ρw are the mass densities of armor
units and water, respectively, and v is a characteristic flow velocity. By inserting v . (gH)1/2 for a breakingwave height of H in Equation VI-5-57 the following stability parameter, N s , is obtained.
(VI-5-58) N s '
H
∆ Dn
where ∆ = ( ρ s / ρw - 1). Non-exceedence of instability, or a certain degree of damage, can then be expressed
in the general form
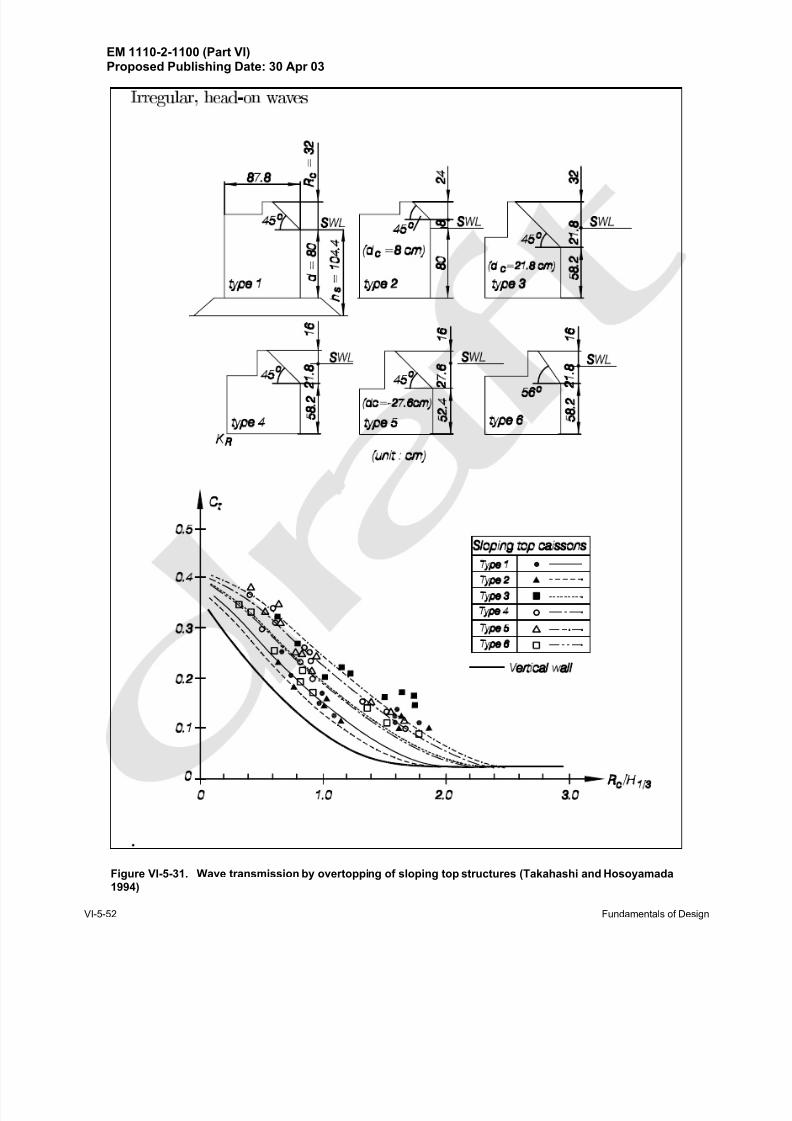
8/13/2019 CEM PartVI-Chap5p1, Fundamentals of Design
http://slidepdf.com/reader/full/cem-partvi-chap5p1-fundamentals-of-design 68/150
EM 1110-2-1100 (Part VI)Proposed Publishing Date: 30 Apr 03
VI-5-52 Fundamentals of Design
Figure VI-5-31. Wave transmission by overtopping of sloping top structures (Takahashi and Hosoyamada
1994)
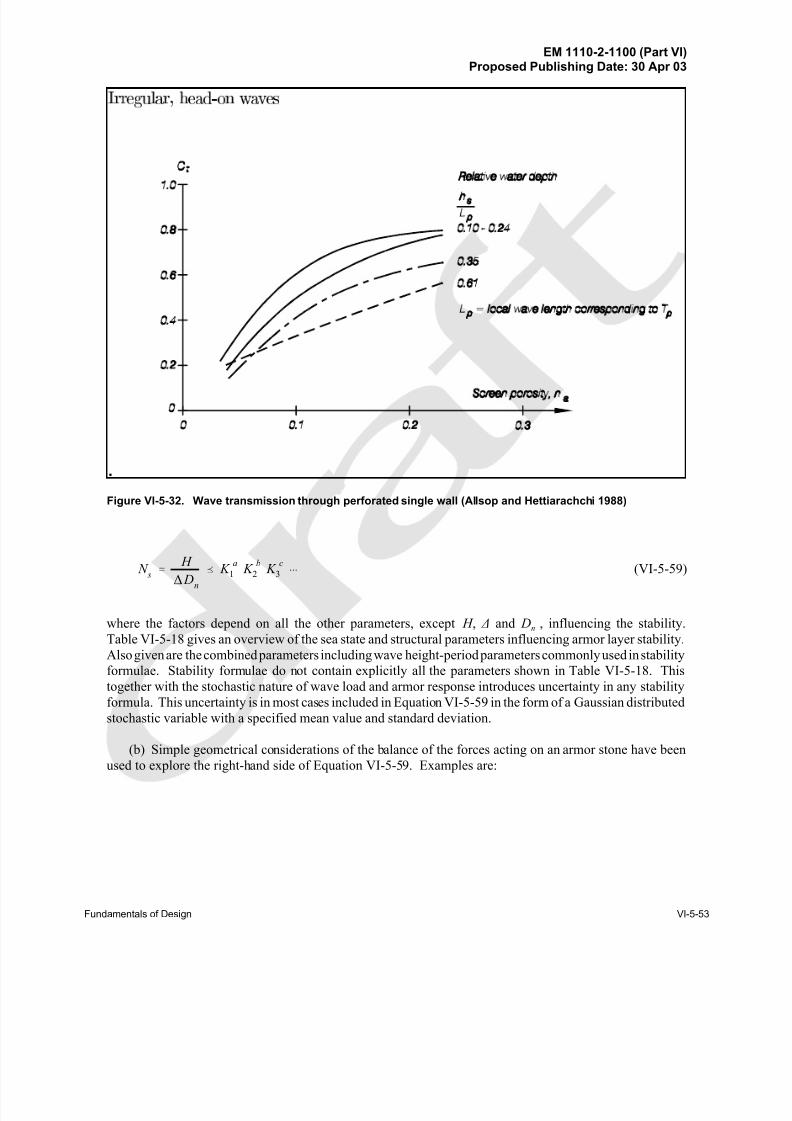
8/13/2019 CEM PartVI-Chap5p1, Fundamentals of Design
http://slidepdf.com/reader/full/cem-partvi-chap5p1-fundamentals-of-design 69/150
EM 1110-2-1100 (Part VI)Proposed Publishing Date: 30 Apr 03
Fundamentals of Design VI-5-53
Figure VI-5-32. Wave transmission through perforated single wall (Allsop and Hettiarachchi 1988)
(VI-5-59) N s ' H ∆ D
n
˜ K a
1 K b
2 K c
3 þ
where the factors depend on all the other parameters, except H , ∆ and Dn , influencing the stability.
Table VI-5-18 gives an overview of the sea state and structural parameters influencing armor layer stability.
Also given are the combined parameters including wave height-period parameters commonly used in stability
formulae. Stability formulae do not contain explicitly all the parameters shown in Table VI-5-18. This
together with the stochastic nature of wave load and armor response introduces uncertainty in any stability
formula. This uncertainty is in most cases included in Equation VI-5-59 in the form of a Gaussian distributed
stochastic variable with a specified mean value and standard deviation.
(b) Simple geometrical considerations of the balance of the forces acting on an armor stone have been
used to explore the right-hand side of Equation VI-5-59. Examples are:
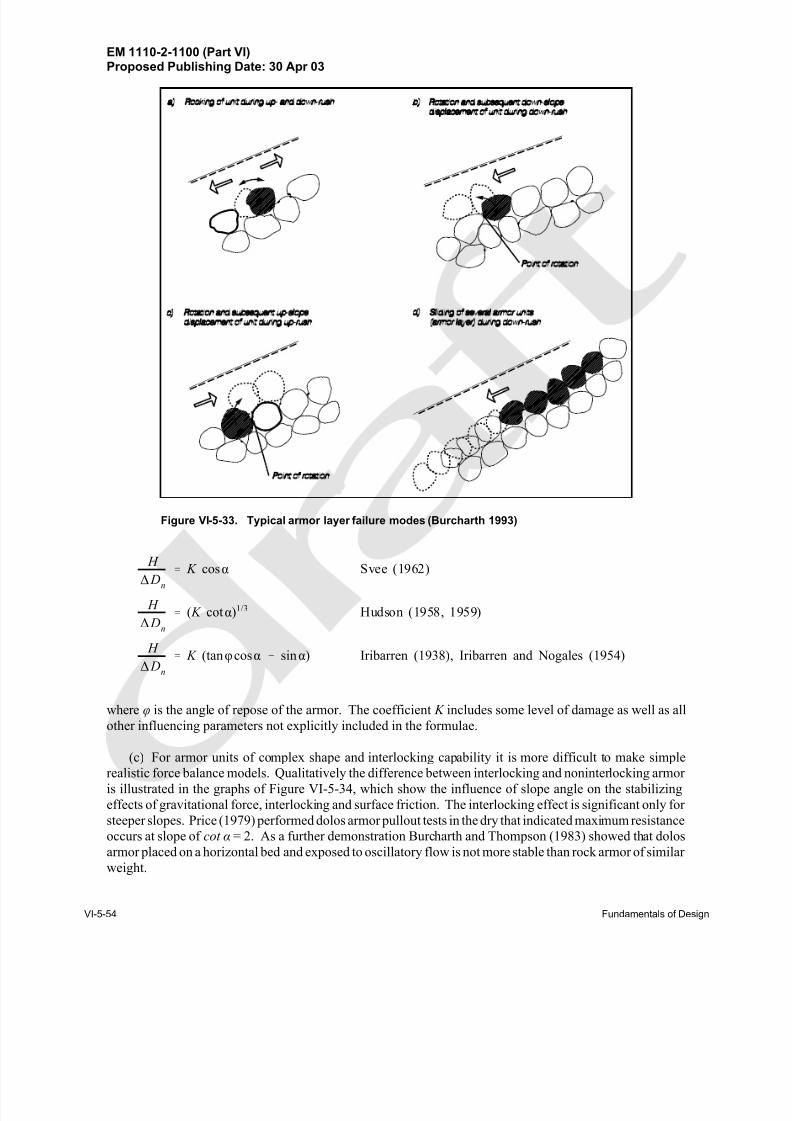
8/13/2019 CEM PartVI-Chap5p1, Fundamentals of Design
http://slidepdf.com/reader/full/cem-partvi-chap5p1-fundamentals-of-design 70/150
EM 1110-2-1100 (Part VI)Proposed Publishing Date: 30 Apr 03
VI-5-54 Fundamentals of Design
Figure VI-5-33. Typical armor layer failure modes (Burcharth 1993)
H ∆ D
n
' K cosα Svee (1962)
H
∆ Dn
' ( K cotα)1/3 Hudson (1958, 1959)
H
∆ Dn
' K (tanφcosα & sinα) Iribarren (1938), Iribarren and Nogales (1954)
where φ is the angle of repose of the armor. The coefficient K includes some level of damage as well as all
other influencing parameters not explicitly included in the formulae.
(c) For armor units of complex shape and interlocking capability it is more difficult to make simplerealistic force balance models. Qualitatively the difference between interlocking and noninterlocking armor
is illustrated in the graphs of Figure VI-5-34, which show the influence of slope angle on the stabilizing
effects of gravitational force, interlocking and surface friction. The interlocking effect is significant only for
steeper slopes. Price (1979) performed dolos armor pullout tests in the dry that indicated maximum resistance
occurs at slope of cot α = 2. As a further demonstration Burcharth and Thompson (1983) showed that dolos
armor placed on a horizontal bed and exposed to oscillatory flow is not more stable than rock armor of similar
weight.
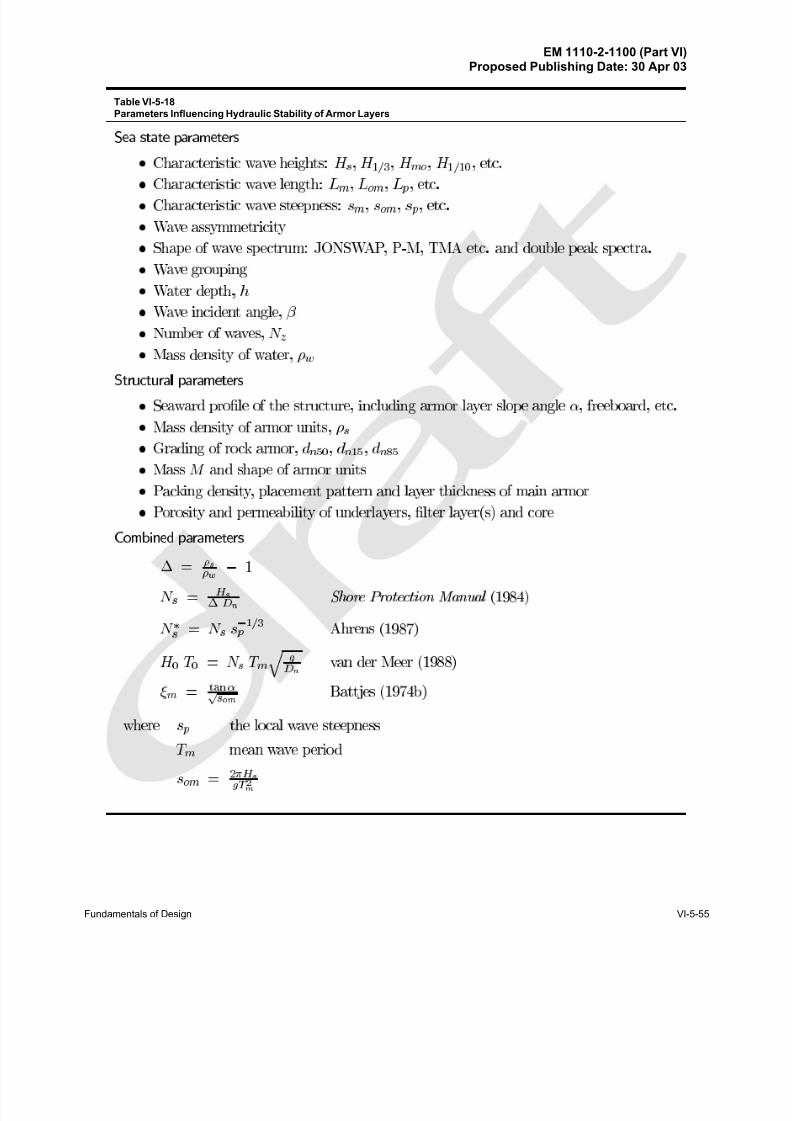
8/13/2019 CEM PartVI-Chap5p1, Fundamentals of Design
http://slidepdf.com/reader/full/cem-partvi-chap5p1-fundamentals-of-design 71/150
EM 1110-2-1100 (Part VI)Proposed Publishing Date: 30 Apr 03
Fundamentals of Design VI-5-55
Table VI-5-18
Parameters Influencing Hydraulic Stability of Armor Layers
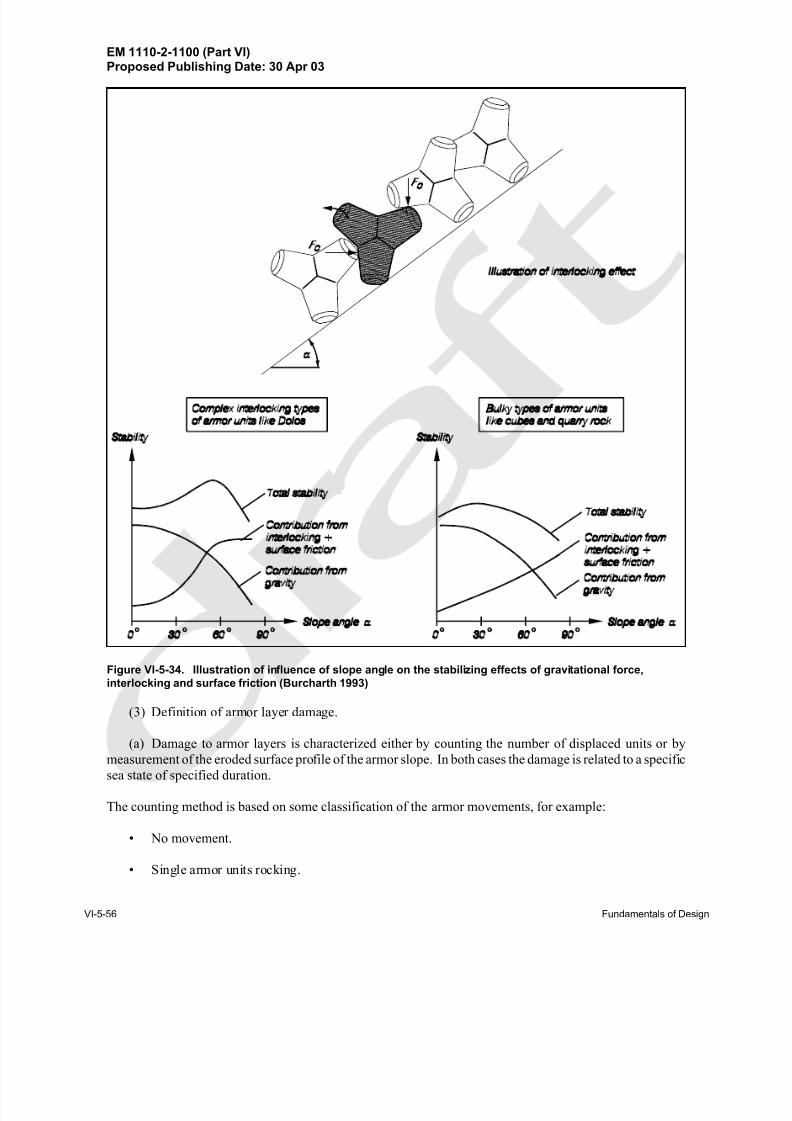
8/13/2019 CEM PartVI-Chap5p1, Fundamentals of Design
http://slidepdf.com/reader/full/cem-partvi-chap5p1-fundamentals-of-design 72/150
EM 1110-2-1100 (Part VI)Proposed Publishing Date: 30 Apr 03
VI-5-56 Fundamentals of Design
Figure VI-5-34. Illustration of influence of slope angle on the stabilizing effects of gravitational force,
interlocking and surface friction (Burcharth 1993)
(3) Definition of armor layer damage.
(a) Damage to armor layers is characterized either by counting the number of displaced units or by
measurement of the eroded surface profile of the armor slope. In both cases the damage is related to a specificsea state of specified duration.
The counting method is based on some classification of the armor movements, for example:
• No movement.
• Single armor units rocking.
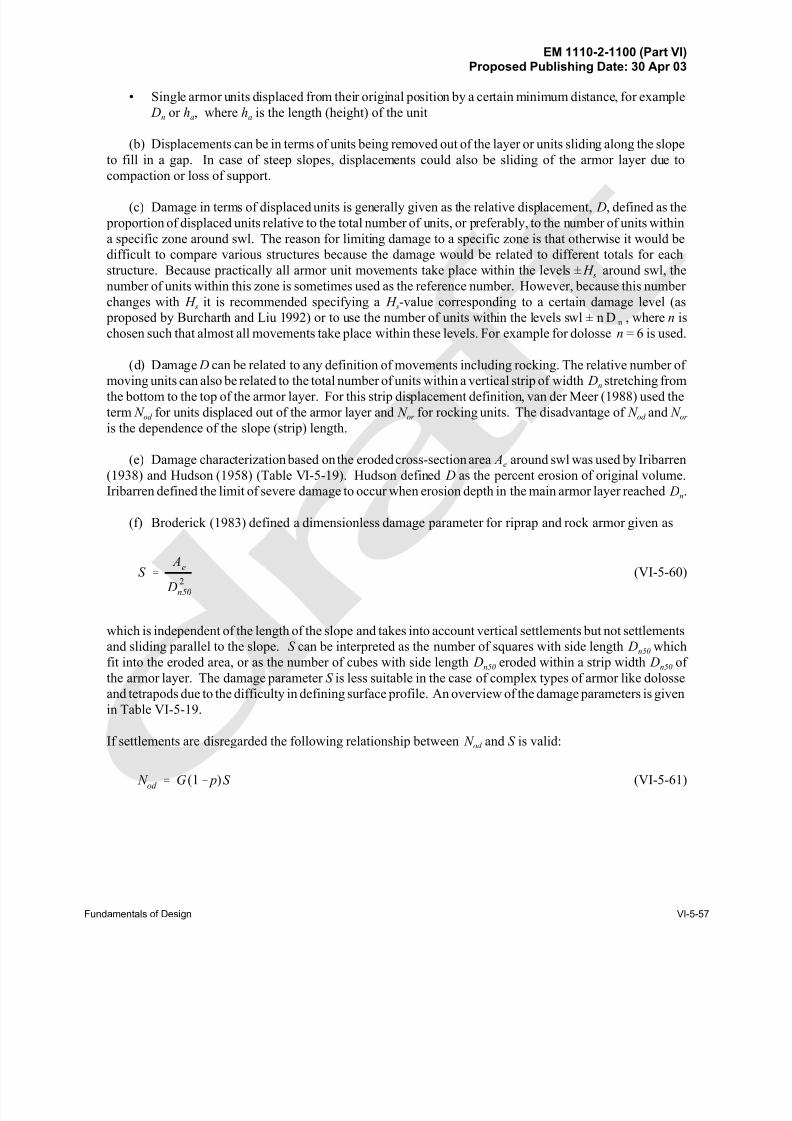
8/13/2019 CEM PartVI-Chap5p1, Fundamentals of Design
http://slidepdf.com/reader/full/cem-partvi-chap5p1-fundamentals-of-design 73/150
EM 1110-2-1100 (Part VI)Proposed Publishing Date: 30 Apr 03
Fundamentals of Design VI-5-57
• Single armor units displaced from their original position by a certain minimum distance, for example
Dn or ha, where ha is the length (height) of the unit
(b) Displacements can be in terms of units being removed out of the layer or units sliding along the slope
to fill in a gap. In case of steep slopes, displacements could also be sliding of the armor layer due to
compaction or loss of support.
(c) Damage in terms of displaced units is generally given as the relative displacement, D, defined as the
proportion of displaced units relative to the total number of units, or preferably, to the number of units within
a specific zone around swl. The reason for limiting damage to a specific zone is that otherwise it would be
difficult to compare various structures because the damage would be related to different totals for each
structure. Because practically all armor unit movements take place within the levels ± H s around swl, the
number of units within this zone is sometimes used as the reference number. However, because this number
changes with H s it is recommended specifying a H s-value corresponding to a certain damage level (as
proposed by Burcharth and Liu 1992) or to use the number of units within the levels swl ± n Dn , where n is
chosen such that almost all movements take place within these levels. For example for dolosse n = 6 is used.
(d) Damage D can be related to any definition of movements including rocking. The relative number of
moving units can also be related to the total number of units within a vertical strip of width Dn stretching fromthe bottom to the top of the armor layer. For this strip displacement definition, van der Meer (1988) used the
term N od for units displaced out of the armor layer and N or for rocking units. The disadvantage of N od and N or
is the dependence of the slope (strip) length.
(e) Damage characterization based on the eroded cross-section area Ae around swl was used by Iribarren
(1938) and Hudson (1958) (Table VI-5-19). Hudson defined D as the percent erosion of original volume.
Iribarren defined the limit of severe damage to occur when erosion depth in the main armor layer reached Dn.
(f) Broderick (1983) defined a dimensionless damage parameter for riprap and rock armor given as
(VI-5-60)S ' Ae
D2
n50
which is independent of the length of the slope and takes into account vertical settlements but not settlements
and sliding parallel to the slope. S can be interpreted as the number of squares with side length Dn50 which
fit into the eroded area, or as the number of cubes with side length Dn50 eroded within a strip width Dn50 of
the armor layer. The damage parameter S is less suitable in the case of complex types of armor like dolosse
and tetrapods due to the difficulty in defining surface profile. An overview of the damage parameters is given
in Table VI-5-19.
If settlements are disregarded the following relationship between N od and S is valid:
(VI-5-61) N od ' G (1& p)S
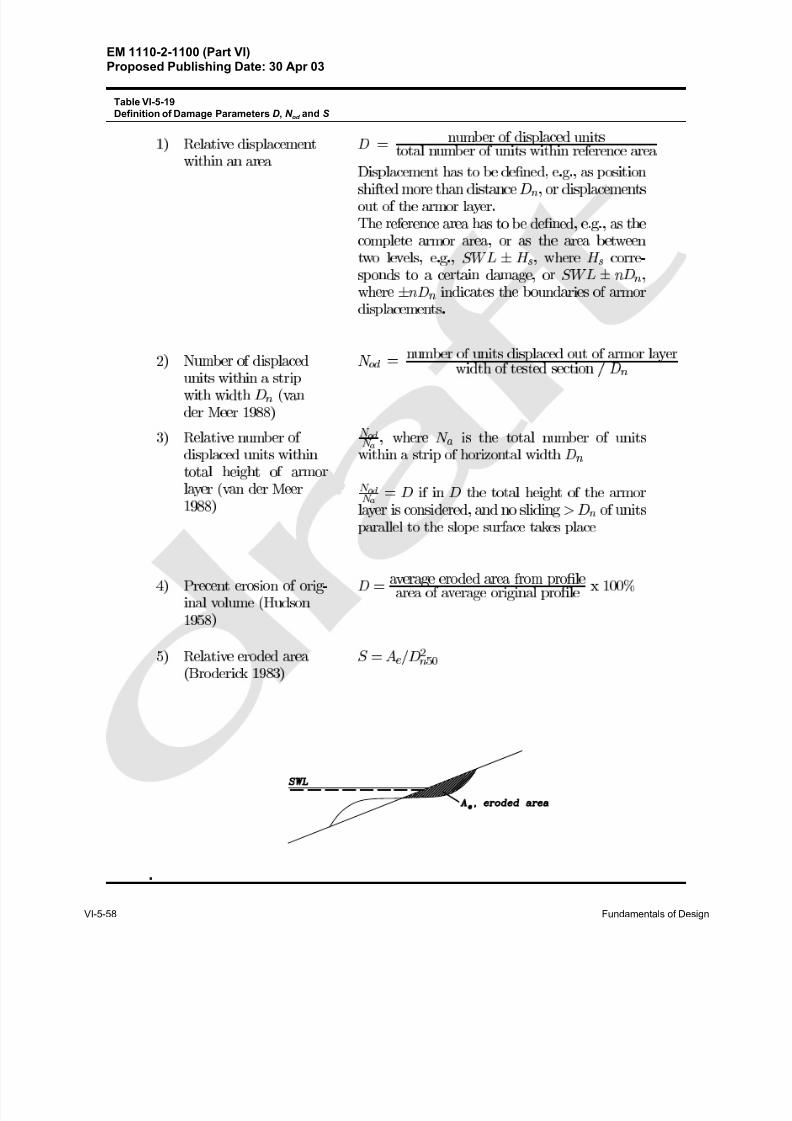
8/13/2019 CEM PartVI-Chap5p1, Fundamentals of Design
http://slidepdf.com/reader/full/cem-partvi-chap5p1-fundamentals-of-design 74/150
EM 1110-2-1100 (Part VI)Proposed Publishing Date: 30 Apr 03
VI-5-58 Fundamentals of Design
Table VI-5-19
Definition of Damage Parameters D, N od
and S
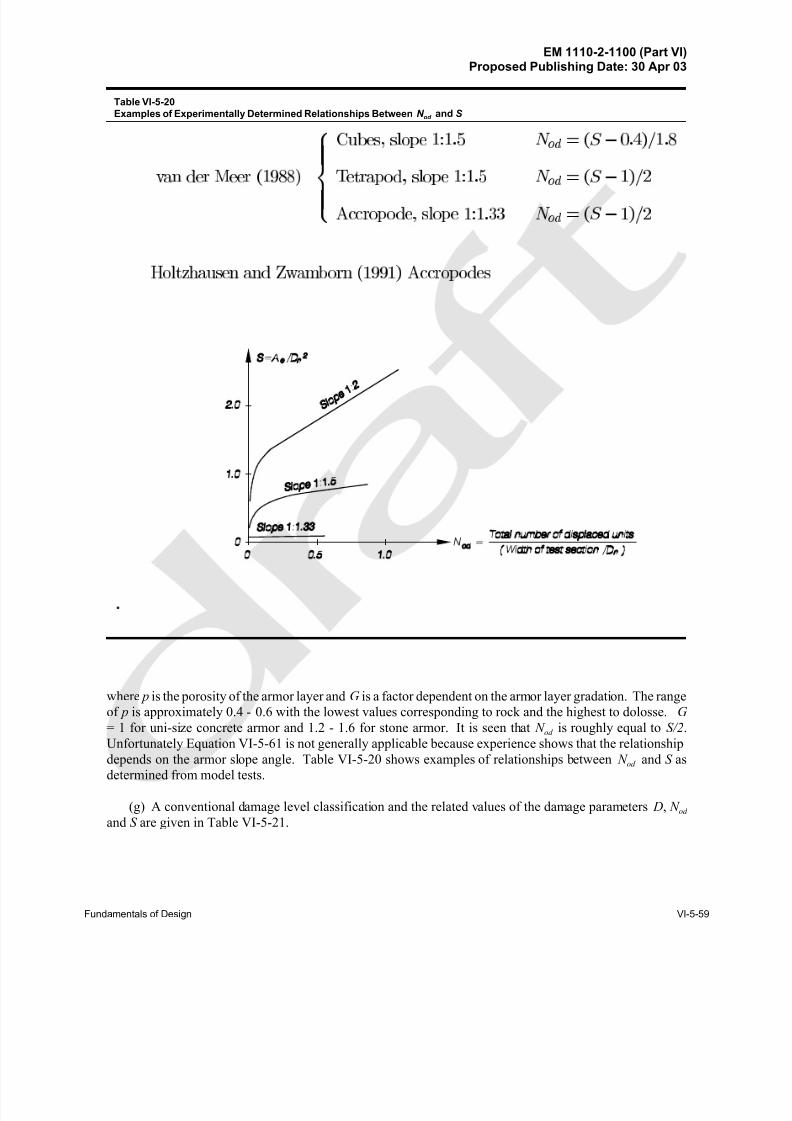
8/13/2019 CEM PartVI-Chap5p1, Fundamentals of Design
http://slidepdf.com/reader/full/cem-partvi-chap5p1-fundamentals-of-design 75/150
EM 1110-2-1100 (Part VI)Proposed Publishing Date: 30 Apr 03
Fundamentals of Design VI-5-59
v a n d e r M e e r ( 1 9 8 8 )
8
>
>
>
>
<
>
>
>
>
:
C u b e s , s l o p e 1 : 1 . 5 N
o d
= ( S ; 0 : 4 ) = 1 : 8
T e t r a p o d , s l o p e 1 : 1 . 5 N
o d
= ( S ; 1 ) = 2
A c c r o p o d e , s l o p e 1 : 1 . 3 3 N
o d
= ( S ; 1 ) = 2
H o l t z h a u s e n a n d Z w a m b o r n ( 1 9 9 1 ) A c c r o p o d e s
.
Table VI-5-20
Examples of Experimentally Determined Relationships Between N od
and S
where p is the porosity of the armor layer and G is a factor dependent on the armor layer gradation. The range
of p is approximately 0.4 - 0.6 with the lowest values corresponding to rock and the highest to dolosse. G
= 1 for uni-size concrete armor and 1.2 - 1.6 for stone armor. It is seen that N od is roughly equal to S/2.
Unfortunately Equation VI-5-61 is not generally applicable because experience shows that the relationship
depends on the armor slope angle. Table VI-5-20 shows examples of relationships between N od and S asdetermined from model tests.
(g) A conventional damage level classification and the related values of the damage parameters D, N od
and S are given in Table VI-5-21.
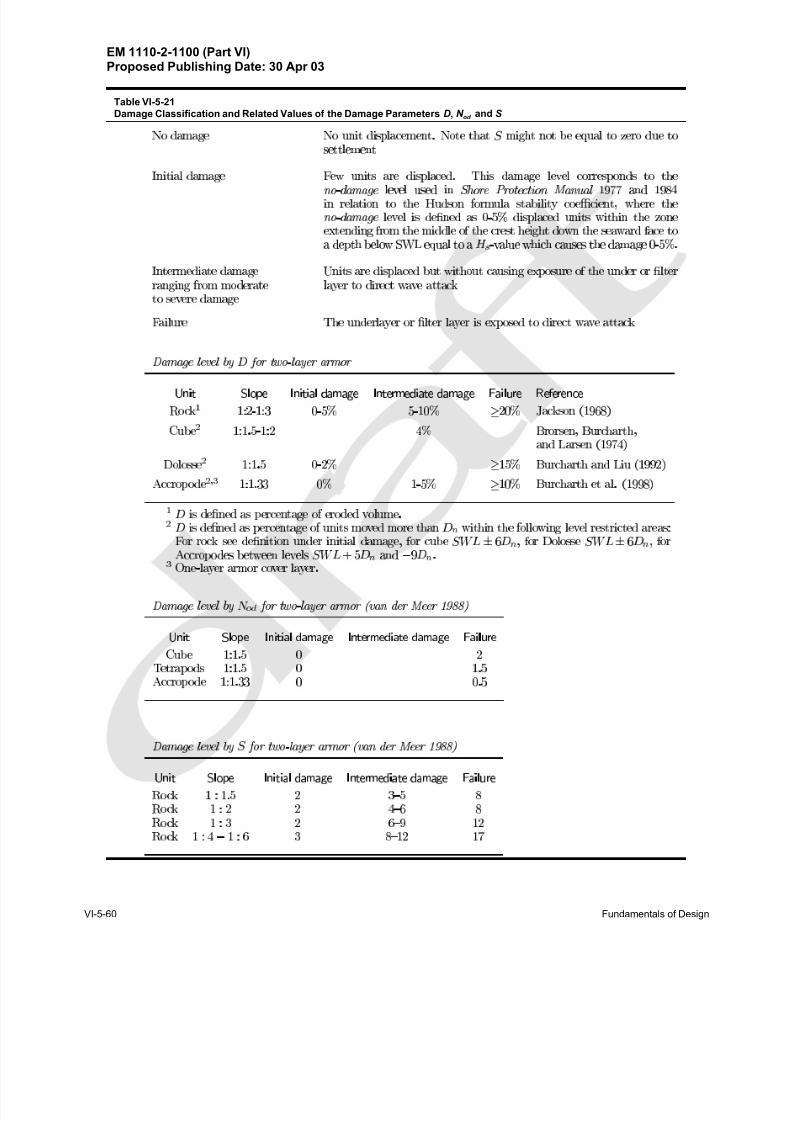
8/13/2019 CEM PartVI-Chap5p1, Fundamentals of Design
http://slidepdf.com/reader/full/cem-partvi-chap5p1-fundamentals-of-design 76/150
EM 1110-2-1100 (Part VI)Proposed Publishing Date: 30 Apr 03
VI-5-60 Fundamentals of Design
Æ
Table VI-5-21
Damage Classification and Related Values of the Damage Parameters D, N od
and S
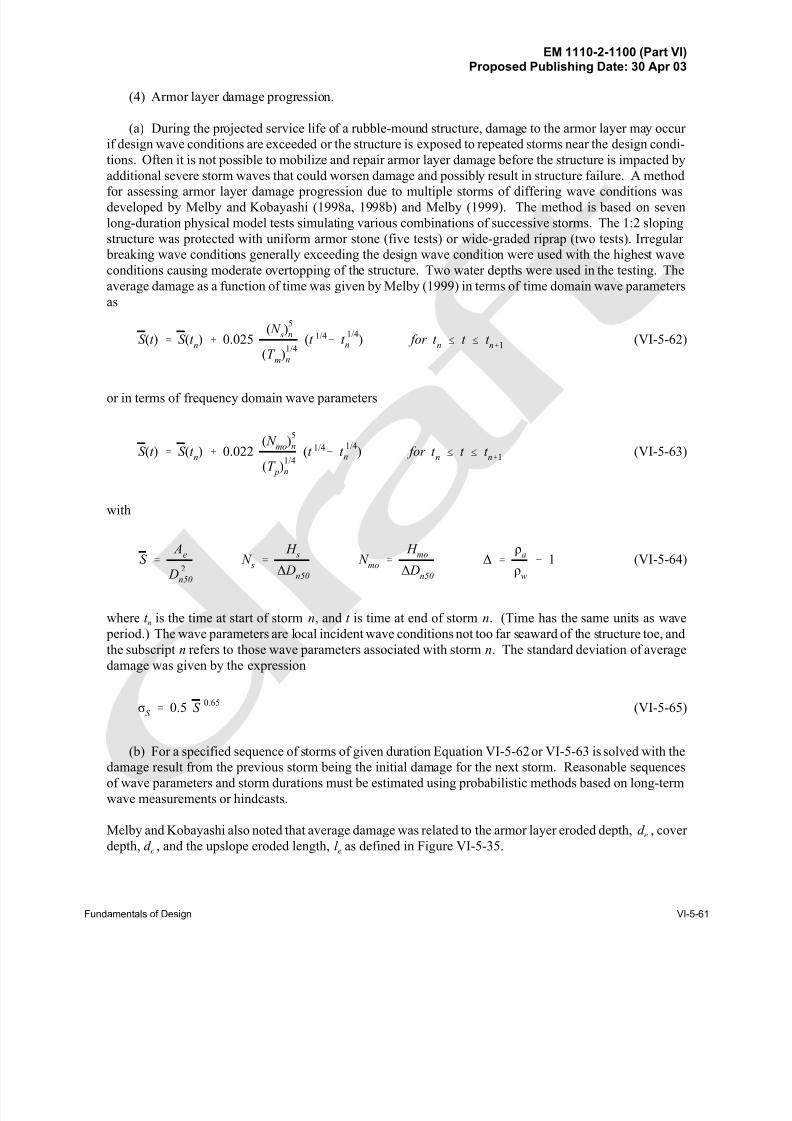
8/13/2019 CEM PartVI-Chap5p1, Fundamentals of Design
http://slidepdf.com/reader/full/cem-partvi-chap5p1-fundamentals-of-design 77/150
EM 1110-2-1100 (Part VI)Proposed Publishing Date: 30 Apr 03
Fundamentals of Design VI-5-61
(4) Armor layer damage progression.
(a) During the projected service life of a rubble-mound structure, damage to the armor layer may occur
if design wave conditions are exceeded or the structure is exposed to repeated storms near the design condi-
tions. Often it is not possible to mobilize and repair armor layer damage before the structure is impacted by
additional severe storm waves that could worsen damage and possibly result in structure failure. A method
for assessing armor layer damage progression due to multiple storms of differing wave conditions wasdeveloped by Melby and Kobayashi (1998a, 1998b) and Melby (1999). The method is based on seven
long-duration physical model tests simulating various combinations of successive storms. The 1:2 sloping
structure was protected with uniform armor stone (five tests) or wide-graded riprap (two tests). Irregular
breaking wave conditions generally exceeding the design wave condition were used with the highest wave
conditions causing moderate overtopping of the structure. Two water depths were used in the testing. The
average damage as a function of time was given by Melby (1999) in terms of time domain wave parameters
as
(VI-5-62)S (t ) ' S (t n) % 0.025
( N s)5
n
(T m)1/4
n
(t 1/4& t
1/4
n ) for t n # t # t
n%1
or in terms of frequency domain wave parameters
(VI-5-63)S (t ) ' S (t n) % 0.022
( N mo
)5
n
(T p
)1/4
n
(t 1/4& t
1/4
n ) for t n #
t # t n%1
with
(VI-5-64)S ' A
e
D 2n50
N s
'
H s
∆ Dn50
N mo
'
H mo
∆ Dn50
∆ '
ρa
ρw
& 1
where t n is the time at start of storm n, and t is time at end of storm n. (Time has the same units as wave
period.) The wave parameters are local incident wave conditions not too far seaward of the structure toe, and
the subscript n refers to those wave parameters associated with storm n. The standard deviation of average
damage was given by the expression
(VI-5-65)σS ' 0.5 S
0.65
(b) For a specified sequence of storms of given duration Equation VI-5-62 or VI-5-63 is solved with thedamage result from the previous storm being the initial damage for the next storm. Reasonable sequences
of wave parameters and storm durations must be estimated using probabilistic methods based on long-term
wave measurements or hindcasts.
Melby and Kobayashi also noted that average damage was related to the armor layer eroded depth, d e , cover
depth, d c , and the upslope eroded length, l e as defined in Figure VI-5-35.
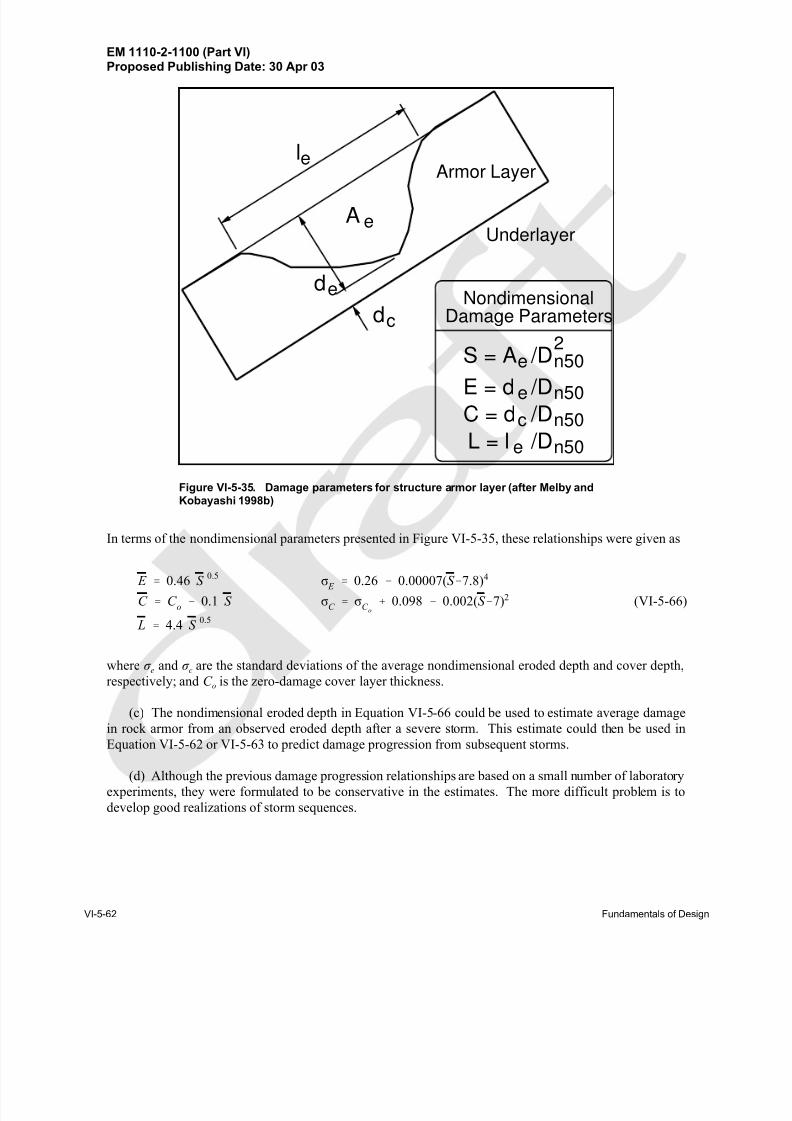
8/13/2019 CEM PartVI-Chap5p1, Fundamentals of Design
http://slidepdf.com/reader/full/cem-partvi-chap5p1-fundamentals-of-design 78/150
EM 1110-2-1100 (Part VI)Proposed Publishing Date: 30 Apr 03
VI-5-62 Fundamentals of Design
Armor Layer
A e
le
de
dc
S = A
E = d
C = d
L = l
e
c
e
e
/D
/D
/D
/D
2n50
n50
n50
n50
NondimensionalDamage Parameters
Underlayer
Figure VI-5-35. Damage parameters for structure armor layer (after Melby andKobayashi 1998b)
In terms of the nondimensional parameters presented in Figure VI-5-35, these relationships were given as
(VI-5-66)
E ' 0.46 S 0.5
σ E ' 0.26 & 0.00007(S &7.8)4
C ' C o & 0.1 S σ
C ' σ
C o% 0.098 & 0.002(S &7)2
L ' 4.4 S 0.5
where σ e and σ c are the standard deviations of the average nondimensional eroded depth and cover depth,
respectively; and C o is the zero-damage cover layer thickness.
(c) The nondimensional eroded depth in Equation VI-5-66 could be used to estimate average damage
in rock armor from an observed eroded depth after a severe storm. This estimate could then be used in
Equation VI-5-62 or VI-5-63 to predict damage progression from subsequent storms.
(d) Although the previous damage progression relationships are based on a small number of laboratory
experiments, they were formulated to be conservative in the estimates. The more difficult problem is to
develop good realizations of storm sequences.
8/13/2019 CEM PartVI-Chap5p1, Fundamentals of Design
http://slidepdf.com/reader/full/cem-partvi-chap5p1-fundamentals-of-design 79/150
EM 1110-2-1100 (Part VI)Proposed Publishing Date: 30 Apr 03
Fundamentals of Design VI-5-63
(5) Practical formulae for hydraulic stability of armor layers.
(a) Formulae for hydraulic stability of armor layers are almost exclusively based on small scale model
tests. Large scale model tests for verification of small scale model test results have been performed in few
cases. Adjustment of formulae due to prototype experience seems not to be reported in the literature.
(b) Generally small scale hydraulic tests of armor layer stability are assumed to be conservative if any bias is present. Nevertheless, armor stability formulae should be applied only for conceptual design, and the
uncertainty of the formulae should be considered. When the formulae do not cover the actual range of
structure geometries and sea states, preliminary designs should be model tested before actual construction.
Major structures should always be tested in a physical model.
(c) Some of the factors by which armor stability formulae can be classified are as follows:
• Type of armor unit.
• Deep or shallow-water wave conditions.
• Armor layers crest level relative to wave runup and swl.
• Structures with and without superstructure.
(d) Type of armor unit distinguishes between rock armor, for which shape and grading must be defined,
and uni-size concrete armor units.
(e) Deepwater conditions correspond to Rayleigh distributed wave height at the structure, i.e., depth-
limited wave breaking does not take place. Shallow-water conditions correspond to non-Rayleigh distributed
wave heights at the structure, i.e., depth limitations cause wave breaking in front of, or in the worst case,
directly upon the structure.
(f) Overtopping affects the armor stability. When the crest is lower than the runup level, wave energycan pass over the structure. Thus, the size of the front slope armor can be reduced while the size of the crest
and rear slope armor must be increased compared to non-overtopped structures. With respect to armor
stability it is common to distinguish between
• Non-overtopped or marginally overtopped structures.
• Low-crested structures, i.e., overtopped structures but with crest level above swl.
• Submerged structures, i.e., the crest level is below swl.
(g) The remainder of this section presents armor layer stability formulae for use in designing coastal
structures. These stability formulae can be used in the context of reliability based design using the partialsafety factors given in the tables of Part VI-6-6, “Partial Safety Factor System for Implementing Reliability
in Design.” Guidance for designing structure cross sections is given in Part VI-5-3-e, “Design of Structure
Cross Section,” and complete design examples for specific structure types are given in Part VI-7, “Design
of Specific Project Elements.”
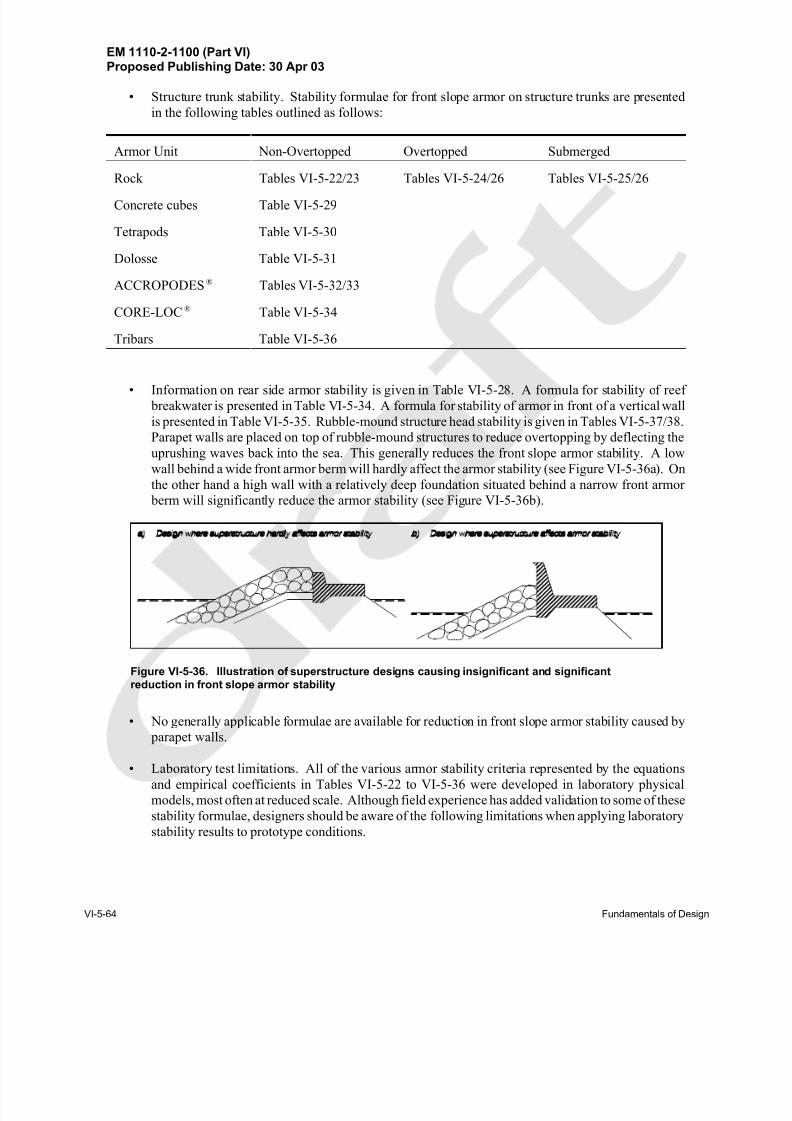
8/13/2019 CEM PartVI-Chap5p1, Fundamentals of Design
http://slidepdf.com/reader/full/cem-partvi-chap5p1-fundamentals-of-design 80/150
EM 1110-2-1100 (Part VI)Proposed Publishing Date: 30 Apr 03
VI-5-64 Fundamentals of Design
Figure VI-5-36. Illustration of superstructure designs causing insignificant and significantreduction in front slope armor stability
• Structure trunk stability. Stability formulae for front slope armor on structure trunks are presented
in the following tables outlined as follows:
Armor Unit Non-Overtopped Overtopped Submerged
Rock Tables VI-5-22/23 Tables VI-5-24/26 Tables VI-5-25/26
Concrete cubes Table VI-5-29
Tetrapods Table VI-5-30
Dolosse Table VI-5-31
ACCROPODES ® Tables VI-5-32/33
CORE-LOC ® Table VI-5-34
Tribars Table VI-5-36
• Information on rear side armor stability is given in Table VI-5-28. A formula for stability of reef
breakwater is presented in Table VI-5-34. A formula for stability of armor in front of a vertical wall
is presented in Table VI-5-35. Rubble-mound structure head stability is given in Tables VI-5-37/38.
Parapet walls are placed on top of rubble-mound structures to reduce overtopping by deflecting the
uprushing waves back into the sea. This generally reduces the front slope armor stability. A low
wall behind a wide front armor berm will hardly affect the armor stability (see Figure VI-5-36a). On
the other hand a high wall with a relatively deep foundation situated behind a narrow front armor
berm will significantly reduce the armor stability (see Figure VI-5-36b).
• No generally applicable formulae are available for reduction in front slope armor stability caused by
parapet walls.
• Laboratory test limitations. All of the various armor stability criteria represented by the equations
and empirical coefficients in Tables VI-5-22 to VI-5-36 were developed in laboratory physical
models, most often at reduced scale. Although field experience has added validation to some of these
stability formulae, designers should be aware of the following limitations when applying laboratory
stability results to prototype conditions.
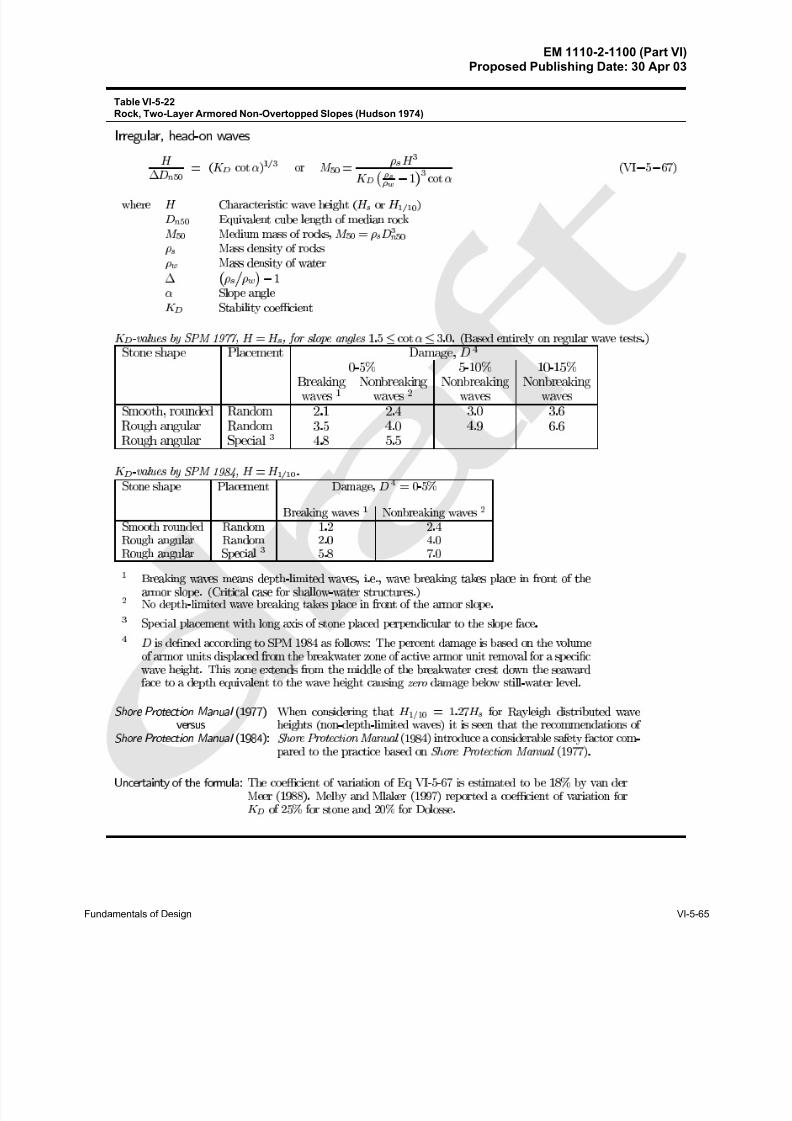
8/13/2019 CEM PartVI-Chap5p1, Fundamentals of Design
http://slidepdf.com/reader/full/cem-partvi-chap5p1-fundamentals-of-design 81/150
EM 1110-2-1100 (Part VI)Proposed Publishing Date: 30 Apr 03
Fundamentals of Design VI-5-65
Æ
Æ
Æ
Æ
Table VI-5-22
Rock, Two-Layer Armored Non-Overtopped Slopes (Hudson 1974)
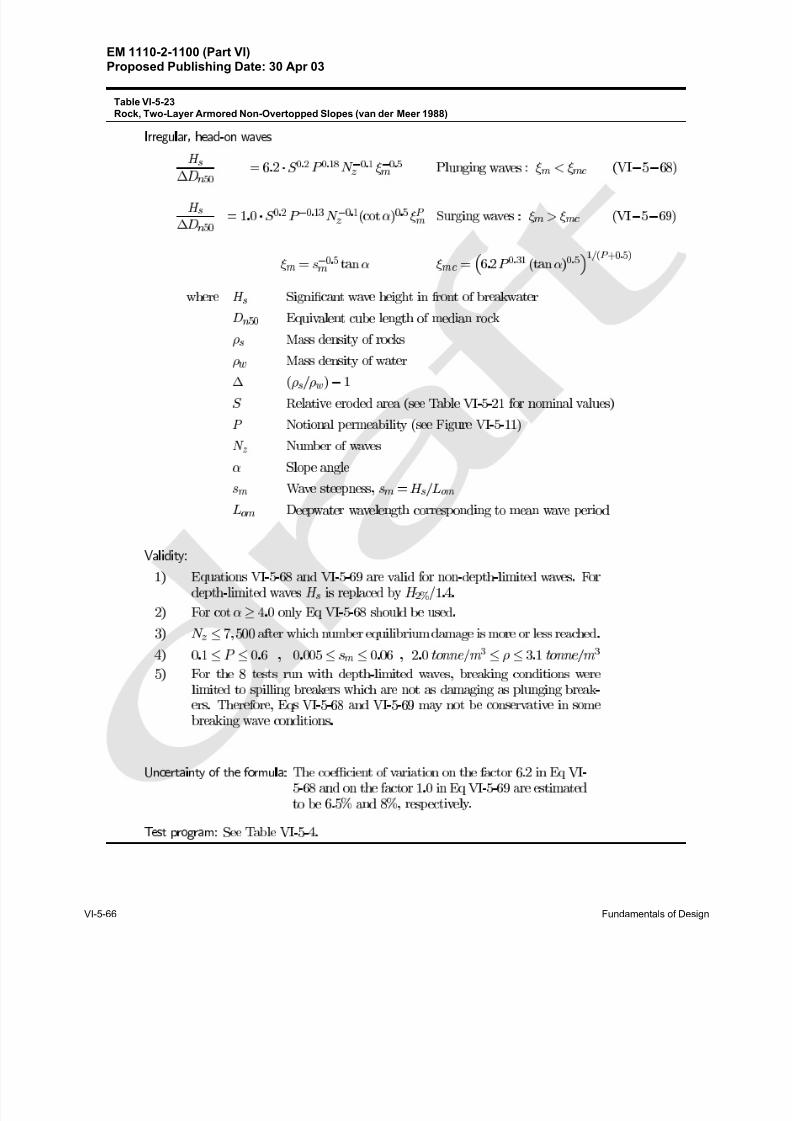
8/13/2019 CEM PartVI-Chap5p1, Fundamentals of Design
http://slidepdf.com/reader/full/cem-partvi-chap5p1-fundamentals-of-design 82/150
EM 1110-2-1100 (Part VI)Proposed Publishing Date: 30 Apr 03
VI-5-66 Fundamentals of Design
Æ
Table VI-5-23
Rock, Two-Layer Armored Non-Overtopped Slopes (van der Meer 1988)
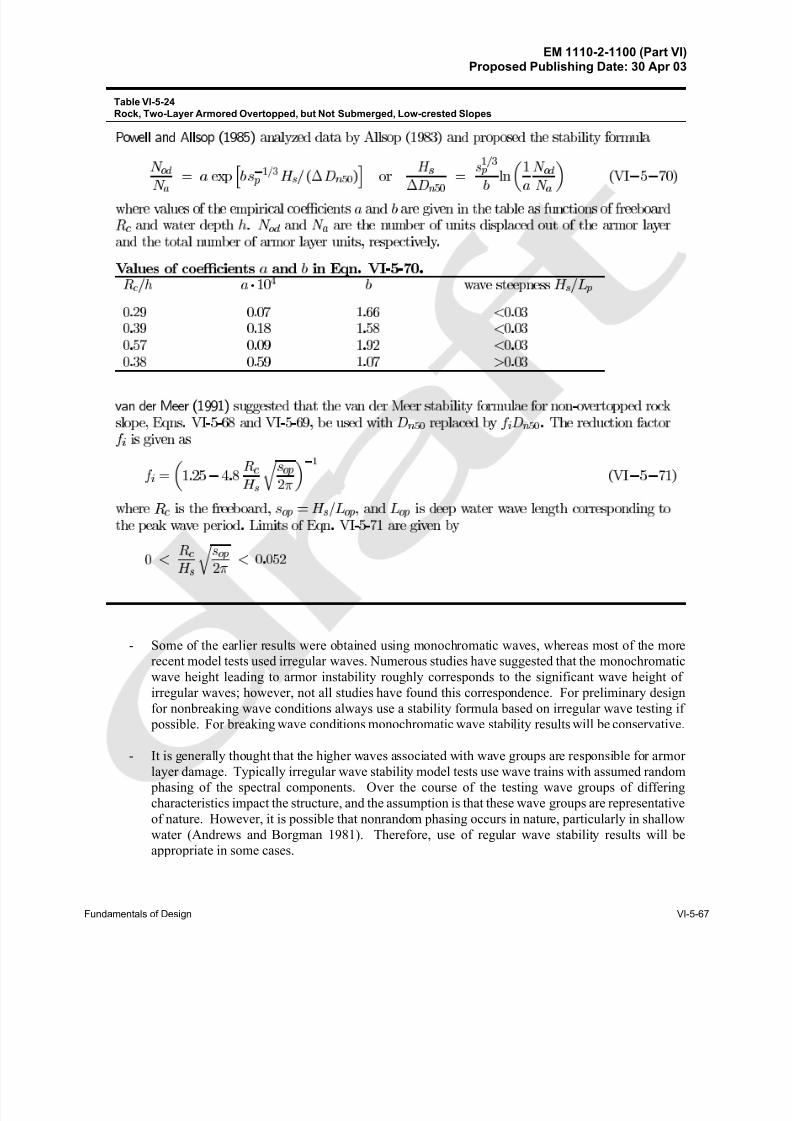
8/13/2019 CEM PartVI-Chap5p1, Fundamentals of Design
http://slidepdf.com/reader/full/cem-partvi-chap5p1-fundamentals-of-design 83/150
EM 1110-2-1100 (Part VI)Proposed Publishing Date: 30 Apr 03
Fundamentals of Design VI-5-67
P o w e l l a n d A l l s o p ( 1 9 8 5 ) a n a l y z e d d a t a b y A l l s o p ( 1 9 8 3 ) a n d p r o p o s e d t h e s t a b i l i t y f o r m u l a
N
o d
N
a
= a e x p
h
b s
; 1 = 3
p
H
s
/ ( D
n 5 0
)
i
o r
H
s
D
n 5 0
=
s
1 = 3
p
b
l n
1
a
N
o d
N
a
( V I ; 5 ; 7 0 )
w h e r e v a l u e s o f t h e e m p i r i c a l c o e c i e n t s a a n d b a r e g i v e n i n t h e t a b l e a s f u n c t i o n s o f f r e e b o a r d
R
c
a n d w a t e r d e p t h h . N
o d
a n d N
a
a r e t h e n u m b e r o f u n i t s d i s p l a c e d o u t o f t h e a r m o r l a y e r
a n d t h e t o t a l n u m b e r o f a r m o r l a y e r u n i t s , r e s p e c t i v e l y .
V a l u e s o f c o e c i e n t s a a n d b i n E q n . V I - 5 - 7 0 .
R
c
= h a 1 0
4
b w a v e s t e e p n e s s H
s
= L
p
0 . 2 9 0 . 0 7 1 . 6 6 < 0 . 0 3
0 . 3 9 0 . 1 8 1 . 5 8 < 0 . 0 3
0 . 5 7 0 . 0 9 1 . 9 2 < 0 . 0 3
0 . 3 8 0 . 5 9 1 . 0 7 > 0 . 0 3
v a n d e r M e e r ( 1 9 9 1 ) s u g g e s t e d t h a t t h e v a n d e r M e e r s t a b i l i t y f o r m u l a e f o r n o n - o v e r t o p p e d r o c k
s l o p e , E q n s . V I - 5 - 6 8 a n d V I - 5 - 6 9 , b e u s e d w i t h D
n 5 0
r e p l a c e d b y f
i
D
n 5 0
. T h e r e d u c t i o n f a c t o r
f
i
i s g i v e n a s
f
i
=
1 : 2 5 ; 4 : 8
R
c
H
s
r
s
o p
2
; 1
( V I ; 5 ; 7 1 )
w h e r e R
c
i s t h e f r e e b o a r d , s
o p
= H
s
= L
o p
, a n d L
o p
i s d e e p w a t e r w a v e l e n g t h c o r r e s p o n d i n g t o
t h e p e a k w a v e p e r i o d . L i m i t s o f E q n . V I - 5 - 7 1 a r e g i v e n b y
0 <
R
c
H
s
r
s
o p
2
< 0 : 0 5 2
Table VI-5-24
Rock, Two-Layer Armored Overtopped, but Not Submerged, Low-crested Slopes
- Some of the earlier results were obtained using monochromatic waves, whereas most of the more
recent model tests used irregular waves. Numerous studies have suggested that the monochromatic
wave height leading to armor instability roughly corresponds to the significant wave height of
irregular waves; however, not all studies have found this correspondence. For preliminary design
for nonbreaking wave conditions always use a stability formula based on irregular wave testing if
possible. For breaking wave conditions monochromatic wave stability results will be conservative.
- It is generally thought that the higher waves associated with wave groups are responsible for armor layer damage. Typically irregular wave stability model tests use wave trains with assumed random
phasing of the spectral components. Over the course of the testing wave groups of differing
characteristics impact the structure, and the assumption is that these wave groups are representative
of nature. However, it is possible that nonrandom phasing occurs in nature, particularly in shallow
water (Andrews and Borgman 1981). Therefore, use of regular wave stability results will be
appropriate in some cases.
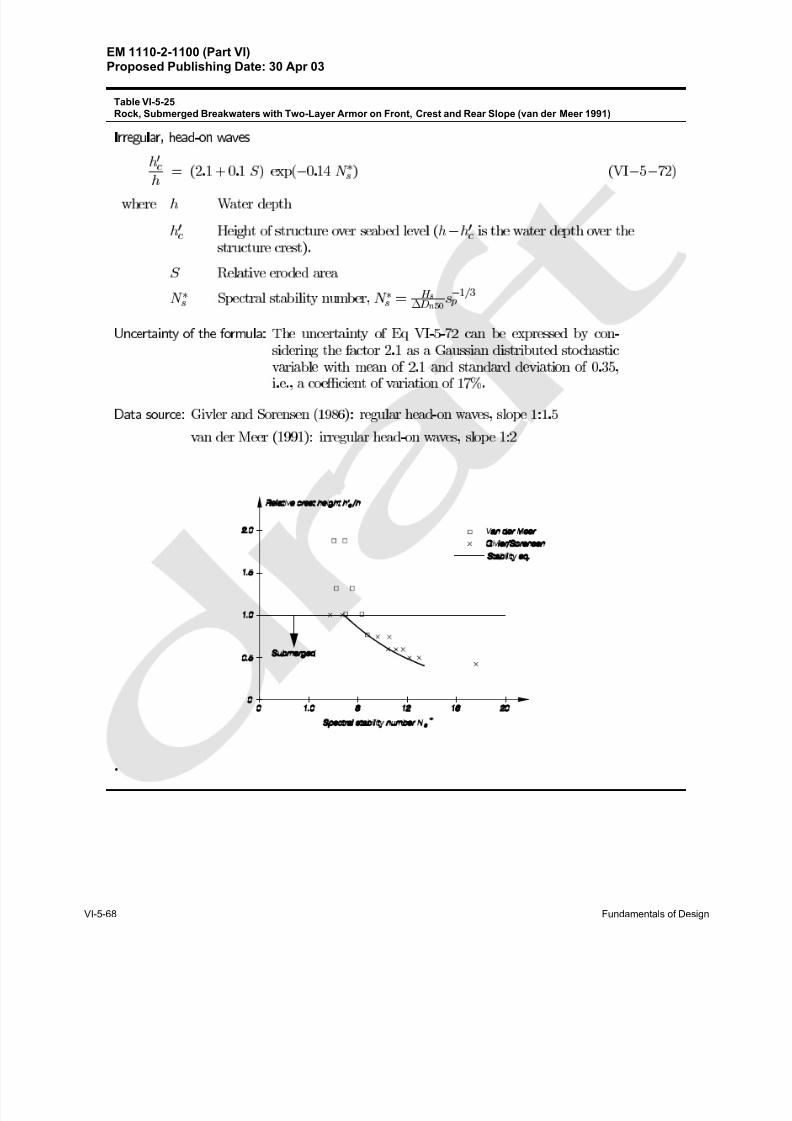
8/13/2019 CEM PartVI-Chap5p1, Fundamentals of Design
http://slidepdf.com/reader/full/cem-partvi-chap5p1-fundamentals-of-design 84/150
EM 1110-2-1100 (Part VI)Proposed Publishing Date: 30 Apr 03
VI-5-68 Fundamentals of Design
Æ
Table VI-5-25
Rock, Submerged Breakwaters with Two-Layer Armor on Front, Crest and Rear Slope (van der Meer 1991)
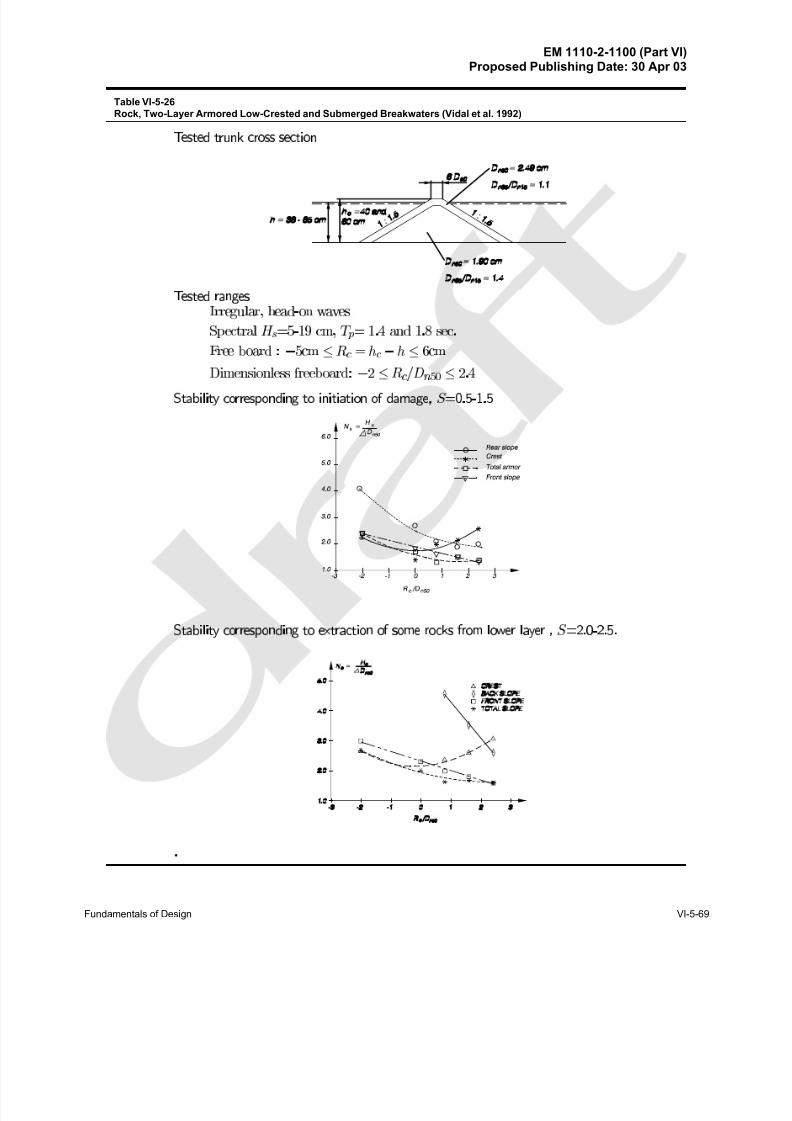
8/13/2019 CEM PartVI-Chap5p1, Fundamentals of Design
http://slidepdf.com/reader/full/cem-partvi-chap5p1-fundamentals-of-design 85/150
EM 1110-2-1100 (Part VI)Proposed Publishing Date: 30 Apr 03
Fundamentals of Design VI-5-69
Table VI-5-26
Rock, Two-Layer Armored Low-Crested and Submerged Breakwaters (Vidal et al. 1992)
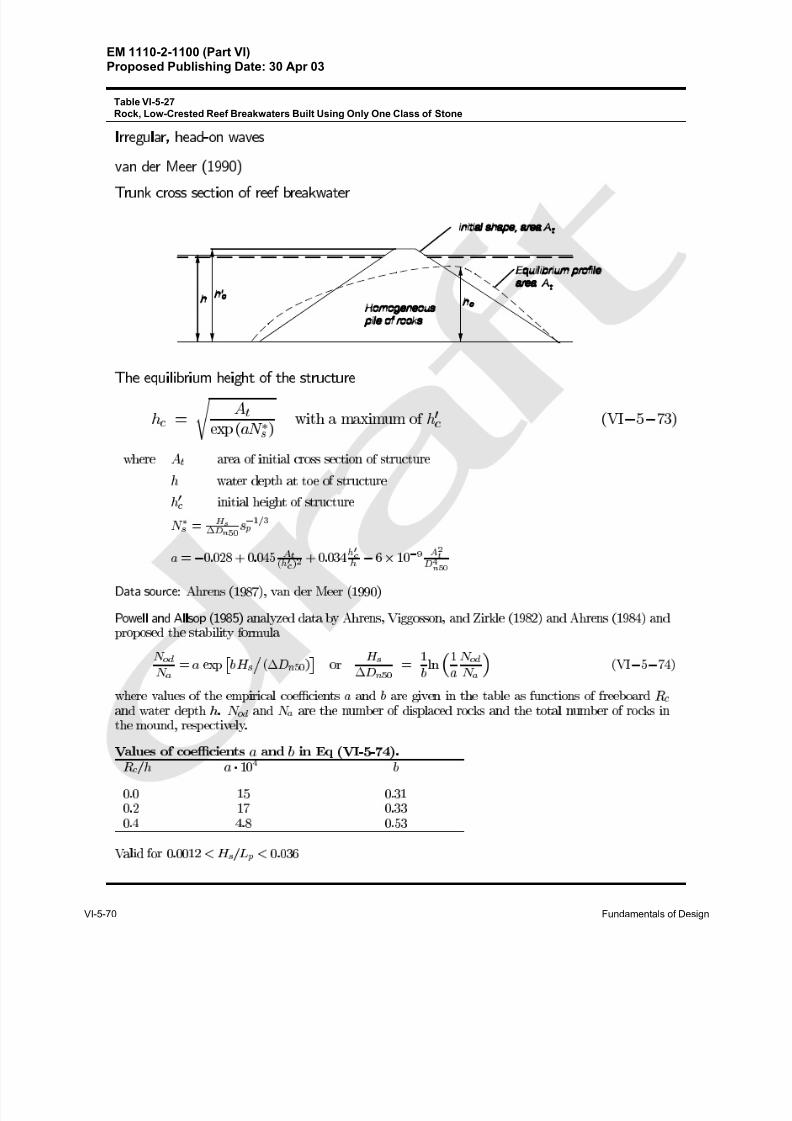
8/13/2019 CEM PartVI-Chap5p1, Fundamentals of Design
http://slidepdf.com/reader/full/cem-partvi-chap5p1-fundamentals-of-design 86/150
EM 1110-2-1100 (Part VI)Proposed Publishing Date: 30 Apr 03
VI-5-70 Fundamentals of Design
Æ
Æ
Æ
Table VI-5-27
Rock, Low-Crested Reef Breakwaters Built Using Only One Class of Stone
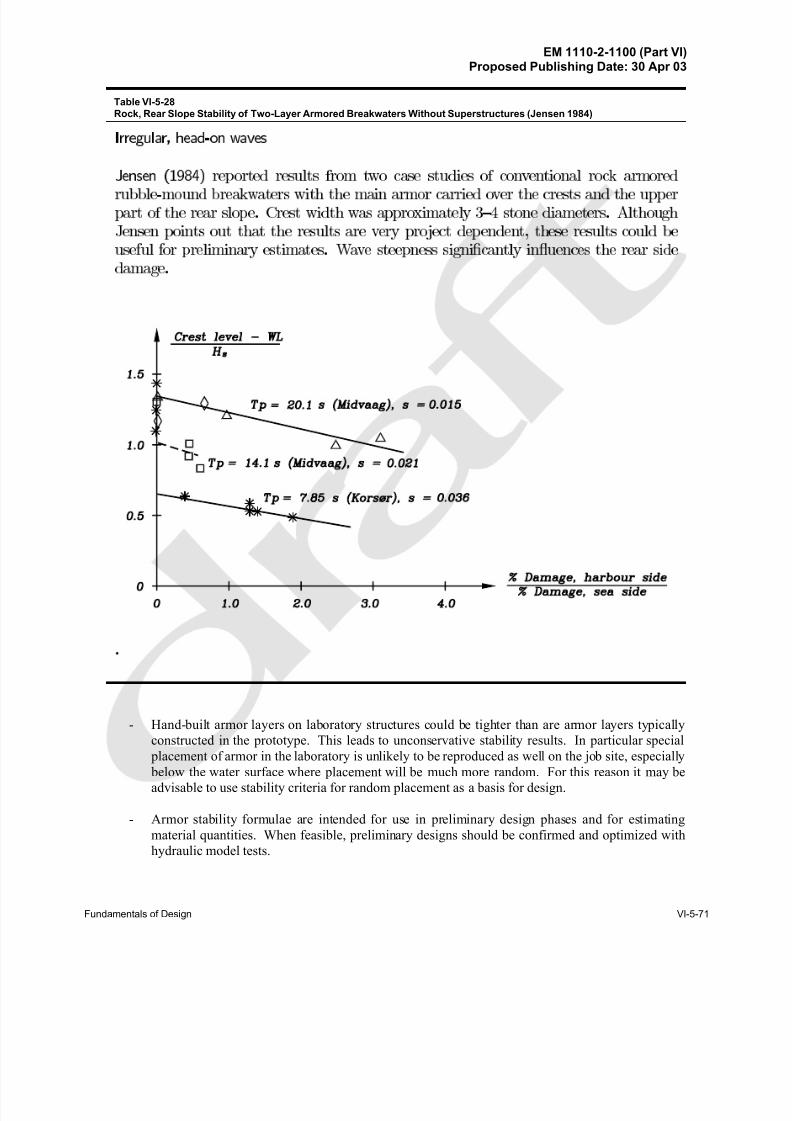
8/13/2019 CEM PartVI-Chap5p1, Fundamentals of Design
http://slidepdf.com/reader/full/cem-partvi-chap5p1-fundamentals-of-design 87/150
EM 1110-2-1100 (Part VI)Proposed Publishing Date: 30 Apr 03
Fundamentals of Design VI-5-71
I r r e g u l a r , h e a d - o n w a v e s
J e n s e n ( 1 9 8 4 ) r e p o r t e d r e s u l t s f r o m t w o c a s e s t u d i e s o f c o n v e n t i o n a l r o c k a r m o r e d
r u b b l e - m o u n d b r e a k w a t e r s w i t h t h e m a i n a r m o r c a r r i e d o v e r t h e c r e s t s a n d t h e u p p e r
p a r t o f t h e r e a r s l o p e . C r e s t w i d t h w a s a p p r o x i m a t e l y 3 { 4 s t o n e d i a m e t e r s . A l t h o u g h
J e n s e n p o i n t s o u t t h a t t h e r e s u l t s a r e v e r y p r o j e c t d e p e n d e n t , t h e s e r e s u l t s c o u l d b e
u s e f u l f o r p r e l i m i n a r y e s t i m a t e s . W a v e s t e e p n e s s s i g n i c a n t l y i n u e n c e s t h e r e a r s i d e
d a m a g e .
.
Table VI-5-28
Rock, Rear Slope Stability of Two-Layer Armored Breakwaters Without Superstructures (Jensen 1984)
- Hand-built armor layers on laboratory structures could be tighter than are armor layers typically
constructed in the prototype. This leads to unconservative stability results. In particular special
placement of armor in the laboratory is unlikely to be reproduced as well on the job site, especially below the water surface where placement will be much more random. For this reason it may be
advisable to use stability criteria for random placement as a basis for design.
- Armor stability formulae are intended for use in preliminary design phases and for estimating
material quantities. When feasible, preliminary designs should be confirmed and optimized with
hydraulic model tests.
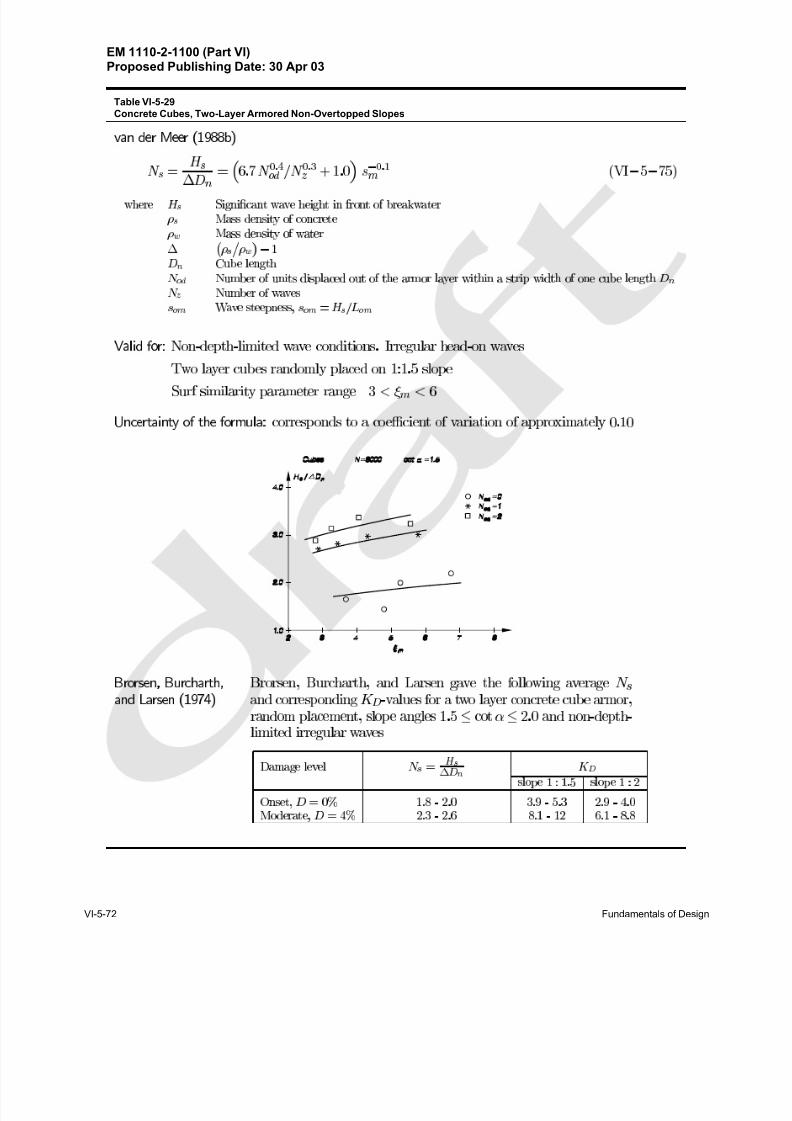
8/13/2019 CEM PartVI-Chap5p1, Fundamentals of Design
http://slidepdf.com/reader/full/cem-partvi-chap5p1-fundamentals-of-design 88/150
EM 1110-2-1100 (Part VI)Proposed Publishing Date: 30 Apr 03
VI-5-72 Fundamentals of Design
Æ
Æ
Table VI-5-29
Concrete Cubes, Two-Layer Armored Non-Overtopped Slopes
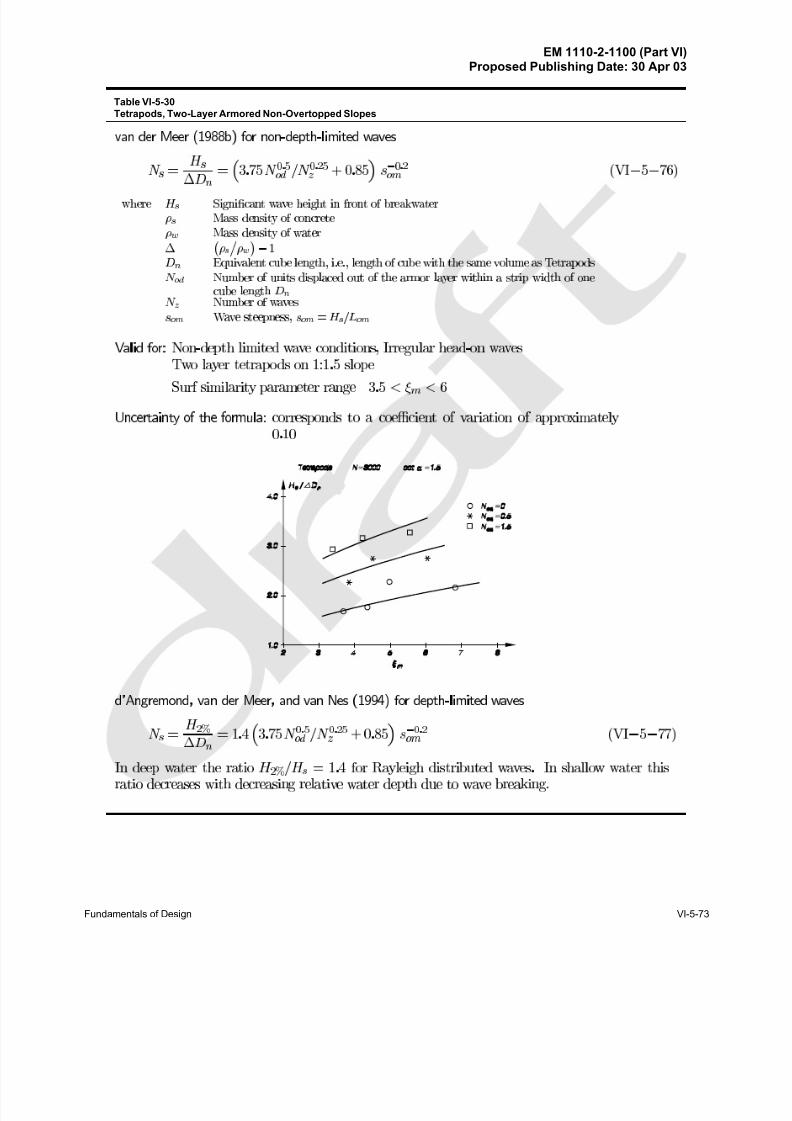
8/13/2019 CEM PartVI-Chap5p1, Fundamentals of Design
http://slidepdf.com/reader/full/cem-partvi-chap5p1-fundamentals-of-design 89/150
EM 1110-2-1100 (Part VI)Proposed Publishing Date: 30 Apr 03
Fundamentals of Design VI-5-73
Æ
Æ
Table VI-5-30
Tetrapods, Two-Layer Armored Non-Overtopped Slopes
8/13/2019 CEM PartVI-Chap5p1, Fundamentals of Design
http://slidepdf.com/reader/full/cem-partvi-chap5p1-fundamentals-of-design 90/150
EM 1110-2-1100 (Part VI)Proposed Publishing Date: 30 Apr 03
VI-5-74 Fundamentals of Design
Æ
Table VI-5-31
Dolos, Non-Overtopped Slopes (Burcharth and Liu 1992)
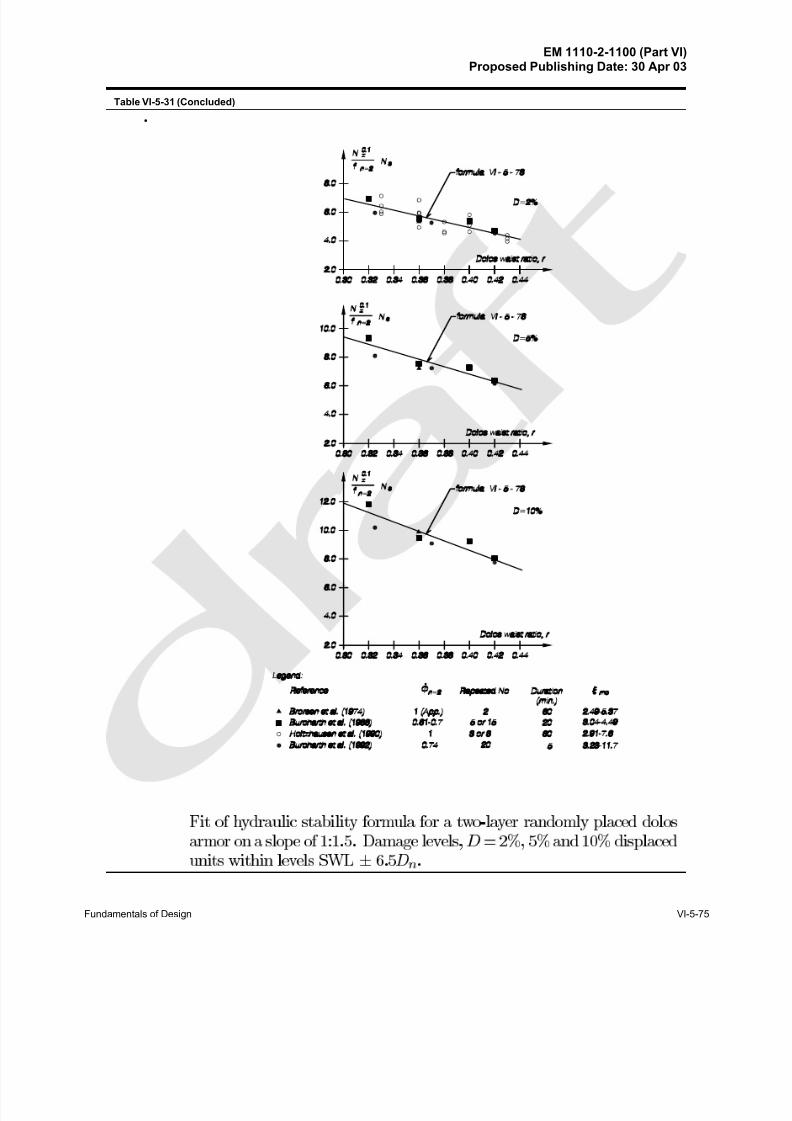
8/13/2019 CEM PartVI-Chap5p1, Fundamentals of Design
http://slidepdf.com/reader/full/cem-partvi-chap5p1-fundamentals-of-design 91/150
EM 1110-2-1100 (Part VI)Proposed Publishing Date: 30 Apr 03
Fundamentals of Design VI-5-75
Table VI-5-31 (Concluded)
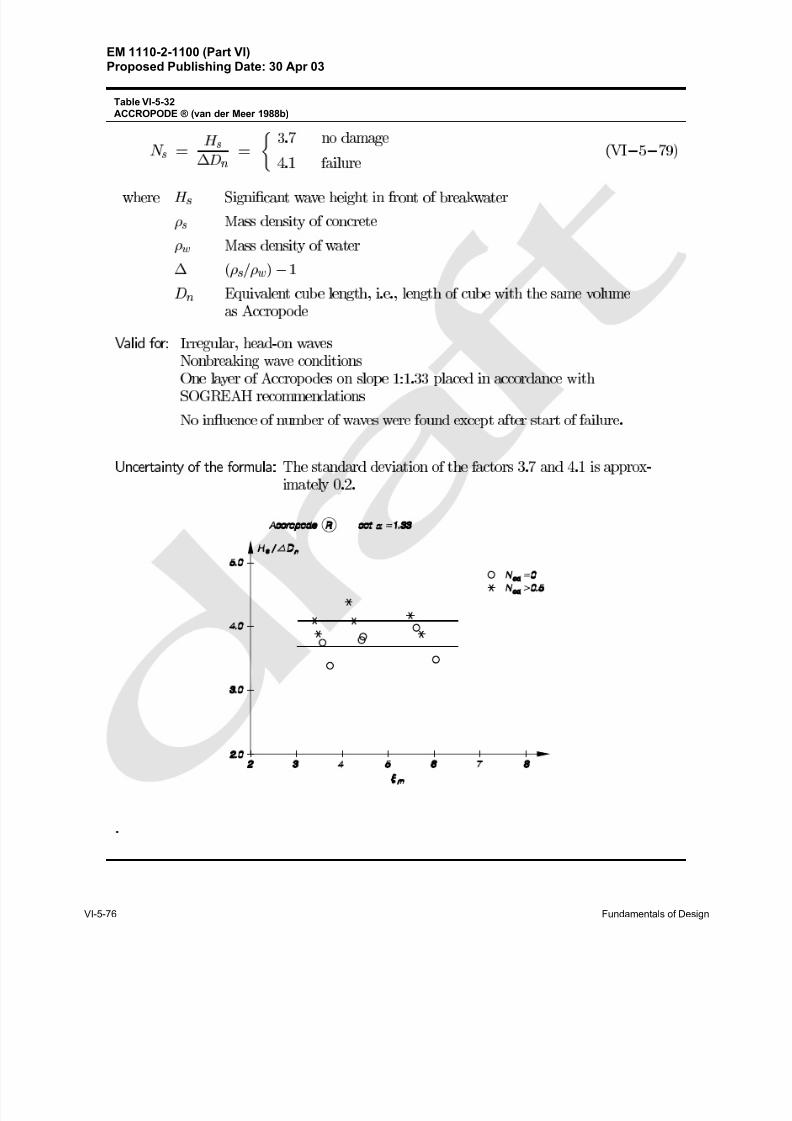
8/13/2019 CEM PartVI-Chap5p1, Fundamentals of Design
http://slidepdf.com/reader/full/cem-partvi-chap5p1-fundamentals-of-design 92/150
EM 1110-2-1100 (Part VI)Proposed Publishing Date: 30 Apr 03
VI-5-76 Fundamentals of Design
Table VI-5-32
ACCROPODE ® (van der Meer 1988b)
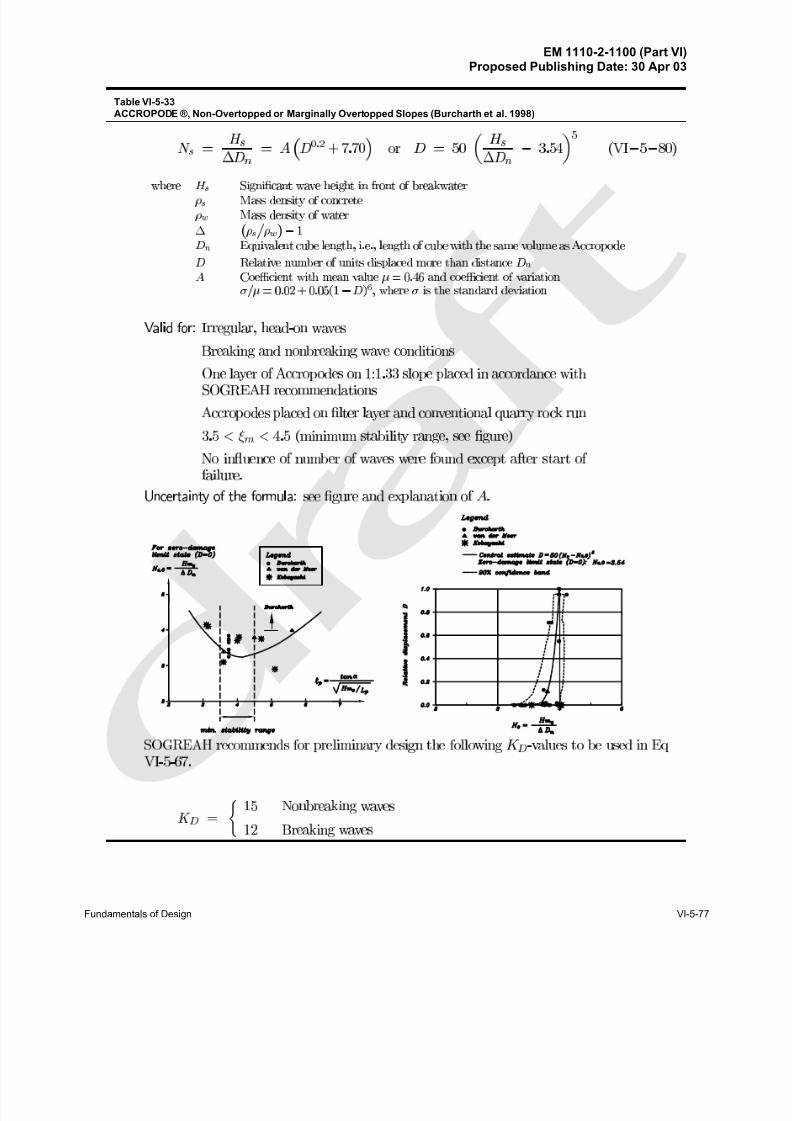
8/13/2019 CEM PartVI-Chap5p1, Fundamentals of Design
http://slidepdf.com/reader/full/cem-partvi-chap5p1-fundamentals-of-design 93/150
EM 1110-2-1100 (Part VI)Proposed Publishing Date: 30 Apr 03
Fundamentals of Design VI-5-77
Æ
Æ Æ
Table VI-5-33
ACCROPODE ®, Non-Overtopped or Marginally Overtopped Slopes (Burcharth et al. 1998)
8/13/2019 CEM PartVI-Chap5p1, Fundamentals of Design
http://slidepdf.com/reader/full/cem-partvi-chap5p1-fundamentals-of-design 94/150
EM 1110-2-1100 (Part VI)Proposed Publishing Date: 30 Apr 03
VI-5-78 Fundamentals of Design
Irregular, head-on waves
(VI-5-81) H
∆ Dn50
' ( K D cotα)1/3
or M 50 '
ρc H 3
K D
(ρ
c
ρw
& 1)3 cotα
where H Characteristic wave height ( H s )
Dn50 Equivalent length of cube having same mass as Core-Loc, D50 = (M 50 / ρ s )1/3
M 50 Mass of Core-Loc armor unit, M 50 = ρ s ( Dn50)3
ρc Mass density of concrete
ρw Mass density of water
∆ ( ρ s / ρw) - 1
α Slope angle
K D Stability coefficient
Trunk section stability. Melby and Turk (1994) found no reasonable ( K D < 50) irregular breaking or
nonbreaking wave conditions that would destabilize the layer. For an armor layer exposed to regular
depth-limited plunging to collapsing waves, K D = 16 in Equation VI-5-81 is recommended for preliminary
design of all trunk sections. The recommended value of K Dis conservative, and it represents a zero-damage condition with little to no armor unit rocking. Site specific
physical model tests will usually yield higher values.
Head section stability. K D = 13 is recommended for preliminary design of head sections exposed to both
breaking and nonbreaking oblique and head-on waves.
Stability test parameters
Model parameters M 50 = 219 g; Depths: 36 and 61 cm; Height: 90 cm
Wave parameters 4.6 # H mo # 36 cm; 1.5 # T p # 4.7 sec
Structure slope, α 1V:1.33H and 1V:1.5H
Surf similarity parameter 2.13 # ξ o # 15.9
Relative depth 0.012 # d/Lo# 0.175
Wave steepness 0.001 # H mo /Lo # breaking
Placement. Core-Locs are intended to be randomly placed in a single-unit thick layer on steep or shallow
slopes. They are well suited for use in repairing existing dolos structures because they interlock well with
dolosse when properly sized (length of Core-Loc central flume is 92 percent of the dolosse fluke length).
Table VI-5-34
CORE-LOC ®, Non or Marginally Overtopped Slopes (Melby and Turk 1994; Turk and Melby 1997)
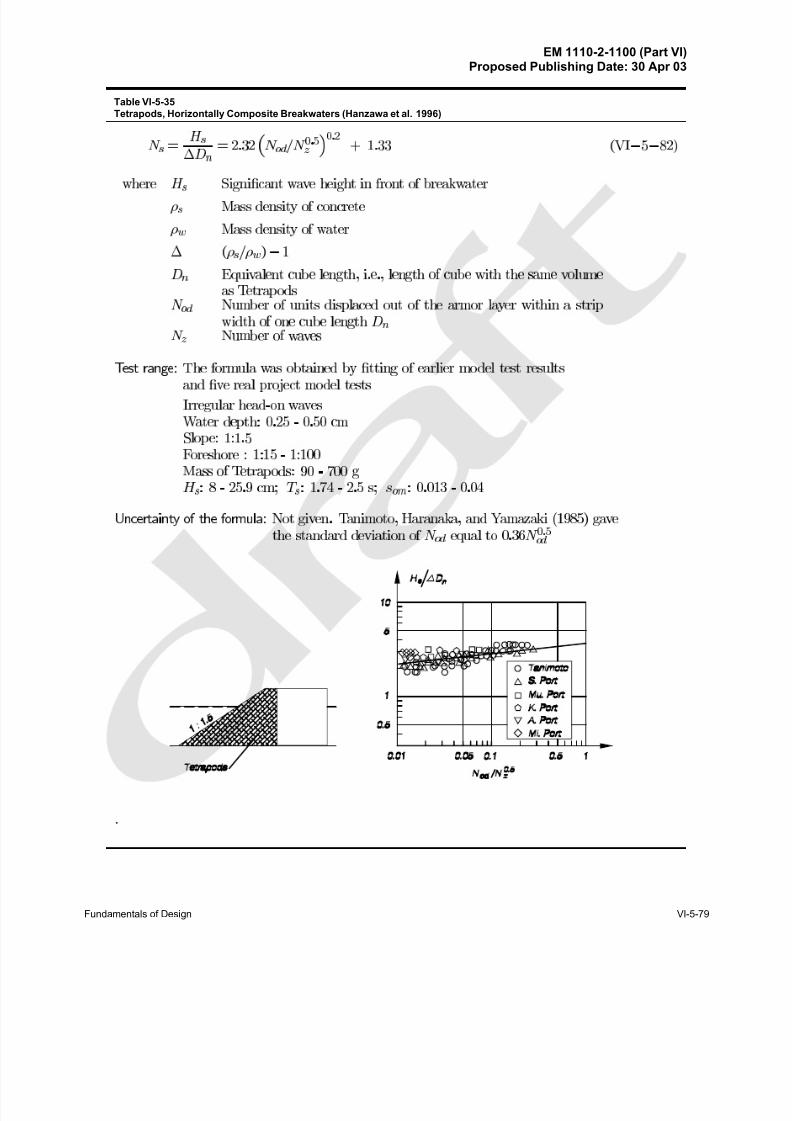
8/13/2019 CEM PartVI-Chap5p1, Fundamentals of Design
http://slidepdf.com/reader/full/cem-partvi-chap5p1-fundamentals-of-design 95/150
EM 1110-2-1100 (Part VI)Proposed Publishing Date: 30 Apr 03
Fundamentals of Design VI-5-79
Table VI-5-35
Tetrapods, Horizontally Composite Breakwaters (Hanzawa et al. 1996)
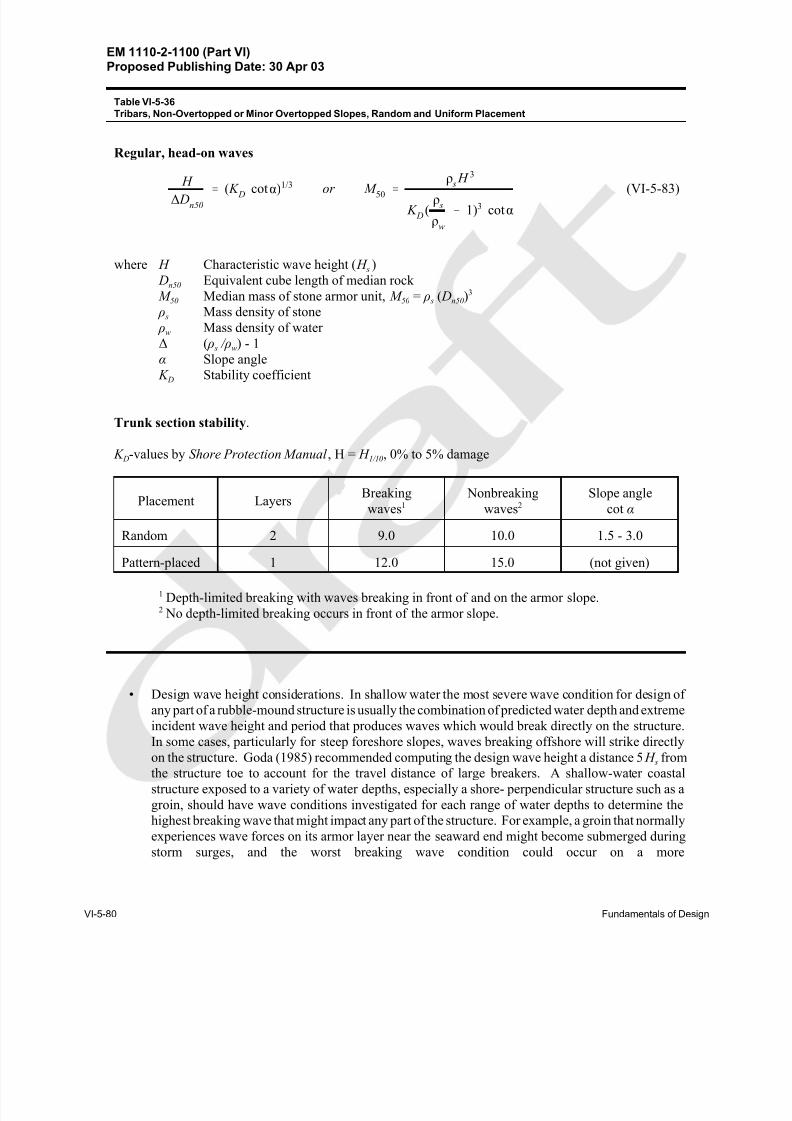
8/13/2019 CEM PartVI-Chap5p1, Fundamentals of Design
http://slidepdf.com/reader/full/cem-partvi-chap5p1-fundamentals-of-design 96/150
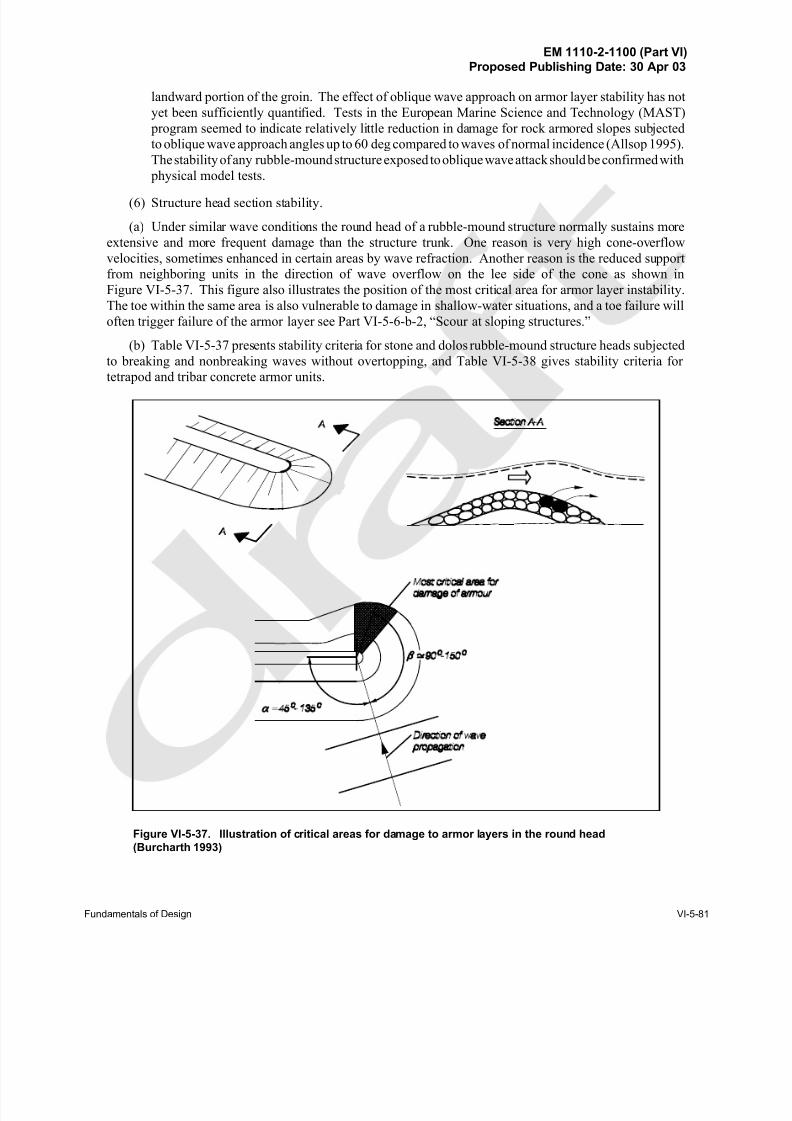
8/13/2019 CEM PartVI-Chap5p1, Fundamentals of Design
http://slidepdf.com/reader/full/cem-partvi-chap5p1-fundamentals-of-design 97/150
EM 1110-2-1100 (Part VI)Proposed Publishing Date: 30 Apr 03
Fundamentals of Design VI-5-81
Figure VI-5-37. Illustration of critical areas for damage to armor layers in the round head
(Burcharth 1993)
landward portion of the groin. The effect of oblique wave approach on armor layer stability has not
yet been sufficiently quantified. Tests in the European Marine Science and Technology (MAST)
program seemed to indicate relatively little reduction in damage for rock armored slopes subjected
to oblique wave approach angles up to 60 deg compared to waves of normal incidence (Allsop 1995).
The stability of any rubble-mound structure exposed to oblique wave attack should be confirmed with
physical model tests.
(6) Structure head section stability.
(a) Under similar wave conditions the round head of a rubble-mound structure normally sustains more
extensive and more frequent damage than the structure trunk. One reason is very high cone-overflow
velocities, sometimes enhanced in certain areas by wave refraction. Another reason is the reduced support
from neighboring units in the direction of wave overflow on the lee side of the cone as shown in
Figure VI-5-37. This figure also illustrates the position of the most critical area for armor layer instability.
The toe within the same area is also vulnerable to damage in shallow-water situations, and a toe failure will
often trigger failure of the armor layer see Part VI-5-6-b-2, “Scour at sloping structures.”
(b) Table VI-5-37 presents stability criteria for stone and dolos rubble-mound structure heads subjected
to breaking and nonbreaking waves without overtopping, and Table VI-5-38 gives stability criteria for
tetrapod and tribar concrete armor units.
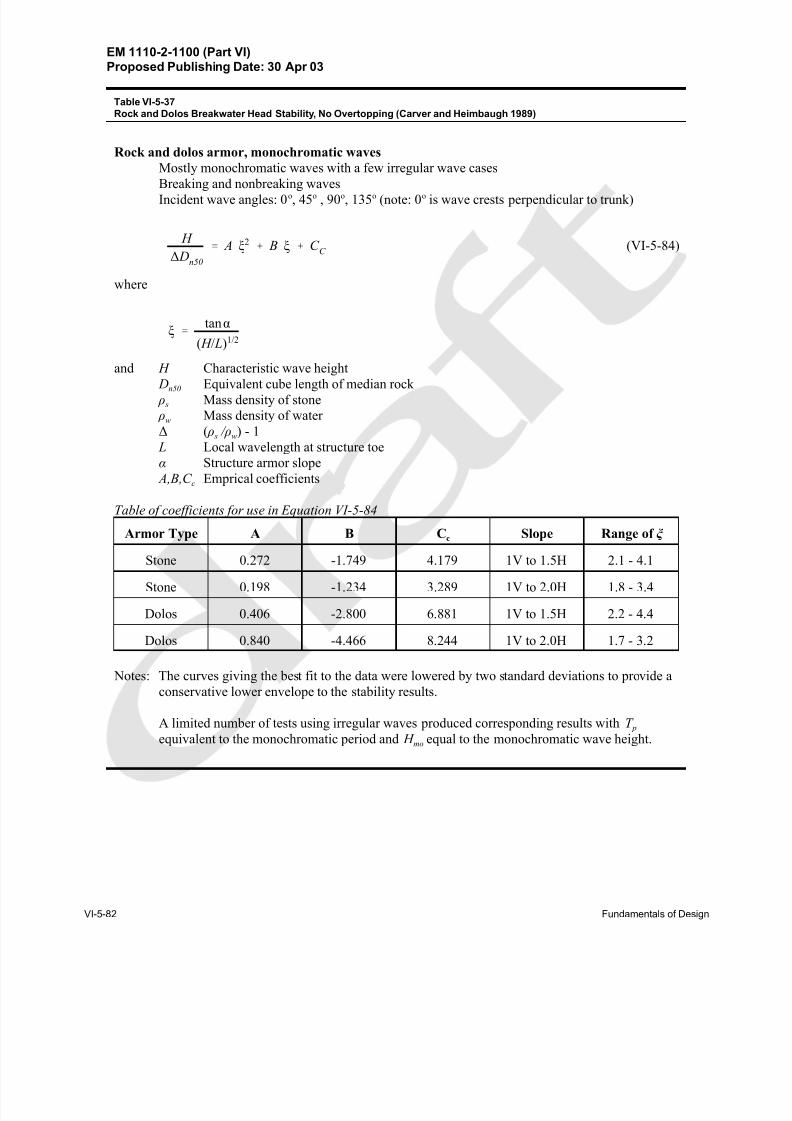
8/13/2019 CEM PartVI-Chap5p1, Fundamentals of Design
http://slidepdf.com/reader/full/cem-partvi-chap5p1-fundamentals-of-design 98/150
EM 1110-2-1100 (Part VI)Proposed Publishing Date: 30 Apr 03
VI-5-82 Fundamentals of Design
Rock and dolos armor, monochromatic waves
Mostly monochromatic waves with a few irregular wave cases
Breaking and nonbreaking wavesIncident wave angles: 0o, 45o , 90o, 135o (note: 0o is wave crests perpendicular to trunk)
(VI-5-84) H
∆ Dn50
' A ξ2% B ξ % C
C
where
ξ 'tanα
( H / L)1/2
and H Characteristic wave height
Dn50 Equivalent cube length of median rock
ρ s Mass density of stone
ρw Mass density of water
∆ ( ρ s / ρw) - 1
L Local wavelength at structure toe
α Structure armor slope
A,B,C c Emprical coefficients
Table of coefficients for use in Equation VI-5-84
Armor Type A B Cc Slope Range of ξ
Stone 0.272 -1.749 4.179 1V to 1.5H 2.1 - 4.1
Stone 0.198 -1.234 3.289 1V to 2.0H 1.8 - 3.4
Dolos 0.406 -2.800 6.881 1V to 1.5H 2.2 - 4.4
Dolos 0.840 -4.466 8.244 1V to 2.0H 1.7 - 3.2
Notes: The curves giving the best fit to the data were lowered by two standard deviations to provide a
conservative lower envelope to the stability results.
A limited number of tests using irregular waves produced corresponding results with T pequivalent to the monochromatic period and H mo equal to the monochromatic wave height.
Table VI-5-37
Rock and Dolos Breakwater Head Stability, No Overtopping (Carver and Heimbaugh 1989)
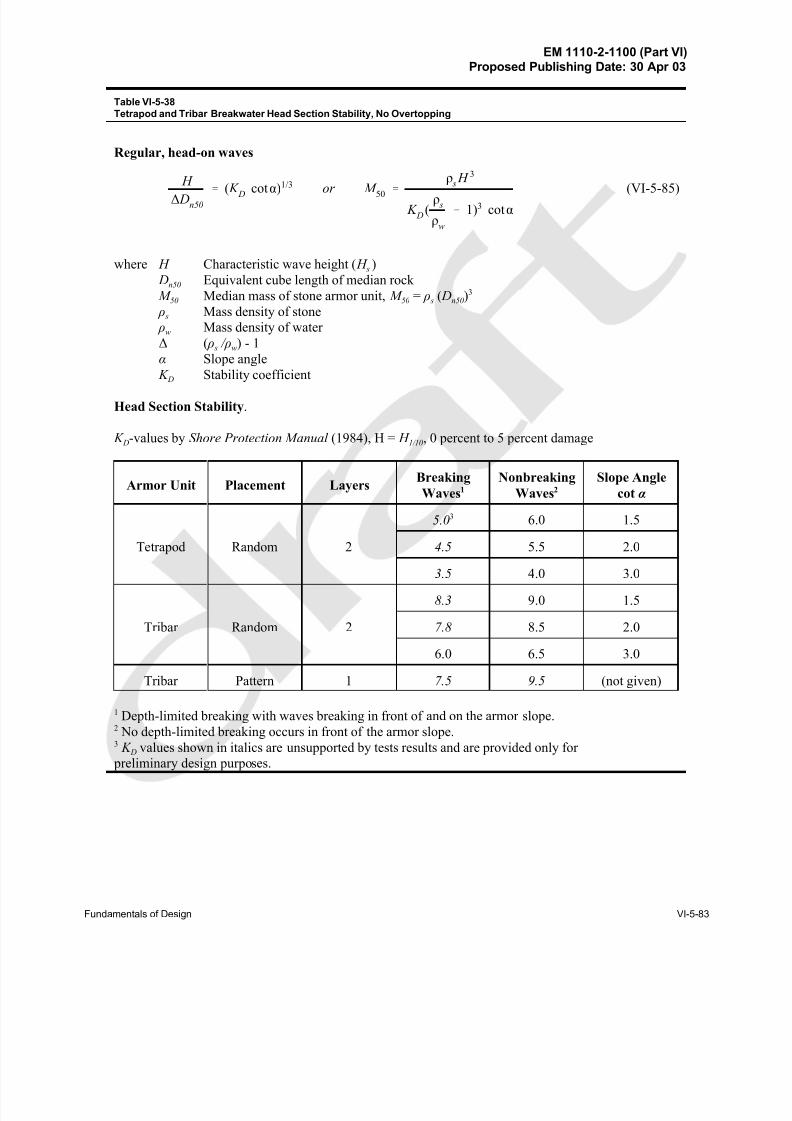
8/13/2019 CEM PartVI-Chap5p1, Fundamentals of Design
http://slidepdf.com/reader/full/cem-partvi-chap5p1-fundamentals-of-design 99/150
EM 1110-2-1100 (Part VI)Proposed Publishing Date: 30 Apr 03
Fundamentals of Design VI-5-83
Regular, head-on waves
(VI-5-85) H
∆ Dn50
' ( K D cotα)1/3 or M 50 '
ρ s H 3
K D
(ρ s
ρw
& 1)3 cotα
where H Characteristic wave height ( H s )
Dn50 Equivalent cube length of median rock
M 50 Median mass of stone armor unit, M 50 = ρ s ( Dn50)3
ρ s Mass density of stone
ρw Mass density of water
∆ ( ρ s / ρw) - 1
α Slope angle
K D Stability coefficient
Head Section Stability.
K D-values by Shore Protection Manual (1984), H = H 1/10, 0 percent to 5 percent damage
Armor Unit Placement LayersBreaking
Waves1
Nonbreaking
Waves2
Slope Angle
cot α
Tetrapod Random 2
5.03 6.0 1.5
4.5 5.5 2.0
3.5 4.0 3.0
Tribar Random 2
8.3 9.0 1.5
7.8 8.5 2.0
6.0 6.5 3.0
Tribar Pattern 1 7.5 9.5 (not given)
1 Depth-limited breaking with waves breaking in front of and on the armor slope.2 No depth-limited breaking occurs in front of the armor slope.3 K D values shown in italics are unsupported by tests results and are provided only for
preliminary design purposes.
Table VI-5-38
Tetrapod and Tribar Breakwater Head Section Stability, No Overtopping
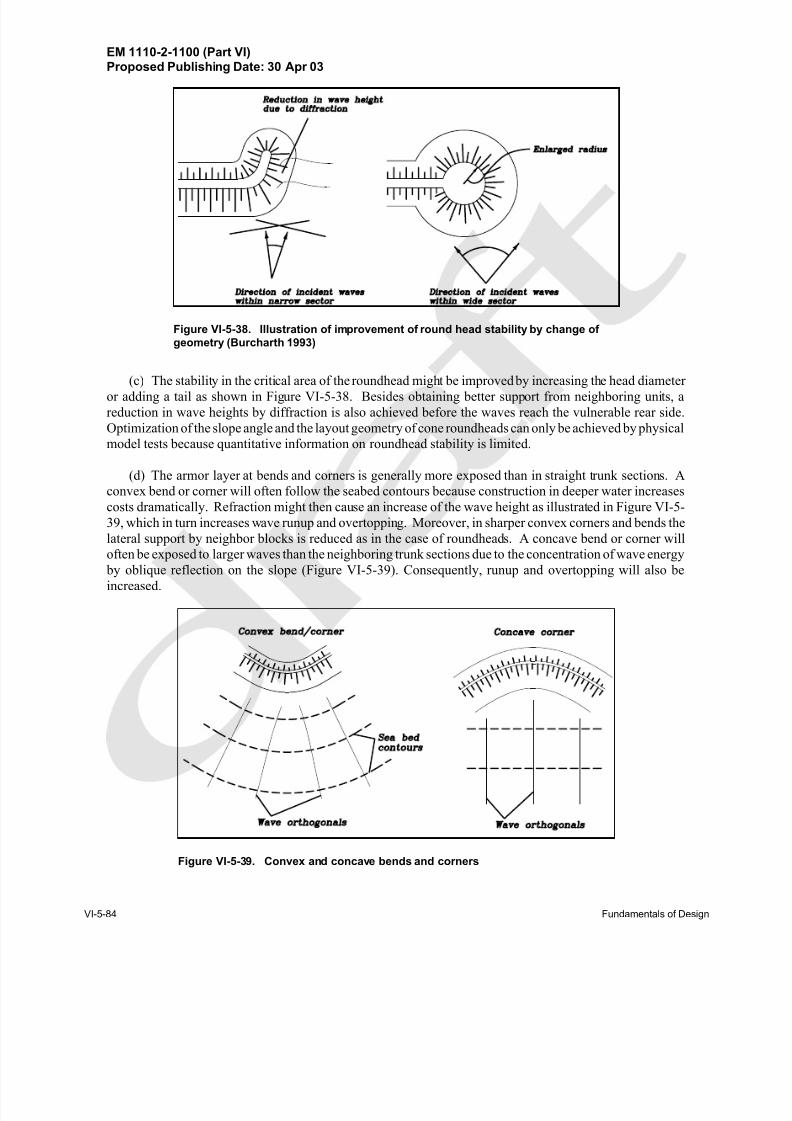
8/13/2019 CEM PartVI-Chap5p1, Fundamentals of Design
http://slidepdf.com/reader/full/cem-partvi-chap5p1-fundamentals-of-design 100/150
EM 1110-2-1100 (Part VI)Proposed Publishing Date: 30 Apr 03
VI-5-84 Fundamentals of Design
Figure VI-5-38. Illustration of improvement of round head stability by change of
geometry (Burcharth 1993)
Figure VI-5-39. Convex and concave bends and corners
(c) The stability in the critical area of the roundhead might be improved by increasing the head diameter or adding a tail as shown in Figure VI-5-38. Besides obtaining better support from neighboring units, a
reduction in wave heights by diffraction is also achieved before the waves reach the vulnerable rear side.
Optimization of the slope angle and the layout geometry of cone roundheads can only be achieved by physical
model tests because quantitative information on roundhead stability is limited.
(d) The armor layer at bends and corners is generally more exposed than in straight trunk sections. A
convex bend or corner will often follow the seabed contours because construction in deeper water increases
costs dramatically. Refraction might then cause an increase of the wave height as illustrated in Figure VI-5-
39, which in turn increases wave runup and overtopping. Moreover, in sharper convex corners and bends the
lateral support by neighbor blocks is reduced as in the case of roundheads. A concave bend or corner will
often be exposed to larger waves than the neighboring trunk sections due to the concentration of wave energy
by oblique reflection on the slope (Figure VI-5-39). Consequently, runup and overtopping will also beincreased.
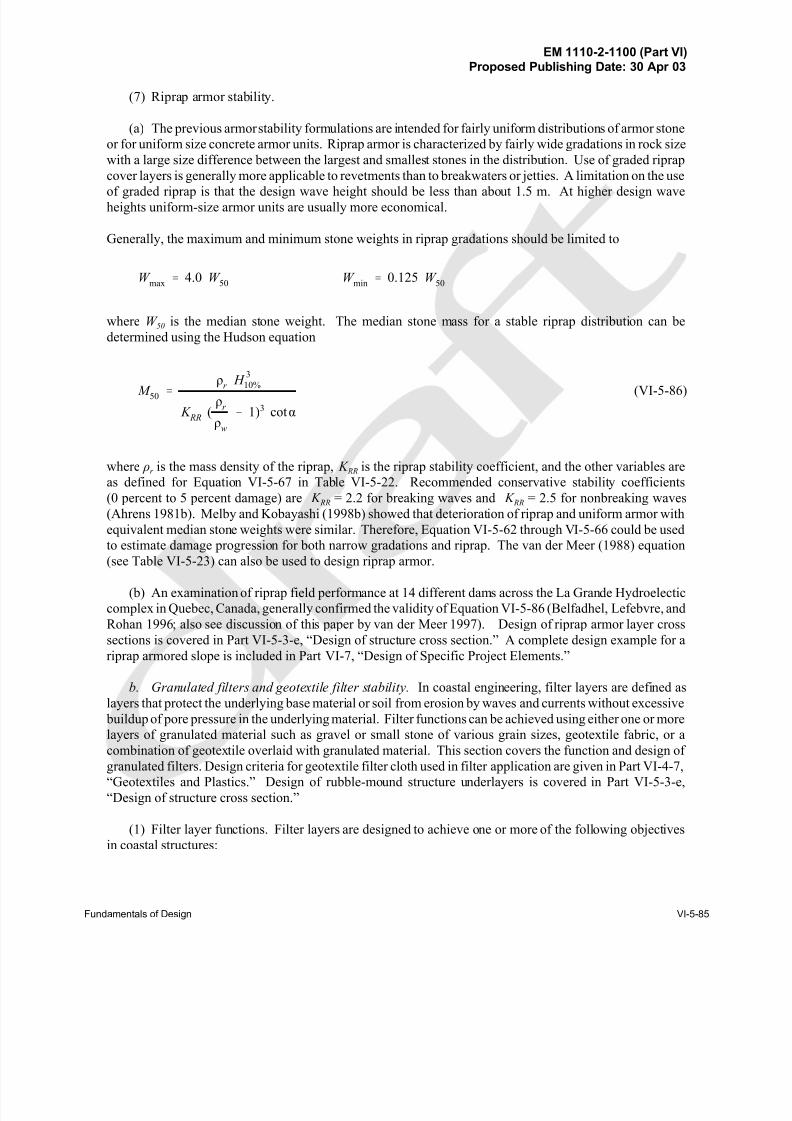
8/13/2019 CEM PartVI-Chap5p1, Fundamentals of Design
http://slidepdf.com/reader/full/cem-partvi-chap5p1-fundamentals-of-design 101/150
EM 1110-2-1100 (Part VI)Proposed Publishing Date: 30 Apr 03
Fundamentals of Design VI-5-85
(7) Riprap armor stability.
(a) The previous armor stability formulations are intended for fairly uniform distributions of armor stone
or for uniform size concrete armor units. Riprap armor is characterized by fairly wide gradations in rock size
with a large size difference between the largest and smallest stones in the distribution. Use of graded riprap
cover layers is generally more applicable to revetments than to breakwaters or jetties. A limitation on the use
of graded riprap is that the design wave height should be less than about 1.5 m. At higher design waveheights uniform-size armor units are usually more economical.
Generally, the maximum and minimum stone weights in riprap gradations should be limited to
W max ' 4.0 W
50W
min ' 0.125 W 50
where W 50 is the median stone weight. The median stone mass for a stable riprap distribution can be
determined using the Hudson equation
(VI-5-86) M 50 '
ρr H 310%
K RR
(ρ
r
ρw
& 1)3 cotα
where ρr is the mass density of the riprap, K RR is the riprap stability coefficient, and the other variables are
as defined for Equation VI-5-67 in Table VI-5-22. Recommended conservative stability coefficients
(0 percent to 5 percent damage) are K RR = 2.2 for breaking waves and K RR = 2.5 for nonbreaking waves
(Ahrens 1981b). Melby and Kobayashi (1998b) showed that deterioration of riprap and uniform armor with
equivalent median stone weights were similar. Therefore, Equation VI-5-62 through VI-5-66 could be used
to estimate damage progression for both narrow gradations and riprap. The van der Meer (1988) equation
(see Table VI-5-23) can also be used to design riprap armor.
(b) An examination of riprap field performance at 14 different dams across the La Grande Hydroelectic
complex in Quebec, Canada, generally confirmed the validity of Equation VI-5-86 (Belfadhel, Lefebvre, and
Rohan 1996; also see discussion of this paper by van der Meer 1997). Design of riprap armor layer cross
sections is covered in Part VI-5-3-e, “Design of structure cross section.” A complete design example for a
riprap armored slope is included in Part VI-7, “Design of Specific Project Elements.”
b. Granulated filters and geotextile filter stability. In coastal engineering, filter layers are defined as
layers that protect the underlying base material or soil from erosion by waves and currents without excessive
buildup of pore pressure in the underlying material. Filter functions can be achieved using either one or more
layers of granulated material such as gravel or small stone of various grain sizes, geotextile fabric, or a
combination of geotextile overlaid with granulated material. This section covers the function and design of
granulated filters. Design criteria for geotextile filter cloth used in filter application are given in Part VI-4-7,
“Geotextiles and Plastics.” Design of rubble-mound structure underlayers is covered in Part VI-5-3-e,
“Design of structure cross section.”
(1) Filter layer functions. Filter layers are designed to achieve one or more of the following objectives
in coastal structures:
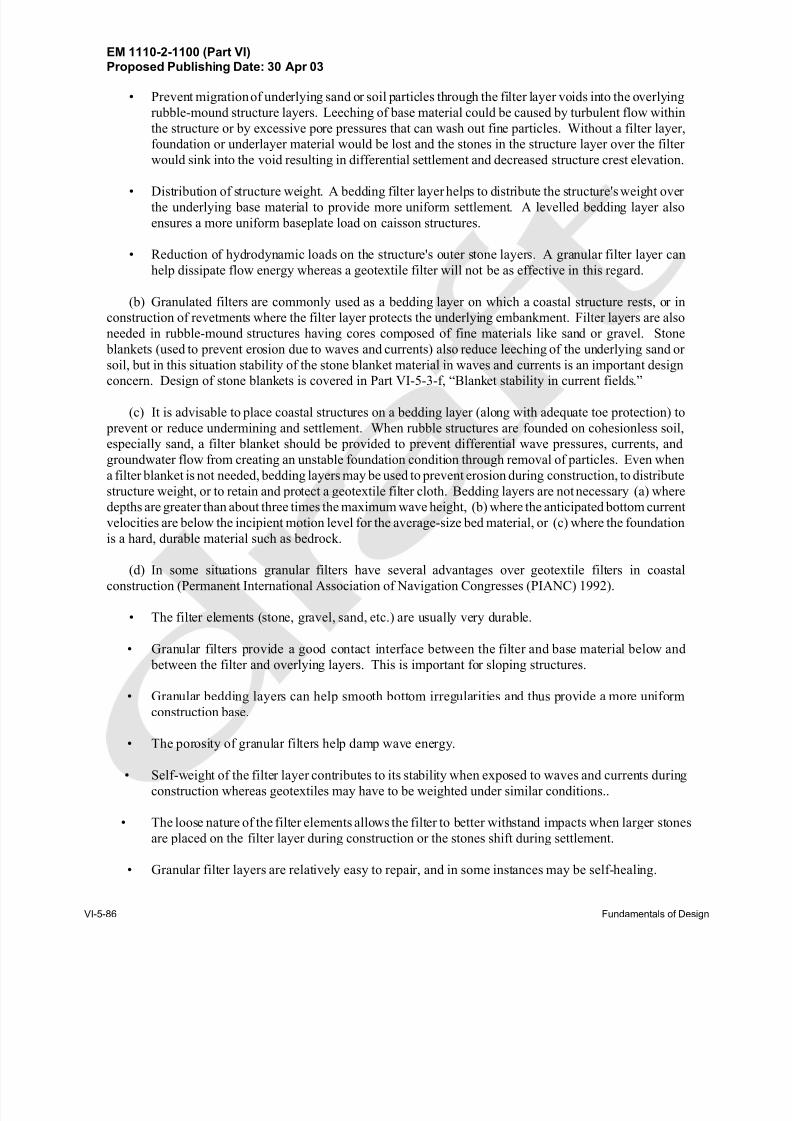
8/13/2019 CEM PartVI-Chap5p1, Fundamentals of Design
http://slidepdf.com/reader/full/cem-partvi-chap5p1-fundamentals-of-design 102/150
EM 1110-2-1100 (Part VI)Proposed Publishing Date: 30 Apr 03
VI-5-86 Fundamentals of Design
• Prevent migration of underlying sand or soil particles through the filter layer voids into the overlying
rubble-mound structure layers. Leeching of base material could be caused by turbulent flow within
the structure or by excessive pore pressures that can wash out fine particles. Without a filter layer,
foundation or underlayer material would be lost and the stones in the structure layer over the filter
would sink into the void resulting in differential settlement and decreased structure crest elevation.
• Distribution of structure weight. A bedding filter layer helps to distribute the structure's weight over the underlying base material to provide more uniform settlement. A levelled bedding layer also
ensures a more uniform baseplate load on caisson structures.
• Reduction of hydrodynamic loads on the structure's outer stone layers. A granular filter layer can
help dissipate flow energy whereas a geotextile filter will not be as effective in this regard.
(b) Granulated filters are commonly used as a bedding layer on which a coastal structure rests, or in
construction of revetments where the filter layer protects the underlying embankment. Filter layers are also
needed in rubble-mound structures having cores composed of fine materials like sand or gravel. Stone
blankets (used to prevent erosion due to waves and currents) also reduce leeching of the underlying sand or
soil, but in this situation stability of the stone blanket material in waves and currents is an important design
concern. Design of stone blankets is covered in Part VI-5-3-f, “Blanket stability in current fields.”
(c) It is advisable to place coastal structures on a bedding layer (along with adequate toe protection) to
prevent or reduce undermining and settlement. When rubble structures are founded on cohesionless soil,
especially sand, a filter blanket should be provided to prevent differential wave pressures, currents, and
groundwater flow from creating an unstable foundation condition through removal of particles. Even when
a filter blanket is not needed, bedding layers may be used to prevent erosion during construction, to distribute
structure weight, or to retain and protect a geotextile filter cloth. Bedding layers are not necessary (a) where
depths are greater than about three times the maximum wave height, (b) where the anticipated bottom current
velocities are below the incipient motion level for the average-size bed material, or (c) where the foundation
is a hard, durable material such as bedrock.
(d) In some situations granular filters have several advantages over geotextile filters in coastalconstruction (Permanent International Association of Navigation Congresses (PIANC) 1992).
• The filter elements (stone, gravel, sand, etc.) are usually very durable.
• Granular filters provide a good contact interface between the filter and base material below and
between the filter and overlying layers. This is important for sloping structures.
• Granular bedding layers can help smooth bottom irregularities and thus provide a more uniform
construction base.
• The porosity of granular filters help damp wave energy.
• Self-weight of the filter layer contributes to its stability when exposed to waves and currents during
construction whereas geotextiles may have to be weighted under similar conditions..
• The loose nature of the filter elements allows the filter to better withstand impacts when larger stones
are placed on the filter layer during construction or the stones shift during settlement.
• Granular filter layers are relatively easy to repair, and in some instances may be self-healing.
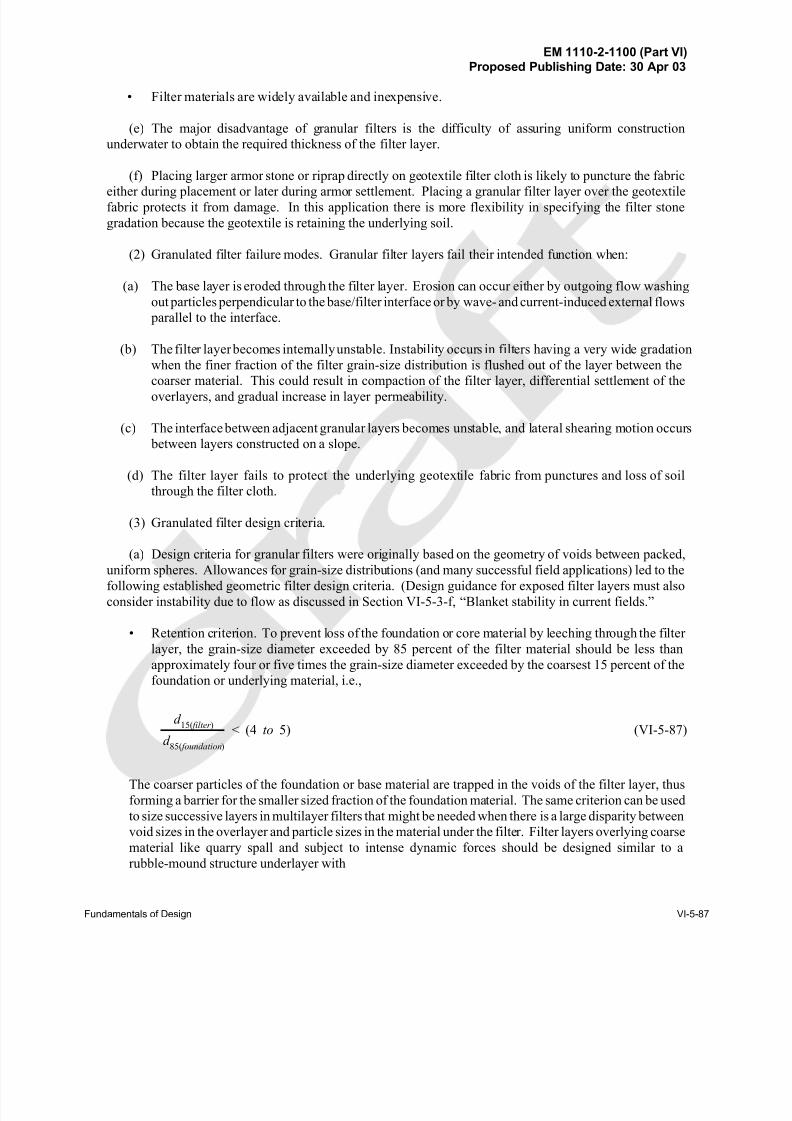
8/13/2019 CEM PartVI-Chap5p1, Fundamentals of Design
http://slidepdf.com/reader/full/cem-partvi-chap5p1-fundamentals-of-design 103/150
EM 1110-2-1100 (Part VI)Proposed Publishing Date: 30 Apr 03
Fundamentals of Design VI-5-87
• Filter materials are widely available and inexpensive.
(e) The major disadvantage of granular filters is the difficulty of assuring uniform construction
underwater to obtain the required thickness of the filter layer.
(f) Placing larger armor stone or riprap directly on geotextile filter cloth is likely to puncture the fabric
either during placement or later during armor settlement. Placing a granular filter layer over the geotextilefabric protects it from damage. In this application there is more flexibility in specifying the filter stone
gradation because the geotextile is retaining the underlying soil.
(2) Granulated filter failure modes. Granular filter layers fail their intended function when:
(a) The base layer is eroded through the filter layer. Erosion can occur either by outgoing flow washing
out particles perpendicular to the base/filter interface or by wave- and current-induced external flows
parallel to the interface.
(b) The filter layer becomes internally unstable. Instability occurs in filters having a very wide gradation
when the finer fraction of the filter grain-size distribution is flushed out of the layer between the
coarser material. This could result in compaction of the filter layer, differential settlement of theoverlayers, and gradual increase in layer permeability.
(c) The interface between adjacent granular layers becomes unstable, and lateral shearing motion occurs
between layers constructed on a slope.
(d) The filter layer fails to protect the underlying geotextile fabric from punctures and loss of soil
through the filter cloth.
(3) Granulated filter design criteria.
(a) Design criteria for granular filters were originally based on the geometry of voids between packed,
uniform spheres. Allowances for grain-size distributions (and many successful field applications) led to thefollowing established geometric filter design criteria. (Design guidance for exposed filter layers must also
consider instability due to flow as discussed in Section VI-5-3-f, “Blanket stability in current fields.”
• Retention criterion. To prevent loss of the foundation or core material by leeching through the filter
layer, the grain-size diameter exceeded by 85 percent of the filter material should be less than
approximately four or five times the grain-size diameter exceeded by the coarsest 15 percent of the
foundation or underlying material, i.e.,
(VI-5-87)d
15( filter )
d 85( foundation)
< (4 to 5)
The coarser particles of the foundation or base material are trapped in the voids of the filter layer, thus
forming a barrier for the smaller sized fraction of the foundation material. The same criterion can be used
to size successive layers in multilayer filters that might be needed when there is a large disparity between
void sizes in the overlayer and particle sizes in the material under the filter. Filter layers overlying coarse
material like quarry spall and subject to intense dynamic forces should be designed similar to a
rubble-mound structure underlayer with
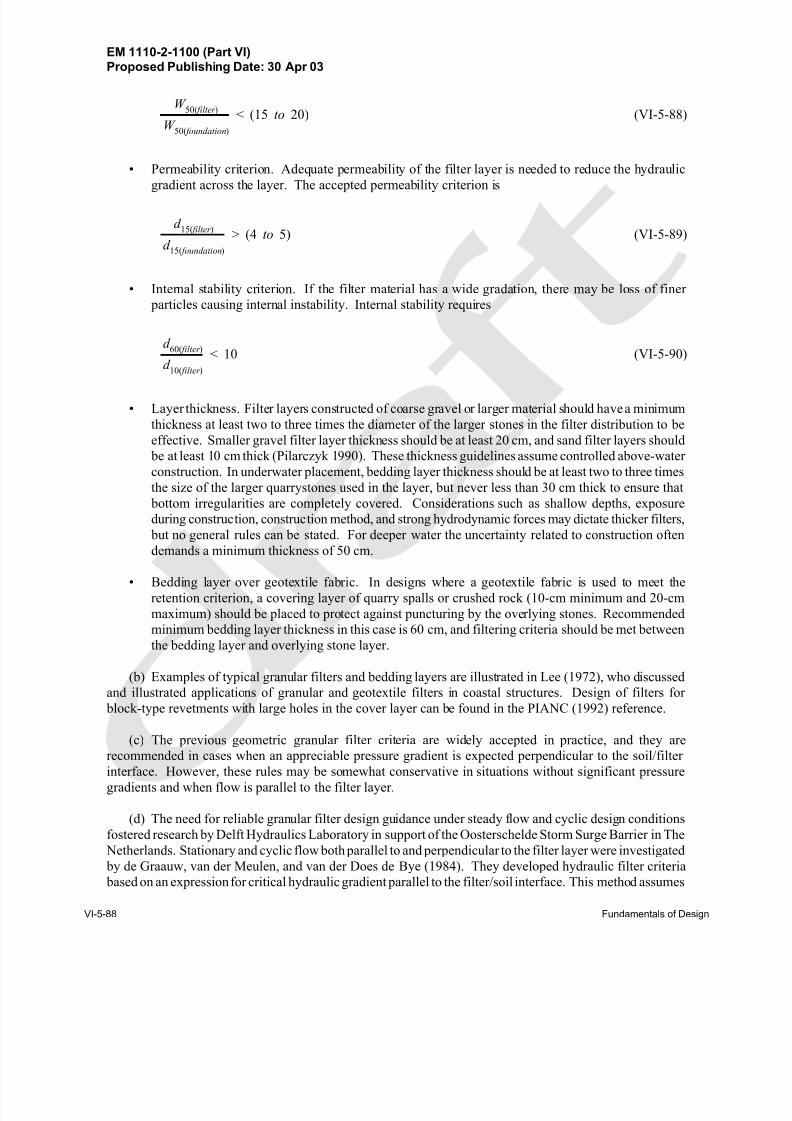
8/13/2019 CEM PartVI-Chap5p1, Fundamentals of Design
http://slidepdf.com/reader/full/cem-partvi-chap5p1-fundamentals-of-design 104/150
EM 1110-2-1100 (Part VI)Proposed Publishing Date: 30 Apr 03
VI-5-88 Fundamentals of Design
(VI-5-88)W
50( filter )
W 50( foundation)
< (15 to 20)
• Permeability criterion. Adequate permeability of the filter layer is needed to reduce the hydraulic
gradient across the layer. The accepted permeability criterion is
(VI-5-89)d
15( filter )
d 15( foundation)
> (4 to 5)
• Internal stability criterion. If the filter material has a wide gradation, there may be loss of finer
particles causing internal instability. Internal stability requires
(VI-5-90)d
60( filter )
d 10( filter )
< 10
• Layer thickness. Filter layers constructed of coarse gravel or larger material should have a minimum
thickness at least two to three times the diameter of the larger stones in the filter distribution to be
effective. Smaller gravel filter layer thickness should be at least 20 cm, and sand filter layers should
be at least 10 cm thick (Pilarczyk 1990). These thickness guidelines assume controlled above-water
construction. In underwater placement, bedding layer thickness should be at least two to three times
the size of the larger quarrystones used in the layer, but never less than 30 cm thick to ensure that
bottom irregularities are completely covered. Considerations such as shallow depths, exposure
during construction, construction method, and strong hydrodynamic forces may dictate thicker filters,
but no general rules can be stated. For deeper water the uncertainty related to construction often
demands a minimum thickness of 50 cm.
• Bedding layer over geotextile fabric. In designs where a geotextile fabric is used to meet the
retention criterion, a covering layer of quarry spalls or crushed rock (10-cm minimum and 20-cm
maximum) should be placed to protect against puncturing by the overlying stones. Recommended
minimum bedding layer thickness in this case is 60 cm, and filtering criteria should be met between
the bedding layer and overlying stone layer.
(b) Examples of typical granular filters and bedding layers are illustrated in Lee (1972), who discussed
and illustrated applications of granular and geotextile filters in coastal structures. Design of filters for
block-type revetments with large holes in the cover layer can be found in the PIANC (1992) reference.
(c) The previous geometric granular filter criteria are widely accepted in practice, and they are
recommended in cases when an appreciable pressure gradient is expected perpendicular to the soil/filter interface. However, these rules may be somewhat conservative in situations without significant pressure
gradients and when flow is parallel to the filter layer.
(d) The need for reliable granular filter design guidance under steady flow and cyclic design conditions
fostered research by Delft Hydraulics Laboratory in support of the Oosterschelde Storm Surge Barrier in The
Netherlands. Stationary and cyclic flow both parallel to and perpendicular to the filter layer were investigated
by de Graauw, van der Meulen, and van der Does de Bye (1984). They developed hydraulic filter criteria
based on an expression for critical hydraulic gradient parallel to the filter/soil interface. This method assumes
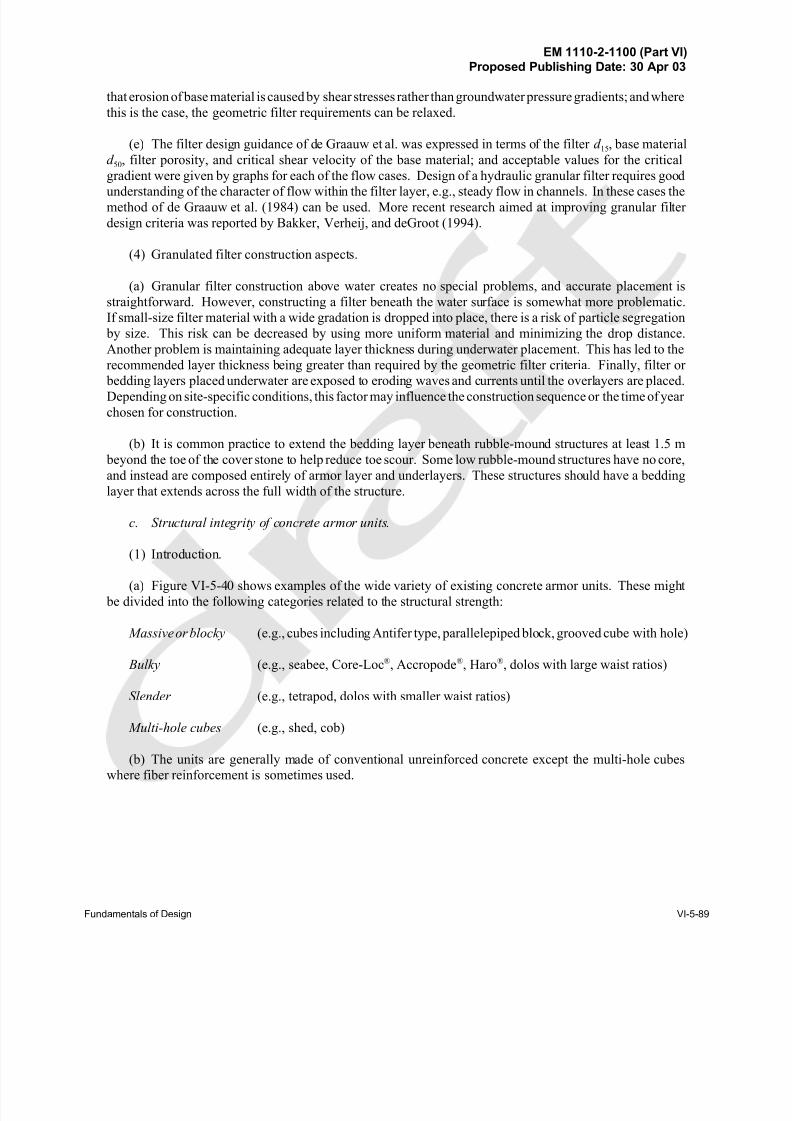
8/13/2019 CEM PartVI-Chap5p1, Fundamentals of Design
http://slidepdf.com/reader/full/cem-partvi-chap5p1-fundamentals-of-design 105/150
EM 1110-2-1100 (Part VI)Proposed Publishing Date: 30 Apr 03
Fundamentals of Design VI-5-89
that erosion of base material is caused by shear stresses rather than groundwater pressure gradients; and where
this is the case, the geometric filter requirements can be relaxed.
(e) The filter design guidance of de Graauw et al. was expressed in terms of the filter d 15, base material
d 50, filter porosity, and critical shear velocity of the base material; and acceptable values for the critical
gradient were given by graphs for each of the flow cases. Design of a hydraulic granular filter requires good
understanding of the character of flow within the filter layer, e.g., steady flow in channels. In these cases themethod of de Graauw et al. (1984) can be used. More recent research aimed at improving granular filter
design criteria was reported by Bakker, Verheij, and deGroot (1994).
(4) Granulated filter construction aspects.
(a) Granular filter construction above water creates no special problems, and accurate placement is
straightforward. However, constructing a filter beneath the water surface is somewhat more problematic.
If small-size filter material with a wide gradation is dropped into place, there is a risk of particle segregation
by size. This risk can be decreased by using more uniform material and minimizing the drop distance.
Another problem is maintaining adequate layer thickness during underwater placement. This has led to the
recommended layer thickness being greater than required by the geometric filter criteria. Finally, filter or
bedding layers placed underwater are exposed to eroding waves and currents until the overlayers are placed.Depending on site-specific conditions, this factor may influence the construction sequence or the time of year
chosen for construction.
(b) It is common practice to extend the bedding layer beneath rubble-mound structures at least 1.5 m
beyond the toe of the cover stone to help reduce toe scour. Some low rubble-mound structures have no core,
and instead are composed entirely of armor layer and underlayers. These structures should have a bedding
layer that extends across the full width of the structure.
c. Structural integrity of concrete armor units.
(1) Introduction.
(a) Figure VI-5-40 shows examples of the wide variety of existing concrete armor units. These might
be divided into the following categories related to the structural strength:
Massive or blocky (e.g., cubes including Antifer type, parallelepiped block, grooved cube with hole)
Bulky (e.g., seabee, Core-Loc®, Accropode®, Haro®, dolos with large waist ratios)
Slender (e.g., tetrapod, dolos with smaller waist ratios)
Multi-hole cubes (e.g., shed, cob)
(b) The units are generally made of conventional unreinforced concrete except the multi-hole cubeswhere fiber reinforcement is sometimes used.
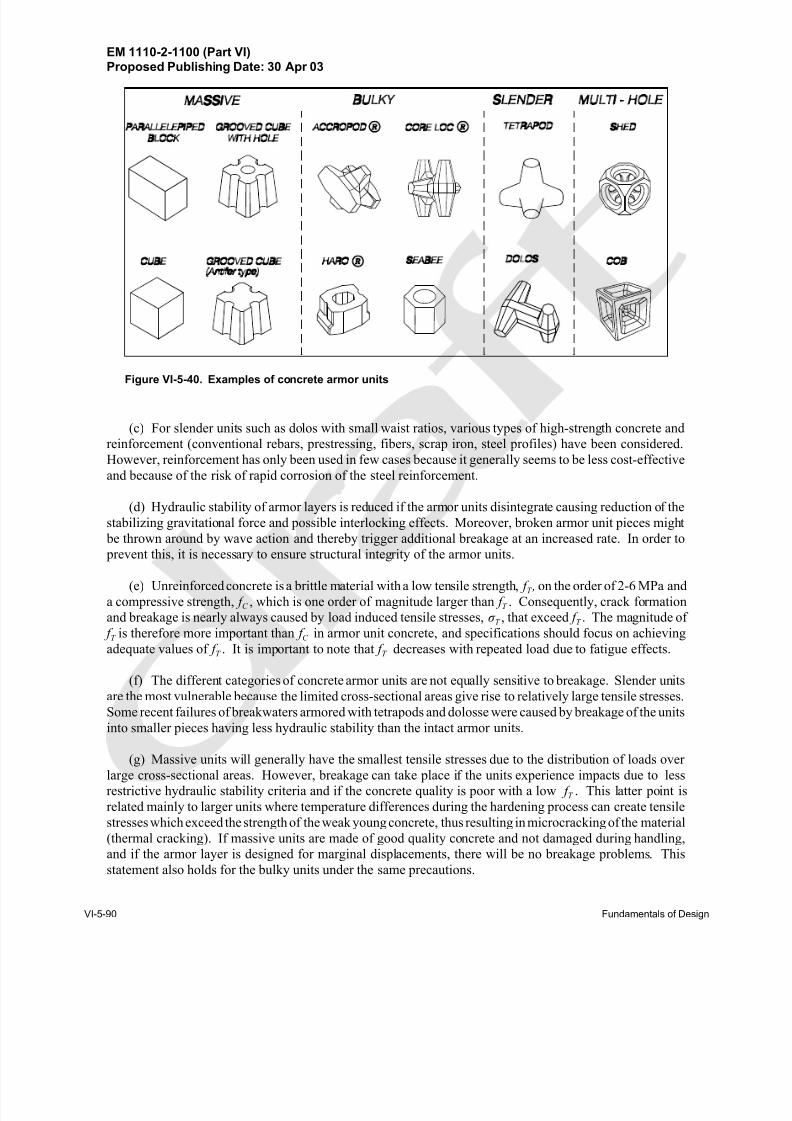
8/13/2019 CEM PartVI-Chap5p1, Fundamentals of Design
http://slidepdf.com/reader/full/cem-partvi-chap5p1-fundamentals-of-design 106/150
EM 1110-2-1100 (Part VI)Proposed Publishing Date: 30 Apr 03
VI-5-90 Fundamentals of Design
Figure VI-5-40. Examples of concrete armor units
(c) For slender units such as dolos with small waist ratios, various types of high-strength concrete and
reinforcement (conventional rebars, prestressing, fibers, scrap iron, steel profiles) have been considered.
However, reinforcement has only been used in few cases because it generally seems to be less cost-effective
and because of the risk of rapid corrosion of the steel reinforcement.
(d) Hydraulic stability of armor layers is reduced if the armor units disintegrate causing reduction of the
stabilizing gravitational force and possible interlocking effects. Moreover, broken armor unit pieces might
be thrown around by wave action and thereby trigger additional breakage at an increased rate. In order to
prevent this, it is necessary to ensure structural integrity of the armor units.
(e) Unreinforced concrete is a brittle material with a low tensile strength, f T , on the order of 2-6 MPa and
a compressive strength, f C , which is one order of magnitude larger than f T . Consequently, crack formation
and breakage is nearly always caused by load induced tensile stresses, σ T , that exceed f T . The magnitude of
f T is therefore more important than f C in armor unit concrete, and specifications should focus on achieving
adequate values of f T . It is important to note that f T decreases with repeated load due to fatigue effects.
(f) The different categories of concrete armor units are not equally sensitive to breakage. Slender units
are the most vulnerable because the limited cross-sectional areas give rise to relatively large tensile stresses.
Some recent failures of breakwaters armored with tetrapods and dolosse were caused by breakage of the units
into smaller pieces having less hydraulic stability than the intact armor units.
(g) Massive units will generally have the smallest tensile stresses due to the distribution of loads over large cross-sectional areas. However, breakage can take place if the units experience impacts due to less
restrictive hydraulic stability criteria and if the concrete quality is poor with a low f T . This latter point is
related mainly to larger units where temperature differences during the hardening process can create tensile
stresses which exceed the strength of the weak young concrete, thus resulting in microcracking of the material
(thermal cracking). If massive units are made of good quality concrete and not damaged during handling,
and if the armor layer is designed for marginal displacements, there will be no breakage problems. This
statement also holds for the bulky units under the same precautions.
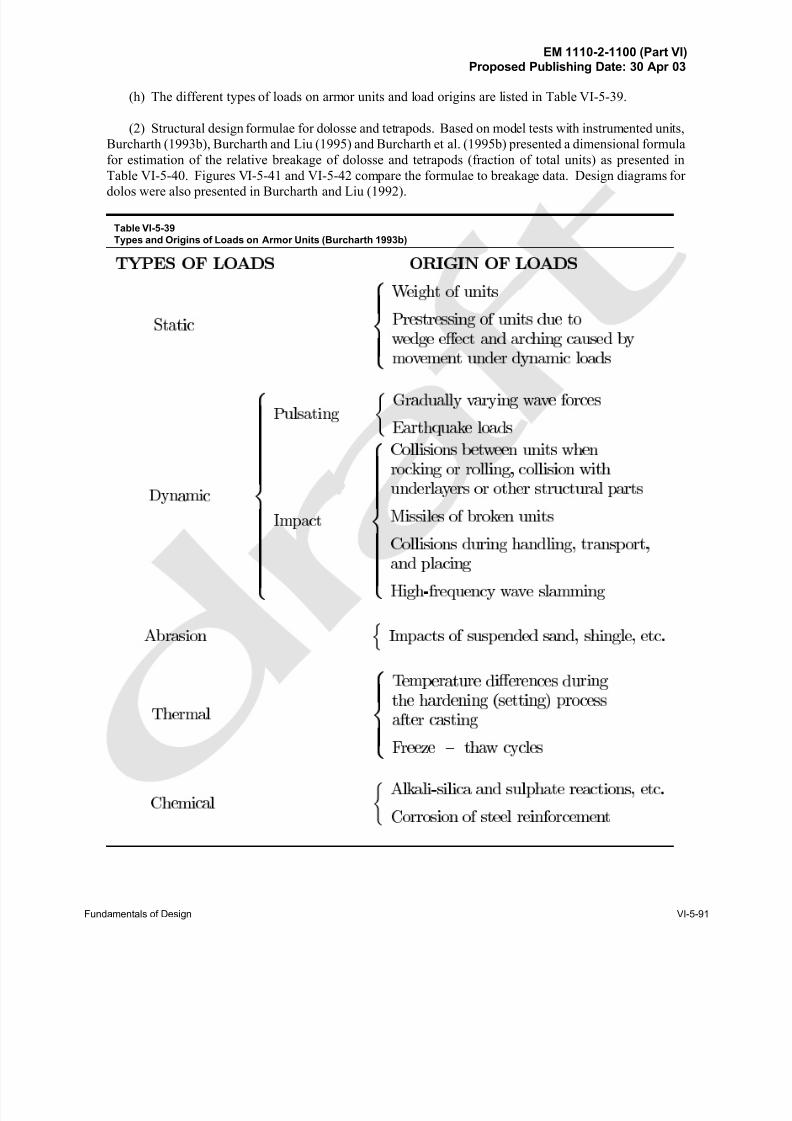
8/13/2019 CEM PartVI-Chap5p1, Fundamentals of Design
http://slidepdf.com/reader/full/cem-partvi-chap5p1-fundamentals-of-design 107/150
EM 1110-2-1100 (Part VI)Proposed Publishing Date: 30 Apr 03
Fundamentals of Design VI-5-91
(h) The different types of loads on armor units and load origins are listed in Table VI-5-39.
(2) Structural design formulae for dolosse and tetrapods. Based on model tests with instrumented units,
Burcharth (1993b), Burcharth and Liu (1995) and Burcharth et al. (1995b) presented a dimensional formula
for estimation of the relative breakage of dolosse and tetrapods (fraction of total units) as presented in
Table VI-5-40. Figures VI-5-41 and VI-5-42 compare the formulae to breakage data. Design diagrams for
dolos were also presented in Burcharth and Liu (1992).
Table VI-5-39
Types and Origins of Loads on Armor Units (Burcharth 1993b)
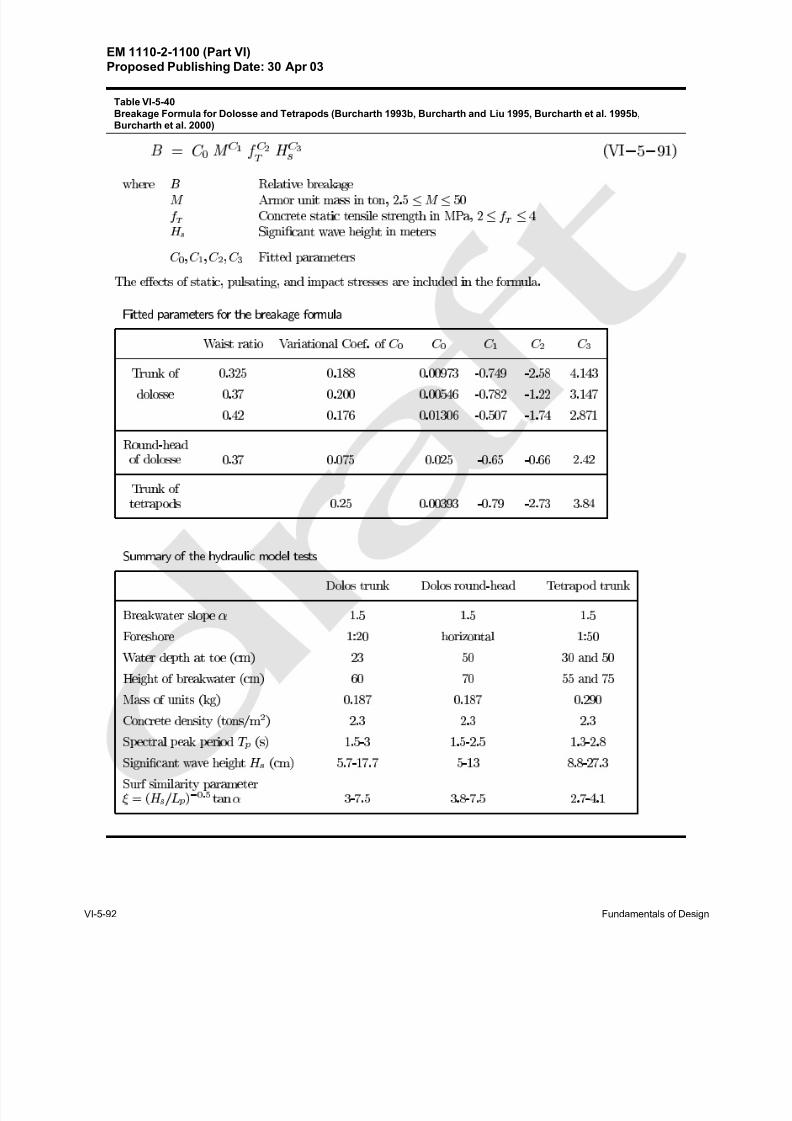
8/13/2019 CEM PartVI-Chap5p1, Fundamentals of Design
http://slidepdf.com/reader/full/cem-partvi-chap5p1-fundamentals-of-design 108/150
EM 1110-2-1100 (Part VI)Proposed Publishing Date: 30 Apr 03
VI-5-92 Fundamentals of Design
Table VI-5-40
Breakage Formula for Dolosse and Tetrapods (Burcharth 1993b, Burcharth and Liu 1995, Burcharth et al. 1995b,Burcharth et al. 2000)
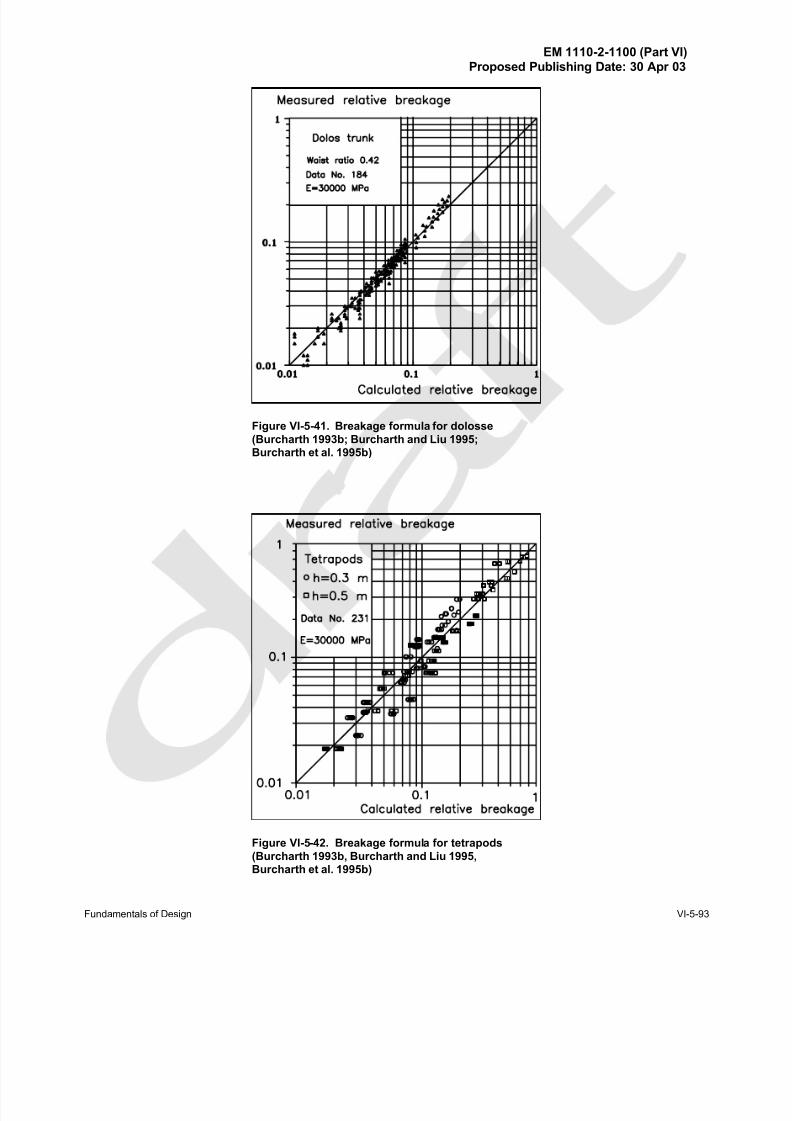
8/13/2019 CEM PartVI-Chap5p1, Fundamentals of Design
http://slidepdf.com/reader/full/cem-partvi-chap5p1-fundamentals-of-design 109/150
EM 1110-2-1100 (Part VI)Proposed Publishing Date: 30 Apr 03
Fundamentals of Design VI-5-93
Figure VI-5-41. Breakage formula for dolosse
(Burcharth 1993b; Burcharth and Liu 1995;Burcharth et al. 1995b)
Figure VI-5-42. Breakage formula for tetrapods
(Burcharth 1993b, Burcharth and Liu 1995,Burcharth et al. 1995b)
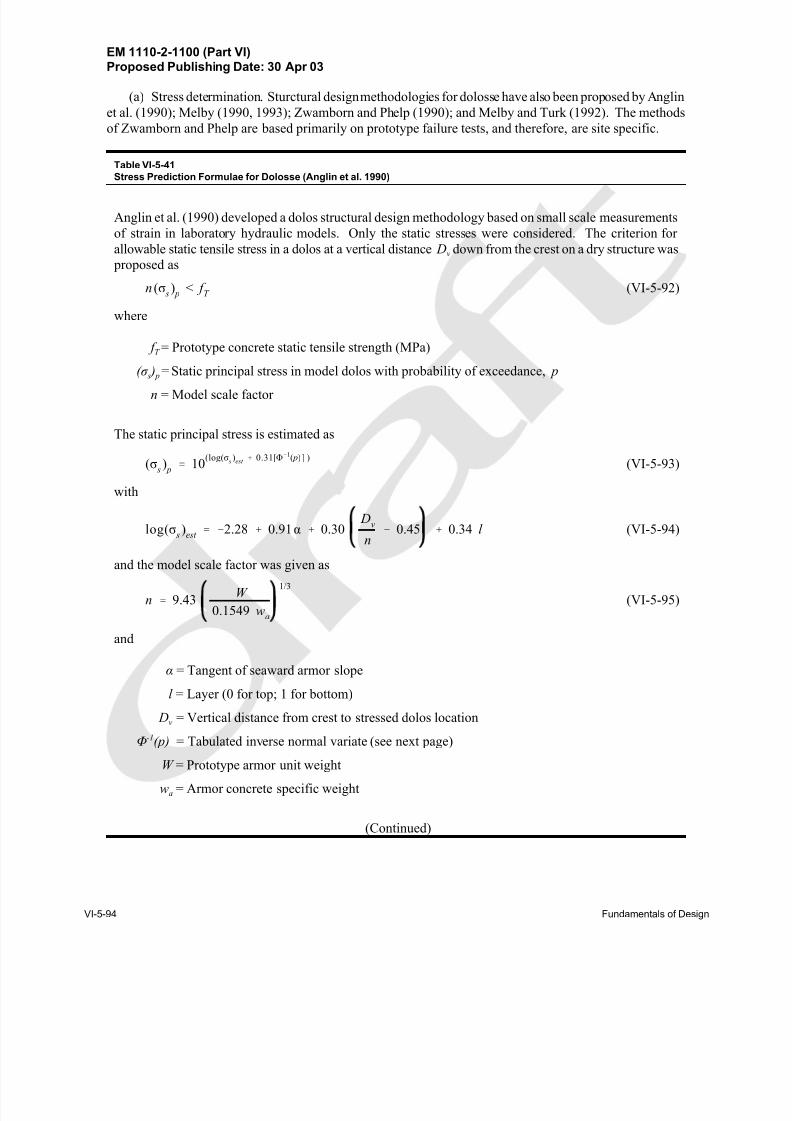
8/13/2019 CEM PartVI-Chap5p1, Fundamentals of Design
http://slidepdf.com/reader/full/cem-partvi-chap5p1-fundamentals-of-design 110/150
EM 1110-2-1100 (Part VI)Proposed Publishing Date: 30 Apr 03
VI-5-94 Fundamentals of Design
(a) Stress determination. Sturctural design methodologies for dolosse have also been proposed by Anglin
et al. (1990); Melby (1990, 1993); Zwamborn and Phelp (1990); and Melby and Turk (1992). The methods
of Zwamborn and Phelp are based primarily on prototype failure tests, and therefore, are site specific.
Table VI-5-41
Stress Prediction Formulae for Dolosse (Anglin et al. 1990)
Anglin et al. (1990) developed a dolos structural design methodology based on small scale measurements
of strain in laboratory hydraulic models. Only the static stresses were considered. The criterion for
allowable static tensile stress in a dolos at a vertical distance Dv down from the crest on a dry structure was
proposed as
(VI-5-92)n (σ s
) p
< f T
where
f T = Prototype concrete static tensile strength (MPa)
( σ s )
p =
Static principal stress in model dolos with probability of exceedance, p
n = Model scale factor
The static principal stress is estimated as
(VI-5-93)(σ s
) p
' 10(log(σ s)est % 0.31[Φ&1( p) ] )
with
(VI-5-94)log(σ s
)est ' &2.28 % 0.91α % 0.30
Dv
n& 0.45 % 0.34 l
and the model scale factor was given as
(VI-5-95)n ' 9.43W
0.1549 wa
1/3
and
α = Tangent of seaward armor slope
l = Layer (0 for top; 1 for bottom)
Dv = Vertical distance from crest to stressed dolos location
Φ-1(p) = Tabulated inverse normal variate (see next page)
W = Prototype armor unit weight
wa = Armor concrete specific weight
(Continued)
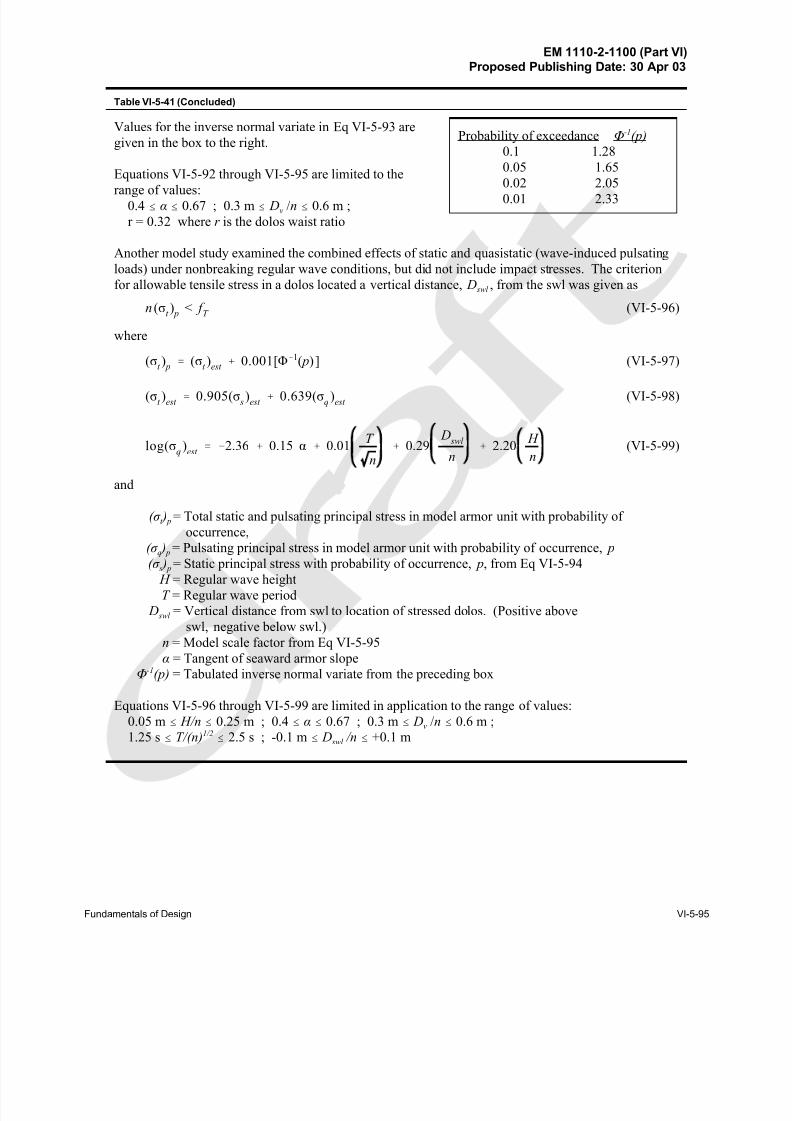
8/13/2019 CEM PartVI-Chap5p1, Fundamentals of Design
http://slidepdf.com/reader/full/cem-partvi-chap5p1-fundamentals-of-design 111/150
EM 1110-2-1100 (Part VI)Proposed Publishing Date: 30 Apr 03
Fundamentals of Design VI-5-95
Probability of exceedance Φ-1(p)
0.1 1.28
0.05 1.65
0.02 2.05 0.01 2.33
Table VI-5-41 (Concluded)
Values for the inverse normal variate in Eq VI-5-93 are
given in the box to the right.
Equations VI-5-92 through VI-5-95 are limited to the
range of values: 0.4 # α # 0.67 ; 0.3 m # Dv /n # 0.6 m ;
r = 0.32 where r is the dolos waist ratio
Another model study examined the combined effects of static and quasistatic (wave-induced pulsating
loads) under nonbreaking regular wave conditions, but did not include impact stresses. The criterion
for allowable tensile stress in a dolos located a vertical distance, D swl , from the swl was given as
(VI-5-96)n (σt ) p
< f T
where
(VI-5-97)(σt ) p ' (σ
t )est % 0.001[Φ&1( p)]
(VI-5-98)(σt )est
' 0.905(σ s
)est
% 0.639(σq)est
(VI-5-99)log(σq)est
' &2.36 % 0.15 α % 0.01T
n% 0.29
D swl
n% 2.20
H
n
and
( σ t ) p = Total static and pulsating principal stress in model armor unit with probability of
occurrence,
( σ q ) p = Pulsating principal stress in model armor unit with probability of occurrence, p
( σ s ) p = Static principal stress with probability of occurrence, p, from Eq VI-5-94 H = Regular wave height
T = Regular wave period
D swl = Vertical distance from swl to location of stressed dolos. (Positive above
swl, negative below swl.)
n = Model scale factor from Eq VI-5-95
α = Tangent of seaward armor slope
Φ-1(p) = Tabulated inverse normal variate from the preceding box
Equations VI-5-96 through VI-5-99 are limited in application to the range of values:
0.05 m # H/n # 0.25 m ; 0.4 # α # 0.67 ; 0.3 m # Dv /n # 0.6 m ;
1.25 s # T/(n)1/2 # 2.5 s ; -0.1 m # D swl /n # +0.1 m
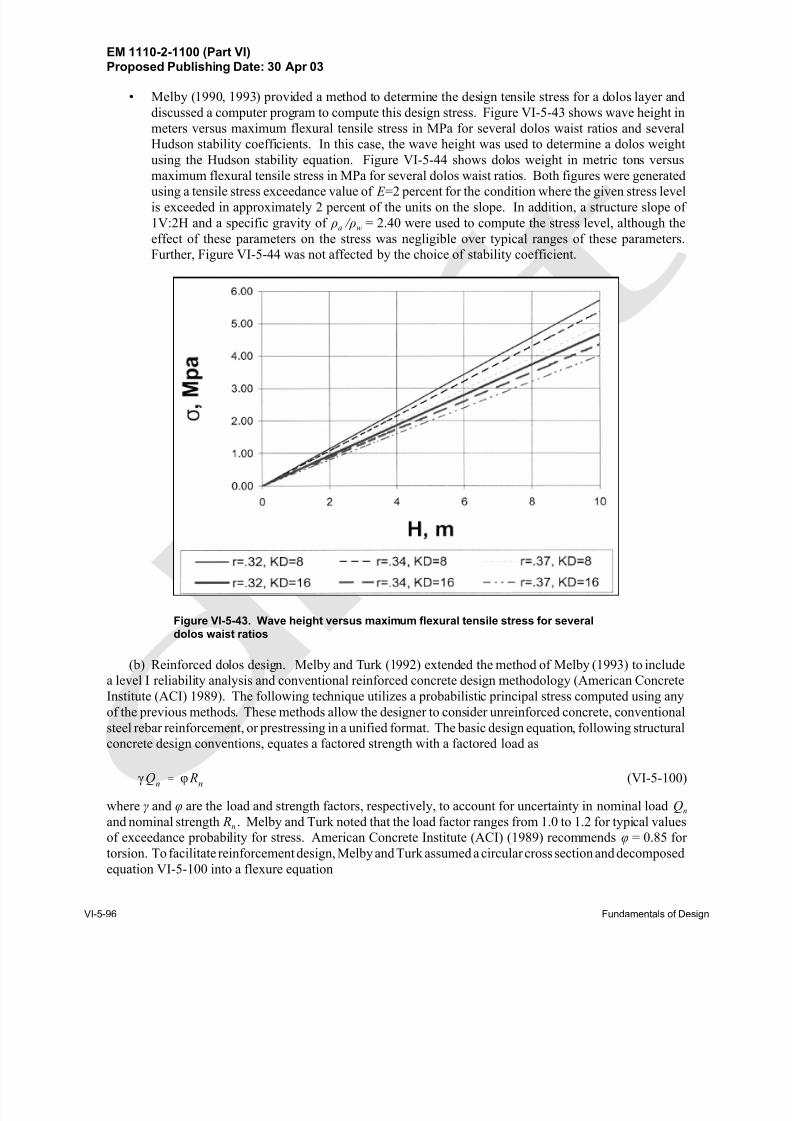
8/13/2019 CEM PartVI-Chap5p1, Fundamentals of Design
http://slidepdf.com/reader/full/cem-partvi-chap5p1-fundamentals-of-design 112/150
EM 1110-2-1100 (Part VI)Proposed Publishing Date: 30 Apr 03
VI-5-96 Fundamentals of Design
Figure VI-5-43. Wave height versus maximum flexural tensile stress for several
dolos waist ratios
• Melby (1990, 1993) provided a method to determine the design tensile stress for a dolos layer and
discussed a computer program to compute this design stress. Figure VI-5-43 shows wave height in
meters versus maximum flexural tensile stress in MPa for several dolos waist ratios and several
Hudson stability coefficients. In this case, the wave height was used to determine a dolos weight
using the Hudson stability equation. Figure VI-5-44 shows dolos weight in metric tons versus
maximum flexural tensile stress in MPa for several dolos waist ratios. Both figures were generated
using a tensile stress exceedance value of E =2 percent for the condition where the given stress levelis exceeded in approximately 2 percent of the units on the slope. In addition, a structure slope of
1V:2H and a specific gravity of ρa / ρw = 2.40 were used to compute the stress level, although the
effect of these parameters on the stress was negligible over typical ranges of these parameters.
Further, Figure VI-5-44 was not affected by the choice of stability coefficient.
(b) Reinforced dolos design. Melby and Turk (1992) extended the method of Melby (1993) to include
a level I reliability analysis and conventional reinforced concrete design methodology (American Concrete
Institute (ACI) 1989). The following technique utilizes a probabilistic principal stress computed using any
of the previous methods. These methods allow the designer to consider unreinforced concrete, conventional
steel rebar reinforcement, or prestressing in a unified format. The basic design equation, following structural
concrete design conventions, equates a factored strength with a factored load as
(VI-5-100)γQn ' φ R
n
where γ and φ are the load and strength factors, respectively, to account for uncertainty in nominal load Qn
and nominal strength Rn . Melby and Turk noted that the load factor ranges from 1.0 to 1.2 for typical values
of exceedance probability for stress. American Concrete Institute (ACI) (1989) recommends φ = 0.85 for
torsion. To facilitate reinforcement design, Melby and Turk assumed a circular cross section and decomposed
equation VI-5-100 into a flexure equation
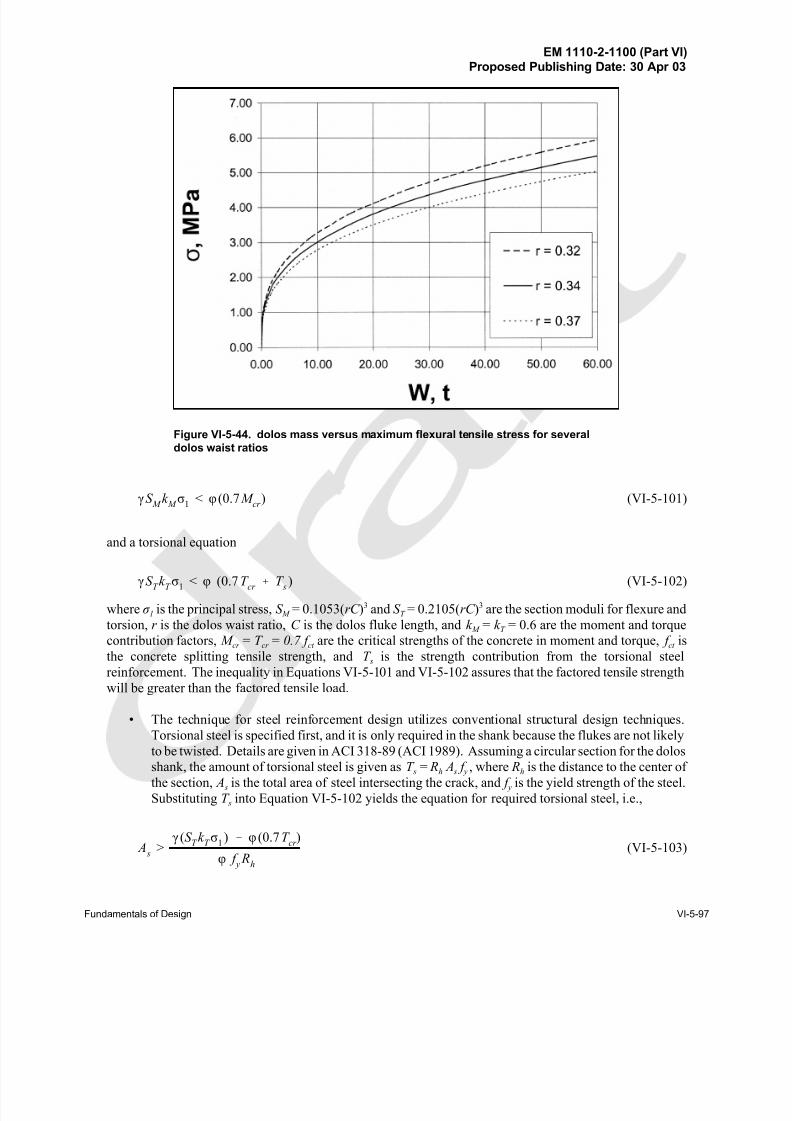
8/13/2019 CEM PartVI-Chap5p1, Fundamentals of Design
http://slidepdf.com/reader/full/cem-partvi-chap5p1-fundamentals-of-design 113/150
EM 1110-2-1100 (Part VI)Proposed Publishing Date: 30 Apr 03
Fundamentals of Design VI-5-97
Figure VI-5-44. dolos mass versus maximum flexural tensile stress for several
dolos waist ratios
(VI-5-101)γS M
k M σ
1< φ(0.7 M
cr )
and a torsional equation
(VI-5-102)γS T k
T σ
1< φ (0.7T
cr % T s
)
where σ 1 is the principal stress, S M = 0.1053(rC )3 and S T = 0.2105(rC )3 are the section moduli for flexure and
torsion, r is the dolos waist ratio, C is the dolos fluke length, and k M = k T = 0.6 are the moment and torque
contribution factors, M cr = T cr = 0.7 f ct are the critical strengths of the concrete in moment and torque, f ct is
the concrete splitting tensile strength, and T s is the strength contribution from the torsional steel
reinforcement. The inequality in Equations VI-5-101 and VI-5-102 assures that the factored tensile strength
will be greater than the factored tensile load.
• The technique for steel reinforcement design utilizes conventional structural design techniques.
Torsional steel is specified first, and it is only required in the shank because the flukes are not likely
to be twisted. Details are given in ACI 318-89 (ACI 1989). Assuming a circular section for the dolosshank, the amount of torsional steel is given as T s = Rh A s f y , where Rh is the distance to the center of
the section, A s is the total area of steel intersecting the crack, and f y is the yield strength of the steel.
Substituting T s into Equation VI-5-102 yields the equation for required torsional steel, i.e.,
(VI-5-103) A s
>γ (S
T k
T σ
1) & φ (0.7T
cr )
φ f y R
h
8/13/2019 CEM PartVI-Chap5p1, Fundamentals of Design
http://slidepdf.com/reader/full/cem-partvi-chap5p1-fundamentals-of-design 114/150
EM 1110-2-1100 (Part VI)Proposed Publishing Date: 30 Apr 03
VI-5-98 Fundamentals of Design
• The number of bars required is then given by n = A s /Ab , where Ab is the cross-sectional area of hoop
reinforcing bars, and the spacing is s = 1.5π Rh /n , assuming the crack extends three-fourths of the
distance around the circumference.
• For flexural reinforcement design, it is assumed that the concrete offers no resistance in tension.
Nominal strength is reached when the crushing strain in the outer fiber of the concrete is balanced
by the yield strain in the steel rebar. The balanced failure condition using the Whitney rectangular stress block is prescribed in ACI 318-89, Part 10. The solution requires an iterative approach because
the neutral axis is a priori unknown. Assuming a rebar size, the neutral axis is located by solving the
quadratic equation that results from balancing the compressive force moment from the Whitney stress
block with the tensile force moment from the steel. Once the neutral axis is determined, the nominal
moment from the steel can determined and substituted into Equation VI-5-101 to determine if the
quantity of steel is adequate to balance the flexural design load. After determining the amount of
flexural steel required, typical checks of compressive stress, shear, bond, minimum reinforcement,
and temperature steel should be made as per ACI 318-89.
(c) Prestressed dolos design. Prestressing acts reduce principal stress. The principal stress reduction
factor is given by
(VI-5-104)ξ ' 0.5 (k M & λ ) % (k
M & λ )2% 4k
2
T
where λ is the ratio of applied precompressive stress to design principal stress. This equation was substituted
into the moment-torque interaction relations to get design equations for torsion and flexure as follows:
(VI-5-105)γξk T σ
1 ' 0.5φ
f c
1 % 4k M
S M
k T S
T
2
(VI-5-106)γξk M σ
1 ' 0.5φ f
c
1 % 0.25k
T S
T
k M
S M
2
where f c is the concrete compressive strength. These equations are similar to Equations VI-5-101 and VI-5-
102, but they are for prestressed concrete design. Details for determining prestressing steel requirements are
given in ACI 318-89 (ACI 1989).
(3) Ultimate impact velocities end equivalent drop height.
(a) For evaluation of the placing technique during construction it is important to consider the ultimate
impact velocities. The lowering speed of the crane at the moment of positioning of the units must be much
slower than the values given in Table VI-5-42. The values of ultimate impact velocities given in
Table VI-5-42 are rough estimates corresponding to solid body impact against a heavy rigid concrete base
which causes breakage resulting in a mass loss of 20 percent or more. If the armor units are not dropped on
a hard rigid surface but instead on soil or a rock underlayer, the ultimate impact velocities can be significantly
higher than those given in Table VI-5-42.
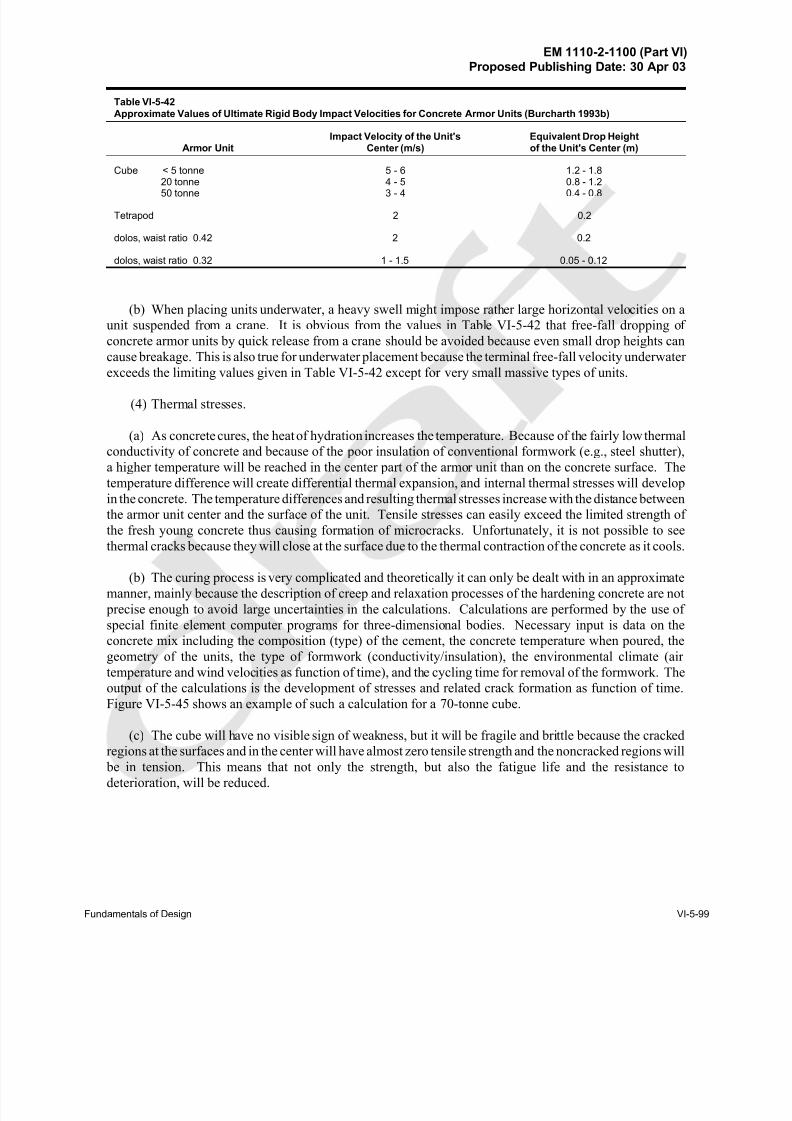
8/13/2019 CEM PartVI-Chap5p1, Fundamentals of Design
http://slidepdf.com/reader/full/cem-partvi-chap5p1-fundamentals-of-design 115/150
EM 1110-2-1100 (Part VI)Proposed Publishing Date: 30 Apr 03
Fundamentals of Design VI-5-99
Table VI-5-42
Approximate Values of Ultimate Rigid Body Impact Velocities for Concrete Armor Units (Burcharth 1993b)
Armor UnitImpact Velocity of the Unit's
Center (m/s)Equivalent Drop Heightof the Unit's Center (m)
Cube < 5 tonne 20 tonne 50 tonne
5 - 64 - 53 - 4
1.2 - 1.80.8 - 1.20.4 - 0.8
Tetrapod 2 0.2
dolos, waist ratio 0.42 2 0.2
dolos, waist ratio 0.32 1 - 1.5 0.05 - 0.12
(b) When placing units underwater, a heavy swell might impose rather large horizontal velocities on a
unit suspended from a crane. It is obvious from the values in Table VI-5-42 that free-fall dropping of
concrete armor units by quick release from a crane should be avoided because even small drop heights can
cause breakage. This is also true for underwater placement because the terminal free-fall velocity underwater
exceeds the limiting values given in Table VI-5-42 except for very small massive types of units.
(4) Thermal stresses.
(a) As concrete cures, the heat of hydration increases the temperature. Because of the fairly low thermal
conductivity of concrete and because of the poor insulation of conventional formwork (e.g., steel shutter),
a higher temperature will be reached in the center part of the armor unit than on the concrete surface. The
temperature difference will create differential thermal expansion, and internal thermal stresses will develop
in the concrete. The temperature differences and resulting thermal stresses increase with the distance between
the armor unit center and the surface of the unit. Tensile stresses can easily exceed the limited strength of
the fresh young concrete thus causing formation of microcracks. Unfortunately, it is not possible to see
thermal cracks because they will close at the surface due to the thermal contraction of the concrete as it cools.
(b) The curing process is very complicated and theoretically it can only be dealt with in an approximate
manner, mainly because the description of creep and relaxation processes of the hardening concrete are not
precise enough to avoid large uncertainties in the calculations. Calculations are performed by the use of
special finite element computer programs for three-dimensional bodies. Necessary input is data on the
concrete mix including the composition (type) of the cement, the concrete temperature when poured, the
geometry of the units, the type of formwork (conductivity/insulation), the environmental climate (air
temperature and wind velocities as function of time), and the cycling time for removal of the formwork. The
output of the calculations is the development of stresses and related crack formation as function of time.
Figure VI-5-45 shows an example of such a calculation for a 70-tonne cube.
(c) The cube will have no visible sign of weakness, but it will be fragile and brittle because the cracked
regions at the surfaces and in the center will have almost zero tensile strength and the noncracked regions will be in tension. This means that not only the strength, but also the fatigue life and the resistance to
deterioration, will be reduced.
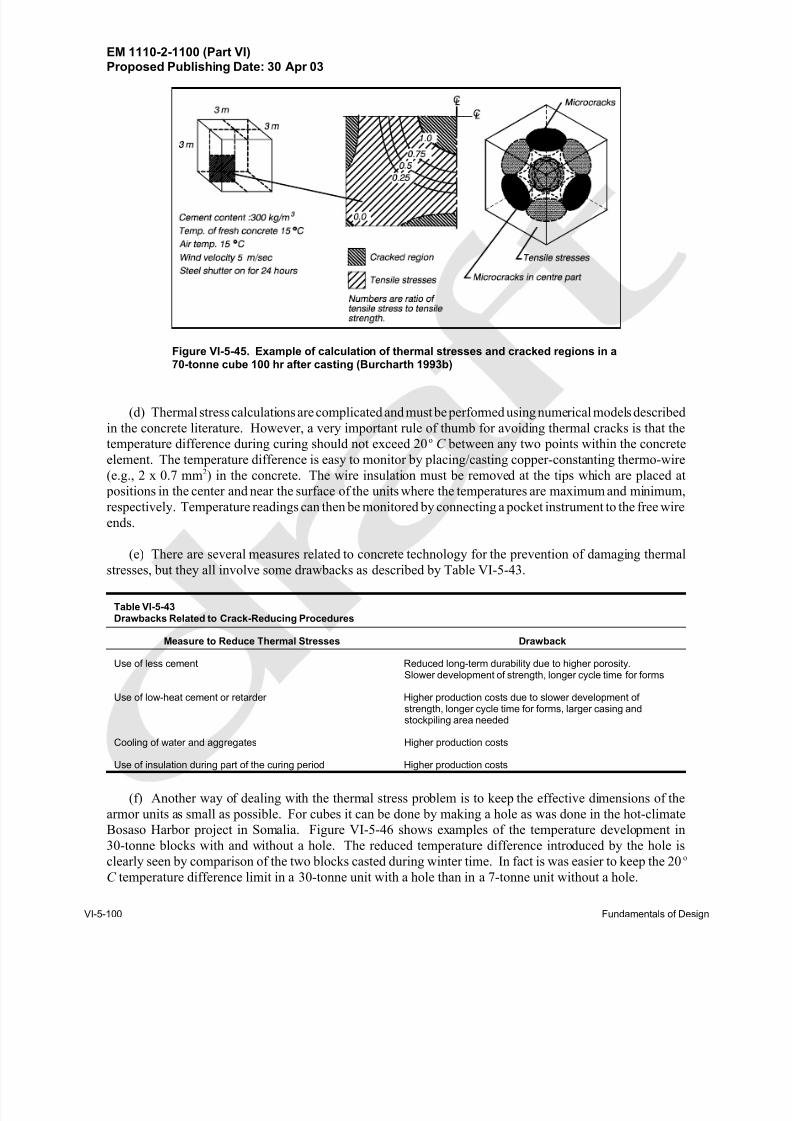
8/13/2019 CEM PartVI-Chap5p1, Fundamentals of Design
http://slidepdf.com/reader/full/cem-partvi-chap5p1-fundamentals-of-design 116/150
EM 1110-2-1100 (Part VI)Proposed Publishing Date: 30 Apr 03
VI-5-100 Fundamentals of Design
Figure VI-5-45. Example of calculation of thermal stresses and cracked regions in a70-tonne cube 100 hr after casting (Burcharth 1993b)
(d) Thermal stress calculations are complicated and must be performed using numerical models described
in the concrete literature. However, a very important rule of thumb for avoiding thermal cracks is that the
temperature difference during curing should not exceed 20o C between any two points within the concrete
element. The temperature difference is easy to monitor by placing/casting copper-constanting thermo-wire
(e.g., 2 x 0.7 mm2) in the concrete. The wire insulation must be removed at the tips which are placed at
positions in the center and near the surface of the units where the temperatures are maximum and minimum,
respectively. Temperature readings can then be monitored by connecting a pocket instrument to the free wire
ends.
(e) There are several measures related to concrete technology for the prevention of damaging thermal
stresses, but they all involve some drawbacks as described by Table VI-5-43.
Table VI-5-43Drawbacks Related to Crack-Reducing Procedures
Measure to Reduce Thermal Stresses Drawback
Use of less cement Reduced long-term durability due to higher porosity.Slower development of strength, longer cycle time for forms
Use of low-heat cement or retarder Higher production costs due to slower development of strength, longer cycle time for forms, larger casing andstockpiling area needed
Cooling of water and aggregates Higher production costs
Use of insulation during part of the curing period Higher production costs
(f) Another way of dealing with the thermal stress problem is to keep the effective dimensions of the
armor units as small as possible. For cubes it can be done by making a hole as was done in the hot-climate
Bosaso Harbor project in Somalia. Figure VI-5-46 shows examples of the temperature development in
30-tonne blocks with and without a hole. The reduced temperature difference introduced by the hole is
clearly seen by comparison of the two blocks casted during winter time. In fact is was easier to keep the 20o
C temperature difference limit in a 30-tonne unit with a hole than in a 7-tonne unit without a hole.
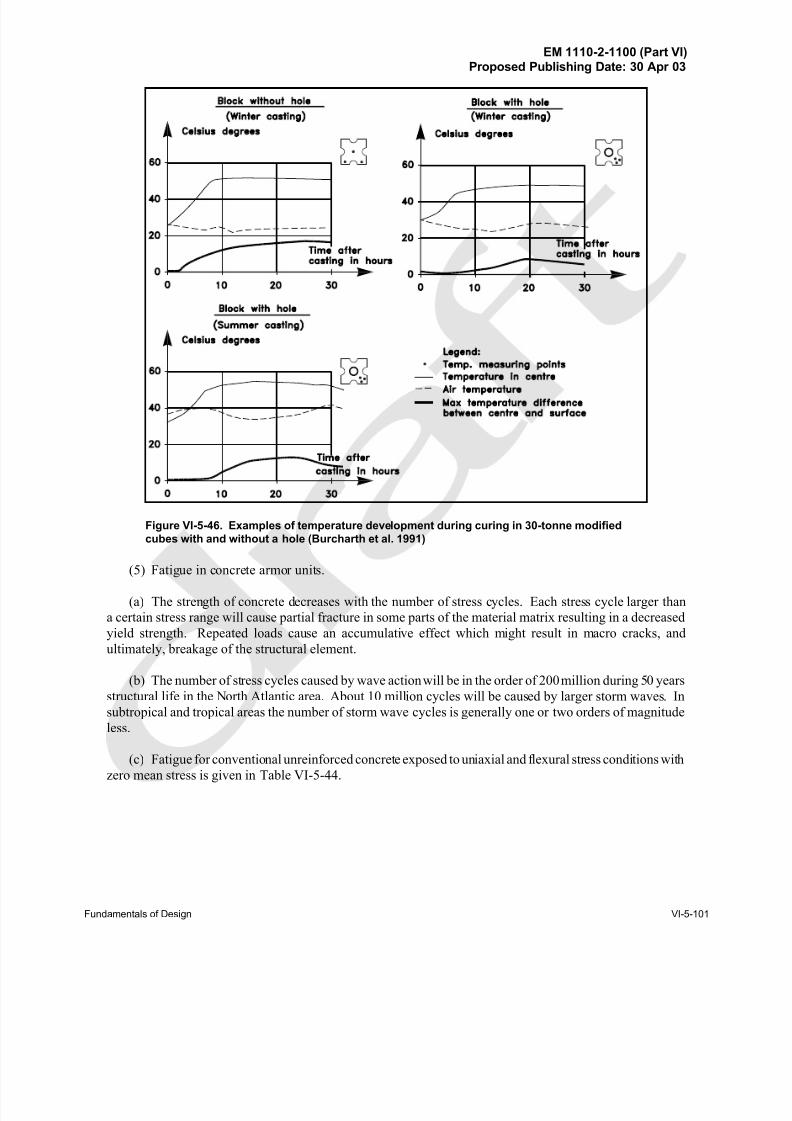
8/13/2019 CEM PartVI-Chap5p1, Fundamentals of Design
http://slidepdf.com/reader/full/cem-partvi-chap5p1-fundamentals-of-design 117/150
EM 1110-2-1100 (Part VI)Proposed Publishing Date: 30 Apr 03
Fundamentals of Design VI-5-101
Figure VI-5-46. Examples of temperature development during curing in 30-tonne modified
cubes with and without a hole (Burcharth et al. 1991)
(5) Fatigue in concrete armor units.
(a) The strength of concrete decreases with the number of stress cycles. Each stress cycle larger than
a certain stress range will cause partial fracture in some parts of the material matrix resulting in a decreased
yield strength. Repeated loads cause an accumulative effect which might result in macro cracks, and
ultimately, breakage of the structural element.
(b) The number of stress cycles caused by wave action will be in the order of 200 million during 50 years
structural life in the North Atlantic area. About 10 million cycles will be caused by larger storm waves. In
subtropical and tropical areas the number of storm wave cycles is generally one or two orders of magnitude
less.
(c) Fatigue for conventional unreinforced concrete exposed to uniaxial and flexural stress conditions withzero mean stress is given in Table VI-5-44.
8/13/2019 CEM PartVI-Chap5p1, Fundamentals of Design
http://slidepdf.com/reader/full/cem-partvi-chap5p1-fundamentals-of-design 118/150
EM 1110-2-1100 (Part VI)Proposed Publishing Date: 30 Apr 03
VI-5-102 Fundamentals of Design
Table VI-5-44
Fatigue for Conventional Unreinforced Concrete Exposed to Uniaxial and Flexural Stress Conditions With Zero MeanStress (Burcharth 1984)
d. Toe stability and protection.
(1) Introduction.
(a) The function of a toe berm is to support the main armor layer and to prevent damage resulting from
scour. Armor units displaced from the armor layer may come to rest on the toe berm, thus increasing toe
berm stability. Toe berms are normally constructed of quarry-run, but concrete blocks can be used if quarry-
run material is too small or unavailable.
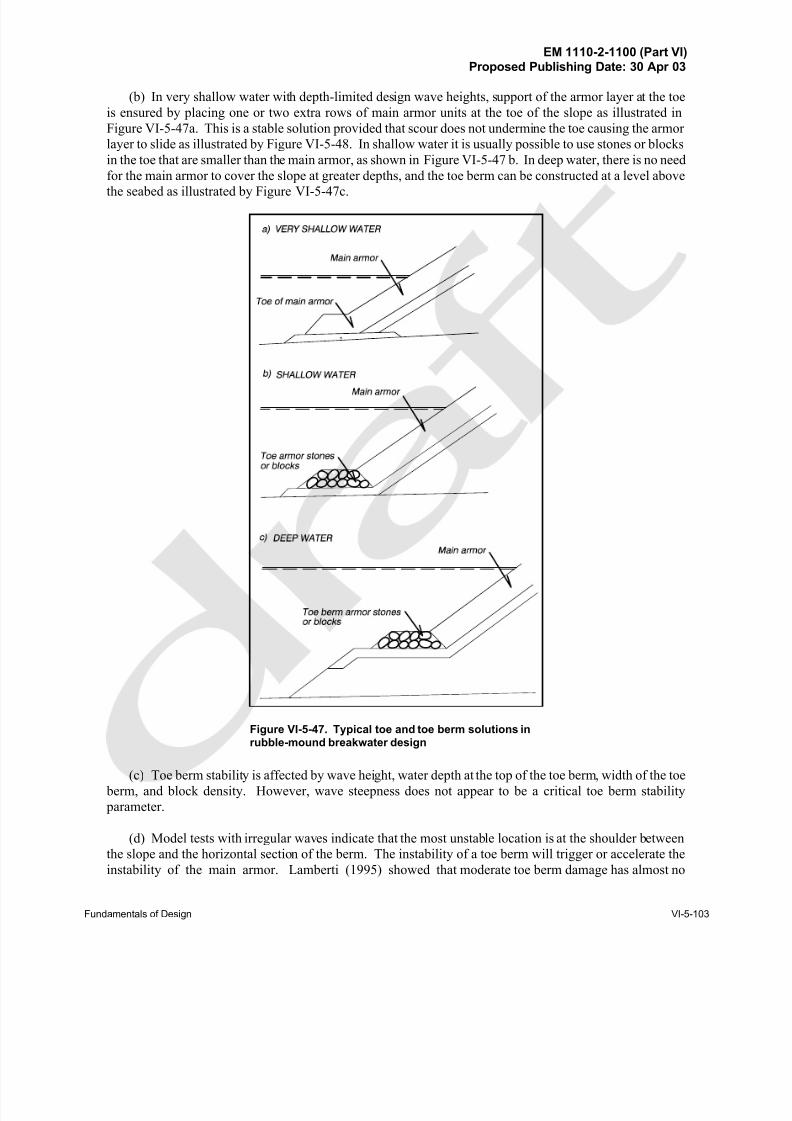
8/13/2019 CEM PartVI-Chap5p1, Fundamentals of Design
http://slidepdf.com/reader/full/cem-partvi-chap5p1-fundamentals-of-design 119/150
EM 1110-2-1100 (Part VI)Proposed Publishing Date: 30 Apr 03
Fundamentals of Design VI-5-103
Figure VI-5-47. Typical toe and toe berm solutions inrubble-mound breakwater design
(b) In very shallow water with depth-limited design wave heights, support of the armor layer at the toe
is ensured by placing one or two extra rows of main armor units at the toe of the slope as illustrated in
Figure VI-5-47a. This is a stable solution provided that scour does not undermine the toe causing the armor
layer to slide as illustrated by Figure VI-5-48. In shallow water it is usually possible to use stones or blocks
in the toe that are smaller than the main armor, as shown in Figure VI-5-47 b. In deep water, there is no need
for the main armor to cover the slope at greater depths, and the toe berm can be constructed at a level above
the seabed as illustrated by Figure VI-5-47c.
(c) Toe berm stability is affected by wave height, water depth at the top of the toe berm, width of the toe
berm, and block density. However, wave steepness does not appear to be a critical toe berm stability
parameter.
(d) Model tests with irregular waves indicate that the most unstable location is at the shoulder between
the slope and the horizontal section of the berm. The instability of a toe berm will trigger or accelerate the
instability of the main armor. Lamberti (1995) showed that moderate toe berm damage has almost no
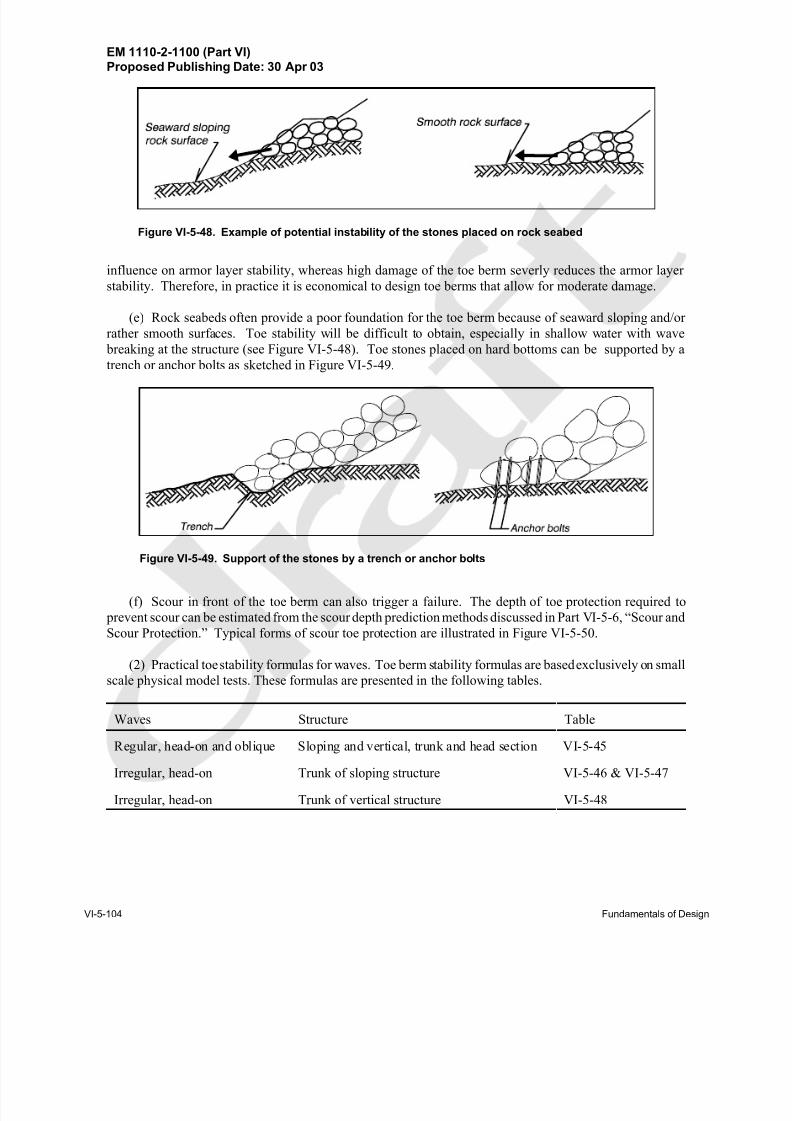
8/13/2019 CEM PartVI-Chap5p1, Fundamentals of Design
http://slidepdf.com/reader/full/cem-partvi-chap5p1-fundamentals-of-design 120/150
EM 1110-2-1100 (Part VI)Proposed Publishing Date: 30 Apr 03
VI-5-104 Fundamentals of Design
Figure VI-5-48. Example of potential instability of the stones placed on rock seabed
Figure VI-5-49. Support of the stones by a trench or anchor bolts
influence on armor layer stability, whereas high damage of the toe berm severly reduces the armor layer
stability. Therefore, in practice it is economical to design toe berms that allow for moderate damage.
(e) Rock seabeds often provide a poor foundation for the toe berm because of seaward sloping and/or
rather smooth surfaces. Toe stability will be difficult to obtain, especially in shallow water with wave
breaking at the structure (see Figure VI-5-48). Toe stones placed on hard bottoms can be supported by a
trench or anchor bolts as sketched in Figure VI-5-49.
(f) Scour in front of the toe berm can also trigger a failure. The depth of toe protection required to
prevent scour can be estimated from the scour depth prediction methods discussed in Part VI-5-6, “Scour and
Scour Protection.” Typical forms of scour toe protection are illustrated in Figure VI-5-50.
(2) Practical toe stability formulas for waves. Toe berm stability formulas are based exclusively on small
scale physical model tests. These formulas are presented in the following tables.
Waves Structure Table
Regular, head-on and oblique Sloping and vertical, trunk and head section VI-5-45
Irregular, head-on Trunk of sloping structure VI-5-46 & VI-5-47
Irregular, head-on Trunk of vertical structure VI-5-48
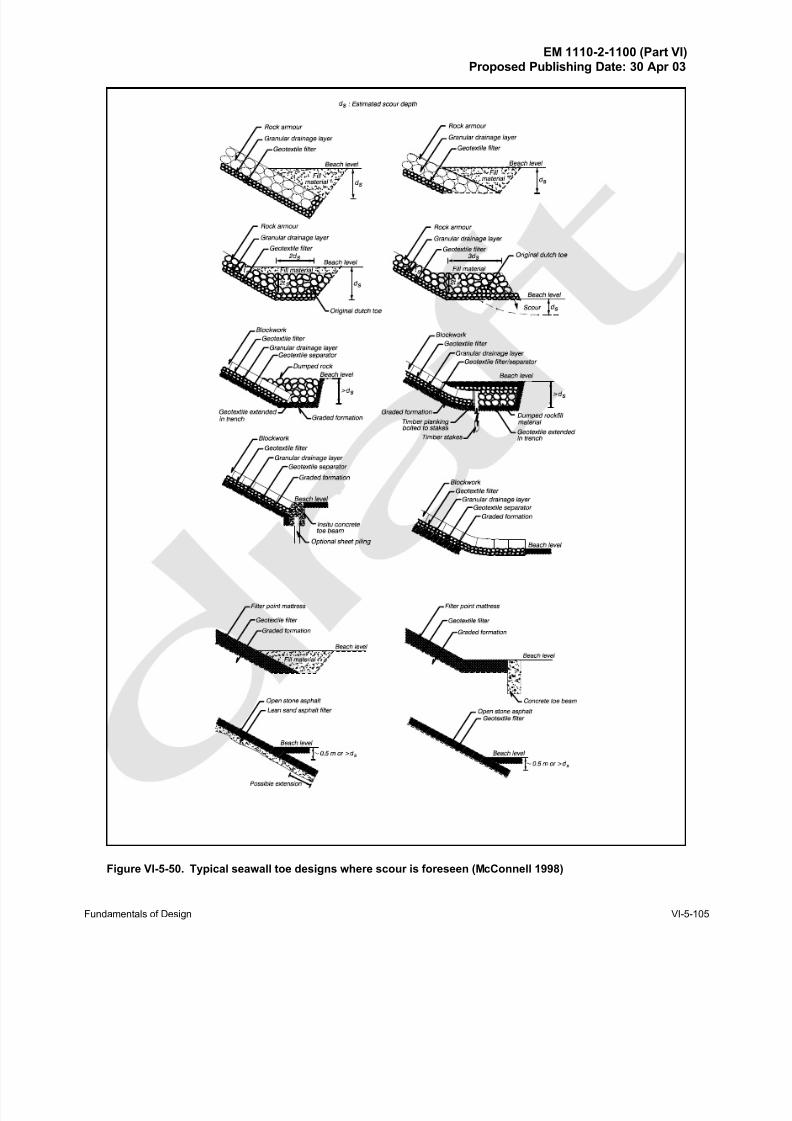
8/13/2019 CEM PartVI-Chap5p1, Fundamentals of Design
http://slidepdf.com/reader/full/cem-partvi-chap5p1-fundamentals-of-design 121/150
EM 1110-2-1100 (Part VI)Proposed Publishing Date: 30 Apr 03
Fundamentals of Design VI-5-105
Figure VI-5-50. Typical seawall toe designs where scour is foreseen (McConnell 1998)
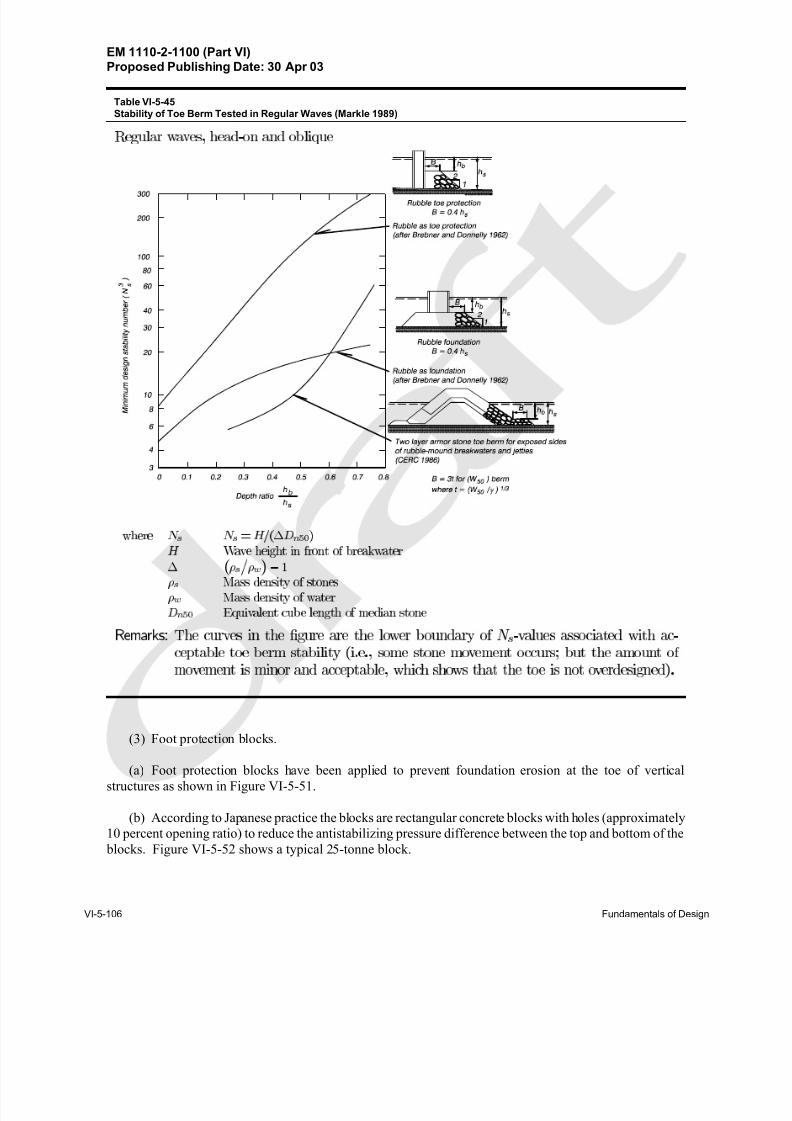
8/13/2019 CEM PartVI-Chap5p1, Fundamentals of Design
http://slidepdf.com/reader/full/cem-partvi-chap5p1-fundamentals-of-design 122/150
EM 1110-2-1100 (Part VI)Proposed Publishing Date: 30 Apr 03
VI-5-106 Fundamentals of Design
R e g u l a r w a v e s , h e a d - o n a n d o b l i q u e
w h e r e N
s
N
s
= H = ( D
n 5 0
)
H W a v e h e i g h t i n f r o n t o f b r e a k w a t e r
;
s
w
; 1
s
M a s s d e n s i t y o f s t o n e s
w
M a s s d e n s i t y o f w a t e r
D
n 5 0
E q u i v a l e n t c u b e l e n g t h o f m e d i a n s t o n e
R e m a r k s : T h e c u r v e s i n t h e g u r e a r e t h e l o w e r b o u n d a r y o f N
s
- v a l u e s a s s o c i a t e d w i t h a c -
c e p t a b l e t o e b e r m s t a b i l i t y ( i . e . , s o m e s t o n e m o v e m e n t o c c u r s b u t t h e a m o u n t o f
m o v e m e n t i s m i n o r a n d a c c e p t a b l e , w h i c h s h o w s t h a t t h e t o e i s n o t o v e r d e s i g n e d ) .
Table VI-5-45
Stability of Toe Berm Tested in Regular Waves (Markle 1989)
(3) Foot protection blocks.
(a) Foot protection blocks have been applied to prevent foundation erosion at the toe of vertical
structures as shown in Figure VI-5-51.
(b) According to Japanese practice the blocks are rectangular concrete blocks with holes (approximately
10 percent opening ratio) to reduce the antistabilizing pressure difference between the top and bottom of the
blocks. Figure VI-5-52 shows a typical 25-tonne block.
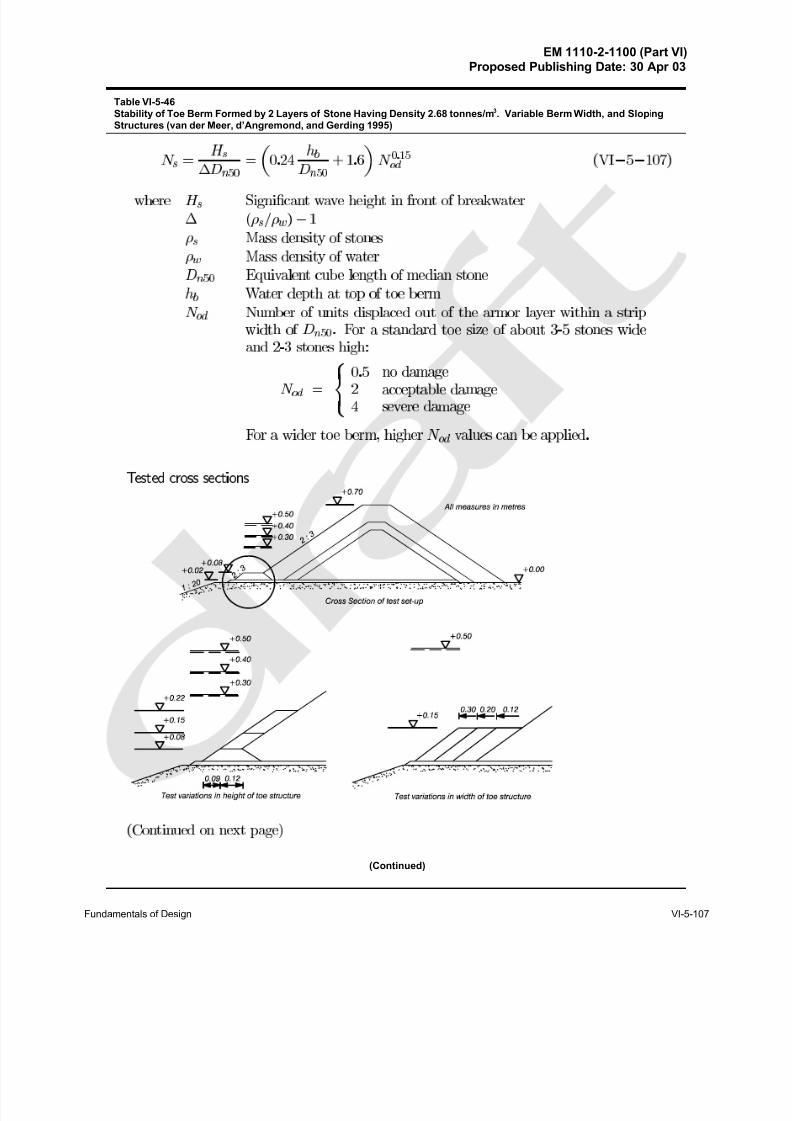
8/13/2019 CEM PartVI-Chap5p1, Fundamentals of Design
http://slidepdf.com/reader/full/cem-partvi-chap5p1-fundamentals-of-design 123/150
EM 1110-2-1100 (Part VI)Proposed Publishing Date: 30 Apr 03
Fundamentals of Design VI-5-107
N
s
=
H
s
D
n 5 0
=
0 : 2 4
h
b
D
n 5 0
+ 1 : 6
N
0 1 5
o d
( V I ; 5 ; 1 0 7 )
w h e r e H
s
S i g n i c a n t w a v e h e i g h t i n f r o n t o f b r e a k w a t e r
(
s
/
w
) ; 1
s
M a s s d e n s i t y o f s t o n e s
w
M a s s d e n s i t y o f w a t e r
D
n 5 0
E q u i v a l e n t c u b e l e n g t h o f m e d i a n s t o n e
h
b
W a t e r d e p t h a t t o p o f t o e b e r m
N
o d
N u m b e r o f u n i t s d i s p l a c e d o u t o f t h e a r m o r l a y e r w i t h i n a s t r i p
w i d t h o f D
n 5 0
. F o r a s t a n d a r d t o e s i z e o f a b o u t 3 - 5 s t o n e s w i d e
a n d 2 - 3 s t o n e s h i g h :
N
o d
=
8
>
<
>
:
0 : 5 n o d a m a g e
2 a c c e p t a b l e d a m a g e
4 s e v e r e d a m a g e
F o r a w i d e r t o e b e r m , h i g h e r N
o d
v a l u e s c a n b e a p p l i e d .
T e s t e d c r o s s s e c t i o n s
( C o n t i n u e d o n n e x t p a g e )
Table VI-5-46
Stability of Toe Berm Formed by 2 Layers of Stone Having Density 2.68 tonnes/m3. Variable Berm Width, and SlopingStructures (van der Meer, d’Angremond, and Gerding 1995)
(Continued)
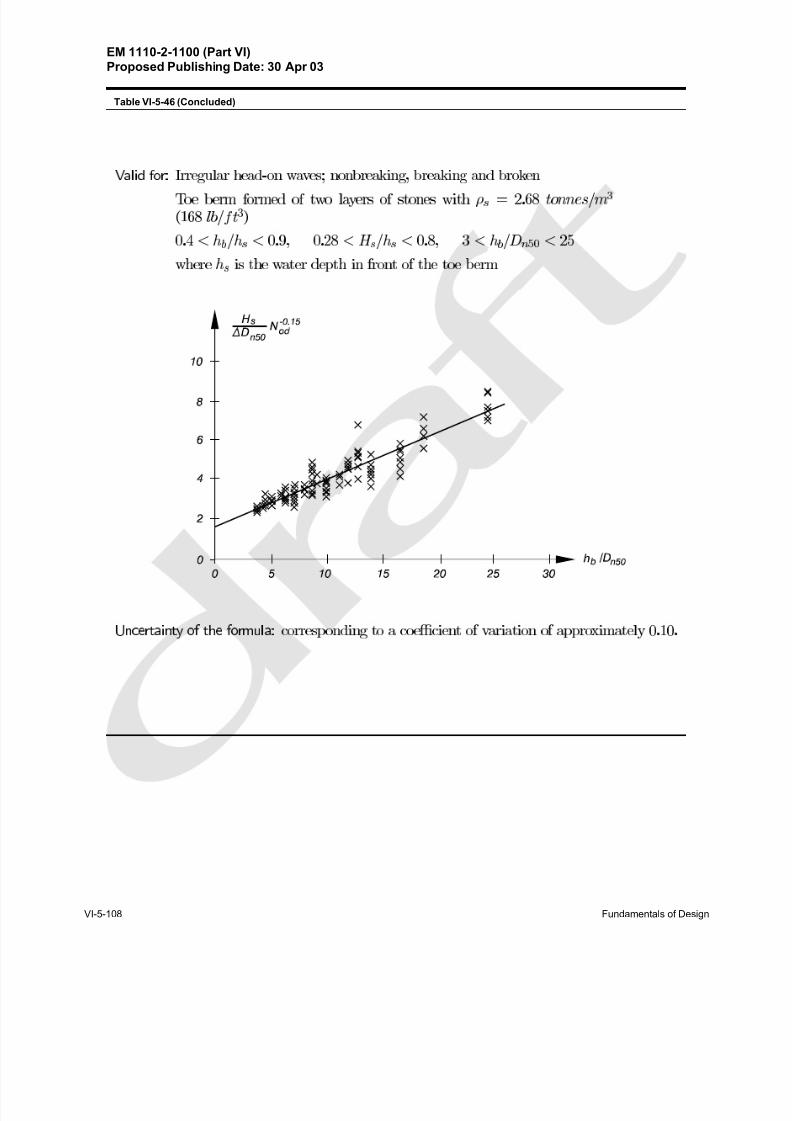
8/13/2019 CEM PartVI-Chap5p1, Fundamentals of Design
http://slidepdf.com/reader/full/cem-partvi-chap5p1-fundamentals-of-design 124/150
EM 1110-2-1100 (Part VI)Proposed Publishing Date: 30 Apr 03
VI-5-108 Fundamentals of Design
V a l i d f o r : I r r e g u l a r h e a d - o n w a v e s n o n b r e a k i n g , b r e a k i n g a n d b r o k e n
T o e b e r m f o r m e d o f t w o l a y e r s o f s t o n e s w i t h
s
= 2 : 6 8 t o n n e s = m
3
( 1 6 8 l b = f t
3
)
0 . 4 < h
b
= h
s
< 0 . 9 , 0 . 2 8 < H
s
= h
s
< 0 . 8 , 3 < h
b
= D
n 5 0
< 2 5
w h e r e h
s
i s t h e w a t e r d e p t h i n f r o n t o f t h e t o e b e r m
U n c e r t a i n t y o f t h e f o r m u l a : c o r r e s p o n d i n g t o a c o e c i e n t o f v a r i a t i o n o f a p p r o x i m a t e l y 0 . 1 0 .
Table VI-5-46 (Concluded)
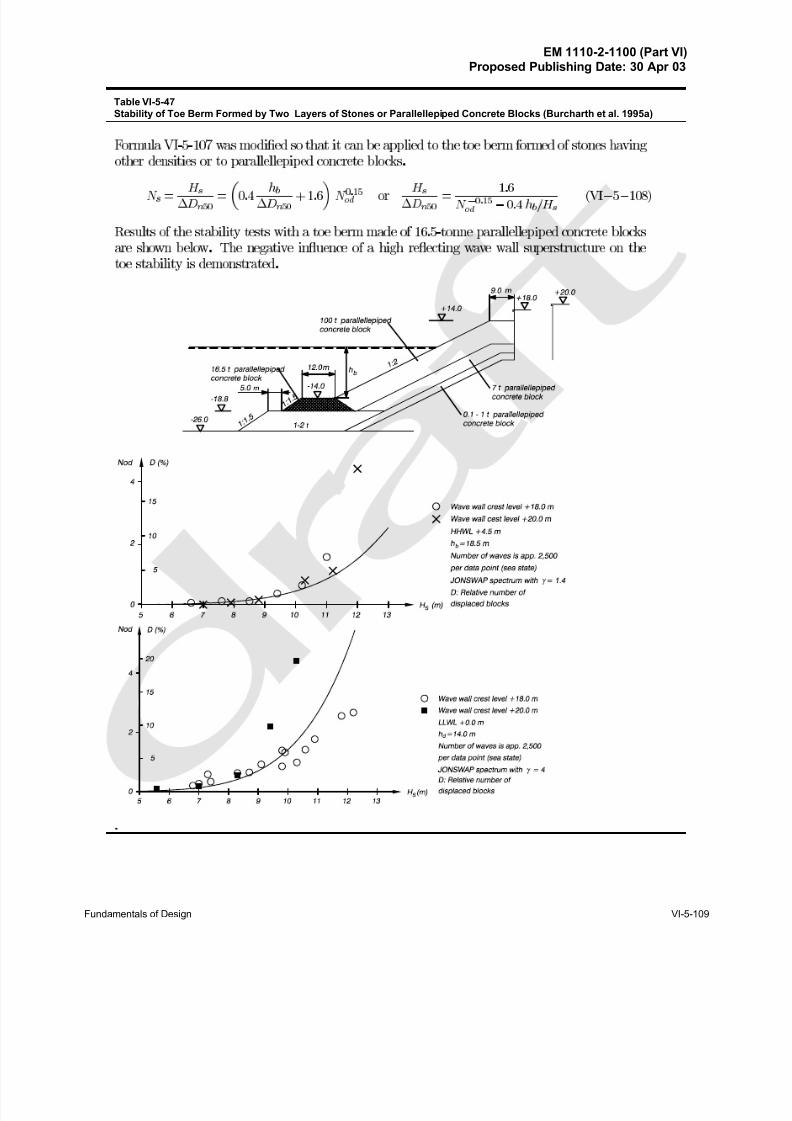
8/13/2019 CEM PartVI-Chap5p1, Fundamentals of Design
http://slidepdf.com/reader/full/cem-partvi-chap5p1-fundamentals-of-design 125/150
EM 1110-2-1100 (Part VI)Proposed Publishing Date: 30 Apr 03
Fundamentals of Design VI-5-109
F o r m u l a V I - 5 - 1 0 7 w a s m o d i e d s o t h a t i t c a n b e a p p l i e d t o t h e t o e b e r m f o r m e d o f s t o n e s h a v i n g
o t h e r d e n s i t i e s o r t o p a r a l l e l l e p i p e d c o n c r e t e b l o c k s .
N
s
=
H
s
D
n 5 0
=
0 : 4
h
b
D
n 5 0
+ 1 : 6
N
0 1 5
o d
o r
H
s
D
n 5 0
=
1 : 6
N
; 0 1 5
o d
; 0 : 4 h
b
= H
s
( V I ; 5 ; 1 0 8 )
R e s u l t s o f t h e s t a b i l i t y t e s t s w i t h a t o e b e r m m a d e o f 1 6 . 5 - t o n n e p a r a l l e l l e p i p e d c o n c r e t e b l o c k s
a r e s h o w n b e l o w . T h e n e g a t i v e i n u e n c e o f a h i g h r e e c t i n g w a v e w a l l s u p e r s t r u c t u r e o n t h e
t o e s t a b i l i t y i s d e m o n s t r a t e d .
.
Table VI-5-47
Stability of Toe Berm Formed by Two Layers of Stones or Parallellepiped Concrete Blocks (Burcharth et al. 1995a)
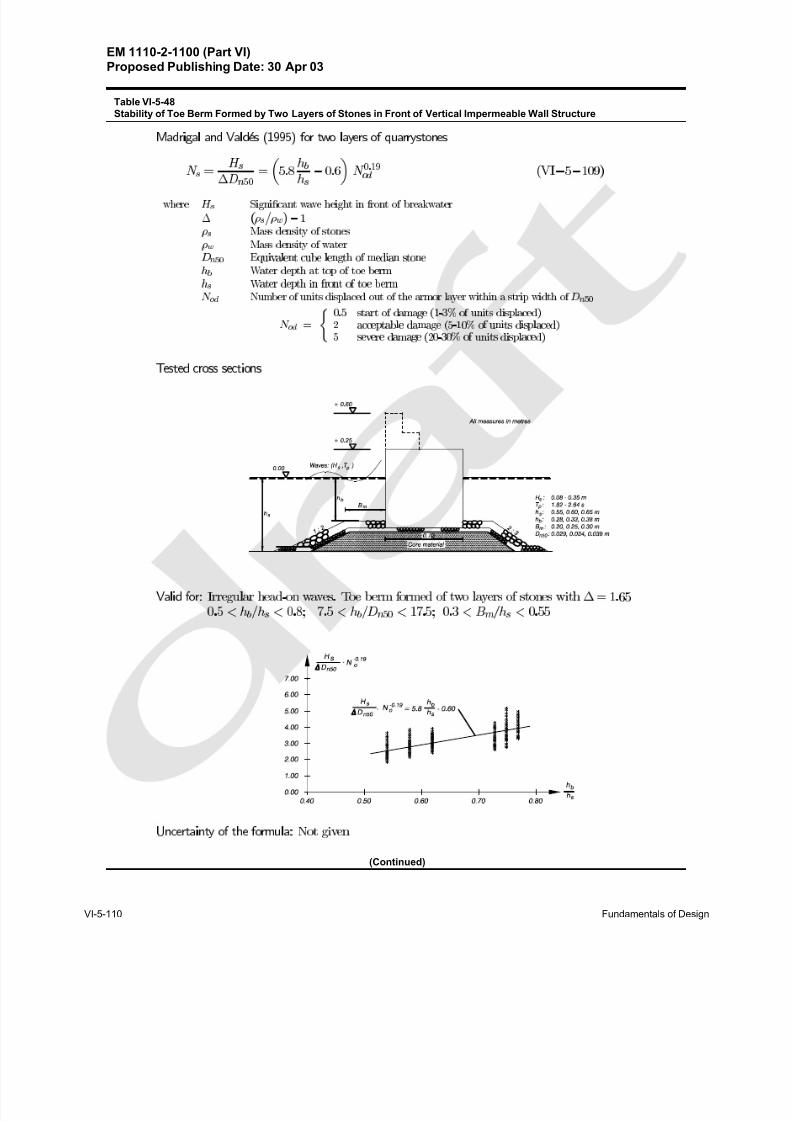
8/13/2019 CEM PartVI-Chap5p1, Fundamentals of Design
http://slidepdf.com/reader/full/cem-partvi-chap5p1-fundamentals-of-design 126/150
EM 1110-2-1100 (Part VI)Proposed Publishing Date: 30 Apr 03
VI-5-110 Fundamentals of Design
Æ
Table VI-5-48
Stability of Toe Berm Formed by Two Layers of Stones in Front of Vertical Impermeable Wall Structure
(Continued)
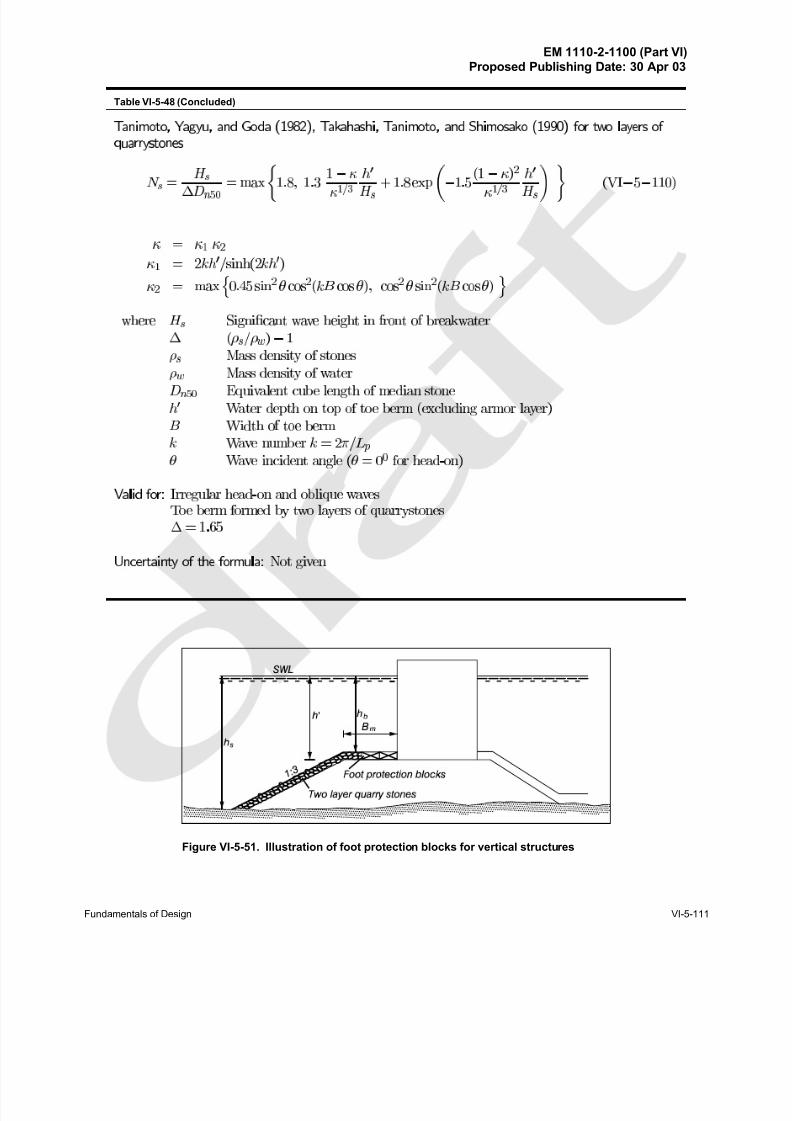
8/13/2019 CEM PartVI-Chap5p1, Fundamentals of Design
http://slidepdf.com/reader/full/cem-partvi-chap5p1-fundamentals-of-design 127/150
EM 1110-2-1100 (Part VI)Proposed Publishing Date: 30 Apr 03
Fundamentals of Design VI-5-111
Figure VI-5-51. Illustration of foot protection blocks for vertical structures
Table VI-5-48 (Concluded)
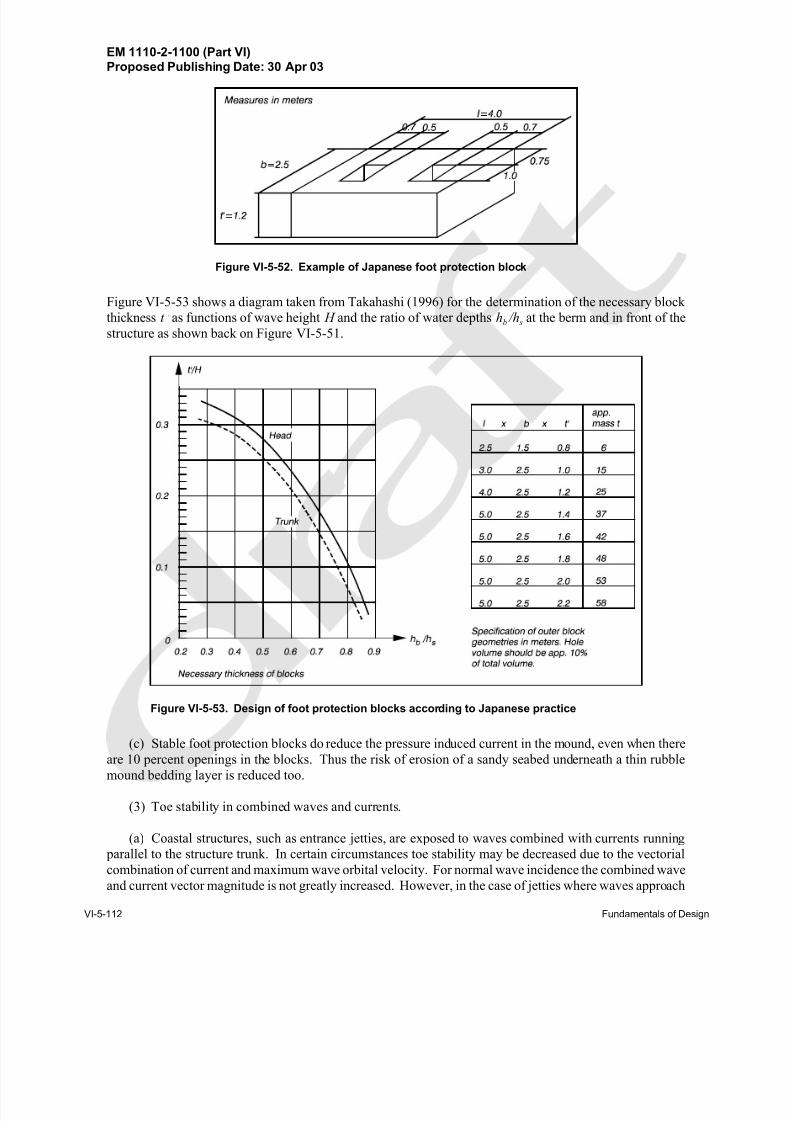
8/13/2019 CEM PartVI-Chap5p1, Fundamentals of Design
http://slidepdf.com/reader/full/cem-partvi-chap5p1-fundamentals-of-design 128/150
EM 1110-2-1100 (Part VI)Proposed Publishing Date: 30 Apr 03
VI-5-112 Fundamentals of Design
Figure VI-5-52. Example of Japanese foot protection block
Figure VI-5-53. Design of foot protection blocks according to Japanese practice
Figure VI-5-53 shows a diagram taken from Takahashi (1996) for the determination of the necessary block
thickness t * as functions of wave height H and the ratio of water depths hb /h s at the berm and in front of the
structure as shown back on Figure VI-5-51.
(c) Stable foot protection blocks do reduce the pressure induced current in the mound, even when there
are 10 percent openings in the blocks. Thus the risk of erosion of a sandy seabed underneath a thin rubblemound bedding layer is reduced too.
(3) Toe stability in combined waves and currents.
(a) Coastal structures, such as entrance jetties, are exposed to waves combined with currents running
parallel to the structure trunk. In certain circumstances toe stability may be decreased due to the vectorial
combination of current and maximum wave orbital velocity. For normal wave incidence the combined wave
and current vector magnitude is not greatly increased. However, in the case of jetties where waves approach
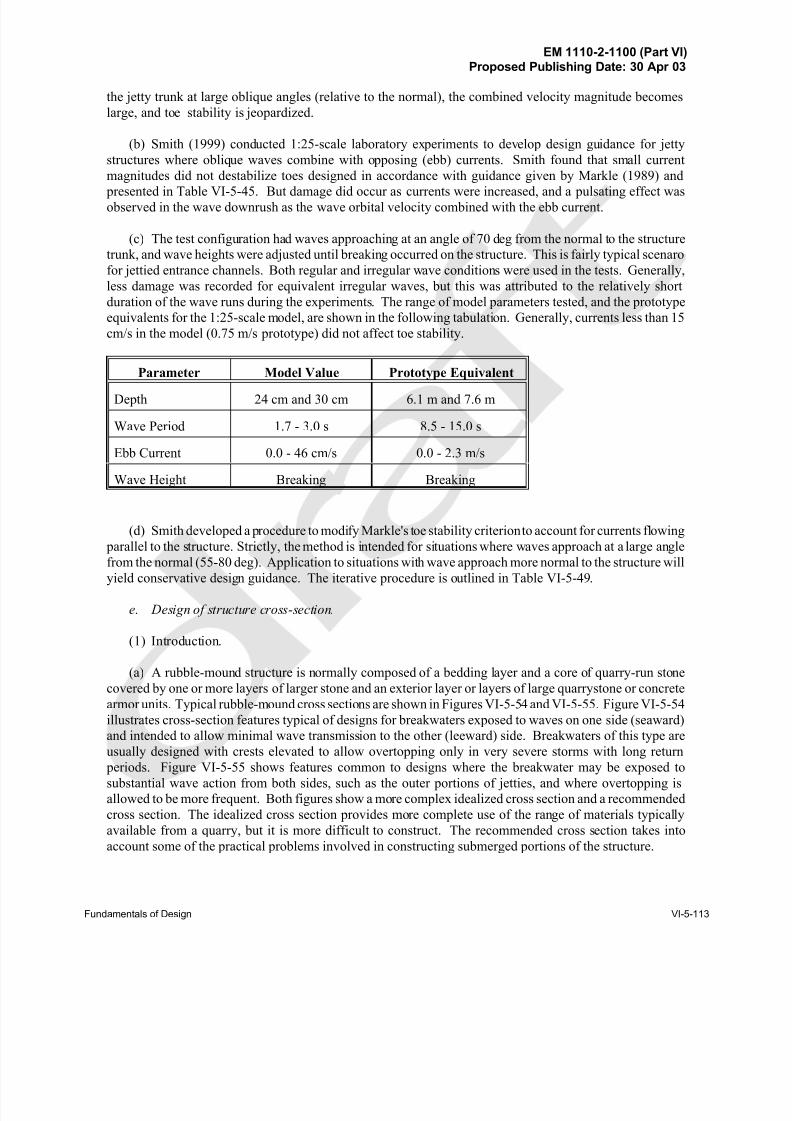
8/13/2019 CEM PartVI-Chap5p1, Fundamentals of Design
http://slidepdf.com/reader/full/cem-partvi-chap5p1-fundamentals-of-design 129/150
EM 1110-2-1100 (Part VI)Proposed Publishing Date: 30 Apr 03
Fundamentals of Design VI-5-113
the jetty trunk at large oblique angles (relative to the normal), the combined velocity magnitude becomes
large, and toe stability is jeopardized.
(b) Smith (1999) conducted 1:25-scale laboratory experiments to develop design guidance for jetty
structures where oblique waves combine with opposing (ebb) currents. Smith found that small current
magnitudes did not destabilize toes designed in accordance with guidance given by Markle (1989) and
presented in Table VI-5-45. But damage did occur as currents were increased, and a pulsating effect wasobserved in the wave downrush as the wave orbital velocity combined with the ebb current.
(c) The test configuration had waves approaching at an angle of 70 deg from the normal to the structure
trunk, and wave heights were adjusted until breaking occurred on the structure. This is fairly typical scenaro
for jettied entrance channels. Both regular and irregular wave conditions were used in the tests. Generally,
less damage was recorded for equivalent irregular waves, but this was attributed to the relatively short
duration of the wave runs during the experiments. The range of model parameters tested, and the prototype
equivalents for the 1:25-scale model, are shown in the following tabulation. Generally, currents less than 15
cm/s in the model (0.75 m/s prototype) did not affect toe stability.
Parameter Model Value Prototype Equivalent
Depth 24 cm and 30 cm 6.1 m and 7.6 m
Wave Period 1.7 - 3.0 s 8.5 - 15.0 s
Ebb Current 0.0 - 46 cm/s 0.0 - 2.3 m/s
Wave Height Breaking Breaking
(d) Smith developed a procedure to modify Markle's toe stability criterion to account for currents flowing
parallel to the structure. Strictly, the method is intended for situations where waves approach at a large angle
from the normal (55-80 deg). Application to situations with wave approach more normal to the structure willyield conservative design guidance. The iterative procedure is outlined in Table VI-5-49.
e. Design of structure cross-section.
(1) Introduction.
(a) A rubble-mound structure is normally composed of a bedding layer and a core of quarry-run stone
covered by one or more layers of larger stone and an exterior layer or layers of large quarrystone or concrete
armor units. Typical rubble-mound cross sections are shown in Figures VI-5-54 and VI-5-55. Figure VI-5-54
illustrates cross-section features typical of designs for breakwaters exposed to waves on one side (seaward)
and intended to allow minimal wave transmission to the other (leeward) side. Breakwaters of this type are
usually designed with crests elevated to allow overtopping only in very severe storms with long return periods. Figure VI-5-55 shows features common to designs where the breakwater may be exposed to
substantial wave action from both sides, such as the outer portions of jetties, and where overtopping is
allowed to be more frequent. Both figures show a more complex idealized cross section and a recommended
cross section. The idealized cross section provides more complete use of the range of materials typically
available from a quarry, but it is more difficult to construct. The recommended cross section takes into
account some of the practical problems involved in constructing submerged portions of the structure.
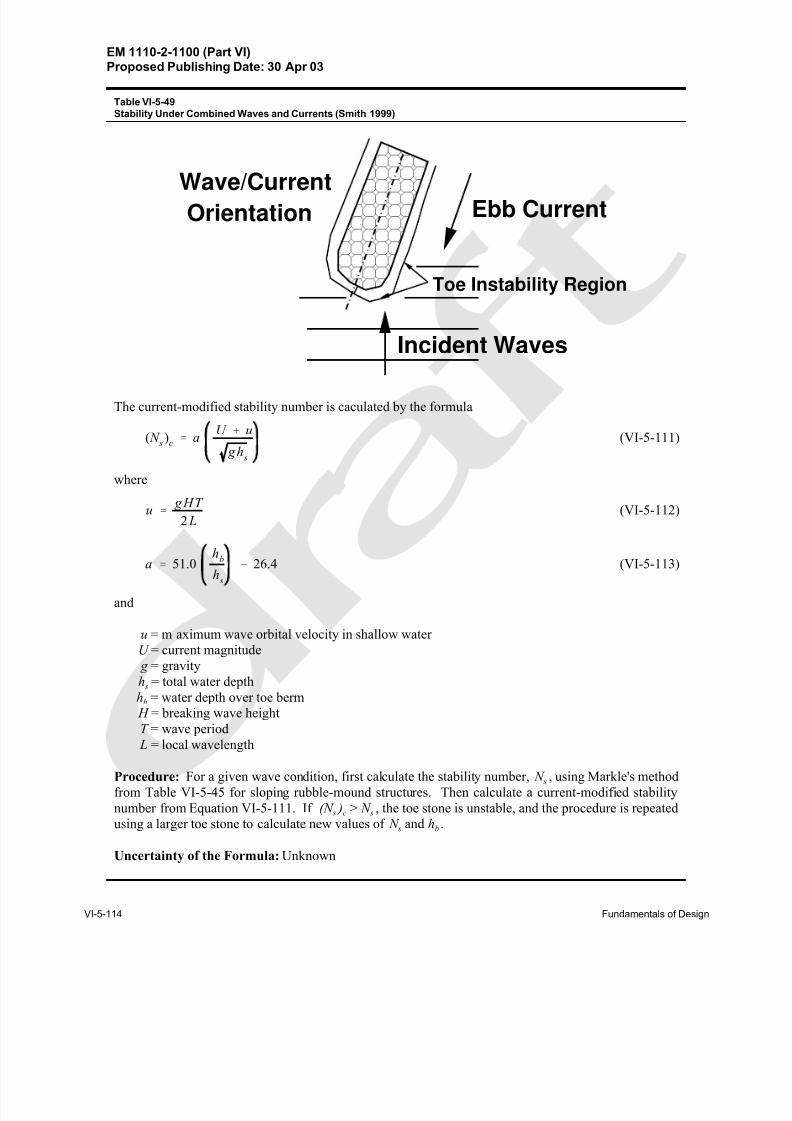
8/13/2019 CEM PartVI-Chap5p1, Fundamentals of Design
http://slidepdf.com/reader/full/cem-partvi-chap5p1-fundamentals-of-design 130/150
EM 1110-2-1100 (Part VI)Proposed Publishing Date: 30 Apr 03
VI-5-114 Fundamentals of Design
0 0 0 0 0 0 0 0 00 0 0 0 0 0 0 0 00 0 0 0 0 0 0 0 00 0 0 0 0 0 0 0 00 0 0 0 0 0 0 0 00 0 0 0 0 0 0 0 00 0 0 0 0 0 0 0 00 0 0 0 0 0 0 0 00 0 0 0 0 0 0 0 00 0 0 0 0 0 0 0 00 0 0 0 0 0 0 0 00 0 0 0 0 0 0 0 01 1 1 1 1 1 1 1 11 1 1 1 1 1 1 1 11 1 1 1 1 1 1 1 11 1 1 1 1 1 1 1 11 1 1 1 1 1 1 1 11 1 1 1 1 1 1 1 11 1 1 1 1 1 1 1 11 1 1 1 1 1 1 1 11 1 1 1 1 1 1 1 11 1 1 1 1 1 1 1 11 1 1 1 1 1 1 1 11 1 1 1 1 1 1 1 1Orientation
Wave/Current Ebb Current
Incident Waves
Toe Instability Region
Table VI-5-49
Stability Under Combined Waves and Currents (Smith 1999)
The current-modified stability number is caculated by the formula
(VI-5-111)( N s
)c ' a
U % u
gh s
where
(VI-5-112)u ' gHT
2 L
(VI-5-113)a '
51.0
hb
h s
&
26.4
and
u = m aximum wave orbital velocity in shallow water
U = current magnitude
g = gravity
h s = total water depth
hb = water depth over toe berm
H = breaking wave height
T = wave period
L = local wavelength
Procedure: For a given wave condition, first calculate the stability number, N s , using Markle's method
from Table VI-5-45 for sloping rubble-mound structures. Then calculate a current-modified stability
number from Equation VI-5-111. If (N s )c > N s , the toe stone is unstable, and the procedure is repeated
using a larger toe stone to calculate new values of N s and hb .
Uncertainty of the Formula: Unknown
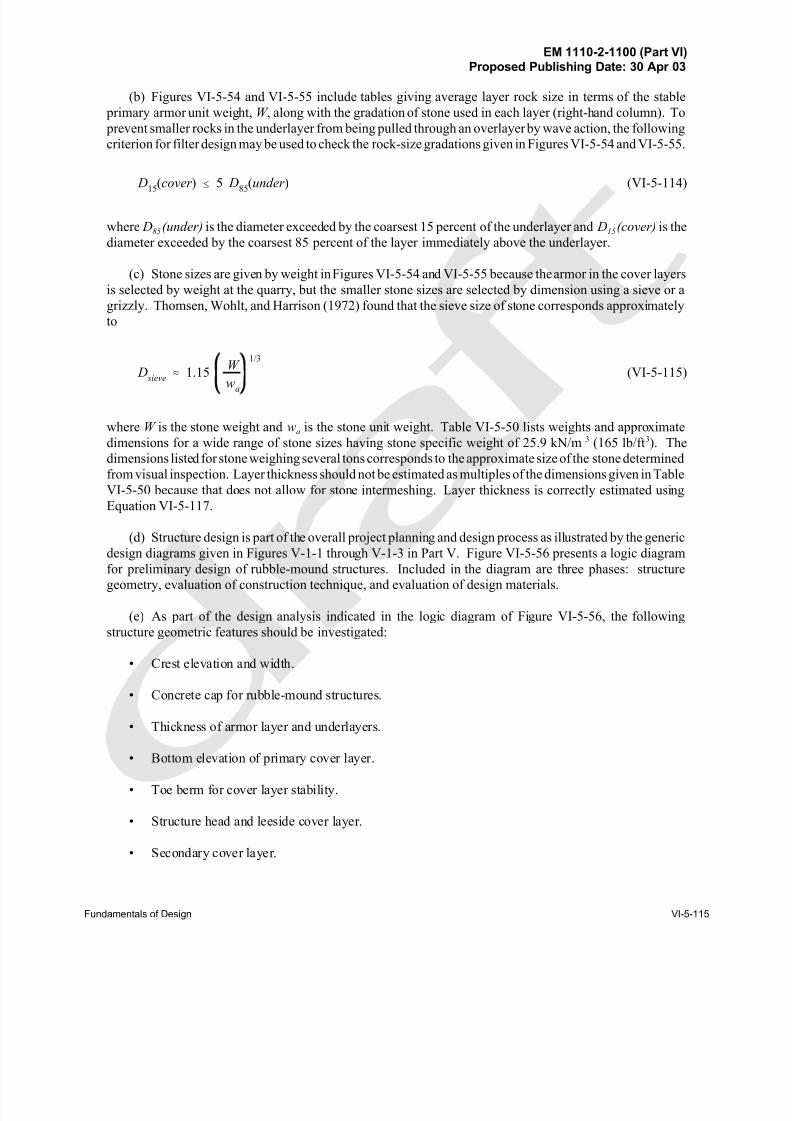
8/13/2019 CEM PartVI-Chap5p1, Fundamentals of Design
http://slidepdf.com/reader/full/cem-partvi-chap5p1-fundamentals-of-design 131/150
EM 1110-2-1100 (Part VI)Proposed Publishing Date: 30 Apr 03
Fundamentals of Design VI-5-115
(b) Figures VI-5-54 and VI-5-55 include tables giving average layer rock size in terms of the stable
primary armor unit weight, W , along with the gradation of stone used in each layer (right-hand column). To
prevent smaller rocks in the underlayer from being pulled through an overlayer by wave action, the following
criterion for filter design may be used to check the rock-size gradations given in Figures VI-5-54 and VI-5-55.
(VI-5-114) D15(cover ) #
5 D85(under )
where D85(under) is the diameter exceeded by the coarsest 15 percent of the underlayer and D15(cover) is the
diameter exceeded by the coarsest 85 percent of the layer immediately above the underlayer.
(c) Stone sizes are given by weight in Figures VI-5-54 and VI-5-55 because the armor in the cover layers
is selected by weight at the quarry, but the smaller stone sizes are selected by dimension using a sieve or a
grizzly. Thomsen, Wohlt, and Harrison (1972) found that the sieve size of stone corresponds approximately
to
(VI-5-115) D sieve .
1.15
W
wa
1/3
where W is the stone weight and wa is the stone unit weight. Table VI-5-50 lists weights and approximate
dimensions for a wide range of stone sizes having stone specific weight of 25.9 kN/m 3 (165 lb/ft3). The
dimensions listed for stone weighing several tons corresponds to the approximate size of the stone determined
from visual inspection. Layer thickness should not be estimated as multiples of the dimensions given in Table
VI-5-50 because that does not allow for stone intermeshing. Layer thickness is correctly estimated using
Equation VI-5-117.
(d) Structure design is part of the overall project planning and design process as illustrated by the generic
design diagrams given in Figures V-1-1 through V-1-3 in Part V. Figure VI-5-56 presents a logic diagram
for preliminary design of rubble-mound structures. Included in the diagram are three phases: structuregeometry, evaluation of construction technique, and evaluation of design materials.
(e) As part of the design analysis indicated in the logic diagram of Figure VI-5-56, the following
structure geometric features should be investigated:
• Crest elevation and width.
• Concrete cap for rubble-mound structures.
• Thickness of armor layer and underlayers.
• Bottom elevation of primary cover layer.
• Toe berm for cover layer stability.
• Structure head and leeside cover layer.
• Secondary cover layer.
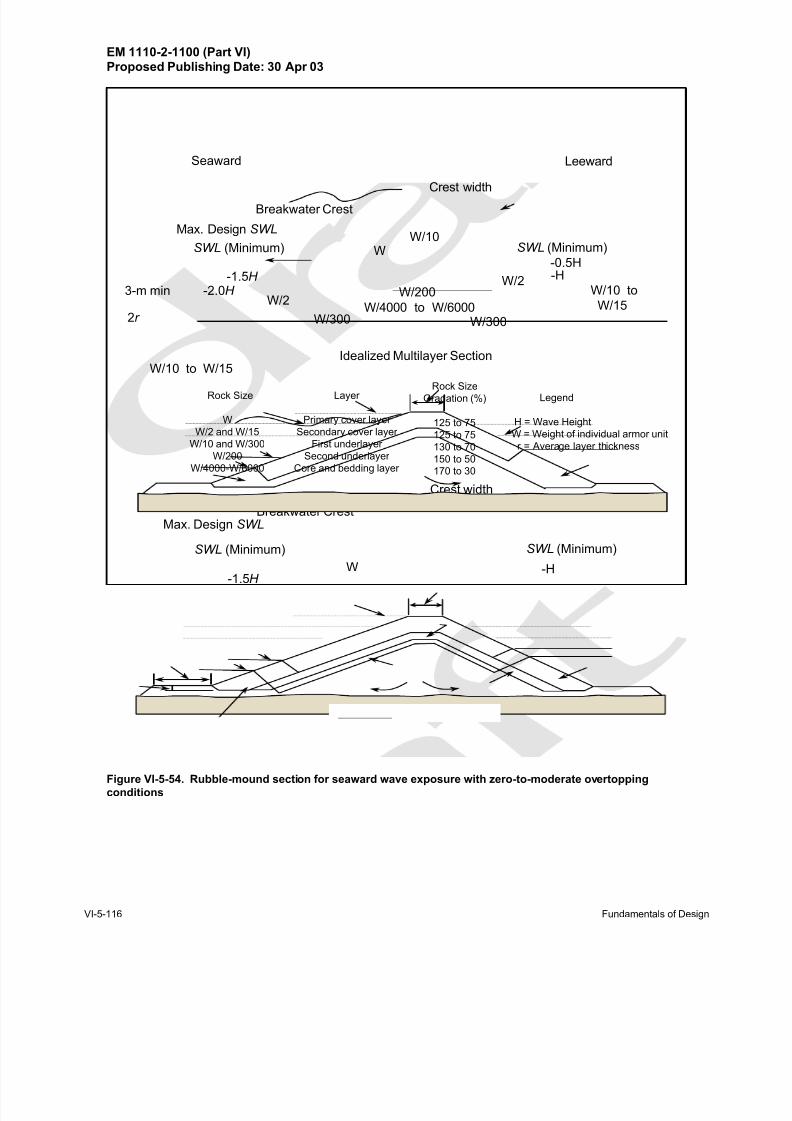
8/13/2019 CEM PartVI-Chap5p1, Fundamentals of Design
http://slidepdf.com/reader/full/cem-partvi-chap5p1-fundamentals-of-design 132/150
EM 1110-2-1100 (Part VI)Proposed Publishing Date: 30 Apr 03
VI-5-116 Fundamentals of Design
3-m min
2r
-2.0H -1.5H
Max. Design SWL
SWL (Minimum)
Breakwater Crest
Seaward Leeward
Crest width
W/10 to W/15Idealized Multilayer Section
WW/10
W/2W/200
W/4000 to W/6000W/300W/300
W/10 to
W/15
SWL (Minimum)
-0.5H-H
W/2
-2.0H -1.5H
Max. Design SWL
SWL (Minimum)
Breakwater Crest
Crest width
W/10 to
W/15W/10 to W/15
-H
SWL (Minimum)
W/200 to W/6000
W
Recommended Three-layer Section
Legend
H = Wave Height
W = Weight of individual armor unit
r = Average layer thickness
Rock Size
Gradation (%)
125 to 75
125 to 75
130 to 70
150 to 50170 to 30
Rock Size
W
W/2 and W/15
W/10 and W/300
W/200
W/4000-W/6000
Layer
Primary cover layer
Secondary cover layer
First underlayer
Second underlayer
Core and bedding layer
Figure VI-5-54. Rubble-mound section for seaward wave exposure with zero-to-moderate overtopping
conditions
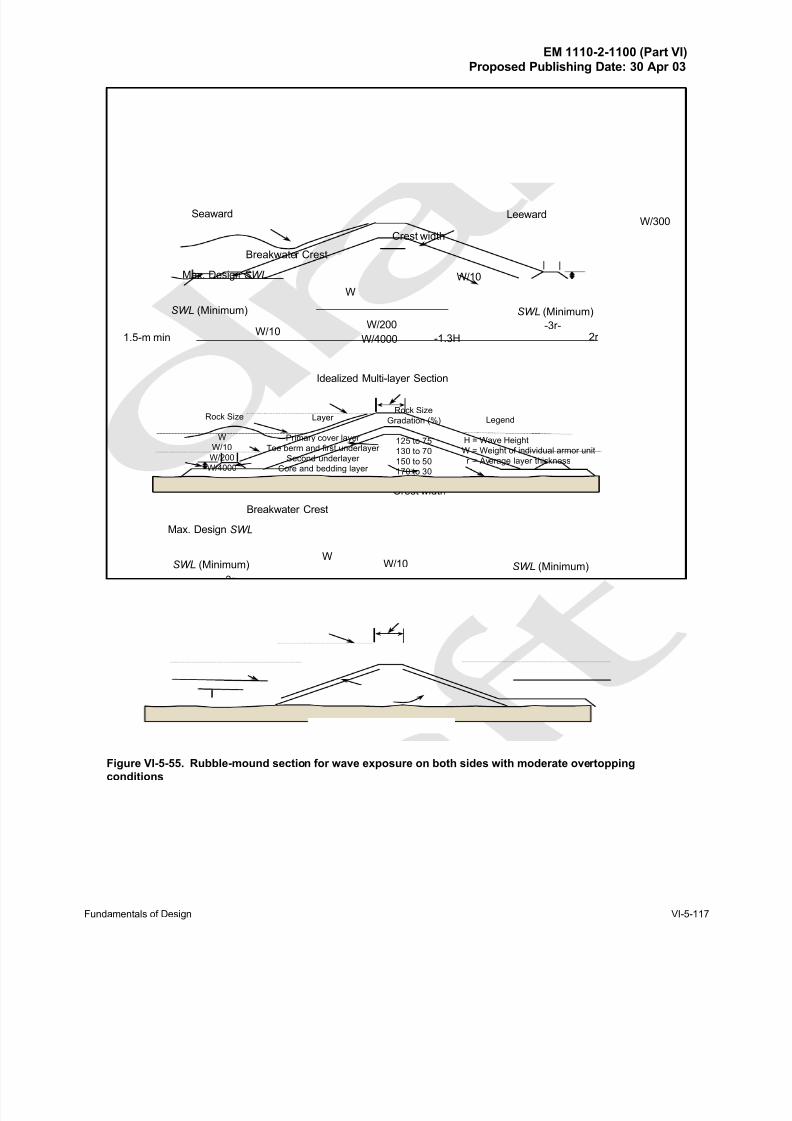
8/13/2019 CEM PartVI-Chap5p1, Fundamentals of Design
http://slidepdf.com/reader/full/cem-partvi-chap5p1-fundamentals-of-design 133/150
EM 1110-2-1100 (Part VI)Proposed Publishing Date: 30 Apr 03
Fundamentals of Design VI-5-117
1.5-m min
Max. Design SWL
SWL (Minimum)
Breakwater Crest
Seaward Leeward
Crest width
Idealized Multi-layer Section
W
W/10
W/200
W/4000
W/300
-3r-
SWL (Minimum)
W/10
2r
W/10
Max. Design SWL
SWL(Minimum)
Breakwater Crest
Crest width
SWL (Minimum)W/200 to W4000
W
Recommended Three-layer Section
Legend
H = Wave Height
W = Weight of individual armor unit
r = Average layer thickness
Rock Size
Gradation (%)
125 to 75
130 to 70
150 to 50
170 to 30
Rock Size
W
W/10
W/200
W/4000
Layer
Primary cover layer
Toe berm and first underlayer
Second underlayer
Core and bedding layer
W/10-3r--1.3H
2r -1.3H
Figure VI-5-55. Rubble-mound section for wave exposure on both sides with moderate overtopping
conditions
8/13/2019 CEM PartVI-Chap5p1, Fundamentals of Design
http://slidepdf.com/reader/full/cem-partvi-chap5p1-fundamentals-of-design 134/150
EM 1110-2-1100 (Part VI)Proposed Publishing Date: 30 Apr 03
VI-5-118 Fundamentals of Design
Table VI-5-50
Weight and Size Selection Dimensions of Quarrystone1
Weight Dimension Weight Dimension Weight Dimension Weight Dimension Weight Dimension
mt (tons) m ft kg (lb) m (ft) kg (lb) cm (in) kg (lb) cm (in.) kg (lb) cm (in.)
0.907 (1) 0.81 (2.64) 45.36 (100) 0.30 (0.97) 2.27 (5) 10.92 (4.30)
1.814 (2) 1.02 (3.33) 90.72 (200) 9.38 (1.23) 4.54 (10) 13.77 (5.42) 0.23 (0.5) 5.08 (2.00) 0.01 (0.025) 1.88 (0.74)
2.722 (3) 1.16 (3.81) 136.08 (300) 0.43 (1.40) 6.81 (15) 15.77 (6.21)
3.629 (4) 1.28 (4.19) 181.44 (400) 9.50 (1.54) 9.07 (20) 17.35 (6.83) 0.45 (1.0) 6.40 (2.52) 0.02 (0.050) 2.36 (0.93)
4.536 (5) 1.38 (4.52) 226.80 (500) 0.51 (1.66) 11.34 (25) 18.70 (7.36)
5.443 (6) 1.46 (4.80) 272.16 (600) 0.54 (1.77) 13.61 (30) 19.86 (7.82) 0.68 (1.5) 7.32 (2.88) 0.03 (0.75) 2.70 (1.06)
6.350 (7) 1.54 (5.05) 317.52 (700) 0.57 (1.86) 15.88 (35) 20.90 (8.23)
7.258 (8) 1.61 (5.28) 362.88 (800) 0.60 (1.95) 18.14 (40) 21.84 (8.60) 0.91 (2.0) 8.05 (3.17) 0.04 (0.100) 2.97 (1.17)
8.165 (9) 1.67 (5.49) 408.24 (900) 0.62 (2.02) 20.41 (45) 22.73 (8.95)
9 .072 (10) 1.73 (5.69) 453.60 (1000) 0.64 (2.10) 22.68 (50) 23.55 (9.27) 1.13 (2.5) 8.66 (3.41) 0.06 (0.125) 3.20 (1.26)
9.979 (11) 1.79 (5.88) 498.96 (1100) 0.66 (2.16) 24.95 (55) 24.31 (9.57)
10.866 (12) 1.84 (6.05) 544.32 (1200) 0.68 (2.23) 27.22 (60) 25.02 (9.85) 1.36 (3.0) 9.22 (3.63) 0.07 (0.150) 3.40 (1.34)
11.793 (13) 1.89 (6.21) 589.68 (1300) 0.70 (2.27) 29.48 (65) 25.70 (10.12)
12.700 (14) 1.94 (6.37) 635.04 (1400) 0.72 (2.35) 31.75 (70) 26.34 (10.37) 1.59 (3.5) 9.70 (3.82) 0.08 (0.175) 3.58 (1.41)
13.608 (15) 1.98 (6.51) 680.40 (1500) 0.73 (2.40) 34.02 (75) 26.95 (10.61)
14.515 (16) 2.03 (6.66) 725.76 (1600) 0.75 (2.45) 36.29 (80) 27.53 (10.84) 1.81 (4.0) 10.13 (3.99) 0.09 (0.200) 3.73 (1.47)
15.422 (17) 2.07 (6.79) 771.12 (1700) 0.76 (2.50) 38.56 (85) 28.09 (11.06)
16.330 (18) 2.11 (6.92) 816.48 (1800) 0.78 (2.55) 40.82 (90) 28.65 (11.28) 2.04 (4.5) 10.54 (4.15) 0.10 (0.225) 3.89 (1.53)
17.237 (19) 2.15 (7.05) 861.84 (1900) 0.80 (2.60) 43.09 (95) 29.16 (11.48)
18.144 (20) 2.19 (7.17) 907.20 (2000) 0.81 (2.64) 45.36 (100) 29.54 (11.63) 2.27 (5.0) 10.92 (4.30) 0.11 (0.250) 4.04 (1.59)
1 Dimensions correspond to size measured by sieve, grizzly, or visual inspection for stone of 25.9 kilonewtons per cubic meter unit weight. Do notuse for determining structure crest width or layer thickness.
• Underlayers.
• Bedding layers and filter blanket layer (see Part VI-5-3b, “Granulated and geotextile filter stability.”
• Scour protection at toe see Part VI-5-6, “Scour and Scour Protection.”
• Toe berm for foundation stability see Part VI-5-3d, “Toe stability and protection,” and Part VI-5-5,“Foundation Loads.”
(f) The following sections describe design aspects for the previously listed geometric features.
8/13/2019 CEM PartVI-Chap5p1, Fundamentals of Design
http://slidepdf.com/reader/full/cem-partvi-chap5p1-fundamentals-of-design 135/150
EM 1110-2-1100 (Part VI)Proposed Publishing Date: 30 Apr 03
Fundamentals of Design VI-5-119
(2) Crest elevation and width.
(a) Overtopping of a rubble-mound structure such as a breakwater or jetty usually can be tolerated if
the waves generated by the overtopping do not cause damage behind the structure. Overtopping will occur
if the crest elevation is lower than the wave runup, as estimated using the procedures in Part VI-5-2-a “Wave
runup and rundown on structures.” If the armor layer is chinked, or in other ways made smoother or less
permeable, maximum runup will be increased.
(b) The selected crest elevation should be the lowest that provides the protection required. Excessive
overtopping of a breakwater or jetty can cause choppiness of the water surface behind the structure and can
be detrimental to harbor operations such as small craft mooring and most types of commercial cargo transfer.
Overtopping of a rubble seawall or revetment can cause serious erosion behind the structure and flooding of
the backshore area. Jetty overtopping is tolerable if it doesn't affect navigation in the channel. Signs warning
pedestrians of overtopping dangers should be prominently posted on any publicly accessible structure
designed for occasional wave overtopping.
(c) Crest width depends greatly on the degree of allowable overtopping; however, this dependency has
not been quantified into general design guidance. The general rule of thumb for overtopping conditions is
that minimum crest width should equal the combined widths of three armor units (n = 3) as determined bythe formula
(VI-5-116) B ' nk ∆
W
wa
1/3
where
B = crest width
n = number of stones (n = 3 is recommended minimum)
k ∆ = layer coefficient from Table VI-5-51
W = primary armor unit weight
wa = specific weight of armor unit material
Where there is no overtopping, crest width is not critical; but in either case the crest must be wide enough to
accommodate any construction and maintenance equipment that might operate directly on the structure.
(d) The sketches in Figures VI-5-54 and VI-5-55 show the primary armor cover layer extending over
the crest. Armor units designed according to the non-overtopping stability formulas in Part VI-5-3a, “Armor
layer stability,” are probably stable on the crest for minor overtopping. For low-crested structures wherefrequent, heavy overtopping is expected, use the appropriate stability formula given in the Part VI-3a tables
for preliminary design. Physical model tests are strongly recommended to confirm the stability of the crest
and backside armor under heavy overtopping conditions. Model testing is almost imperative to check the
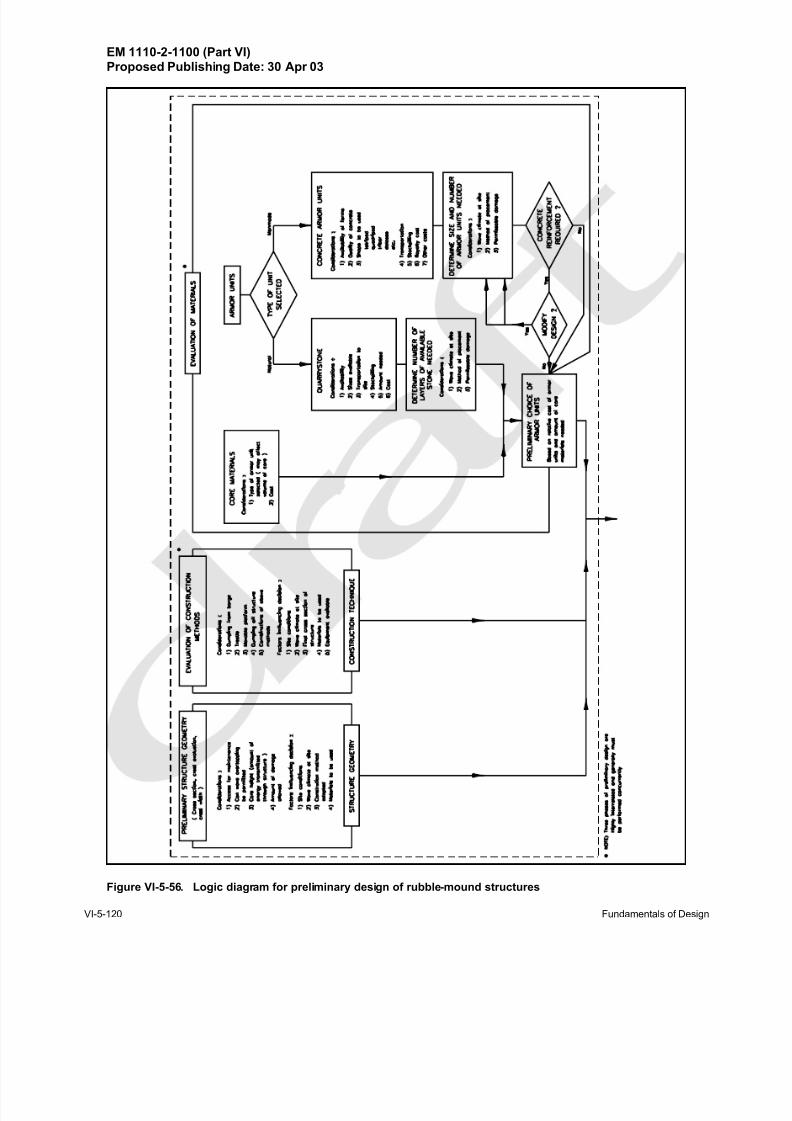
8/13/2019 CEM PartVI-Chap5p1, Fundamentals of Design
http://slidepdf.com/reader/full/cem-partvi-chap5p1-fundamentals-of-design 136/150
EM 1110-2-1100 (Part VI)Proposed Publishing Date: 30 Apr 03
VI-5-120 Fundamentals of Design
Figure VI-5-56. Logic diagram for preliminary design of rubble-mound structures
8/13/2019 CEM PartVI-Chap5p1, Fundamentals of Design
http://slidepdf.com/reader/full/cem-partvi-chap5p1-fundamentals-of-design 137/150
EM 1110-2-1100 (Part VI)Proposed Publishing Date: 30 Apr 03
Fundamentals of Design VI-5-121
overtopping stability of concrete armor units placed on the crest which may be less stable than equivalent
stone armor.
(3) Concrete cap for rubble-mound structures.
(a) Placed concrete may be added to the cover layer of rubble-mound jetties and breakwaters for
purposes such as filling the interstices of stones in the cover layer crest and side slopes as far down as waveaction permits, or as large monolithic blocks cast in place. Placed concrete may serve any of four purposes:
to strengthen the crest, to deflect overtopping waves away from impacting directly on the leeside slope, to
increase the crest height, and to provide roadway access along the crest for construction or maintenance
purposes.
(b) Massive concrete caps have been used with cover layers of precast concrete armor units to replace
armor units of questionable stability on an overtopped crest and to provide a rigid backup to the top rows of
armor units on the slopes. To accomplish this dual purpose, the cap can be a slab with a solid or permeable
parapet (Czerniak and Collins 1977; Jensen 1983) a slab over stone grouted to the bottom elevation of the
armor layer, or a solid or permeable block (Lillevang 1977; Markle 1982). Massive concrete caps must be
placed after a structure has settled or must be sufficiently flexible to undergo settlement without breaking up
(Magoon et al. 1974).
(c) Concrete caps with solid vertical or sloped walls reflect waves out through the upper rows of armor
units, perhaps causing loss of those units. Solid slabs and blocks can trap air beneath them, creating uplift
forces during heavy wave action that may crack or tip the cap (Magoon et al. 1974). A permeable cap
decreases both of these problems. A parapet can be made permeable, and vertical vents can be placed through
the slab or block itself (Mettam 1976). Lillevang (1977) designed a breakwater crest composed of a vented
block cap placed on an unchinked, ungrounted extension of the seaward slope's underlayer, a permeable base
reaching across the crest.
(d) Ribbed caps are a compromise between the solid block and a covering of concrete armor units. The
ribs are large, long, rectangular members of reinforced concrete placed perpendicular to the axis of a structure
in a manner resembling railroad ties. The ribs are connected by reinforced concrete braces, giving the capthe appearance of a railroad track running along the structure crest. This cap serves to brace the upper units
on the slopes, yet is permeable in both the horizontal and vertical directions.
(e) Ribbed caps have been used on U.S. Army Corps of Engineers breakwaters at Maalea Harbor
(Carver and Markle 1981), at Kahului (Markle 1982), on Maui, and Pohoiki Bay, all in the State of Hawaii.
(f) Waves overtopping a concrete cap can damage the leeside armor layer. The width of the cap and
the shape of its lee side can be designed to deflect overtopping waves away from the structure's lee side
(Czerniak and Collins 1977; Lillevang 1977; and Jensen 1983). Ribbed caps help dissipate waves.
(g) High parapet walls have been added to caps to deflect overtopping seaward and allow the lowering
of the crest of the rubble mound itself. These walls present the same reflection problems described above andcomplicate the design of a stable cap (Mettam 1977; Jensen 1983). Hydraulic model tests by Carver and
Davidson (1976, 1983) have investigated the stability of caps with high parapet walls proposed for Corps
structures. Part VI-5-4d, “Stability of concrete caps and caissons against sliding and overturning,” provides
design guidance.
(h) To evaluate the need for a massive concrete cap to increase structural stability against overtopping,
consideration should be given to the cost of including a cap versus the cost of increasing dimensions to
prevent overtopping and for construction and maintenance purposes. A massive concrete cap is not necessary
8/13/2019 CEM PartVI-Chap5p1, Fundamentals of Design
http://slidepdf.com/reader/full/cem-partvi-chap5p1-fundamentals-of-design 138/150
EM 1110-2-1100 (Part VI)Proposed Publishing Date: 30 Apr 03
VI-5-122 Fundamentals of Design
for the structural stability of a structure composed of concrete armor units when the difference in elevation
between the crest and the limit of wave runup on the projected slope above the structure is less than 15
percent of the total wave runup. For this purpose, an all-rubble structure is preferable, and a concrete cap
should be used only if substantial savings would result. Maintenance costs for an adequately designed rubble
structure are likely to be lower than for any alternative composite-type structure. The cost of a concrete cap
should also be compared to the cost of covering the crest with flexible, permeable concrete armor units,
perhaps larger than those used on the slopes, or large quarrystone armor. Hydraulic model tests arerecommended to determine the most stable and economical crest designs for major structures.
(i) Experience indicates that concrete placed in the voids on the structure slopes has little structural
value. By reducing slope roughness and surface porosity, the concrete increases wave runup. The effective
life of the concrete is short, because the bond between concrete and stone is quickly broken by structure
settlement. Such filling increases maintenance costs. For a roadway, a concrete cap can usually be justified
if frequent maintenance of armor slopes is anticipated. A smooth surface is required for wheeled vehicles;
tracked equipment can be used on ribbed caps.
(4) Thickness of armor layer and underlayers.
(a) The thickness of the cover layer and underlayers is calculated using the formula
(VI-5-117)r ' nk ∆
W
wa
1/3
and the placing density (number of armor units per unit area) is estimated using the equation
(VI-5-118) N
a
A' nk
∆1 &
P
100
wa
W
2/3
where r is the average layer thickness, n is the number of quarrystone or concrete armor units in the thickness
(typically n = 2), W is the weight of individual armor units, wa is the specific weight of the armor unit
material, and N a is the required number of individual armor units for a given surface area, A. The layer
coefficient (k ∆) and cover layer average porosity ( P ) in percent were experimentally determined, and values
are given in Table VI-5-51. Equations VI-5-117 and VI-5-118 can be used with either metric or English
units.
(b) The specified placing or packing density must be strictly maintained during construction to assure
proper interlocking, and therefore hydraulic stability, of the armor layer. During placement, packing density
can be maintained by specifying a mean and allowable deviation for the centroidal distance (in three
dimensions) between units, or it can be maintained by counting units in a specified area. For grid placement,
each subsequent row of armor units is typically offset laterally from the previous lower row to avoid failure
planes. To specify the placement grid, D H is the distance between the centroids of two adjacent units on the
same horizontal row and DU is the distance between the centroids of units upslope in the plane of the structure
slope. Values of D H and DU for specific armor sizes and packing density coefficients appropriate for Core-
Loc and Accropod units can be obtained from the vendor or license holder. Within any matrix of armor units,
every effort should be made to achieve maximum interlocking. The maximum centroidal
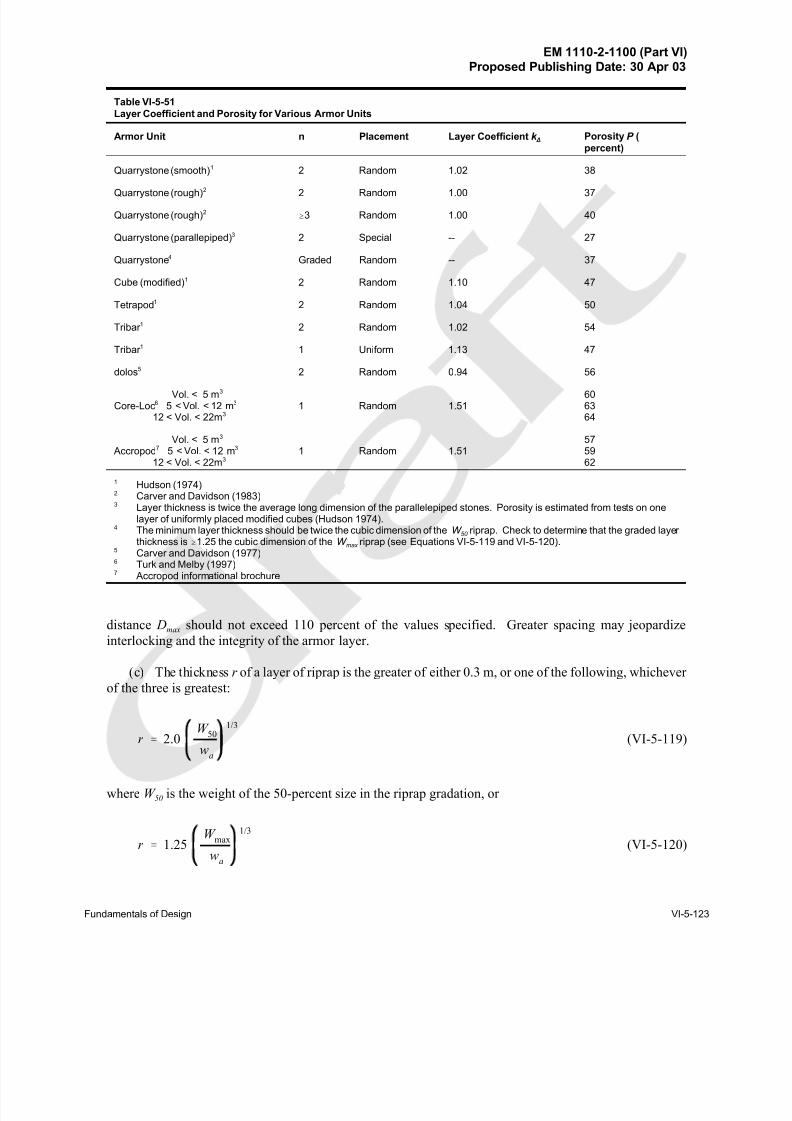
8/13/2019 CEM PartVI-Chap5p1, Fundamentals of Design
http://slidepdf.com/reader/full/cem-partvi-chap5p1-fundamentals-of-design 139/150
EM 1110-2-1100 (Part VI)Proposed Publishing Date: 30 Apr 03
Fundamentals of Design VI-5-123
Table VI-5-51
Layer Coefficient and Porosity for Various Armor Units
Armor Unit n Placement Layer Coefficient k ∆
Porosity P (
percent)
Quarrystone (smooth)1 2 Random 1.02 38
Quarrystone (rough)2 2 Random 1.00 37
Quarrystone (rough)2$3 Random 1.00 40
Quarrystone (parallepiped)3 2 Special -- 27
Quarrystone4 Graded Random -- 37
Cube (modified)1 2 Random 1.10 47
Tetrapod1 2 Random 1.04 50
Tribar 1 2 Random 1.02 54
Tribar 1 1 Uniform 1.13 47
dolos5 2 Random 0.94 56
Vol. < 5 m3
Core-Loc6 5 < Vol. < 12 m3
12 < Vol. < 22m31 Random 1.51
606364
Vol. < 5 m3
Accropod7 5 < Vol. < 12 m3
12 < Vol. < 22m3 1 Random 1.51
575962
1 Hudson (1974)2 Carver and Davidson (1983)3 Layer thickness is twice the average long dimension of the parallelepiped stones. Porosity is estimated from tests on one
layer of uniformly placed modified cubes (Hudson 1974).4 The minimum layer thickness should be twice the cubic dimension of the W
50 riprap. Check to determine that the graded layer
thickness is $1.25 the cubic dimension of the W max
riprap (see Equations VI-5-119 and VI-5-120).5 Carver and Davidson (1977)6
Turk and Melby (1997)7 Accropod informational brochure
distance Dmax should not exceed 110 percent of the values specified. Greater spacing may jeopardize
interlocking and the integrity of the armor layer.
(c) The thickness r of a layer of riprap is the greater of either 0.3 m, or one of the following, whichever
of the three is greatest:
(VI-5-119)r ' 2.0W
50
wa
1/3
where W 50 is the weight of the 50-percent size in the riprap gradation, or
(VI-5-120)r ' 1.25W
max
wa
1/3
8/13/2019 CEM PartVI-Chap5p1, Fundamentals of Design
http://slidepdf.com/reader/full/cem-partvi-chap5p1-fundamentals-of-design 140/150
EM 1110-2-1100 (Part VI)Proposed Publishing Date: 30 Apr 03
VI-5-124 Fundamentals of Design
where W max is the heaviest stone in the gradation. The specified layer thickness should be increased by
50 percent for riprap placed underwater if conditions make placement to design dimensions difficult. The
placing density of riprap is defined as the total weight of riprap placed (W T ) per unit area ( A) of structure
slope. Riprap placing density can be estimated as
(VI-5-121)W T
A' r wa 1 & P
100
(5) Bottom elevation of primary cover layer.
(a) When water depth is greater than 1.5 H (where H is the irregular wave height parameter used to
determine a stable primary armor unit weight), the armor units in the cover layer should be extended
downslope to an elevation below minimum SWL equal to the design wave height H as shown in Figure VI-5-
54. For water depths less than 1.5 H extend the cover layer armor units to the toe as shown in Figure VI-5-55.
Model tests to determine the bottom elevation of the primary cover layer and the type of armor placement
should be conducted when feasible. Revetment cover layers located in shallow water should be extended
seaward of the structure toe on sandy bottoms to serve as scour protection.
(b) Increased stability for special-placement parallelepiped stone (see higher K D values in Table VI-5-22)
can only be obtained if a toe mound is carefully placed to support the quarrystones with their long axes
perpendicular to the structure slope. For dolosse it is recommended that the bottom rows of units in the
primary cover layer be “special placed” on top of the secondary cover layer as shown in Figure VI-5-54, on
top of the toe berm as shown in Figure VI-5-55, or on the bottom itself. This placement is highly dependent
on wave conditions and water clarity. Site-specific model studies have placed the bottom layer of dolosse
with vertical flukes away from the slope and the second row placed so that the units overlap the horizontal
flukes of the bottom layer. This helps assure interlocking with the random-placed units farther up the slope
(Bottin, Chatham, and Carver 1976), and provides better toe stability than random placement. The seaward
dolosse in the bottom row should be placed with the bottom of the vertical flukes one-half the length of the
units back from the design surface of the primary armor layer to produce the design layer thickness.
(c) Core-Loc units can be placed randomly along the toe, but experiments indicate a pattern placement
along the toe is more stable and should be used when the breakwater is built in shallow, depth-limited
conditions. For the bottom layer, individual Core-Loc units are set in a three-point stance in cannon fashion
with the central fluke pointing seaward, up at a 45-deg angle like the cannon barrel. All toe units are placed
side-by-side with minimal space between adjacent units. The second course of units is laid atop of the toe
units such that they straddle each toe unit. Once the second row has been placed, all subsequent Core-Loc
armor units are placed in a random matrix. While placing these units in a variety of random orientations, care
must be taken to assure that all overlying units are interlocked with and constrain underlying units.
(6) Toe berm for cover layer stability.
(a) Structures exposed to breaking waves should have a quarrystone toe berm to protect the toe of the
primary armor layer (see Figure VI-5-55). Design guidance for toe berm dimensions and stone size is given
in Part VI-5-3d, “Toe stability and protection.”
8/13/2019 CEM PartVI-Chap5p1, Fundamentals of Design
http://slidepdf.com/reader/full/cem-partvi-chap5p1-fundamentals-of-design 141/150
EM 1110-2-1100 (Part VI)Proposed Publishing Date: 30 Apr 03
Fundamentals of Design VI-5-125
(b) The toe berm may be placed before or after the adjacent cover layer. For special-placement
quarrystone or uniform-placement tribars, the toe berm serves as a base, and it must be placed first. When
placed after the cover layer, the toe berm must be high enough to provide bracing up to at least half the height
of the toe armor units. Usually, this requirement is exceeded by the design guidance recommended in
Part VI-5-3-d.
(7) Structure head and leeside cover layer.
(a) Armoring of the head of a breakwater or jetty should be the same on the leeside slope as on the
seaside slope for a distance of about 15 to 45 m from the structure end. This distance depends on such factors
as structure length and crest elevation at the seaward end. (See Tables VI-5-37 and VI-5-38 for sizing stable
armor units for heads.)
(b) Design of leeside cover layers depends on the extent of wave overtopping, any waves or surges
acting directly on the lee slope, structure porosity, and differential hydrostatic head resulting in uplift forces
that may dislodge armor units on the back slope. If the crest elevation is established to prevent possible
overtopping, the weight of armor units and the bottom elevation of the back slope cover layer should depend
on the lesser wave action on the lee side (if any) and the porosity of the structure. Under minor overtopping
the armor weight calculated for the seaward side primary cover layer should be used on the lee side down toat least the SWL or -0.5 H for preliminary designs. However, model testing may be needed to determine
stable armor weights for overtopping wave impacts.
(c) For heavy overtopping of breaking waves in shallow water, the primary armor layer on the lee side
should be extended to the bottom as shown in Figure VI-5-55. Where concrete caps are employed, stability
of the leeside armor during overtopping should be verified with model tests. When both sides of a structure
are exposed to similar wave action (groins and jetties), both slopes should have similar designs.
(8) Secondary cover layer.
(a) If the armor units in the primary and secondary cover layers are of the same material, the weight of
armor units in the secondary cover layer, between -1.5 H and -2.0 H , should be greater than about one-half the weight of armor units in the primary cover layer. Below -2.0 H , the weight requirements can be reduced
to about W /15 for the same slope condition (see Figure VI-5-54). If the primary cover layer is quarrystone,
the weights for the secondary quarrystone layers should be ratioed from the weight of quarrystone that would
be required for the primary cover layer. The use of a single size of concrete armor unit for all cover layers
(i.e., upgrading the secondary cover layer to the same size as the primary cover layer) may prove to be
economically advantageous when the structure is located in shallow water as shown in Figure VI-5-55 where
the primary cover layer is extended down the entire slope.
(b) The secondary cover layer (shown in Figure VI-5-54 from elevation -1.5 H to the bottom) should
be as thick as, or thicker than, the primary cover layer. As an example, cover layers of quarrystone of
two-stone thickness (n = 2) will require a secondary cover layer thickness of n = 2.5 for the slope between
elevations - H and -2.0 H , and a thickness of n = 5 for the slope below an elevation of -2.0 H . These layer thicknesses are based on the armor unit weight ratios given in Figure VI-5-54.
(c) The interfaces between the secondary cover layers and the primary cover layer are shown at the slope
of 1-to-1.5 on Figure VI-5-54. Steeper slopes for the interfaces may contribute to the stability of the cover
armor, but material characteristics and site wave conditions during construction may require using a flatter
slope than shown in the figure.
(9) Underlayers.
8/13/2019 CEM PartVI-Chap5p1, Fundamentals of Design
http://slidepdf.com/reader/full/cem-partvi-chap5p1-fundamentals-of-design 142/150
EM 1110-2-1100 (Part VI)Proposed Publishing Date: 30 Apr 03
VI-5-126 Fundamentals of Design
(a) The first underlayer directly beneath the primary armor units (see Figures VI-5-54 and VI-5-55)
should have a minimum thickness of two quarrystones (n = 2). The first underlayer stones should weigh
about one-tenth of the weight of the overlying armor units (W /10) if the cover layer and first underlayer are
both quarrystone, or the first underlayer is quarrystone and the cover layer is concrete armor units with a
stability coefficient of K D ̃ 12 (see Tables VI-5-29, VI-5-33, VI-5-34, VI-5-36). When the cover layer armor
unit K D > 12 (dolosse, Core-Loc, and uniformly-placed tribars) the first underlayer quarrystone weight should
be about one-fifth the weight of the overlying unit (W /5). The larger size promotes increased interlocking between the first underlayer and the concrete armor units of the primary cover layer. Hydraulic model tests
(Carver and Davidson 1977; Carver 1980) indicate for quarrystone armor units and dolosse on a breakwater
trunk exposed to nonbreaking waves that the underlayer stone size could range from W /5 to W /20 with little
effect on armor stability, wave runup or rundown. If the underlayer stone proposed for a given structure is
available with a gradation in the range of W /5 to W /20, the structure should be model tested with that
underlayer gradation to determine if this economical material will support a stable primary cover layer of
planned armor units when exposed to the site design conditions.
(b) The second underlayer beneath the primary cover layer and upper secondary cover layer (above
-2.0 H ) should have a minimum equivalent thickness of two quarrystones and a weight about 1/20 the
weight of the stones in the first underlayer. In terms of primary armor unit weight this is approximately
1/20 × W /10 = W /200 for quarrystone and some concrete armor units.
(c) The first underlayer beneath the lower secondary cover layer (below -2.0 H on Figure VI-5-54)
should also have a minimum of two thicknesses of quarrystone. Stones in this layer should weigh about 1/20
of the immediately overlying armor unit weight. In terms of primary armor unit weight this is approximately
1/20 x W /15 = W /300 for units of the same material. The second underlayer for the secondary armor below
-2.0 H can be as light as W /6000, or equal to the core material size.
(d) For the recommended cross section in Figure VI-5-54 when the primary armor is quarrystone and/or
concrete units with K D ˜ 12, the first underlayer and the cover layer below -2.0 H should have quarrystone
weights between W /10 and W /15. If the primary armor is concrete armor units with K D > 12, the first
underlayer and cover armor below -2.0 H should be quarrystone with weights between W /5 and W /10.
(e) For graded riprap cover layers the minimum requirement for the underlayers (if one or more are
required) is
(VI-5-122) D15
(cover ) # 5 D85
(under )
where D15 (cover) is the diameter exceeded by the coarsest 85 percent of the riprap or underlayer on top and
D85 (under) is the diameter exceeded by the coarsest 15 percent of the underlayer or soil below (Ahrens
1981b). For a revetment where the riprap and the underlying soil satisfy the size criterion, no underlayer is
necessary. Otherwise, one or more of the following is required.
(f) The size criterion for riprap is more restrictive than the general filter criterion given in Part VI-5-3b,
“Granulated and geotextile filter stability.” The riprap criterion requires larger stone in the lower layer to
prevent the material from washing through the voids in the upper layer as cover layer stones shift during wave
action. A more conservative underlayer than required by the minimum criterion may be constructed of stone
with a 50-percent size of about W 50 /20. This larger stone will produce a more permeable underlayer and
should reduce runup and increase interlocking between the cover layer and underlayer. However, be sure to
check the underlayer gradation against the underlying soil to assure the minimum criterion of
Equation VI-5-122 is met.
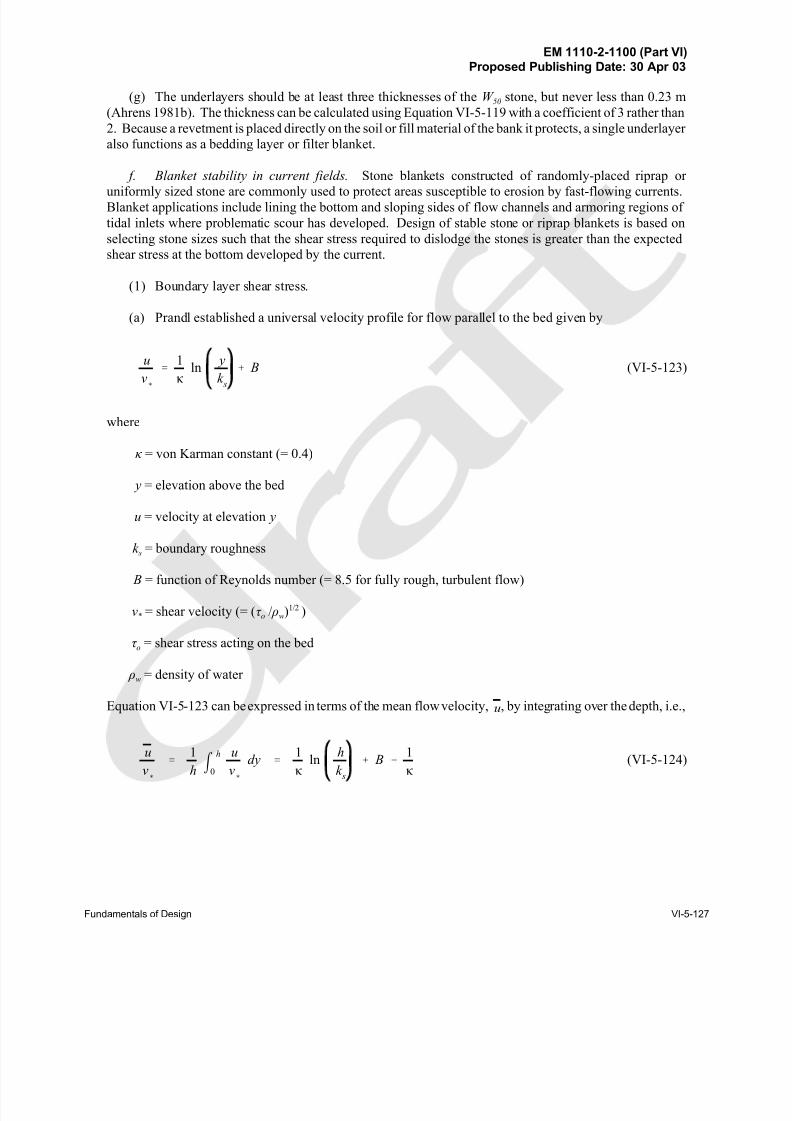
8/13/2019 CEM PartVI-Chap5p1, Fundamentals of Design
http://slidepdf.com/reader/full/cem-partvi-chap5p1-fundamentals-of-design 143/150
EM 1110-2-1100 (Part VI)Proposed Publishing Date: 30 Apr 03
Fundamentals of Design VI-5-127
(g) The underlayers should be at least three thicknesses of the W 50 stone, but never less than 0.23 m
(Ahrens 1981b). The thickness can be calculated using Equation VI-5-119 with a coefficient of 3 rather than
2. Because a revetment is placed directly on the soil or fill material of the bank it protects, a single underlayer
also functions as a bedding layer or filter blanket.
f. Blanket stability in current fields. Stone blankets constructed of randomly-placed riprap or
uniformly sized stone are commonly used to protect areas susceptible to erosion by fast-flowing currents.Blanket applications include lining the bottom and sloping sides of flow channels and armoring regions of
tidal inlets where problematic scour has developed. Design of stable stone or riprap blankets is based on
selecting stone sizes such that the shear stress required to dislodge the stones is greater than the expected
shear stress at the bottom developed by the current.
(1) Boundary layer shear stress.
(a) Prandl established a universal velocity profile for flow parallel to the bed given by
(VI-5-123)u
v(
'1
κ
ln y
k s% B
where
κ = von Karman constant (= 0.4)
y = elevation above the bed
u = velocity at elevation y
k s = boundary roughness
B = function of Reynolds number (= 8.5 for fully rough, turbulent flow)
v* = shear velocity (= (τ o / ρw)1/2 )
τ o = shear stress acting on the bed
ρw = density of water
Equation VI-5-123 can be expressed in terms of the mean flow velocity, , by integrating over the depth, i.e.,u
(VI-5-124)uv
(
' 1h m
h0
uv
(
dy ' 1κ
ln hk s
% B & 1κ
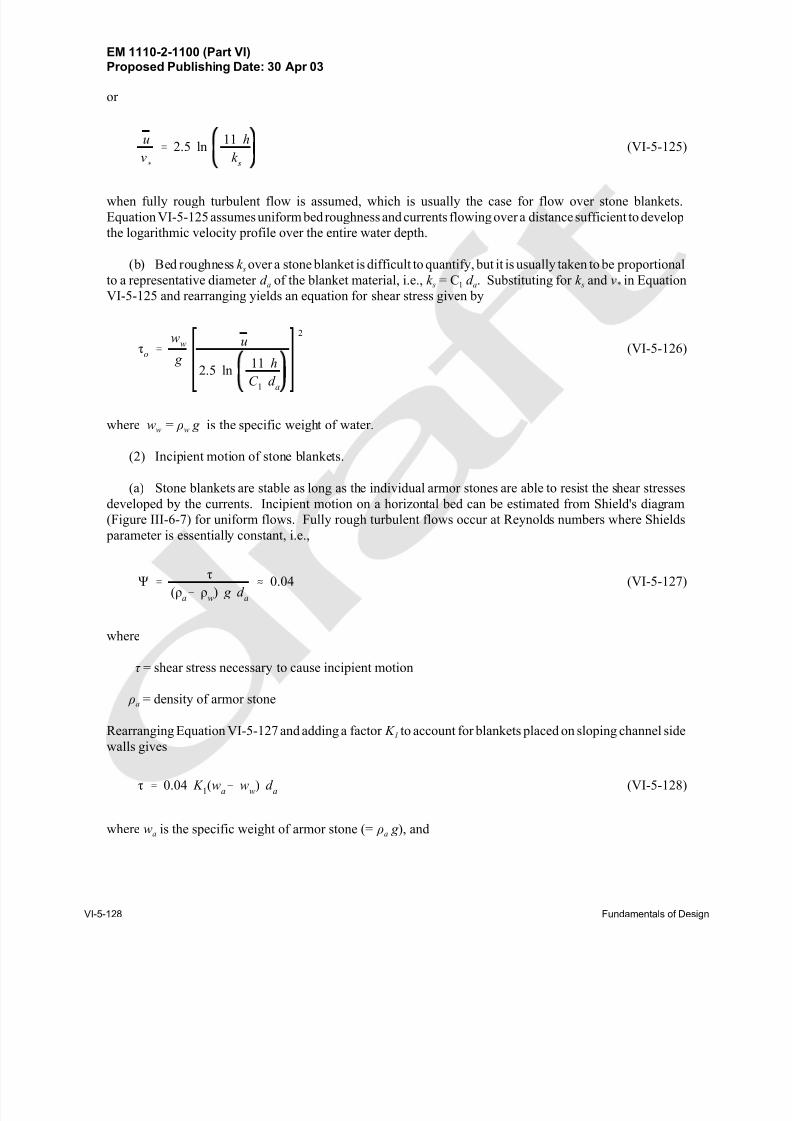
8/13/2019 CEM PartVI-Chap5p1, Fundamentals of Design
http://slidepdf.com/reader/full/cem-partvi-chap5p1-fundamentals-of-design 144/150
EM 1110-2-1100 (Part VI)Proposed Publishing Date: 30 Apr 03
VI-5-128 Fundamentals of Design
or
(VI-5-125)u
v(
' 2.5 ln11 h
k s
when fully rough turbulent flow is assumed, which is usually the case for flow over stone blankets.
Equation VI-5-125 assumes uniform bed roughness and currents flowing over a distance sufficient to develop
the logarithmic velocity profile over the entire water depth.
(b) Bed roughness k s over a stone blanket is difficult to quantify, but it is usually taken to be proportional
to a representative diameter d a of the blanket material, i.e., k s = C1 d a. Substituting for k s and v* in Equation
VI-5-125 and rearranging yields an equation for shear stress given by
(VI-5-126)τo '
ww
g
u
2.5 ln11 h
C 1 d a
2
where ww = ρw g is the specific weight of water.
(2) Incipient motion of stone blankets.
(a) Stone blankets are stable as long as the individual armor stones are able to resist the shear stresses
developed by the currents. Incipient motion on a horizontal bed can be estimated from Shield's diagram
(Figure III-6-7) for uniform flows. Fully rough turbulent flows occur at Reynolds numbers where Shields
parameter is essentially constant, i.e.,
(VI-5-127)Ψ 'τ
(ρa& ρ
w) g d
a
. 0.04
where
τ = shear stress necessary to cause incipient motion
ρa = density of armor stone
Rearranging Equation VI-5-127 and adding a factor K 1 to account for blankets placed on sloping channel side
walls gives
(VI-5-128)τ ' 0.04 K 1(w
a& w
w) d
a
where wa is the specific weight of armor stone (= ρa g ), and
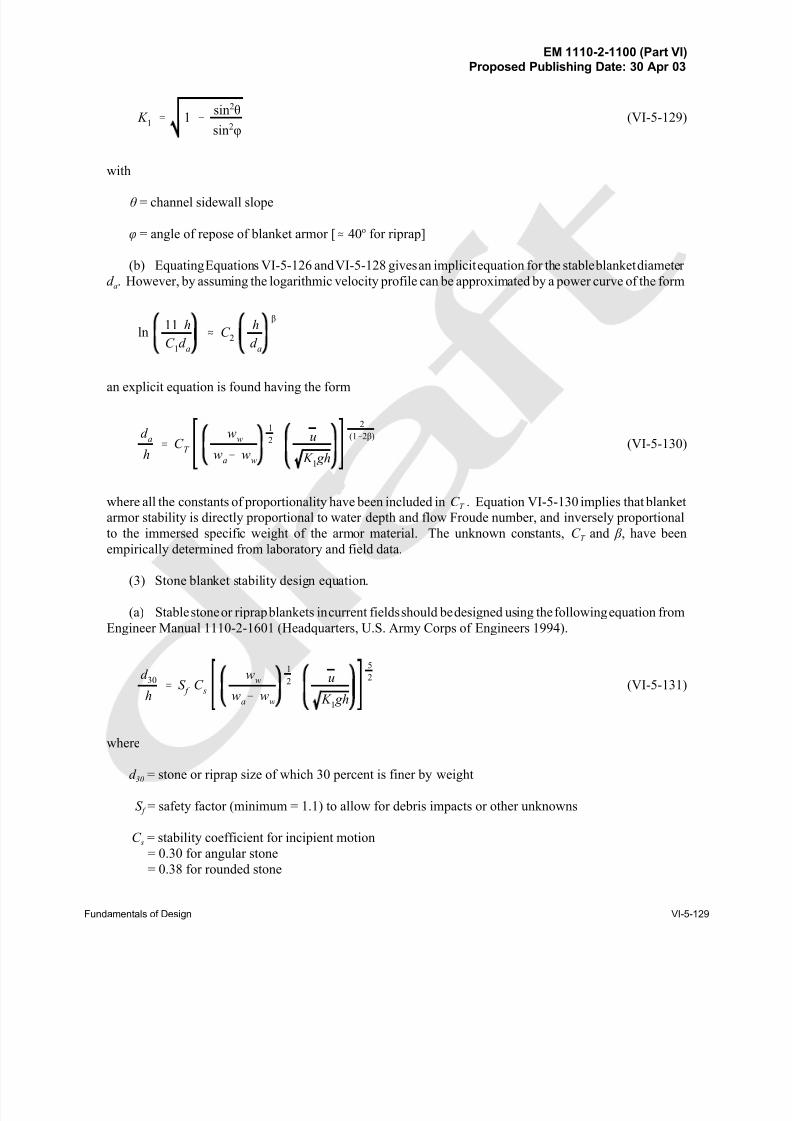
8/13/2019 CEM PartVI-Chap5p1, Fundamentals of Design
http://slidepdf.com/reader/full/cem-partvi-chap5p1-fundamentals-of-design 145/150
EM 1110-2-1100 (Part VI)Proposed Publishing Date: 30 Apr 03
Fundamentals of Design VI-5-129
(VI-5-129) K 1 ' 1 &
sin2θ
sin2φ
with
θ = channel sidewall slope
φ = angle of repose of blanket armor [. 40o for riprap]
(b) Equating Equations VI-5-126 and VI-5-128 gives an implicit equation for the stable blanket diameter
d a. However, by assuming the logarithmic velocity profile can be approximated by a power curve of the form
ln11 h
C 1d
a
. C 2
h
d a
β
an explicit equation is found having the form
(VI-5-130)d
a
h' C
T
ww
wa& w
w
1
2 u
K 1 gh
2
(1&2β)
where all the constants of proportionality have been included in C T . Equation VI-5-130 implies that blanket
armor stability is directly proportional to water depth and flow Froude number, and inversely proportional
to the immersed specific weight of the armor material. The unknown constants, C T and β , have been
empirically determined from laboratory and field data.
(3) Stone blanket stability design equation.
(a) Stable stone or riprap blankets in current fields should be designed using the following equation from
Engineer Manual 1110-2-1601 (Headquarters, U.S. Army Corps of Engineers 1994).
(VI-5-131)d
30
h' S
f C
s
ww
wa& w
w
1
2 u
K 1 gh
5
2
where
d 30 = stone or riprap size of which 30 percent is finer by weight
S f = safety factor (minimum = 1.1) to allow for debris impacts or other unknowns
C s = stability coefficient for incipient motion
= 0.30 for angular stone
= 0.38 for rounded stone
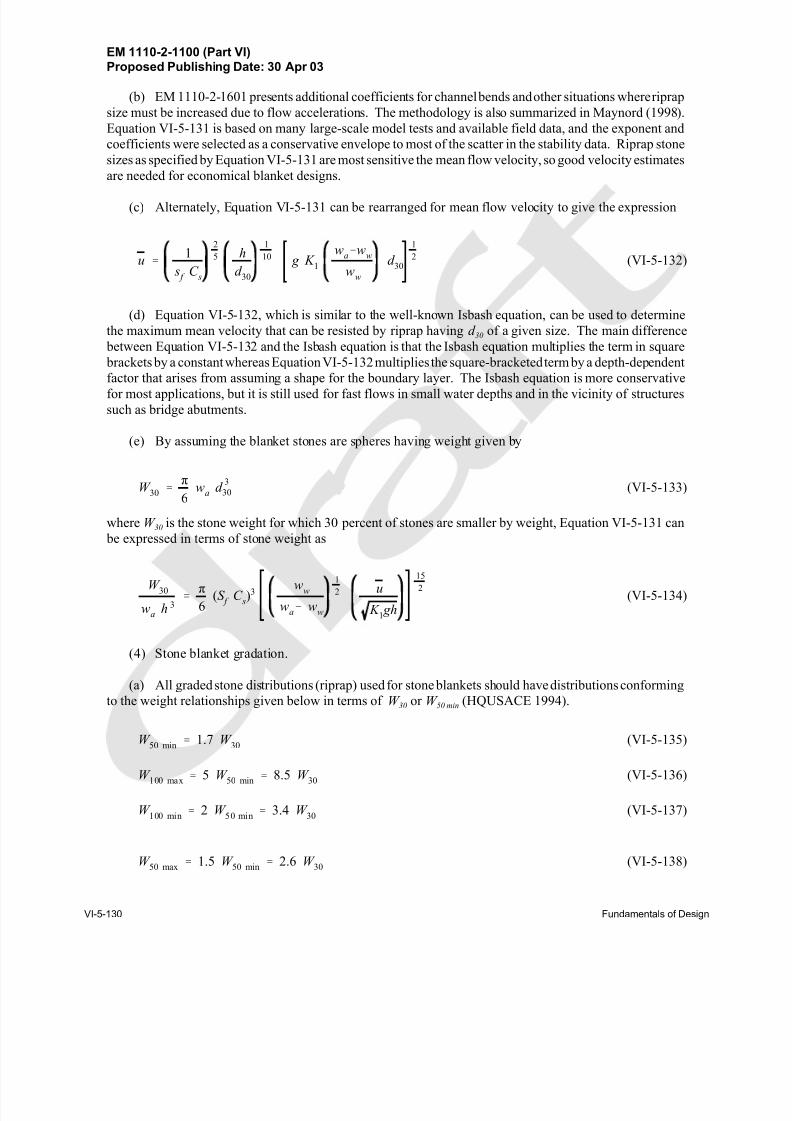
8/13/2019 CEM PartVI-Chap5p1, Fundamentals of Design
http://slidepdf.com/reader/full/cem-partvi-chap5p1-fundamentals-of-design 146/150
EM 1110-2-1100 (Part VI)Proposed Publishing Date: 30 Apr 03
VI-5-130 Fundamentals of Design
(b) EM 1110-2-1601 presents additional coefficients for channel bends and other situations where riprap
size must be increased due to flow accelerations. The methodology is also summarized in Maynord (1998).
Equation VI-5-131 is based on many large-scale model tests and available field data, and the exponent and
coefficients were selected as a conservative envelope to most of the scatter in the stability data. Riprap stone
sizes as specified by Equation VI-5-131 are most sensitive the mean flow velocity, so good velocity estimates
are needed for economical blanket designs.
(c) Alternately, Equation VI-5-131 can be rearranged for mean flow velocity to give the expression
(VI-5-132)u '1
s f
C s
2
5 h
d 30
1
10 g K 1
wa&w
w
ww
d 30
1
2
(d) Equation VI-5-132, which is similar to the well-known Isbash equation, can be used to determine
the maximum mean velocity that can be resisted by riprap having d 30 of a given size. The main difference
between Equation VI-5-132 and the Isbash equation is that the Isbash equation multiplies the term in square
brackets by a constant whereas Equation VI-5-132 multiplies the square-bracketed term by a depth-dependent
factor that arises from assuming a shape for the boundary layer. The Isbash equation is more conservativefor most applications, but it is still used for fast flows in small water depths and in the vicinity of structures
such as bridge abutments.
(e) By assuming the blanket stones are spheres having weight given by
(VI-5-133)W 30 '
π
6w
ad
3
30
where W 30 is the stone weight for which 30 percent of stones are smaller by weight, Equation VI-5-131 can
be expressed in terms of stone weight as
(VI-5-134)W
30
wa
h 3'
π
6(S
f C
s)3
ww
wa& w
w
1
2 u
K 1 gh
15
2
(4) Stone blanket gradation.
(a) All graded stone distributions (riprap) used for stone blankets should have distributions conforming
to the weight relationships given below in terms of W 30 or W 50 min (HQUSACE 1994).
(VI-5-135)W 50 min
' 1.7 W 30
(VI-5-136)W 100 max ' 5 W
50 min ' 8.5 W 30
(VI-5-137)W 100 min ' 2 W
50 min ' 3.4 W 30
(VI-5-138)W 50 max ' 1.5 W
50 min ' 2.6 W 30
8/13/2019 CEM PartVI-Chap5p1, Fundamentals of Design
http://slidepdf.com/reader/full/cem-partvi-chap5p1-fundamentals-of-design 147/150
EM 1110-2-1100 (Part VI)Proposed Publishing Date: 30 Apr 03
Fundamentals of Design VI-5-131
(VI-5-139)W 15 max ' 0.5 W
50 max ' 0.75 W 50 min ' 1.3 W
30
(VI-5-140)W 15 min ' 0.31 W
50 min ' 0.5 W 30
(b) Recommended thickness of the blanket layer, r , depends on whether placement is submerged or in
the dry as specified by the following formulas.
(c) For blankets placed above water, the layer thickness should be
(VI-5-141)r ' 2.1W
50 min
wa
1
3' 2.5
W 30
wa
1
3
with a minimum blanket thickness of 0.3 m. Blankets placed below water should have layer thickness given
by
(VI-5-142)r ' 3.2W
50 min
wa
1
3' 3.8
W 30
wa
1
3
with a minimum blanket thickness of 0.5 m.
VI-5-4. Vertical-Front Structure Loading and Response
a. Wave forces on vertical walls.
(1) Wave-generated pressures on structures are complicated functions of the wave conditions and
geometry of the structure. For this reason laboratory model tests should be performed as part of the finaldesign of important structures. For preliminary designs the formulae presented in this section can be used
within the stated parameter limitations and with consideration of the uncertainties. Three different types of
wave forces on vertical walls can be identified as shown in Figure VI-5-57.
(a) Nonbreaking waves: Waves do not trap an air pocket against the wall (Figure VI-5-57a). The
pressure at the wall has a gentle variation in time and is almost in phase with the wave elevation.
Wave loads of this type are called pulsating or quasistatic loads because the period is much larger
than the natural period of oscillation of the structures. (For conventional caisson breakwaters the
period is approximately one order of magnitude larger.) Consequently, the wave load can be treated
like a static load in stability calculations. Special considerations are required if the caisson is placed
on fine soils where pore pressure may build up, resulting in significant weakening of the soil.
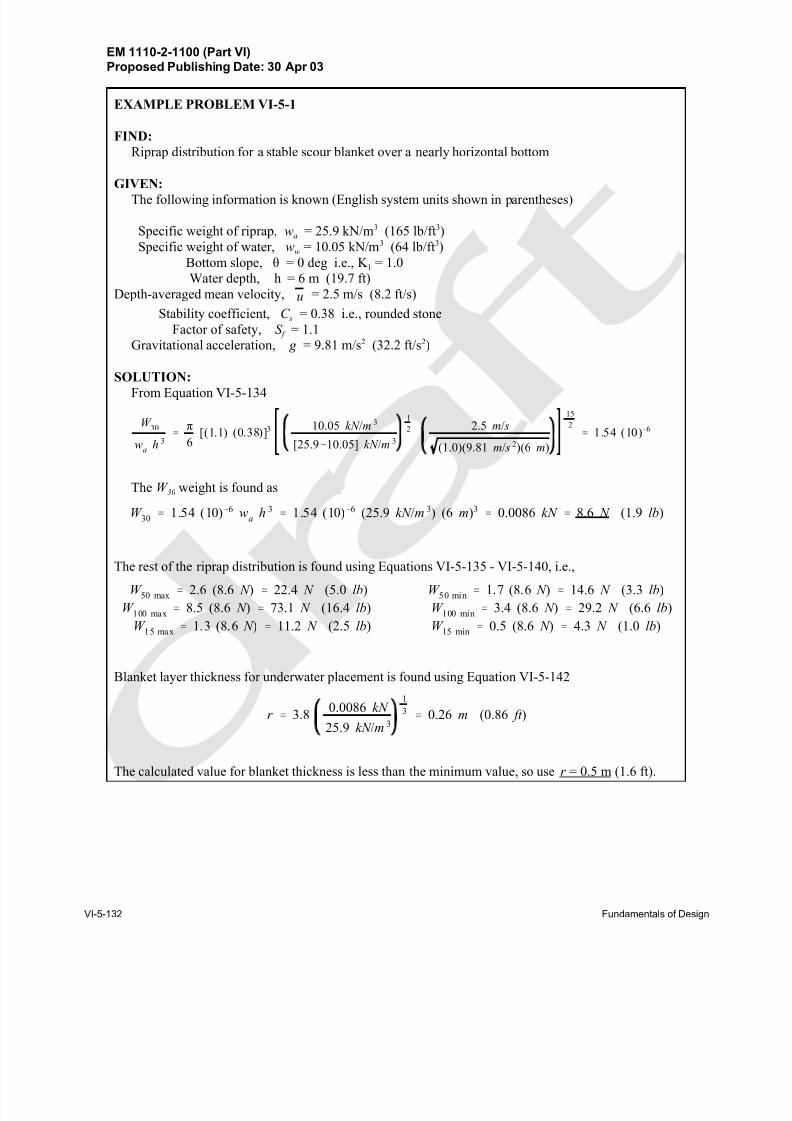
8/13/2019 CEM PartVI-Chap5p1, Fundamentals of Design
http://slidepdf.com/reader/full/cem-partvi-chap5p1-fundamentals-of-design 148/150
EM 1110-2-1100 (Part VI)Proposed Publishing Date: 30 Apr 03
VI-5-132 Fundamentals of Design
W 30
wa
h 3'
π
6[(1.1) (0.38)]3 10.05 kN /m 3
[25.9&10.05] kN /m 3
1
2 2.5 m/ s
(1.0)(9.81 m/ s 2)(6 m)
15
2' 1.54 (10)&6
W 30
' 1.54 (10)&6 wa
h 3' 1.54 (10)&6 (25.9 kN /m 3) (6 m)3
' 0.0086 kN ' 8.6 N (1.9 lb)
W 50 max ' 2.6 (8.6 N ) ' 22.4 N (5.0 lb) W
50 min ' 1.7 (8.6 N ) ' 14.6 N (3.3 lb)
W 100 max
' 8.5 (8.6 N ) ' 73.1 N (16.4 lb) W 100 min
' 3.4 (8.6 N ) ' 29.2 N (6.6 lb)
W 15 max ' 1.3 (8.6 N ) ' 11.2 N (2.5 lb) W
15 min ' 0.5 (8.6 N ) ' 4.3 N (1.0 lb)
r ' 3.80.0086 kN
25.9 kN /m 3
1
3' 0.26 m (0.86 ft )
EXAMPLE PROBLEM VI-5-1
FIND:
Riprap distribution for a stable scour blanket over a nearly horizontal bottom
GIVEN: The following information is known (English system units shown in parentheses)
Specific weight of riprap, wa = 25.9 kN/m3 (165 lb/ft3)
Specific weight of water, ww = 10.05 kN/m3 (64 lb/ft3)
Bottom slope, θ = 0 deg i.e., K 1 = 1.0
Water depth, h = 6 m (19.7 ft)
Depth-averaged mean velocity, = 2.5 m/s (8.2 ft/s)u
Stability coefficient, C s = 0.38 i.e., rounded stone
Factor of safety, S f = 1.1
Gravitational acceleration, g = 9.81 m/s2 (32.2 ft/s2)
SOLUTION: From Equation VI-5-134
The W 30 weight is found as
The rest of the riprap distribution is found using Equations VI-5-135 - VI-5-140, i.e.,
Blanket layer thickness for underwater placement is found using Equation VI-5-142
The calculated value for blanket thickness is less than the minimum value, so use r = 0.5 m (1.6 ft).
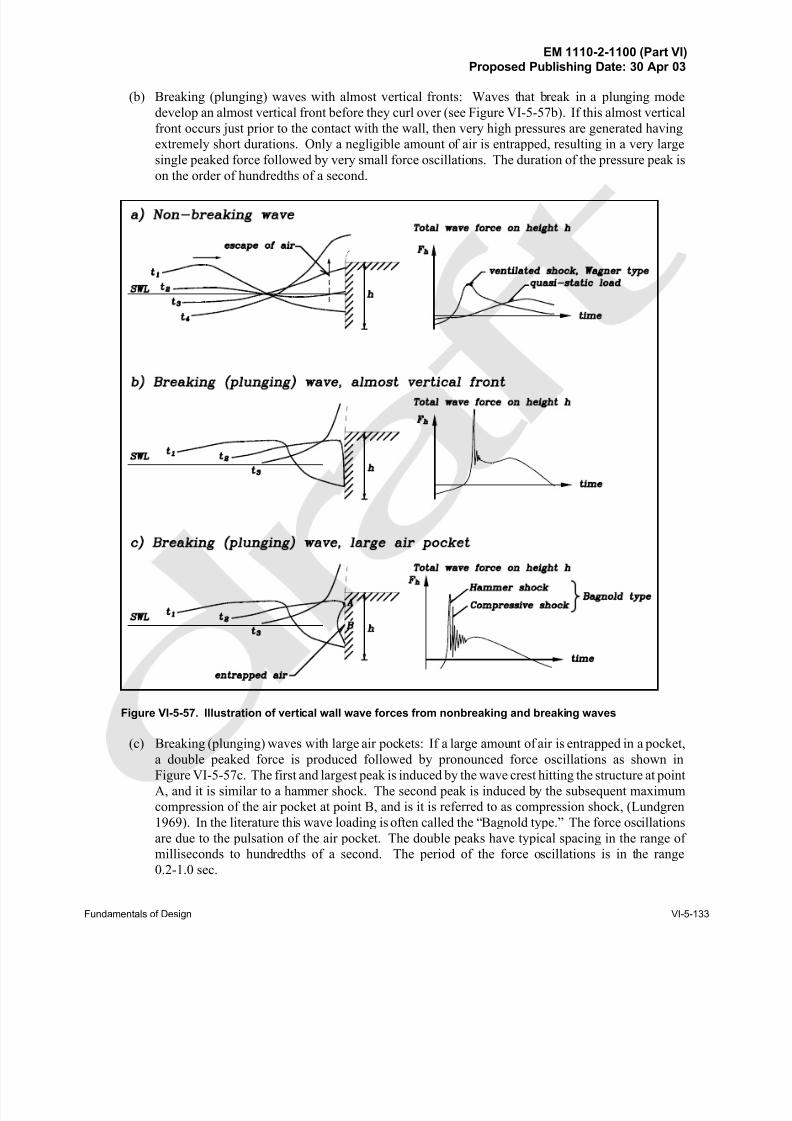
8/13/2019 CEM PartVI-Chap5p1, Fundamentals of Design
http://slidepdf.com/reader/full/cem-partvi-chap5p1-fundamentals-of-design 149/150
EM 1110-2-1100 (Part VI)Proposed Publishing Date: 30 Apr 03
Fundamentals of Design VI-5-133
Figure VI-5-57. Illustration of vertical wall wave forces from nonbreaking and breaking waves
(b) Breaking (plunging) waves with almost vertical fronts: Waves that break in a plunging mode
develop an almost vertical front before they curl over (see Figure VI-5-57b). If this almost vertical
front occurs just prior to the contact with the wall, then very high pressures are generated having
extremely short durations. Only a negligible amount of air is entrapped, resulting in a very large
single peaked force followed by very small force oscillations. The duration of the pressure peak is
on the order of hundredths of a second.
(c) Breaking (plunging) waves with large air pockets: If a large amount of air is entrapped in a pocket,
a double peaked force is produced followed by pronounced force oscillations as shown inFigure VI-5-57c. The first and largest peak is induced by the wave crest hitting the structure at point
A, and it is similar to a hammer shock. The second peak is induced by the subsequent maximum
compression of the air pocket at point B, and is it is referred to as compression shock, (Lundgren
1969). In the literature this wave loading is often called the “Bagnold type.” The force oscillations
are due to the pulsation of the air pocket. The double peaks have typical spacing in the range of
milliseconds to hundredths of a second. The period of the force oscillations is in the range
0.2-1.0 sec.
8/13/2019 CEM PartVI-Chap5p1, Fundamentals of Design
http://slidepdf.com/reader/full/cem-partvi-chap5p1-fundamentals-of-design 150/150
EM 1110-2-1100 (Part VI)Proposed Publishing Date: 30 Apr 03
(2) Due to the extremely stochastic nature of wave impacts there are no reliable formula for prediction
of impulsive pressures caused by breaking waves. Determination of impact pressures in model tests is
difficult because of scale effects related to the amount and size of air bubbles and size and shape of air
pockets. Also the instrumentation, data sampling, and analyses need special attention to avoid bias by
dynamic amplification and misinterpretation when scaling to prototype values. Another problem related to
model tests is the sensitivity of the shock loads on the shape and kinematics of the breaking waves. This calls
for a very realistic and statistically correct reproduction of natural waves in laboratory models.
(3) Impulsive loads from breaking waves can be very large, and the risk of extreme load values increases
with the number of loads. Therefore, conditions resulting in frequent wave breaking at vertical structures
should be avoided. Alternatives include placing a mound of armor units in front of the vertical wall structure
to break the waves before they can break directly on the wall, or using a rubble-mound structure in place of
the vertical wall structure.
(4) Frequent wave breaking at vertical structures will not take place for oblique waves with angle of
incidence larger than 20 deg from normal incidence. Nor will it take place if the seabed in front of the
structure has a mild slope of about 1:50 or less over a distance of at least several wavelengths, and the vertical
wall has no sloping foundation at the toe of the wall.
(5) The use of a sloping-front face from about still-water level (swl) to the crest is very effective in
reducing large impact pressures from breaking waves. In addition, the direction of the wave forces on the
sloping part (right angle to the surface) helps reduce the horizontal force and the tilting moment. Structures
with sloping tops might be difficult to optimize where large water level variations are present. Also, a
sloping-front structure allows more overtopping than a vertical wall structure of equivalent crest height.
(6) It is important to investigate the effect of sloping rubble protection or any rubble foundation that
extends in front of a vertical wall to make sure the slope does not trigger wave breaking, causing frequent
impact loads on the wall.